European exchange of monitoring information and state of ...
53
European exchange of monitoring information and state of the air quality in 2005 0 - 20 ug/m3 20 - 40 ug/m3 40 - 50 ug/m3 > 50 ug/m3 PM10 annual mean 2005 all stations, data coverage > 75% ETC/ACC Technical paper 2007/1 September 2007 W.J.A Mol, P.R. van Hooydonk and F.A.A.M. de Leeuw The European Topic Centre on Air and Climate Change (ETC/ACC) is a consortium of European institutes under contract of the European Environmental Agency MNP UBA-D UBA-V NILU AEAT AUTh CHMI MetNo ÖKO REC TNO
Transcript of European exchange of monitoring information and state of ...
European exchange of monitoring information
and state of the air quality in 2005
0 - 20 ug/m3
20 - 40 ug/m3
40 - 50 ug/m3
> 50 ug/m3
PM10annual mean
2005all stations, data coverage > 75%
ETC/ACC Technical paper 2007/1 September 2007
W.J.A Mol, P.R. van Hooydonk and F.A.A.M. de Leeuw
The European Topic Centre on Air and Climate Change (ETC/ACC) is a consortium of European institutes under contract of the European Environmental Agency
MNP UBA-D UBA-V NILU AEAT AUTh CHMI MetNo ÖKO REC TNO

Author affiliation: PR van Hooydonk, FAAM de Leeuw and WJA Mol: Netherlands Environmental Assessment Agency (MNP), Bilthoven, The Netherlands. Maps in Figure 2-9 in this report have been produced by Petr Ptasek of the Czech Hydrometeorological Institute (Český hydrometeorologický ústav). Disclaimer. This Technical paper has not been subjected to EEA member country review. It does not represent the formal views of the European Environment Agency. © ETC/ACC, 2007. ETC/ACC Technical paper 2007/1 European Topic Centre on Air and Climate Change PO Box 303 3720 AH Bilthoven The Netherlands Phone +31 30 2748562 Fax +31 30 2744433 Email: [email protected] Website: http://air-climate.eionet.europa.eu/

ETC/ACC Technical paper 2007/1 page 3 of 53
SUMMARY Current air quality legislation of the European Union, Council Decision (97/101/EC), requires the Commission to prepare yearly a technical report on the meta information and air quality data flows that have been exchanged among the European Union Member States and the Commission. Besides the EU Member States, other member and collaborating countries of the European Environment Agency, which include EU Acceding Countries and EFTA states, have agreed to follow this reporting procedure as well. All this information is made available in the AIRBASE database, accessible at “airbase.eionet.europa.eu”. The results of the reporting cycle presented in this particular technical report cover data for 2005.
A total of 33 countries, including 26 EU Member States, have provided air quality data for 2005. Luxembourg is the only EU Member State not providing information. As in preceding years, a large number of time series have been transmitted, covering, for example, sulphur dioxide (SO2), nitrogen dioxide (NO2), nitrogen oxides (NOx), particulate matter (PM10, PM2.5), ozone (O3), carbon monoxide (CO) and benzene (C6H6). In an increasing degree also Volatile Organic Compounds (VOCs), Heavy Metals (HM’s) and Polycyclic Aromatic Hydrocarbons (PAHs) have been transmitted. Nearly all the countries that have updated their meta information have used the Air Quality Data Exchange Module (AQ-DEM), made available for this purpose by the European Topic Centre on Air and Climate Change (ETC/ACC).
The previous Technical Reports were focused on the meta information and the quality of the measurement data. In addition to the more technical aspects of the data submission process, this report will briefly describe the state of the air quality for some selected pollutants.
Pollution by SO2 shows a decreasing trend both in emissions as well as in ambient concentrations. Exceedances of the health related SO2 limit values are observed at a limited number of stations only. The emission of NOx decreases but NO2 concentrations in urban and traffic areas are decreasing at a much lower rate. Compliance with the NO2 limit value for annual mean values is a serious problem in many urban and traffic areas. During the last five years emissions of primary PM10 and its precursor gasses are reducing slowly but in the observed concentrations no clear European-wide trend is seen. The PM10-limit value for daily values is exceeded frequently at urban and traffic stations. The ambient levels of CO are below the limit value; some incidental exceedances are observed but in these cases measuring artefacts can not be excluded. The benzene concentrations are in compliance with the limit values except for a limited number of traffic hotspot situations. Ozone precursor emissions are decreasing; the ozone concentrations, however, do not show a decreasing trend. On the contrary, the health related and the annual mean values show an increasing tendency. Both the health and the ecosystem related target values are exceeded frequently and widely over Europe The regular QA/QC checks applied to the delivered EoI data were extended to include checks for missing data and for questionable station coordinates. This year countries were also asked to verify the information on the administrative units in which stations are located. The methodology for calculating statistics and exceedances from the reported EoI data has also been reviewed and improved this year.

ETC/ACC Technical paper 2007/ 1 page 4 o f 53

ETC/ACC Technical paper 2007/1 page 5 of 53
CONTENTS
1. INTRODUCTION................................................................................................................... 7
2. EXCHANGE OF INFORMATION 2006 (DATA FOR 2005)..................................................... 9 2.1. Data delivery ............................................................................................................ 9 2.2. QA/QC feedback actions......................................................................................... 9 2.3. Results ....................................................................................................................... 9 2.4. Time series.............................................................................................................. 21 2.5. Total number of stations in AIRBASE .................................................................. 24
3. State of the air quality for selected pollutants ........................................................... 25 3.1. Introduction ........................................................................................................... 25 3.2. Sulphur dioxide (SO2) ........................................................................................... 27 3.3. Nitrogen dioxide (NO2)......................................................................................... 29 3.4. Particulate Matter (PM10 and PM2.5)................................................................... 31 3.5. Carbon monoxide (CO)......................................................................................... 34 3.6. Benzene ................................................................................................................... 36 3.7. Ozone (O3) .............................................................................................................. 38 3.8. Further reading...................................................................................................... 40
4. CONCLUSIONS................................................................................................................... 41
5. REFERENCES .................................................................................................................... 42
Annex A Exchange of Information requirements ............................................................. 45
Annex B. QA/QC feedback actions...................................................................................... 49
Annex C Status overview of the EoI 2005 EoI Reporting................................................ 53

ETC/ACC Technical paper 2007/ 1 page 6 o f 53

ETC/ACC Technical paper 2007/1 page 7 of 53
1. INTRODUCTION Countries of the European Union have a long tradition of exchanging air quality data. The reciprocal exchange among countries and the Commission is based on a series of Council Decisions. The latest Decision (97/101/EC) ‘establishing a reciprocal exchange of information and data from networks and individual stations measuring ambient air pollution within the Member States’, the so-called Exchange of Information (EoI), was adopted by the European Council in 1997 (EU 1997). The annexes to the Decision have been amended to adapt the list of pollutants covered to changes and requirements on additional information, validation and aggregation (EU 2001a, EU 2001b). Data submission followed the Guidance on the revised Annexes of the Decision (Garber et al. 2001).
Parallel to dataflow under the EoI, the EU Member States provide information on air quality in the context of the Air Quality Framework (FWD; EU 1996) and related daughter directives (EU 1999, EU 2000, EU 2002, EU 2004). This information mainly focuses on compliance checking with obligations under the air quality directives, such as limit values. To avoid duplicate reporting by the Member States, some of the meta data that is needed for evaluating the reports under the FWD (in particular the meta-information on stations and networks) is only sent under the EoI.
The EoI requires a large set of meta information and air quality data to be delivered to the Commission. Part of this information is mandatory and the other items are to be delivered to the Commission ‘to the extent possible’ and ‘as much information as feasible should be supplied’1.
According to the EoI Decision, the Commission will, each year, prepare a technical report on meta information and air quality data exchanged, and make the information available to EU Member States. The decision states that the Commission will call on the European Environment Agency (EEA) with regard to the operation and practical implementation of the information system. The European Topic Centre on Air and Climate Change (ETC/ACC), under contract to EEA, manages the database system, AIRBASE (see Mol et al. 2005a). The information submitted under the EoI is stored in AIRBASE and made available to the public on Internet via the ETC/ACC website2.
Efforts have been made to load meta-information for all stations sending information on near real time (NRT) ozone to EEA3 into AIRBASE. AIRBASE has become more and more the central database for the air quality meta information for the different air quality data flows: EoI, FWD (questionnaire, summer ozone reporting) and the NRT ozone Web site.
This report shows information provided by EU-27 Member States, including Bulgaria and Romania. Note that these two countries joined the European Union at 01-01-2007 and that this report is handling 2005-data provided in 2006. In addition it contains information from the other 5 EEA member countries and from the 5 cooperating countries4, which have agreed to follow the data exchange procedures in the framework of Euroairnet. This report also reports on the QA/QC aspects of the data in AIRBASE. The procedures and the first QA/QC checks are described in a report (see Mol et al. 2005b). A check for missing data has been added to the yearly QA/QC checks on the delivered EoI-data (outliers, missing essential meta data, possible overwriting of data already stored in AIRBASE, possible deletion 1 See Annex A for an overview. 2 http://airbase.eionet.europa.eu/3 http://www.eea.europa.eu/maps/ozone/welcome 4 EU27 Member States: Austria, Belgium, Bulgaria (since 01-01-2007), Denmark, Finland, Germany, Greece, Spain, France, Ireland, Italy, Luxembourg, The Netherlands, Portugal, Sweden, United Kingdom, Czech Republic, Estonia, Cyprus, Latvia, Lithuania, Hungary, Malta, Poland, Romania (since 01-01-2007), Slovenia, Slovakia. EU 25 Member States: EU27 Member States minus Bulgaria and Romania. Next to the 27 EU Member States the four EFTA Countries (Iceland, Liechtenstein, Norway and Switzerland) and Turkey are EEA member countries (EEA 32 member countries). EEA collaborating countries are: Albania, Bosnia and Herzegovina, FYROM, Croatia and Serbia-Montenegro.

ETC/ACC Technical paper 2007/ 1 page 8 o f 53 of stations and measurement configurations with data). In addition to these standard checks also QA/QC checks are performed on questionable station coordinates.
This year information on the administrative unit has been added to descriptive information of each monitoring station in AIRBASE. Besides the NUTS/LAU information also the EuroBoundaryMap1 (formerly known as SABE - Seamless Administrative Boundaries of Europe) information has been loaded in AIRBASE. The member states have been asked to check the linkage between stations and the NUTS/LAU and SABE administrative information. At the end of 2006 and the beginning of 2007 the EEA performed several checks on the generated statistics derived from the reported data in AirBase. These checks resulted in:
- improvements on the applications for specific cases (very low number of raw data within a year, wrongly reported datasets, duplicate datasets)
- detection of suspicious historical data wrongly marked as valid. Although the impact of the detected inconsistencies was low, these checks resulted in a further improvement of the AirBase information system.
In addition to the more technical aspects of the data submission process, this report will briefly describe the state of the air quality for some selected pollutants. The current (2005) air quality status will be described together with the changes in concentrations during the last 10 and 5 years.
1 http://www.eurogeographics.org/eng/04_sabe.asp

ETC/ACC Technical paper 2007/1 page 9 of 53
2. EXCHANGE OF INFORMATION 2006 (DATA FOR 2005)
2.1. Data delivery Thirty three countries, including all EU-27 Member States except Luxembourg, provided air quality data for the reporting year 2005 (see the status table in http://air-climate.eionet.europa.eu/country_tools/aq/eoi_to_airbase_status/index_html)
The delivery of data was facilitated by the Air Quality Data Exchange Module (AQ-DEM), developed by the ETC/ACC. This tool was used by most of the countries. Some countries provided their data in files in the EoI specified formats (DEM and ISO-7168-1: 1999 (extended) format). All data delivered for the reporting year 2005 was loaded into AIRBASE. All statistics and exceedances relevant in the Daughter Directives have been calculated and were also loaded into AIRBASE.
2.2. QA/QC feedback actions Several quality checks have been performed on delivered data and the already available information in AIRBASE. The procedures and the first QA/QC checks are described in a report (see Mol et al. 2005b). A check on missing data has been added to the yearly QA/QC checks on the delivered EoI-data (outliers, missing essential meta data, possible overwriting of data already stored in AIRBASE, possible deletion of stations and measurement configurations with data). In addition to these standard checks also QA/QC checks are performed on questionable station coordinates.
This year also extra administrative unit information has been added to AIRBASE. Besides the NUTS/LAU information1 also the EuroBoundaryMap2 (formerly known as SABE - Seamless Administrative Boundaries of Europe) information has been loaded in AIRBASE. The member states have been asked to check that stations are located in the correct administrative units.
Intensive feedback took place with the data suppliers on these items. The country feedbacks sent to the member states resulted for 22 EoI reports in one or more updates of their original report like:
- revalidation of suspicious data, originally reported as valid;
- resubmission of time series in which suspicious data were detected;
- updating (essential) meta information.
And as result of the new check, missing data, we detected in 12 EoI reports one or more missing time series. For 10 countries these reports resulted in additional submissions and/or meta information (end date of measurement). More detailed information on the country feedbacks can be found in Annex B.
2.3. Results Transmitted data cover pollutants including mainly sulphur dioxide (SO2), nitrogen dioxide (NO2), nitrogen oxides (NOx), ozone (O3), carbon monoxide (CO), particulate matter (PM10, PM2.5), benzene (C6H6) and lead (Pb). Fewer time series were submitted for less commonly monitored components. Although this report includes the available information up to April 2007, data processing is an ongoing process, so please refer to the AIRBASE website 3 for the most recent overview of the progress in processing the data.
1 http://ec.europa.eu/comm/eurostat/ramon/nuts/home_regions_en.html 2 http://www.eurogeographics.org/eng/04_sabe.asp 3 http://airbase.eionet.europa.eu

ETC/ACC Technical paper 2007/ 1 page 10 o f 53 The number of reporting countries varied per component (Table 1). For completeness we have also added the number of stations with NOx data (or if no NOx data are available with NO2 + NO data). We added also the number of stations providing data for one or more ozone precursors (VOC’s; excluding benzene which is listed separately) and for the 4th Daughter Directive the number of stations with data for one ore more Heavy Metals (As, Cd, Hg, Ni, excluding Pb which is listed separately) and one or more PAH’s ((benzo(a)pyrene, benzo(a)anthracen, benzo(b)fluoranthen, benzo(j)fluoranthen, benzo(k)fluoranthen, indeno (1,2,3-cd)pyren en dibenzo(a,h)anthracene). The number of countries ranged from 4 for one or more PAHs to all 33 for nitrogen dioxide and ozone. The number of stations varied accordingly, being 49 for one or more PAHs and 2753 for nitrogen dioxide.
More detailed information on the number and type of stations per pollutant and per country in 2005 can be found in table A “number of stations per pollutant and station type and country in 2005” in http://air-climate.eionet.europa.eu/databases/airbase/aqtables/eoi2006/index_html.
Consequently, the distribution and density of stations throughout Europe shows differences (Figures 2 through 9). This holds as well for the number of stations per country (Table 2).
All stations with primary data (raw data with averages varying from hour to year) are taken into account in this chapter, regardless of the data coverage at that station. Figure 1 compares the number of stations from Table 1 with the number of stations with >=75% and >=90% data coverage1. For O3 and CO only hourly concentration data have been delivered and for Pb only daily values. For the components SO2 , NO2 ,PM10 , PM2.5 and benzene hourly as well as daily concentration data are available; SO2 and NO2 data are delivered mainly as hourly values. Also measurement data with other averaging times than hour and day have been delivered: weekly, 4-weekly, monthly, 3-monthly and yearly. These measurement data are related to the 4th DD pollutants (Heavy Metals and PAH’s).
Stations which have delivered only statistics are not included in this report. However, the meta information of these stations and the statistics are available in AIRBASE. This evaluation focus on components defined under the Framework Directive (and the first three daughter directives). Most countries delivered data for more pollutants than the mandatory list of pollutants defined under the EoI. See table B “number of stations with HMs, VOCs, PAHs and other non-Directive components” in http://air-climate.eionet.europa.eu/databases/airbase/aqtables/eoi2006/index_html for a summary of these supplementary components.
The same number of countries (33) as in 2004 has delivered data in the framework of the EoI2006. The number of stations for which data are reported has increased for the components SO2 (+228), NO2 (+318),PM10 (+405), PM2.5 (+109), Pb (+118), CO(+175), benzene (+195) and O3 (+112). The number of stations for which NOx or NO +NO2 has been reported has decreased (-209). Fewer countries have reported NO in addition to NO2. There is a large difference between the number of stations for which NO2 has been reported and the number of stations for which NO (or NOx) has been reported. This is surprising as most automated monitors measure both pollutants simultaneously. See table C “number of stations with NO2 ,NOx and/or NO” in http://air-climate.eionet.europa.eu/databases/airbase/aqtables/eoi2006/index_html for an overview per country.
1 The data quality objectives as laid down in the Daughter Directives require, in general, a data coverage of 90%. For continuous measurements in the assessments presented here (chapter3) a criterion of 75% data coverage is applied.

ETC/ACC Technical paper 2007/1 page 11 of 53
Table 1 Number of stations for which 2005 data have been delivered for Daughter Directives components, specified per station type.
Daughter Directive1 1 1 1 1 1 2 2 3 3 4 4
SO2 NO2 NOx/NO PM10 PM2.5 Pb CO C6H6 O3 VOC HM PAHReporting EU countries 26 26 24 26 15 14 26 20 26 10 11 4Total number of stations 2152 2663 1878 2229 257 257 1219 566 1948 149 263 49Of whichTraffic 466 766 643 648 77 62 627 269 326 87 63 7Urban background 847 1088 647 948 104 97 409 197 911 45 85 30Industrial 506 423 307 359 21 55 117 65 217 10 55 5Regional background 293 339 275 236 48 43 46 29 446 7 60 7Other (total) 40 47 6 38 7 0 20 6 48 0 0 0
Reporting non-EU countries 6 7 7 6 3 6 5 7 2Total number of stations 84 90 59 60 12 32 16 56 6Of whichTraffic 27 34 26 25 9 20 12 17 1Urban background 30 30 17 19 3 4 3 14 3Industrial 15 12 7 7 6 7Regional background 12 14 9 9 2 1 18 2Other (total) 0 0 0 0 0 0 0 0 0 0 0 0
Total reporting countries 32 33 31 32 18 14 32 25 33 12 11 4Total number of stations 2236 2753 1937 2289 269 257 1251 582 2004 155 263 49
Table 2 Number of stations for which 2005 data have been delivered for Daughter Directives components, specified per country.
Daughter Directive1 1 1 1 1 1 2 2 3 3 4 4
SO2 NO2 NOx/NO PM10 PM2.5 Pb CO C6H6 O3 VOC HM PAHEU-27 countriesAUSTRIA 118 148 148 107 7 15 41 20 115 1 11 3BELGIUM 66 63 63 47 9 37 18 34 39 36BULGARIA 30 30 14 28 11 12 13 12 3CYPRUS 1 1 1 2 1 2CZECH REPUBLIC 89 92 92 120 32 25 32 26 61 25 20DENMARK 5 12 12 10 3 7 1 9 1ESTONIA 7 7 7 4 5 7FINLAND 11 28 28 32 6 8 16FRANCE 402 520 358 59 107 33 467GERMANY 270 441 435 428 24 227 177 314 69 103GREECE 8 17 17 10 2 10 1 20HUNGARY 24 24 23 19 16 7 16IRELAND 10 10 10 14 10 5 5 8ITALY 265 355 235 235 12 6 265 90 198 33LATVIA 6 6 3 4 1 1 5 4 2LITHUANIA 12 13 8 12 7 7 5 11MALTA 2 2 2 2 2 1 3 1NETHERLANDS 37 45 45 40 4 22 8 39 8 4POLAND 132 135 71 150 2 29 48 17 54 4PORTUGAL 46 63 63 54 17 41 5 46ROMANIA 39 32 16 15 16 12 16 5 7SLOVAKIA (Slovak Republic) 27 28 28 28 3 21 11 14 22 21SLOVENIA 22 10 10 10 5 11SPAIN 436 443 434 403 70 44 234 65 352 22SWEDEN 11 27 5 27 7 3 15 16UNITED KINGDOM 76 111 111 71 4 28 79 41 88 15 27 24Total EU-27 countries 2152 2663 1878 2229 257 257 1219 566 1948 149 263 49non-EU-27 countriesBOSNIA - HERZEGOVINA 3 3 1 2 3 2ICELAND 1 2 2 2 2 1 1 4 1LIECHTENSTEIN 2 2 2 2MACEDONIA;FORMER YU 36 14 14 14 13 1 13NORWAY 6 19 14 19 8 4 10 9SERBIA AND MONTENEG 25 24 3 1 1 1 1SWITZERLAND 13 26 23 22 10 3 25 5Total non-EU-27 countries 84 90 59 60 12 0 32 16 56 6 0 0Total all countries 2236 2753 1937 2289 269 257 1251 582 2004 155 263 49

ETC/ACC Technical paper 2007/ 1 page 12 o f 53 Figure 1 Number of stations with 2005 data coverage >0% (with data), >=75% and >=90%

ETC/ACC Technical paper 2007/1 page 13 of 53
Figure 2 Location of stations for which 2005 air quality data for sulphur dioxide (SO2) have been reported.

ETC/ACC Technical paper 2007/ 1 page 14 o f 53
Figure 3 Location of stations for which 2005 air quality data for nitrogen dioxide (NO2) have been reported.

ETC/ACC Technical paper 2007/1 page 15 of 53
Figure 4 Location of stations for which 2005 air quality data for particulate matter (PM10) have been reported.

ETC/ACC Technical paper 2007/ 1 page 16 o f 53
Figure 5 Location of stations for which 2005 air quality data for particulate matter (PM2.5) have been reported.

ETC/ACC Technical paper 2007/1 page 17 of 53
Figure 6 Location of stations for which 2005 air quality data for lead (Pb) have been reported.

ETC/ACC Technical paper 2007/ 1 page 18 o f 53
Figure 7 Location of stations for which 2005 air quality data for carbon monoxide (CO) have been reported.

ETC/ACC Technical paper 2007/1 page 19 of 53
Figure 8 Location of stations for which 2005 air quality data for benzene (C6H6) have been reported.
ETC/ACC Technical paper 2007/ 1 page 20 o f 53
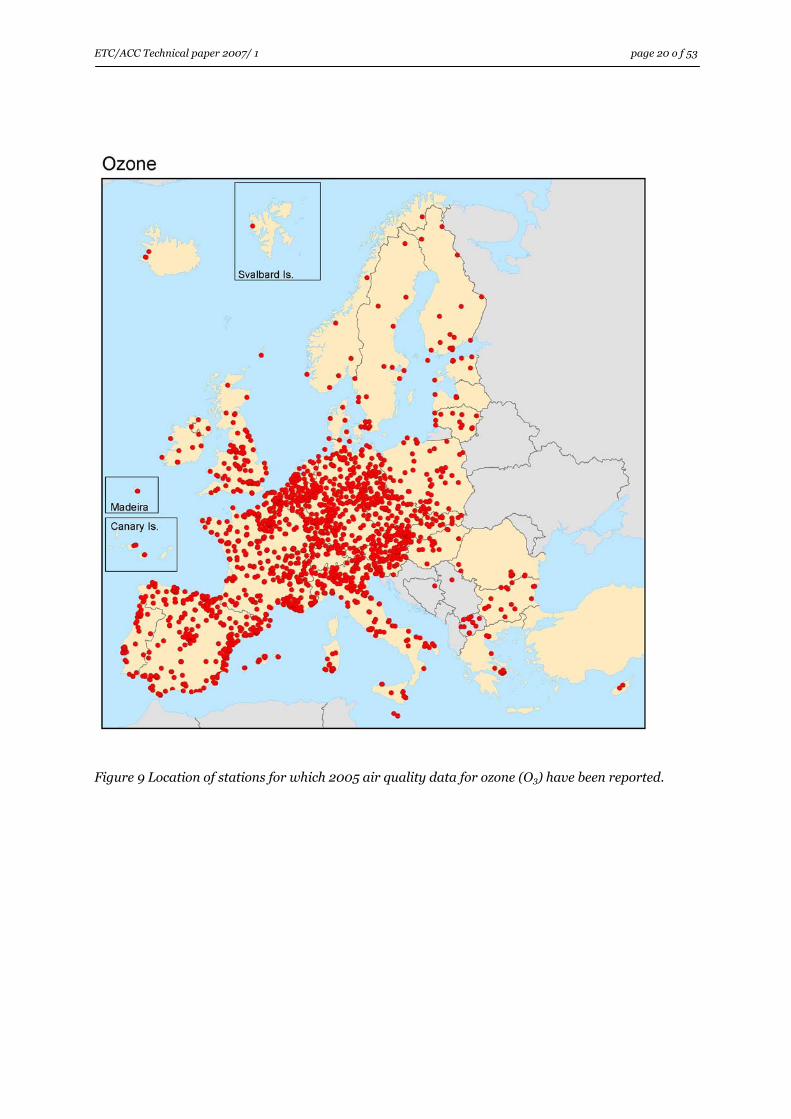
Figure 9 Location of stations for which 2005 air quality data for ozone (O3) have been reported.
ETC/ACC Technical paper 2007/1 page 21 of 53
2.4. Time series The total number of stations with raw data which are operational in 2005 is 3852 (see Table 3).
Long-term measurement series provide valuable information for determining, for example, the effect of abatement measures and trend analysis. Since AIRBASE became operational in 1997, the average length of the time series in AIRBASE is relatively short (see Table 4). The number of countries and stations with continuous time series with length 10, 5 or 1 year and ending in 2005, is visualized in Figure 10. However, as one of the long-term objectives is to expand the time series in AIRBASE, further improvement can be expected. More information about time series can be found in table D “Information on time series in AirBase” in http://air-climate.eionet.europa.eu/databases/airbase/aqtables/eoi2006/index_html.
Note that the length of the time series in years in Table 4 and table “Information on time series in AirBase” are calculated regardless of the data capture in a year. If there is a gap of one or more years, the maximum length of time series is taken. For the average length of time series all stations available in AIRBASE have been included.
ETC/ACC Technical paper 2007/ 1 page 22 o f 53
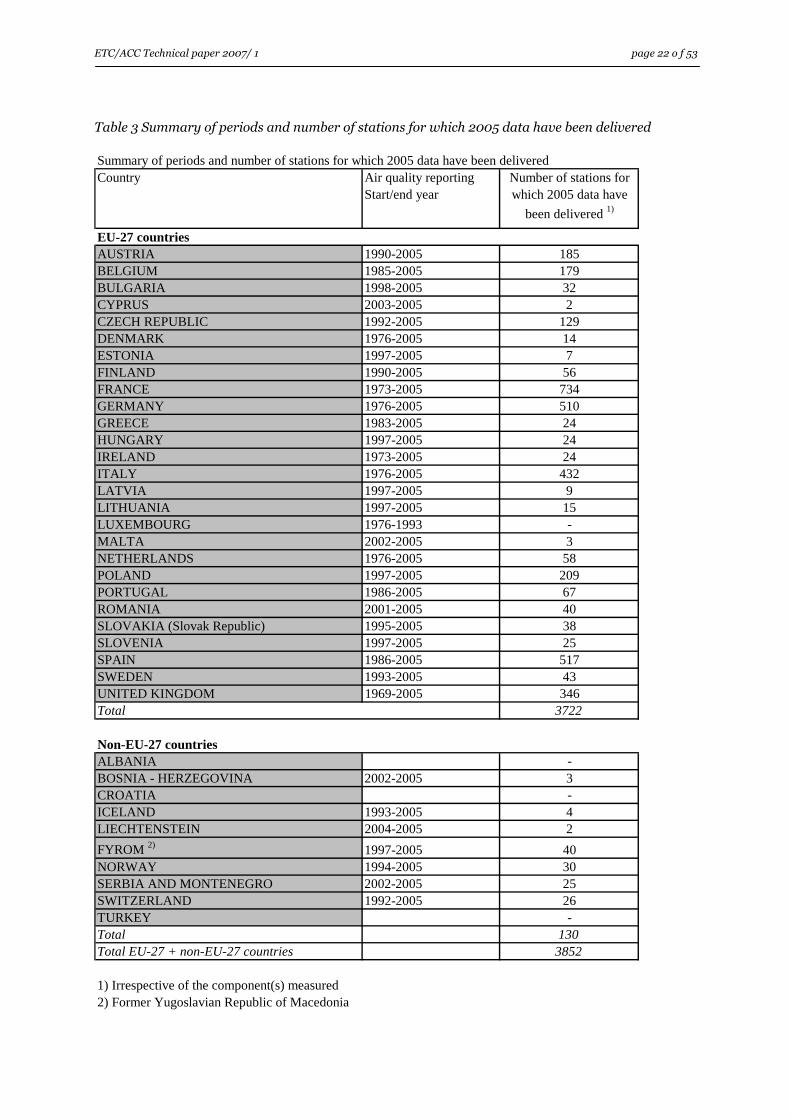
Table 3 Summary of periods and number of stations for which 2005 data have been delivered Summary of periods and number of stations for which 2005 data have been delivered Country Air quality reporting
Start/end yearNumber of stations for which 2005 data have
been delivered 1)
EU-27 countries AUSTRIA 1990-2005 185BELGIUM 1985-2005 179BULGARIA 1998-2005 32CYPRUS 2003-2005 2CZECH REPUBLIC 1992-2005 129DENMARK 1976-2005 14ESTONIA 1997-2005 7FINLAND 1990-2005 56FRANCE 1973-2005 734GERMANY 1976-2005 510GREECE 1983-2005 24HUNGARY 1997-2005 24IRELAND 1973-2005 24ITALY 1976-2005 432LATVIA 1997-2005 9LITHUANIA 1997-2005 15LUXEMBOURG 1976-1993 -MALTA 2002-2005 3NETHERLANDS 1976-2005 58POLAND 1997-2005 209PORTUGAL 1986-2005 67ROMANIA 2001-2005 40SLOVAKIA (Slovak Republic) 1995-2005 38SLOVENIA 1997-2005 25SPAIN 1986-2005 517SWEDEN 1993-2005 43UNITED KINGDOM 1969-2005 346Total 3722
Non-EU-27 countries ALBANIA -BOSNIA - HERZEGOVINA 2002-2005 3CROATIA -ICELAND 1993-2005 4LIECHTENSTEIN 2004-2005 2FYROM 2) 1997-2005 40NORWAY 1994-2005 30SERBIA AND MONTENEGRO 2002-2005 25SWITZERLAND 1992-2005 26TURKEY -Total 130Total EU-27 + non-EU-27 countries 3852
1) Irrespective of the component(s) measured2) Former Yugoslavian Republic of Macedonia
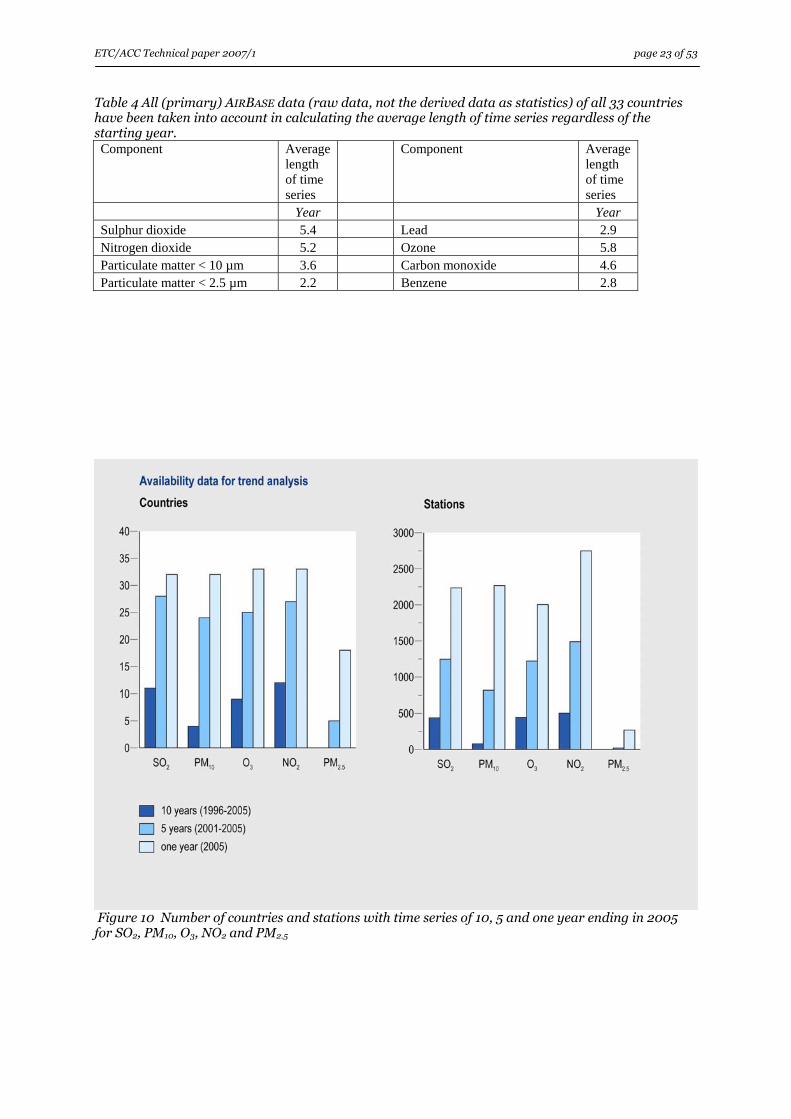
ETC/ACC Technical paper 2007/1 page 23 of 53 Table 4 All (primary) AIRBASE data (raw data, not the derived data as statistics) of all 33 countries have been taken into account in calculating the average length of time series regardless of the starting year. Component Average
length of time series
Component Average length of time series
Year Year Sulphur dioxide 5.4 Lead 2.9 Nitrogen dioxide 5.2 Ozone 5.8 Particulate matter < 10 µm 3.6 Carbon monoxide 4.6 Particulate matter < 2.5 µm 2.2 Benzene 2.8
Figure 10 Number of countries and stations with time series of 10, 5 and one year ending in 2005 for SO2, PM10, O3, NO2 and PM2.5

ETC/ACC Technical paper 2007/ 1 page 24 o f 53
2.5. Total number of stations in AIRBASE Since its introduction in 1997 AIRBASE has grown into a database which nowadays contains air quality data from 34 European countries for the years ranging from 1969 (United Kingdom) to 2005 for many pollutants. The total number of stations in AIRBASE is 6011, from which 5523 stations have measurement data. The 488 stations without data are partially stations for which meta information has been delivered but no measurement data (Germany) and partially stations for which measurement data will be delivered (e.g. United Kingdom). But also reporting near real time ozone to EEA which have not yet delivered for the EoI are included. In spite of the EoI obligation to send only raw data or raw data combined with statistics, there are still 241 stations with only statistics in AIRBASE. Summarized, in AIRBASE we have:
5282 stations with raw data 241 stations with only statistics
5523 stations with data 488 stations without data
6011 stations in total
Information on stations with missing essential information1, see table E “number of stations with/without data and with missing essential meta information” in http://air-climate.eionet.europa.eu/databases/airbase/aqtables/eoi2006/index_html.
1 From a user perspective the meta information essential for an adequate assessment of the air quality data consist of: station characteristics in terms of type of station and are, geographical co-ordinates and altitude, station name (see Mol and van Hooydonk 2005c for further discussion)
ETC/ACC Technical paper 2007/1 page 25 of 53
3. State of the air quality for selected pollutants
3.1. Introduction
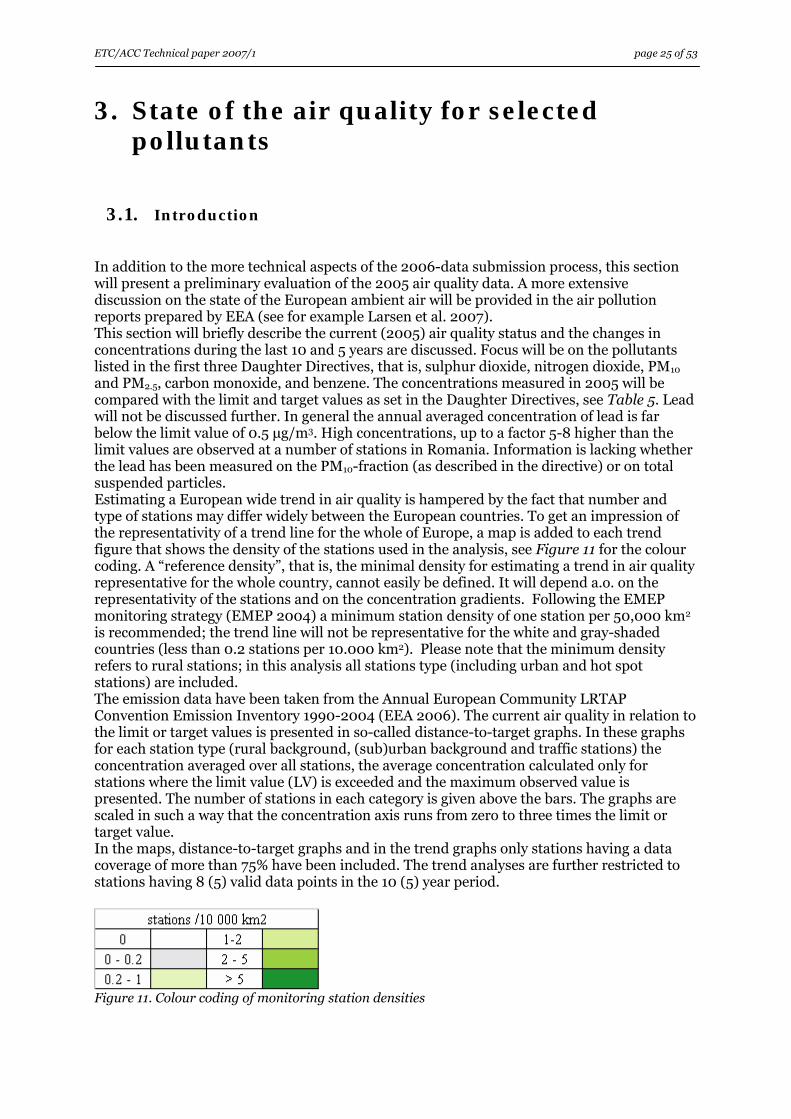
In addition to the more technical aspects of the 2006-data submission process, this section will present a preliminary evaluation of the 2005 air quality data. A more extensive discussion on the state of the European ambient air will be provided in the air pollution reports prepared by EEA (see for example Larsen et al. 2007). This section will briefly describe the current (2005) air quality status and the changes in concentrations during the last 10 and 5 years are discussed. Focus will be on the pollutants listed in the first three Daughter Directives, that is, sulphur dioxide, nitrogen dioxide, PM10 and PM2.5, carbon monoxide, and benzene. The concentrations measured in 2005 will be compared with the limit and target values as set in the Daughter Directives, see Table 5. Lead will not be discussed further. In general the annual averaged concentration of lead is far below the limit value of 0.5 μg/m3. High concentrations, up to a factor 5-8 higher than the limit values are observed at a number of stations in Romania. Information is lacking whether the lead has been measured on the PM10-fraction (as described in the directive) or on total suspended particles. Estimating a European wide trend in air quality is hampered by the fact that number and type of stations may differ widely between the European countries. To get an impression of the representativity of a trend line for the whole of Europe, a map is added to each trend figure that shows the density of the stations used in the analysis, see Figure 11 for the colour coding. A “reference density”, that is, the minimal density for estimating a trend in air quality representative for the whole country, cannot easily be defined. It will depend a.o. on the representativity of the stations and on the concentration gradients. Following the EMEP monitoring strategy (EMEP 2004) a minimum station density of one station per 50,000 km2 is recommended; the trend line will not be representative for the white and gray-shaded countries (less than 0.2 stations per 10.000 km2). Please note that the minimum density refers to rural stations; in this analysis all stations type (including urban and hot spot stations) are included. The emission data have been taken from the Annual European Community LRTAP Convention Emission Inventory 1990-2004 (EEA 2006). The current air quality in relation to the limit or target values is presented in so-called distance-to-target graphs. In these graphs for each station type (rural background, (sub)urban background and traffic stations) the concentration averaged over all stations, the average concentration calculated only for stations where the limit value (LV) is exceeded and the maximum observed value is presented. The number of stations in each category is given above the bars. The graphs are scaled in such a way that the concentration axis runs from zero to three times the limit or target value. In the maps, distance-to-target graphs and in the trend graphs only stations having a data coverage of more than 75% have been included. The trend analyses are further restricted to stations having 8 (5) valid data points in the 10 (5) year period.
Figure 11. Colour coding of monitoring station densities

ETC/ACC Technical paper 2007/ 1 page 26 o f 53 Table 5 Limit and target values defined by the European Union for SO2, NO2, PM10, Benzene, CO and O3 Parameter period Limit
and target values (μg/m3)
No of allowed exceedances
Target data
SO2 (1999/30/EC) Human health protection Hourly average 350 24 hours/yr Human health protection Daily average 125 3 days/yr Vegetation protection Annual average 20 Vegetation protection winter average 20 NO2 (1999/30/EC) Human health protection Hourly average 200 18 hours/yr 1 Jan 2010 Human health protection Annual average 40 1 Jan 2010 PM10 (1999/30/EC) Human health protection Daily average 50 35 days/yr Human health protection Annual average 40 Pb (1999/30/EC) Human health protection Annual average 0.5 CO (2000/69/EC) Human health protection 8h running averagea 10 b Benzene (2000/69/EC) Human health protection Annual average 5 1 Jan 2010 Ozone (2002/3/EC) Human health protection 8h running averagea 120 25 days/yr 1 Jan 2010 Vegetation protection Hourly averaged
(growing season) 18 c 1 Jan 2010
(a) daily maximum of 8h running averaged concentrations (b) in mg/m3 (c) in (mg/m3).h

ETC/ACC Technical paper 2007/1 page 27 of 53
3.2. Sulphur dioxide (SO2)
Sources & effects
0 - 5 ug/m3
5 - 10 ug/m3
10 - 20 ug/m3
> 20 ug/m3
SO2annual mean
2005all stations, data coverage > 75%
Man-made contributions to ambient SO2 includes mainly the use of sulphur-containing fossil fuels and bio-fuels used for domestic heating, stationary power generation and for transport. Volcanoes are the most important natural sources. Epidemiological studies published in the recent past provide suggestive evidence on the human health effects of sulphur dioxide. SO2 is a major precursor to particulate matter (PM2.5) which is associated with significant health effects. Sulphur dioxide and its oxidation products contribute to acid deposition. Status At 1933 stations SO2 monitoring data fulfil the data coverage criteria of 75%. At half of them the annual mean is below 5 μg/m3. At about 100 stations, in Spain and the Balkan and a few other countries, the annual mean is above 20 μg/m3. As none of these stations has been classified as “rural background”, this suggests that the limit value for the annual average for protection of vegetation was probably not exceeded in 2005. In the first daughter directive the EU has set limit values for the protection of human health (a daily average of 125 µg/m3 not to be exceeded on more than 3 days per year and an hourly average of 350 µg/m3 not to be exceeded on more than 24 days per year). The extent of exceedance of the SO2 limit values is displayed in the figures on the left. Comparing the figures for the two limit values it is clear that the daily limit value is exceeded more than the hourly limit value. At rural stations no exceedance is observed for either of the two limit values. For both urban background and traffic hotspot stations an exceedance is observed at less then 1.5% of all stations. Concentrations at traffic hotspots tend to be higher than in the urban background; the difference is, however, not significant. Note that the number of stations differs in both graphs as a limited number of stations report only daily values.
ETC/ACC Technical paper 2007/ 1 page 28 o f 53
Trends in SO2 levels
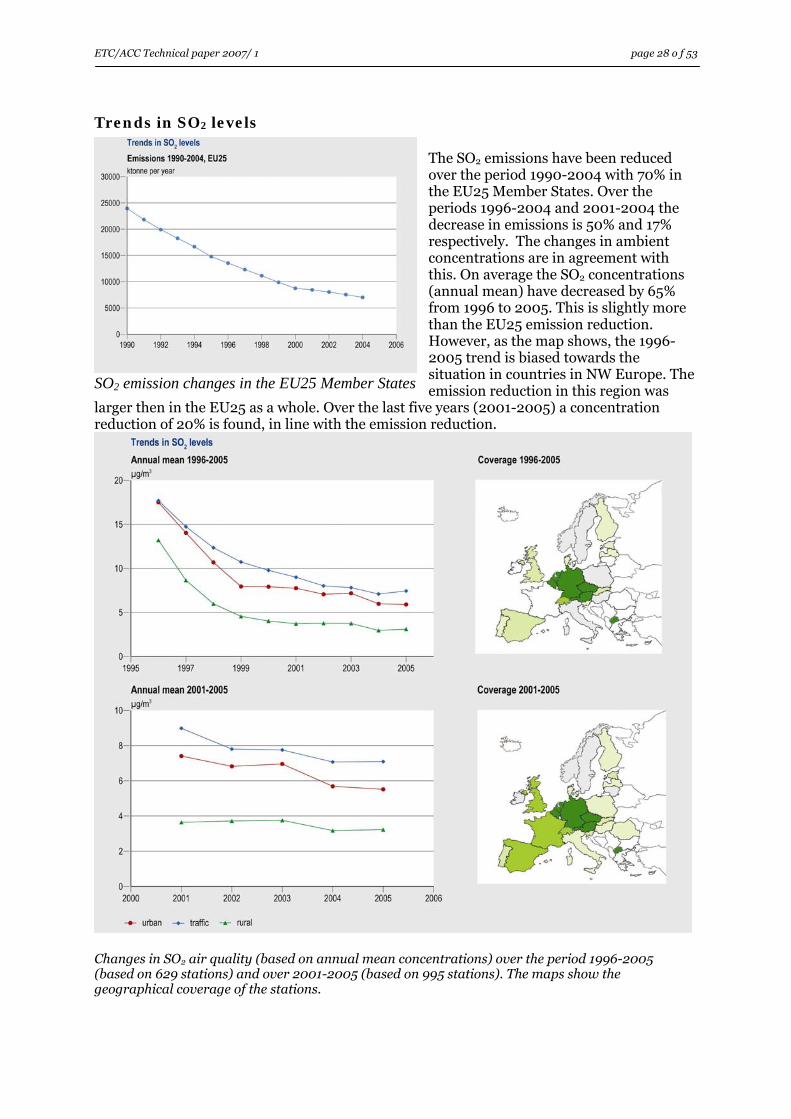
The SO2 emissions have been reduced over the period 1990-2004 with 70% in the EU25 Member States. Over the periods 1996-2004 and 2001-2004 the decrease in emissions is 50% and 17% respectively. The changes in ambient concentrations are in agreement with this. On average the SO2 concentrations (annual mean) have decreased by 65% from 1996 to 2005. This is slightly more than the EU25 emission reduction. However, as the map shows, the 1996-2005 trend is biased towards the situation in countries in NW Europe. The emission reduction in this region was
larger then in the EU25 as a whole. Over the last five years (2001-2005) a concentration reduction of 20% is found, in line with the emission reduction.
SO2 emission changes in the EU25 Member States
Changes in SO2 air quality (based on annual mean concentrations) over the period 1996-2005 (based on 629 stations) and over 2001-2005 (based on 995 stations). The maps show the geographical coverage of the stations.
ETC/ACC Technical paper 2007/1 page 29 of 53
3.3. Nitrogen dioxide (NO2)
Sources & effects
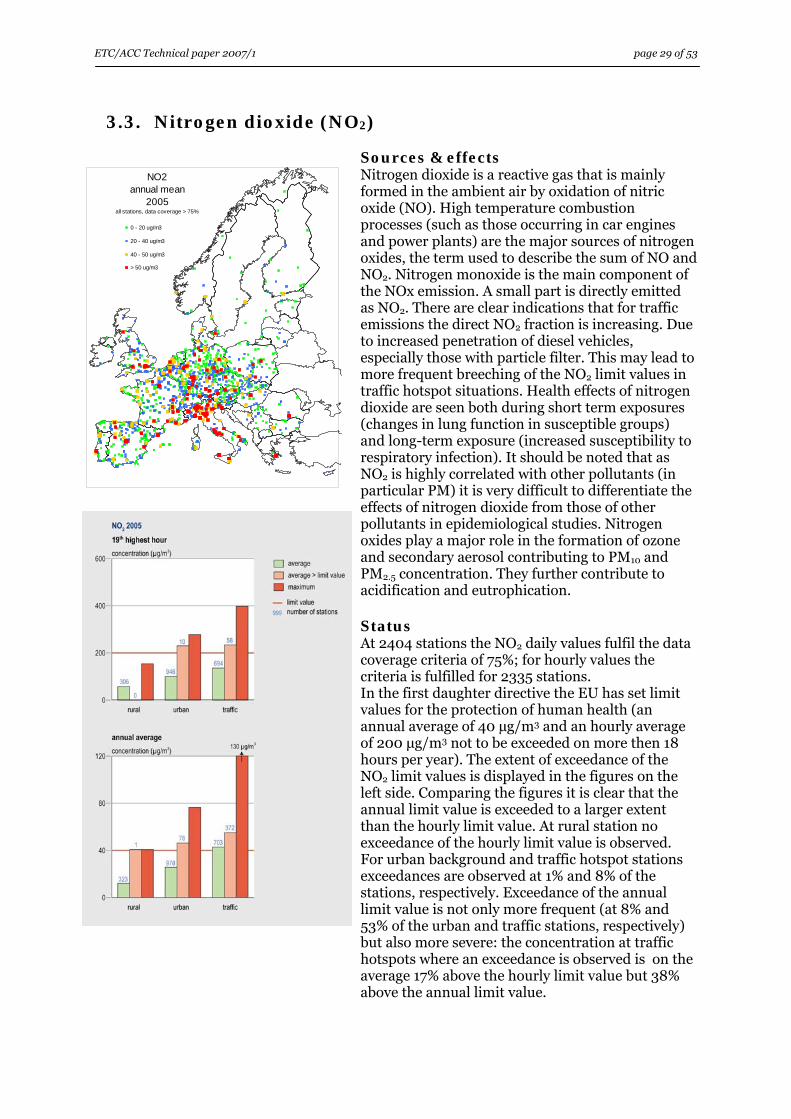
0 - 20 ug/m3
20 - 40 ug/m3
40 - 50 ug/m3
> 50 ug/m3
NO2annual mean
2005all stations, data coverage > 75%
Nitrogen dioxide is a reactive gas that is mainly formed in the ambient air by oxidation of nitric oxide (NO). High temperature combustion processes (such as those occurring in car engines and power plants) are the major sources of nitrogen oxides, the term used to describe the sum of NO and NO2. Nitrogen monoxide is the main component of the NOx emission. A small part is directly emitted as NO2. There are clear indications that for traffic emissions the direct NO2 fraction is increasing. Due to increased penetration of diesel vehicles, especially those with particle filter. This may lead to more frequent breeching of the NO2 limit values in traffic hotspot situations. Health effects of nitrogen dioxide are seen both during short term exposures (changes in lung function in susceptible groups) and long-term exposure (increased susceptibility to respiratory infection). It should be noted that as NO2 is highly correlated with other pollutants (in particular PM) it is very difficult to differentiate the effects of nitrogen dioxide from those of other pollutants in epidemiological studies. Nitrogen oxides play a major role in the formation of ozone and secondary aerosol contributing to PM10 and PM2.5 concentration. They further contribute to acidification and eutrophication. Status At 2404 stations the NO2 daily values fulfil the data coverage criteria of 75%; for hourly values the criteria is fulfilled for 2335 stations. In the first daughter directive the EU has set limit values for the protection of human health (an annual average of 40 µg/m3 and an hourly average of 200 μg/m3 not to be exceeded on more then 18 hours per year). The extent of exceedance of the NO2 limit values is displayed in the figures on the left side. Comparing the figures it is clear that the annual limit value is exceeded to a larger extent than the hourly limit value. At rural station no exceedance of the hourly limit value is observed. For urban background and traffic hotspot stations exceedances are observed at 1% and 8% of the stations, respectively. Exceedance of the annual limit value is not only more frequent (at 8% and 53% of the urban and traffic stations, respectively) but also more severe: the concentration at traffic hotspots where an exceedance is observed is on the average 17% above the hourly limit value but 38% above the annual limit value.

ETC/ACC Technical paper 2007/ 1 page 30 o f 53
Trends in NO2 levels The NOx emissions have been reduced over the period 1990-2004 with 32% in the EU25 Member States. Over the periods 1996-2004 and 2001-2004 the decrease in emissions is 20% and 6% respectively. The changes in ambient NO2 concentrations depend on the type of station. At rural stations, the 1996-2005 concentration change (- 25%) is in line with the emission change. At more polluted stations the decrease in NO2 is less: 18% and 5% reduction at urban background and traffic hotspots, respectively. Close to NOx sources a similar reduction in NOx emissions and corresponding NOx concentrations is not seen in
the NO2 concentrations as the NO2/NOx ratio increase due to ozone oxidation of the available NO. In rural situations NO concentrations are very low and NOx and NO2 concentrations changes are more parallel. A second reason of the small NO2 reduction at traffic sites is the increase of direct emission of NO2 by diesel cars. Over the last five years (2001-2005) the annual averaged NO2 concentrations do not show a distinct trend.
NOx emission changes in the EU25 Member States
Changes in NO2 air quality (based on annual mean concentrations) over the period 1996-2005 (based on 680 stations) and over 2001-2005 (based on 1211 stations). The maps show the geographical coverage of the stations.

ETC/ACC Technical paper 2007/1 page 31 of 53
3.4. Particulate Matter (PM10 and PM2.5)
Sources & effects Particulate matter is the general term used for a mixture of solid particles and liquid droplets with a wide range in size and chemical composition. PM2.5 refers to fine particle that have a diameter of 2.5 micrometer or less. PM10 refers to the particles with a diameter of 10 micrometer or less. PM is either emitted directly (primary particles) or formed in the atmosphere from primary gaseous emissions (secondary particles, most important precursors are sulphur dioxide, nitrogen oxides, ammonia and organic compounds). PM is from natural (e.g. sea salt, Sahara dust, pollen, volcanic emissions) or anthropogenic origin such as thermal power generation, incineration and vehicles. In cities vehicle exhaust and road dust are important sources. Epidemiological studies indicate that the most severe health effects from exposure to air pollution must be attributed to the particulate matter and, in a lesser extent, to ozone (see section 3.7). It is suggested that for both pollutants there is no safe level: even at concentrations below current air quality guidelines they may pose a health risk (WHO, 2006). Health effects of fine particulate matter (PM) are caused by their inhalation and penetration into the lungs. Both chemical and physical interactions with lung tissues can induce irritation or damage. Since finer PM are more able to penetrate the lungs, the size of the particles is of significance. The current scientific understanding is that mortality effects of PM are mainly associated with the PM2.5 fraction which represents 40 – 80% of the PM10-mass (Larssen and de Leeuw 2007). However, health effects are seen with both the finer sub-2.5μm and the coarser 2.5-10μm fractions of PM10. Whilst evidence is growing that finer size fractions are perhaps most important, ambient air quality measurements and emission data at present are often only available for PM10. Different methods are in use from the routine monitoring of PM10. Some of these methods are very sensitive for sampling artefacts. The first daughter directive states that when a non-reference method is applied, equivalence with the reference method has to be ensured, if necessary, by applying a
correction factor. However, it can not be excluded that incidentally the data obtained by a non-reference method has not been or is not properly corrected prior to submission to
0 - 20 ug/m3
20 - 40 ug/m3
40 - 50 ug/m3
> 50 ug/m3
PM10annual mean
2005all stations, data coverage > 75%

ETC/ACC Technical paper 2007/ 1 page 32 o f 53 AirBase. This may lead to a systematic underestimation for the stations concerned. Overview of PM measuring methods and correction factors are available from the ETC/ACC web site (Buijsman and de Leeuw 2004, de Leeuw 2005). Status At 1838 stations the PM10 daily values fulfil the data coverage criteria of 75%. In the first daughter directive the EU has set limit values for the protection of human health (an annual average of 40 µg/m3 and a daily average of 50 μg/m3 not to be exceeded on more than 35 days per year). The extent of exceedance of the PM10 limit values is displayed in the distance-to-target graphs. Comparing the figures it is clear that the daily limit value is exceeded to a larger extent than the annual limit value. Exceedance of both limit values is observed at all types of stations with increasing numbers from rural to urban to traffic hotspot. The daily limit value is frequently exceeded at urban stations (more than 30%) and at traffic stations (more than 55%). Trends in PM10 levels
The total PM10 emissions have been reduced over the period 1990-2004 with 47% in the EU25 Member States. The secondary PM-precursor emissions are calculated as a weighted sum of the emissions of PM-precursors SO2, NOx and NH3 (see de Leeuw 2002).This reduction is largely due to a reduction in SO2 emissions. The primary PM10 emissions have been reduced by 45% over this period. Over the period 1997-2004 and 2001-2004 the decrease in total emissions is 22% and 8%, respectively. The limited number of stations operational during the period 1997-2005 and the large meteorologically induced inter-year variations over the entire
period precludes any firm conclusion about a possible trend. Although the number of stations providing data during the last five year period has been more than doubled, a clear European-wide trend is not observed.
Changes in emissions of primary PM10 and total emissions (primary plus secondary) in the EU25 Member States
The number of operational PM2.5 stations is growing but still limited. For 2005 there are 175 stations fulfilling the criteria of more than 75% data coverage. Although the spatial coverage of monitoring stations is presently insufficient to assess variations across Europe, some comparison is possible between observations at the increasing numbers of monitoring stations reporting PM2.5 and the 25 μg/m3 ‘cap’ value of the proposed Air Quality Directive (EU 2005). Information is unfortunately too limited to compare against the expected concentration reduction trends of the proposed PM2.5 exposure reduction target (EU 2005). As many current PM2.5 monitor types significantly underestimate concentrations mass loss during sampling, real PM2.5 concentrations would be higher than those shown. The indication is that hot-spot (traffic-related) locations may well exceed the cap value, although most PM2.5 observations are below the proposed limit. Concentrations generally increase from rural-to-urban-to-traffic locations, in accordance with increasing proximity to PM sources.

ETC/ACC Technical paper 2007/1 page 33 of 53
Changes in PM10 air quality (based on annual mean concentrations) over the period 1997-2005 (based on 202 stations) and over 2001-2005 (based on 565 stations).
Measured PM2.5 concentrations, 2005 (μg/m3, annual average) for several countries. Each bar represents the average concentrations for each station type

ETC/ACC Technical paper 2007/ 1 page 34 o f 53
3.5. Carbon monoxide (CO)
Sources & effects Carbon monoxide (CO) is a colourless, odourless gas that is formed during the incomplete combustion of fossil fuels and biofuels. The contribution of road transport to the CO emissions decreases from 56% in 1990 to 41% in 2003; the remaining is mainly emitted during energy production. The CO concentrations tend to vary with the traffic patterns during the day; the highest CO levels are found in urban areas, typically during rush hours at traffic locations. The atmospheric lifetime of CO is about 3 months. It is slowly oxidized to carbon dioxide. During this oxidation process ozone is formed and CO contributes to the hemispheric ozone background concentrations. Carbon monoxide enters the body through the lungs. In the blood it is strongly bound to hemoglobin and thereby it reduces the oxygen delivery to the body’s organs and tissues. Those who suffer from cardiovascular disease are the most sensitive towards CO exposure. Status At 1063 stations the CO daily maximum 8-hour mean values fulfil the data coverage criteria of 75%. In the second daughter directive the EU has set limit values for the protection of human health: the CO daily maximum 8-hour mean values may not exceed 10 mg/m3. This level is not exceeded at the few operational rural stations. Exceedances are observed at less then 1% and at 2% of the urban and traffic stations, respectively. Most of these exceedances are observed in one Italian region; measurement artefacts can not be excluded.
0 - 1 mg/m3
1 - 2 mg/m3
2 - 10 mg/m3
> 10 mg/m3
COannual mean 8h-daily max
2005all stations, data coverage > 75%
CO emission changes in the EU25 Member States
Trends in CO levels The CO emissions have been halved over the period 1990-2004 in the EU25 Member States. Over the periods 1997-2004 and 2001-2004 the decrease in emissions is 29% and 12% respectively. The changes in ambient concentrations are in agreement with this. On average the CO concentrations (annual mean of 8h daily maximum values) have decreased at traffic and urban stations, relatively close to the sources, with 50% from 1997-2005. At rural stations the decrease is about 10%. With an atmospheric reference time of about 3 months the

ETC/ACC Technical paper 2007/1 page 35 of 53 rural concentrations will to a large extent be determined by sources outside the EU25. Over the last five years (2001-2005) a 30% reduction is observed at traffic stations; in the urban background the reduction is about 23%. .
Changes in CO air quality (based on annual mean concentrations) over the period 1997-2005 (based on 390 stations) and over 2001-2005 (based on 455 stations). The maps show the geographical coverage of the stations

ETC/ACC Technical paper 2007/ 1 page 36 o f 53
3.6. Benzene
0 - 1 ug/m3
1 - 2 ug/m3
2 - 5 ug/m3
> 5 ug/m3
Benzeneannual mean
2005all stations, data coverage > 75%
Sources & effects Benzene is a volatile, colourless liquid with a sweet smell. Incomplete burning from combustion is the most significant source. Benzene is an additive to petrol with a maximum concentration of 1% v/v. At the European scale, 80-85% of benzene emissions are due to vehicular traffic. In general the contributions of domestic heating are small (about 5%) but with sharp geographic patterns. In Sweden the domestic contribution reaches over 50%. Removal of benzene from the atmosphere is mainly by reaction with the hydroxyl (OH) radical. Photo-oxidation does contribute to ozone formation, although benzene reactivity is relatively low. A lifetime of several days at representative tropospheric OH- concentrations is sufficient for benzene to be transported over long distances. Inhalation is the dominant pathway for benzene exposure in humans, food and water consumption being only a minor source. Smoking is a large source of personal exposure. The most significant adverse effects from prolonged exposure are haematotoxicity, genotoxicity and carcinogenicity. Chronic exposure to benzene can depress bone marrow, and cause haematological effects such as decreased red and white blood cell count in workers occupationally exposed to high concentrations. Status
At 383 stations the benzene daily values fulfil the data coverage criteria of better than 75%. The second Daughter Directive (2000/69/EC) set an annual average concentration limit value of 5μg/m3 for benzene in ambient air, to be met by 2010. Including the margin of tolerance, the annual mean concentrations may not exceed 10 μg/m3 in 2005. At rural stations no exceedance of the limit value is observed. Exceedance of the limit value is observed at one urban station and at 7 traffic hotspot stations. Exceedances of the limit value plus margin of tolerance have not been reported. Trends in benzene levels Recent summaries of the benzene emissions in the EU25 countries do not exist. For a limited number of countries emission data representative for the last decade of the previous century is presented in the position paper on benzene in support to the preparation of the second

ETC/ACC Technical paper 2007/1 page 37 of 53 daughter directive. More recent, expert-based emission data have been prepared for the Auto Oil Programme (EEA, 2001). These studies indicate decreasing benzene emissions but a further quantification is not possible. Most important control methods to reduce benzene emissions include the reduction of benzene content of petrol to 1% in 2000, the introduction of catalytic converters and vapour recovery of petrol deliveries. Up to 2001 benzene monitoring data has been submitted for less then 100 stations. Since 2001 onwards the number of stations annually reporting data might be as large as 500 although at a large number of the stations the data coverage criteria of 75% have not been met. For only 44 traffic stations a complete time series has been reported over the period 2001 – 2005. On the average these traffic station show a reduction by one third in these five years.

ETC/ACC Technical paper 2007/ 1 page 38 o f 53
3.7. Ozone (O3)
Sources & effects
0 - 60 ug/m3
60 - 80 ug/m3
80 - 100 ug/m3
> 100 ug/m3
ozoneannual mean daily maxima
2005all stations, data coverage > 75%
Ozone is not directly emitted into the atmosphere but formed by photochemical reactions of volatile organic compounds (VOC) and nitrogen oxides. Sunlight and high temperature favours ozone formation. NOx play a complex role in the ozone chemistry: close to NOx sources it will deplete ozone due to the scavenging reaction between the freshly emitted nitrogen monoxide and ozone. Farther away from sources, NOx is indispensable in the regeneration of the OH-radical, the key species in the oxidation chain process. Evaporation losses are the main source of VOC emissions. Traffic, solvent usage and refineries are the largest anthropogenic sources. Short-term studies show that O3 has adverse health effects, especially in the summer, on pulmonary function, lung inflammation, lung permeability, respiratory symptoms, increased medication usage, morbidity and mortality. Long-term effects are less clear but evidence for the chronic effects of ozone is supported by human and experimental information. Epidemiological evidence of chronic effects is less conclusive, owing mostly to an absence of studies designed specifically to address this question and inherent limitations in characterizing exposure. The studies with the most efficient approaches and more individual assignment of exposure provide new evidence for chronic effects of ozone on small airway function and possibly on asthma. Status At 1808 stations the ozone daily values fulfil the data coverage criteria of 75%. In the third daughter directive the EU has set target values for the protection of human health (the daily maximum of the running 8-hour mean values may not exceed 120 μg/m3 on more than 25 days per year) and for vegetation (18000 (μg/m3).h as AOT40 value). The health related target is widely exceeded on more then half of the rural background stations. In urban area about 30% of the station is not in compliance with the target. The AOT40 value averaged over all rural background stations is just above the target. On half of the rural station the target is exceeded, on average concentrations are 50% above target. Even at one third of the urban stations and one fifth of the traffic station the AOT40-target is exceeded. The maximum observed AOT40 levels are more than three times

ETC/ACC Technical paper 2007/1 page 39 of 53 higher than the target value: 89000, 54800 and 54800 (µg/m3).h at rural, urban and traffic stations, respectively.
Trends in ozone levels The emissions of ozone precursors, weighted according to their contribution in ozone formation (de Leeuw 2002) have been reduced over the period 1990-2004 with about 40% in the EU25 Member States; the 32% NOx reduction is less than the 44% reduction in VOC emissions. Over the periods 1996-2004 and 2001-2004 the decrease in total emissions is 24% and 8% respectively. The development of the ozone concentrations during the last decade are not in line with these emission changes. Neglecting the high concentrations in 2003, caused by the extremely favourable conditions for
ozone formation in that year in most of Europe, the rural data show no trend at all while the traffic and urban stations suggest some increasing tendency. This increase can be explained by less ozone depletion due to decreasing NOx emissions. The constant background levels are the net result of a number of possible processes: the increase in hemispheric background
Changes in ozone air quality (based on annual mean concentrations) over the period 1996-2005 (based on 629 stations) and over 2001-2005 (based on 995 stations). The maps show the geographical coverage of the station.

ETC/ACC Technical paper 2007/ 1 page 40 o f 53 concentrations, less ozone deposition during the (more frequent) dry periods during the summer, increased ozone formation due to higher temperatures, less ozone formation due to emissions reduction. Climatologic changes in the large-scale circulation patterns over Europe might also play a role.
3.8. Further reading.
Air Quality Framework Directive and related Daughter Directive:
See EU (1996), EU (1999), EU (2000), EU (2002) Health effects of air pollution: See WHO (2006) EEA and ETC/ACC publications on air pollution: See Larssen S. et al. (2007) See EEA (2006)

ETC/ACC Technical paper 2007/1 page 41 of 53
4. CONCLUSIONS The EoI2006 data cycle was very successful. A total of 33 countries, including 26 EU Member States, have provided air quality data for 2005. Measurement data from 3852 stations have been delivered, about 300 stations more than in the EoI2005. The spatial station coverage of PM2.5 has been increased but is still insufficient. PM2.5 measurement data have been reported from only 269 stations. There is also a difference between the number of stations for which NO2 has been reported and the number of stations for which NO (or NOx) has been reported. This is surprising as most automated monitors measure both pollutants simultaneously. 11 countries have reported one or more VOCs except Benzene (ozone precursors 3DD) and Heavy Metals except Lead (4DD) and 4 countries have reported PAHs (4DD). Nearly all countries have delivered the data in time before 1st of October 2005. ETC/ACC has produced QA/QC country feedback reports. The response on these reports was very good. The quality of the meta information, measurement data but also the derived information (statistics, exceedances) in AIRBASE has been improved considerably. Concerning the air quality state for the selected pollutants we can conclude the following. Pollution by SO2 shows a decreasing trend both in emissions as well as in ambient concentrations. Exceedances of the health related limit values are observed at a limited number of stations only. The emission of NOx decreases but concentrations in urban and traffic areas are decreasing at a much lower rate. Compliance with the NO2 limit value for annual mean values is a serious problem in many urban and traffic areas. During the last five years emissions of primary PM10 and its precursor gasses are reducing slowly but in the observed concentrations no clear European-wide trend is seen. The PM10-limit value for daily values is exceeded frequently at urban and traffic stations. The ambient levels of CO are below the limit value; some incidental exceedances are observed but in these cases measuring artifacts can not be excluded. The benzene concentrations are in compliance with the limit values except for a limited number of traffic hotspot situations. Ozone precursor emissions are decreasing; the ozone concentrations, however, do not show a decreasing trend. On the contrary, the health related and the annual mean values show an increasing tendency. Both the health and the ecosystem related target values are exceeded frequently and widely over Europe.
ETC/ACC Technical paper 2007/ 1 page 42 o f 53
5. REFERENCES
Buijsman E. and Leeuw F.A.A.M. de (2004): Correction factors and PM10 measurements in AIRBASE, EEA-ETC/ACC technical paper. See: http://air-climate.eionet.eu.int/docs/meetings/041122_9th_EIONET_AQ_WS/05d_PM10_corr_factors_in_AirBase_Nov2004-TempDraft.pdf.
EEA (2001): Air quality in larger cities in the European Union - A contribution to the Auto-Oil II programme. EEA Topic Report 3/2001. See http://air-climate.eionet.europa.eu/reports/EEA_Topic_Rep_3_2001_Auto_Oil_II
EEA (2006): Annual European Community LRTAP Convention Emission Inventory 1990-2004. Submission to EMEP through the Executive Secretary of the UNECE. EEA Technical Report 2006/8. See http://air-climate.eionet.europa.eu/reports/EEA_EU_CLRTAP_em_inv_EEA_TechRep_8_2006
EMEP (2004): EMEP Monitoring Strategy and Measurement Programma 2004-2009. As amended and adopted by the EMEP Steering Body at its twenty-eighth session. September 2004. See http://www.nilu.no/projects/ccc/reports/Monitoring%20Strategy_full.pdf
EU (1996): Council Directive 96/62/EC of 27 September 1996 on ambient air quality assessment and management. Official Journal L 296, 21/11/1996, pp. 55-63. See http://ec.europa.eu/environment/air/ambient.htm
EU (1997): Council Decision of 27 January 1997 establishing a reciprocal exchange of information and data from networks and individual stations measuring ambient air pollution within the Member States (Exchange of Information (97/101/EC)). Official Journal L 035, 05/02/1997, pp. 14-22. See http://ec.europa.eu/environment/air/ambient.htm
EU (1999): Council Directive 1999/30/EC of 22 April 1999 relating to limit values for sulphur dioxide, nitrogen dioxide and oxides of nitrogen, particulate matter and lead in ambient air (first Daughter Directive (99/30/EC)). Official Journal L 163, 29/06/1999, pp. 41–60. See http://ec.europa.eu/environment/air/ambient.htm
EU (2000): Directive 2000/69/EC of the European Parliament and of the Council of 16 November 2000 relating to limit values for benzene and carbon monoxide in ambient air (second Daughter Directive (2000/69/EC)). Official Journal L 313, 13/12/2000, pp. 12–21. See http://ec.europa.eu/environment/air/ambient.htm
EU (2001a): Commission Decision of 17 October 2001 amending the Annexes to Council Decision 97/101/EC establishing a reciprocal exchange of information and data from networks and individual stations measuring ambient air pollution within the Member States (2001/752/EC). Official Journal L 282, 26/10/2001, pp. 69–76. See http://ec.europa.eu/environment/air/ambient.htm
EU (2001b): Corrigendum to Commission Decision 2001/752/EC of 17 October 2001 amending the Annexes to Council Decision 97/101/EC establishing a reciprocal exchange of information and data from networks and individual stations measuring ambient air pollution within the Member States. Official Journal L 334, 18/12/2001, pp. 35. See http://ec.europa.eu/environment/air/ambient.htm
EU (2002): Directive 2002/3/EC of the European Parliament and the Council of 12 February 2002 relating to ozone in ambient air (third Daughter Directive (2002/3/EC)). Official Journal L 67, 9/03/2002, pp. 14–30. See http://ec.europa.eu/environment/air/ambient.htm

ETC/ACC Technical paper 2007/1 page 43 of 53 EU (2004): Directive 2004/107/EC of the European Parliament and the Council of 15
December 2004 relating to arsenic, cadmium, mercury, nickel and polycyclic aromatic hydrocarbons in ambient air (fourth Daughter Directive (2004/107/EC)). Official Journal L 23, 26/01/2005, pp. 3–16. See http://ec.europa.eu/environment/air/ambient.htm
EU (2005): Proposal for a Directive of the European Parliament and the Council on ambient air quality and cleaner air for Europe. COM(2005) 447 final of 21 September 2005. http://eur-lex.europa.eu/LexUriServ/site/en/com/2005/com2005_0447en01.pdf
Garber W, Colosio J, Grittner S, Larssen S, Rasse D, Schneider J, Houssiau M. (2001): Guidance on the Annexes to Decision 97/101/EC on Exchange of Information as revised by Decision 2002/752/EC. European Commission, DG Environment, Brussels. http://ec.europa.eu/environment/air/pdf/guidancetoannexes97101ec.pdf
Larssen, S. et al. (2007): Air Pollution in Europe – 1990-2004. EEA report, in preparation
Larssen S. Leeuw F. A.A.M. de (2007): PM10 and PM2.5 concentrations in Europe as assessed from monitoring data reported to AirBase. In: EMEP Particulate Matter Assessment Report, EMEP/CCC report-8/2007, NILU, Kjeller, Norway.
Leeuw F.A.A.M. de (2002): A set of emission indicators for long-range transboundary air pollution. Environmental Science and Policy 5, 135-145.
Leeuw F.A.A.M. de (2005): PM10 measurement methods and correction factors in AirBase 2004 status report. EEA-ETC/ACC Technical Paper 2005/6. See : http://air-climate.eionet.europa.eu/reports/ETCACC_TechnPaper_2005_6_PM10_CorrFactors2004
Mol, W.J.A., Leeuw, F.A.A.M. de (2005a): AirBase: A Valuable Tool in Air Quality Assessments in: The Proceedings of the 5th International Conference on Urban Air Quality, Valencia Spain 29-31 March 2005, Editors R.S. Sokhi, M.M. Millán and N. Moussiopoulos.
Mol, W.J.A., Hooydonk P.R. van (2005b): QA/QC checks on air quality data in AirBase and on the EoI2004 data – Procedures and results. ETC/ACC Technical Paper 2005/3. Available at http://air-climate.eionet.europa.eu/reports/ETCACC_TechnPaper_2005_3_QAQC_feedback_EoI2004
Mol, W.J.A., Hooydonk P.R. van (2005c): European exchange of air quality monitoring meta information in 2003. ETC/ACC Technical Paper 2005/2. Available at http://air-climate.eionet.europa.eu/reports/ETCACC_TechnPaper_2005_2_EoI_AQ_meta_info2003
WHO (2006): Air quality guidelines for particular matter, ozone, nitrogen dioxide and sulphur dioxide – Global update 2005. WHO Regional Office for Europe, Copenhagen, Denmark. http://www.euro.who.int/InformationSources/Publications/Catalogue/20070323_1
Air quality in larger cities in the European Union - A contribution to the Auto-Oil II programme EEA Topic report No 3/2001

ETC/ACC Technical paper 2007/ 1 page 44 o f 53

ETC/ACC Technical paper 2007/1 page 45 of 53
Annex A Exchange of Information requirements
The Member States of the European Union should, according to Annex II of the Council Decision on the reciprocal exchange of information, report certain types of meta information (EU, 2001a). Part of the information, as mentioned in Annex II, is mandatory (Table A1). The other information should be delivered ‘to the extent possible’ and ‘as much as feasible’ (Table A2).
Table A.1 Overview of mandatory meta information to be delivered under the Exchange of Information (EoI)
Item a Description
I.1. Name of the network
I.4.1. Name of the body responsible for network management
I.4.2. Name of person responsible
I.4.3. Address
I.4.4. Telephone and fax numbers
I.5. Time reference basis
II.1.1. Name of the station
II.1.4. Station code given under the present decision and to be provided by the Commission
II.1.8. Geographical co-ordinates
II.1.10. Pollutants measured
II.1.11. Meteorological parameters measured
II.2.1. Type of area
(a) Numbers according to Annex II of the EoI (EU, 2001a)

ETC/ACC Technical paper 2007/ 1 page 46 o f 53
Table A.2. Overview of non-mandatory meta information to be delivered under the Exchange of Information (EoI)
Item a Description
I.2. Abbreviation (of the network)
I.3. Type of networks
I.4.5. E-mail (of the body responsible for the network)
I.4.6. Website address
II.1.2. Name of the town/city of location (of the station)
II.1.3. National and/or local reference number or code
II.1.5. Name of technical body responsible for the station
II.1.6. Bodies or programmes to which data are reported
II.1.7. Monitoring objectives
II.1.9. NUTS level IV
II.1.12 Other relevant information
II.2.2. Type of station in relation to dominant emission sources
II.2.3. Additional information about the station
III.1.1. Name (of measurement equipment)
III.1.2. Analytical principle or measurement method
III.2.1. Location of sampling point
III.2.2 Height of sampling point
III.2.3 Result-integrating time
III.2.4 Sampling time
(a) Numbers according to the Annex II of the Exchange of Information (EU, 2001a). Table A.3 Overview of mandatory pollutants to be delivered under the Exchange of Information (EoI)
EoI nr. Formula Name of pollutant Units of measurement
Average over
1 SO2 Sulphur dioxide µg/m3 1 h
2 NO2 Nitrogen dioxide µg/m3 1 h
3 PM10 Particulate matter < 10 µm µg/m3 24 h
4 PM2.5 Particulate matter < 2.5 µm µg/m3 24 h
5 SPM Total suspended particulates
µg/m3 24 h
6 Pb Lead µg/m3 24 h
7 O3 Ozone µg/m3 1 h
8 C6H6 Benzene µg/m3 24 h
9 CO Carbon monoxide mg/m3 1 h
10 Cd Cadmium ng/m3 24 h
11 As Arsenic ng/m3 24 h
12 Ni Nickel ng/m3 24 h
13 Hg Mercury ng/m3 24 h
14 BS Black smoke µg/m3 24 h
15 NOX Nitrogen oxides µg NO2/m3 1 h

ETC/ACC Technical paper 2007/1 page 47 of 53
Table A.4 Overview of other pollutants to be delivered under the Exchange of Information (EoI) if available
EoI nr. Formula Name of pollutant Units of
measurement Average over
16 C2H6 Ethane µg/m3 24 h 17 H2C=CH2 Ethene (Ethylene) µg/m3 24 h 18 HC=CH Ethyne (Acetylene) µg/m3 24 h 19 H3C-CH2-CH3 Propane µg/m3 24 h 20 CH2=CH-CH3 Propene µg/m3 24 h 21 H3C-CH2-CH2-CH3 n-Butane µg/m3 24 h 22 H3C-CH(CH3)2 i-Butane µg/m3 24 h 23 H2C=CH-CH2-CH3 1-Butene µg/m3 24 h 24 H3C-CH=CH-CH3 trans-2-Butene µg/m3 24 h 25 H3C-CH=CH-CH3 cis-2-Butene µg/m3 24 h 26 CH2=CH-CH=CH2 1.3 Butadiene µg/m3 24 h 27 H3C-(CH2)3-CH3 n-Pentane µg/m3 24 h 28 H3C-CH2-CH(CH3)2 i-Pentane µg/m3 24 h 29 H2C=CH-CH2-CH2-CH3 1-Pentene µg/m3 24 h 30 H3C-HC=CH-CH2-CH3 2-Pentenes µg/m3 24 h 31 CH2=CH-C(CH3)=CH2 Isoprene µg/m3 24 h 32 C36H14 n-Hexane µg/m3 24 h
33 (CH3)2-CH-CH2-CH2-CH3
i-Hexane µg/m3 24 h
34 C7H16 n-Heptane µg/m3 24 h 35 C8H18 n-Octane µg/m3 24 h
36 (CH3)3-C-CH2-CH-(CH3)2
i-Octane µg/m3 24 h
37 C6H5-CH3 Toluene µg/m3 24 h 38 C6H5-C2H5 Ethyl benzene µg/m3 24 h 39 m,p-C6H4(CH3)2 m,p-Xylene µg/m3 24 h 40 o-C6H4-(CH3)2 o-Xylene µg/m3 24 h 41 C6H3-(CH3)3 1,2,4-Trimethylbenzene µg/m3 24 h 42 C6H3(CH3)3 1,2,3-Trimethylbenzene µg/m3 24 h 43 C6H3(CH3)3 1,3,5-Trimethylbenzene µg/m3 24 h 44 HCHO Formaldehyde µg/m3 1 h
45 THC (NM) Total non-methane hydrocarbons µg C/m3 24 h
46 SA Strong acidity µg SO2/m3 24 h 47 PM1 Particulate matter < 1 µm µg/m3 24 h 48 CH4 Methane µg/m3 24 h 49 Cr Chromium ng/m3 24 h 50 Mn Manganese ng/m3 24 h 51 H2S Hydrogen sulphide µg/m3 24 h 52 CS2 Carbon disulphide µg/m3 1 h 53 C6H5-CH=CH2 Styrene µg/m3 24 h 54 CH2=CH-CN Acrylonitrile µg/m3 24 h 55 CHCl=CCl2 Trichloroethylene µg/m3 24 h 56 C2Cl4 Tetrachloroethylene µg/m3 24 h 57 CH2Cl2 Dichloromethane µg/m3 24 h 58 BaP Benzo(a)pyrene µg/m3 24 h 59 VC Vinyl chloride µg/m3 24 h 60 PAN Peroxyacetyl nitrate µg/m3 1 h 61 NH3 Ammonia µg/m3 24 h 62 N-DEP Wet nitrogen deposition mg N/(m2*month) 1 month 63 S-DEP Wet sulphur deposition mg S/(m2*month) 1 month

ETC/ACC Technical paper 2007/ 1 page 48 o f 53
ETC/ACC Technical paper 2007/1 page 49 of 53
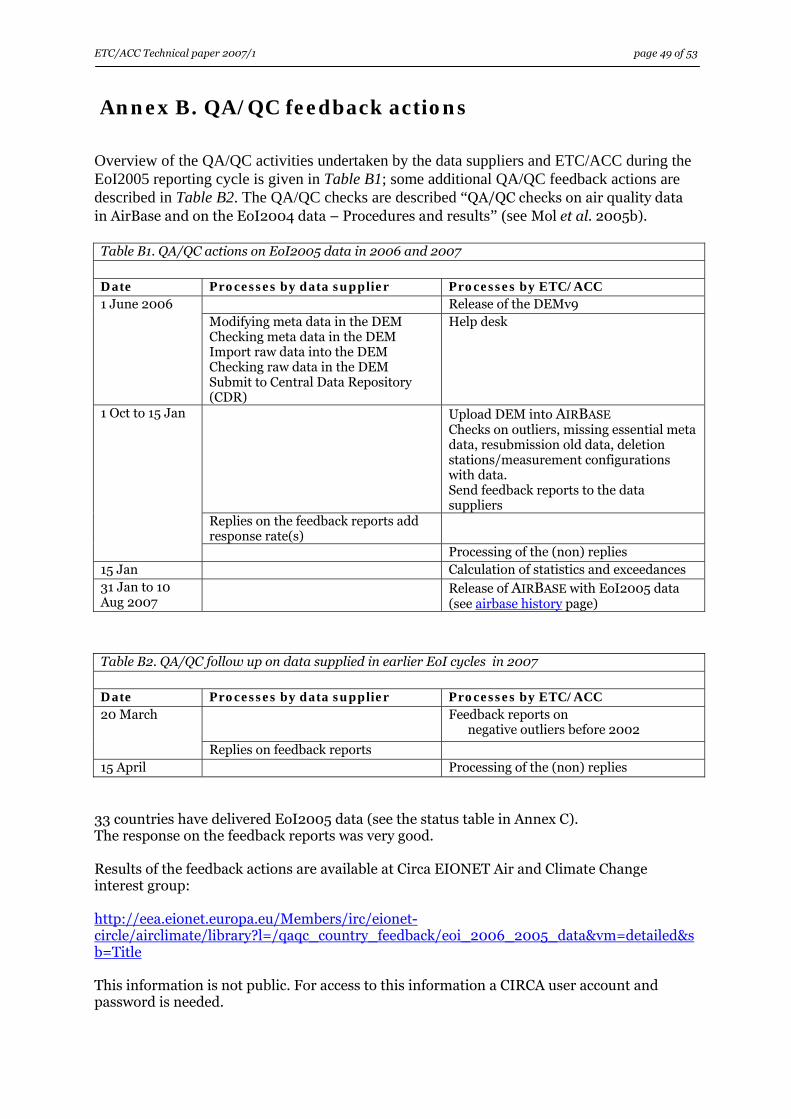
Annex B. QA/QC feedback actions
Overview of the QA/QC activities undertaken by the data suppliers and ETC/ACC during the EoI2005 reporting cycle is given in Table B1; some additional QA/QC feedback actions are described in Table B2. The QA/QC checks are described “QA/QC checks on air quality data in AirBase and on the EoI2004 data – Procedures and results” (see Mol et al. 2005b). Table B1. QA/QC actions on EoI2005 data in 2006 and 2007 Date Processes by data supplier Processes by ETC/ACC
Release of the DEMv9 1 June 2006 Modifying meta data in the DEM Checking meta data in the DEM Import raw data into the DEM Checking raw data in the DEM Submit to Central Data Repository (CDR)
Help desk
Upload DEM into AIRBASE Checks on outliers, missing essential meta data, resubmission old data, deletion stations/measurement configurations with data. Send feedback reports to the data suppliers
Replies on the feedback reports add response rate(s)
1 Oct to 15 Jan
Processing of the (non) replies 15 Jan Calculation of statistics and exceedances 31 Jan to 10 Aug 2007
Release of AIRBASE with EoI2005 data (see airbase history page)
Table B2. QA/QC follow up on data supplied in earlier EoI cycles in 2007 Date Processes by data supplier Processes by ETC/ACC
Feedback reports on negative outliers before 2002
20 March
Replies on feedback reports 15 April Processing of the (non) replies
33 countries have delivered EoI2005 data (see the status table in Annex C). The response on the feedback reports was very good. Results of the feedback actions are available at Circa EIONET Air and Climate Change interest group: http://eea.eionet.europa.eu/Members/irc/eionet-circle/airclimate/library?l=/qaqc_country_feedback/eoi_2006_2005_data&vm=detailed&sb=Title This information is not public. For access to this information a CIRCA user account and password is needed.

ETC/ACC Technical paper 2007/ 1 page 50 o f 53
Table B3. Status overview of QA/QC feedback actions on the EoI-2005 reporting cycle Status Country feedback
AL AlbaniaAT AustriaBA Bosnia-HerzegovinaBE BelgiumBG BulgariaCH SwitzerlandCS Serbia and MontenegroCY CyprusCZ Czech RepublicDE GermanyDK DenmarkEE EstoniaES SpainFI FinlandFR FranceGB United KingdomGR GreeceHR CroatiaHU HungaryIE IrelandIS IcelandIT ItalyLI LiechtensteinLT LithuaniaLU LuxembourgLV LatviaMK FYR of MacedoniaMT MaltaNL NetherlandsNO NorwayPL PolandPT PortugalRO RomaniaSE SwedenSI SloveniaSK Slovak RepublicTR Turkey
outliers (extreme/
suspicious)
Country missing data
reply received
resubmitted data
missing essential
meta inform.
deletion stations/
meas.conf. with data
ETC/ACC Technical paper 2007/1 page 51 of 53
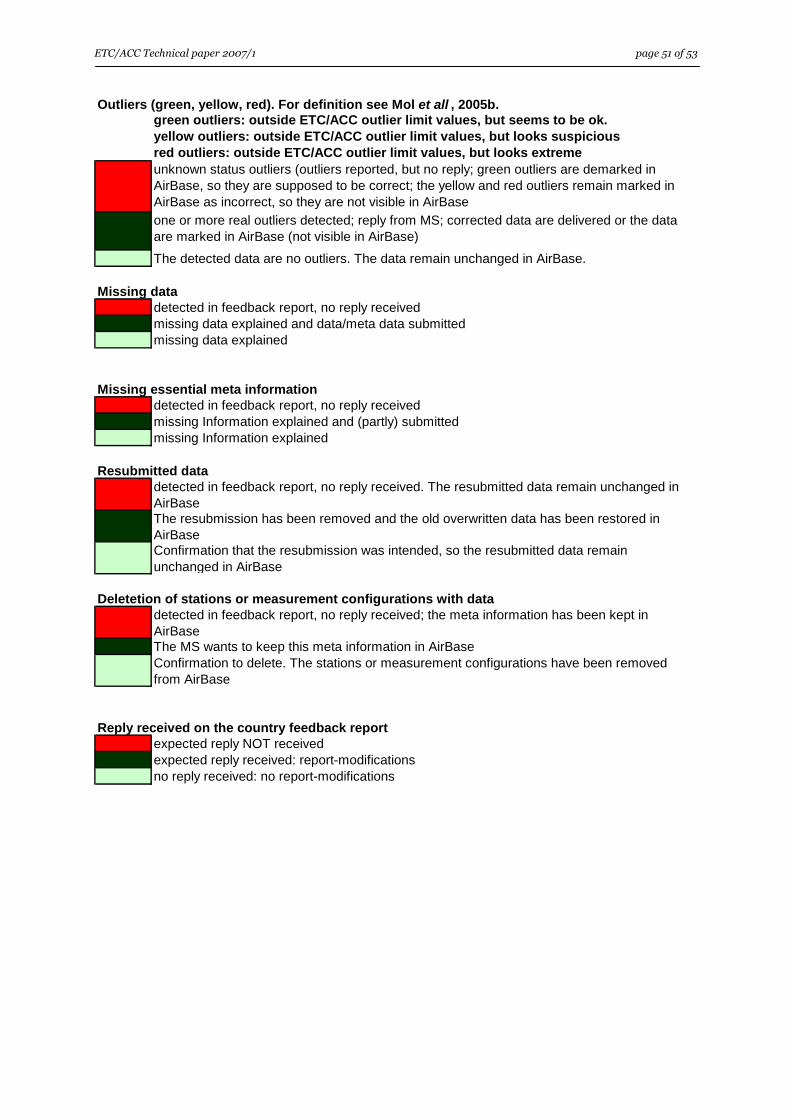
green outliers: outside ETC/ACC outlier limit values, but seems to be ok.yellow outliers: outside ETC/ACC outlier limit values, but looks suspiciousred outliers: outside ETC/ACC outlier limit values, but looks extreme
Reply received on the country feedback reportexpected reply NOT receivedexpected reply received: report-modificationsno reply received: no report-modifications
Deletetion of stations or measurement configurations with datadetected in feedback report, no reply received; the meta information has been kept in AirBaseThe MS wants to keep this meta information in AirBaseConfirmation to delete. The stations or measurement configurations have been removed from AirBase
Resubmitted datadetected in feedback report, no reply received. The resubmitted data remain unchanged in AirBaseThe resubmission has been removed and the old overwritten data has been restored in AirBaseConfirmation that the resubmission was intended, so the resubmitted data remain unchanged in AirBase
missing Information explained
Missing data
Missing essential meta information
Outliers (green, yellow, red). For definition see Mol et all , 2005b.
missing data explained and data/meta data submittedmissing data explained
detected in feedback report, no reply receivedmissing Information explained and (partly) submitted
unknown status outliers (outliers reported, but no reply; green outliers are demarked in AirBase, so they are supposed to be correct; the yellow and red outliers remain marked in AirBase as incorrect, so they are not visible in AirBaseone or more real outliers detected; reply from MS; corrected data are delivered or the data are marked in AirBase (not visible in AirBase)
The detected data are no outliers. The data remain unchanged in AirBase.
detected in feedback report, no reply received

ETC/ACC Technical paper 2007/ 1 page 52 o f 53

ETC/ACC Technical paper 2007/1 page 53 of 53
Annex C Status overview of the EoI 2005 EoI Reporting
ETC/ACC provides a regularly updated progress report for the annual EoI data cycle on: http://air-climate.eionet.europa.eu/country_tools/aq/eoi_to_airbase_status/index_html
Status since: 6-2-2007
Country (#)
Date EoI data
arrived at ETC/ACC
Initial upload to
AirBase for QA/QC
checking
Date QA/QC
report sent to country
Date country reply to QA/QC report
End date processing
data and statistics into
AirBase
Remark
Alpha-2 Short name (***)AL Albania 27-02-06 yearly statisticsAT Austria * 14-09-06 22-09-06 04-10-06 06-10-06 31-01-07BA Bosnia-Herzegovina 29-09-06 18-10-06 24-10-06 24-10-06 31-01-07BE Belgium * 20-09-06 13-10-06 16-10-06 17-11-06 31-01-07BG Bulgaria * 28-09-06 17-10-06 24-10-06 20-11-06 31-01-07CH Switzerland ** 10-10-06 25-10-06 02-11-06 01-02-07 31-01-07CS Serbia & Montenegro 27-09-06 17-10-06 24-10-06 07-12-06 31-01-07CY Cyprus * 09-10-06 25-10-06 02-11-06 14-11-06 31-01-07CZ Czech Republic * 26-09-06 13-10-06 16-10-06 14-11-06 31-01-07DE Germany * 28-09-06 30-11-06 07-12-06 11-12-06 31-01-07DK Denmark * 29-09-06 18-10-06 24-10-06 20-12-06 31-01-07 EE Estonia * 21-09-06 13-10-06 16-10-06 01-12-06 31-01-07ES Spain * 29-09-06 20-11-06 22-11-06 18-01-07 31-01-07FI Finland * 13-10-06 25-10-06 02-11-06 01-12-06 31-01-07FR France * 06-03-06 20-10-06 24-10-06 15-12-06 31-01-07GB United Kingdom * 28-09-06 18-10-06 07-12-06 12-01-07 31-01-07GR Greece * 22-09-06 13-10-06 16-10-06 31-10-06 31-01-07HR Croatia HU Hungary * 28-09-06 17-10-06 24-10-06 27-11-06 31-01-07IE Ireland * 27-09-06 17-10-06 24-10-06 20-11-06 31-01-07IS Iceland ** 01-11-06 17-11-06 22-11-06 16-01-07 31-01-07IT Italy * 23-10-06 01-12-06 06-12-06 10-01-07 31-01-07 meta info + Sabe: februaryLI Liechtenstein ** 15-09-06 13-10-06 16-10-06 31-01-07 no answer expectedLT Lithuania * 26-09-06 13-10-06 16-10-06 30-11-06 31-01-07LU Luxembourg *LV Latvia * 18-09-06 13-10-06 16-10-06 14-11-06 31-01-07MK FYR of Macedonia 29-09-06 18-10-06 24-10-06 08-11-06 31-01-07MT Malta * 28-09-06 17-10-06 24-10-06 05-12-06 31-01-07NL Netherlands * 29-09-06 18-10-06 24-10-06 15-01-07 31-01-07NO Norway ** 28-09-06 17-10-06 24-10-06 11-12-06 31-01-07PL Poland * 28-09-06 17-10-06 24-10-06 27-11-06 31-01-07PT Portugal * 02-10-06 23-10-06 24-10-06 25-11-06 31-01-07RO Romania * 12-10-06 25-10-06 02-11-06 17-01-07 31-01-07SE Sweden * 29-09-06 18-10-06 24-10-06 09-11-06 31-01-07SI Slovenia * 29-09-06 18-10-06 24-10-06 24-11-06 31-01-07SK Slovak Republic * 29-09-06 06-11-06 07-11-06 05-12-06 31-01-07TR Turkey **
* EU 27 country**
(***)(#)
Overview 2006 EoI Reporting (Air Quality data of 2005)
Non EU27 country, EEA 32 countryData not yet available via website (AirView)ISO3166-1 codes: Alpha-2 element and Short Name