European Environmental report - Honda European Environmental...6 EUROPEAN ENVIRONMENTAL REPORT 2013...
41
EUROPEAN ENVIRONMENTAL REPORT 2013 European Environmental Report 2013
Transcript of European Environmental report - Honda European Environmental...6 EUROPEAN ENVIRONMENTAL REPORT 2013...

EuropEan EnvironmEntal rEport 2013
European Environmental report
2013

EuropEan EnvironmEntal rEport 2013 EuropEan EnvironmEntal rEport 201332
Reducing and Reporting Environmental Impacts in 6 Regions WorldwideDriven by our philosophy of building products close to the customer, Honda has manufacturing operations in 6 regions worldwide. In fi scal 2013, we delivered 26 million products to customers around the world. Always conscious of the environmental impact of our operations, we are working hard to take environmental responsibility to ever-higher levels around the world. In 2010, we established a new set of CO2 emission reduction targets for our products, aiming by 2020 to provide “good products to customers with speed, affordability, and low CO2 emissions.” As we seek to realize the Honda Environmental and Safety Vision -to realize the joy and freedom of mobility and a sustainable society where people can enjoy life - based on these targets, we are accelerating global efforts to address climate change, energy issues, and other environmental challenges. And amidst increasing global pressure on companies to disclose their environmental impacts, we are actively working to disclose the environmental performance and initiatives of each region, the highlights of which are compiled yearly in regional environmental reports.
Automobiles MotorcyclesPower productsand otherAnnual unit sales by region (FY2013), and regional environmental reports
Europe/Middle East/Africa China
North America
South America
Asia/Oceania
1,656,000
280,000
2,614,000
*Report covers from fi scal 2012 are shown for all regions except Japan
Latest data as of March 31, 2013
543,000
11,962,000
1,886,000
Due out September 2013Due out October 2013
Due out August 2013Due out August 2013
Due out September 2013
Annual unit sales
Annual unit sales
Annual unit sales
Annual unit sales
Annual unit sales
Annual unit salesEnvironmental report
Environmental report
Environmental report
Environmental report
Environmental report
Environmental report
*See below for more information on Japan business
164,000
1,589,000
143,000
248,000
336,000
1,122,000
Japan
716,000
218,000
308,000
596,000
1,298,000Power products: included in fi gure for Asia/Oceania
Company name: Honda Motor Co., Ltd.
Head offi ce: 2-1-1 Minami Aoyama, Minato-ku, Tokyo 107–8556, Japa
Established: September 24, 1948
President & CEO: Takanobu Ito
Capital: ¥86.067 billion (as of March 31, 2013)
Sales: Consolidated: ¥9.878 trillion (Results of FY2013)
Unconsolidated: ¥3.244 trillion
Consolidated subsidiaries: 369 (as of March 31, 2013)
Major products: <Automobiles> Standard-sized vehicles, compact vehicles,
and mini-vehicles
<Motorcycles> Scooters, mini-bikes, motorcycles, and ATVs
<Power products> Power product engines, lawnmowers,
marine outboard engines,
CIG thin fi lm solar cells,
and household gas engine cogeneration units
Information on Honda in Japan
Company overview
0
5,000
10,000
15,000(¥ billion)
(¥ billion) (¥ billion)
2009 2010 2011 2012 2013 (FY)
2009 2010 2011 2012 2013 (FY)
2009 2010 2011 2012 2013 (FY) 2009 2010 2011 2012 2013 (FY)-2,000
200
600
0
800
400
-100
500
400
0
600
100
200
300
0
50,000
100,000
200,000
150,000
Automobiles 77.9%
Financial services 5.7%
Power products and other 2.9%
Motorcycles 13.5%
Japan30.9%
Asia 18.3%
North America 38.6%
Other 7.1%
Europe5.1%
■ Unconsolidated ■ Consolidated
■ Unconsolidated ■ Consolidated
■ Unconsolidated ■ Consolidated ■ Unconsolidated ■ Consolidated
Net sales
0
5,000
10,000
15,000(¥ billion)
(¥ billion) (¥ billion)
2009 2010 2011 2012 2013 (FY)
2009 2010 2011 2012 2013 (FY)
2009 2010 2011 2012 2013 (FY) 2009 2010 2011 2012 2013 (FY)-2,000
200
600
0
800
400
-100
500
400
0
600
100
200
300
0
50,000
100,000
200,000
150,000
Automobiles 77.9%
Financial services 5.7%
Power products and other 2.9%
Motorcycles 13.5%
Japan30.9%
Asia 18.3%
North America 38.6%
Other 7.1%
Europe5.1%
■ Unconsolidated ■ Consolidated
■ Unconsolidated ■ Consolidated
■ Unconsolidated ■ Consolidated ■ Unconsolidated ■ Consolidated
Operating income
0
5,000
10,000
15,000(¥ billion)
(¥ billion) (¥ billion)
2009 2010 2011 2012 2013 (FY)
2009 2010 2011 2012 2013 (FY)
2009 2010 2011 2012 2013 (FY) 2009 2010 2011 2012 2013 (FY)-2,000
200
600
0
800
400
-100
500
400
0
600
100
200
300
0
50,000
100,000
200,000
150,000
Automobiles 77.9%
Financial services 5.7%
Power products and other 2.9%
Motorcycles 13.5%
Japan30.9%
Asia 18.3%
North America 38.6%
Other 7.1%
Europe5.1%
■ Unconsolidated ■ Consolidated
■ Unconsolidated ■ Consolidated
■ Unconsolidated ■ Consolidated ■ Unconsolidated ■ Consolidated
Net income
Financial information
0
5,000
10,000
15,000(¥ billion)
(¥ billion) (¥ billion)
2009 2010 2011 2012 2013 (FY)
2009 2010 2011 2012 2013 (FY)
2009 2010 2011 2012 2013 (FY) 2009 2010 2011 2012 2013 (FY)-2,000
200
600
0
800
400
-100
500
400
0
600
100
200
300
0
50,000
100,000
200,000
150,000
Automobiles 77.9%
Financial services 5.7%
Power products and other 2.9%
Motorcycles 13.5%
Japan30.9%
Asia 18.3%
North America 38.6%
Other 7.1%
Europe5.1%
■ Unconsolidated ■ Consolidated
■ Unconsolidated ■ Consolidated
■ Unconsolidated ■ Consolidated ■ Unconsolidated ■ Consolidated
Net sales by operational area(consolidated: FY2013)
0
5,000
10,000
15,000(¥ billion)
(¥ billion) (¥ billion)
2009 2010 2011 2012 2013 (FY)
2009 2010 2011 2012 2013 (FY)
2009 2010 2011 2012 2013 (FY) 2009 2010 2011 2012 2013 (FY)-2,000
200
600
0
800
400
-100
500
400
0
600
100
200
300
0
50,000
100,000
200,000
150,000
Automobiles 77.9%
Financial services 5.7%
Power products and other 2.9%
Motorcycles 13.5%
Japan30.9%
Asia 18.3%
North America 38.6%
Other 7.1%
Europe5.1%
■ Unconsolidated ■ Consolidated
■ Unconsolidated ■ Consolidated
■ Unconsolidated ■ Consolidated ■ Unconsolidated ■ Consolidated
Net sales by region(consolidated: FY2013)
0
5,000
10,000
15,000(¥ billion)
(¥ billion) (¥ billion)
2009 2010 2011 2012 2013 (FY)
2009 2010 2011 2012 2013 (FY)
2009 2010 2011 2012 2013 (FY) 2009 2010 2011 2012 2013 (FY)-2,000
200
600
0
800
400
-100
500
400
0
600
100
200
300
0
50,000
100,000
200,000
150,000
Automobiles 77.9%
Financial services 5.7%
Power products and other 2.9%
Motorcycles 13.5%
Japan30.9%
Asia 18.3%
North America 38.6%
Other 7.1%
Europe5.1%
■ Unconsolidated ■ Consolidated
■ Unconsolidated ■ Consolidated
■ Unconsolidated ■ Consolidated ■ Unconsolidated ■ Consolidated
Number of associates
*See Honda Annual Report (print/PDF) for detailed fi nancial information.
EuropEan EnvironmEntal rEport 2013 EuropEan EnvironmEntal rEport 201354
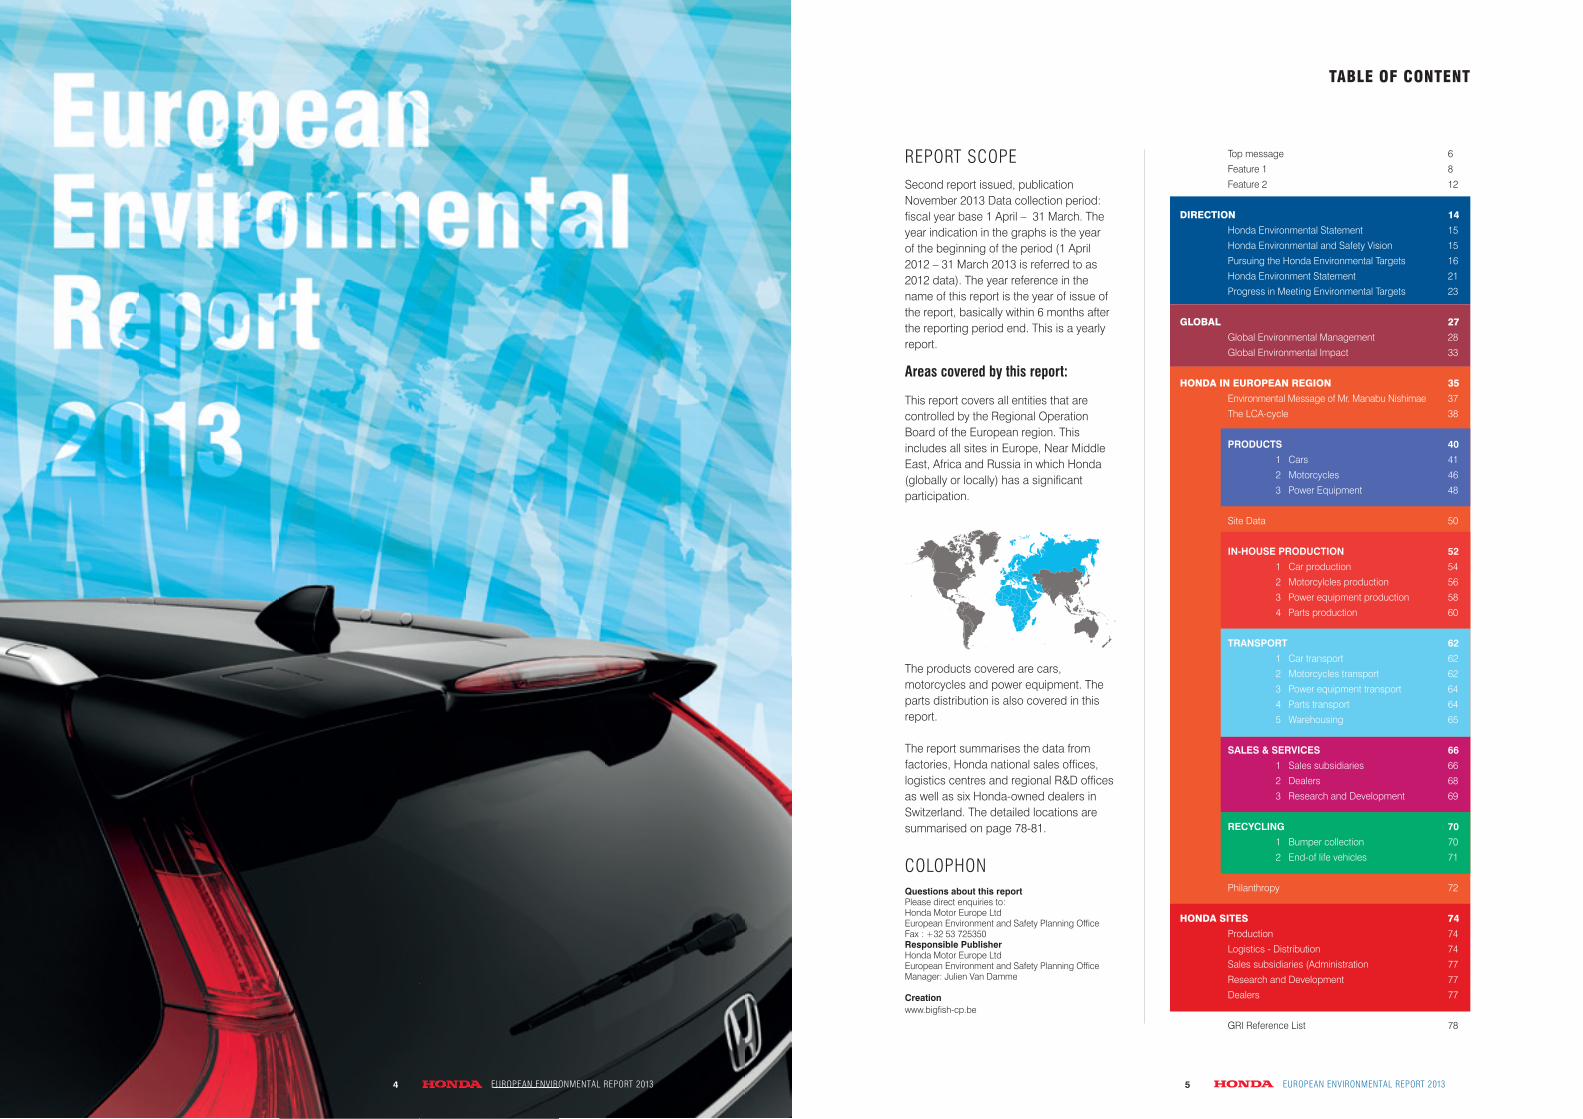
This report covers all entities that are controlled by the Regional Operation Board of the European region. This includes all sites in Europe, Near Middle East, Africa and Russia in which Honda (globally or locally) has a signifi cant participation.
Areas covered by this report:
The products covered are cars, motorcycles and power equipment. The parts distribution is also covered in this report.
The report summarises the data from factories, Honda national sales offi ces, logistics centres and regional R&D offi ces as well as six Honda-owned dealers in Switzerland. The detailed locations are summarised on page 78-81.
ColopHonQuestions about this reportPlease direct enquiries to:Honda Motor Europe LtdEuropean Environment and Safety Planning Offi ceFax : +32 53 725350Responsible PublisherHonda Motor Europe Ltd European Environment and Safety Planning Offi ceManager: Julien Van Damme
Creationwww.bigfi sh-cp.be
TABLE OF CONTENT
6
8
12
14
15
15
16
21
23
27
28
33
35
37
38
40
41
46
48
50
52
54
56
58
60
62
62
62
64
64
65
66
66
68
69
70
70
71
72
74
74
74
77
77
77
78
EuropEan EnvironmEntal rEport 20134 EuropEan EnvironmEntal rEport 20134
Second report issued, publication November 2013 Data collection period: fi scal year base 1 April – 31 March. The year indication in the graphs is the year of the beginning of the period (1 April 2012 – 31 March 2013 is referred to as 2012 data). The year reference in the name of this report is the year of issue of the report, basically within 6 months after the reporting period end. This is a yearly report.
rEport SCopE Top message
Feature 1
Feature 2
DIRECTION
Honda Environmental Statement
Honda Environmental and Safety Vision
Pursuing the Honda Environmental Targets
Honda Environment Statement
Progress in Meeting Environmental Targets
GLOBAL
Global Environmental Management
Global Environmental Impact
HONDA IN EUROPEAN REGION
Environmental Message of Mr. Manabu Nishimae
The LCA-cycle
PRODUCTS
1 Cars
2 Motorcycles
3 Power Equipment
Site Data
IN-HOUSE PRODUCTION
1 Car production
2 Motorcylcles production
3 Power equipment production
4 Parts production
TRANSPORT
1 Car transport
2 Motorcycles transport
3 Power equipment transport
4 Parts transport
5 Warehousing
SALES & SERVICES
1 Sales subsidiaries
2 Dealers
3 Research and Development
RECYCLING
1 Bumper collection
2 End-of life vehicles
Philanthropy
HONDA SITES
Production
Logistics - Distribution
Sales subsidiaries (Administration
Research and Development
Dealers
GRI Reference List

EuropEan EnvironmEntal rEport 2013 EuropEan EnvironmEntal rEport 201376
In 2010, Honda announced its direction for the decade leading up to 2020: to provide “good products to customers with speed, affordability, and low CO2 emissions.” The Honda Environmental and Safety Vision - to realize “the joy and freedom of mobility and a sustainable society where people can enjoy life” - was established based on this direction.
Providing the joy and freedom of mobility has been Honda’s aim in the development of personal mobility products since the company’s founding. The joy of mobility is not just the pleasure of driving your own car or motorcycle. It’s also the excitement of making discoveries and realizing dreams through the freedom mobility provides. Realizing a sustainable society where people can enjoy life, on the other hand, will require us to focus corporate resources on addressing climate change and energy issues as top priorities.To realize the two components of our Environmental and Safety Vision, we will lead the industry in offering outstanding environmental and safety performance with products and technologies that proudly bear Honda’s identity
TOP MESSAGE
Striving to Realize the Joy and Freedom of Mobility and Sustainable Society where People Can Enjoy Life
To thrive in an ever-changing global economy and market, Honda must transition to a new global organizational structure that, in every region (the six regions into which Honda has organized its worldwide operations), consistently rolls out competitive products that target local needs before other companies.Specifically, we need to finish the work of assembling an organization that is globally optimized for producing the best products for all of our customers. This includes building development capacities for responding quickly to market needs, enacting product design and procurement structure reform, and further improving production efficiency, all while adapting these organizations and facilities to national and local industrial infrastructure in rapidly growing economies in developing nations as well as in mature economies.The same goes for environmental management. Honda puts climate change and energy at the top of the list of global environmental issues that it needs to address. To respond to the environmental laws, standards, and challenges unique to each country and region, we believe reducing environmental impacts based on firm regional autonomy is the most appropriate business organization for Honda.
Last year, we announced estimates of all greenhouse gas (GHG) emissions that resulted from Honda business activities in fiscal 2012. These figures, calculated in accordance with the Greenhouse Gas Protocol, the most widely used GHG accounting and reporting standard worldwide, included data on Scope 3 (which includes emissions from use of sold products), making Honda the first automaker in the world to release emissions data covering its entire value chain.In fiscal 2012, Honda emitted the equivalent of 225 million tons of CO2. Of that, 196 million tons - or 87% - came from the use of Honda products sold in that year (which includes GHGs emitted across their lifespans now and into the future). Clearly, improving the fuel efficiency of products must be our core strategy for reducing CO2 emissions, but we think that taking all available actions to reduce emissions - regardless of the size of their impact - is the responsible approach to take as a corporate citizen.Until last year, Honda’s focus in this area was on doing research to understand the size of our environmental footprint. The next stage will include monitoring and managing GHG emissions across our value chain and devising and implementing specific strategies to reduce them, such as expanding hybrid options to our entire lineup and commencing operation of the environmentally advanced Yorii Plant. Expanding this approach beyond CO2 emissions to include all types of environmental pollutants, improving monitoring accuracy, and realizing further reductions, will be our environmental management policy for the years ahead.
June 2013
President & CEOChairman, Honda World Environmental and Safety Committee
TOP MESSAGE
Global operational reform
Awareness of the challenges: 2013 a year of action
EuropEan EnvironmEntal rEport 20136

EuropEan EnvironmEntal rEport 2013 EuropEan EnvironmEntal rEport 201398
FEATURE 1
Being “A Company Society Wants to Exist”in All Corners of the World
Honda manages its global production and sales networks through an organization divided into six regions: North America, South America, Europe, Asia & Oceania, China, and Japan. Six regional environmental committees, one for each region, set their own policies and plans for environmental initiatives based on the global direction and supervise and evaluate the divisions that carry out these plans. For the publication of this year’s report, the six committee chairmen were gathered and asked to provide a review of activities in fi scal 2013 as well as their future outlook for global operations.
Tetsuo IwamuraHonda North America Regional Environmental Committee ChairmanMasahiro TakedagawaHonda South America Regional Environmental Committee ChairmanManabu NishimaeHonda European Regional Environmental Committee ChairmanHiroshi KobayashiHonda Asia & Oceania Regional Environmental Committee ChairmanSeiji KuraishiHonda China Regional Environmental Committee ChairmanSho MinekawaHonda Japan Environmental Committee Chairman
Interviewer: Michio Shinohara, General Manager,Environment & Safety Planning Offi ce
Honda’s six regional environmental committeechairmen look back on fi scal 2013and forward to the years ahead
●Europe●China
●Japan ●North America
●South America●Asia & Oceania
.
EuropEan EnvironmEntal rEport 20138
FEATURE 1
Honda South AmericaRegional Environmental Committee ChairmanMasahiro Takedagawa
What is each region like?
First, please tell us what defi nes your region in terms of market characteristics and environmental challenges.
• Iwamura: North America is in many ways an environmentally advanced region with very eco-conscious public and private sectors. This is true not only of the U.S., which has the most stringent environmental regulations in the world, but also Canada and Mexico, which tend to follow U.S. regulations. So as a whole, North America is a region that’s rather tough on environment requirements.At the center is the U.S.; its government makes decisions based on hearings with various private sector interests. Honda engages in a wide range of communication activitiesto take advantage of these opportunities and convey to the government our stance and how companies should act on key issues, and get those ideas refl ected in long-term environmental policies.
• Takedagawa: South America’s largest market, Brazil, has for the last 40 years been promoting the use of sugar cane-derived bioethanol fuel as a national policy. During that time, fl ex-fuel cars and motorcycles have moved into the mainstream. Other innovative efforts include the development of the world’s largest environmental protection system, a system to monitor the Amazon rainforest using satellite technology, and the passing of an environmental crimes law, which is unusual on a global level. National environmental programs outside Brazil vary widely, so today I would like to talk mostly about Brazil, which is the most important market for Honda in South America.
• Nishimae: Europe has watched its automobile market contract in a deteriorating economic environment, from 16 million units in 2006 to less than 12 million units last year. Consumers are wanting smaller and more fuel-effi cient vehicles. Another notable trend in recent years has been the dominance of diesel, which now accounts for more than 55% of the market. Diesel engines with a capacity of 1.6 liters or less are particularly popular among fuel-effi cient models. With the EU targeting a mandatory CO2 emission limit for passenger cars of 95 g/km—one of the lowest in the world—by 2020,
environmental regulations across Europe are also becoming increasingly strict.
• Kobayashi: Asia and Oceania is a very broad region that extends from Pakistan in the west to South Korea in the east, and as far south as Australia and New Zealand. As a result, a wide divergence in environmental awareness between countries is one characteristic of this region. Within that context, the automobile market in India and other emerging countries is growing quickly, which has been met with moves in these countries to introduce more progressive environmental regulations. This region also has the highest sales of Honda motorcycles, so what we do to the environmental performance of motorcycle products here will have a large impact on Honda elsewhere.
• Kuraishi: China is now the largest mobility market in the world, selling roughly 20 million cars and 25 million motorcycles a year. This has led the national government to set very high environmental targets and ordinary people to take more interest in environmental issues.The actual response to these issues is still inadequate when you look at, say, the problem of fi ne-particle pollution, but the environment is, as you would expect, a major pillar of Honda’s business in China. Looking to the future, we are actively expanding the application of hybrid technologies for automobiles and electronic fuel injection (see note) for motorcycles, and aim to be the most environmentallyresponsible automaker as we continue growing in thismarket.
• Minekawa: Japan’s triple disaster of two years ago: the earthquake, tsunami, and nuclear meltdown, have had a huge impact on the minds of Japanese people. Since then, customer expectations with regard to sustainability and renewable energy have risen substantially, meaning that companies who are failing to respond decisively to these expectations will be left behind. Furthermore, local public transport systems are going bankrupt more often due to the decline of Japan’s rural population, which is increasing the need for personal vehicles as a means of transportation. Honda hopes to offer viable solutions to issues like these.
“next year we will begin operating a wind farm that will satisfyall the electricity needs of our automobile plant in Brazil.”
“in north america, we’ve begun the highly consequential mission of trying to meet the new fuel effi ciency standards set for 2025.”
Honda North AmericaRegional Environmental
Committee ChairmanTetsuo Iwamura

EuropEan EnvironmEntal rEport 2013 EuropEan EnvironmEntal rEport 20131110
H o n d a A s i a & O c e a n i a R e g i o n a l Environmental Committee ChairmanHiroshi Kobayashi
Fiscal 2013 in review
Thank you for your informative description of each region.Next, what were the most important events that happenedin your region in fi scal 2013, on both the business andenvironmental fronts?
• Iwamura: North America launched in April 2012 a Green Dealer program for Acura dealers and Honda automobile dealers in the U.S. The program is meant to encourage a stronger commitment to environmental conservation by awarding silver, gold, or platinum status to dealers based on their environmental efforts and achievements. By the end of fi scal 2013, 40 dealers were awarded, and we plan to increase this to 100 dealers by the end of fi scal 2014. We also established a partnership with a company to lease solar equipment to our customers dealers to encourage them to install solar. In production, our transmission plant in Ohio announced in January 2013 plans to develop and begin operation of a wind farm by the end of 2013. The wind farm is expected to cover about 10% of the plant’s electricity needs.
• Takedagawa: In South America, we held two regionalenvironmental committee meetings where we discussed environmental performance at production sites in each country and exchanged ideas for improvement. An increasing number of sites are using smart meters and switching from liquid paint to powder coat. Fuel-effi cient products were released, including the Civic and CR-V, both equipped with Eco Assist, and the PCX150 scooter with an idling stop system. In transportation, we worked to reduce both cost and CO2 emissions by increasing the number of motorcycle units per land shipment and by shifting to marine transport.
• Nishimae: In Europe, we were excited to introduce a small, 1.6-liter diesel engine-which was a highly anticipated component business wise-in the Civic, which also marked the debut of Earth Dreams Technology in the region. In spring of last year we started demonstrating a new electric scooter in Barcelona, Spain, and we also released a robotic lawn mower under the name Miimo. We’re making continued efforts to reduce CO2 emissions, for example by installing solar panels at plants and parts warehouses, and by searching for more effi cient routes and modes of transport
within the complex European distribution system.
• Kobayashi: Asia & Oceania posted spectacular business results in fi scal 2013. Automobile sales volume exceeded prior year results by a wide margin in all countries and set a new all-time record for the region. Thailand, India, Indonesia, and a few other countries posted their own record sales. A new power product sales record was also set for the region. Environmentally, we’ve been pushing hard to reduce CO2 emissions from product use, for example by expanding our lineup of electronic fuel injection-equipped motorcycles in Indonesia and raising fuel effi ciency levels for new motorcycle models in Thailand and India. For automobiles, we began local production of hybrid vehicles in Thailand and Malaysia.
• Kuraishi: China saw its second consecutive year of declining automobile sales. This was largely due to impacts from the disaster in Japan and fl ooding in Thailand two years ago, and the Senkaku Islands issue last year. To promote the popularization of hybrid vehicles, we introduced the Insight, CR-Z, and ILX hybrid, and set the stage for fullscale adoption of eco-cars by hosting test-drive events and demonstrating the Fit EV in Guangzhou. Contrastingly, we succeeded in expanding our share of the motorcycle and power equipment markets. In production, Dongfeng Honda launched a second plant and Guangqi Honda a third production line, both of which were designed for better environmental performance and associate comfort, by recycling waste heat and using more natural light in offi ces, among other improvements.
• Minekawa: Japan achieved a signifi cant increase in automobile sales in 2012, the driving force behind which was the release of the fi rst mini-vehicle in Japan to feature an Earth Dreams Technology powertrain. We also worked on expanding our hybrid lineup, and the customer response to these efforts showed us that environmental awareness and the demand for better fuel effi ciency is getting stronger and stronger. We also increased solar generation capacity at Honda dealers and added a web page showing in real time how much solar electricity is being generated at Honda operating sites and dealerships, which is a major step forward in communicating effectively with our external stakeholders in Japan. These achievements will form the basis for company efforts in fi scal 2014.
“Supplier selection and development is the key to expandinglocal production and procurement in asia.”
“in Europe, we will bolster our position by revampingall automobile engines over the next three years.”
Honda European RegionalEnvironmental
Committee ChairmanManabu Nishimae
FEATURE 1
Honda Japan Environmental Committee ChairmanSho Minekawa
Strategies and ambitions for the future
It appears that progress is being made in both business and the environment in each region, with the right balance being struck between the two. In closing, please tell us your region’s action plan for business and the environment in the years ahead.
• Iwamura: In North America, we’ve begun the highly consequential mission of trying to meet the new fuel effi ciency standards set for 2025. If we don’t clear these demanding targets, we won’t be able to continue doing business. Not only do we need to strengthen the competitiveness of our hybrid lineup but we also need to dramatically increase the fuel effi ciency of our gas-engine models. Companies that accomplish this effi ciently, quickly, and cheaply will be the ones to fl ourish in this market. For Honda to fl ourish, we will bring to bear all the power we have as a company, based on close coordination between front-line associates in development, manufacturing, and sales.
• Takedagawa: In South America, we adopted the South America Honda Environment Statement at a regional environmental committee meeting last February. The declaration articulates our decision to put to use all human creativity and wisdom and do our very best to achieve environmental impact reductions and sustainable business activities. As a way of acting on our promise, we plan to develop enough wind capacity to satisfy all the electricity needs of our automobile plant in Brazil, which produces 160,000 units per year. The wind farm is scheduled to go into operation in September 2014 (see page 49). For products, we will market new ecoconscious motorcycle and automobile engines under the name Flex One and engage in branding
activities to show how Honda is an environmental leader.
• Nishimae: In Europe, we plan to meet customers’ needs for low emissions, high fuel-economy by revamping all automobile engines over the next three years. We hope to maintain our strong motorcycle reputation in Europe, the biggest market for sport-touring crossover bikes, by leveraging the fuel-effi cient NC700 series. Honda’s approach in Europe for the coming years will be about bolstering our position
as a company society wants to exist while thinking about the environment and offering advanced environmental technologies in all products- automobiles, motorcycles, and power equipment.
• Kobayashi: Asia a nd Oceania is expected to continue showing impressive growth, but environmental regulations in a number of countries will become increasingly strict. To get the upper hand in this environment we need to expand local procurement and production and fi nd and develop new local suppliers. The key to future business is developing suppliers that can share Honda’s position on the environment and will work with us to reduce impacts. Although awareness and activity vary between countries, we hope to speed up progress by actively promoting the sharing of best practices and bringing everyone up to the same level.
• Kuraishi: In China, Honda takes it as its mission to actively increase penetration of eco-conscious engines, the most prominent being the hybrid engine. To that end, we are making preparations to begin local hybrid production within the next three years. As we aim to become the environmental leader and offer the most fuel-effi cient products in each category, we will also strive to deliver outstanding value that satisfi es our Chinese customers in areas beyond environmental performance as well. By doing so, we hope to be a brand that is well-loved and that encourages positive excitement for the future.
• Minekawa: In J apan, public expectations surrounding renewable energy and the environment have risen tremendously. Honda’s technological answer to those expectations actually already exists. All that’s left is to determine how affordably we can provide the technologies to our customers. R&D, production, and sales divisions need to work together to fi gure out how to deliver good products to customers with speed, affordability, and low CO2 emissions. Solving this problem is an important key to achieving higher growth for our business.
Thank you all for your time today.
“r&D, production, and sales divisions need to work togetherand fi gure out how to get satisfying products to more people.”
“in China, we’re making preparations to beginlocal hybrid production within three years.”
Honda China RegionalEnvironmental
Committee ChairmanSeiji Kuraishi
FEATURE 1

EuropEan EnvironmEntal rEport 2013 EuropEan EnvironmEntal rEport 20131312
FEATURE 2
Yorii designated as leader of globalHonda manufacturing
In July 2010, Honda announced that the Yorii Plant will beindispensable in efforts to establish the highly sophisticated next-generation manufacturing technologies necessary for the production of environmentally responsible products and development of low-carbon manufacturing. Equipped and designed to function as one of the leader plants in Japan of Honda’s manufacturing sites in 27 countries, the Yorii Plant is absolutely packed with cutting-edge environmental technologies.
• Product specialization yields 30% reduction in energy use Customizing the plant for production of compact vehicles - such as the new Fit to be released this year - and loading it with dedicated machinery and technologies has resulted in an extremely effi cient production system. In fact, combined with the latest energy conservation and management technologies, this system uses 30% less energy per unit.
• 2.6 MW of solar power - the most of any auto factory in Japan Installation of Honda Soltec-brand CIGS thin-fi lm solar panels on rooftops and other surfaces is underway, with plans to increase total generation capacity to 2.6 MW by August 2013—the most of any auto factory in Japan. This is enough to power 459 typical Japanese homes, and should cut CO2 emissions by roughly 1,200 tons per year.
• Produces 28% of the energy it uses through cogeneration Faced with nationwide restrictions on electricity use
following the 2011 disaster, the Yorii Plant was equipped with a natural gas-powered cogeneration system that will meet 28% of its electrical and thermal energy needs, reducing the plant’s peak power demand by 45%. Using energy from the system, which is about twice as effi cient as energy from the grid, will cut emissions by roughly 3,000 t-CO2 per year.
• New paint technologies reduce CO2 emissions by 40% Body coating processes at the Yorii Plant will use a newly developed paint technology called Honda Smart Ecological Paint as well as a newly developed wall-mounted robotic painting system. These innovations result in a 40% shorter coating line and 40% fewer CO2 emissions compared to conventional lines
Toward better relationships with life of all kinds
The Yorii Plant is not just about cutting-edge hardware. It is also a testing ground for pioneering efforts in community engagement and environmental conservation. Efforts here will serve as a model for other Honda plants around the world.
• Built to support healthy, active ecosystems Before the plant’s construction, Honda hired experts to survey the site and conduct an environmental assessment. Their survey showed that the site and the area around it was once an expansive satoyama environment, one that in modern times had fallen into disuse. Meanwhile, the environmental impact assessment showed that the construction of a plant here would have, as expected, a sizable impact on the surrounding environment. Facing these fi ndings head-on, Honda
Welcome Center Welcome Center Wall-mounted painting robot Wall-mounted painting robot
Rooftop solar array under construction Rooftop solar array under construction
West biotope
East biotope
Last March, Honda fi nished construction on a new 250,000-vehicle plant in Saitama, Japan. Set to begin operating in July, the Yorii Plant is not only a state-of-the-art manufacturing compound boasting world-leading energy effi ciency and the most advanced equipment available, but, with more than 30% of its land area devoted to vegetation and riparian habitat, it is also ecologically responsible, specially designed for building harmonious relationships with the surrounding human and biological communities.
The New Yorii Plant, an Experiment in Satoyama Restoration
FEATURE 2
decided that the most responsible thing to do as a company that strives to operate in harmony with its surroundings would be not only to minimize the impact of the plant’s construction on the environment but to stimulate the natural environment through the creation and continued maintenance of new habitat, and restore the satoyama to its original condition.
• 16,000 m2 of life-sustaining biotope Satoyama are rural areas in Japan where humans have actively managed and taken care of the natural environment while sustainably benefi ting from the services they provide. The neglect of a satoyama environment causes it to deteriorate, adversely impacting the wildlife it supports. Honda undertook to conserve and even create new habitats for animals and plants living in the site and the surrounding area, particularly species endemic to Yorii. We dedicated 326,000 m2, or 34%, of the site’s 950,000 m2 to vegetated land and riparian habitat for wildlife. The east and west biotopes, which comprise mixed woodlands, streams, rice paddies, and wetlands, total 160,000 m2 and are given central importance in Honda’s effort to cultivate a diverse ecosystem at the Yorii Plant. Special care was also taken to ensure that plants and animals can move freely from these biotopes to other vegetated land and wetland on site, and farther to unmanaged areas beyond the plant. This continuous biological community forms a green corridor that extends
Surveys show positive trend in biodiversity conservation
• Conserving rare animal speciesDuring construction, Honda took utmost care to preserve
habitat for rare species. From the habitats of the Tokyo salamander, stone loach, and Japanese fi refl y - three species that have diffi culty relocating and were thought to be particularly vulnerable to the construction - that could not be saved, individuals were captured and bred indoors and then later reintroduced to the biotopes.
• Conserving rare plant speciesRare plant species, such as the Tokyo wood fern, Hardy orchid, and Japanese bugbane, were conserved via transplantation. The Hakuun-ran, a type of orchid that was on Saitama Prefecture’s endangered species list at the time, was given special attention. The population was preserved by propagating it through artifi cial pollination and growing them in sterile culture media.
• Increase in rare species confi rmedAs a result of these efforts, surveys confi rmed that the number of rare animal and plant species on site has been increasing since before construction of the plant.
• Rare animals 69 species (2007) - 73 species (2010-2012)• Rare plants 29 species (2007) - 35 species (2010)• Number of rare species confi rmed per area of vegetated land 6 species/ha (2007) -15 species/ha (2010)
In a program developed by the Japan Business Initiative for Biodiversity and Tohoku University for measuring the success of eco-conscious land use projects and conservation initiatives, the Yorii Plant scored an impressive 84 out of 100.By continuing to support and expand conservation initiatives like these, Honda will strive to build relationships of symbiosis and mutual growth between the Yorii Plant and the surrounding communities.
Yorii PlantYorii Plant
Ogawa PlantOgawa Plant
Goog le
Maps
aerial
photo (par tial ly
edited)
Regulating reservoir
Rice padd y
Green space
Sunlitwetlan d
Shadedwetlan d
The east biotope was publicized at a press conference in April 2013.
Rare species were captured, bred, and reintroduced to the biotope under expertguidance. Surveys latershowed the species wereestablishing themselves and thriving.
Top: Rare animals - Tokyo salamander (Hynobius tokyoensis), Stone loach (Lefua echigonia),Japanese fi refl y (Luciola cruciata), Great purple emperor (Sasakia charonda)Bottom: Rare plants - Hakuun-ran (Vexillabium nakaianum), Tokyo wood fern (Dryopteris tokyoensis),Hardy orchid (Bletilla striata), Japanese bugbane (Cimicifuga japonica)Biotopes and other areas for conserving and creating new habitat for rare species were includedin the plant construction plans. Biodiversity surveys and management will be conducted regularlyeven after the project is over.
The area between the Yorii Plant and nearby OgawaPlant forms a broad ecosystem that was preservedto keep wildlife populations from being separated.Restoration and conservation efforts are happeningthroughout this area.
Green corridor
East biotope
Some of the rare animal and plant species living near Yorii Plant
Reintroducing rare species
EuropEan EnvironmEntal rEport 2013 EuropEan EnvironmEntal rEport 20131514 EuropEan EnvironmEntal rEport 201314
1. Honda Environmental Statement
3. Assessment of environmental issues
4. Honda’s vision for future operations
Greatest challenge
Climate change and energy issues
Major challenge
Resource problems
Concern
Biodiversity
Greatest challenge
Climate change and energy issues
Major challenge
Resource problems
Concern
Biodiversity
2. Honda Environmental and Safety Vision
Realizing the joy and freedom of mobility and a sustainable society where people can enjoy life
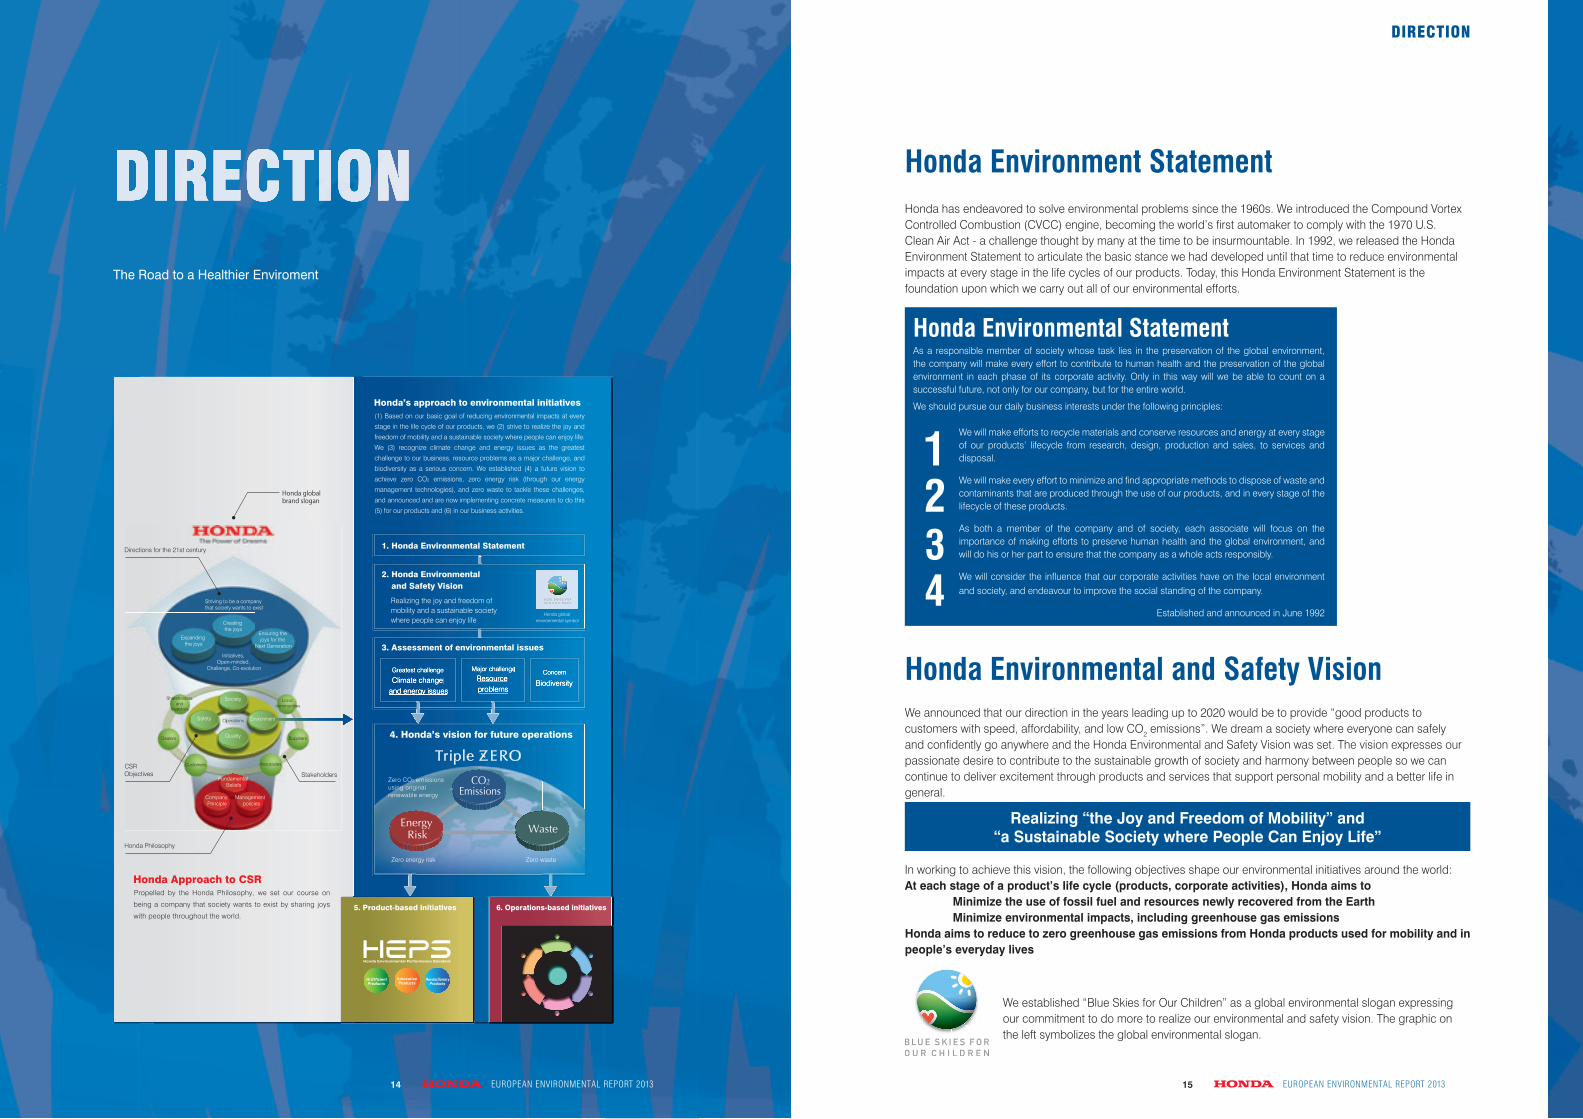
(1) Based on our basic goal of reducing environmental impacts at every
stage in the life cycle of our products, we (2) strive to realize the joy and
freedom of mobility and a sustainable society where people can enjoy life.
We (3) recognize climate change and energy issues as the greatest
challenge to our business, resource problems as a major challenge, and
biodiversity as a serious concern. We established (4) a future vision to
achieve zero CO2 emissions, zero energy risk (through our energy
management technologies), and zero waste to tackle these challenges,
and announced and are now implementing concrete measures to do this
(5) for our products and (6) in our business activities.
Honda’s approach to environmental initiatives
Honda global environmental symbol
5. Product-based initiatives 6. Operations-based initiatives
Propelled by the Honda Philosophy, we set our course on
being a company that society wants to exist by sharing joys
with people throughout the world.
Honda Approach to CSR
Honda global brand slogan
Honda Philosophy
Directions for the 21st century
CSR Objectives
株主投資家
地域社会
販売会社 お取引先
お客様 従業員
Stakeholders
Striving to be a company that society wants to exist
Creating the joys
Expanding the joys
Ensuring the joys for the
Next Generation
Initiatives, Open-minded,
Challenge, Co-evolution
Operations
Society
Safety
Quality
Company Principle
Management policies
Fundamental Beliefs
Shareholders and
investors
Local communities
Dealers Suppliers
Customers Associates
Zero CO2 emissions using original renewable energy
Zero energy risk Zero waste
Environment
The Road to a Healthier Enviroment
EuropEan EnvironmEntal rEport 201314
Honda Environmental and Safety Vision
Honda has endeavored to solve environmental problems since the 1960s. We introduced the Compound Vortex Controlled Combustion (CVCC) engine, becoming the world’s fi rst automaker to comply with the 1970 U.S. Clean Air Act - a challenge thought by many at the time to be insurmountable. In 1992, we released the Honda Environment Statement to articulate the basic stance we had developed until that time to reduce environmental impacts at every stage in the life cycles of our products. Today, this Honda Environment Statement is the foundation upon which we carry out all of our environmental efforts.
We announced that our direction in the years leading up to 2020 would be to provide “good products to customers with speed, affordability, and low CO2 emissions”. We dream a society where everyone can safely and confi dently go anywhere and the Honda Environmental and Safety Vision was set. The vision expresses our passionate desire to contribute to the sustainable growth of society and harmony between people so we can continue to deliver excitement through products and services that support personal mobility and a better life in general.
In working to achieve this vision, the following objectives shape our environmental initiatives around the world:At each stage of a product’s life cycle (products, corporate activities), Honda aims to Minimize the use of fossil fuel and resources newly recovered from the Earth Minimize environmental impacts, including greenhouse gas emissionsHonda aims to reduce to zero greenhouse gas emissions from Honda products used for mobility and in people’s everyday lives
We established “Blue Skies for Our Children” as a global environmental slogan expressing our commitment to do more to realize our environmental and safety vision. The graphic on the left symbolizes the global environmental slogan.
DIRECTION
Honda Environment Statement
Honda Environmental StatementAs a responsible member of society whose task lies in the preservation of the global environment, the company will make every effort to contribute to human health and the preservation of the global environment in each phase of its corporate activity. Only in this way will we be able to count on a successful future, not only for our company, but for the entire world.
We should pursue our daily business interests under the following principles:
We will make efforts to recycle materials and conserve resources and energy at every stage of our products’ lifecycle from research, design, production and sales, to services and disposal.
We will make every effort to minimize and fi nd appropriate methods to dispose of waste and contaminants that are produced through the use of our products, and in every stage of the lifecycle of these products.
As both a member of the company and of society, each associate will focus on the importance of making efforts to preserve human health and the global environment, and will do his or her part to ensure that the company as a whole acts responsibly.
We will consider the infl uence that our corporate activities have on the local environment and society, and endeavour to improve the social standing of the company.
Established and announced in June 1992
Realizing “the Joy and Freedom of Mobility” and“a Sustainable Society where People Can Enjoy Life”
DIRECTIONDIRECTIONDIRECTIONDIRECTIONDIRECTIONDIRECTIONDIRECTION

EuropEan EnvironmEntal rEport 2013 EuropEan EnvironmEntal rEport 20131716
CO2 emission reduction/elimination technology
Energy risk reduction/elimination technology
Waste reduction/elimination or 3R technology
Risk management led by the World Environment and Safety CommitteeWe clarify our understanding of such risks and opportunities Nrelating to climate change and energy issues by analyzing them from three different perspectives: by product categories (motorcycles, automobiles, and power products), with a focus on our business and product development operations; by region, which is based on our unique regional management structure; and by function, such as production and sales. The Honda World Environmental and Safety Committee assesses these risks and opportunities from a global perspective, the fi ndings of which are then used by our Regional Operations (regional environmental committees), Business Operations and Functional Operations in the formulation of various management policies and strategies, such as in formulatingand updating our medium-term plans for environmentalinitiatives. We conduct this risk management process every six months and as needed.
Zero energy riskIn response to energy issues, our long-term goal is toachieve zero energy risk by becoming energy self-suffi cientthrough the use of solar-powered hydrogen stations, andby raising the effi ciency of environmental managementthrough innovations in energy management technologies.To get there, we will reduce energy risk by cutting energyuse through product fuel effi ciency improvements, andby diversifying energy sources through the deployment ofhybrid and other electromotive technologies.Progress in this area will also lead to reduced risk forHonda’s business activities.
Zero wasteIn response to resource problems, our aim is to completelyclose the loop for all resources and bring product lifecyclewaste down to zero. We will do this by developingtechnologies to shift away from using precious resources,by developing and perfecting reduction, reuse, and recycling (3R) technologies, and by reducing water resource use. By reducing and eliminating the use of hazardous chemicals as well as waste, we will strive to eliminate all materials from our products and business activities that have an adverse effect on human health and the environment.
Impact on Honda Business Activitiess
Biodiversity
Noise/Vibration
Substances of concern
Waste
Air, water, and soil pollution
Resource problems
Climate change, energy issues
Sta
keho
lder
con
cern
s
Honda’s general assessment of environmental issues from a global perspective
Honda’s current recognition and response to environmental issues
Perceived risks
Incentives to switch to products that use next-generation energy
(e.g., electric/hybrid vehicles, solar power)
Direct operational risks from rising sea levels and extreme weather
events
Changing consumervalues (emphasis on environmental
performance)
Energy diversifi cation (e.g., deployment of smart community (see
note) technologies)
Tighter regulation of product-related GHG emissions
Tighter regulation of operations-related GHG emissions
Worsening resource problems
Increasing reporting requirements for GHG emissions
Perc
eive
d op
portu
nitie
s
Honda’s assessment of opportunities and risks of climate change and energy from a global perspective
DIRECTION
Honda has endeavored to solve environmental problems since the 1960s. We introduced the Compound Vortex Controlled Combustion (CVCC) engine, becoming the world’s fi rst automaker to comply with the 1970 U.S. Clean Air Act - a challenge thought by many at the time to be insurmountable. In 1992, we released the Honda Environment Statement to articulate the basic stance we had developed until that time to reduce environmental impacts at every stage in the life cycles of our products. Today, this Honda Environment Statement is the foundation upon which we carry out all of our environmental efforts.
Pursuing the Honda Environmental and Safety Vision
Current assessment of environmental issues
Climate change and energy issues are our greatest challenges
To continue doing business across the globe as a member of society and to make progress toward the Honda Environmental and Safety Vision, we must correctly assess the environmental issues that exist in the world today and the way in which Honda business activities relate to and infl uence them. Accordingly, Honda has organized various environmental issues and identifi ed those that pose the greatest risk to our business and stakeholders. As a global corporation supplying mobility products, we see climate change and energy issues as the greatest challenges facing the company, followed by resource problems.
Environmental management system
To organize and analyze in a timely manner the impacts of various environmental issues on our business, particularly climate change and energy, and to develop and execute specifi c measures for addressing them, we have constructed a comprehensive global management system. Based on this system, we have established our own CO2 emission reduction targets, considered to bethe principal driver of climate change, and are carrying out various initiatives to realize the Honda Environmental and Safety Vision, such as stepping up efforts in each region across the globe to achieve these targets. Assessment of business activity risks and opportunities
Risks and opportunities relating to climate change and energy issues
Honda’s response to the key challenges of climate change nand energy issues does not just involve initiatives for environmental conservation. While these environmental issues pose risks to our business continuity, they also present opportunities to create and expand new businesses. Honda considers it essential to engage in business activities and decide and execute specifi c measures, having suffi ciently assessed these risks and opportunities. Accordingly, we have compiled all of the major opportunities and risks we currently expect from climate change and energy issues, and have been taking measures in response.
Measures based on risk and opportunity assessment
To minimize the regulatory risk our products face as emitters of GHGs, we set forth CO2 emission reduction targets for our automobiles, motorcycles, and power products for 2020. Major initiatives to reduce CO2 emissions include the introduction of the new Earth Dreams Technology hybrid powertrains for automobiles, and the marketing of electric vehicles. In response to changes in consumer awareness and growing energy diversifi cation needs, we are continuing demonstration testing of electric mobility products in Japan, the U.S., and China for the establishment of a future smart mobility society. We also are accelerating development projects, having completed the construction of a demonstration Honda Smart Home System house and a solar-powered hydrogen station in 2012.
Note 2: Read more about the recycling of rare earths in Case17 of “Environmental Documentary Honda Face.” (http://world.honda.com/environment/face/2012/)Note 3: Well-to-wheel: Typically, all steps from extracting petroleum resources to their use as fuel in a vehicle. It can also refer to the life cycles of non-petroleum energy resources, from generation to their fi nal use in propelling a vehicle.
CO2 Emissions
Energy Risk Waste
Zero CO2 emissions using original renewable energy
Zero energy risk Zero waste
Triple Zero symbols
In this year’s report, technologies, products, and initiatives that contribute to the realization of Triple Zero are marked with one of three Triple Zero symbols.
DIRECTION
We are working to reduce GHG emissions in each regionand domain of our business in order to minimize regulatoryrisk relating to emissions from each business site. We compile the results of our efforts and make them known to the public once a year through this Environmental AnnualReport. We see the increasing scarcity of resources stemming from the response to climate change and energy issues as another major challenge. In recognition of the risk of resources becoming depleted, more diffi cult to obtain, and more expensive to dispose of, we are developing alternative technologies, technologies to reduce, reuse, and recycle these resources, and we are also diversifying our supply chain. In fi scal 2013, we actively engaged in measures such as establishing a scheme for the closed-loop recycling of rare earths (see note 2) extracted from nickel metal hydride batteries for hybrid vehicles.
Giving shape to the Honda Environmental and Safety Vision
Triple Zero: The ultimate zero-impact society
In order to realize the Honda Environmental and SafetyVision - our vision for the future - we are engaging withclimate change, energy and resource issues through ourtechnology and business activities, with the aim of creatinga zero-impact society. As a specifi c model for this, Hondahas announced the Triple Zero concept.
Zero CO2 emissions through renewable energyIn response to climate change, our long-term goal is todeploy solar power and other renewable energy systems tobring well-to-wheel (see note 3) CO2 emissions down to zero.To get there, we will develop the technologies needed toreduce and eliminate emissions, while at the same timesteadily reducing product life-cycle emissions and emissionsfrom business activities through a range of initiativesincluding product fuel-effi ciency improvements andincreasing effi ciency in product transportation.
Triple Zero: Toward a zero-impact society

EuropEan EnvironmEntal rEport 2013 EuropEan EnvironmEntal rEport 20131918
Product-based scenarios for addressing climate change and energy issues
Honda Environmental Performance Standards (HEPS) and carbon reduction scenarios
Scenarios for achieving zero CO2 emissions
Reducing CO2 emissions in three stages
To achieve zero CO2 emissions, one of the three objectives of Triple Zero, our aim is to eliminate the life-cycle emissions(emissions from all stages in the life of a product, fromits manufacture using raw materials, to customer use, todisposal) of all Honda products, including through suchstrategies as renewable energy carbon offsets. However, given that many mobility products today still runon fossil fuel burned in an internal combustion engine, zeroCO2 emissions is not something we can achieve overnight.That is why we have developed three scenarios to guide usthrough steady reductions, and ending with the completeelimination of CO2 emissions. These scenarios, which areto be pursued in parallel, are: 1) Reduce emissions througheffi ciency improvements of internal combustion engines, 2)Reduce emissions by introducing energy-diversifi cation andenvironmentally innovative technologies, and 3) Eliminateemissions through the use and [comprehensive/fullyintegrated management] of renewable energy (see fi gurebelow).
• Honda Environmental Performance Standards
To move our products along these scenarios, in fi scal 2012we established the Honda Environmental PerformanceStandards (HEPS), an independent product classifi cationand certifi cation system designed to shed light on howHonda products are contributing to achievement of thethree scenarios outlined above. Under HEPS, productsare grouped into three categories, each with its ownrequirements for certifi cation. By making all new Honda products compliant with one of the three standards, we will make steady progress toward realizing zero CO2 emissions.
Hi Effi cient Products
Products that emit less CO2 emissions because of improved internal combustion engine effi ciency.This category includes products that incorporate technologies for improving fuel combustion and transmission effi ciency and reducing friction between engine parts. Compliance is determined based on how well a product reduces or helps reduce CO2 emissions during use compared to preceding models.
Innovative Products
Products that emit less CO2 because they use anenvironmentally innovative technology or alternative energysource. This category includes motorcycles that incorporateHonda’s patented Idle Stop System, automobiles thatincorporate hybrid technologies or direct-injection enginetechnologies, and power products with a new electronicgovernor technology for regulating engine speed.Alternative energy technologies include motorcycles andautomobiles that can run on ethanol, and power productsthat can run on gaseous fuels.Compliance is determined based on how well a productreduces or helps reduce CO2 emissions during usecompared to preceding models.
Revolutionary Products
Products that generate or use energy from renewablesources or help manage the generation and consumptionof such energy, thereby contributing to the eliminationof CO2 emissions. This category includes products thatincorporate electromotive technologies or technologies forgenerating or using renewable energy (e.g., hydrogen fuelfor automobiles, solar cells for power products).
DIRECTION
● Examples of HEPS-compliant models released in FY2013
Products with a more effi cient internal
combustion engine that emits less
CO2
Products that use unconventional energy sources or innovative
environmental technologies that emit less CO2
Products designed to reduce or eliminate CO2 emissions by
harnessing renewable energies or facilitating total energy management
Hi Effi cient Products
CO2 emissions from product use
Innovative Products Revolutionary Products
Compliant products
(examples)
Defi nition
Performance parameter
Power products
Super Cub C50
N-ONE
GX390 engine
Integra
Accord PHEV
EU9i GP LPG generator
EV-neo
Fit EV
Solar modules
CBR125R
ILX
XRE300
Civic Diesel
Salad CG FFV300 gas-powered tiller
Kushi
PCX150
Brio
MSX
CITY CNG
MCHO1.0 household cogeneration unit
FCX Clarity
Graspa HRE330 electric lawnmower
Dio110
Crosstour
GX690 engine
CB300R
Fit twist Flex
HSM1390 i hybrid snowblower
Monpal ML200 scooter
Miimo 300 robotic lawnmower
Automobiles
Motorcycles
HEPS-compliant models released in FY2013
38 HEPS-compliant models released in FY2013
We reviewed products to see how many met the HEPSrequirements. In fi scal 2013, 18 motorcycles models, 16automobile models, and 4 power products—a total of 38models—were HEPS-certifi ed
Cumulatively, this brings the number of HEPS-compliantproducts to 66 motorcycle models, 83 automobile models,and 42 power product models, or 191 models in total.By region, 67 models in Japan, 48 models in North America, 58 models in Europe, 28 models in South America, 63 models in Asia & Oceania, and 26 models in China are now HEPS-certifi ed.
DIRECTION
Fossil fuel use Diversified energy use
Life-cycle CO2 emissions
Renewable energy use Energy management technologies
Evolution of energy technologies
Hi Efficient Products
Innovative Products
Revolutionary Products

EuropEan EnvironmEntal rEport 2013 EuropEan EnvironmEntal rEport 20132120
Honda's Business Activities Honda's Response
* The aim of zero emissions initiatives is to reduce waste and substances of concern as near as possible to zero.
Environmental efforts based on life-cycle assessment
The seven domains of Honda business activities
Environmental initiatives in our business activities
Administration
Life cycle stages in Honda's business activities
Major initiatives in each domain
Product-based initiatives
Factors considered to impact the environment
Hi Effi cient Products
Effi ciency improvement technologies for internal
combustion engines
Make products HEPS-compliant
InnovativeProducts
Environmental innova-tion and energy diversi-
fi cation technologies
RevolutionaryProducts
Renewable energy technologies
Reduce environmental impacts from business activities
Reduce environmental impacts from products
Product
development
Purchasing
Production
Transportation
Sales and
Service
Product
recycling (3Rs)
Administration
Greenhouse gasesExhaust emissionsRaw materialsNoise/VibrationSubstances of concern
Greenhouse gasesWaste
Greenhouse gasesRemoved partsCFCsWaste
Greenhouse gasesEnd-of-life products
Greenhouse gasesWaste
● Social contribution activities
● Promote “green purchasing” ●Environmental management ●Energy conservation at suppliers ●Resource conservation ●Zero emissions activities at suppliers
● Promote “green factories” ●Environmental management ●Energy and resource conservation ●Zero waste and emissions initiative
● Promote “green logistics” ●Environmental management ●Increase transportation effi ciency ●Use less packaging
● Promote “green dealers” (automobiles, motorcycles, power products)
● Environmental management ● Increase energy effi ciency ● Do more for environmental conserva-
tion
● Increase parts collection, reuse, and recy-cling
● Properly process end-of-life products● Provide technical support for recycling
● Promote “green offi ces” ●Environmental management ●Energy conservation ●Use resources effectively
Greenhouse gasesRaw materialsWasteWater use WastewaterExhaust emissionsNoise / VibrationSubstances of concern
● Promote “green laboratories” ●Energy and resource conservation ●Zero waste and emissions* initiatives
Reducing the amount of CO2 emitted by our productsis not all we are trying to do for the environment. Givenour philosophy of reducing impacts across entireproduct life cycles, we were quick to start reducingthe environmental impacts of our business activitiesthemselves. Specifi cally, we divided our businessactivities into seven domains and have sought to reduceimpacts by being aware of all the factors in each domainthat place stress on the environment.We believe that steadily reducing environmental impactsfrom both our business activities and products will helpus achieve the Honda Environmental and Safety Visionand also lead to recognition of Honda as a companysociety values.
DIRECTION
Basic Statement
We recognize, under the Honda Environment Statement, that biodiversity conservation initiatives are an essential part of our commitment to the preservation of the global environment. We will continue to work toward harmony
between this commitment and our activities.
Priority Activities
1. Development of Environmental TechnologyWe will contribute to the conservation of biodiversity by developing and disseminating technologies for fuel-effi cient vehicles, next-generation cars, and energy-production and other technologies for the reduction of environmental impacts.
2. Initiatives Based on Corporate ActivitiesWe will work to reduce environmental impacts and ensure the effective use of resources through efficiency improvements.
3. Cooperation with CommunitiesWe will implement community-based activities in cooperation with stakeholders, using expertise accumulated by Honda through its initiatives to protect ecosystems, such as the Community Forests and Hello Woods initiatives.
4. Disclosure and Sharing of InformationWe will share information with society by disclosing the outcomes of our activities.
Established in May 2011
Honda Biodiversity Guidelines
Climate change and energy issues are not our only concerns. We also pay close attention to biodiversity as an issue relating to environmental conservation, because our business activities can have an impact on vital natural resources. Tree-planting and water-recycling initiatives at our plants in the 1960s, and our Community Forest program launched in 1976, demonstrate the deep roots of our commitment to environmental conservation and living in harmony with local communities. In 2011, we created the Honda Biodiversity Guidelines as part of the contributions we strive to make to global environmental conservation, a goal set forth in our Honda Environment Statement.
Honda Environment Statement
Our greatest contribution: reducing environmentalimpacts from products and operations
Resource exploitation, runaway development, pollution,climate change – these and many other impacts of humanactivities threaten biodiversity. As a manufacturer ofpersonal mobility products, we see our business activitiesas being most closely associated with the growingenvironmental impacts resulting from emissions ofgreenhouse gases (GHGs) and various other pollutants.We believe that minimizing the environmental impacts thatresult from our business activities and products representsthe greatest contribution we can make to protecting Earth’smyriad life forms. We created the Honda BiodiversityGuidelines to set priorities in this effort, focusing ourenergies on developing environmental technologies andreducing impacts in our business activities, alongsideinitiatives to operate in harmony with local communities.
Develop technologies to reduce impacts on theenvironment
We will develop technologies to reduce the environmentalimpacts of personal mobility, since this represents themodels—were HEPS-certifi ed
greatest contribution we can make. Technologies includefuel-effi cient and next-generation vehicles, and technologiesthat harness alternative energies.
Make business activities species-friendly
We aim to make our business activities more sustainablein themselves, by releasing less environmental pollutants,including GHGs, waste, and substances of concern.
Work to protect nearby ecosystems
We have already gained a wealth of knowledge abouthow to maintain and restore ecosystems through ourCommunity Forest and Hello Woods initiatives.Working in collaboration with nearby communities, we willuse this knowledge and experience to implement programsto protect local species and make our business activitiesfriendlier to them.
Communicate openly with the public
We will endeavor to openly communicate with the publicabout the details and outcomes of activities we implementfrom the new perspectives offered by these biodiversityguidelines.
DIRECTION

EuropEan EnvironmEntal rEport 2013 EuropEan EnvironmEntal rEport 20132322
Collaborating with local communities
For biodiversity conservation
Honda conducts various initiatives to reduce environmentalimpacts from its products and business activities, basedon the recognition that success in this area is most vitalto the conservation of biological diversity. Forging positiverelationships with local communities and partnering withthem to preserve and cultivate nearby habitats is also animportant endeavor in this regard.
Community Forest initiative
Following the thinking of Honda founder Soichiro Honda,who said that no concrete walls should be built to separatelocal communities from the grounds of Honda facilities,Honda used trees instead of walls to mark the boundary ofits Sayama (now Saitama) Factory in 1964.In 1976, this idea was expanded with the launch of theCommunity Forest initiative, a program to plant indigenoustrees at each facility and use natural ecosystems tocultivate forests with numerous tree species. The forestswere managed like the forests surrounding shrines, wherenative trees are left and woodland is cultivated by leaving itas untouched and natural as possible.Now the Community Forests at Honda facilities have fi nallygrown to resemble true forests. Birds make their nestsin trees 20 meters high, small mammals are a commonsighting, and luscious greenery and seasonal fl owers bringpeace of mind to Honda associates and local residents.
Biodiversity surveys at major business sites
With a view to establish its own biodiversity policy, Hondacarried out biodiversity surveys from 2011 to 2012to assess the natural environments surrounding ouroperations and determine what kinds of organisms andhow many inhabit them. These surveys also includeda factual survey of the Community Forest initiativespanning the three decades since its launch. Based onthis, Community Forest management methods werereassessed.
Introducing satoyama methods
The survey results revealed several problems with theCommunity Forests, which had grown far larger than hadbeen assumed three decades earlier. Trees overhangingroads were obstructing passage, large quantities of leaveswere accumulating in surrounding neighborhoods, andnon-native species that were propagating in the forestswere found to pose a possible threat to nearby ecosystems.In order to improve this situation, we revised ourCommunity Forest management policy from one basedon a laissez-faire approach to one involving activemanagement. We decided to introduce satoyama practices,such as thinning and pruning trees and removing foreignspecies, to help maintain biological vitality and diversity andmake the forests more functional and benefi cial to localcommunities.
DIRECTION DIRECTION
達成
100
84.890.587.6
2000 FY2012FY2011 FY20130
20
80
60
40
100
(baseline) 2000 FY2012FY2011 FY2013
(baseline) 2000 FY2012FY2011 FY2013
(baseline)
(%)
~~
100
72.675.984.9
0
20
80
60
40
100
(%)
~~
達成
100
85.386.589.0
0
20
80
60
40
100
120 120 120
140 140 140
(%)
~~
達成
2020target
(30% reduction)
2020target
(30% reduction)
2020target
(30% reduction)
Automobiles Motorcycles Power products2020 Product CO2 EmissionReduction Targets
Regions covered:
Japan, North America, Europe, Asia/Oceania, China, and South America, covering more than 90% of global sales by volume of each product category.
Progress in achieving the 2020 Product CO2 Emission Reduction Targets
Automobiles (g/km) Motorcycles (g/km) Power products (kg/h)
2020 Product CO2 Emissions Reduction Targets
Current progress in achieving the targets
baseline: 2000
30% reduction
(g/km)
baseline: 2000
30% reduction(g/km)
baseline: 2000
30% reduction
(kg/h)
Global average CO2 emissions from Honda
products
Progress in Meeting Environmental Targets
Reducing CO2 emissions from our products is a necessary step in combating climate change and energy issues, the greatest challenges to our business. That is why we created the 2020 Product CO2 Emissions Reduction Targets, through which we seek to reduce the average
Automobile fuel effi ciency increased with the introduction of redesigned core models such as the CR-V and Accord. CO2 emissions declined substantially year-on-year thanks to the moderate recovery of the U.S. market and steady expansion of the Asian market, driving a large increase in sales.Motorcycle CO2 emissions saw another year-on-year decline, driven by increased sales from the introduction in Thailand of the Click 125i, a commuter vehicle with
amount of CO2 emitted per unit of automobiles, motorcycles, and power products by 30% from 2000 levels by 2020. We hope to achieve these targets by developing more effi cient technologies and marketing more energy-effi cient products.
improved fuel effi ciency, and increased sales of the fuel-effi cient PCX150 in Thailand, BeAT in Indonesia, and Activa in India.Sales of large engines, which have comparatively higher per-unit emissions, increased in North America. Meanwhile in Europe, sales of low-emission household cogeneration units and zero-emission robotic lawn mowers increased, contributing to a slight year-on-year decline in CO2 emissions for power products as a whole.

EuropEan EnvironmEntal rEport 2013 EuropEan EnvironmEntal rEport 20132524
DIRECTION
Mid-term plans
Mid-term plans and results for product-related environmental initiatives
Mid-term plans for product-related environmental initiatives (FY2012 – FY2014)Milestones on the road to 2020
Motorcycles: Launched the PCX150, a next-generation compact scooter equipped with an engine with enhanced durability, quietness, and fuel effi ciency (June 2012) Launched the Super Cub 50 equipped with a high-effi ciency engine that employs extensive low-friction technologies (May 2012)
Automobiles: Launched an Accord for the North American market equipped with a newly developed engine and CVT that realizes top-class fuel effi ciency (September 2012) Launched a Civic for the European market equipped with a diesel engine incorporating extensive effi ciency improvements and weight-reduction technologies (December 2012) Launched a Civic for the South American market that employs the FFV technology Flex One, eliminating the need for a secondary fuel tank (February 2013)
Power products: Launched new gas-powered products to support energy diversifi cation: the EU9i GP propane gas-powered portable generator (August 2012); and the Salad CG FFV300 tiller, which runs on butane gas canisters (March 2013)
Achieve best-in-industry fuel effi ciency and accelerate technology penetration:Motorcycles: Expand use of electronic fuel-injection system (PGM-FI) and low-friction engines, especially in commuter vehiclesAutomobiles: Phase in upgrades to engine and transmission lineups, starting in 2012Power products: Expand application of new electronic self-tuning regulator (STR) governor, developed for the iGX engine
Motorcycles: Continued leasing the EV-neo electric scooter Continued sales of the Kushi, an electric bicycle for the Chinese market
Automobiles: Launched the Accord PHEV (North America, January 2013) and Accord Hybrid (Japan, June 2013) equipped with Sports Hybrid i-MMD Began leasing the Fit EV in Japan (August 2012) and the U.S. (July 2012)
Power products: Launched Miimo, a robotic lawn mower equipped with a lithium-ion battery, in the European market (April 2013)
Establish and deploy next-generation electromotive technologies:Motorcycles: Market electric motorcycles that meet local needs in developed (Japan: leased) and emerging (China) countriesAutomobiles: Launch multiple models (especially compact vehicles) equipped with IMA hybrid technology in Japan; currently developing mid-
size and larger plug-in hybrid and battery electric vehicles, with plans to launch products in Japan and the U.S. and commence production in China in 2012.
Power products: Improve electric lawnmowers and expand lineup through model additions, especially in Europe
●Launch new thin-fi lm solar cell modules with world’s highest module conversion effi ciency and deploy technology globally●Conduct demonstration testing of next-generation personal mobility systems in cities in Japan, the U.S., and China●Through joint-implementation of the E-KIZUNA Project with Saitama City, conduct demonstration testing of the Honda Smart Home System (HSHS) with an aim to cut household CO2 emissions by 50% from 2000 levels by 2015
●Japan: In Saitama Prefecture, began demonstration testing of a house equipped with the Honda Smart Home System (April 2012)● Continued demonstration projects using next-generation personal mobility systems in cities in Japan, the U.S., and China
Products: Continue to promote structural design with an emphasis on weight reduction; higher throughput yields; easier recycling and mainte-nance; and sustainable design with an emphasis on easily recycled materials and use of recycled resins
● Reduced the weight of parts in automobiles by employing tailored blanks and technologies for joining dissimilar metals such as steel and aluminum● Built a system for extracting rare earths from used nickel metal hydride batteries from hybrid vehicles and recycling them as material for new nickel metal hydride batteries
● Continued to promote the management of substances used in products and fi nd alternatives to substances of very high concern● Continued to operate global management systems for substances used in products, to comply with applicable regulations in various countries and reduce risk
Made consistent efforts to reduce exhaust emissions to comply with tighter emissions regulations in various countries
Steadily reduce exhaust emissions to comply with tighter emission regulations in various countries
●Promote management of substances used in products and fi nd alternatives to substances of very high concern●Operate global management systems for substances used in products to comply with applicable regulations in various countries
Climate change and energy
Climate change and energy
Material and water resources
Material and water resources
Substances of concern
Substances of concern
Achieve global targets for reduc-ing average product CO2 emis-sions, with the end goal of steadily reducing product life-cycle emis-sions over the long term
Market new products to reduce CO2 emissions from mobility and other products
Ramp up 3R efforts
Reduce exhaust emissions
Manage substances of concern used in products more strictly
5
6
4
3
2
1
1
2
3
4
5
6
Results of fi scal 2013 initiatives
●Formulating detailed plans for fi scal 2014
In our effort to minimize CO2 emissions and all other environmental impacts stemming from our products, we created a detailed mid-term plan for product-related environmental initiatives through fi scal 2014. By following this plan, we will not only increase the energy effi ciency of our products but also make improvements across their life cycles by practicing sustainable design for improved 3R performance, reducing emissions from products, and carrying out stricter management of substances of concern used in our products.
Recognizing the signifi cant impact that our business activities have on the environment, we likewise formulated a detailed mid-term plan for operations-related environmental initiatives, with the end goal of realizing the Honda Environmental and Safety Vision. By following this plan we will reduce product life-cycle CO2 emissions, reuse and recycle more resources, and strive to minimize water use, among other activities. Believing that these initiatives should cover all our business activities, including our supply chains, we will actively promote environmental management at our suppliers, focusing especially on greenhouse gas emissions.
DIRECTION
Note 1: A single per-unit-of-production value was calculated by weighting the average reduction percentages for motorcycles, automobiles, and power products with the CO2 emissions associated with their respective life cycles.
Note 2: VOC (Volatile Organic Compounds): Organic chemical substances that cause photochemical smog and are commonly used in the solvents of paints and thinners.
Mid-term plans for operations-related environmental initiatives (FY2012 – FY2014)Milestones on the road to 2020
Climate change and energy
Material and water re-sources
Substances of concern
Environmental management
Biodiversity
Strengthen initiatives that span entire product life cycles
Ramp up 3R efforts
Minimize water use
Reduce VOC2 emissions from production processes
Strengthen global/regional promotional frameworks and increase disclosure of environmental data
Local conservation initiatives in accordance with the Honda Biodi-versity Guidelines
Promoted measurement of GHG emissions from suppliers in a broader range of activities covering product life cyclesAsia/Oceania: Deployed the Energy Conservation Caravan to visit suppliers and monitor energy consumption
Transportation modal shifts in each regionSouth America: Began shifting to coastal routes and actively avoiding trucking for the transportation of motorcycles
Promoted use of recycled water and water-conservation activities in each regionAsia/Oceania: Introduced rainwater storage systems
Production domain: Reduce use according to conditions in each region, for example by conserving water and using recycled water in production processes
End-of-life product recycling: ●Make steady efforts to comply with end-of-life vehicle recycling laws in various countries
Continued efforts to comply with the automobile recycling regulations of each country
Sales and services, administration, product development domains: ●Promote energy conservation by encouraging eco-etiquette and more effi cient use of facilities
●Promoted energy conservation through eco-awareness and etiquette-raising activities and improvements in equipment use●Installed high-effi ciency devices (LED lighting, compressors, HVAC systems, IPM motors)
North America: Increased the number of participants in the Green Dealer program launched the previous year and enhanced program development
Transportation domain: ●Increase transportation effi ciency in each region by implementing modal shifts, deploying more fuel-effi cient trucks, etc.
Production domain: ●Install cutting-edge environmental technologies at Yorii Plant (production scheduled to begin in 2013) and make preparations to deploy the technologies globally●Set benchmarks for energy use and set higher effi ciency standards
Used energy use monitoring of each production process to make the production system more effi cientAsia/Oceania: Made progress in switching from diesel generators to natural gas cogeneration systems
Purchasing domain:●Promote measurement and reduction of suppliers’ GHG emissions under the revised Green Purchasing Guidelines
Production domain: ●Strengthen resource-use-reduction initiatives by increasing throughput yields to reduce by-products ●Collaborate with suppliers to increase use of metal scraps ●Maintain zero landfi ll waste performance (Japan and Europe)
●Started using low-VOC coatings in coating processes●Used low-VOC coatings for prototype models in product development
North America: Introduced new processing equipment to reduce VOC emissions in the bumper coating process
Production domain: Develop VOC-emissions-reduction technologies for coating processes and expand application to overseas facilities and motorcycle coating processes
Conducted biodiversity surveys at business sites in Japan
Corporate initiatives: ●Educate suppliers on the destructive impacts of hazardous substances and water use on ecosystemsCollaboration with local communities: ●Conduct biodiversity surveys at business sites in Japan●Develop policies, guidelines, and practical know-how at each business site ●Assess possibilities of introducing biodiversity initiatives at overseas business sites
Convened Regional Environmental Committees and trained environmental offi cers in all regions
Strengthen independent, voluntary promotional frameworks in each region, and strengthen global collaboration
Issued a fi scal 2013 regional environmental report in each region (North America, South America, Europe, Asia & Oceania, China, and Japan)
Expand Honda Environmental Annual Report into a global report, and increase disclosure of environmental data in each region
Global operations: Reduce CO2 emissions per unit of production by 5% by FY2014 (baseline: FY2009)1
Reduced average per-unit CO2 emissions by 7% in FY2013 (baseline : FY2009)
●Implemented measures to improve throughput yields in the design stage●Increased use of stamping press scrap steel
South America: Promoted sand mold recycling in the storage process
Results of fi scal 2013 initiatives
Climate change and energy
Substances of concern
Environmental management
Biodiversity
Material and water re-sources
1
2
3
4
5
6
7
8
9
10
11
12
1
2
3
4
5
6
7
8
9
10
11
12
Mid-term plans and results for operations-related environmental initiatives

EuropEan EnvironmEntal rEport 2013 EuropEan EnvironmEntal rEport 20132726 EuropEan EnvironmEntal rEport 201327
Always conscious of the environmentalimpact of its manufacturing operations,Honda is working hard to takeenvironmental responsibility to everhigher levels around the world throughoperating management systems in sixregions worldwide.
EuropEan EnvironmEntal rEport 201327
GLOBALGLOBALGLOBALGLOBALGLOBALGLOBALGLOBAL
EuropEan EnvironmEntal rEport 201326

EuropEan EnvironmEntal rEport 2013 EuropEan EnvironmEntal rEport 20132928
Environmental management promotion structure
The PDCA cycle of eco-conservation activities
DivisionsWorld Environment andSafety Committee
P
DC
A
Mid-term environmental policies/plans
Detailed plans/actions
Regional environmentalcommittees
Note: For information on safety initiatives, see the Honda CSR Report and Honda Driving Safety Promotion Activities.
●●●
Asia/Oceania Environmental Committeet China Environmental Committee
Business
Region
Customer service / Function
Japan Environmental Committee
North America Environmental Committee
South America Environmental Committee
European Environmental Committee
Regional Operations (Japan)
Regional Operations(North America)
Regional Operations (South America)
Regional Operations (Europe/CIS/Middle East/Africa)
Regional Operations (Asia/Oceania)
Regional Operations (China)
Automobile Operations Power product Operations
Customer service Operations
Business support Operations
Business management Operations Production Operations
Honda R&D Co., Ltd.
Motorcycle Operations
Purchasing Operations
Honda Engineering Co., Ltd.
Environment and Safety Planning Offi ce
Secretariat
World Environment and Safety Committee
Corporate Communications Division
Green Factory Promotion Center
Honda’s organizational structure for environmental affairs
as of June 2013
Honda has created an institutional framework to put into practice the environmental principles articulated in the Honda Environment Statement, and has expanded it to the global level.We are actively working to build environmental management systems at all business sites and obtain ISO 14001 certifi cation at certain sites.
Global Environmental Management
Organizational structure
In December 1991, Honda created what is now the Japan Environmental Committee and assigned it a central role in governing the environmental affairs of the company. This structure has been expanded into a global environmental management system with regional environmental committees in North America, South America, Europe, Asia & Oceania, and China. In March 1995, the World Environment and Safety Committee was established to manage environmental as well as safety initiatives (see note), through which Honda aims to create a motorized society that is safe for all people. The World Environment and Safety Committee discusses, determines, and reviews annual plans for implementing environmental conservation activities at the global level based on mid-term business plans, and has created an environmental management system that integrates activities on the global level with those on the factory fl oor. The company’s president and CEO currently chairs the committee, a refl ection of Honda’s recognition that environmental issues, especially climate change and energy, are critical to Honda’s business operations.
The World Environment and Safety Committee develops mid-term policies and plans for global environmental initiatives based on mid-term policies and management plans determined by the Management Council. Individual divisions prepare detailed plans for each region and business area, and then fi nalize the overall plans after discussion and approval by the regional environmental committees.
The regional environmental committees discuss and evaluate annual achievements under the plans and, based on the results, create new targets and plans with the objective of achieving mid-term policies and plans. The progress of environmental initiatives by Honda Group companies, as well as themes affecting multiple domains around the world, are reported to the World Environment and Safety Committee and then factored into the next year’s annual plans and the next mid-term business plans and policies. Honda follows the Plan-Do-Check-Act cycle to promote continuous improvement in environmental performance in each region: Japan, North America, South America, Europe, Asia/Oceania, and China.
One hallmark of this system is that planning and implementation are not simply delegated to specialized staff, but that all associates are expected to be involved. The basic thinking is that all associates should be actively tackling environmental issues as a part of their daily work.
GLOBAL
Europe 19 companies Japan
42 companies
China 25 companies
Asia/Oceania 45 companies
North America 28 companies
South America 10 companies
ISO 14001-certifi cation status worldwide (as of March 31, 2013)
Note: Includes facilities of Honda Motor Co., Ltd. and its major consolidated subsidiaries and affi liated companies.
Honda Conduct Guidelinehttp://world.honda.com/conductguidelin
Environmental management at Honda business sites
Regulatory compliance
In accordance with the Honda Environment Statement, Honda introduces environmental management systems at all business sites and in each division, promotes continuous efforts to improve environmental performance, and strives to comply with voluntary environmental standards that are more stringent than national and regional regulations.
We revised the Honda Conduct Guidelines in April 2013 (formulated 2010) and are implementing it throughout the Honda Group in Japan and worldwide. The document calls on Honda associates to comply with laws and regulations, company rules, and social norms and, for the purposes of environmental conservation, to strive to
Along with development of environmental management systems at the group-wide level, we have been introducing such systems at each business site in order to continuously improve their environmental performance and to control environmental pollutants. We have been working actively to acquire ISO 14001, an international certifi cation for environmental management, particularly at our production facilities.
After acquiring certifi cation at each of our fi ve major production facilities in Japan, we combined their certifi cation for integrated operation of their management systems. Going forward, we plan to promote acquisition and expand our integrated system to include environmental management of the Saitama Factory’s Yorii Plant, newly
reduce environmental impacts in one’s work by conserving and recycling resources and energy in accordance with environmental laws and regulations, company policies, and internal standards. We have appointed corporate directors to serve as Compliance Offi cers, and work systematically to enhance compliance and risk management under the supervision of directors in charge of each part of the organization.
Emergency protocols
In anticipation of accidents and emergencies that could cause environmental pollution, each factory and division has clearly-defi ned procedures for preventing pollution.
completed in March 2013. We also combined the certifi cation registration for Honda head offi ce buildings and district buildings in fi scal 2012.
We will continue developing our environmental management systems and seeking ISO 14001 certifi cation (or in Europe, EMAS). We will continue working to ensure that business sites with certifi ed environmental management systems remain certifi ed, and also continue to apply the PDCA cycle at each site for continuous improvement in reducing the environmental impact of our operations.
GLOBAL

EuropEan EnvironmEntal rEport 2013 EuropEan EnvironmEntal rEport 20133130
●Breakdown and changes in Honda GHG emissions
Disclosure of total GHG emissions
Scope 3, category 11
Scope 3other categories
Scope 3, other categories
Scope 1
Scope 1
〈GHG emissions〉
200,000,000 t-CO2e
FY2012 FY2013
Scope 2
Scope 2
16.3%1.3%
0.5% 225,060,000 t-CO2e
275,910,000 t-CO2e
275,910,000 t-CO2eFY2013
Scope 3, category 1181.9%
*See notes on page 45 for detailed descriptions of scope 1, scope 2, scope 3, and category 11 of scope 3.
●GHG emissions from the entire Honda value chain
FY2012 FY2013
Scope 1*direct emissions from Honda business activities 1,240,000 t-CO2e 1,410,000 t-CO2e
indirect emissions from energy useScope 2* 2,960,000 t-CO2e 3,540,000 t-CO2e
other indirect emissionsScope 3* 220,860,000 t-CO2e 270,960,000 t-CO2e
Emissions from entire value chain (total of scope 1, 2, and 3) 225,060,000 t-CO2e 275,910,000 t-CO2e
Other totals:
All emissions from Honda business activities (scopes 1, 2) 4,200,000 t-CO2e 4,950,000 t-CO2e
Emissions from use of sold products (scope 3, category 11*) 195,880,000 t-CO2e 225,950,000 t-CO2e
Organizational structureAs a responsible company operating in the mobility industry, Honda believes in the importance of calculating and disclosing greenhouse gas (GHG) emissions in order to drive progress in initiatives to reduce global emissions.
As the first milestone in this endeavor, in August 2012 Honda became the world’s first mobility company to disclose estimates of all GHG emissions from its entire value chain in conformity with the Greenhouse Gas Protocol (GHG Protocol)1, currently the world’s most widely used GHG emissions accounting standard. Honda released estimates of not only emissions from our own business activities (scope 1 and 2), but also all upstream and downstream activities (scope 3), from the procurement of raw materials, to the transportation and customer use of Honda products, and finally to the treatment of end-of-life products2
Now we are taking steps to get a more accurate reading of the emissions that come from our entire value chain. We are doing this by expanding the boundaries of data collection3 and improving the accuracy of calculation methods used for categories that account for the largest percentage of scope 3 emissions (other indirect emissions).
As a result, the latest calculations show that GHG emissions from Honda business activities in fiscal 2013 were 4,950,000 t-CO2e, and total value chain emissions, which also includes other indirect emissions, were 275,910,000 t-CO2e.
We hope to leverage these improvements in data measurement and management to devise more effective emission reduction strategies.
GLOBAL
2009
2008(年度)
(年度)
(年度)
(年度)
(年度)
(年度)
20,700
19,400
00,000
00,000
21,700
20,300
00,000
19,700
00,000
2010
2011
2012
直接エネルギー消費量
2009
2008
2010
2011
2012
間接エネルギー消費量
0 5,000 10,000 15,000 20,000 25,000
(単位:TJ)
(単位:万t-CO2換算)
(単位:千㎥)
(単位:t)
(単位:t)
2010
2009
2008
2011
2012
2010
2009
2008
2011
2012
直接排出量
間接排出量
0 50 100 150 200 300250
133
131
000
124
000
300
296
000
277
000
発生量
社外埋立量2010
2011
2012
2011
2012
2009
2008
0 10,000 20,000 30,000 40,000
0 300,000 600,000 1,200,000 1,500,000900,000
32,100
38,000
00,000
26,200
00,000
1,210,000
0,000,000
2010
2009
2008
1,280,000
0,000,000
0,000,000
2011
2012
2010
2009
2008
0 10,000 20,000 30,000 40,000
34,400
33,800
00,000
30,100
00,000
020406080100120(%)
020406080100120(%)
SOx
0 200 400 800 1,000600
000
NOx 000
20,900
(単位:千㎥)
2010
2009
2008
2011
2012
2010
2009
2008
2011
2012
使用料
排水量
0 00 000 000 000 000000
000
000
000
000
000
000
000
000
000
000
2000年100%
CO2排
出量
Baseline100
Baseline100
2005 CB400SF
32
Super Cub 50
70
Integra
44
PCX150
■ Raw materials ■ Production ■ Use ■ Sales/service ■ Disposal ■ Transportation
■ Raw materials ■ Production ■ Use ■ Sales/service ■ Disposal ■ Transportation
2006 Civic
82
CR-Z
122
Stepwgn
67
N-ONE
LCA results for major automobile models released in FY2013 (Japan)
2009
2008(年度)
(年度)
(年度)
(年度)
(年度)
(年度)
20,700
19,400
00,000
00,000
21,700
20,300
00,000
19,700
00,000
2010
2011
2012
直接エネルギー消費量
2009
2008
2010
2011
2012
間接エネルギー消費量
0 5,000 10,000 15,000 20,000 25,000
(単位:TJ)
(単位:万t-CO2換算)
(単位:千㎥)
(単位:t)
(単位:t)
2010
2009
2008
2011
2012
2010
2009
2008
2011
2012
直接排出量
間接排出量
0 50 100 150 200 300250
133
131
000
124
000
300
296
000
277
000
発生量
社外埋立量2010
2011
2012
2011
2012
2009
2008
0 10,000 20,000 30,000 40,000
0 300,000 600,000 1,200,000 1,500,000900,000
32,100
38,000
00,000
26,200
00,000
1,210,000
0,000,000
2010
2009
2008
1,280,000
0,000,000
0,000,000
2011
2012
2010
2009
2008
0 10,000 20,000 30,000 40,000
34,400
33,800
00,000
30,100
00,000
020406080100120(%)
020406080100120(%)
SOx
0 200 400 800 1,000600
000
NOx 000
20,900
(単位:千㎥)
2010
2009
2008
2011
2012
2010
2009
2008
2011
2012
使用料
排水量
0 00 000 000 000 000000
000
000
000
000
000
000
000
000
000
000
2000年100%
CO2排
出量
Baseline100
Baseline100
2005 CB400SF
32
Super Cub 50
70
Integra
44
PCX150
■ Raw materials ■ Production ■ Use ■ Sales/service ■ Disposal ■ Transportation
■ Raw materials ■ Production ■ Use ■ Sales/service ■ Disposal ■ Transportation
2006 Civic
82
CR-Z
122
Stepwgn
67
N-ONE
LCA results for major motorcycle models released in FY2013 (Japan)
●Scope 1: Direct GHG emissions from business activities, as defined by the GHG Protocol (examples: combustion of fuel oil at a manufacturing plant, emissions from work vehicles and company cars). The scope 1 figures presented in this report include all GHGs emitted directly by Honda Motor Co. and its 461 consolidated subsidiaries and affiliated companies worldwide.
●Protocol 2: Indirect GHG emissions from a company’s use of energy, as defined by the GHG Protocol (examples: electrical energy used by a manufacturing plant or office). The scope 2 figures presented in this report include all GHGs emitted directly by Honda Motor Co. and its 461 consolidated subsidiaries and affiliated companies worldwide.
●Scope 3: Other indirect GHG emissions not included in scope 1 and scope 2, as defined by the GHG Protocol. Scope 3 is systematically broken down into 15 categories (examples: category 11 includes emissions arising from the use of sold products; category 12 includes emissions arising from the end-of-life treatment of sold products).
●The category 11 figures presented in this report represent the cumulative amount of greenhouse gases that will have been emitted by products sold by Honda in fiscal 2012 (automobiles, motorcycles, power products) as a result of their use by customers from the time they received those products until they dispose of them in the future. The “scope 3, other categories” figures presented in this report are the sum of emissions from categories 1, 2, 3, 4, 5, 6, 7, 10, 12, and 15. As per the GHG Protocol, Honda excludes categories 8, 13, and 14 from its calculations, as these categories are either not part of Honda business activities or emissions from these categories are accounted for in other categories.
*Honda’s model-specific LCA system assumes a product lifetime driving distance of 100,000 km for automobiles and 50,000 for motorcycles. These figures are different from those assumed for scope 3, category 11 emissions under the GHG Protocol.
FY2012 FY2013 FY2014 FY2015
●Total GHG emissions● From growth to decline
Cont inue reduct ion efforts to reach zero
Emissions from Honda operations: Conceptual projection
FY20××
Promoting lifecycle assessment (LCA)
We have been developing our own methods to reduce the environmental impacts of our business activities and across product life cycles, from production through disposal.In March 2002, we built the Honda Life-Cycle Assessment (LCA) Data System, a system for measuring CO2 emissions from all business activities, and since then have been making focused efforts to meet reduction targets set for each domain—production, purchasing, sales and services, administration, transportation, and so forth.In fiscal 2007, we began operating a new, model-specific LCA system for calculating the life-cycle emissions of a single vehicle, from the procurement of raw materials through disposal. The LCA data of each product model obtained through this system is being used to develop more effective strategies for reducing life-cycle emissions.
Reducing GHG emissions from use of sold products
Scope 3, category 11 emissions, emissions from use ofproducts sold to our customers, accounted for more than80% of emissions that took place across our value chain. This means that determining how to reduce GHG emissions from the use of Honda products poses the greatest challenge to reducing total emissions.The biggest step in reducing emissions from product useis improving fuel efficiency. We set a 2020 target to reduceglobal average product CO2 emissions by 30% from 2000levels, based on which we will strive to improve product fuelefficiencies year after year.
During this time, however, we still expect our scope 3,category 11 emissions to continue growing. Productiongrowth, which follows global economic growth, particularlyin Asia, is occurring at a faster rate than improvements infuel efficiency, so the net effect will be an increase in GHGemissions.
But still, at some point we need to turn this growth curvedownward. Honda’s vision is to reach a point where totalemissions from product use are declining even as production is expanding. To achieve that turnaround, we set our own standards called the Honda Environmental Performance Standards (HEPS).The goal is eventually to reduce environmental impacts tozero, an initiative we call Triple Zero. Along with HEPS wedeveloped scenarios that represent the steps we plan to take in reducing GHG emissions by complying with the standards, including improving product fuel efficiency and increasing use of renewable energy.
GLOBAL

EuropEan EnvironmEntal rEport 2013 EuropEan EnvironmEntal rEport 20133332
The thinking behind scope 3, category 11 (emissions from product use)
Scope 3, category 11 accounts for more than 80% of all CO2 emissions that occur in Honda’s value chain. The reason category 11 is so large is because it includes not only the CO2 that Honda products sold in fi scal 2013 emitted in fi scal 2013, but also the CO2 those products will emit in the future. In other words, when a customer in Japan purchases a Honda vehicle, we expect that customer to drive the vehicle 10,000 km a year for 15 years*1. Scope 3, category 11 is where we calculate all the CO2 that will be emitted during that time.Scope 3 includes future emissions because it is based on an accounting method that counts emissions not when they occur but when the business activities that will result in those emissions occur. The 26 million automobiles, motorcycles, and power products that Honda sold to customers around the world in fi scal 2013 will continue emitting CO2 as they are used and until they are disposed of at some point in the future. Scope 3 says that these emissions are the result of Honda having sold its products in fi scal 2013.
● Environmental conservation expenditures in Japan
Expanding environmental accounting worldwide
Product life cycle
2012 2013 2014 2015
FY2013April 1, 2012-March31, 2013
Greenhouse gas emissions occur in every stage of a product’s life cycle, from the extraction of raw materials to the end-of-life treatment (recycling, disposal) of the product.
Scope 3, category 11 (product use) emissions in fiscal 2013 are all GHG emissions that will result from the use of Honda products sold in fiscal 2013 until their end-of-life treatment sometime in the future.
Raw material extraction
Scope 3, Category 1
Scope 3, Category 4
Scope 3, Category 9
Scope 3, Category 12
Scope 3, Category 11
Scope 1 and 2
Raw material transport
Production
Sales
End-of-life treatment
Product used by customer (Japan: 10,000 km/yr × 15 years)
*1 Annual distance traveled, product lifetime in years: Based on the WBCSD's SMP Model developed by the International Energy Agency
2. International guidelines issued by the Global Reporting Initiative (GRI) to promote concrete action for environmental, social, and economic progress. At the end of this report is an index specifying the pages in this report where the general standard disclosures and environmental performance indicators required by the guidelines can be found.
Expenditures (million yen)
2,352 1,102
6,301
4
186,513
196,272
Investments(million yen)
2,285
254
564
0
16,456
19,559
Emissions treatment
Waste disposal
Environmental management
Remediation
Prevention
Total
Honda discloses information on the emissions treatment,waste disposal, environmental management, remediationand prevention as well as the overall environmentaleffi ciency of our business in order to advance environmentalmanagement on a practical level and realize ourenvironmental vision. These data serve not only as anindicator of corporate value for external stakeholders butalso as a reference for making administrative managementdecisions regarding environmental initiatives.As a result, for fi scal 2013 we are disclosing the environmentalconservation expenditures that were recorded in Japan inthe format suggested by the GRI Guidelines*2, which is thesame format used last year to disclose automobile R&Dexpenditures in North America. These changes have beenmade in an effort to improve the accuracy of data collectedfrom our operating sites worldwide and to determine anappropriate method for disclosing sustainability informationfrom our global operations.
GLOBAL
Environmental data for manufacturing, by region (FY2013)
(FY)
(FY)
(FY)
(FY)
(FY)
19,400
22,900
21,700
20,300
22,300
19,700
2011
2012
2013
Direct energy consumption
2010
2011
2012
2013
Indirect energy consumption
0 5,000 10,000 15,000 20,000 25,000
(TJ)
(1,000 t-CO2 equivalent)
(単位:千㎥)
(1,000 t)
(t)
2011
2010
2012
2013
2011
2010
2012
2013
Direct emissions
Indirect emissions
0 500 1,000 1,500 2,000 4,0003,5002,500 3,000
1,330
1,310
1,240
1,410
3,000
2,960
3,540
2,770
Total waste generated
Waste landfilled
2011
2012
2013
2010
0 10 20 30 40
0 300 600 1,200 1,500900
32
38
26
31
1,210
1,370
2012
2013
2011
2012
2011
2010
1,280
1,150
2011
2012
2010
2009
2008
0 10,000 20,000 30,000 40,000
34,400
33,800
00,000
30,100
00,000
020406080
100120(%)
020406080
100120(%)
NOx
0 200 400 800 1,000600
605
SOx 265
NOx 572
SOx 233
2010 20,700
20,900
(1,000 m3)
2011
2010
2012
2013
2011
2012
2013
Water use
Wastewater volume*
0 5,000 10,000 15,000 40,00020,000
34,400
33,800
30,100
34,300
23,200
20,900
21,100
0 3,000 6,000 9,000 12,000
(年度)
使用量2010
2012
2009
2011
排水量
20102011 7,900
2012 8,000
7,700
2000年100%
CO2排出量
基準機種100
36 2836
CB400SF
(2005年)
○○○○○
76
○○○○ ○○○○○○○○○○
○○○○○
基準機種100
84
117
■ 原材料 ■ 製造 ■ 走行 ■販売・サービス ■廃棄 ■輸送
■原材料 ■製造 ■走行 ■販売・サービス ■廃棄 ■輸送
シビック(2006年)
○○○○○○○○○○
75
○○○○
69
○○○○○○○○○○
○○○○○
(FY)
(FY)
(FY)
(FY)
(FY)
19,400
22,900
21,700
20,300
22,300
19,700
2011
2012
2013
Direct energy consumption
2010
2011
2012
2013
Indirect energy consumption
0 5,000 10,000 15,000 20,000 25,000
(TJ)
(1,000 t-CO2 equivalent)
(単位:千㎥)
(1,000 t)
(t)
2011
2010
2012
2013
2011
2010
2012
2013
Direct emissions
Indirect emissions
0 500 1,000 1,500 2,000 4,0003,5002,500 3,000
1,330
1,310
1,240
1,410
3,000
2,960
3,540
2,770
Total waste generated
Waste landfilled
2011
2012
2013
2010
0 10 20 30 40
0 300 600 1,200 1,500900
32
38
26
31
1,210
1,370
2012
2013
2011
2012
2011
2010
1,280
1,150
2011
2012
2010
2009
2008
0 10,000 20,000 30,000 40,000
34,400
33,800
00,000
30,100
00,000
020406080
100120(%)
020406080
100120(%)
NOx
0 200 400 800 1,000600
605
SOx 265
NOx 572
SOx 233
2010 20,700
20,900
(1,000 m3)
2011
2010
2012
2013
2011
2012
2013
Water use
Wastewater volume*
0 5,000 10,000 15,000 40,00020,000
34,400
33,800
30,100
34,300
23,200
20,900
21,100
0 3,000 6,000 9,000 12,000
(年度)
使用量2010
2012
2009
2011
排水量
20102011 7,900
2012 8,000
7,700
2000年100%
CO2排出量
基準機種100
36 2836
CB400SF
(2005年)
○○○○○
76
○○○○ ○○○○○○○○○○
○○○○○
基準機種100
84
117
■ 原材料 ■ 製造 ■ 走行 ■販売・サービス ■ 廃棄 ■ 輸送
■原材料 ■製造 ■走行 ■販売・サービス ■ 廃棄 ■ 輸送
シビック(2006年)
○○○○○○○○○○
75
○○○○
69
○○○○○○○○○○
○○○○○
(FY)
(FY)
(FY)
(FY)
(FY)
19,400
22,900
21,700
20,300
22,300
19,700
2011
2012
2013
Direct energy consumption
2010
2011
2012
2013
Indirect energy consumption
0 5,000 10,000 15,000 20,000 25,000
(TJ)
(1,000 t-CO2 equivalent)
(単位:千㎥)
(1,000 t)
(t)
2011
2010
2012
2013
2011
2010
2012
2013
Direct emissions
Indirect emissions
0 500 1,000 1,500 2,000 4,0003,5002,500 3,000
1,330
1,310
1,240
1,410
3,000
2,960
3,540
2,770
Total waste generated
Waste landfilled
2011
2012
2013
2010
0 10 20 30 40
0 300 600 1,200 1,500900
32
38
26
31
1,210
1,370
2012
2013
2011
2012
2011
2010
1,280
1,150
2011
2012
2010
2009
2008
0 10,000 20,000 30,000 40,000
34,400
33,800
00,000
30,100
00,000
020406080
100120(%)
020406080
100120(%)
NOx
0 200 400 800 1,000600
605
SOx 265
NOx 572
SOx 233
2010 20,700
20,900
(1,000 m3)
2011
2010
2012
2013
2011
2012
2013
Water use
Wastewater volume*
0 5,000 10,000 15,000 40,00020,000
34,400
33,800
30,100
34,300
23,200
20,900
21,100
0 3,000 6,000 9,000 12,000
(年度)
使用量2010
2012
2009
2011
排水量
20102011 7,900
2012 8,000
7,700
2000年100%
CO2排出量
基準機種100
36 2836
CB400SF
(2005年)
○○○○○
76
○○○○ ○○○○○○○○○○
○○○○○
基準機種100
84
117
■ 原材料 ■ 製造 ■ 走行 ■販売・サービス ■廃棄 ■輸送
■原材料 ■製造 ■走行 ■販売・サービス ■廃棄 ■輸送
シビック(2006年)
○○○○○○○○○○
75
○○○○
69
○○○○○○○○○○
○○○○○
Energy consumption
Waste generated, landfi lled
Companies covered:Nearly all consolidated subsidiaries and affi liated companies of the Honda GroupNotes:• Greenhouse gas emissions were calculated while referring mainly to the WRI
and WBCSD’s 2004 "The Greenhouse Gas Protocol (Revised Edition)." • Calculations based mainly on emissions from stationary sources.
Companies covered:Nearly all consolidated subsidiaries and affi liated companies of the Honda GroupNotes:• Purchased electricity has been converted to joules using the international standard 3.6 GJ/MWh.
• Calculations based mainly on energy consumed by stationary sources.• A terajoule (TJ) is a unit of energy, "tera" meaning 1012.
Greenhouse gas emissions
Companies covered:Nearly all consolidated subsidiaries and affi liated companies of the Honda Group*Disclosure of wastewater volume begun in fi scal 2011.
Companies covered: Nearly all consolidated subsidiaries and affi liated companies of the Honda Group
Notes:• Landfi lled amounts for waste outside Japan also include other waste treatment methods• Figures for Japan indicate amounts actually brought to landfi lls.
Water use, wastewater volume
(FY)
(FY)
(FY)
(FY)
(FY)
19,400
22,900
21,700
20,300
22,300
19,700
2011
2012
2013
Direct energy consumption
2010
2011
2012
2013
Indirect energy consumption
0 5,000 10,000 15,000 20,000 25,000
(TJ)
(1,000 t-CO2 equivalent)
(単位:千㎥)
(1,000 t)
(t)
2011
2010
2012
2013
2011
2010
2012
2013
Direct emissions
Indirect emissions
0 500 1,000 1,500 2,000 4,0003,5002,500 3,000
1,330
1,310
1,240
1,410
3,000
2,960
3,540
2,770
Total waste generated
Waste landfilled
2011
2012
2013
2010
0 10 20 30 40
0 300 600 1,200 1,500900
32
38
26
31
1,210
1,370
2012
2013
2011
2012
2011
2010
1,280
1,150
2011
2012
2010
2009
2008
0 10,000 20,000 30,000 40,000
34,400
33,800
00,000
30,100
00,000
020406080
100120(%)
020406080
100120(%)
NOx
0 200 400 800 1,000600
605
SOx 265
NOx 572
SOx 233
2010 20,700
20,900
(1,000 m3)
2011
2010
2012
2013
2011
2012
2013
Water use
Wastewater volume*
0 5,000 10,000 15,000 40,00020,000
34,400
33,800
30,100
34,300
23,200
20,900
21,100
0 3,000 6,000 9,000 12,000
(年度)
使用量2010
2012
2009
2011
排水量
20102011 7,900
2012 8,000
7,700
2000年100%
CO2排出量
基準機種100
36 2836
CB400SF
(2005年)
○○○○○
76
○○○○ ○○○○○○○○○○
○○○○○
基準機種100
84
117
■ 原材料 ■ 製造 ■ 走行 ■販売・サービス ■廃棄 ■輸送
■原材料 ■製造 ■走行 ■販売・サービス ■廃棄 ■輸送
シビック(2006年)
○○○○○○○○○○
75
○○○○
69
○○○○○○○○○○
○○○○○
Companies covered:Nearly all consolidated subsidiaries and affi liated companies of the Honda Group
Notes:• Calculations based on fuel consumption.
Atmospheric pollutants
Note: LNG is not included.
Japan
1,560
85
806
8
0
414,000
3,590
4,400
50
N. America
1,820
6,410
273
301
6,700
394,000
3,130
2,110
90
S. America
322
240
336
41
1,300
66,000
210
1,730
80
Europe
151
526
7
7
0
47,000
660
10
0
Asia/Oceania
1,020
1,200
1,260
1,690
3,900
188,000
5,850
3,440
20
China
590
893
296
98
16,400
110,000
4,120
0
0
Purchased electricity
Natural gas
Liquefi ed petroleum gas
Diesel
Landfi lled waste
Volume recycled
Municipal water
Groundwater
Rainwater
Energy
Waste
Water use
(1,000 MWh)
(1,000 GJ●
(1,000 GJ)
●1,000 GJ●
●t●
●t●
●1,000 ●●
●1,000 ●●
●1,000 ●●
Japan N. America S. America Europe Asia/Oceania China
Global Environmental Impact
GLOBAL

EuropEan EnvironmEntal rEport 2013 EuropEan EnvironmEntal rEport 20133534
GLOBAL
EuropEan EnvironmEntal rEport 201335
This covers all entities that are controlled by the Regional Operation Board of the European region. This includes all sites in Europe, Near Middle East, Africa and Russia in which Honda (globally or locally) has a signifi cant participation.
EuropEan EnvironmEntal rEport 201335
HONDA IN HONDA IN HONDA IN HONDA IN HONDA IN HONDA IN HONDA IN EUROPEAN REGIONEUROPEAN REGIONEUROPEAN REGIONEUROPEAN REGIONEUROPEAN REGIONEUROPEAN REGIONEUROPEAN REGION
EuropEan EnvironmEntal rEport 201334
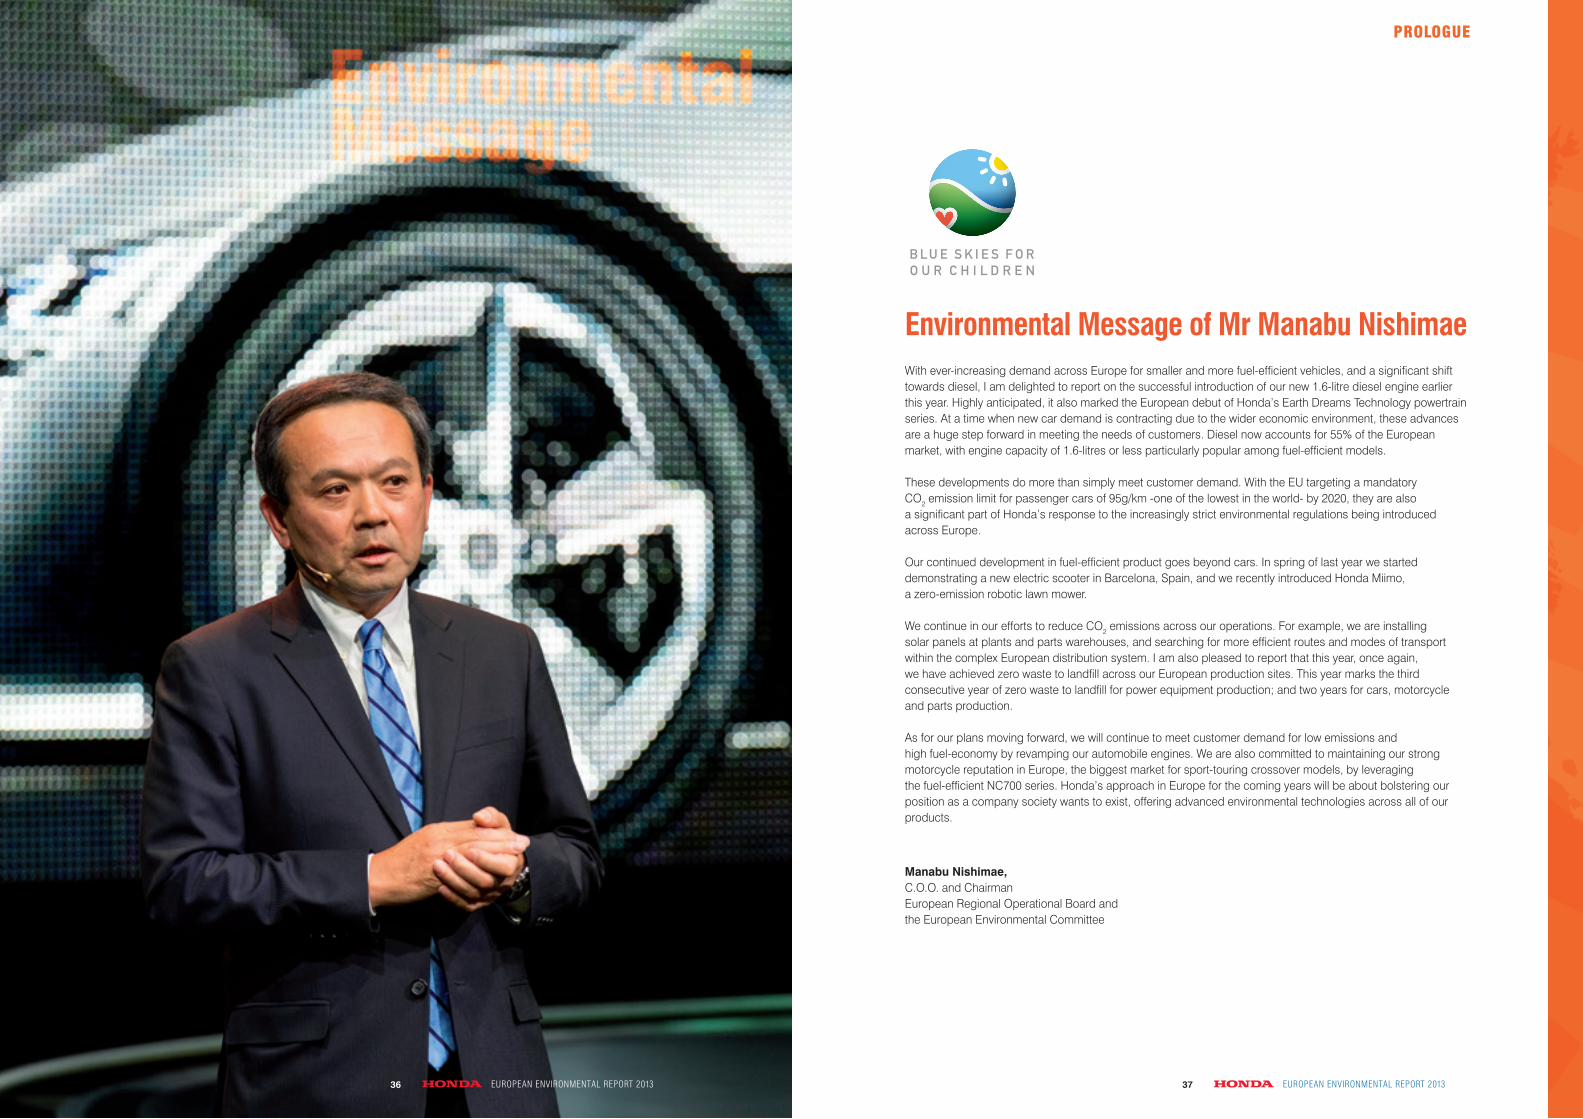
EuropEan EnvironmEntal rEport 2013 EuropEan EnvironmEntal rEport 20133736
With ever-increasing demand across Europe for smaller and more fuel-efficient vehicles, and a significant shift towards diesel, I am delighted to report on the successful introduction of our new 1.6-litre diesel engine earlier this year. Highly anticipated, it also marked the European debut of Honda’s Earth Dreams Technology powertrain series. At a time when new car demand is contracting due to the wider economic environment, these advances are a huge step forward in meeting the needs of customers. Diesel now accounts for 55% of the European market, with engine capacity of 1.6-litres or less particularly popular among fuel-efficient models. These developments do more than simply meet customer demand. With the EU targeting a mandatory CO2 emission limit for passenger cars of 95g/km -one of the lowest in the world- by 2020, they are also a significant part of Honda’s response to the increasingly strict environmental regulations being introduced across Europe.
Our continued development in fuel-efficient product goes beyond cars. In spring of last year we started demonstrating a new electric scooter in Barcelona, Spain, and we recently introduced Honda Miimo, a zero-emission robotic lawn mower.
We continue in our efforts to reduce CO2 emissions across our operations. For example, we are installing solar panels at plants and parts warehouses, and searching for more efficient routes and modes of transport within the complex European distribution system. I am also pleased to report that this year, once again, we have achieved zero waste to landfill across our European production sites. This year marks the third consecutive year of zero waste to landfill for power equipment production; and two years for cars, motorcycle and parts production.
As for our plans moving forward, we will continue to meet customer demand for low emissions andhigh fuel-economy by revamping our automobile engines. We are also committed to maintaining our strong motorcycle reputation in Europe, the biggest market for sport-touring crossover models, by leveraging the fuel-efficient NC700 series. Honda’s approach in Europe for the coming years will be about bolstering our position as a company society wants to exist, offering advanced environmental technologies across all of our products.
Environmental Message of Mr Manabu Nishimae
Manabu Nishimae, C.O.O. and Chairman European Regional Operational Board and the European Environmental Committee
PROLOGUE
EuropEan EnvironmEntal rEport 201336
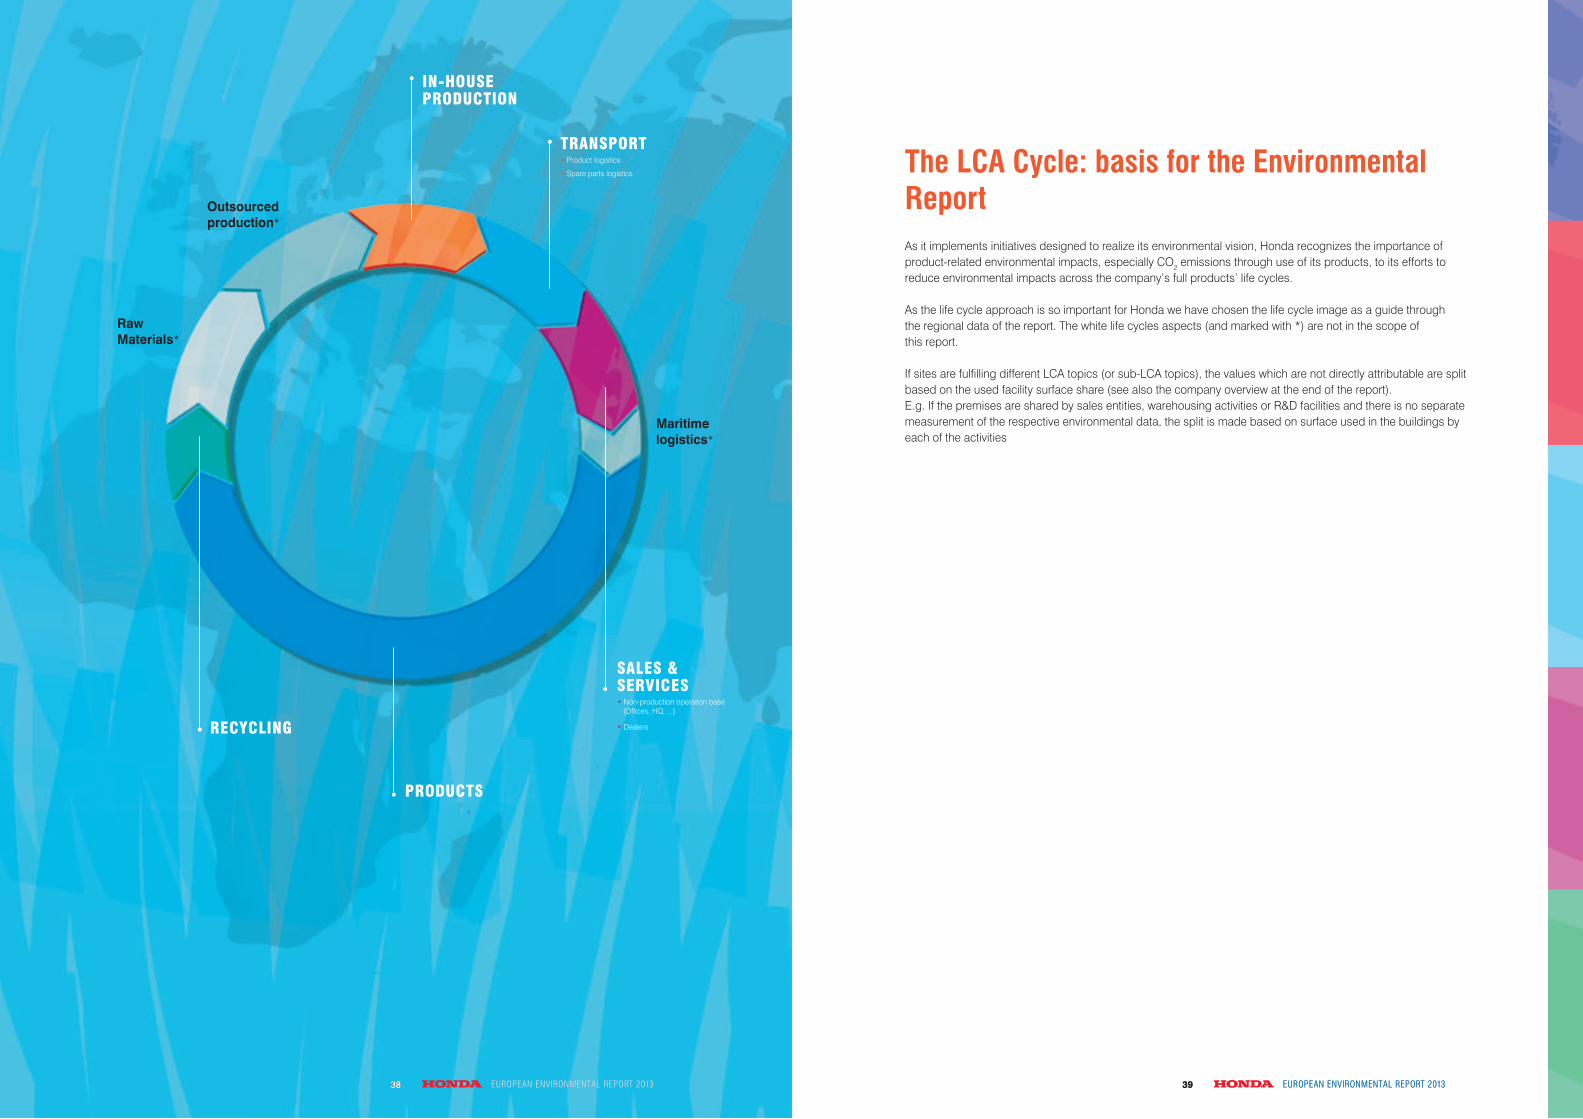
EuropEan EnvironmEntal rEport 201339EuropEan EnvironmEntal rEport 201338 EuropEan EnvironmEntal rEport 201338
PRODUCTS
RECYCLING
SALES &SERVICES
IN-HOUSE PRODUCTION
TRANSPORTThe LCA Cycle: basis for the Environmental ReportAs it implements initiatives designed to realize its environmental vision, Honda recognizes the importance of product-related environmental impacts, especially CO2 emissions through use of its products, to its efforts to reduce environmental impacts across the company’s full products’ life cycles.
As the life cycle approach is so important for Honda we have chosen the life cycle image as a guide through the regional data of the report. The white life cycles aspects (and marked with *) are not in the scope of this report.
If sites are fulfi lling different LCA topics (or sub-LCA topics), the values which are not directly attributable are split based on the used facility surface share (see also the company overview at the end of the report).E.g. If the premises are shared by sales entities, warehousing activities or R&D facilities and there is no separate measurement of the respective environmental data, the split is made based on surface used in the buildings by each of the activities
EuropEan EnvironmEntal rEport 201339
Raw Materials*
Outsourced production*
Maritime logistics*
• Product logistics
• Spare parts logistics
• Non-production operation base (Offi ces, HQ, ...)
• Dealers

EuropEan EnvironmEntal rEport 2013 EuropEan EnvironmEntal rEport 20134140
In order to constantly evaluate the environmental performance of all products under one framework, Honda has introduced the HEPS criteria. HEPS categorises three types of product which contribute towards Honda’s ongoing efforts to reduce full life-cycle CO2 emissions, as follows:
• Hi-effi ciency products: effi ciency improvement technologies for internal combustion engines• Innovative products: environmental-innovation and energy diversifi cation technologies• Revolutionary products: renewable energy technologies
* not all of these models are commercially available
Product-based scenarios for addressing climate change and energy issues:
Based on this defi nition we count 58 Honda models coming under one of these categories for Europe. Samples of those models can be found hereafter.*
Honda Environmental Performance Standards (HEPS)
Earth Dreams technology, implemented mainly in cars, generated a high number of models in the categories ‘hi effi ciency’ and ‘innovative’. The FCX-Clarity, available in Europe in test mode mean that cars are also represented in the category ‘revolutionary products’.
Samples of 2012 Cars
average Co2 EmissionsOnce again overall CO2 emissions across Car have fallen, due to continued development in more effi cient products, most notably the introduction of the new-generation engine series, Earth Dreams Technology (please see below). The number of models falling under the HEPS criteria remains unchanged from the last two previous years, but market demand for more effi cient models continues to increase.
Cars
Civic 5Dr
Accord
Jazz
Insight
Jazz Hybrid
FCX Clarity
Hi Efficient Products Innovative products Revolutionary Products
1
Providing more fuel-effi cient technologies in cars and offering a model range based on the market demand, the CO2 emission of the sold vehicles could be reduced year-on-year. Achievement of this target was linked to our achievement of this target was linked to our hybrid cars with IMA* technology and especially to the sales of Honda diesel engine models
0 %
1 %
2 %
3 %
4 %
5 %
6 %
7 %
8 %
2008 2009 2010 2011
2009 2010 2011 2012
2012
CO2 in g/km
136
138
140
142
144
146
148
150
152
154
156
Car Models per HEPS Category
0
2
4
6
8
10
12
14
16
Motorcycle Models per HEPS Category
0
2
4
6
8
10
12
14
16
2010 2011 2012
2010 2011 2012
2010 2011 2012
Power Equipment Models per HEPS Category
0
5
10
15
20
25
30
35
13
14
45
1010 10
33 3
11 1
11
2
1
1
16
13
1
16
12
2
% Replaced bumpers to Recycling
PRODUCTS
Fossil fuel use Diversified energy use
Life-cycle CO2 emissions
Renewable energy use Energy management technologies
Evolution of energy technologies
Hi Efficient Products
Innovative Products
Revolutionary Products
RECYCLING
PRODUCTS
IN-HOUSE PRODUCTION
SALES & SERVICES
TRANSPORT
Revolutionary
Innovative
High Effi ciency
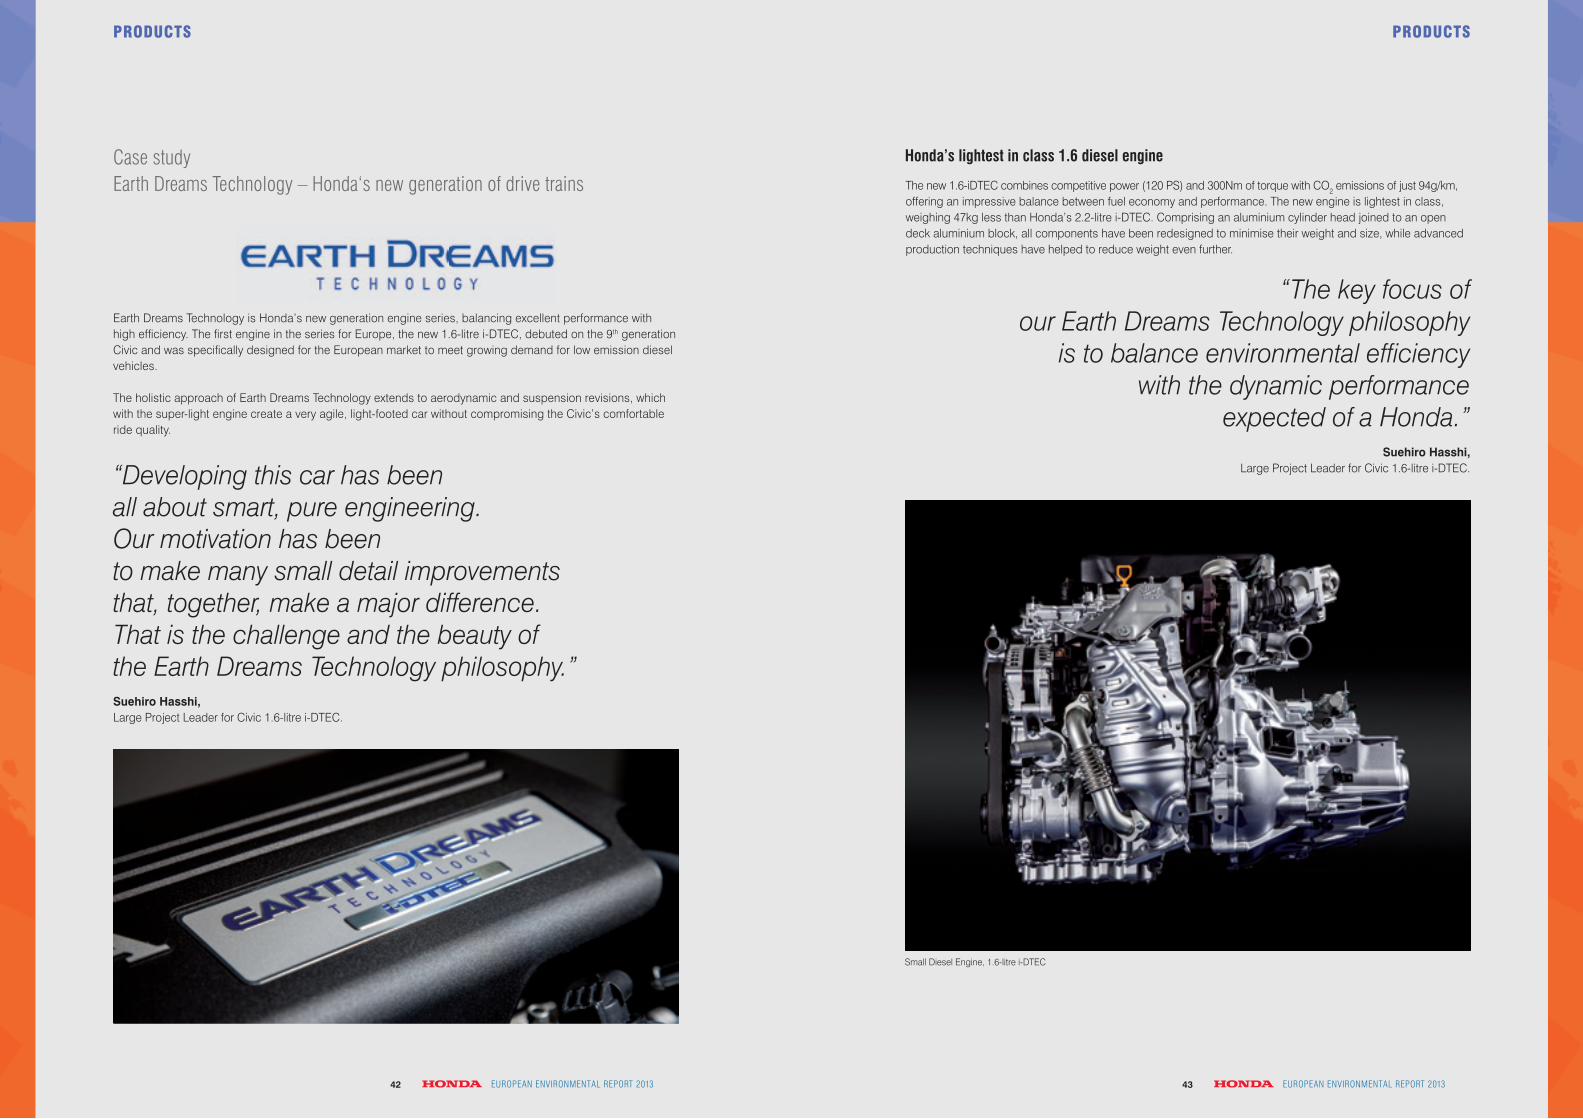
EuropEan EnvironmEntal rEport 2013 EuropEan EnvironmEntal rEport 20134342
Earth Dreams Technology is Honda’s new generation engine series, balancing excellent performance with high effi ciency. The fi rst engine in the series for Europe, the new 1.6-litre i-DTEC, debuted on the 9th generation Civic and was specifi cally designed for the European market to meet growing demand for low emission diesel vehicles.
The holistic approach of Earth Dreams Technology extends to aerodynamic and suspension revisions, which with the super-light engine create a very agile, light-footed car without compromising the Civic’s comfortable ride quality.
Case study Earth Dreams technology – Honda‘s new generation of drive trains
Suehiro Hasshi, Large Project Leader for Civic 1.6-litre i-DTEC.
“Developing this car has been all about smart, pure engineering. Our motivation has been to make many small detail improvements that, together, make a major difference. That is the challenge and the beauty of the Earth Dreams Technology philosophy.”
PRODUCTS
Honda’s lightest in class 1.6 diesel engine
The new 1.6-iDTEC combines competitive power (120 PS) and 300Nm of torque with CO2 emissions of just 94g/km, offering an impressive balance between fuel economy and performance. The new engine is lightest in class, weighing 47kg less than Honda’s 2.2-litre i-DTEC. Comprising an aluminium cylinder head joined to an open deck aluminium block, all components have been redesigned to minimise their weight and size, while advanced production techniques have helped to reduce weight even further.
“The key focus of our Earth Dreams Technology philosophy
is to balance environmental effi ciency with the dynamic performance
expected of a Honda.”Suehiro Hasshi,
Large Project Leader for Civic 1.6-litre i-DTEC.
Small Diesel Engine, 1.6-litre i-DTEC
PRODUCTS
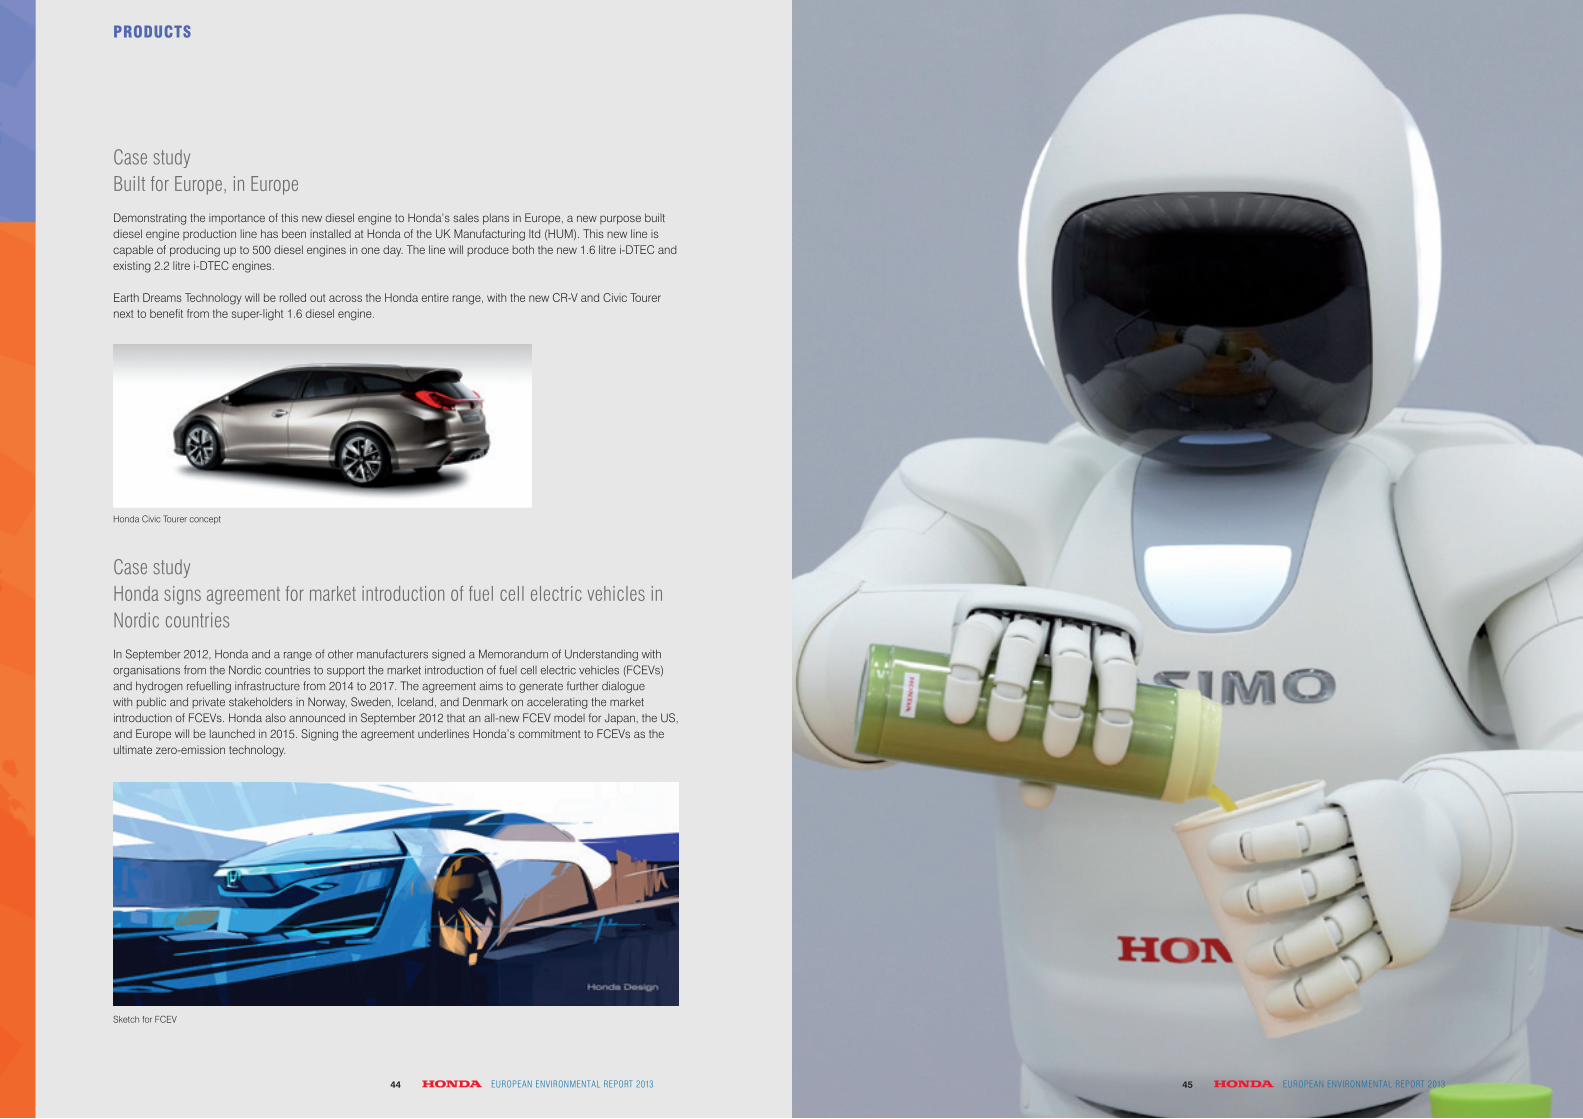
EuropEan EnvironmEntal rEport 2013 EuropEan EnvironmEntal rEport 20134544
Demonstrating the importance of this new diesel engine to Honda’s sales plans in Europe, a new purpose built diesel engine production line has been installed at Honda of the UK Manufacturing ltd (HUM). This new line is capable of producing up to 500 diesel engines in one day. The line will produce both the new 1.6 litre i-DTEC and existing 2.2 litre i-DTEC engines.
Earth Dreams Technology will be rolled out across the Honda entire range, with the new CR-V and Civic Tourer next to benefi t from the super-light 1.6 diesel engine.
In September 2012, Honda and a range of other manufacturers signed a Memorandum of Understanding with organisations from the Nordic countries to support the market introduction of fuel cell electric vehicles (FCEVs) and hydrogen refuelling infrastructure from 2014 to 2017. The agreement aims to generate further dialogue with public and private stakeholders in Norway, Sweden, Iceland, and Denmark on accelerating the market introduction of FCEVs. Honda also announced in September 2012 that an all-new FCEV model for Japan, the US, and Europe will be launched in 2015. Signing the agreement underlines Honda’s commitment to FCEVs as the ultimate zero-emission technology.
Case study Built for Europe, in Europe
Case study Honda signs agreement for market introduction of fuel cell electric vehicles in nordic countries
Sketch for FCEV
Honda Civic Tourer concept
PRODUCTS
PRODUCTS
EuropEan EnvironmEntal rEport 201345

EuropEan EnvironmEntal rEport 201347EuropEan EnvironmEntal rEport 201346
This year the number of models falling under the High-effi ciency category of HEPS has more than doubled, while the Innovative category has welcomed two new models.
Motorcycles
Samples of 2012 Motorcycles
CB600F
NT700V
EV-neo
Hi Efficient Products Revolutionary Products
0 %
1 %
2 %
3 %
4 %
5 %
6 %
7 %
8 %
2008 2009 2010 2011
2009 2010 2011 2012
2012
CO2 in g/km
136
138
140
142
144
146
148
150
152
154
156
Car Models per HEPS Category
0
2
4
6
8
10
12
14
16
Motorcycle Models per HEPS Category
0
2
4
6
8
10
12
14
16
2010 2011 2012
2010 2011 2012
2010 2011 2012
Power Equipment Models per HEPS Category
0
5
10
15
20
25
30
35
13
14
45
1010 10
33 3
11 1
11
2
1
1
16
13
1
16
12
2
% Replaced bumpers to Recycling
PRODUCTS
Case studyEnhanced Smart power
Case studyall-new 700cc engine
In 2006, Honda was the fi rst manufacturer to announce voluntary, per-unit CO2 emission reduction targets for all of its products and the plants that produce them – signalling a strong ongoing commitment to environmental innovation.
In April 2012, Honda announced that Europe’s best-selling motorcycle in 2011, the PCX125, would be enhanced with its new next generation engine technology, eSP (enhanced Smart Power). This single-cylinder, liquid-cooled four-stroke unit delivers the optimum combination of fuel economy, power and torque, coupled with quiet operation. Development has seen a relentless focus on reducing friction and weight, which along with Idling Stop make for an incredibly effi cient package - in the case of the PCX125 delivering fuel economy of 133.9mpg. Later in 2012 Honda announced that eSP would be rolled out even further – to the popular SH125 scooter range. As a result the SH125 delivers the same outstanding fuel economy as the PCX125.
In October 2011 Honda announced a new 670cc engine for the mid-capacity 700 Series, delivering both powerful torque in low to mid-speed range and top class fuel-effi ciency.
The new engine features a variety of technologies inspired by automotive development. Programmed Fuel Injection (PGMFi) ensures maximum combustion effi ciency by delivering the optimal air: fuel ratio of 14:1, while the number and size of parts has been reduced to bring down weight. Additionally it uses just one throttle body for both cylinders, and the smaller, lighter catalyser is situated closer to the engine, enabling it to warm up faster. The new engine is the centre-pin for Honda’s mid-class range, debuting on the NCD700 Integra in 2012, delivering 76.35mpg, followed by the very popular NC700X and NC700S.
PCX125
New 700cc Engine
PRODUCTS
SH125
Innovative products
2
Revolutionary
Innovative
High Effi ciency
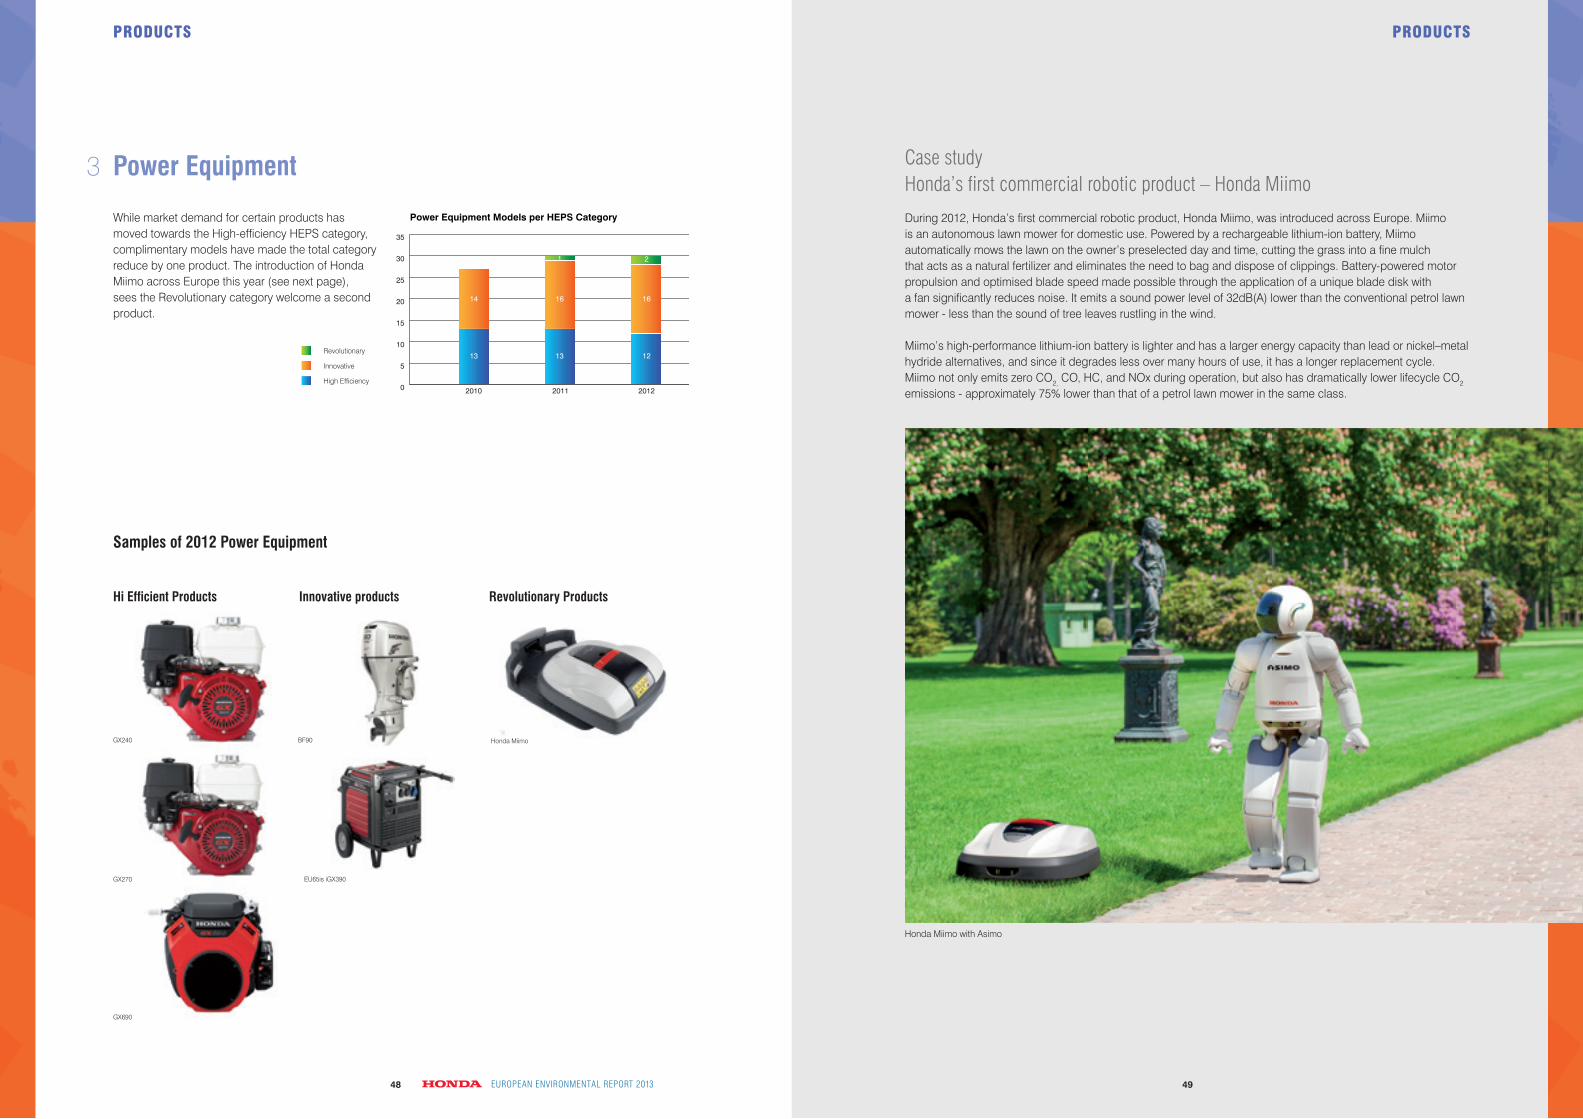
Power Equipment
Samples of 2012 Power Equipment
While market demand for certain products has moved towards the High-effi ciency HEPS category, complimentary models have made the total category reduce by one product. The introduction of Honda Miimo across Europe this year (see next page), sees the Revolutionary category welcome a second product.
GX240 BF90
EU65is●iGX390●
GX690
GX270
Honda Miimo
Hi Efficient Products Innovative products Revolutionary Products
0 %
1 %
2 %
3 %
4 %
5 %
6 %
7 %
8 %
2008 2009 2010 2011
2009 2010 2011 2012
2012
CO2 in g/km
136
138
140
142
144
146
148
150
152
154
156
Car Models per HEPS Category
0
2
4
6
8
10
12
14
16
Motorcycle Models per HEPS Category
0
2
4
6
8
10
12
14
16
2010 2011 2012
2010 2011 2012
2010 2011 2012
Power Equipment Models per HEPS Category
0
5
10
15
20
25
30
35
13
14
45
1010 10
33 3
11 1
11
2
1
1
16
13
1
16
12
2
% Replaced bumpers to Recycling
PRODUCTS
Case studyHonda’s fi rst commercial robotic product – Honda miimo
During 2012, Honda’s fi rst commercial robotic product, Honda Miimo, was introduced across Europe. Miimo is an autonomous lawn mower for domestic use. Powered by a rechargeable lithium-ion battery, Miimo automatically mows the lawn on the owner’s preselected day and time, cutting the grass into a fi ne mulch that acts as a natural fertilizer and eliminates the need to bag and dispose of clippings. Battery-powered motor propulsion and optimised blade speed made possible through the application of a unique blade disk with a fan signifi cantly reduces noise. It emits a sound power level of 32dB(A) lower than the conventional petrol lawn mower - less than the sound of tree leaves rustling in the wind.
Miimo’s high-performance lithium-ion battery is lighter and has a larger energy capacity than lead or nickel–metal hydride alternatives, and since it degrades less over many hours of use, it has a longer replacement cycle. Miimo not only emits zero CO2, CO, HC, and NOx during operation, but also has dramatically lower lifecycle CO2
emissions - approximately 75% lower than that of a petrol lawn mower in the same class.
Honda Miimo with Asimo
PRODUCTS
3
EuropEan EnvironmEntal rEport 201348 49
Revolutionary
Innovative
High Effi ciency
Energy used is derived from meter readings and invoices from the energy suppliers. Where conversion is required, the conversion rate is applied as based on:
• the information provided by the energy supplier, or, if not available
• national standard conversion values, or, if not available
• international conversion factors
• calculations based on chemical conversions
For the conversion to CO2 equivalents the following priority of conversion factors is used:
• the information provided by the energy supplier, or, if not available
• national sector standard conversion values, or, if not available
• national conversion values as published by the country, or, if not available
• national standard conversion values (GHG Protocol country data), or, if not available
• international conversion factors (GHG Protocol data)
• calculations based on chemical conversions (only applicable for primary energy resoources)
These rules apply per site. Site data is consolidated after conversions.
To make the performances comparable we normalise the values:
• For cars, motorcycle and power equipment production sites and transport: per unit output
• For parts production and transport: per turnover (referring to base year data = 100%)
• For logistics sites, for offices and for dealers: per area (m²) building
Data reported on have been collected based on the following collection and calculation rules:
Energy data related to direct energy consumption (as being primary energy sources as purchased and used by the reporting organisation, including natural gas, fuels from distilled crude oil, or from other renewable resources) and indirect energy consumption (through purchasing of electricity, heat, steam, from fossil, nuclear or renewable sources and as used on the respective sites)
Site Data
EuropEan EnvironmEntal rEport 20135150 EuropEan EnvironmEntal rEport 2013

EuropEan EnvironmEntal rEport 2013 EuropEan EnvironmEntal rEport 20135352
Honda continues to work to minimise the impact of its manufacturing on the global environment, to improve associates’ working environment and to enhance cooperation with local communities. Honda wants communities to be proud of its factories, and so it strives to realise the ideal of manufacturing products with the smallest environmental footprints in the most environmentally-responsible factories.
Honda operates six manufacturing facilities in Europe. Honda’s efforts in minimising the environmental impact of its manufacturing operations in Europe include reducing the energy intensity of production, as well as initiatives to use water and other natural resources more effi ciently, and to reduce air emissions and waste generation. During 2012 we once again realised the ideal of all production facilities in Europe sending zero waste to landfi ll.
Case studyHonda turkey a.S. (Htr) wins Environmentally Friendly plant award
HTR recently received the “Environmentally Friendly Plant Award” from the Turkish Healthy Cities Association. The association’s member municipalities praised HTR’s tree-planting activities in Kargali Village, held as an Environment and Corporate Responsibility Project in 2011 and 2012. The Turkish Healthy Cities Association was founded in 2005 and currently has a membership of 46 cities. The association uses the Award to encourage manufacturers to invest in the environment.
Case studyHum and Htr harness the power of the sun to reduce Co2 emissions
Case studyreducing energy usage through more effi cient lighting
HUM and HTR are harnessing the power of the sun to deliver a cost-effective reduction in CO2 emissions. In October 2011, HUM switched on a 5MWp solar-array consisting of more than 21,000 ground mounted panels covering a development area of 32 acres. The installation generated 4.5 GWh of renewable energy, equating to 4.4% of the site’s total electricity requirement for the year. HUM invested zero capital cost for the development, and in its fi rst year of operation delivered considerable cost savings compared to buying grid supplied energy was realised. CO2 emissions were reduced by almost 2000 tons.Similarly HTR has been successfully using solar power in its operations, recently installing solar panels and invertors on site. To date the site has generated 124,000 Kwh per year of renewable energy, resulting in a CO2 reduction of 54 tons.
HUM’s High Bay lighting metal halide fi ttings were using 450 watts of electricity per hour, based on 24/7 operation. A review of alternatives was carried out with the aim of reducing both energy usage and electricity costs. The solution was a new, more effi cient light fi tting, using just 220 watts of electricity per hour - less than half that of the previous version. To date this initiative has resulted in a saving of 637MWh of electricity and signifi cant cost reductions. Further improvements are being implemented, for example the introduction of movement sensors that switch off the lights when they are not needed.
IN-HOUSE PRODUCTION
RECYCLING
PRODUCTS
IN-HOUSE PRODUCTION
SALES & SERVICES
TRANSPORT

EuropEan EnvironmEntal rEport 2013 EuropEan EnvironmEntal rEport 20135554
Car Production
Total energy consumption increased this year, the result of a rise in production volumes and a very long and harsh winter across Europe. Energy per unit has improved, however, due to higher efficiency. The split between gas, electricity and LPG as sources remains the same as last year.
Despite the increase in energy consumption, we have managed to bring down overall emissions levels, with a fall in CO2 in both absolute value and per produced car. Once again the result of higher efficiency, but also, significantly, by HUM purchasing certified CO2 free electricity and the introduction of solar energy at both HUM (2nd phase) and Honda Turkey A.S. (HTR).
This year has seen an increase in absolute figures of water usage due to increased production volumes, yet consumption per unit produced remains stable, in fact slightly lower than last year.Finally, we celebrate a very significant achievement, our second consecutive year of zero waste to landfill across both HUM and HTR.
Energy by Source
Energy Consumption
in MWh in kWh/unit
2008 2009 2010 2011 2012
2008 2009 2010 2011 2012
2008 2009 2010 2011 2012
2008 2009 2010 2011 2012
2008 2009 2010 2011 2012
2008 2009 2010 2011 2012
2008 2009 2010 2011 2012
2008 2009 2010 2011 2012
Energy Consumption for Car Production
0
50.000
100.000
150.000
200.000
250.000
300.000
0
500
1000
1500
2000
1.209
1.5951.412
1.393
1.709
in t CO2 in kg-CO2/UnitCO2 Emissions for Car Production
0
10.000
20.000
30.000
40.000
50.000
60.000
70.000
80.000
90.000
0
100
200
300
400
500
600
388
511
446
413
184
0
100.000
200.000
300.000
400.000
500.000
600.000
700.000
800.000
0
1
2
3
4
5in m³ in m³/Unit
Water Usage for Car Production
2,7
4,6
3,7 3,63,8
0
5.000
10.000
15.000
20.000
25.000
30.000
35.000
0
20
40
60
80
100
120
140
160in t in kg/Unit
Waste for Car Production
149 140
120 124
143
0
100
200
300
400
500
600
700
800
900in t
Waste to Landfill for Car Production
0
10.000
20.000
30.000
40.000
0
50
100
150
200
250in MWh in kWh/Unit
Energy Consumption for Motor Cycle Production
177
224
183 192
133
0
2.000
4.000
6.000
8.000
10.000
12.000
0
10
20
30
40
50
60
70in t CO2
in kg CO2/UnitCO2 Emissions for Motor Cycle Production
46,4
58,6
49,751,3
38,9
Energy by Source for Motor Cycle Production
0
5.000
10.000
15.000
20.000
25.000
30.000
0
50
100
150
200in m³ in l/Unit
Water Usage for Motor Cycle Production
119
146
96 9282
Electricity47,7%
Gas56,0%
LGP0,4%
Energy by Source for Car Production
Electricity47,7%
Gas57,9%
Oil13,9%
Oil13,9%
260.309
83.569
580.587
32.060
835
36.917
9.674
24.778 20.424 13.186 14.272 13.085
8.186 6.809 7.971 6.206
31.305 25.007 29.750 21.180
533
197 0 0
16.499 19.186 14.732 27.399
545.770 597.899 447.007 696.388
60.095 71.118 48.983
35.385
187.502 222.058 202.618 270.836
IN-HOUSE PRODUCTION
CO2 Emissions
Water Usage
Waste
Waste to Landfill
in MWh in kWh/unit
2008 2009 2010 2011 2012
2008 2009 2010 2011 2012
2008 2009 2010 2011 2012
2008 2009 2010 2011 2012
2008 2009 2010 2011 2012
2008 2009 2010 2011 2012
2008 2009 2010 2011 2012
2008 2009 2010 2011 2012
Energy Consumption for Car Production
0
50.000
100.000
150.000
200.000
250.000
300.000
0
500
1000
1500
2000
1.209
1.5951.412
1.393
1.709
in t CO2 in kg-CO2/UnitCO2 Emissions for Car Production
0
10.000
20.000
30.000
40.000
50.000
60.000
70.000
80.000
90.000
0
100
200
300
400
500
600
388
511
446
413
184
0
100.000
200.000
300.000
400.000
500.000
600.000
700.000
800.000
0
1
2
3
4
5in m³ in m³/Unit
Water Usage for Car Production
2,7
4,6
3,7 3,63,8
0
5.000
10.000
15.000
20.000
25.000
30.000
35.000
0
20
40
60
80
100
120
140
160in t in kg/Unit
Waste for Car Production
149 140
120 124
143
0
100
200
300
400
500
600
700
800
900in t
Waste to Landfill for Car Production
0
10.000
20.000
30.000
40.000
0
50
100
150
200
250in MWh in kWh/Unit
Energy Consumption for Motor Cycle Production
177
224
183 192
133
0
2.000
4.000
6.000
8.000
10.000
12.000
0
10
20
30
40
50
60
70in t CO2
in kg CO2/UnitCO2 Emissions for Motor Cycle Production
46,4
58,6
49,751,3
38,9
Energy by Source for Motor Cycle Production
0
5.000
10.000
15.000
20.000
25.000
30.000
0
50
100
150
200in m³ in l/Unit
Water Usage for Motor Cycle Production
119
146
96 9282
Electricity47,7%
Gas56,0%
LGP0,4%
Energy by Source for Car Production
Electricity47,7%
Gas57,9%
Oil13,9%
Oil13,9%
260.309
83.569
580.587
32.060
835
36.917
9.674
24.778 20.424 13.186 14.272 13.085
8.186 6.809 7.971 6.206
31.305 25.007 29.750 21.180
533
197 0 0
16.499 19.186 14.732 27.399
545.770 597.899 447.007 696.388
60.095 71.118 48.983
35.385
187.502 222.058 202.618 270.836
IN-HOUSE PRODUCTION
1
Total amount
per unit
Total amount
per unit
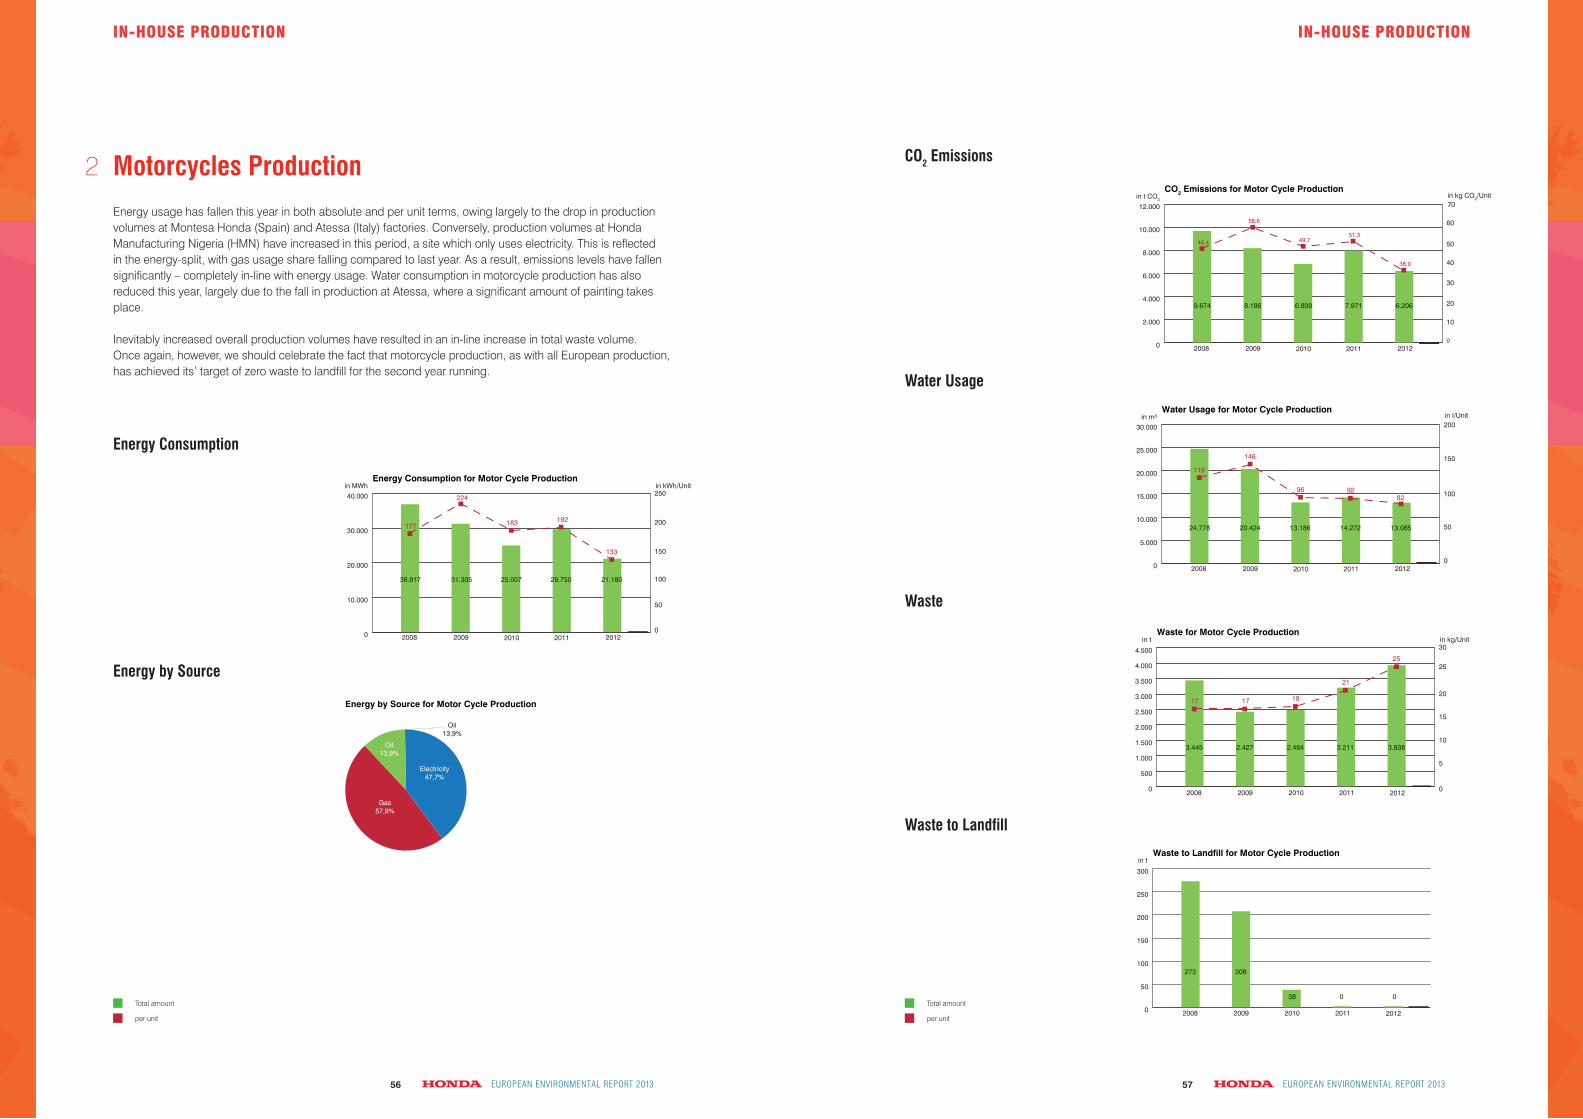
EuropEan EnvironmEntal rEport 2013 EuropEan EnvironmEntal rEport 20135756
Motorcycles Production
Energy usage has fallen this year in both absolute and per unit terms, owing largely to the drop in production volumes at Montesa Honda (Spain) and Atessa (Italy) factories. Conversely, production volumes at Honda Manufacturing Nigeria (HMN) have increased in this period, a site which only uses electricity. This is reflected in the energy-split, with gas usage share falling compared to last year. As a result, emissions levels have fallen significantly – completely in-line with energy usage. Water consumption in motorcycle production has also reduced this year, largely due to the fall in production at Atessa, where a significant amount of painting takes place.
Inevitably increased overall production volumes have resulted in an in-line increase in total waste volume. Once again, however, we should celebrate the fact that motorcycle production, as with all European production, has achieved its’ target of zero waste to landfill for the second year running.
Energy by Source
Energy Consumption
in MWh in kWh/unit
2008 2009 2010 2011 2012
2008 2009 2010 2011 2012
2008 2009 2010 2011 2012
2008 2009 2010 2011 2012
2008 2009 2010 2011 2012
2008 2009 2010 2011 2012
2008 2009 2010 2011 2012
2008 2009 2010 2011 2012
Energy Consumption for Car Production
0
50.000
100.000
150.000
200.000
250.000
300.000
0
500
1000
1500
2000
1.209
1.5951.412
1.393
1.709
in t CO2 in kg-CO2/UnitCO2 Emissions for Car Production
0
10.000
20.000
30.000
40.000
50.000
60.000
70.000
80.000
90.000
0
100
200
300
400
500
600
388
511
446
413
184
0
100.000
200.000
300.000
400.000
500.000
600.000
700.000
800.000
0
1
2
3
4
5in m³ in m³/Unit
Water Usage for Car Production
2,7
4,6
3,7 3,63,8
0
5.000
10.000
15.000
20.000
25.000
30.000
35.000
0
20
40
60
80
100
120
140
160in t in kg/Unit
Waste for Car Production
149 140
120 124
143
0
100
200
300
400
500
600
700
800
900in t
Waste to Landfill for Car Production
0
10.000
20.000
30.000
40.000
0
50
100
150
200
250in MWh in kWh/Unit
Energy Consumption for Motor Cycle Production
177
224
183 192
133
0
2.000
4.000
6.000
8.000
10.000
12.000
0
10
20
30
40
50
60
70in t CO2
in kg CO2/UnitCO2 Emissions for Motor Cycle Production
46,4
58,6
49,751,3
38,9
Energy by Source for Motor Cycle Production
0
5.000
10.000
15.000
20.000
25.000
30.000
0
50
100
150
200in m³ in l/Unit
Water Usage for Motor Cycle Production
119
146
96 9282
Electricity47,7%
Gas56,0%
LGP0,4%
Energy by Source for Car Production
Electricity47,7%
Gas57,9%
Oil13,9%
Oil13,9%
260.309
83.569
580.587
32.060
835
36.917
9.674
24.778 20.424 13.186 14.272 13.085
8.186 6.809 7.971 6.206
31.305 25.007 29.750 21.180
533
197 0 0
16.499 19.186 14.732 27.399
545.770 597.899 447.007 696.388
60.095 71.118 48.983
35.385
187.502 222.058 202.618 270.836
in MWh in kWh/unit
2008 2009 2010 2011 2012
2008 2009 2010 2011 2012
2008 2009 2010 2011 2012
2008 2009 2010 2011 2012
2008 2009 2010 2011 2012
2008 2009 2010 2011 2012
2008 2009 2010 2011 2012
2008 2009 2010 2011 2012
Energy Consumption for Car Production
0
50.000
100.000
150.000
200.000
250.000
300.000
0
500
1000
1500
2000
1.209
1.5951.412
1.393
1.709
in t CO2 in kg-CO2/UnitCO2 Emissions for Car Production
0
10.000
20.000
30.000
40.000
50.000
60.000
70.000
80.000
90.000
0
100
200
300
400
500
600
388
511
446
413
184
0
100.000
200.000
300.000
400.000
500.000
600.000
700.000
800.000
0
1
2
3
4
5in m³ in m³/Unit
Water Usage for Car Production
2,7
4,6
3,7 3,63,8
0
5.000
10.000
15.000
20.000
25.000
30.000
35.000
0
20
40
60
80
100
120
140
160in t in kg/Unit
Waste for Car Production
149 140
120 124
143
0
100
200
300
400
500
600
700
800
900in t
Waste to Landfill for Car Production
0
10.000
20.000
30.000
40.000
0
50
100
150
200
250in MWh in kWh/Unit
Energy Consumption for Motor Cycle Production
177
224
183 192
133
0
2.000
4.000
6.000
8.000
10.000
12.000
0
10
20
30
40
50
60
70in t CO2
in kg CO2/UnitCO2 Emissions for Motor Cycle Production
46,4
58,6
49,751,3
38,9
Energy by Source for Motor Cycle Production
0
5.000
10.000
15.000
20.000
25.000
30.000
0
50
100
150
200in m³ in l/Unit
Water Usage for Motor Cycle Production
119
146
96 9282
Electricity47,7%
Gas56,0%
LGP0,4%
Energy by Source for Car Production
Electricity47,7%
Gas57,9%
Oil13,9%
Oil13,9%
260.309
83.569
580.587
32.060
835
36.917
9.674
24.778 20.424 13.186 14.272 13.085
8.186 6.809 7.971 6.206
31.305 25.007 29.750 21.180
533
197 0 0
16.499 19.186 14.732 27.399
545.770 597.899 447.007 696.388
60.095 71.118 48.983
35.385
187.502 222.058 202.618 270.836
IN-HOUSE PRODUCTION
Water Usage
Waste
Waste to Landfill
CO2 Emissions
in MWh in kWh/unit
2008 2009 2010 2011 2012
2008 2009 2010 2011 2012
2008 2009 2010 2011 2012
2008 2009 2010 2011 2012
2008 2009 2010 2011 2012
2008 2009 2010 2011 2012
2008 2009 2010 2011 2012
2008 2009 2010 2011 2012
Energy Consumption for Car Production
0
50.000
100.000
150.000
200.000
250.000
300.000
0
500
1000
1500
2000
1.209
1.5951.412
1.393
1.709
in t CO2 in kg-CO2/UnitCO2 Emissions for Car Production
0
10.000
20.000
30.000
40.000
50.000
60.000
70.000
80.000
90.000
0
100
200
300
400
500
600
388
511
446
413
184
0
100.000
200.000
300.000
400.000
500.000
600.000
700.000
800.000
0
1
2
3
4
5in m³ in m³/Unit
Water Usage for Car Production
2,7
4,6
3,7 3,63,8
0
5.000
10.000
15.000
20.000
25.000
30.000
35.000
0
20
40
60
80
100
120
140
160in t in kg/Unit
Waste for Car Production
149 140
120 124
143
0
100
200
300
400
500
600
700
800
900in t
Waste to Landfill for Car Production
0
10.000
20.000
30.000
40.000
0
50
100
150
200
250in MWh in kWh/Unit
Energy Consumption for Motor Cycle Production
177
224
183 192
133
0
2.000
4.000
6.000
8.000
10.000
12.000
0
10
20
30
40
50
60
70in t CO2
in kg CO2/UnitCO2 Emissions for Motor Cycle Production
46,4
58,6
49,751,3
38,9
Energy by Source for Motor Cycle Production
0
5.000
10.000
15.000
20.000
25.000
30.000
0
50
100
150
200in m³ in l/Unit
Water Usage for Motor Cycle Production
119
146
96 9282
Electricity47,7%
Gas56,0%
LGP0,4%
Energy by Source for Car Production
Electricity47,7%
Gas57,9%
Oil13,9%
Oil13,9%
260.309
83.569
580.587
32.060
835
36.917
9.674
24.778 20.424 13.186 14.272 13.085
8.186 6.809 7.971 6.206
31.305 25.007 29.750 21.180
533
197 0 0
16.499 19.186 14.732 27.399
545.770 597.899 447.007 696.388
60.095 71.118 48.983
35.385
187.502 222.058 202.618 270.836
in t in kg/Unit
2008 2009 2010 2011 2012
2008 2009 2010 2011 2012
2008 2009 2010 2011 2012
2008 2009 2010 2011 2012
2008 2009 2010 2011 2012
2008 2009 2010 2011 2012
2008 2009 2010 2011 2012
2008 2009 2010 2011 2012
Waste for Motor Cycle Production
0
500
1.000
1.500
2.000
2.500
3.000
3.500
4.000
4.500
0
5
10
15
20
25
30
17 17 18
21
25
in tWaste to Landfill for Motor Cycle Production
0
50
100
150
200
250
300
in MWh in kWh/UnitEnergy Consumption for Power Equipment Production
0
2.000
4.000
6.000
8.000
10.000
12.000
14.000
0
10
5
15
25
20
16,4
18,1 18,5
23,5
19,8
in t CO2 in kg-CO2
CO2 Emissions for Power Equipment Production
Energy by Source for Power Production
0
500
1.000
1.500
2.000
2.500
3.000
3.500
0
1
2
3
4
5
6
7
4,5 4,74,9
5,3
6,3
in m³ in l/UnitWater Usage for Power Equipment Production
0
2.000
4.000
6.000
8.000
10.000
12.000
0
5
10
15
20
11 11
17 16
14
in t in kg/UnitWaste for Power Equipment Production
in tWaste to Landfill for Power Equipment Production
0
50
100
150
200
in MWh in kWh/UnitEnergy Consumption for Parts Production
0
1.000
2.000
3.000
4.000
5.000
6.000
7.000
0
50
150
100
200
250
100113
144 142
192
0
500
1.000
1.500
2.000
2.500
0
1
2
3
4
5
2,7 2,8
3,8
2,6 2,5
Energy by Source for Parts Production
Electricity47,7%
Gas52,9%
Oil0,1%
Electricity47,7%
Gas40,1%
Oil1,6%
3.445
273
11.898
3.241
7.707
1.954
162
2.071 1.886
5.441 6.005 5.158
2008 2009 2010 2011 2012
in t CO2 in %CO2 Emissions for Parts Production
0
500
1.000
1.500
2.000
0
20
40
60
80
100
120
140
160
100 108110
99
134
777 678
1.560 1.569 1.353
118
1 0 0
1.435 1.422 1.472 1.839
6.315 9.793 7.185 7.858
2.596 2.756 3.293 2.565
11.898 10.532 12.298 9.512
208
38 0 0
2.427 2.484 3.211 3.938
IN-HOUSE PRODUCTION
2
Total amount
per unit
Total amount
per unit
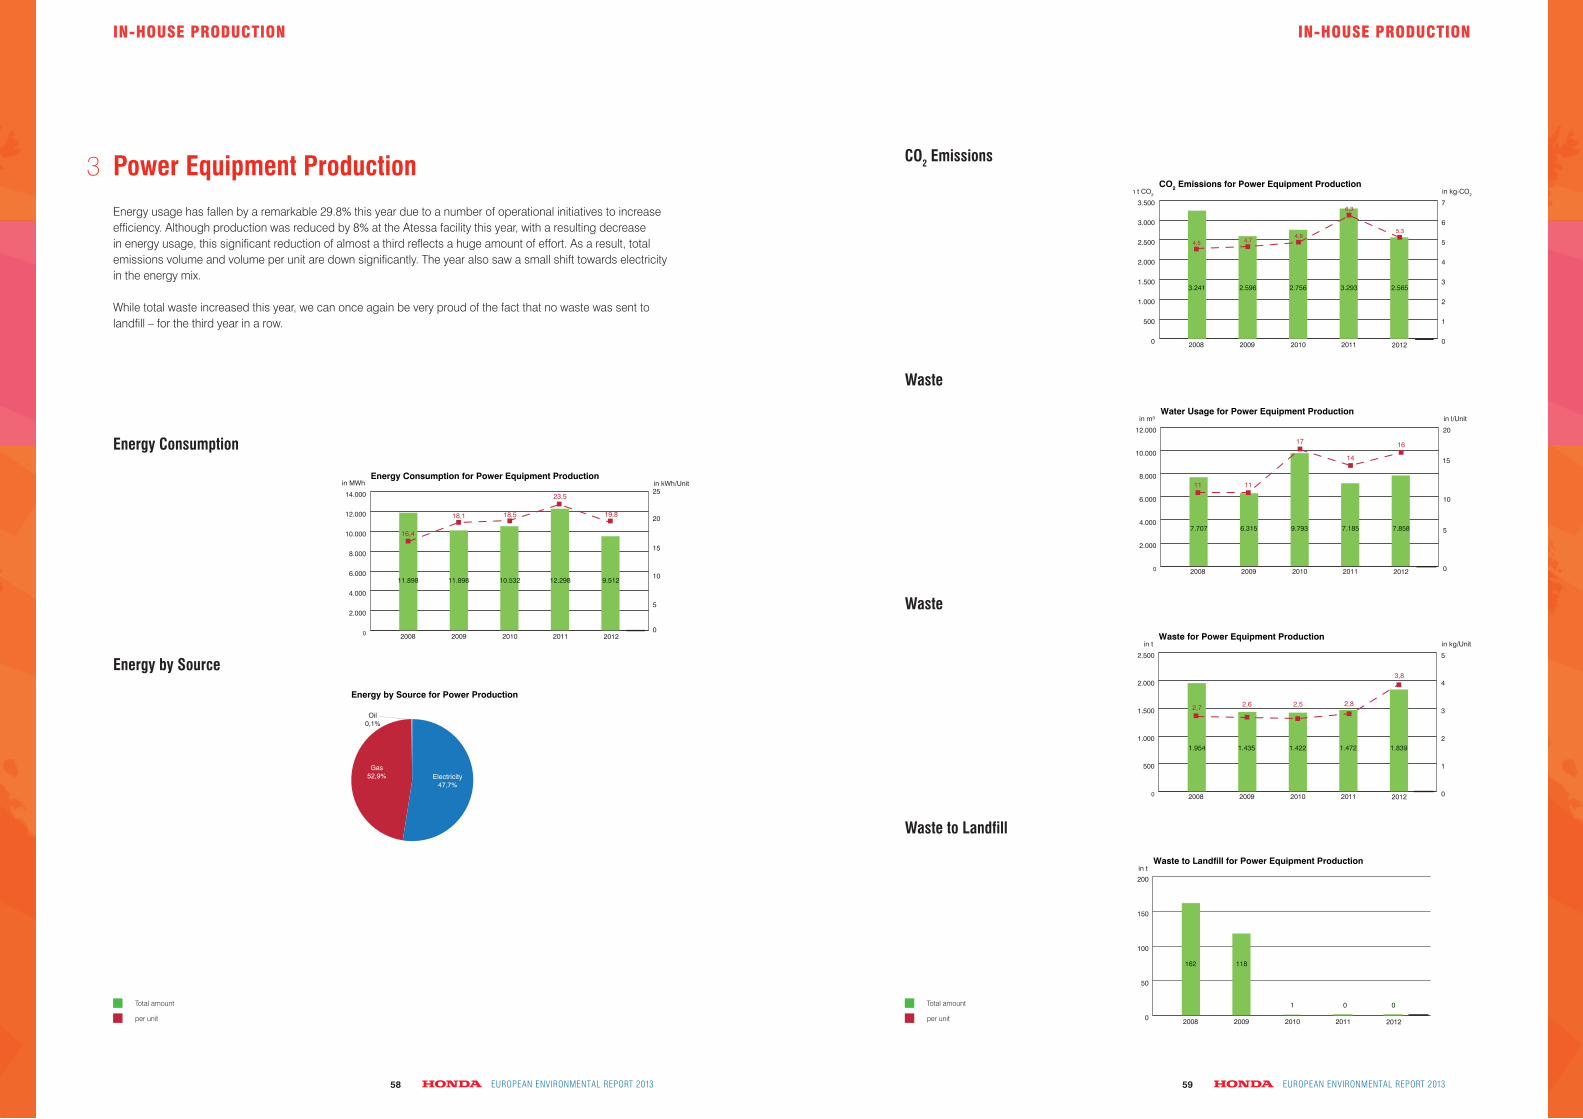
EuropEan EnvironmEntal rEport 2013 EuropEan EnvironmEntal rEport 20135958
Power Equipment Production
Energy usage has fallen by a remarkable 29.8% this year due to a number of operational initiatives to increase efficiency. Although production was reduced by 8% at the Atessa facility this year, with a resulting decrease in energy usage, this significant reduction of almost a third reflects a huge amount of effort. As a result, total emissions volume and volume per unit are down significantly. The year also saw a small shift towards electricity in the energy mix.
While total waste increased this year, we can once again be very proud of the fact that no waste was sent to landfill – for the third year in a row.
Energy by Source
Energy Consumption
in t in kg/Unit
2008 2009 2010 2011 2012
2008 2009 2010 2011 2012
2008 2009 2010 2011 2012
2008 2009 2010 2011 2012
2008 2009 2010 2011 2012
2008 2009 2010 2011 2012
2008 2009 2010 2011 2012
2008 2009 2010 2011 2012
Waste for Motor Cycle Production
0
500
1.000
1.500
2.000
2.500
3.000
3.500
4.000
4.500
0
5
10
15
20
25
30
17 17 18
21
25
in tWaste to Landfill for Motor Cycle Production
0
50
100
150
200
250
300
in MWh in kWh/UnitEnergy Consumption for Power Equipment Production
0
2.000
4.000
6.000
8.000
10.000
12.000
14.000
0
10
5
15
25
20
16,4
18,1 18,5
23,5
19,8
in t CO2 in kg-CO2
CO2 Emissions for Power Equipment Production
Energy by Source for Power Production
0
500
1.000
1.500
2.000
2.500
3.000
3.500
0
1
2
3
4
5
6
7
4,5 4,74,9
5,3
6,3
in m³ in l/UnitWater Usage for Power Equipment Production
0
2.000
4.000
6.000
8.000
10.000
12.000
0
5
10
15
20
11 11
17 16
14
in t in kg/UnitWaste for Power Equipment Production
in tWaste to Landfill for Power Equipment Production
0
50
100
150
200
in MWh in kWh/UnitEnergy Consumption for Parts Production
0
1.000
2.000
3.000
4.000
5.000
6.000
7.000
0
50
150
100
200
250
100113
144 142
192
0
500
1.000
1.500
2.000
2.500
0
1
2
3
4
5
2,7 2,8
3,8
2,6 2,5
Energy by Source for Parts Production
Electricity47,7%
Gas52,9%
Oil0,1%
Electricity47,7%
Gas40,1%
Oil1,6%
3.445
273
11.898
3.241
7.707
1.954
162
2.071 1.886
5.441 6.005 5.158
2008 2009 2010 2011 2012
in t CO2 in %CO2 Emissions for Parts Production
0
500
1.000
1.500
2.000
0
20
40
60
80
100
120
140
160
100 108110
99
134
777 678
1.560 1.569 1.353
118
1 0 0
1.435 1.422 1.472 1.839
6.315 9.793 7.185 7.858
2.596 2.756 3.293 2.565
11.898 10.532 12.298 9.512
208
38 0 0
2.427 2.484 3.211 3.938
IN-HOUSE PRODUCTION
CO2 Emissions
Waste
Waste
Waste to Landfill
in t in kg/Unit
2008 2009 2010 2011 2012
2008 2009 2010 2011 2012
2008 2009 2010 2011 2012
2008 2009 2010 2011 2012
2008 2009 2010 2011 2012
2008 2009 2010 2011 2012
2008 2009 2010 2011 2012
2008 2009 2010 2011 2012
Waste for Motor Cycle Production
0
500
1.000
1.500
2.000
2.500
3.000
3.500
4.000
4.500
0
5
10
15
20
25
30
17 17 18
21
25
in tWaste to Landfill for Motor Cycle Production
0
50
100
150
200
250
300
in MWh in kWh/UnitEnergy Consumption for Power Equipment Production
0
2.000
4.000
6.000
8.000
10.000
12.000
14.000
0
10
5
15
25
20
16,4
18,1 18,5
23,5
19,8
in t CO2 in kg-CO2
CO2 Emissions for Power Equipment Production
Energy by Source for Power Production
0
500
1.000
1.500
2.000
2.500
3.000
3.500
0
1
2
3
4
5
6
7
4,5 4,74,9
5,3
6,3
in m³ in l/UnitWater Usage for Power Equipment Production
0
2.000
4.000
6.000
8.000
10.000
12.000
0
5
10
15
20
11 11
17 16
14
in t in kg/UnitWaste for Power Equipment Production
in tWaste to Landfill for Power Equipment Production
0
50
100
150
200
in MWh in kWh/UnitEnergy Consumption for Parts Production
0
1.000
2.000
3.000
4.000
5.000
6.000
7.000
0
50
150
100
200
250
100113
144 142
192
0
500
1.000
1.500
2.000
2.500
0
1
2
3
4
5
2,7 2,8
3,8
2,6 2,5
Energy by Source for Parts Production
Electricity47,7%
Gas52,9%
Oil0,1%
Electricity47,7%
Gas40,1%
Oil1,6%
3.445
273
11.898
3.241
7.707
1.954
162
2.071 1.886
5.441 6.005 5.158
2008 2009 2010 2011 2012
in t CO2 in %CO2 Emissions for Parts Production
0
500
1.000
1.500
2.000
0
20
40
60
80
100
120
140
160
100 108110
99
134
777 678
1.560 1.569 1.353
118
1 0 0
1.435 1.422 1.472 1.839
6.315 9.793 7.185 7.858
2.596 2.756 3.293 2.565
11.898 10.532 12.298 9.512
208
38 0 0
2.427 2.484 3.211 3.938
IN-HOUSE PRODUCTION
3
Total amount
per unit
Total amount
per unit

EuropEan EnvironmEntal rEport 2013 EuropEan EnvironmEntal rEport 20136160
Parts Production
Energy consumption in parts production fell this year due to a decrease in total volumes. However, the inevitable result in a fall in production volume is lower efficiency – reflected by the fact that energy use per unit has increased this year. Similarly, water consumption and waste volumes both dropped overall, but increased per unit.
Once again parts production recorded a second consecutive year of zero waste to landfill.
Energy by Source
Energy Consumption
in t in kg/Unit
2008 2009 2010 2011 2012
2008 2009 2010 2011 2012
2008 2009 2010 2011 2012
2008 2009 2010 2011 2012
2008 2009 2010 2011 2012
2008 2009 2010 2011 2012
2008 2009 2010 2011 2012
2008 2009 2010 2011 2012
Waste for Motor Cycle Production
0
500
1.000
1.500
2.000
2.500
3.000
3.500
4.000
4.500
0
5
10
15
20
25
30
17 17 18
21
25
in tWaste to Landfill for Motor Cycle Production
0
50
100
150
200
250
300
in MWh in kWh/UnitEnergy Consumption for Power Equipment Production
0
2.000
4.000
6.000
8.000
10.000
12.000
14.000
0
10
5
15
25
20
16,4
18,1 18,5
23,5
19,8
in t CO2 in kg-CO2
CO2 Emissions for Power Equipment Production
Energy by Source for Power Production
0
500
1.000
1.500
2.000
2.500
3.000
3.500
0
1
2
3
4
5
6
7
4,5 4,74,9
5,3
6,3
in m³ in l/UnitWater Usage for Power Equipment Production
0
2.000
4.000
6.000
8.000
10.000
12.000
0
5
10
15
20
11 11
17 16
14
in t in kg/UnitWaste for Power Equipment Production
in tWaste to Landfill for Power Equipment Production
0
50
100
150
200
in MWh in kWh/UnitEnergy Consumption for Parts Production
0
1.000
2.000
3.000
4.000
5.000
6.000
7.000
0
50
150
100
200
250
100113
144 142
192
0
500
1.000
1.500
2.000
2.500
0
1
2
3
4
5
2,7 2,8
3,8
2,6 2,5
Energy by Source for Parts Production
Electricity47,7%
Gas52,9%
Oil0,1%
Electricity47,7%
Gas40,1%
Oil1,6%
3.445
273
11.898
3.241
7.707
1.954
162
2.071 1.886
5.441 6.005 5.158
2008 2009 2010 2011 2012
in t CO2 in %CO2 Emissions for Parts Production
0
500
1.000
1.500
2.000
0
20
40
60
80
100
120
140
160
100 108110
99
134
777 678
1.560 1.569 1.353
118
1 0 0
1.435 1.422 1.472 1.839
6.315 9.793 7.185 7.858
2.596 2.756 3.293 2.565
11.898 10.532 12.298 9.512
208
38 0 0
2.427 2.484 3.211 3.938
in t in kg/Unit
2008 2009 2010 2011 2012
2008 2009 2010 2011 2012
2008 2009 2010 2011 2012
2008 2009 2010 2011 2012
2008 2009 2010 2011 2012
2008 2009 2010 2011 2012
2008 2009 2010 2011 2012
2008 2009 2010 2011 2012
Waste for Motor Cycle Production
0
500
1.000
1.500
2.000
2.500
3.000
3.500
4.000
4.500
0
5
10
15
20
25
30
17 17 18
21
25
in tWaste to Landfill for Motor Cycle Production
0
50
100
150
200
250
300
in MWh in kWh/UnitEnergy Consumption for Power Equipment Production
0
2.000
4.000
6.000
8.000
10.000
12.000
14.000
0
10
5
15
25
20
16,4
18,1 18,5
23,5
19,8
in t CO2 in kg-CO2
CO2 Emissions for Power Equipment Production
Energy by Source for Power Production
0
500
1.000
1.500
2.000
2.500
3.000
3.500
0
1
2
3
4
5
6
7
4,5 4,74,9
5,3
6,3
in m³ in l/UnitWater Usage for Power Equipment Production
0
2.000
4.000
6.000
8.000
10.000
12.000
0
5
10
15
20
11 11
17 16
14
in t in kg/UnitWaste for Power Equipment Production
in tWaste to Landfill for Power Equipment Production
0
50
100
150
200
in MWh in kWh/UnitEnergy Consumption for Parts Production
0
1.000
2.000
3.000
4.000
5.000
6.000
7.000
0
50
150
100
200
250
100113
144 142
192
0
500
1.000
1.500
2.000
2.500
0
1
2
3
4
5
2,7 2,8
3,8
2,6 2,5
Energy by Source for Parts Production
Electricity47,7%
Gas52,9%
Oil0,1%
Electricity47,7%
Gas40,1%
Oil1,6%
3.445
273
11.898
3.241
7.707
1.954
162
2.071 1.886
5.441 6.005 5.158
2008 2009 2010 2011 2012
in t CO2 in %CO2 Emissions for Parts Production
0
500
1.000
1.500
2.000
0
20
40
60
80
100
120
140
160
100 108110
99
134
777 678
1.560 1.569 1.353
118
1 0 0
1.435 1.422 1.472 1.839
6.315 9.793 7.185 7.858
2.596 2.756 3.293 2.565
11.898 10.532 12.298 9.512
208
38 0 0
2.427 2.484 3.211 3.938
IN-HOUSE PRODUCTION
Water Usage
Waste
Waste
in m³ in %
2008 2009 2010 2011 2012
2008 2009 2010 2011 2012
2008 2009 2010 2011 2012
2008 2009 2010 2011 2012
2008 2009 2010 2011 2012
2008 2009 2010 2011 2012
2008 2009 2010 2011 2012
2008 2009 2010 2011 2012
2008 2009 2010 2011 2012
Water Usage for Parts Production
0
2.000
4.000
6.000
8.000
10.000
0
50
100
150
200
250
300
350
400
450
100127
386
307
379
in t in %Waste for Parts Production
in tWaste to Landfill for Parts Production
0
10
20
30
40
in t CO2 in kg CO2/UnitCO2 Emissions for Car Transport
0
10.000
20.000
30.000
40.000
50.000
60.000
0
60
20
40
80
100
120
140
160144
121131
110
122
0
100
200
300
400
500
600
700
0
20
40
60
80
100
120
140
160
100 96
133
133
127
in t CO2 in kg CO2/UnitCO2 Emissions for Motor Cycle Transport
0
2.000
4.000
6.000
8.000
0
10
5
20
25
30
35
15
28,527,9
29,3
25,3 25,8
in t CO2 in kg CO2/UnitCO2 Emissions for Power Equipment Transport
0
1.000
2.000
3.000
4.000
5.000
6.000
7.000
0
1
2
3
4
54,7 4,6
4,3 4,1 4,0
in t-CO2 in %CO2 Emissions for Parts Transport
0
5.000
10.000
15.000
20.000
25.000
30.000
0
20
40
60
80
100
120
100 96,8
88,1 91,698,7
in MWh in kWh/m2Total Energy for Warehousing
0
10.000
20.000
30.000
40.000
50.000
0
20
40
60
80
100
120
89
82 85
99
117
Energy by Source for Warehousing
in t-CO2 in kg-CO2/m²CO2 Emissions for Warehousing
0
2.000
4.000
6.000
8.000
10.000
0
5
10
15
2019,2
14,515,4 15,1
17,9
Electricity32,9%
Gas67,0%
Oil0,1%
1.326
230 179
560
37
12
57.027
7.038
6.538
25.790
37.822
8193 6262 6680 6343 7002
35.508 36.716 41.842 45.828
24.154 22.620 21.683 21.683
5.227 5.466 5.075 4.555
4.605 4.671 5.257 4.550
32.725 31.110 20.905 28.875
9
0 0
599 450
1.364
9.352 8.342 6.505
IN-HOUSE PRODUCTION
4
CO2 Emissions
Total amount
per unit
Total amount
per unit
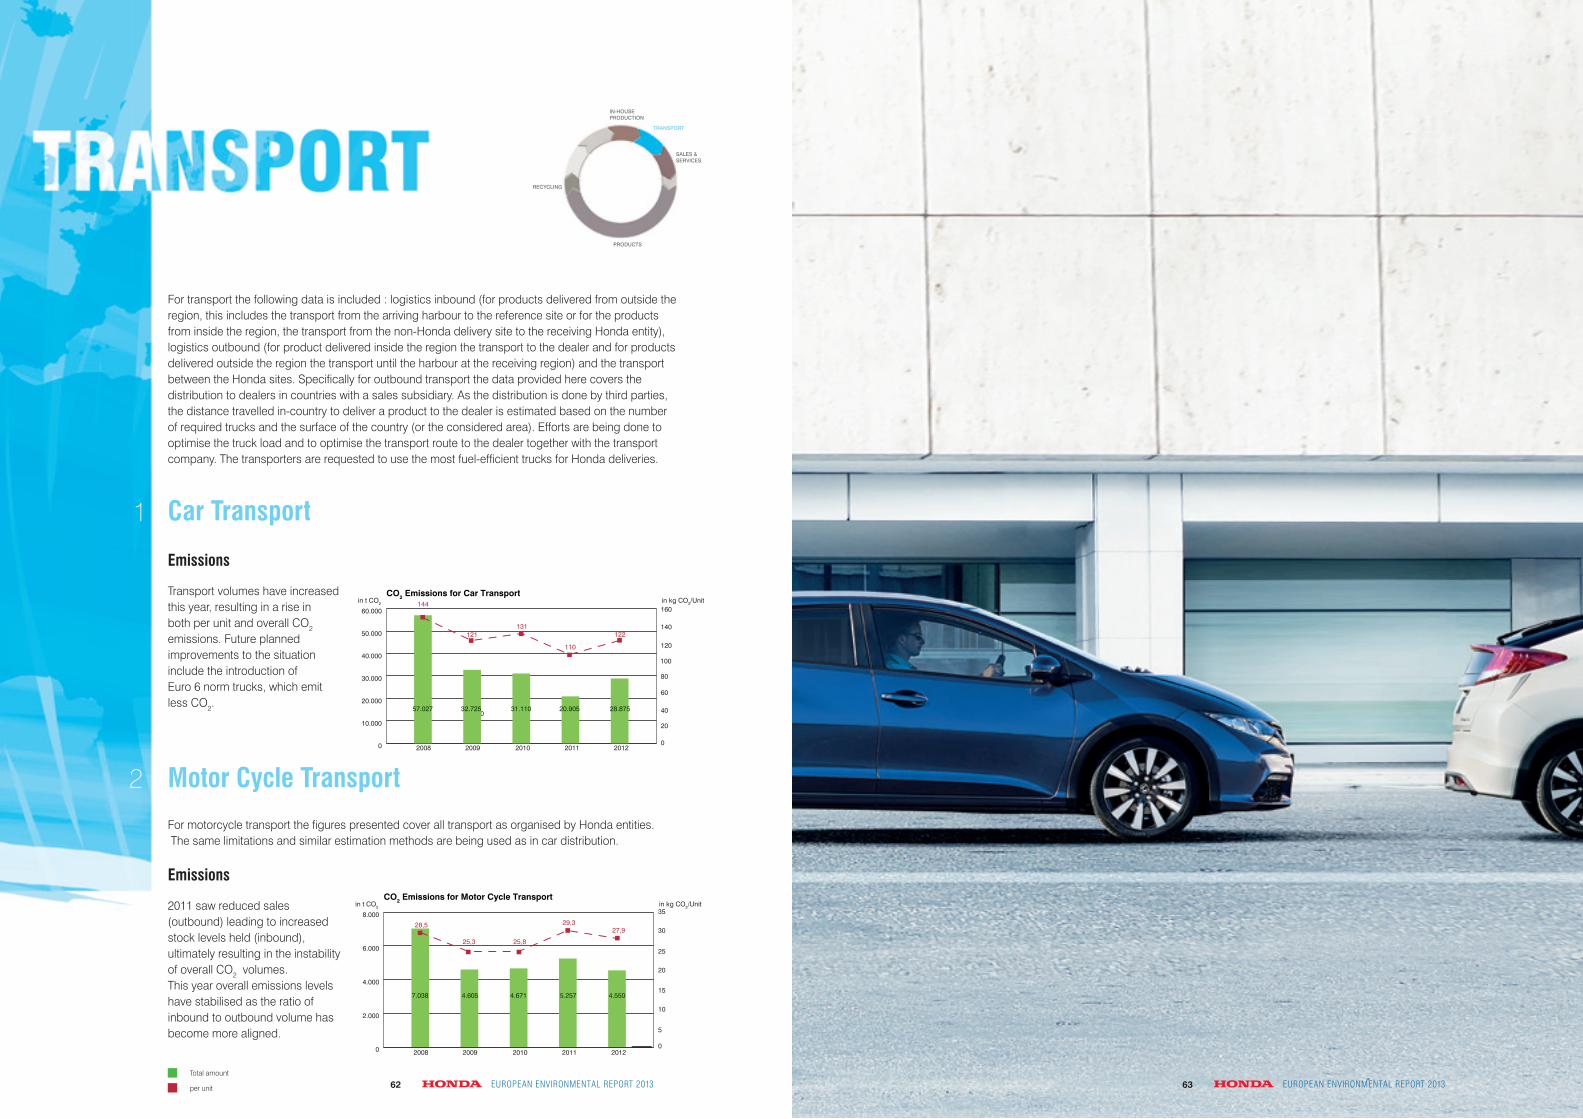
EuropEan EnvironmEntal rEport 201363EuropEan EnvironmEntal rEport 201362
Car Transport
Emissions
Transport volumes have increased this year, resulting in a rise in both per unit and overall CO2 emissions. Future planned improvements to the situation include the introduction of Euro 6 norm trucks, which emit less CO2.
For transport the following data is included : logistics inbound (for products delivered from outside the region, this includes the transport from the arriving harbour to the reference site or for the products from inside the region, the transport from the non-Honda delivery site to the receiving Honda entity), logistics outbound (for product delivered inside the region the transport to the dealer and for products delivered outside the region the transport until the harbour at the receiving region) and the transport between the Honda sites. Specifi cally for outbound transport the data provided here covers the distribution to dealers in countries with a sales subsidiary. As the distribution is done by third parties, the distance travelled in-country to deliver a product to the dealer is estimated based on the number of required trucks and the surface of the country (or the considered area). Efforts are being done to optimise the truck load and to optimise the transport route to the dealer together with the transport company. The transporters are requested to use the most fuel-effi cient trucks for Honda deliveries.
Motor Cycle Transport
Emissions
2011 saw reduced sales (outbound) leading to increased stock levels held (inbound), ultimately resulting in the instability of overall CO2 volumes. This year overall emissions levels have stabilised as the ratio of inbound to outbound volume has become more aligned.
For motorcycle transport the fi gures presented cover all transport as organised by Honda entities. The same limitations and similar estimation methods are being used as in car distribution.
0
in m³ in %
2008 2009 2010 2011 2012
2008 2009 2010 2011 2012
2008 2009 2010 2011 2012
2008 2009 2010 2011 2012
2008 2009 2010 2011 2012
2008 2009 2010 2011 2012
2008 2009 2010 2011 2012
2008 2009 2010 2011 2012
2008 2009 2010 2011 2012
Water Usage for Parts Production
0
2.000
4.000
6.000
8.000
10.000
0
50
100
150
200
250
300
350
400
450
100127
386
307
379
in t in %Waste for Parts Production
in tWaste to Landfill for Parts Production
0
10
20
30
40
in t CO2 in kg CO2/UnitCO2 Emissions for Car Transport
0
10.000
20.000
30.000
40.000
50.000
60.000
0
60
20
40
80
100
120
140
160144
121131
110
122
0
100
200
300
400
500
600
700
0
20
40
60
80
100
120
140
160
100 96
133
133
127
in t CO2 in kg CO2/UnitCO2 Emissions for Motor Cycle Transport
0
2.000
4.000
6.000
8.000
0
10
5
20
25
30
35
15
28,527,9
29,3
25,3 25,8
in t CO2 in kg CO2/UnitCO2 Emissions for Power Equipment Transport
0
1.000
2.000
3.000
4.000
5.000
6.000
7.000
0
1
2
3
4
54,7 4,6
4,3 4,1 4,0
in t-CO2 in %CO2 Emissions for Parts Transport
0
5.000
10.000
15.000
20.000
25.000
30.000
0
20
40
60
80
100
120
100 96,8
88,1 91,698,7
in MWh in kWh/m2Total Energy for Warehousing
0
10.000
20.000
30.000
40.000
50.000
0
20
40
60
80
100
120
89
82 85
99
117
Energy by Source for Warehousing
in t-CO2 in kg-CO2/m²CO2 Emissions for Warehousing
0
2.000
4.000
6.000
8.000
10.000
0
5
10
15
2019,2
14,515,4 15,1
17,9
Electricity32,9%
Gas67,0%
Oil0,1%
1.326
230 179
560
37
12
57.027
7.038
6.538
25.790
37.822
8193 6262 6680 6343 7002
35.508 36.716 41.842 45.828
24.154 22.620 21.683 21.683
5.227 5.466 5.075 4.555
4.605 4.671 5.257 4.550
32.725 31.110 20.905 28.875
9
0 0
599 450
1.364
9.352 8.342 6.505in m³ in %
2008 2009 2010 2011 2012
2008 2009 2010 2011 2012
2008 2009 2010 2011 2012
2008 2009 2010 2011 2012
2008 2009 2010 2011 2012
2008 2009 2010 2011 2012
2008 2009 2010 2011 2012
2008 2009 2010 2011 2012
2008 2009 2010 2011 2012
Water Usage for Parts Production
0
2.000
4.000
6.000
8.000
10.000
0
50
100
150
200
250
300
350
400
450
100127
386
307
379
in t in %Waste for Parts Production
in tWaste to Landfill for Parts Production
0
10
20
30
40
in t CO2 in kg CO2/UnitCO2 Emissions for Car Transport
0
10.000
20.000
30.000
40.000
50.000
60.000
0
60
20
40
80
100
120
140
160144
121131
110
122
0
100
200
300
400
500
600
700
0
20
40
60
80
100
120
140
160
100 96
133
133
127
in t CO2 in kg CO2/UnitCO2 Emissions for Motor Cycle Transport
0
2.000
4.000
6.000
8.000
0
10
5
20
25
30
35
15
28,527,9
29,3
25,3 25,8
in t CO2 in kg CO2/UnitCO2 Emissions for Power Equipment Transport
0
1.000
2.000
3.000
4.000
5.000
6.000
7.000
0
1
2
3
4
54,7 4,6
4,3 4,1 4,0
in t-CO2 in %CO2 Emissions for Parts Transport
0
5.000
10.000
15.000
20.000
25.000
30.000
0
20
40
60
80
100
120
100 96,8
88,1 91,698,7
in MWh in kWh/m2Total Energy for Warehousing
0
10.000
20.000
30.000
40.000
50.000
0
20
40
60
80
100
120
89
82 85
99
117
Energy by Source for Warehousing
in t-CO2 in kg-CO2/m²CO2 Emissions for Warehousing
0
2.000
4.000
6.000
8.000
10.000
0
5
10
15
2019,2
14,515,4 15,1
17,9
Electricity32,9%
Gas67,0%
Oil0,1%
1.326
230 179
560
37
12
57.027
7.038
6.538
25.790
37.822
8193 6262 6680 6343 7002
35.508 36.716 41.842 45.828
24.154 22.620 21.683 21.683
5.227 5.466 5.075 4.555
4.605 4.671 5.257 4.550
32.725 31.110 20.905 28.875
9
0 0
599 450
1.364
9.352 8.342 6.505
TRANSPORT
1
2
EuropEan EnvironmEntal rEport 20136362 EuropEan EnvironmEntal rEport 2013
RECYCLING
PRODUCTS
IN-HOUSE PRODUCTION
SALES & SERVICES
TRANSPORT
Total amount
per unit
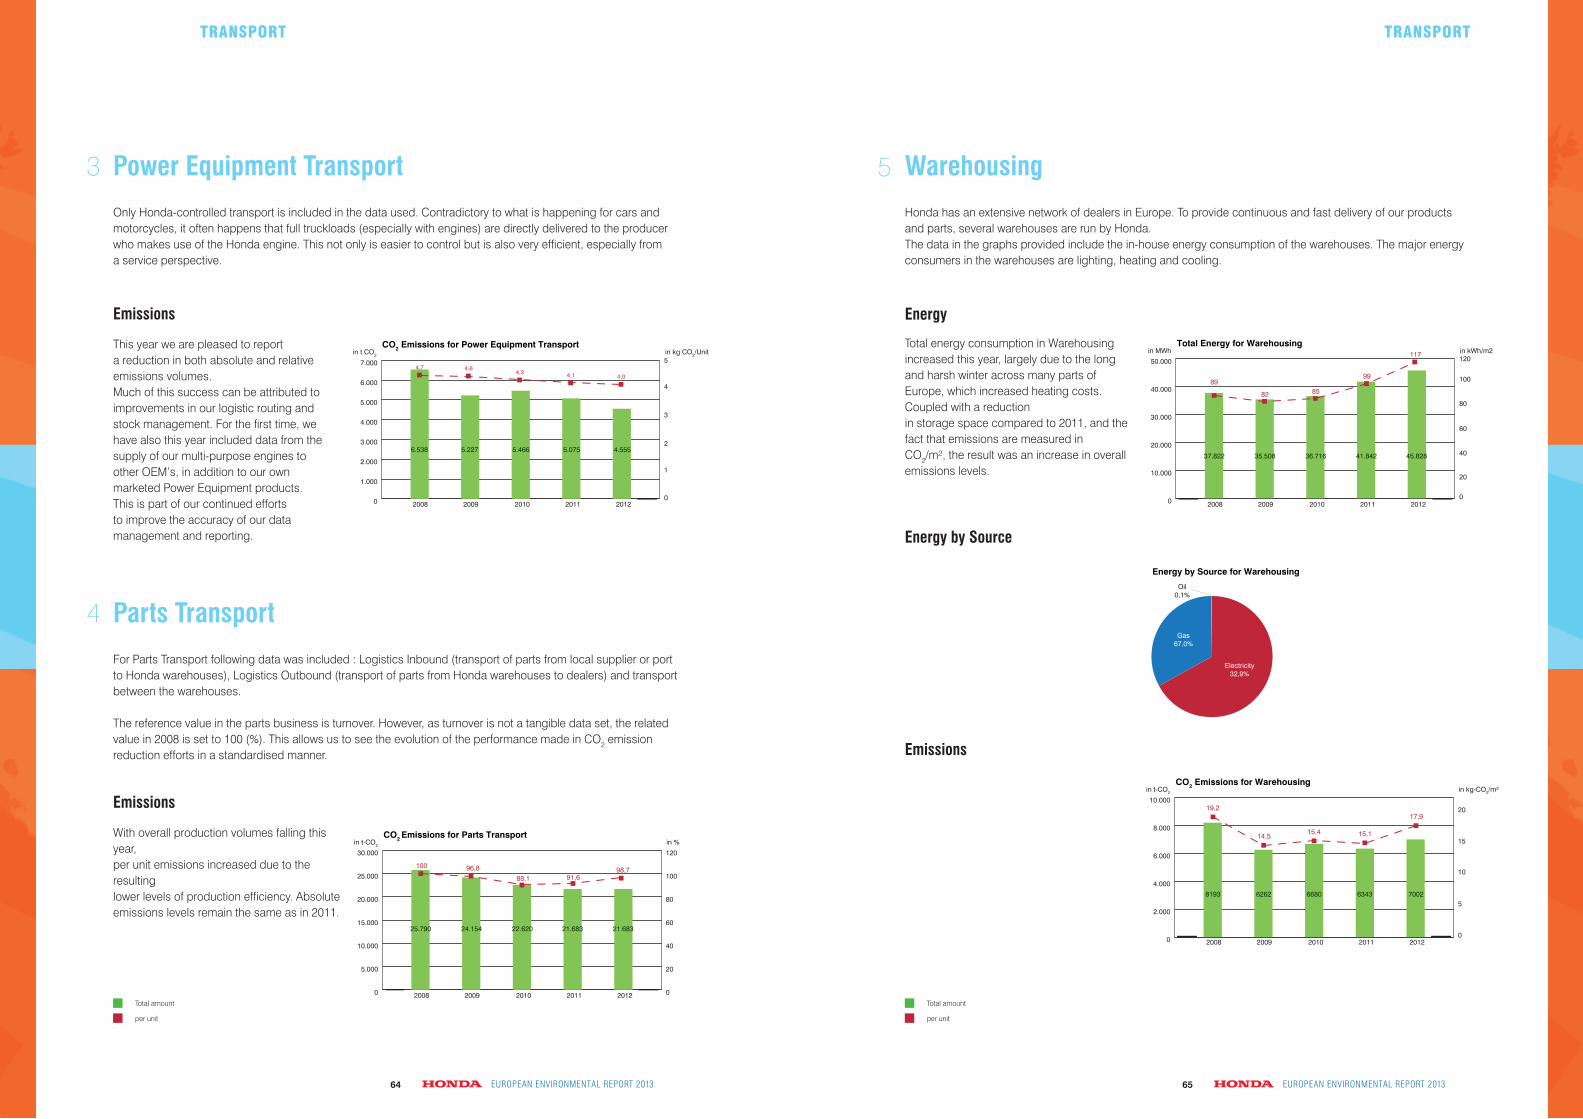
Power Equipment Transport
Emissions
This year we are pleased to report a reduction in both absolute and relative emissions volumes. Much of this success can be attributed to improvements in our logistic routing and stock management. For the first time, we have also this year included data from the supply of our multi-purpose engines to other OEM’s, in addition to our own marketed Power Equipment products. This is part of our continued efforts to improve the accuracy of our data management and reporting.
Only Honda-controlled transport is included in the data used. Contradictory to what is happening for cars and motorcycles, it often happens that full truckloads (especially with engines) are directly delivered to the producer who makes use of the Honda engine. This not only is easier to control but is also very efficient, especially from a service perspective.
Parts Transport
Emissions
With overall production volumes falling this year, per unit emissions increased due to the resulting lower levels of production efficiency. Absolute emissions levels remain the same as in 2011.
For Parts Transport following data was included : Logistics Inbound (transport of parts from local supplier or port to Honda warehouses), Logistics Outbound (transport of parts from Honda warehouses to dealers) and transport between the warehouses.
The reference value in the parts business is turnover. However, as turnover is not a tangible data set, the related value in 2008 is set to 100 (%). This allows us to see the evolution of the performance made in CO2 emission reduction efforts in a standardised manner.
in m³ in %
2008 2009 2010 2011 2012
2008 2009 2010 2011 2012
2008 2009 2010 2011 2012
2008 2009 2010 2011 2012
2008 2009 2010 2011 2012
2008 2009 2010 2011 2012
2008 2009 2010 2011 2012
2008 2009 2010 2011 2012
2008 2009 2010 2011 2012
Water Usage for Parts Production
0
2.000
4.000
6.000
8.000
10.000
0
50
100
150
200
250
300
350
400
450
100127
386
307
379
in t in %Waste for Parts Production
in tWaste to Landfill for Parts Production
0
10
20
30
40
in t CO2 in kg CO2/UnitCO2 Emissions for Car Transport
0
10.000
20.000
30.000
40.000
50.000
60.000
0
60
20
40
80
100
120
140
160144
121131
110
122
0
100
200
300
400
500
600
700
0
20
40
60
80
100
120
140
160
100 96
133
133
127
in t CO2 in kg CO2/UnitCO2 Emissions for Motor Cycle Transport
0
2.000
4.000
6.000
8.000
0
10
5
20
25
30
35
15
28,527,9
29,3
25,3 25,8
in t CO2 in kg CO2/UnitCO2 Emissions for Power Equipment Transport
0
1.000
2.000
3.000
4.000
5.000
6.000
7.000
0
1
2
3
4
54,7 4,6
4,3 4,1 4,0
in t-CO2 in %CO2 Emissions for Parts Transport
0
5.000
10.000
15.000
20.000
25.000
30.000
0
20
40
60
80
100
120
100 96,8
88,1 91,698,7
in MWh in kWh/m2Total Energy for Warehousing
0
10.000
20.000
30.000
40.000
50.000
0
20
40
60
80
100
120
89
82 85
99
117
Energy by Source for Warehousing
in t-CO2 in kg-CO2/m²CO2 Emissions for Warehousing
0
2.000
4.000
6.000
8.000
10.000
0
5
10
15
2019,2
14,515,4 15,1
17,9
Electricity32,9%
Gas67,0%
Oil0,1%
1.326
230 179
560
37
12
57.027
7.038
6.538
25.790
37.822
8193 6262 6680 6343 7002
35.508 36.716 41.842 45.828
24.154 22.620 21.683 21.683
5.227 5.466 5.075 4.555
4.605 4.671 5.257 4.550
32.725 31.110 20.905 28.875
9
0 0
599 450
1.364
9.352 8.342 6.505
TRANSPORT TRANSPORT
Warehousing
Energy
Energy by Source
Emissions
Total energy consumption in Warehousing increased this year, largely due to the long and harsh winter across many parts of Europe, which increased heating costs. Coupled with a reduction in storage space compared to 2011, and the fact that emissions are measured in CO2/m², the result was an increase in overall emissions levels.
Honda has an extensive network of dealers in Europe. To provide continuous and fast delivery of our products and parts, several warehouses are run by Honda.The data in the graphs provided include the in-house energy consumption of the warehouses. The major energy consumers in the warehouses are lighting, heating and cooling.
in m³ in %
2008 2009 2010 2011 2012
2008 2009 2010 2011 2012
2008 2009 2010 2011 2012
2008 2009 2010 2011 2012
2008 2009 2010 2011 2012
2008 2009 2010 2011 2012
2008 2009 2010 2011 2012
2008 2009 2010 2011 2012
2008 2009 2010 2011 2012
Water Usage for Parts Production
0
2.000
4.000
6.000
8.000
10.000
0
50
100
150
200
250
300
350
400
450
100127
386
307
379
in t in %Waste for Parts Production
in tWaste to Landfill for Parts Production
0
10
20
30
40
in t CO2 in kg CO2/UnitCO2 Emissions for Car Transport
0
10.000
20.000
30.000
40.000
50.000
60.000
0
60
20
40
80
100
120
140
160144
121131
110
122
0
100
200
300
400
500
600
700
0
20
40
60
80
100
120
140
160
100 96
133
133
127
in t CO2 in kg CO2/UnitCO2 Emissions for Motor Cycle Transport
0
2.000
4.000
6.000
8.000
0
10
5
20
25
30
35
15
28,527,9
29,3
25,3 25,8
in t CO2 in kg CO2/UnitCO2 Emissions for Power Equipment Transport
0
1.000
2.000
3.000
4.000
5.000
6.000
7.000
0
1
2
3
4
54,7 4,6
4,3 4,1 4,0
in t-CO2 in %CO2 Emissions for Parts Transport
0
5.000
10.000
15.000
20.000
25.000
30.000
0
20
40
60
80
100
120
100 96,8
88,1 91,698,7
in MWh in kWh/m2Total Energy for Warehousing
0
10.000
20.000
30.000
40.000
50.000
0
20
40
60
80
100
120
89
82 85
99
117
Energy by Source for Warehousing
in t-CO2 in kg-CO2/m²CO2 Emissions for Warehousing
0
2.000
4.000
6.000
8.000
10.000
0
5
10
15
2019,2
14,515,4 15,1
17,9
Electricity32,9%
Gas67,0%
Oil0,1%
1.326
230 179
560
37
12
57.027
7.038
6.538
25.790
37.822
8193 6262 6680 6343 7002
35.508 36.716 41.842 45.828
24.154 22.620 21.683 21.683
5.227 5.466 5.075 4.555
4.605 4.671 5.257 4.550
32.725 31.110 20.905 28.875
9
0 0
599 450
1.364
9.352 8.342 6.505
3
4
5
EuropEan EnvironmEntal rEport 20136564 EuropEan EnvironmEntal rEport 2013
Total amount
per unit
Total amount
per unit

EuropEan EnvironmEntal rEport 201367EuropEan EnvironmEntal rEport 201366
Honda continues to proactively promote environmental activities in the sales and service domain. Through these efforts, Honda can bring enhanced value to customers and communities, and earn their trust.
Sales subsidiaries
Total Energy
Emissions
Energy
Energy consumption for National Sales Offi ces remained consistent this year, while, encouragingly, overall CO2 emissions levels continued to fall.
This year we have introduced a global collection system for environmental data, ‘Slimoffi ce’. This has improved the accuracy and timeliness of data collected, further enhanced by a move from annual to bi-annual collection. Because of this change in reporting, fi gures vary slightly from those of 2011, but provide a more accurate analysis of the situation.
0
1.000
2.000
3.000
4.000
5.000
6.000
0
10
20
30
40
50
60
in MWh in kWh/m²
2008 2009 2010 2011 2012
2008 2009 2010 2011 2012
2008 2009 2010 2011 2012
2008 2009 2010 2011 2012
2008 2009 2010 2011 2012
2008 2009 2010 2011 2012
Total Energy National Sales Ofiices
0
4.000
8.000
12.000
16.000
20.000
24.000
28.000
0
50
100
150
200
250
210 219 211 208 213
in t-CO2 in kg CO2/m²CO2 Emissions for National Sales Offices
56 56 55
47
35
Energy by Source for National Sales Offices
Energy by Source for Sales Dealers
Energy by Source for R&D
0
500
1.000
1.500
2.000
0
20
40
60
80
100
120
140
160
180in MWh in kWh/Unit
Energy Consumption for Dealers
158 158160 161 166
0
50
100
150
200
250
300
0
5
10
15
20
25
30
in t-CO2 in kg CO2/m2
CO2 Emissions for Dealers
24 24 2323
22
0
2.000
4.000
6.000
8.000
10.000
12.000
0
100
200
300
400
500
600
in MWh in kWh/m²Total Energy R&D
500 476
444 443424
0
500
1.000
1.500
2.000
2.500
3.000
3.500
0
40
80
120
160in t-CO2 in kg/m²
CO2 Emissions for R&D153
136 131 131130
Gas42,4%
Electricity44,3%
Oil11,8%
Steam1,4%
Electricity43,2%
Gas24,0%
Oil32,8%
Electricity46,7%Gas
49,4%
Oil3,9%
20.363
5.422
1.756
267
9.826 8.725 8.324 8.530 8.680
266 251 256 239
1.781 1.754 1.785 1.800
5.288 5.640 4.870 3.810
20.538 21.646 21.551 23.090
3015 2675 2577 2511 2390
0
1.000
2.000
3.000
4.000
5.000
6.000
0
10
20
30
40
50
60
in MWh in kWh/m²
2008 2009 2010 2011 2012
2008 2009 2010 2011 2012
2008 2009 2010 2011 2012
2008 2009 2010 2011 2012
2008 2009 2010 2011 2012
2008 2009 2010 2011 2012
Total Energy National Sales Ofiices
0
4.000
8.000
12.000
16.000
20.000
24.000
28.000
0
50
100
150
200
250
210 219 211 208 213
in t-CO2 in kg CO2/m²CO2 Emissions for National Sales Offices
56 56 55
47
35
Energy by Source for National Sales Offices
Energy by Source for Sales Dealers
Energy by Source for R&D
0
500
1.000
1.500
2.000
0
20
40
60
80
100
120
140
160
180in MWh in kWh/Unit
Energy Consumption for Dealers
158 158160 161 166
0
50
100
150
200
250
300
0
5
10
15
20
25
30
in t-CO2 in kg CO2/m2
CO2 Emissions for Dealers
24 24 2323
22
0
2.000
4.000
6.000
8.000
10.000
12.000
0
100
200
300
400
500
600
in MWh in kWh/m²Total Energy R&D
500 476
444 443424
0
500
1.000
1.500
2.000
2.500
3.000
3.500
0
40
80
120
160in t-CO2 in kg/m²
CO2 Emissions for R&D153
136 131 131130
Gas42,4%
Electricity44,3%
Oil11,8%
Steam1,4%
Electricity43,2%
Gas24,0%
Oil32,8%
Electricity46,7%Gas
49,4%
Oil3,9%
20.363
5.422
1.756
267
9.826 8.725 8.324 8.530 8.680
266 251 256 239
1.781 1.754 1.785 1.800
5.288 5.640 4.870 3.810
20.538 21.646 21.551 23.090
3015 2675 2577 2511 2390
1
EuropEan EnvironmEntal rEport 20136766 EuropEan EnvironmEntal rEport 2013
RECYCLING
PRODUCTS
IN-HOUSE PRODUCTION
SALES & SERVICES
TRANSPORT
Total amount
per unit

Dealers
In this report we only include consolidated Honda sites. Six dealers in Switzerland are historically owned by our Swiss sales subsidiary and they are thus the only basis for the reporting in this section.
Total Energy
Emissions
Energy
Total energy consumption across the dealer network remained fairly stable throughout the year. While the long winter meant an increase in heating used, the total surface area used was reduced. As a result of increased heating, and a continued shift away from oil to gas powered-heating, gas takes a much bigger proportion of the energy mix compared to previous years.
0
1.000
2.000
3.000
4.000
5.000
6.000
0
10
20
30
40
50
60
in MWh in kWh/m²
2008 2009 2010 2011 2012
2008 2009 2010 2011 2012
2008 2009 2010 2011 2012
2008 2009 2010 2011 2012
2008 2009 2010 2011 2012
2008 2009 2010 2011 2012
Total Energy National Sales Ofiices
0
4.000
8.000
12.000
16.000
20.000
24.000
28.000
0
50
100
150
200
250
210 219 211 208 213
in t-CO2 in kg CO2/m²CO2 Emissions for National Sales Offices
56 56 55
47
35
Energy by Source for National Sales Offices
Energy by Source for Sales Dealers
Energy by Source for R&D
0
500
1.000
1.500
2.000
0
20
40
60
80
100
120
140
160
180in MWh in kWh/Unit
Energy Consumption for Dealers
158 158160 161 166
0
50
100
150
200
250
300
0
5
10
15
20
25
30
in t-CO2 in kg CO2/m2
CO2 Emissions for Dealers
24 24 2323
22
0
2.000
4.000
6.000
8.000
10.000
12.000
0
100
200
300
400
500
600
in MWh in kWh/m²Total Energy R&D
500 476
444 443424
0
500
1.000
1.500
2.000
2.500
3.000
3.500
0
40
80
120
160in t-CO2 in kg/m²
CO2 Emissions for R&D153
136 131 131130
Gas42,4%
Electricity44,3%
Oil11,8%
Steam1,4%
Electricity43,2%
Gas24,0%
Oil32,8%
Electricity46,7%Gas
49,4%
Oil3,9%
20.363
5.422
1.756
267
9.826 8.725 8.324 8.530 8.680
266 251 256 239
1.781 1.754 1.785 1.800
5.288 5.640 4.870 3.810
20.538 21.646 21.551 23.090
3015 2675 2577 2511 2390
0
1.000
2.000
3.000
4.000
5.000
6.000
0
10
20
30
40
50
60
in MWh in kWh/m²
2008 2009 2010 2011 2012
2008 2009 2010 2011 2012
2008 2009 2010 2011 2012
2008 2009 2010 2011 2012
2008 2009 2010 2011 2012
2008 2009 2010 2011 2012
Total Energy National Sales Ofiices
0
4.000
8.000
12.000
16.000
20.000
24.000
28.000
0
50
100
150
200
250
210 219 211 208 213
in t-CO2 in kg CO2/m²CO2 Emissions for National Sales Offices
56 56 55
47
35
Energy by Source for National Sales Offices
Energy by Source for Sales Dealers
Energy by Source for R&D
0
500
1.000
1.500
2.000
0
20
40
60
80
100
120
140
160
180in MWh in kWh/Unit
Energy Consumption for Dealers
158 158160 161 166
0
50
100
150
200
250
300
0
5
10
15
20
25
30
in t-CO2 in kg CO2/m2
CO2 Emissions for Dealers
24 24 2323
22
0
2.000
4.000
6.000
8.000
10.000
12.000
0
100
200
300
400
500
600
in MWh in kWh/m²Total Energy R&D
500 476
444 443424
0
500
1.000
1.500
2.000
2.500
3.000
3.500
0
40
80
120
160in t-CO2 in kg/m²
CO2 Emissions for R&D153
136 131 131130
Gas42,4%
Electricity44,3%
Oil11,8%
Steam1,4%
Electricity43,2%
Gas24,0%
Oil32,8%
Electricity46,7%Gas
49,4%
Oil3,9%
20.363
5.422
1.756
267
9.826 8.725 8.324 8.530 8.680
266 251 256 239
1.781 1.754 1.785 1.800
5.288 5.640 4.870 3.810
20.538 21.646 21.551 23.090
3015 2675 2577 2511 2390
SALES & SERVICES
Research and Development
Total Energy
Emissions
Energy
Total energy consumption within R&D remained fairly stable throughout the year. While the long winter meant an increase in heating used, the total surface area used and heated was reduced.
Total emissions were further reduced by another 5%, due to the purchase of CO2-free electricity by our R&D facility in Swindon. The increase in gas usage in the energy mix refl ects the increased use of heating.
0
1.000
2.000
3.000
4.000
5.000
6.000
0
10
20
30
40
50
60
in MWh in kWh/m²
2008 2009 2010 2011 2012
2008 2009 2010 2011 2012
2008 2009 2010 2011 2012
2008 2009 2010 2011 2012
2008 2009 2010 2011 2012
2008 2009 2010 2011 2012
Total Energy National Sales Ofiices
0
4.000
8.000
12.000
16.000
20.000
24.000
28.000
0
50
100
150
200
250
210 219 211 208 213
in t-CO2 in kg CO2/m²CO2 Emissions for National Sales Offices
56 56 55
47
35
Energy by Source for National Sales Offices
Energy by Source for Sales Dealers
Energy by Source for R&D
0
500
1.000
1.500
2.000
0
20
40
60
80
100
120
140
160
180in MWh in kWh/Unit
Energy Consumption for Dealers
158 158160 161 166
0
50
100
150
200
250
300
0
5
10
15
20
25
30
in t-CO2 in kg CO2/m2
CO2 Emissions for Dealers
24 24 2323
22
0
2.000
4.000
6.000
8.000
10.000
12.000
0
100
200
300
400
500
600
in MWh in kWh/m²Total Energy R&D
500 476
444 443424
0
500
1.000
1.500
2.000
2.500
3.000
3.500
0
40
80
120
160in t-CO2 in kg/m²
CO2 Emissions for R&D153
136 131 131130
Gas42,4%
Electricity44,3%
Oil11,8%
Steam1,4%
Electricity43,2%
Gas24,0%
Oil32,8%
Electricity46,7%Gas
49,4%
Oil3,9%
20.363
5.422
1.756
267
9.826 8.725 8.324 8.530 8.680
266 251 256 239
1.781 1.754 1.785 1.800
5.288 5.640 4.870 3.810
20.538 21.646 21.551 23.090
3015 2675 2577 2511 2390
0
1.000
2.000
3.000
4.000
5.000
6.000
0
10
20
30
40
50
60
in MWh in kWh/m²
2008 2009 2010 2011 2012
2008 2009 2010 2011 2012
2008 2009 2010 2011 2012
2008 2009 2010 2011 2012
2008 2009 2010 2011 2012
2008 2009 2010 2011 2012
Total Energy National Sales Ofiices
0
4.000
8.000
12.000
16.000
20.000
24.000
28.000
0
50
100
150
200
250
210 219 211 208 213
in t-CO2 in kg CO2/m²CO2 Emissions for National Sales Offices
56 56 55
47
35
Energy by Source for National Sales Offices
Energy by Source for Sales Dealers
Energy by Source for R&D
0
500
1.000
1.500
2.000
0
20
40
60
80
100
120
140
160
180in MWh in kWh/Unit
Energy Consumption for Dealers
158 158160 161 166
0
50
100
150
200
250
300
0
5
10
15
20
25
30
in t-CO2 in kg CO2/m2
CO2 Emissions for Dealers
24 24 2323
22
0
2.000
4.000
6.000
8.000
10.000
12.000
0
100
200
300
400
500
600
in MWh in kWh/m²Total Energy R&D
500 476
444 443424
0
500
1.000
1.500
2.000
2.500
3.000
3.500
0
40
80
120
160in t-CO2 in kg/m²
CO2 Emissions for R&D153
136 131 131130
Gas42,4%
Electricity44,3%
Oil11,8%
Steam1,4%
Electricity43,2%
Gas24,0%
Oil32,8%
Electricity46,7%Gas
49,4%
Oil3,9%
20.363
5.422
1.756
267
9.826 8.725 8.324 8.530 8.680
266 251 256 239
1.781 1.754 1.785 1.800
5.288 5.640 4.870 3.810
20.538 21.646 21.551 23.090
3015 2675 2577 2511 2390
SALES & SERVICES
2 3
EuropEan EnvironmEntal rEport 20136968 EuropEan EnvironmEntal rEport 2013
Total amount
per unit
Total amount
per unit
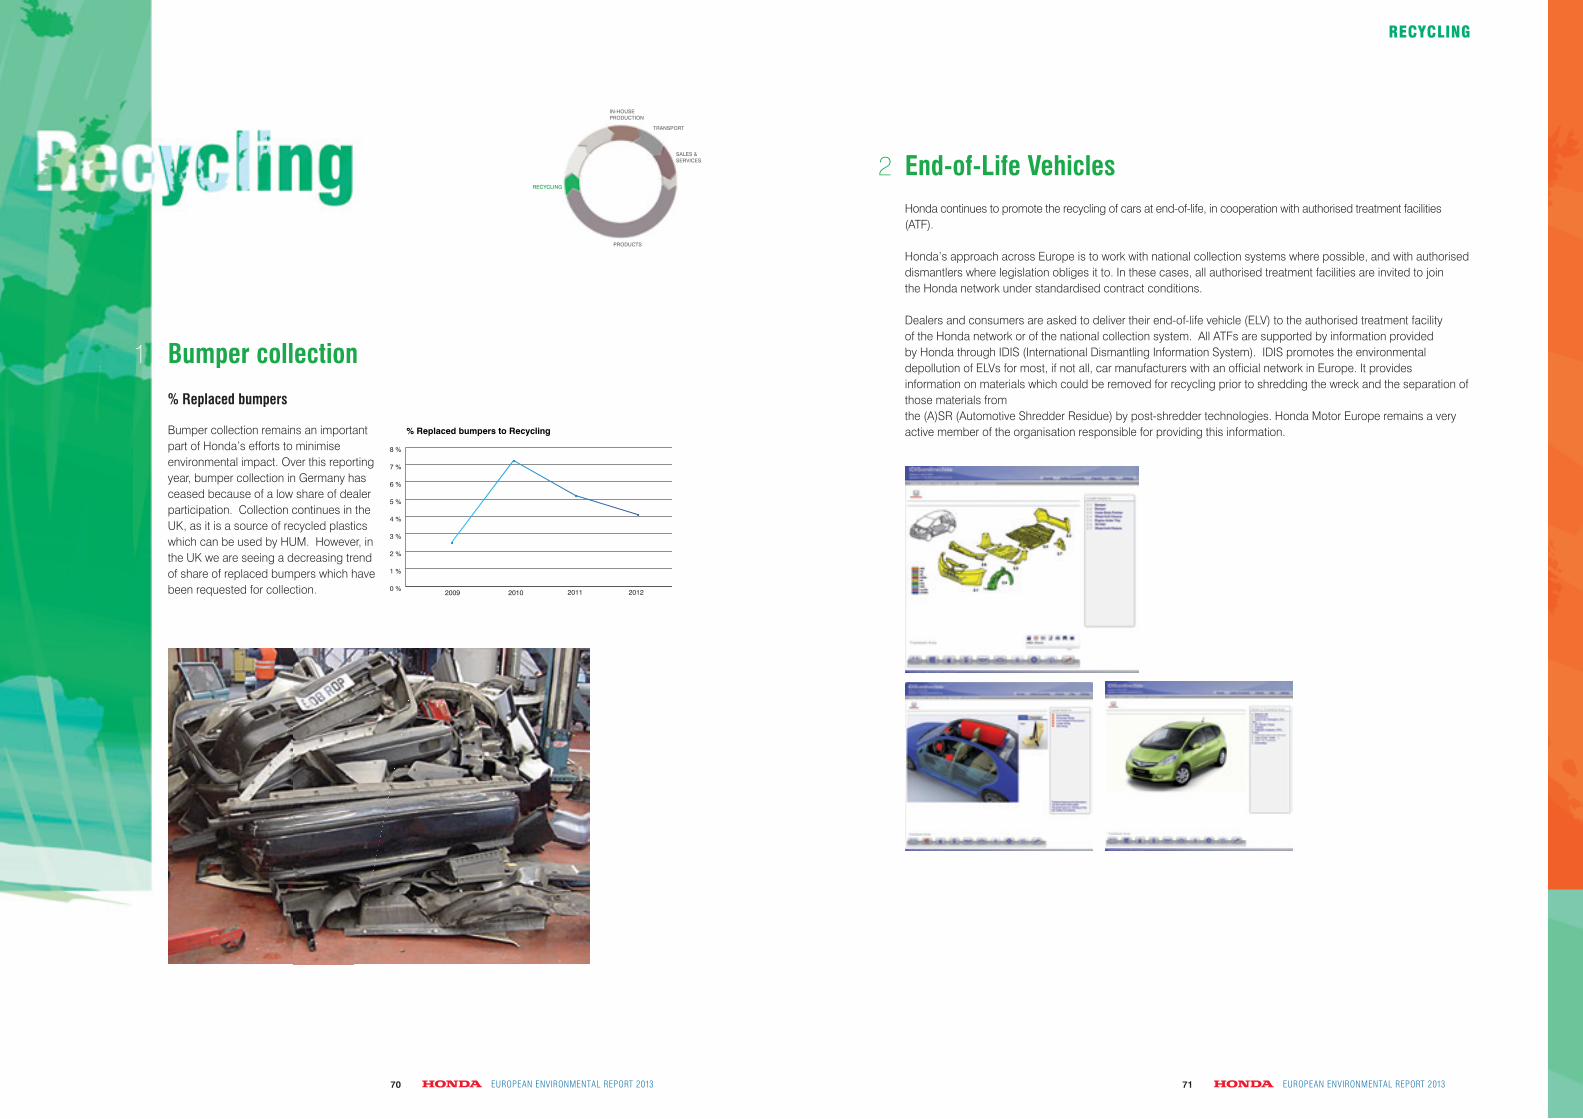
EuropEan EnvironmEntal rEport 2013 EuropEan EnvironmEntal rEport 20137170
Bumper collection
% Replaced bumpers
Bumper collection remains an important part of Honda’s efforts to minimise environmental impact. Over this reporting year, bumper collection in Germany has ceased because of a low share of dealer participation. Collection continues in the UK, as it is a source of recycled plastics which can be used by HUM. However, in the UK we are seeing a decreasing trend of share of replaced bumpers which have been requested for collection. 0 %
1 %
2 %
3 %
4 %
5 %
6 %
7 %
8 %
2008 2009 2010 2011
2009 2010 2011 2012
2012
CO2 in g/km
136
138
140
142
144
146
148
150
152
154
156
Car Models per HEPS Category
0
2
4
6
8
10
12
14
16
Motorcycle Models per HEPS Category
0
2
4
6
8
10
12
14
16
2010 2011 2012
2010 2011 2012
2010 2011 2012
Power Equipment Models per HEPS Category
0
5
10
15
20
25
30
35
13
14
45
1010 10
33 3
11 1
11
2
1
1
16
13
1
16
12
2
% Replaced bumpers to Recycling
Honda continues to promote the recycling of cars at end-of-life, in cooperation with authorised treatment facilities (ATF).
Honda’s approach across Europe is to work with national collection systems where possible, and with authorised dismantlers where legislation obliges it to. In these cases, all authorised treatment facilities are invited to join the Honda network under standardised contract conditions.
Dealers and consumers are asked to deliver their end-of-life vehicle (ELV) to the authorised treatment facility of the Honda network or of the national collection system. All ATFs are supported by information provided by Honda through IDIS (International Dismantling Information System). IDIS promotes the environmental depollution of ELVs for most, if not all, car manufacturers with an offi cial network in Europe. It provides information on materials which could be removed for recycling prior to shredding the wreck and the separation of those materials from the (A)SR (Automotive Shredder Residue) by post-shredder technologies. Honda Motor Europe remains a very active member of the organisation responsible for providing this information.
End-of-Life Vehicles
RECYCLING
1
2RECYCLING
PRODUCTS
IN-HOUSE PRODUCTION
SALES & SERVICES
TRANSPORT

EuropEan EnvironmEntal rEport 2013 EuropEan EnvironmEntal rEport 20137372
Case studyHonda motor nigeria (Hmn) - providing vital water to the local community
Clean water is in scarce supply for the local community of HMN, particularly in the annual dry season when much of the water is not pure enough for domestic usage. There is no public water supply, so residents previously had to queue for a long time to get their water from a bore-hole. To help with the problem, HMN has installed a tap with metering equipment outside its external fence, providing chlorinised and filtered, and therefore purified, water directly from the factory. During FY2013 HMN provided 1,245 cubic metres of free clean water to the local community, meaning less queuing, and a continuous supply throughout the year, even during the dry season.
Philanthropy Case studySchool of Dreams - taking Honda philosophy into uK classrooms
Since 2006, Honda (UK) has taken the ‘School of Dreams’ programme into 200 schools across the UK, directly engaging with more than 10,000 students aged 11-13 years. School of Dreams uses the key Honda philosophy of ‘The Power of Dreams’ as the basis for teaching skills and strategies which help children turn their dreams and ambitions into a reality.
Developed by Honda (UK) and a team of independent education experts, School of Dreams is part of the company’s commitment to giving back to the local communities in which it operates. The programme has been designed to help students discover different, creative, and fun ways to think and learn. Crucially, it encourages participants of the importance of perseverance, based on the company founder, Soichiro Honda’s belief that “success is 99% failure”.
Held in schools as a two-day workshop, School of Dreams has also been designed to create an ongoing legacy for months or years to come. Students are encouraged to become ‘Sharers’ and ‘Doers’, by both taking what they have learnt and passing it on to others; and by organising projects and initiatives which change something in their local community for the better. The programme runs an award scheme which recognises this sharing and doing, as well as offering ongoing advice and support materials. It is estimated that to date more than 30,000 further students and teaching staff have benefitted from the cascade programme.

EuropEan EnvironmEntal rEport 2013 EuropEan EnvironmEntal rEport 20137574
Logistics – Distribution
Production
included in Report
Name City Country
Honda of the UK Manufacturing Ltd (cars) Swindon UK
Honda Turkiye A.S. (cars) Gebze Turkey
Honda Italia Industriale S.P.A. (motorcycles and power equipment) Atessa Italy
C.I.A.P. S.P.A. (parts) Bologna Italy
Montesa Honda S.A. (motorcycles)* San Perpetua de Mogoda (Barcelona) Spain
Honda France Manufacturing S.A.S. (power equipment) Ormes (Orléans) France
Honda Mfg. (Nigeria) Ltd (motorcycles) Lagos Nigeria
Name City Country
Honda Europe NV Gent Belgium
Honda Belgium Factory N.V. Aalst Belgium
Honda Logistics Center Austria GmbH Guntramsdorf Austria
Honda Logistics Center Central Europe Sp.z.O.Z. Pniewy Poland
Honda Logistics Center Spain AS Barcelona Spain
Honda Logistics Centre Italy SPA Collognola Al Colli Italy
Honda Logistics Center Sweden AB. Arlöw Sweden
Honda Logistics Centre UK Ltd South-Marston UK
Honda Motor Company South Africa* Midrand South Africa
Honda Gulf Fze Dubai United Arab Emirates
Honda Motor Rus LLC* Moscow Russia
Honda Ukraine LLC* Kyiv Ukraïne
* Data split from total site data
* included in motorcycle production data until 2009.
Barcelona, Spain
Swindon, UK
Verona, Italy
Malmö, Sweden
Pniewy, Poland
HONDA SITES
EuropEan EnvironmEntal rEport 201375Ghent, Belgium
EuropEan EnvironmEntal rEport 201375

EuropEan EnvironmEntal rEport 2013 EuropEan EnvironmEntal rEport 20137776 EuropEan EnvironmEntal rEport 201376
Sales subsidiaries (Administration) Research and Development
Ref. City Country
Honda Research Institute Europe GmbH Offenbach am Main Germany
Honda R&D Europe (Deutschland) GmbH Offenbach am Main Germany
Honda R&D Europe (U.K.) Ltd South Marston (Swindon) United Kingdom
Honda R&D Europe (Italia) S.r.l. Roma Italy
Name City Country
Honda Motor Europe Ltd (European headquarters) Slough (London) United Kingdom
Honda Belgium – Sales Office Zellik Belgium
Honda Nederland BV Schiphol-Rijk The Netherlands
Honda Nordic AB Malmö Sweden
Honda Motor Europe Ltd – Norge Drammen Norway
Honda Motor Europe Ltd - Denmark Kolding Denmark
Honda Motor Europe Ltd – Finland Helsinki Finland
Honda Motor Europe - Estonia Tallinn Estonia
Honda Motor Rus LLC* Moscow Russia
Honda Ukraine LLC* Kyiv Ukraine
Honda Turkey AS Kocaeli Turkey
Honda Motor Co., Middle East Office
Jebel Ali South Free Zone
United Arab Emirates
Honda Motor Company South Africa* Midrand South Africa
Honda Portugal SA Sintra Portugal
Honda Automoviles España SA Barcelona Spain
Montesa Honda SA Barcelona Spain
Honda France SA Marne la Vallée France
Honda Italia Industriale - Atessa Atessa - chieti Italy
Honda Italia Industriale Spa - Roma Office Roma Italy
Honda Automobili Italia Spa Verona Italy
Honda (Suisse) SA Vernier Geneve Switzerland
Honda Automobile Suisse SA Satigny-Geneve Switzerland
Honda Deutschland GmbH Offenbach Germany
Honda Austria Gesellschaft Mbh Wiener Neudorf Austria
Honda Hungary Budaörs Hungary
Honda Slovakia Bratislava Slovakia
Honda Ceska republika, spol. s r.o. Praha 5 Czech Republic
Honda Poland Ltd Warszawa Poland
DealersName City Country
Garage du golf Aigle Switzerland
Garage city servette Geneve Switzerland
Garage de bellevaux Lausanne Switzerland
Garage des jordils Neuchatel Switzerland
Garage de villars chandolan Fribourg Switzerland
Letzigraben garage Zurich Switzerland
* Data split from total site data
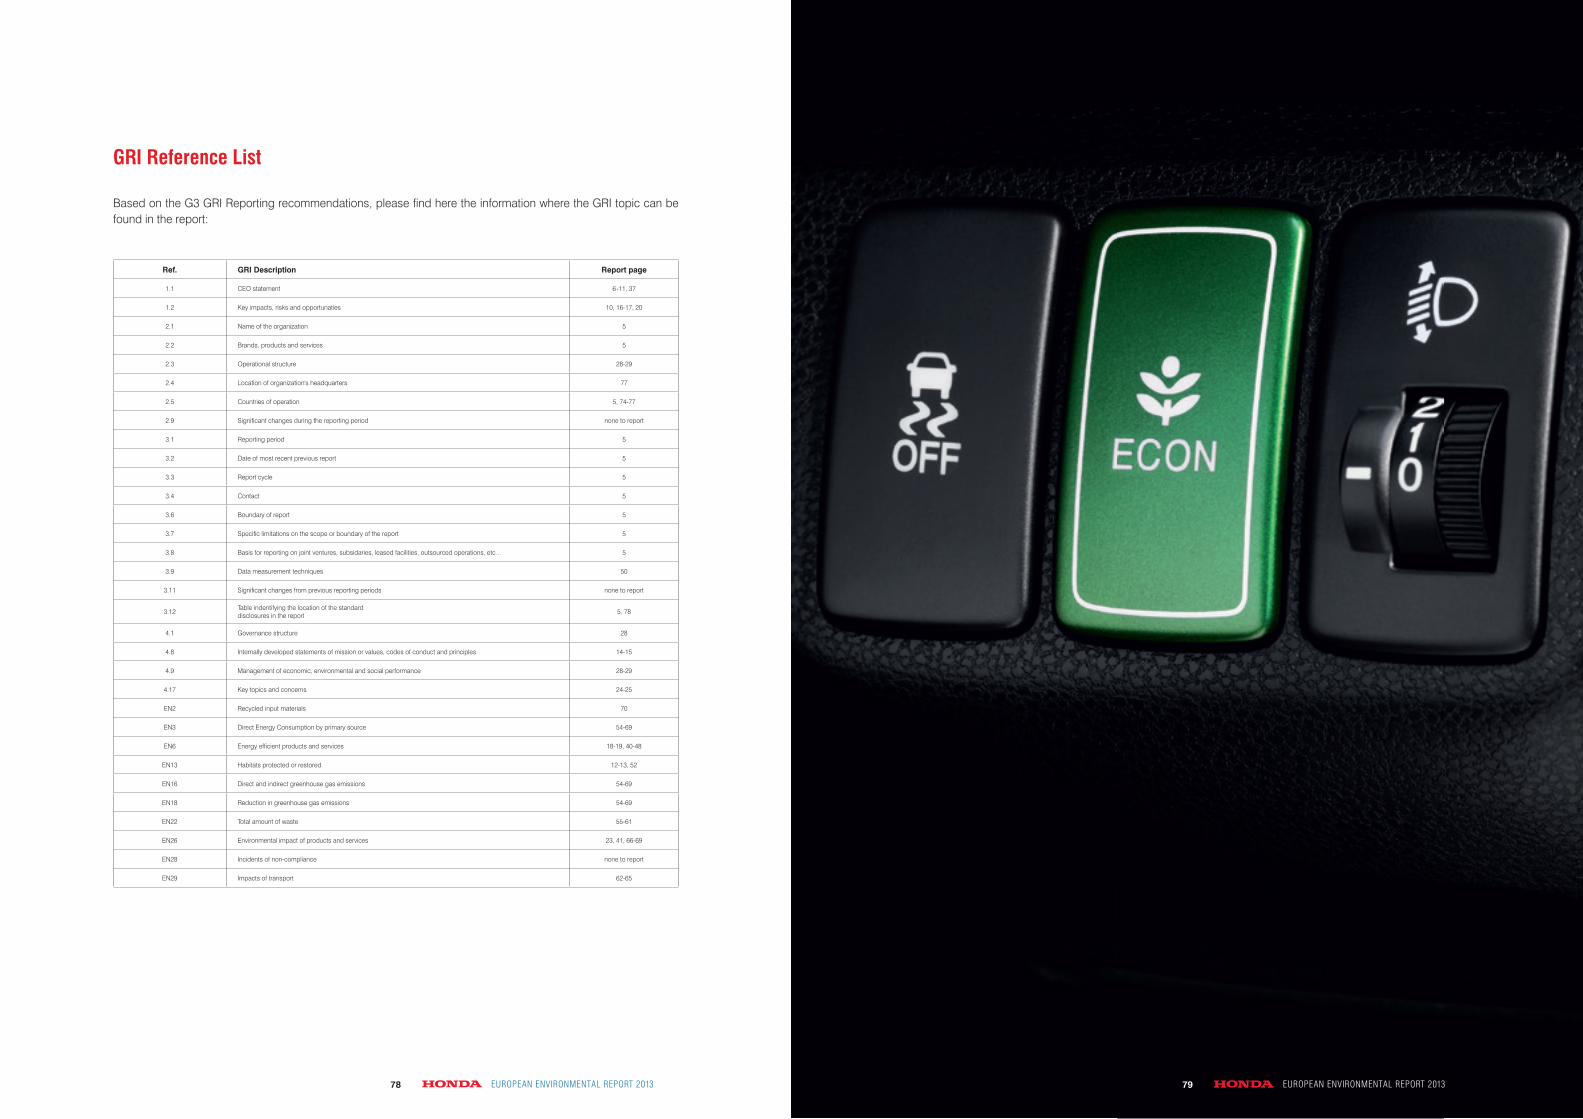
EuropEan EnvironmEntal rEport 2013 EuropEan EnvironmEntal rEport 20137978
GRI Reference List
Based on the G3 GRI Reporting recommendations, please fi nd here the information where the GRI topic can be found in the report:
Ref. GRI Description Report page
1.1 CEO statement 6-11, 37
1.2 Key impacts, risks and opportunaties 10, 16-17, 20
2.1 Name of the organization 5
2.2 Brands, products and services 5
2.3 Operational structure 28-29
2.4 Location of organization's headquarters 77
2.5 Countries of operation 5, 74-77
2.9 Signifi cant changes during the reporting period none to report
3.1 Reporting period 5
3.2 Date of most recent previous report 5
3.3 Report cycle 5
3.4 Contact 5
3.6 Boundary of report 5
3.7 Specifi c limitations on the scope or boundary of the report 5
3.8 Basis for reporting on joint ventures, subsidaries, leased facilities, outsourced operations, etc… 5
3.9 Data measurement techniques 50
3.11 Signifi cant changes from previous reporting periods none to report
3.12 Table indentifying the location of the standard disclosures in the report 5, 78
4.1 Governance structure 28
4.8 Internally developed statements of mission or values, codes of conduct and principles 14-15
4.9 Management of economic, environmental and social performance 28-29
4.17 Key topics and concerns 24-25
EN2 Recycled input materials 70
EN3 Direct Energy Consumption by primary source 54-69
EN6 Energy effi cient products and services 18-19, 40-48
EN13 Habitats protected or restored 12-13, 52
EN16 Direct and indirect greenhouse gas emissions 54-69
EN18 Reduction in greenhouse gas emissions 54-69
EN22 Total amount of waste 55-61
EN26 Environmental impact of products and services 23, 41, 66-69
EN28 Incidents of non-compliance none to report
EN29 Impacts of transport 62-65
EuropEan EnvironmEntal rEport 201379 EuropEan EnvironmEntal rEport 201379

EuropEan EnvironmEntal rEport 201380 EuropEan EnvironmEntal rEport 201380
Honda Motor Europe Ltd - EESPO
Wijngaardveld 1 (Noord V)
9300 Aalst - Belgium