European Engine Outlook Potential of the Gasoline Engine · PDF fileGasoline Engine Pavan...
27
© 2015 IHS Presentation ihs.com IHS AUTOMOTIVE European Engine Outlook – Potential of the Gasoline Engine Pavan Potluri, Senior Powertrain Analyst +44 (0) 208 544 7973, [email protected] IHS Automotive Customer Briefing – Frankfurt | 17 June 2015
Transcript of European Engine Outlook Potential of the Gasoline Engine · PDF fileGasoline Engine Pavan...

© 2015 IHS
Presentation
ihs.com
IHS AUTOMOTIVE
European Engine Outlook – Potential of the
Gasoline Engine
Pavan Potluri, Senior Powertrain Analyst
+44 (0) 208 544 7973, [email protected]
IHS Automotive Customer Briefing – Frankfurt | 17 June 2015

Contents
© 2015 IHS
NOITCUDORTNI
ETABED TNECER EHT - LESEID
KOOLTUO ENIGNE ENILOSAG
YRAMMUS
2
© 2015 IHS
Introduction
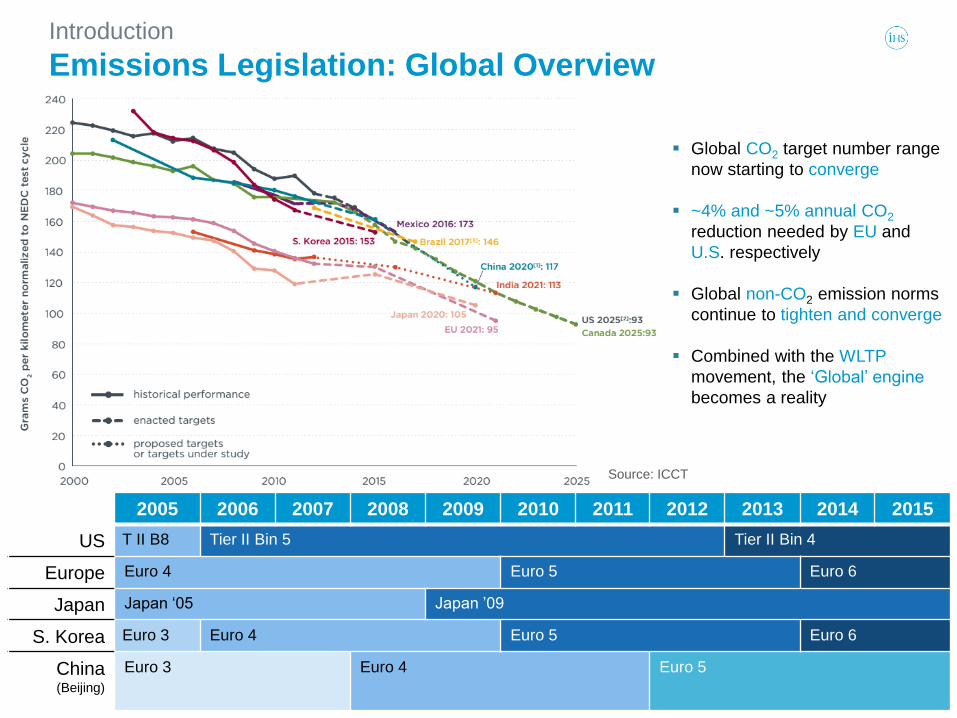
Emissions Legislation: Global Overview
3
2005 2006 2007 2008 2009 2010 2011 2012 2013 2014 2015
US T II B8 Tier II Bin 5 Tier II Bin 4
Europe Euro 4 Euro 5 Euro 6
Japan Japan90’napaJ 50‘
S. Korea Euro 3 Euro 4 Euro 5 Euro 6
China (Beijing)
Euro 3 Euro 4 Euro 5
Global CO2 target number range
now starting to converge
~4% and ~5% annual CO2
reduction needed by EU and
U.S. respectively
Global non-CO2 emission norms
continue to tighten and converge
Combined with the WLTP
movement, the ‘Global’enigne
becomes a reality
Source: ICCT

© 2015 IHS 4
2017
• PN regulations for GDI engines – EU6c
• LCV targets 178g/km
2021
• 95g/km (NEDC) – 27% reduction from all OEMs
• WLTC + RDE challenges
• LCV targets 147g/km
2025?
• 78-68g/km? vehicle fleet average target sets the bar high
2015
• 130g/km for all Pass.Cars
• Costly NOx reduction for Diesel - EU6b
Introduction
European Legislation Roadmap

© 2015 IHS
Introduction
How have OEMs achieved these targets in the EU?
• Diesel engines generally achieve better CO2 values on NEDC
• Before Euro 5b (2011) the non-CO2 limit values (NOx, PM, PN..) for the diesel engines
were relatively weak compared to some other markets like the USA
5
56%
30%
35%
40%
45%
50%
55%
60%
2009 2010 2011 2012 2013 2014
EU Diesel Penetration (Pass.Car Only)
Diesel Sales Diesel Production Only Source: IHS

Contents
© 2015 IHS
NOITCUDORTNI
ETABED TNECER EHT - LESEID
KOOLTUO ENIGNE ENILOSAG
YRAMMUS
6

© 2015 IHS 7
Diesel - The Recent Debate

© 2015 IHS
Diesel - The Recent Debate
8
• Focus on CO2 in Europe incentivized consumer behaviour
towards diesel
• Increased Particulate Matter(PM), Nitrous Oxides(NOx) in
cities as a result – Health issues, visual pollution
• Increased pressure on city authorities to limit entry of diesel
vehicles – creation of zero/ low emission zones, higher
congestion charges, out right-ban on diesel vehicles

© 2015 IHS 9
Diesel - The Recent Debate
Certified Emissions vs. Reality
• NOx emission limits
lowered by 85%
between 2000 and
2014
• On-road emission
levels decreased only
by ~45%
• Upcoming test
procedure changes
(WLTC, RDE) should
improve this situation
Source: REAL-WORLD EXHAUST EMISSIONS FROM MODERN DIESEL CARS, ICCT, October 2014

© 2015 IHS
Diesel - The Recent Debate
Real Driving Emissions (RDE)
• Real driving emissions have not decreased as fast as expected
• New RDE procedure will complement NEDC/ WLTC
• Expected to be phased in ~ 2017/18 (likely pushed to 2020) starting
with Euro6c
• “Random”SMEP roelcycevird
• Measurement Targets:
NOx (main target for Diesel)
CO
PN (main target for GDI)
HC (optional)
10
Source: TUV Nord

Contents
© 2015 IHS
NOITCUDORTNI
ETABED TNECER EHT - LESEID
KOOLTUO ENIGNE ENILOSAG
YRAMMUS
11

© 2015 IHS
Gasoline Engine Outlook
Gasoline around the World
12
Light Vehicle Gasoline Sales (incl. LCVs)
0% 10% 20% 30% 40% 50% 60% 70% 80% 90% 100%
GLOBAL
NA
Brazil
GC
EU28
Percentage Share
2012 2021 Source: IHS Note: Includes Gas-E85/E100 bi-fuel vehicles

© 2015 IHS
8,6
1,5
1,4
0,0
1,0
2,0
3,0
4,0
5,0
6,0
7,0
8,0
9,0
10,0
20
12
20
13
20
14
20
15
20
16
20
17
20
18
20
19
20
20
20
21
Per
cen
t S
har
e
Gas Gas-CNG/-E85/-LPG Electric
13
Gasoline Engine Outlook
EU28 – LCV Sales by Fuel Type
• Diesel is the dominant fuel in
the LCV segment, expected to
stay strong in long term
• Gasoline shows some growth,
especially in smaller LCVs
• Modest growth for
CNG/E85/LPG fuels
• Electric LCVs expected to
reach ~1.4% in 2021
89,0
85,0
87,0
89,0
91,0
93,0
95,0
20
12
20
13
20
14
20
15
20
16
20
17
20
18
20
19
20
20
20
21
Per
cen
t S
har
e
Diesel
Source: IHS

© 2015 IHS 14
Gasoline Engine Outlook
EU28 - Passenger Vehicle Sales by Fuel Type
• Gasoline set to overtake diesel
as the dominant fuel
• Theotleseidmorf”revossorc“
gasoline expected to happen
around 2021 (might even
happen slightly earlier)
• Modest growth for
CNG/E85/LPG fuels
• Electricity as a propulsion
source is expected to reach
~1.6% by 2021
2,4
1,6
0,0
1,0
2,0
3,0
4,0
5,0
20
12
20
13
20
14
20
15
20
16
20
17
20
18
20
19
20
20
20
21
Per
cen
t S
har
e
Gas-CNG/-E85/-LPG Electric
48,4
35,0
40,0
45,0
50,0
55,0
60,0
20
12
20
13
20
14
20
15
20
16
20
17
20
18
20
19
20
20
20
21
Perc
ent
Share
Gas Diesel
Source: IHS

© 2015 IHS
Gasoline Engine Outlook
EU28 – Gasoline Market Share by Veh. Segment
15
0% 10% 20% 30% 40% 50% 60% 70% 80%
Total Share
A-/B-Segm.
C-/D-Segm.
E-/F-Segm.
Percentage Share
2012 2021
6.5%
-2.4%
Source: IHS
5.2%
5.6%

© 2015 IHS 16
Gasoline Engine Outlook
EU28 Gasoline Extremes– A Segment
• Gasoline remains the
dominant fuel in A-segment
• Diesel share drops to zero
after 2019
• Electric Vehicles expected to
gain a significant share going
forwards
• Some growth in
CNG/E85/LPG fuels
6,4
9,2
0,0
2,0
4,0
6,0
8,0
10,0
12,0
14,0
20
12
20
13
20
14
20
15
20
16
20
17
20
18
20
19
20
20
20
21
Per
cen
t S
har
e
Diesel Gas-CNG/-E85/-LPG Electric
84,5
70,0
75,0
80,0
85,0
90,0
95,0
20
12
20
13
20
14
20
15
20
16
20
17
20
18
20
19
20
20
20
21
Per
cen
t S
har
e
Gas
Source: IHS
© 2015 IHS 17
Gasoline Engine Outlook
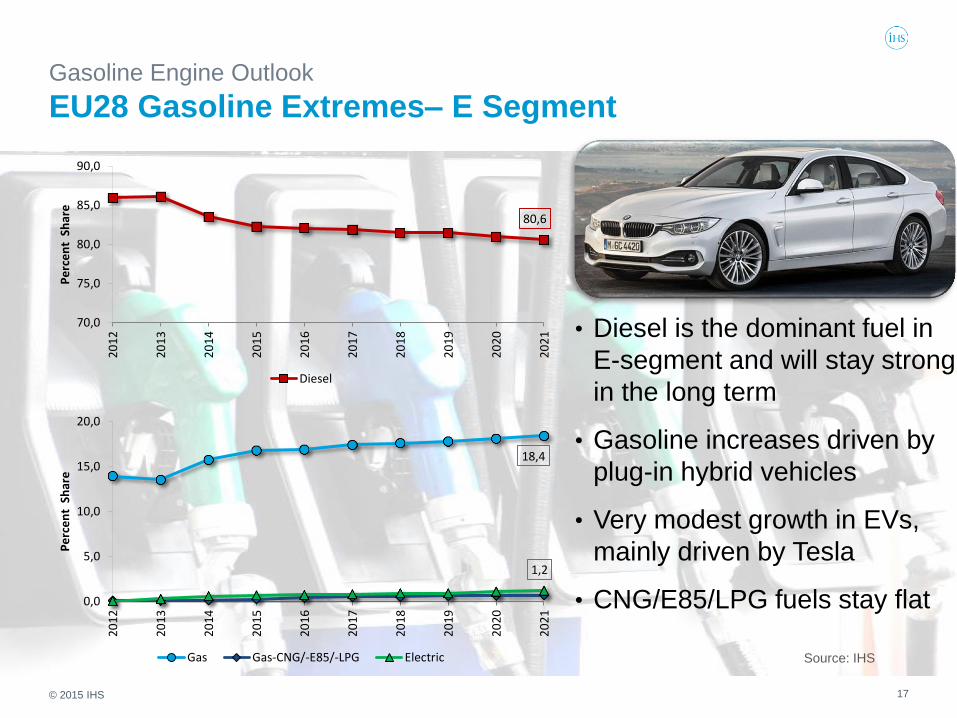
EU28 Gasoline Extremes– E Segment
• Diesel is the dominant fuel in
E-segment and will stay strong
in the long term
• Gasoline increases driven by
plug-in hybrid vehicles
• Very modest growth in EVs,
mainly driven by Tesla
• CNG/E85/LPG fuels stay flat
80,6
70,0
75,0
80,0
85,0
90,0
20
12
20
13
20
14
20
15
20
16
20
17
20
18
20
19
20
20
20
21
Pe
rce
nt
Sh
are
Diesel
18,4
1,2
0,0
5,0
10,0
15,0
20,0
20
12
20
13
20
14
20
15
20
16
20
17
20
18
20
19
20
20
20
21
Pe
rce
nt
Sh
are
Gas Gas-CNG/-E85/-LPG Electric Source: IHS
© 2015 IHS 18
Gasoline Engine Outlook
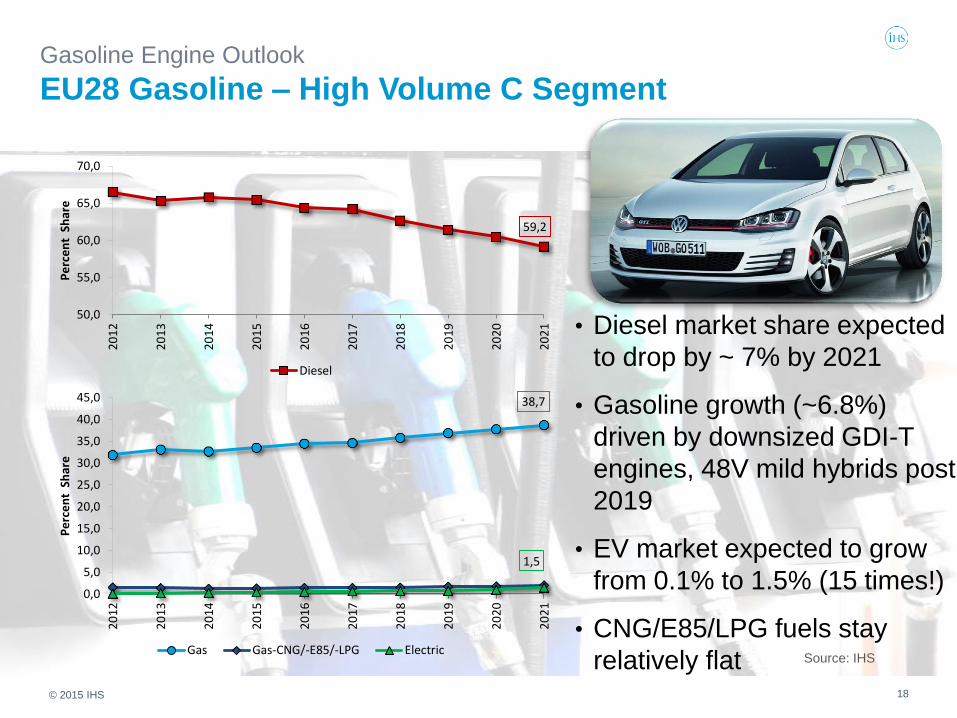
EU28 Gasoline – High Volume C Segment
• Diesel market share expected
to drop by ~ 7% by 2021
• Gasoline growth (~6.8%)
driven by downsized GDI-T
engines, 48V mild hybrids post
2019
• EV market expected to grow
from 0.1% to 1.5% (15 times!)
• CNG/E85/LPG fuels stay
relatively flat
Source: IHS
59,2
50,0
55,0
60,0
65,0
70,0
20
12
20
13
20
14
20
15
20
16
20
17
20
18
20
19
20
20
20
21
Pe
rce
nt
Sh
are
Diesel
38,7
1,5
0,0
5,0
10,0
15,0
20,0
25,0
30,0
35,0
40,0
45,0
20
12
20
13
20
14
20
15
20
16
20
17
20
18
20
19
20
20
20
21
Pe
rce
nt
Sh
are
Gas Gas-CNG/-E85/-LPG Electric

© 2015 IHS 19
Gasoline Engine Outlook
New Platforms Coming Online – Volvo Example
Source: IHS
• New VEP/GEP gasoline engines
being developed as part of the
modular VEA platform
• Will replace the current range of
SI6, SIGMA and Volvo INLINE
engines
• Avg. annual volumes ~200k
Volvo VEP/ GEP Engine Range (estimated)
Fuel Type Gasoline
# of cylinders 3 4
Expected SOP 2018/19 2015
Displacement 1.5L 2.0L
Power Range [kW] 75 - 135 85 - 240
Torque Range [N.m] 140 - 260 240 - 420
Source: Volvo
Will play a key role in Volvo’s Drive-E
efficiency strategy

© 2015 IHS
Gasoline Engine Outlook
Volvo VEP Triple Boost Development
20
2.0L 4-Cylinder 335kW (168kW/L) , 500N.m [Daimler M133 engine – 133kW/L]
Source: Volvo

© 2015 IHS 21
Gasoline Engine Outlook
New Platforms Coming Online – JLR Example
Source: IHS
• New AJ20-P engine range being
developed as part of the modular
AJ20 (Ingenium) platform
• Will be a range of 3, 4 and 6 cyl
inline engines. A V8 engine is
also likely at some point
• Avg. annual volumes ~180k
JLR AJ20-P Engine Range (estimated)
Fuel Type Gasoline
# of cylinders 3 4 6 8
Expected SOP 2017/18 2015/16 2020/21 2022?
Displacement 1.5L 2.0L 3.0L 4.0L
Power Range [kW] 110 - 140 150 - 220 230 - 320 350 - 450
Torque Range [N.m] 140 - 260 300 - 380 400 - 500 550 - 700
Source: JLR
Will be the main engine
platform for JLR

© 2015 IHS 22
$400
THE CHANGING
LANDSCAPE
Global vehicle CO2 and fuel consumption
regulations are continually tightening;
resulting in significant increases in R&D
spending and planning complexity.
What’s?ekatsta
Estimated incremental
spend globally to 2020.
$5-8 billion estimated
average annual per OEM.
Penalties
for non-
compliance billion
Brand image as
a leader in
technological
advancements and
environmental
sustainability
Vehicle
profitability
Market
share
* IEA World Energy Investment Outlook (International Energy Agency, World Energy Investment
Outlook, OECD/IEA, Paris).
*

© 2015 IHS 23
What is IHS Doing to Help?
CO2 & Fuel Efficiency Forecasts
3 years of history, 6 years of forecast by
body type
Enables planning and
provides insight into competitive powertrain efficiency
expectations
Vehicle Performance
Module (optional add-on)
The augmentation of theoretical performance forecast with
trade-off metrics
Enables insight into
competitive positioning on the important
blend of performance
and efficiency
Vehicle Compliance
Module (optional add-on)
Displays distance to
target
Enables an un-biased, physics
based independent outlook on
potential OEM compliance
gaps
Introducing V-PaC, the
IHS Automotive Vehicle
Performance and Compliance
Monitor
This One-of-a-kind solution helps
automakers and suppliers adjust
their strategies for the most
critically regulated markets by
providing 6 year forecasts for:
•Projected fuel consumption,
tailpipe CO2 emissions, and
acceleration performance
•Over 36,000 vehicle-powertrain
combinations
•Connected to over 160
attributes
• The United States, EU28, Brazil
& China
V-PaC

© 2015 IHS
What is this New Capability?
• Cloud based web-portal – easy access from anywhere
• Offers full vehicle performance and compliance analysis
• Designed for strategy planning and competitive vehicle analysis
• Integrationniartrewop atad gib s'rentrap ruo dna tsacerofTPBS’SHIfo
& engineering software prowess
• Leverages fuel consumption and CO2 regulatory parameters to provide
vehicle and fleet-level compliance
• Introduces performance and compliance data into the competitive
context
• Expands the appeal beyond traditional engineering tools
• Depth of coverage includes U.S., EU28, Brazil & China
24

© 2015 IHS
What is this New Capability?
25
Forecasts for 36,000
vehicle-powertrain
combinations
Over 160 technical
attributes
per vehicle
Contents
© 2015 IHS
NOITCUDORTNI
ETABED TNECER EHT - LESEID
KOOLTUO ENIGNE ENILOSAG
YRAMMUS
26

© 2015 IHS
Summary
• Gasoline set to overtake diesel and become the dominant fuel for passenger
vehicles in the EU28 in coming years
• Market share of gasoline is segment dependent, with diesel remaining strong in
the larger vehicle segments (C+)
• Growth of gasoline driven by increased installation of efficient downsized GDI-T
engines and increasing powertrain electrification (48V, E-Superchargers, plug-
in hybrids etc.)
• Diesel has been a fundamental contributor to the CO2 performance in Europe,
but is facing a number of challenges (cost, air quality issues, political pressure
etc.) - the market share will undoubtedly soften, but this is not the end for diesel
• The upcoming WLTC, RDE drive cycle changes will minimize the discrepancy
between homologation and real world emissions – both for diesel and gasoline
• Auto OEMs, supported by suppliers need to strike the perfect compromise of
efficiency, performance, utility, compliance and V-PaC is now here to provide
that critical insight
27