
European Data Centre Market - FStech · CB Richard Ellis | Page 3 Total Market Retail Colocation...
23
Andrew Jay Head of EMEA Technology Practice Group CB Richard Ellis Data Centre Real Estate Market Update Supply and Demand in the Face of Recession 1 st December 2008
Transcript of European Data Centre Market - FStech · CB Richard Ellis | Page 3 Total Market Retail Colocation...

Andrew JayHead of EMEA Technology Practice GroupCB Richard Ellis
Data Centre Real Estate Market UpdateSupply and Demand in the Face of Recession1st December 2008

CB Richard Ellis | Page 2
Agenda
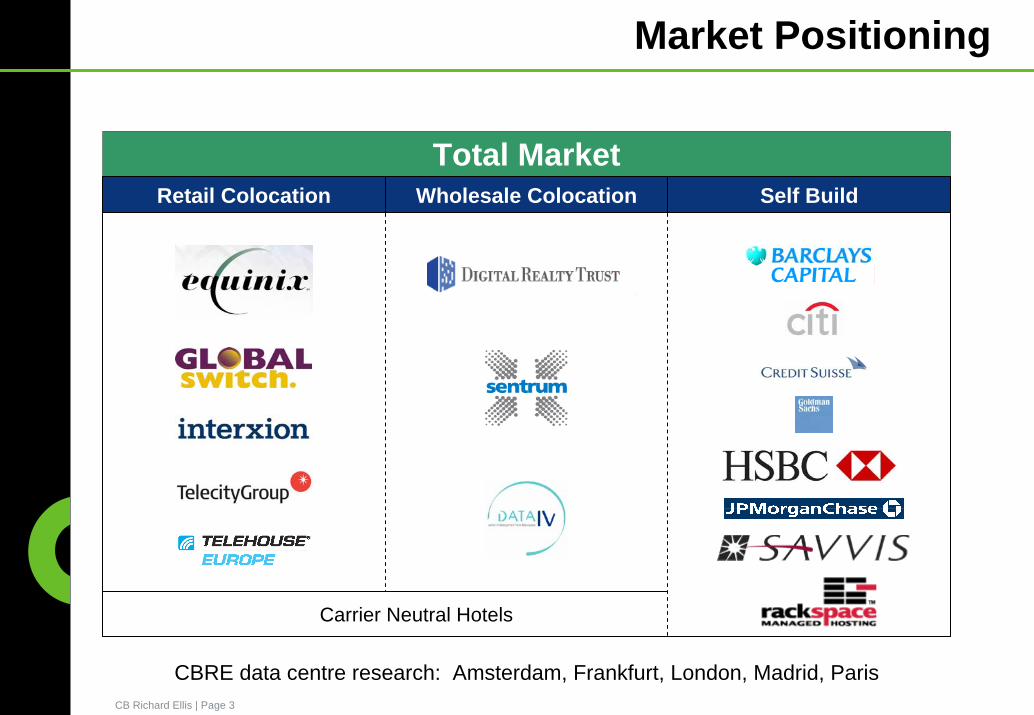
Market Positioning
Demand
Supply
Pricing
Conclusions
CB Richard Ellis | Page 3
Total MarketRetail Colocation
Market Positioning
Wholesale Colocation Self Build
CBRE data centre research: Amsterdam, Frankfurt, London, Madrid, Paris
Carrier Neutral Hotels

CB Richard Ellis | Page 4
Demand
Existing facilities no longer fit for purpose– Insufficient power/cooling to accommodate new (blade)
technology
– Pressure to use space for people
– Requirement for Zero Downtime – 2N specification
– Landlord conflict to limit data centre plant
Increasing reliance on IT
Expansion of IT equipment
Data centre consolidation initiatives
Internal Drivers
Source: CBRE research

CB Richard Ellis | Page 5
Demand
Terrorist threat or catastrophic event – 9/11
Statutory and regulatory pressures on business continuity (PAS 56) and disaster recovery (FSA regulations)
Corporate Governance – Sarbanes Oxley
Meeting criteria for insurance purposes
Meeting client expectations
External Drivers
Source: CBRE research

CB Richard Ellis | Page 6
Demand
Total Market Take-up
Source: CBRE research
0
20
40
60
80
100
120
140
160
180
Amsterdam Frankfurt London Madrid Paris Total
Thou
sand
m²
2005 2006 2007 2008 Q1/Q2

CB Richard Ellis | Page 7
Demand
Total Market Take-up
Source: CBRE research
Amsterdam Frankfurt London Madrid Paris Total
Thou
sand
m²
2005 2006 2007 2008 Projection
0
20
40
60
80
100
120
140
160
180

CB Richard Ellis | Page 8
DemandTake-up by Market Type & Sector
* Projected take-up
Source: CBRE research
Wholesale Colocation Model– Real estate model
– Variety of product offerings
– Modular bespoke fitout is contract led
– FM services are optional
– No managed services
– Pricing is driven by return on build cost
0
20
40
60
80
100
120
140
160
180
2001 2002 2003 2004 2005 2006 2007 2008 *
Thou
sand
m²
Self Build
Wholesale Colocation
Retail Colocation

CB Richard Ellis | Page 9
60%
8%
32%
54%
15%
31%
64%15%
21%Corporate
Systems Integrator
Technology & Telecoms200555,000 m²
200664,000 m²
2007158,000 m²
DemandTake-up by Market Type & Sector
Source: CBRE research
2008152,000 m²(projection)
66%9%
25%
2009
?
* Projected take-up
0
20
40
60
80
100
120
140
160
180
2001 2002 2003 2004 2005 2006 2007 2008 *
Thou
sand
m²
Self Build
Wholesale Colocation
Retail Colocation

CB Richard Ellis | Page 10
DemandTake-up By Market Type
Company Location Market Type FloorArea (m²)
Adapt London Retail Colocation 1,500
BT London Wholesale Colocation 2,000
Paris
Paris
German Bank London Wholesale Colocation 4,000
Petrochemical Company London Wholesale Colocation 2,000
US Investment Bank London Self Build 15,000
SAVVIS London Self Build 6,000
Rackspace London Self Build 5,000
IBM Retail Colocation 1,000
AT&T Retail Colocation 400
Source: CBRE research
CB Richard Ellis | Page 11
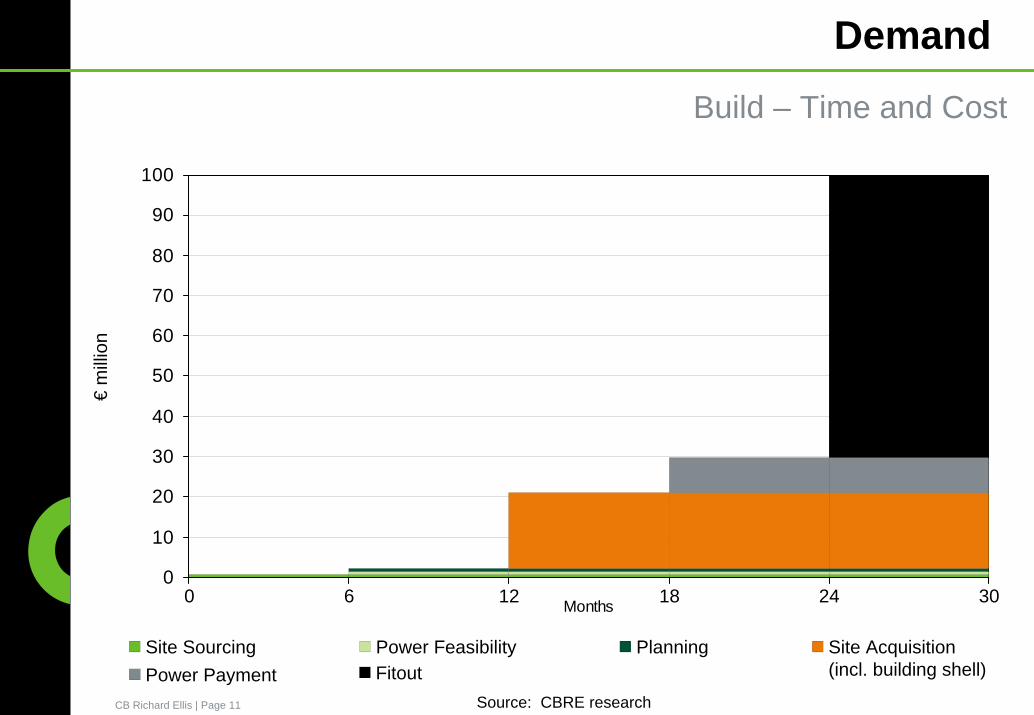
Demand€
milli
onBuild – Time and Cost
Site Sourcing Power Feasibility Planning Site Acquisition(incl. building shell)Power Payment Fitout
6 18 2412 300
Source: CBRE research
0
10
20
30
40
50
60
70
80
90
100
Months

CB Richard Ellis | Page 12
-0.5
0
0.5
1
1.5
2
Credit Crunch: LIBOR % aboveBank of England base rate
2008 2009 2010
Demand
Demand Pipeline
2005 2006 2007
projection
1 321. Bear Stearns collapse – credit
market closes
2. Banks write down toxic debt
3. Lehman Brothers collapse -Armageddon
Source: CBRE research
0
50
100
150
200
250
Thou
sand
m²

CB Richard Ellis | Page 13
New Supply (planned)
Demand (actual)
Demand and Supply
Credit Crunch Impact
Source: CBRE research
New Supply
New Supply (actual)DemandDemand (projected)
0
100
200
300
400
500
60020
05 Q
1
2005
Q2
2005
Q3
2005
Q4
2006
Q1
2006
Q2
2006
Q3
2006
Q4
2007
Q1
2007
Q2
2007
Q3
2007
Q4
2008
Q1
2008
Q2
2008
Q3
2008
Q4
2009
Q1
2009
Q2
2009
Q3
2009
Q4
2010
Q1
2010
Q2
2010
Q3
2010
Q4
-0.5
0
0.5
1
1.5
2Th
ousa
nd m
²

CB Richard Ellis | Page 14
Supply
London Colocation Market
Existing colocation facilitiesat 1 Jan 200519 facilities, 160,000 m²
60 km aroundcentral London
Source: CBRE research

CB Richard Ellis | Page 15
London Colocation Market
Supply
60 km aroundcentral London
Existing colocation facilitiesat 1 Jan 200519 facilities, 160,000 m²
New supply (pre-crunch)2005 to 201035 facilities, 406,900 m²
Source: CBRE research

CB Richard Ellis | Page 16
London Colocation Market
Supply
60 km aroundcentral London
Existing colocation facilitiesat 1 Jan 200519 facilities, 160,000 m²
New supply (pre-crunch)2005 to 201035 facilities, 406,900 m²
64% reduction in proposed new floor space
New supply (actual)2005 to 201017 facilities, 145,900 m²
Source: CBRE research
CB Richard Ellis | Page 17
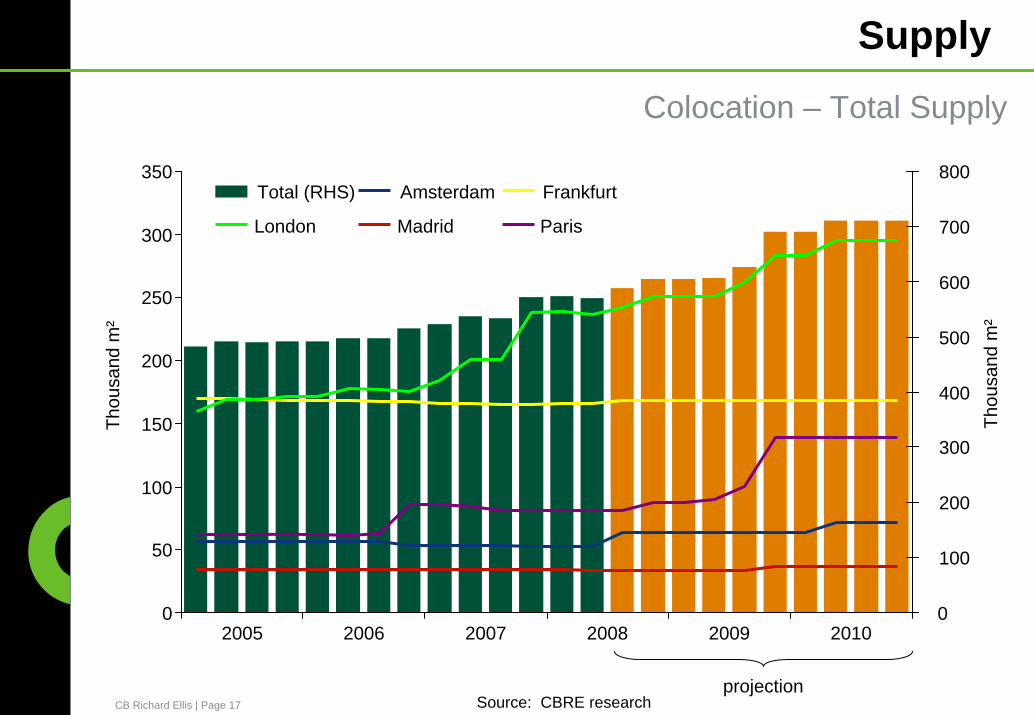
Supply
Colocation – Total Supply
2005 2006 2007 2008 20102009
Source: CBRE researchprojection
0
50
100
150
200
250
300
350
Thou
sand
m²
0
100
200
300
400
500
600
700
800
Thou
sand
m²
Total (RHS) Amsterdam Frankfurt
London Madrid Paris
CB Richard Ellis | Page 18
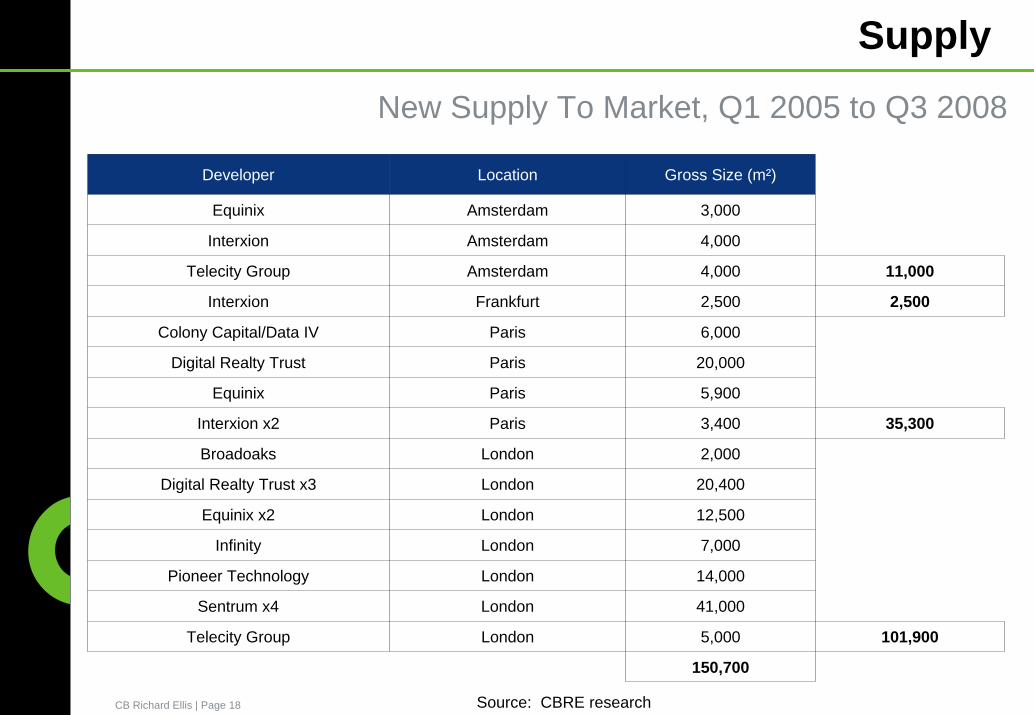
Supply
New Supply To Market, Q1 2005 to Q3 2008
Developer Location Gross Size (m²) City Total (m²)
Equinix Amsterdam 3,000
11,000
2,500
Colony Capital/Data IV Paris 6,000
Digital Realty Trust Paris 20,000
Equinix Paris 5,900
Interxion x2 Paris 3,400 35,300
101,900
Interxion Amsterdam 4,000
Telecity Group Amsterdam 4,000
Sentrum x4 London 41,000
Interxion Frankfurt 2,500
Broadoaks London 2,000
Digital Realty Trust x3
Telecity Group London 5,000
150,700
20,400
12,500
7,000
14,000
London
Equinix x2 London
Infinity London
Pioneer Technology London
Source: CBRE research

CB Richard Ellis | Page 19
Supply
Future Supply Pipeline from Q4 2008 to Q1 2010
Developer Location Gross Size (m²) City Total (m²)
8,000 8,000
3,000
51,000
Sentrum London 10,000
44,000
Interxion Madrid 3,000
Colony Capital/Data IV Paris 18,000
Digital Realty Trust Paris 10,000
Equinix Paris 10,000
Global Switch Paris 10,000
Telecity Group Paris 3,000
Equinix London 10,000
12,000
Telehouse London 12,000
106,000
Global Switch Amsterdam
e-shelter London
Source: CBRE research

CB Richard Ellis | Page 20
Supply
Vacancy Rates
2005 2006 2007 20092008
Source: CBRE researchprojection
0%
10%
20%
30%
40%
50%
60% Overall AmsterdamFrankfurt LondonMadrid Paris

CB Richard Ellis | Page 21
Pricing
Pricing trending towards € per kW
Retail Pricing– €2,900 - €3,500+ per m² pa (1,250 Watts per m²) - €2,560 per kW per annum
Wholesale Pricing– €1,800 - €2,400 per m² pa (1,250 Watts per m²) - €1,680 per kW per annum
Rents driven by– SPECIFICATION
– Power density
– Level of service provided
– Supply and demand (by market and building)
Colocation Pricing
Source: CBRE research

CB Richard Ellis | Page 22
Conclusions
Underlying demand drivers remain – increased reliance on IT and need for increased processing power
Credit Crunch has had relatively minor impact on Demand compared to Supply
Capital constraints mean less opportunities to self build – OPEX solutions preferred
BEWARE – fragile supply and demand dynamics
CB Richard Ellis | Page 23
Questions ?
Thank you
If you wish to receive the quarterly CBRE data centre research bulletin, please email [email protected]