European case study: Enhancing commercial bank liquidity ... · European case study: Enhancing...
20
World Gold Council | Enhancing commercial bank liquidity buffers with gold | October 2012 1 European case study: Enhancing commercial bank liquidity buffers with gold The World Gold Council has conducted extensive research on gold and has demonstrated in past submissions to the Basel Committee on Banking Supervision that gold meets the fundamental and market criteria required to be considered a high quality liquid asset for Basel III. The following case study conducted by the World Gold Council adds to existing research on this topic and examines the effect of adding gold to the Liquidity Coverage Ratio (LCR). This analysis demonstrates that including gold as an eligible asset in bank liquidity buffers, commercial banks would achieve lower levels of risk and improve their risk-adjusted returns. The study also found that a portfolio with gold outperformed a portfolio without gold during the majority of the most extreme liquidity stress events over the past eight years. Specifically the analysis used conservative assumptions and a statistical approach of resampling to determine the optimal liquidity buffer composition with gold and excluding gold. Back testing the results from 2005, the case study provides the following observations: 1 The optimisation study reveals that an allocation to gold is statistically optimal when choosing among the universe of eligible liquid assets with a confidence level of 97.5%. 2 Including gold as an eligible asset in commercial bank liquidity buffers allows a bank to achieve lower levels of risk and improve its risk-adjusted returns (i.e. expand its efficient frontier). 3 Through back testing a liquidity portfolio with gold outperformed a portfolio without gold during the majority of the most extreme liquidity stress events over the past eight years. 4 A commercial bank that held gold in its liquidity portfolio since 2005 would have witnessed similar annualised volatility to a liquidity buffer without gold (2.64% versus 2.62%). 5 A liquidity portfolio that includes gold has a similar level of maximum loss as a portfolio without gold, as measured by a Value-at-Risk analysis at the 99% confidence level. 6 A liquidity portfolio with gold outperformed in 6 out of 7 liquidity stress events over the past eight years and outperformed the non-gold portfolio by an average of 11 basis points. 7 Gold was the best performing asset in 5 of the 7 liquidity stress events, outperforming LCR assets such as German Bunds, US Treasuries and European covered bonds. 8 An analysis in GBP terms illustrated similar results, namely, that gold is statistically significant at the 97.5% confidence level. It allows banks to reach lower levels of risk and is the best performing asset in the majority of liquidity stress events.
Transcript of European case study: Enhancing commercial bank liquidity ... · European case study: Enhancing...
World Gold Council | Enhancing commercial bank liquidity buffers with gold | October 2012 1
European case study: Enhancing commercial bank liquidity buffers with gold
The World Gold Council has conducted extensive research on gold and has demonstrated in past submissions to the Basel Committee on Banking Supervision that gold meets the fundamental and market criteria required to be considered a high quality liquid asset for Basel III.
The following case study conducted by the World Gold Council adds to existing research on this topic and examines the effect of adding gold to the Liquidity Coverage Ratio (LCR). This analysis demonstrates that including gold as an eligible asset in bank liquidity buffers, commercial banks would achieve lower levels of risk and improve their risk-adjusted returns. The study also found that a portfolio with gold outperformed a portfolio without gold during the majority of the most extreme liquidity stress events over the past eight years.
Specifically the analysis used conservative assumptions and a statistical approach of resampling to determine the optimal liquidity buffer composition with gold and excluding gold. Back testing the results from 2005, the case study provides the following observations:
1 The optimisation study reveals that an allocation to gold is statistically optimal when choosing among the universe of eligible liquid assets with a confidence level of 97.5%.
2 Including gold as an eligible asset in commercial bank liquidity buffers allows a bank to achieve lower levels of risk and improve its risk-adjusted returns (i.e. expand its efficient frontier).
3 Through back testing a liquidity portfolio with gold outperformed a portfolio without gold during the majority of the most extreme liquidity stress events over the past eight years.
4 A commercial bank that held gold in its liquidity portfolio since 2005 would have witnessed similar annualised volatility to a liquidity buffer without gold (2.64% versus 2.62%).
5 A liquidity portfolio that includes gold has a similar level of maximum loss as a portfolio without gold, as measured by a Value-at-Risk analysis at the 99% confidence level.
6 A liquidity portfolio with gold outperformed in 6 out of 7 liquidity stress events over the past eight years and outperformed the non-gold portfolio by an average of 11 basis points.
7 Gold was the best performing asset in 5 of the 7 liquidity stress events, outperforming LCR assets such as German Bunds, US Treasuries and European covered bonds.
8 An analysis in GBP terms illustrated similar results, namely, that gold is statistically significant at the 97.5% confidence level. It allows banks to reach lower levels of risk and is the best performing asset in the majority of liquidity stress events.

World Gold Council | Enhancing commercial bank liquidity buffers with gold | October 2012 2
Outline
I: Optimal liquidity portfolio construction (with gold and excluding gold) 3
II: Back testing liquidity buffer portfolio performance 10
III: Event analysis: Back testing performance during liquidity events 12
Appendix: Results of UK banks case study in GBP terms 17
World Gold Council | Enhancing commercial bank liquidity buffers with gold | October 2012 3
I: Optimal liquidity buffer portfolio construction (with gold and excluding gold)
Portfolio theory used to model optimal liquidity buffers
In managing its balance sheet (and liquidity buffers), a commercial bank will have taken into account many considerations that will include among other items: risk management, regulatory compliance, liquidity, return, and practicality. As modeling these various considerations is virtually impossible, this analysis examines the optimal liquidity buffer by utilizing portfolio theory to study the universe of “high quality liquid assets” to determine what allocations to these assets is optimal.
Asset selection
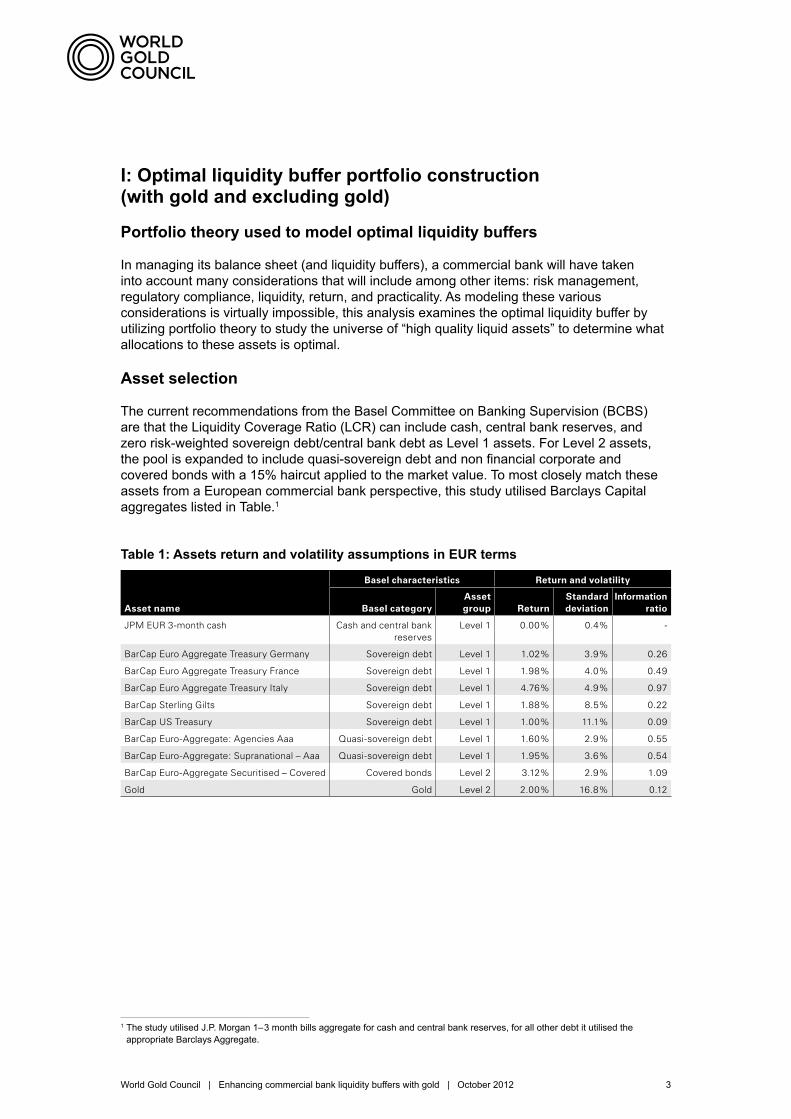
The current recommendations from the Basel Committee on Banking Supervision (BCBS) are that the Liquidity Coverage Ratio (LCR) can include cash, central bank reserves, and zero risk-weighted sovereign debt/central bank debt as Level 1 assets. For Level 2 assets, the pool is expanded to include quasi-sovereign debt and non financial corporate and covered bonds with a 15% haircut applied to the market value. To most closely match these assets from a European commercial bank perspective, this study utilised Barclays Capital aggregates listed in Table.1
1 The study utilised J.P. Morgan 1–3 month bills aggregate for cash and central bank reserves, for all other debt it utilised the appropriate Barclays Aggregate.
Table 1: Assets return and volatility assumptions in EUR terms
Basel characteristics Return and volatility
Asset name Basel categoryAsset group Return
Standard deviation
Information ratio
JPM EUR 3-month cash Cash and central bank reserves
Level 1 0.00% 0.4% -
BarCap Euro Aggregate Treasury Germany Sovereign debt Level 1 1.02% 3.9% 0.26
BarCap Euro Aggregate Treasury France Sovereign debt Level 1 1.98% 4.0% 0.49
BarCap Euro Aggregate Treasury Italy Sovereign debt Level 1 4.76% 4.9% 0.97
BarCap Sterling Gilts Sovereign debt Level 1 1.88% 8.5% 0.22
BarCap US Treasury Sovereign debt Level 1 1.00% 11.1% 0.09
BarCap Euro-Aggregate: Agencies Aaa Quasi-sovereign debt Level 1 1.60% 2.9% 0.55
BarCap Euro-Aggregate: Supranational – Aaa Quasi-sovereign debt Level 1 1.95% 3.6% 0.54
BarCap Euro-Aggregate Securitised – Covered Covered bonds Level 2 3.12% 2.9% 1.09
Gold Gold Level 2 2.00% 16.8% 0.12
World Gold Council | Enhancing commercial bank liquidity buffers with gold | October 2012 4
Period of analysis
Fourteen years of monthly historical data from June 1998 to June 2012 was used for this study to determine estimates for volatility and long-run average correlations between the asset categories. In addition to volatility and correlations, this optimisation study needed an estimated return for each asset. As past performance of both gold and fixed income securities over the last fourteen years would not be an appropriate forward looking measure, as for example cash returned 3.1% during this period, this study instead used an average of the ‘Yield to Worst’ values calculated by Barclays Capital from the period between January and June 2012. These return estimates such as 1.02% for German Bunds and 1.60% for European Agency bonds are more appropriate in the current interest rate environment for this study. As no such yield estimate is available for gold, this study estimated that gold would return 2% in-line with the widely perceived long-term ‘target’ for inflation anticipated by European monetary authorities. As gold has typically exceeded inflation over a long horizon, this assumption provides a similar level of conservatism to the analysis as the ‘Yield to Worst’ framework.
Observation on correlations
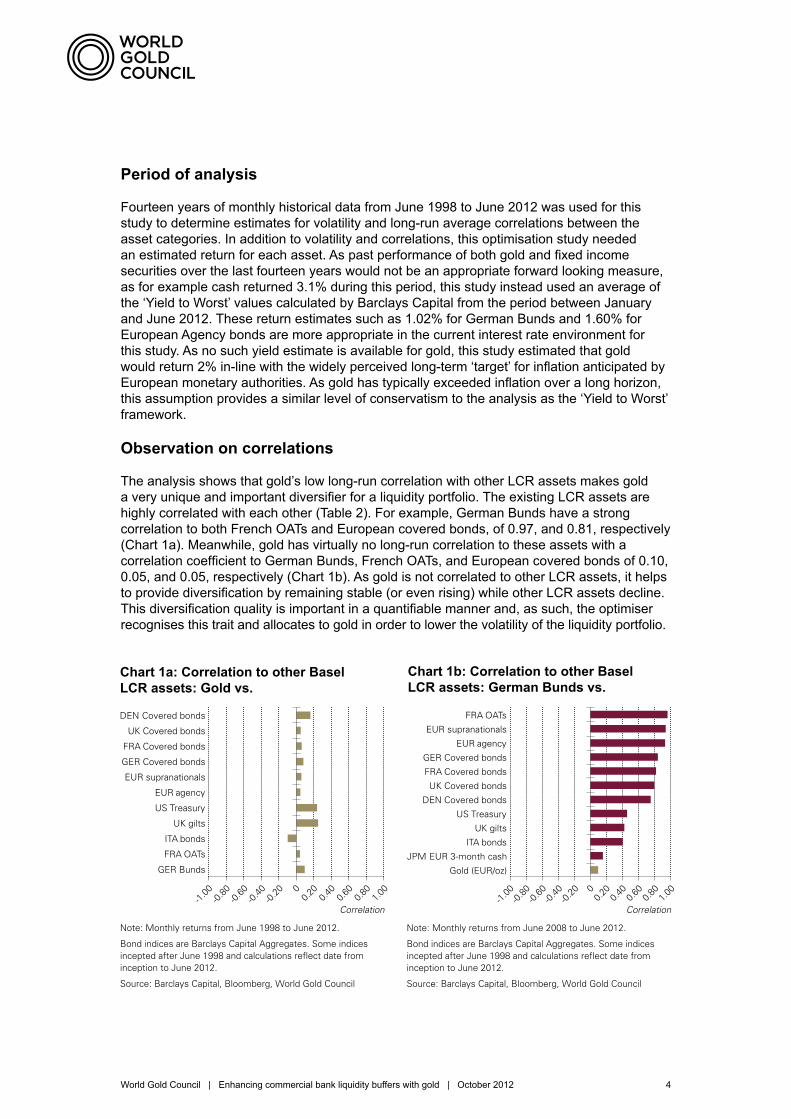
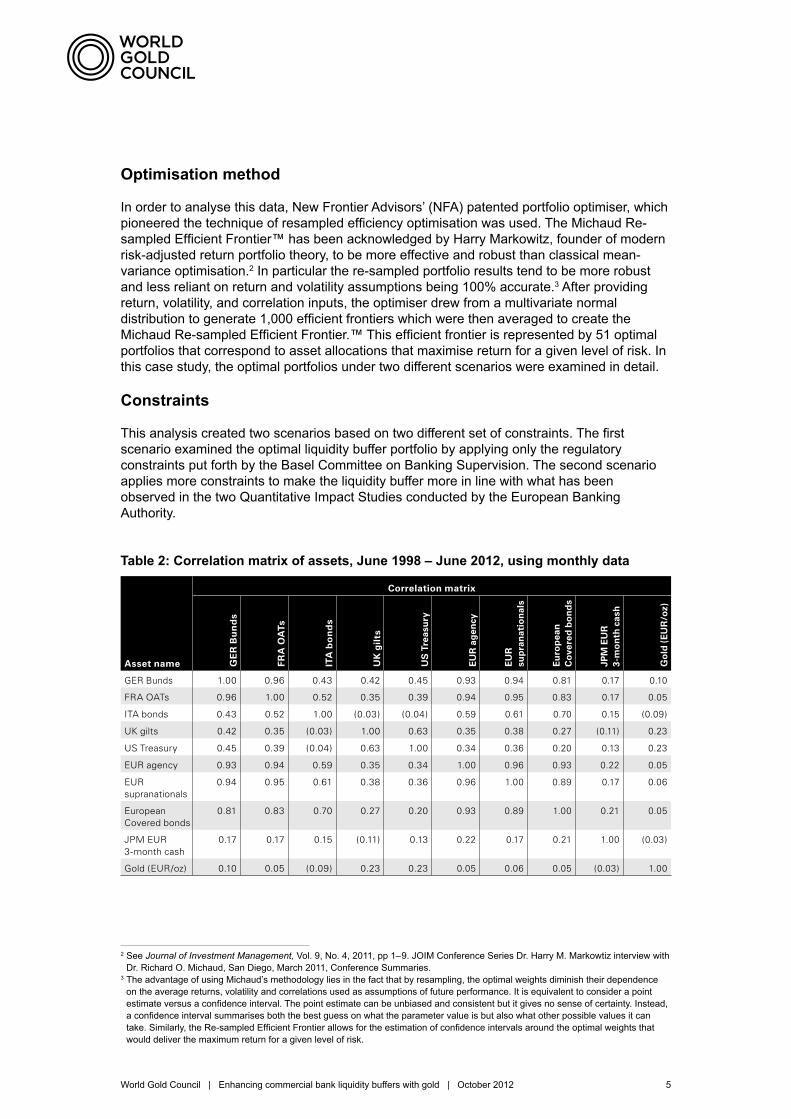
The analysis shows that gold’s low long-run correlation with other LCR assets makes gold a very unique and important diversifier for a liquidity portfolio. The existing LCR assets are highly correlated with each other (Table 2). For example, German Bunds have a strong correlation to both French OATs and European covered bonds, of 0.97, and 0.81, respectively (Chart 1a). Meanwhile, gold has virtually no long-run correlation to these assets with a correlation coefficient to German Bunds, French OATs, and European covered bonds of 0.10, 0.05, and 0.05, respectively (Chart 1b). As gold is not correlated to other LCR assets, it helps to provide diversification by remaining stable (or even rising) while other LCR assets decline. This diversification quality is important in a quantifiable manner and, as such, the optimiser recognises this trait and allocates to gold in order to lower the volatility of the liquidity portfolio.
Chart 1a: Correlation to other Basel LCR assets: Gold vs.
Chart 1b: Correlation to other Basel LCR assets: German Bunds vs.
-1.00
-0.80
-0.60
-0.40
-0.20
0 0.2
0 0.4
0 0.6
0 0.8
0 1.0
0
Correlation
Chart 1a: Correlation to other Basel LCR assets: Gold vs.
Note: Monthly returns from June 1998 to June 2012.
Bond indices are Barclays Capital Aggregates. Some indices incepted after June 1998 and calculations reflect date from inception to June 2012.
Source: Barclays Capital, Bloomberg, World Gold Council
GER Bunds
FRA OATs
ITA bonds
UK gilts
US Treasury
EUR agency
EUR supranationals
GER Covered bonds
FRA Covered bonds
UK Covered bonds
DEN Covered bonds
Gold (EUR/oz)
JPM EUR 3-month cash
ITA bonds
UK gilts
US Treasury
DEN Covered bonds
UK Covered bonds
FRA Covered bonds
GER Covered bonds
EUR agency
EUR supranationals
FRA OATs
-1.00
-0.80
-0.60
-0.40
-0.20
0 0.2
0 0.4
0 0.6
0 0.8
0 1.0
0
Correlation
Chart 1b: Correlation to other Basel LCR assets:German Bunds vs.
Note: Monthly returns from June 2008 to June 2012.
Bond indices are Barclays Capital Aggregates. Some indices incepted after June 1998 and calculations reflect date from inception to June 2012.
Source: Barclays Capital, Bloomberg, World Gold Council
World Gold Council | Enhancing commercial bank liquidity buffers with gold | October 2012 5
Optimisation method
In order to analyse this data, New Frontier Advisors’ (NFA) patented portfolio optimiser, which pioneered the technique of resampled efficiency optimisation was used. The Michaud Re-sampled Efficient Frontier™ has been acknowledged by Harry Markowitz, founder of modern risk-adjusted return portfolio theory, to be more effective and robust than classical mean-variance optimisation.2 In particular the re-sampled portfolio results tend to be more robust and less reliant on return and volatility assumptions being 100% accurate.3 After providing return, volatility, and correlation inputs, the optimiser drew from a multivariate normal distribution to generate 1,000 efficient frontiers which were then averaged to create the Michaud Re-sampled Efficient Frontier.™ This efficient frontier is represented by 51 optimal portfolios that correspond to asset allocations that maximise return for a given level of risk. In this case study, the optimal portfolios under two different scenarios were examined in detail.
Constraints
This analysis created two scenarios based on two different set of constraints. The first scenario examined the optimal liquidity buffer portfolio by applying only the regulatory constraints put forth by the Basel Committee on Banking Supervision. The second scenario applies more constraints to make the liquidity buffer more in line with what has been observed in the two Quantitative Impact Studies conducted by the European Banking Authority.
2 See Journal of Investment Management, Vol. 9, No. 4, 2011, pp 1–9. JOIM Conference Series Dr. Harry M. Markowtiz interview with Dr. Richard O. Michaud, San Diego, March 2011, Conference Summaries.
3 The advantage of using Michaud’s methodology lies in the fact that by resampling, the optimal weights diminish their dependence on the average returns, volatility and correlations used as assumptions of future performance. It is equivalent to consider a point estimate versus a confidence interval. The point estimate can be unbiased and consistent but it gives no sense of certainty. Instead, a confidence interval summarises both the best guess on what the parameter value is but also what other possible values it can take. Similarly, the Re-sampled Efficient Frontier allows for the estimation of confidence intervals around the optimal weights that would deliver the maximum return for a given level of risk.
Table 2: Correlation matrix of assets, June 1998 – June 2012, using monthly data
Correlation matrix
Asset name GE
R B
un
ds
FR
A O
ATs
ITA
bo
nd
s
UK
gil
ts
US
Tre
asu
ry
EU
R a
gen
cy
EU
R
sup
ran
atio
nal
s
Eu
rop
ean
C
ove
red
bo
nd
s
JPM
EU
R
3-m
on
th c
ash
Go
ld (
EU
R/o
z)
GER Bunds 1.00 0.96 0.43 0.42 0.45 0.93 0.94 0.81 0.17 0.10
FRA OATs 0.96 1.00 0.52 0.35 0.39 0.94 0.95 0.83 0.17 0.05
ITA bonds 0.43 0.52 1.00 (0.03) (0.04) 0.59 0.61 0.70 0.15 (0.09)
UK gilts 0.42 0.35 (0.03) 1.00 0.63 0.35 0.38 0.27 (0.11) 0.23
US Treasury 0.45 0.39 (0.04) 0.63 1.00 0.34 0.36 0.20 0.13 0.23
EUR agency 0.93 0.94 0.59 0.35 0.34 1.00 0.96 0.93 0.22 0.05
EUR supranationals
0.94 0.95 0.61 0.38 0.36 0.96 1.00 0.89 0.17 0.06
European Covered bonds
0.81 0.83 0.70 0.27 0.20 0.93 0.89 1.00 0.21 0.05
JPM EUR 3-month cash
0.17 0.17 0.15 (0.11) 0.13 0.22 0.17 0.21 1.00 (0.03)
Gold (EUR/oz) 0.10 0.05 (0.09) 0.23 0.23 0.05 0.06 0.05 (0.03) 1.00
World Gold Council | Enhancing commercial bank liquidity buffers with gold | October 2012 6
1 Regulatory scenario − Limit Level 2 assets to 40% of the LCR, consistent with the existing
recommendations from the Basel Committee
2 Constrained scenario (in addition to above constraint) − Limit the cash position in the LCR to a maximum of 30% − Require a minimum allocation of 50% to sovereign debt assets − Require German Bunds allocation to exceed French OATs − Limit maximum allocation to Italian bonds to 10% − Limit maximum allocation to each: UK gilts and US Treasuries to 10% − Limit maximum combined allocation to European agencies and European
supranationals to 15% − Limit maximum allocation to European covered bonds to 10% Rationale of non-regulatory constraints
A ceiling of 30% for cash and a minimum of 50% for sovereign debt was selected as it was most consistent with the level of cash held in aggregate across the European banking system when the European Banking Authority conducted their Basel III monitoring exercise4 released in April 2012. In this study the committee provided an aggregate breakdown of the composition of holdings of liquid assets. As cash has the lowest volatility, without a constraint, the optimisation exercises allocates a significant majority of the LCR to cash in lowest risk optimal portfolio.
Allocations to sovereign debt were further constrained by ensuring German Bunds received a higher allocation than French OATs consistent with likely bank portfolio allocations. Moreover, a maximum allocation of 10% was applied to Italian bonds due to credit risk. Under the current environment it is not reasonable for banks to have a higher exposure. Without such a constraint the portfolio optimiser would assign a higher distribution to Italian bonds given the higher relative return assumption. The last sovereign constraint was a limitation on both UK gilts and US Treasuries to 10% due to foreign exchange risk. As stated in the BIS Basel III framework, “in managing foreign exchange liquidity risk, the bank should take into account the risk that its ability to swap currencies and access the relevant foreign exchange markets may erode rapidly under stressed conditions.”5
Lastly, European Agency and European supranational allocations were limited to a combined 15% and covered bonds to 10% due to supply limitations. These allocations are consistent with the relative size of the respective debt markets, compared with the pool of eligible LCR assets and current holdings in the EBA Basel III monitoring exercise.
Applying a haircut penalty to Level 2 assets
The Basel Committee has recommended applying a 15% haircut on all Level 2 assets which would mean that a commercial bank would have to either provide an additional 15% of each Level 2 asset to make up the required LCR, or they would have to have an additional 15% in another form of a Level 1 LCR asset. In order to most accurately impose this regulatory haircut on the portfolios that were presented, a distinction should be made between the extra costs associated with a Level 2 asset versus a Level 1 asset. This analysis included a funding cost equal to the 12m Euribor on Level 2 assets (Gold and covered bonds).
4 European Banking Authority, Results of the Basel III monitoring exercise as of 30 June 2011 study, April 2012. 5 BIS, Basel III: International framework for liquidity risk measurement, standards and monitoring, December 2010.
World Gold Council | Enhancing commercial bank liquidity buffers with gold | October 2012 7
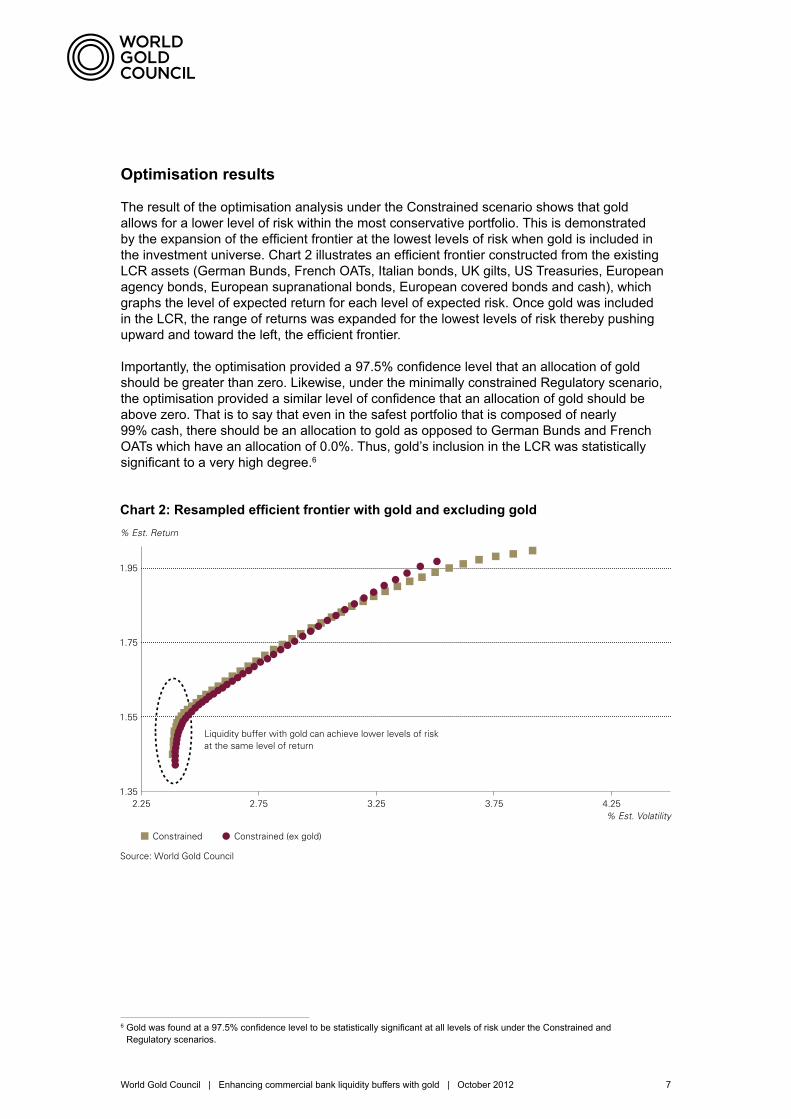
Optimisation results
The result of the optimisation analysis under the Constrained scenario shows that gold allows for a lower level of risk within the most conservative portfolio. This is demonstrated by the expansion of the efficient frontier at the lowest levels of risk when gold is included in the investment universe. Chart 2 illustrates an efficient frontier constructed from the existing LCR assets (German Bunds, French OATs, Italian bonds, UK gilts, US Treasuries, European agency bonds, European supranational bonds, European covered bonds and cash), which graphs the level of expected return for each level of expected risk. Once gold was included in the LCR, the range of returns was expanded for the lowest levels of risk thereby pushing upward and toward the left, the efficient frontier.
Importantly, the optimisation provided a 97.5% confidence level that an allocation of gold should be greater than zero. Likewise, under the minimally constrained Regulatory scenario, the optimisation provided a similar level of confidence that an allocation of gold should be above zero. That is to say that even in the safest portfolio that is composed of nearly 99% cash, there should be an allocation to gold as opposed to German Bunds and French OATs which have an allocation of 0.0%. Thus, gold’s inclusion in the LCR was statistically significant to a very high degree.6
6 Gold was found at a 97.5% confidence level to be statistically significant at all levels of risk under the Constrained and Regulatory scenarios.
Chart 2: Resampled efficient frontier with gold and excluding gold
1.35
1.55
1.75
1.95
2.25 2.75 3.25 3.75 4.25
% Est. Return
Chart 2: Resampled efficient frontier with gold and excluding gold
% Est. Volatility
Constrained Constrained (ex gold)
Source: World Gold Council
Liquidity buffer with gold can achieve lower levels of riskat the same level of return
World Gold Council | Enhancing commercial bank liquidity buffers with gold | October 2012 8
Chart 3: Constrained optimal portfolios with gold and excluding gold
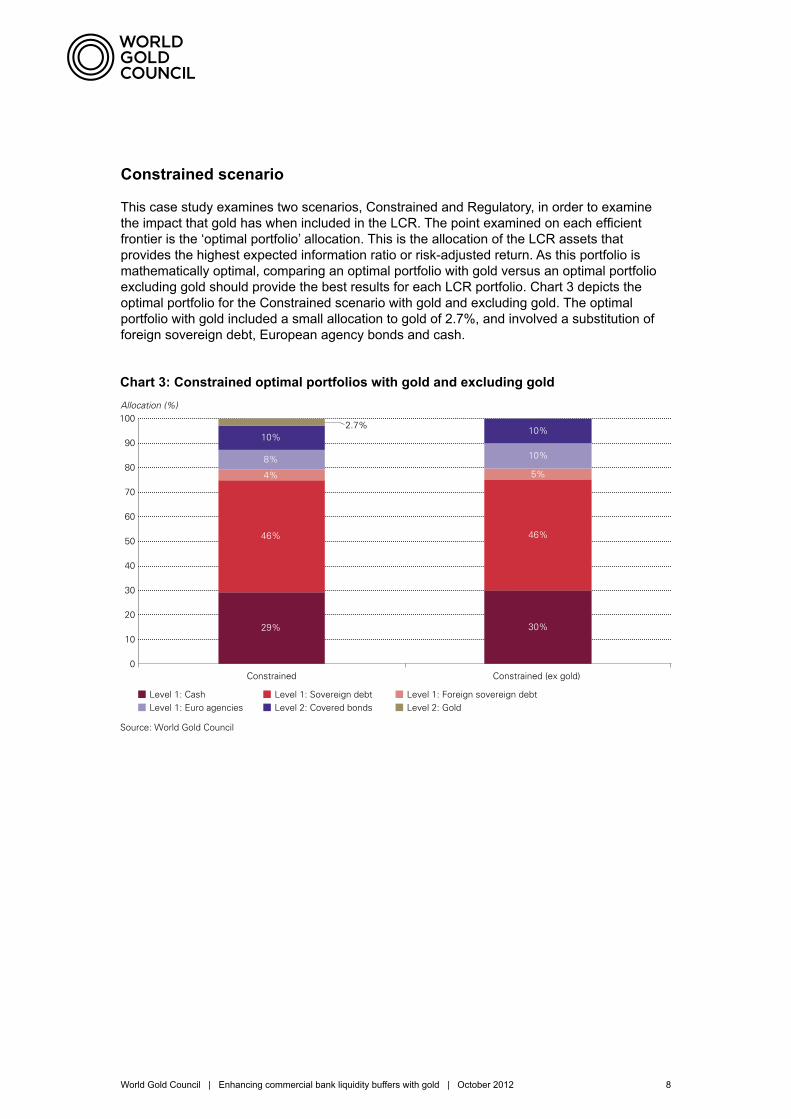
Constrained scenario
This case study examines two scenarios, Constrained and Regulatory, in order to examine the impact that gold has when included in the LCR. The point examined on each efficient frontier is the ‘optimal portfolio’ allocation. This is the allocation of the LCR assets that provides the highest expected information ratio or risk-adjusted return. As this portfolio is mathematically optimal, comparing an optimal portfolio with gold versus an optimal portfolio excluding gold should provide the best results for each LCR portfolio. Chart 3 depicts the optimal portfolio for the Constrained scenario with gold and excluding gold. The optimal portfolio with gold included a small allocation to gold of 2.7%, and involved a substitution of foreign sovereign debt, European agency bonds and cash.
2.7%
Allocation (%)
Chart 3: Constrained optimal portfolios with gold and excluding gold
Constrained Constrained (ex gold)
Level 1: Cash Level 1: Sovereign debt Level 1: Foreign sovereign debt Level 1: Euro agencies Level 2: Covered bonds Level 2: Gold
Source: World Gold Council
10
0
20
30
40
50
60
70
80
90
100
29% 30%
46% 46%
4% 5%
8% 10%
10% 10%
World Gold Council | Enhancing commercial bank liquidity buffers with gold | October 2012 9
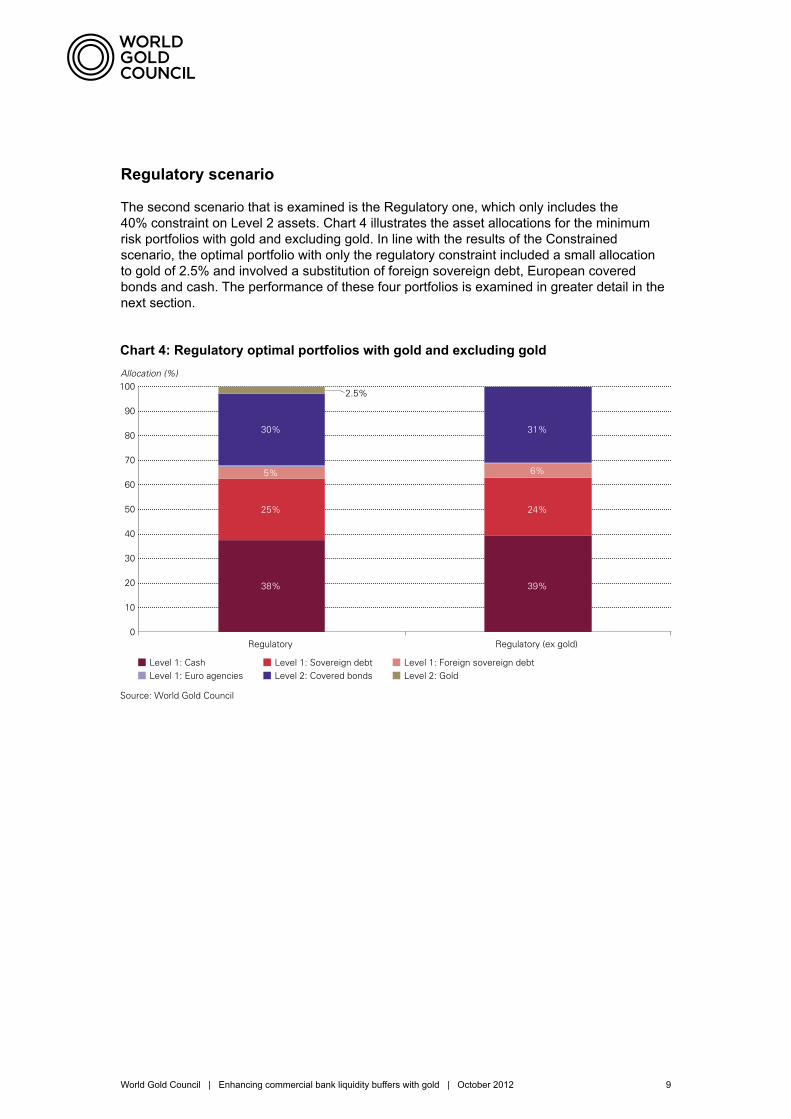
Regulatory scenario
The second scenario that is examined is the Regulatory one, which only includes the 40% constraint on Level 2 assets. Chart 4 illustrates the asset allocations for the minimum risk portfolios with gold and excluding gold. In line with the results of the Constrained scenario, the optimal portfolio with only the regulatory constraint included a small allocation to gold of 2.5% and involved a substitution of foreign sovereign debt, European covered bonds and cash. The performance of these four portfolios is examined in greater detail in the next section.
Chart 4: Regulatory optimal portfolios with gold and excluding gold
2.5%
Allocation (%)
Chart 4: Regulatory optimal portfolios with gold and excluding gold
Regulatory Regulatory (ex gold)
Level 1: Cash Level 1: Sovereign debt Level 1: Foreign sovereign debt Level 1: Euro agencies Level 2: Covered bonds Level 2: Gold
Source: World Gold Council
10
0
20
30
40
50
60
70
80
90
100
38%
25%
5%
30%
39%
24%
6%
31%
World Gold Council | Enhancing commercial bank liquidity buffers with gold | October 2012 10
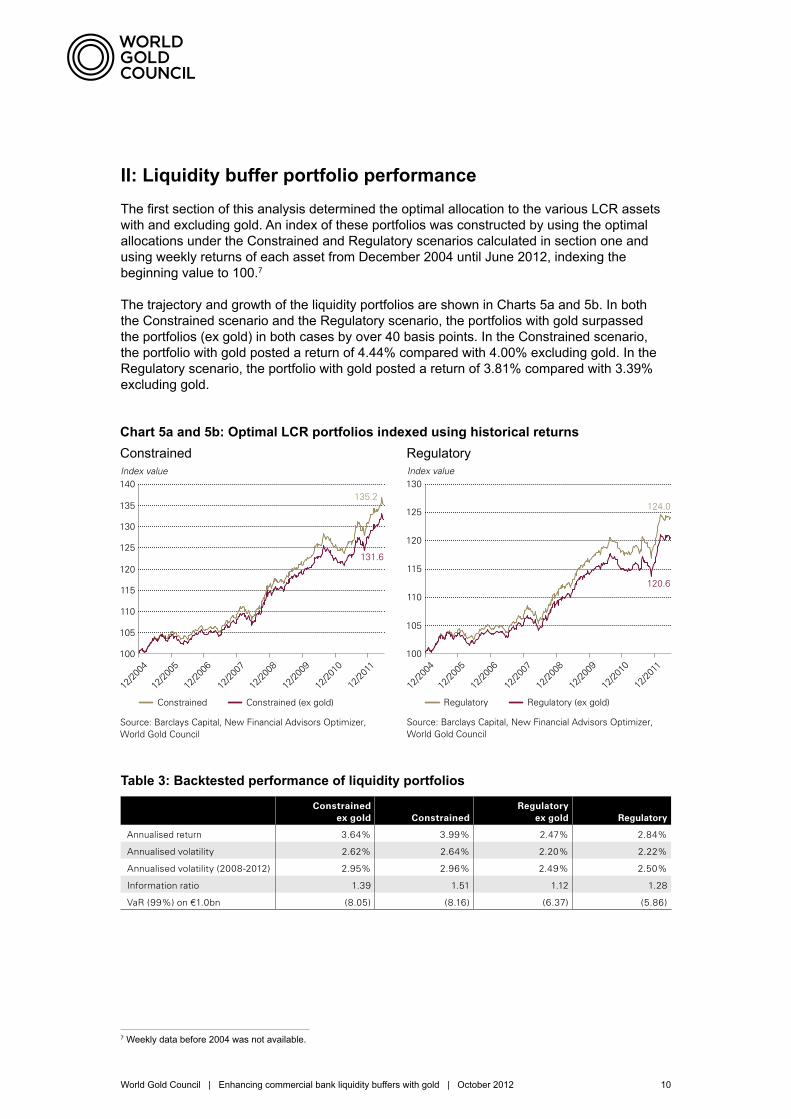
II: Liquidity buffer portfolio performanceThe first section of this analysis determined the optimal allocation to the various LCR assets with and excluding gold. An index of these portfolios was constructed by using the optimal allocations under the Constrained and Regulatory scenarios calculated in section one and using weekly returns of each asset from December 2004 until June 2012, indexing the beginning value to 100.7
The trajectory and growth of the liquidity portfolios are shown in Charts 5a and 5b. In both the Constrained scenario and the Regulatory scenario, the portfolios with gold surpassed the portfolios (ex gold) in both cases by over 40 basis points. In the Constrained scenario, the portfolio with gold posted a return of 4.44% compared with 4.00% excluding gold. In the Regulatory scenario, the portfolio with gold posted a return of 3.81% compared with 3.39% excluding gold.
7 Weekly data before 2004 was not available.
Chart 5a and 5b: Optimal LCR portfolios indexed using historical returns Constrained Regulatory
135.2
131.6
100
105
110
115
120
125
130
135
140Index value
Chart 5a: Optimal LCR Portfolios Indexed Using Historical Returns
12/20
04
12/20
05
12/20
06
12/20
07
12/20
08
12/20
09
12/20
10
12/20
11
Constrained Constrained (ex gold)
Source: Barclays Capital, New Financial Advisors Optimizer, World Gold Council
100
105
110
115
120
125
130Index value
Chart 5b: Optimal LCR Portfolios Indexed Using Historical Returns
12/20
04
12/20
05
12/20
06
12/20
07
12/20
08
12/20
09
12/20
10
12/20
11
Regulatory Regulatory (ex gold)
Source: Barclays Capital, New Financial Advisors Optimizer, World Gold Council
124.0
120.6
Table 3: Backtested performance of liquidity portfolios
Constrained ex gold Constrained
Regulatory ex gold Regulatory
Annualised return 3.64% 3.99% 2.47% 2.84%
Annualised volatility 2.62% 2.64% 2.20% 2.22%
Annualised volatility (2008-2012) 2.95% 2.96% 2.49% 2.50%
Information ratio 1.39 1.51 1.12 1.28
VaR (99%) on €1.0bn (8.05) (8.16) (6.37) (5.86)
World Gold Council | Enhancing commercial bank liquidity buffers with gold | October 2012 11
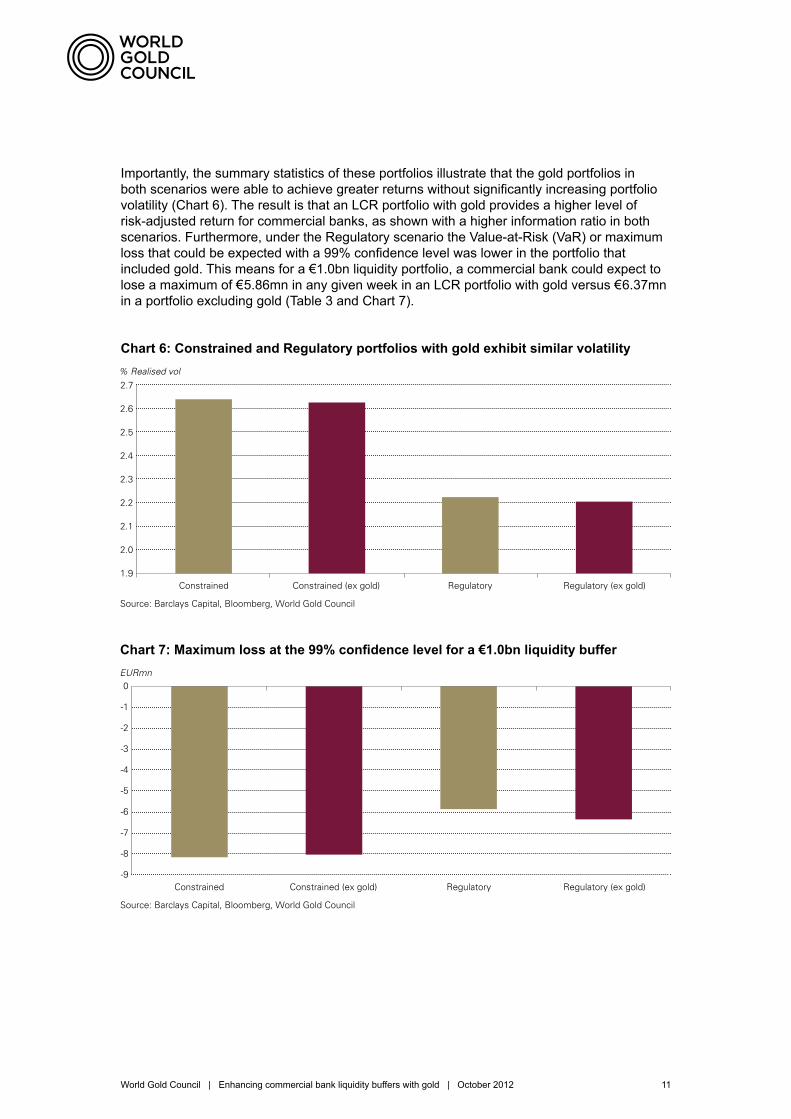
Importantly, the summary statistics of these portfolios illustrate that the gold portfolios in both scenarios were able to achieve greater returns without significantly increasing portfolio volatility (Chart 6). The result is that an LCR portfolio with gold provides a higher level of risk-adjusted return for commercial banks, as shown with a higher information ratio in both scenarios. Furthermore, under the Regulatory scenario the Value-at-Risk (VaR) or maximum loss that could be expected with a 99% confidence level was lower in the portfolio that included gold. This means for a €1.0bn liquidity portfolio, a commercial bank could expect to lose a maximum of €5.86mn in any given week in an LCR portfolio with gold versus €6.37mn in a portfolio excluding gold (Table 3 and Chart 7).
% Realised vol
Chart 6: Constrained and Regulatory portfolios with gold exhibit similar volatility
Constrained (ex gold) Constrained Regulatory (ex gold) Regulatory
Source: Barclays Capital, Bloomberg, World Gold Council
1.9
2.0
2.1
2.2
2.3
2.4
2.5
2.6
2.7
-9
-8
-7
-6
-5
-4
-3
-2
-1
0EURmn
Chart 7: Maximum loss at the 99% confidence level for a EUR1.0bn liquidity buffer
Constrained (ex gold)Constrained Regulatory (ex gold)Regulatory
Source: Barclays Capital, Bloomberg, World Gold Council
Chart 6: Constrained and Regulatory portfolios with gold exhibit similar volatility
Chart 7: Maximum loss at the 99% confidence level for a €1.0bn liquidity buffer
World Gold Council | Enhancing commercial bank liquidity buffers with gold | October 2012 12
III: Analysis of liquidity eventsAs the policy focus of the LCR is on ensuring banks have adequate liquidity during periods of financial strain, in this section the performance of these portfolios during specific short periods of liquidity stress were examined.
Defining periods of liquidity stress
As a framework to uncover liquidity stress periods, we examined instances when the “US dollar basis,” defined as the implied FX swap dollar interest rate – benchmark dollar interest rate, widened significantly, consistent with a pattern that indicates funding pressures among European banks.8 These instances were cross checked against instances when the spread between the Euro Interbank Offering Rate (Euribor) and Euro OverNight Index Average (Eonia) in Euros widened by a rate greater than two and a half standard deviations,9 in a given week. The Euribor-Eonia spread is the European equivalent to the spread between the London Interbank Offering Rate (LIBOR) and the Overnight Index Swap rate (OIS) in US dollars. The LIBOR-OIS spread is considered a daily measure of the health of the banking system or as Alan Greenspan has termed it “a barometer of fears of bank insolvency.”10 While the Euribor-Eonia spread may include some element of credit concern and is not a precise liquidity metric, using Euribor-Eonia allows examination of specific weeks that were under stress while also avoiding using any of the securities analysed in this study such as credit spreads.
8 Federal Reserve Bank of New York, Capital Constraints, Counterparty Risk, and Deviations from Covered Interest Rate Parity, October 2009.
9 For data that is normally distributed, a positive two and a half standard deviation move is likely to occur less than 1.25% of the time. Therefore, these are extreme events also sometimes referred to as tail risks.
10 Federal Reserve Bank of St. Louis, What the Libor-OIS Spread Says, May 2009.
World Gold Council | Enhancing commercial bank liquidity buffers with gold | October 2012 13
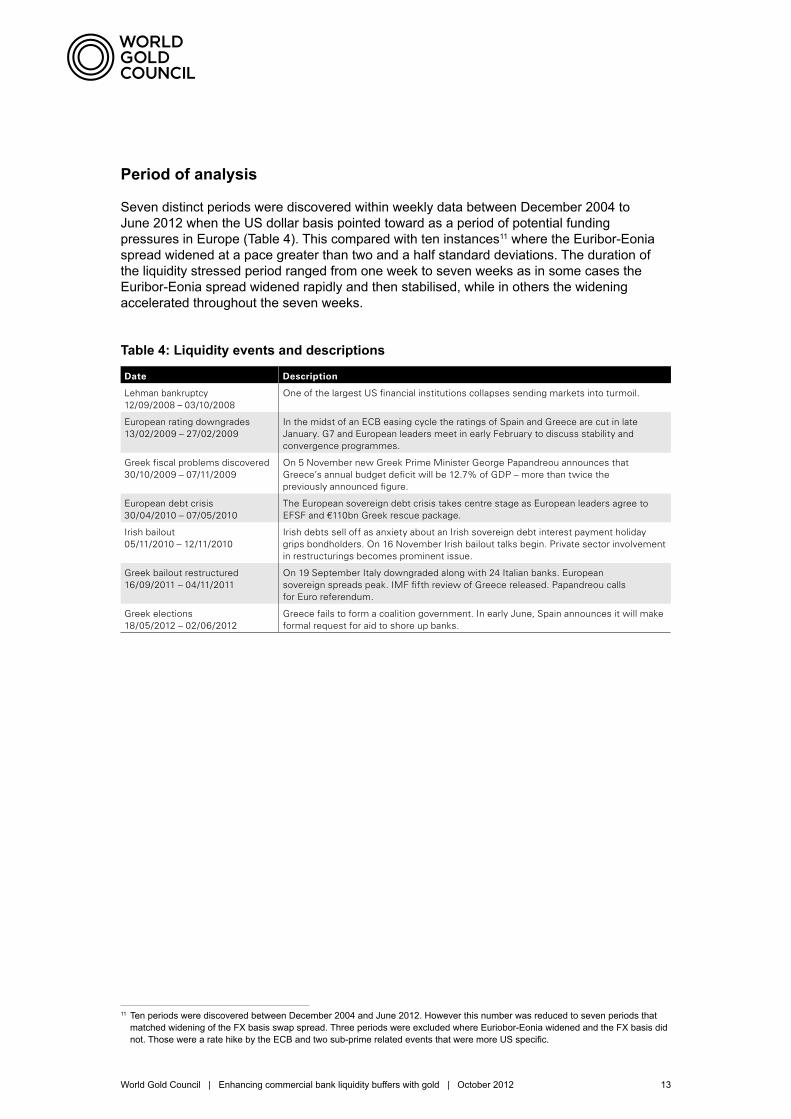
Table 4: Liquidity events and descriptions
Date Description
Lehman bankruptcy 12/09/2008 – 03/10/2008
One of the largest US financial institutions collapses sending markets into turmoil.
European rating downgrades 13/02/2009 – 27/02/2009
In the midst of an ECB easing cycle the ratings of Spain and Greece are cut in late January. G7 and European leaders meet in early February to discuss stability and convergence programmes.
Greek fiscal problems discovered 30/10/2009 – 07/11/2009
On 5 November new Greek Prime Minister George Papandreou announces that Greece’s annual budget deficit will be 12.7% of GDP – more than twice the previously announced figure.
European debt crisis 30/04/2010 – 07/05/2010
The European sovereign debt crisis takes centre stage as European leaders agree to EFSF and €110bn Greek rescue package.
Irish bailout 05/11/2010 – 12/11/2010
Irish debts sell off as anxiety about an Irish sovereign debt interest payment holiday grips bondholders. On 16 November Irish bailout talks begin. Private sector involvement in restructurings becomes prominent issue.
Greek bailout restructured 16/09/2011 – 04/11/2011
On 19 September Italy downgraded along with 24 Italian banks. European sovereign spreads peak. IMF fifth review of Greece released. Papandreou calls for Euro referendum.
Greek elections 18/05/2012 – 02/06/2012
Greece fails to form a coalition government. In early June, Spain announces it will make formal request for aid to shore up banks.
Period of analysis
Seven distinct periods were discovered within weekly data between December 2004 to June 2012 when the US dollar basis pointed toward as a period of potential funding pressures in Europe (Table 4). This compared with ten instances11 where the Euribor-Eonia spread widened at a pace greater than two and a half standard deviations. The duration of the liquidity stressed period ranged from one week to seven weeks as in some cases the Euribor-Eonia spread widened rapidly and then stabilised, while in others the widening accelerated throughout the seven weeks.
11 Ten periods were discovered between December 2004 and June 2012. However this number was reduced to seven periods that matched widening of the FX basis swap spread. Three periods were excluded where Euriobor-Eonia widened and the FX basis did not. Those were a rate hike by the ECB and two sub-prime related events that were more US specific.
World Gold Council | Enhancing commercial bank liquidity buffers with gold | October 2012 14
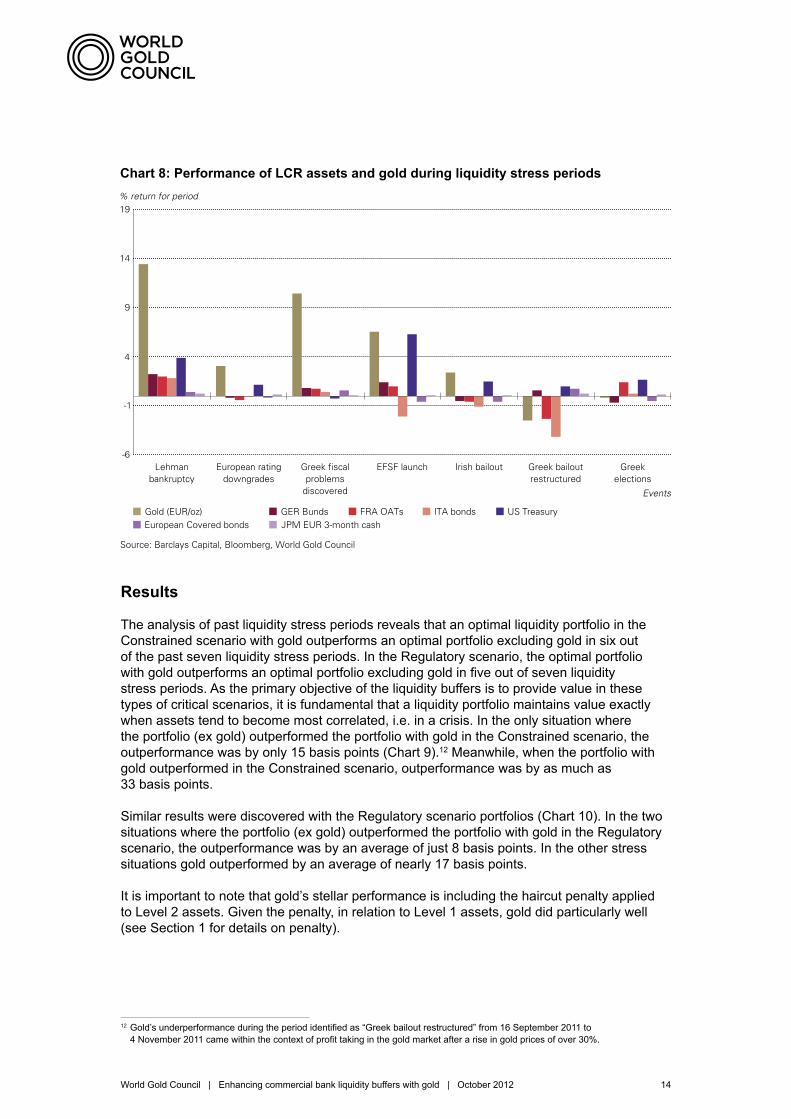
Results
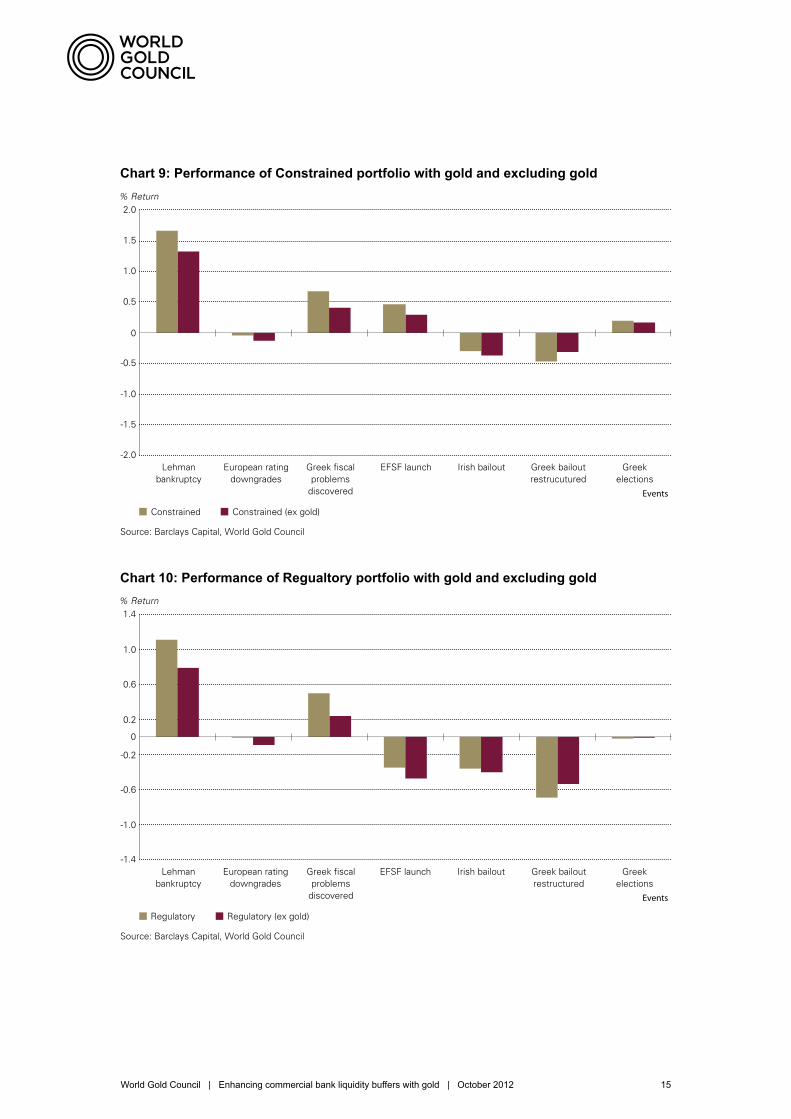
The analysis of past liquidity stress periods reveals that an optimal liquidity portfolio in the Constrained scenario with gold outperforms an optimal portfolio excluding gold in six out of the past seven liquidity stress periods. In the Regulatory scenario, the optimal portfolio with gold outperforms an optimal portfolio excluding gold in five out of seven liquidity stress periods. As the primary objective of the liquidity buffers is to provide value in these types of critical scenarios, it is fundamental that a liquidity portfolio maintains value exactly when assets tend to become most correlated, i.e. in a crisis. In the only situation where the portfolio (ex gold) outperformed the portfolio with gold in the Constrained scenario, the outperformance was by only 15 basis points (Chart 9).12 Meanwhile, when the portfolio with gold outperformed in the Constrained scenario, outperformance was by as much as 33 basis points.
Similar results were discovered with the Regulatory scenario portfolios (Chart 10). In the two situations where the portfolio (ex gold) outperformed the portfolio with gold in the Regulatory scenario, the outperformance was by an average of just 8 basis points. In the other stress situations gold outperformed by an average of nearly 17 basis points.
It is important to note that gold’s stellar performance is including the haircut penalty applied to Level 2 assets. Given the penalty, in relation to Level 1 assets, gold did particularly well (see Section 1 for details on penalty).
12 Gold’s underperformance during the period identified as “Greek bailout restructured” from 16 September 2011 to 4 November 2011 came within the context of profit taking in the gold market after a rise in gold prices of over 30%.
% return for period
Chart 8: Performance of LCR assets and gold during liquidity stress periods
Lehmanbankruptcy
European ratingdowngrades
Greek fiscalproblems
discovered
EFSF launch Irish bailout Greek bailoutrestructured
Greekelections
Events
Gold (EUR/oz) GER Bunds FRA OATs ITA bonds US Treasury European Covered bonds JPM EUR 3-month cash
Source: Barclays Capital, Bloomberg, World Gold Council
-6
-1
4
9
14
19
Chart 8: Performance of LCR assets and gold during liquidity stress periods
World Gold Council | Enhancing commercial bank liquidity buffers with gold | October 2012 15
Chart 9: Performance of Constrained portfolio with gold and excluding gold
Chart 10: Performance of Regualtory portfolio with gold and excluding gold
Constrained Constrained (ex gold)
% Return
Chart 9: Performance of Constrained portfolio with gold and excluding gold
-2.0
-1.5
-1.0
-0.5
0
0.5
1.0
1.5
2.0
Lehmanbankruptcy
European ratingdowngrades
Greek fiscalproblems
discovered
EFSF launch Irish bailout Greek bailoutrestrucutured
Greekelections
Events
Source: Barclays Capital, World Gold Council
Regulatory Regulatory (ex gold)
% Return
Chart 10: Performance of Regualtory portfolio with gold and excluding gold
Lehmanbankruptcy
European ratingdowngrades
Greek fiscalproblems
discovered
EFSF launch Irish bailout Greek bailoutrestructured
Greekelections
Events
Source: Barclays Capital, World Gold Council
-1.4
-1.0
-0.6
-0.2
0.2
0
0.6
1.0
1.4
World Gold Council | Enhancing commercial bank liquidity buffers with gold | October 2012 16
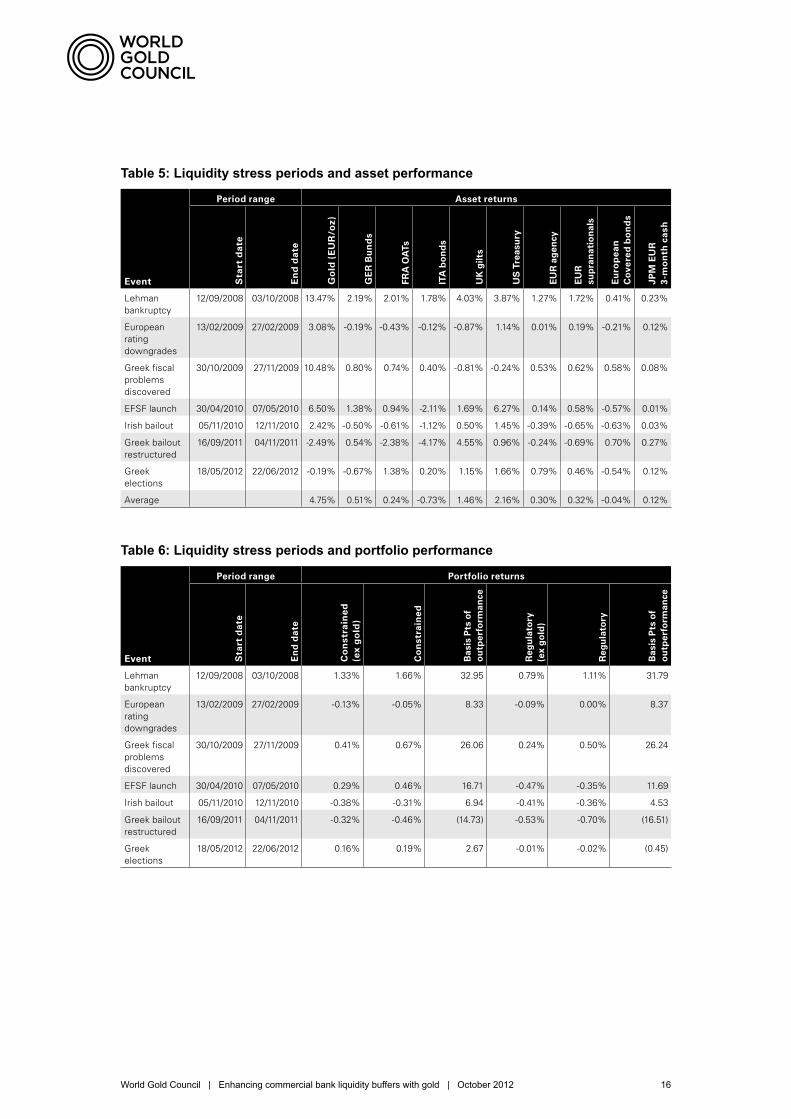
Table 5: Liquidity stress periods and asset performance
Table 6: Liquidity stress periods and portfolio performance
Period range Asset returns
Event Sta
rt d
ate
En
d d
ate
Go
ld (
EU
R/o
z)
GE
R B
un
ds
FRA
OA
Ts
ITA
bo
nd
s
UK
gilt
s
US
Tre
asu
ry
EU
R a
gen
cy
EU
R
sup
ran
atio
nal
s
Eu
rop
ean
C
ove
red
bo
nd
s
JPM
EU
R
3-m
on
th c
ash
Lehman bankruptcy
12/09/2008 03/10/2008 13.47% 2.19% 2.01% 1.78% 4.03% 3.87% 1.27% 1.72% 0.41% 0.23%
European rating downgrades
13/02/2009 27/02/2009 3.08% -0.19% -0.43% -0.12% -0.87% 1.14% 0.01% 0.19% -0.21% 0.12%
Greek fiscal problems discovered
30/10/2009 27/11/2009 10.48% 0.80% 0.74% 0.40% -0.81% -0.24% 0.53% 0.62% 0.58% 0.08%
EFSF launch 30/04/2010 07/05/2010 6.50% 1.38% 0.94% -2.11% 1.69% 6.27% 0.14% 0.58% -0.57% 0.01%
Irish bailout 05/11/2010 12/11/2010 2.42% -0.50% -0.61% -1.12% 0.50% 1.45% -0.39% -0.65% -0.63% 0.03%
Greek bailout restructured
16/09/2011 04/11/2011 -2.49% 0.54% -2.38% -4.17% 4.55% 0.96% -0.24% -0.69% 0.70% 0.27%
Greek elections
18/05/2012 22/06/2012 -0.19% -0.67% 1.38% 0.20% 1.15% 1.66% 0.79% 0.46% -0.54% 0.12%
Average 4.75% 0.51% 0.24% -0.73% 1.46% 2.16% 0.30% 0.32% -0.04% 0.12%
Event
Period range Portfolio returns
Sta
rt d
ate
En
d d
ate
Co
nst
rain
ed
(e
x g
old
)
Co
nst
rain
ed
Bas
is P
ts o
f o
utp
erfo
rman
ce
Reg
ula
tory
(e
x g
old
)
Reg
ula
tory
Bas
is P
ts o
f o
utp
erfo
rman
ceLehman bankruptcy
12/09/2008 03/10/2008 1.33% 1.66% 32.95 0.79% 1.11% 31.79
European rating downgrades
13/02/2009 27/02/2009 -0.13% -0.05% 8.33 -0.09% 0.00% 8.37
Greek fiscal problems discovered
30/10/2009 27/11/2009 0.41% 0.67% 26.06 0.24% 0.50% 26.24
EFSF launch 30/04/2010 07/05/2010 0.29% 0.46% 16.71 -0.47% -0.35% 11.69
Irish bailout 05/11/2010 12/11/2010 -0.38% -0.31% 6.94 -0.41% -0.36% 4.53
Greek bailout restructured
16/09/2011 04/11/2011 -0.32% -0.46% (14.73) -0.53% -0.70% (16.51)
Greek elections
18/05/2012 22/06/2012 0.16% 0.19% 2.67 -0.01% -0.02% (0.45)
World Gold Council | Enhancing commercial bank liquidity buffers with gold | October 2012 17
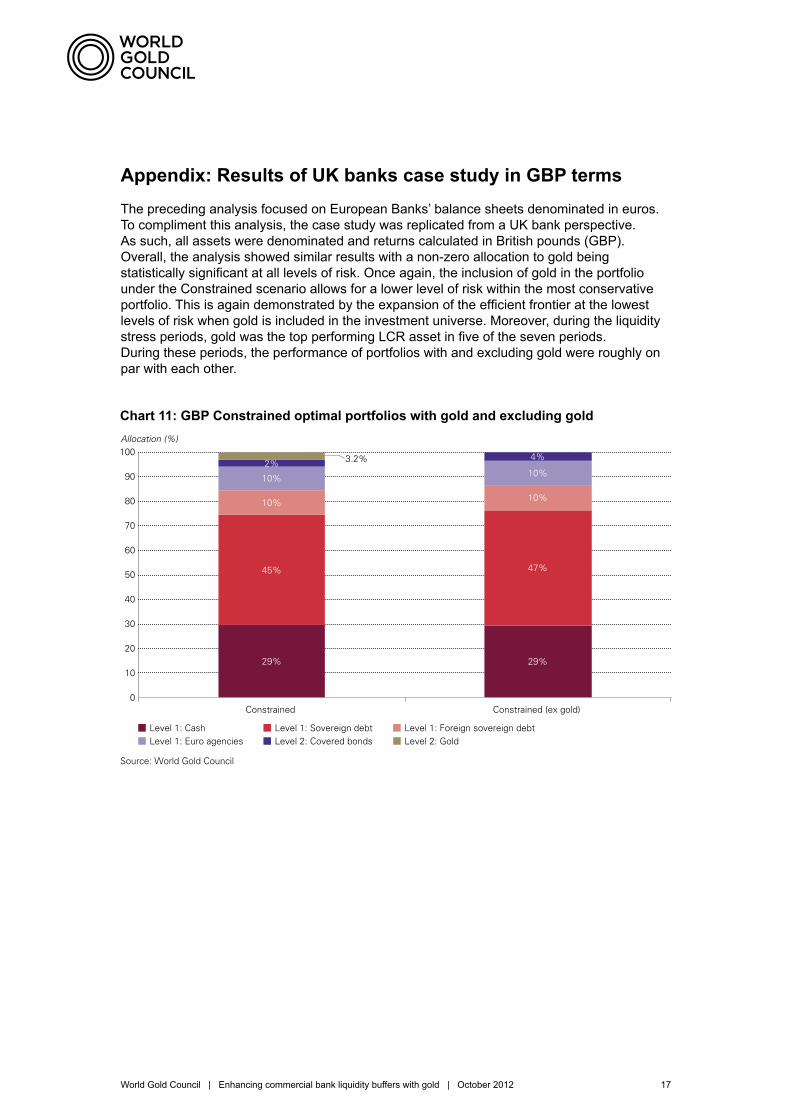
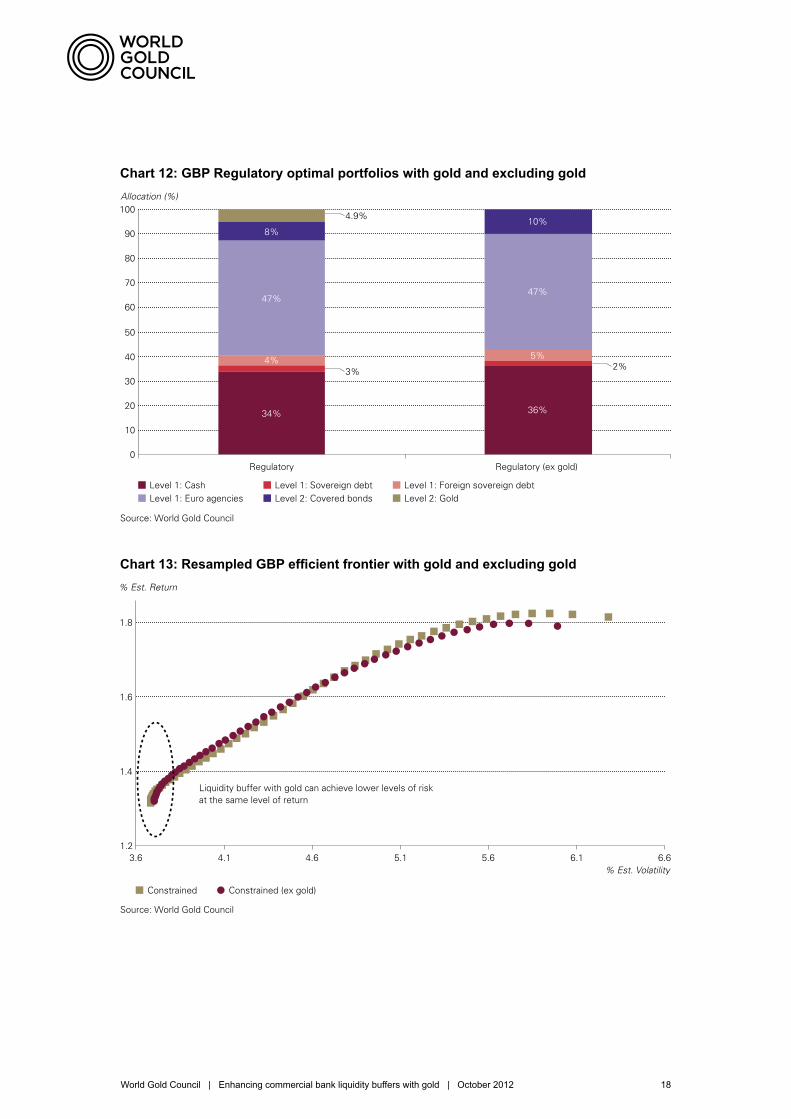
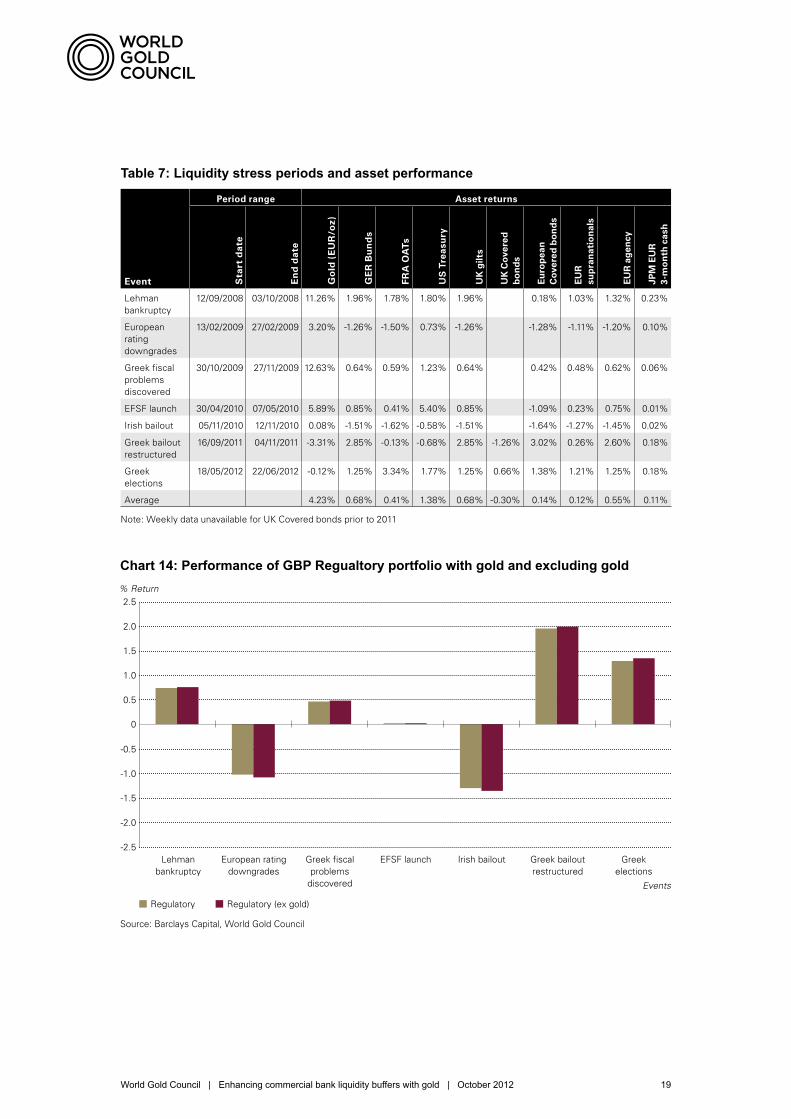
Appendix: Results of UK banks case study in GBP termsThe preceding analysis focused on European Banks’ balance sheets denominated in euros. To compliment this analysis, the case study was replicated from a UK bank perspective. As such, all assets were denominated and returns calculated in British pounds (GBP). Overall, the analysis showed similar results with a non-zero allocation to gold being statistically significant at all levels of risk. Once again, the inclusion of gold in the portfolio under the Constrained scenario allows for a lower level of risk within the most conservative portfolio. This is again demonstrated by the expansion of the efficient frontier at the lowest levels of risk when gold is included in the investment universe. Moreover, during the liquidity stress periods, gold was the top performing LCR asset in five of the seven periods. During these periods, the performance of portfolios with and excluding gold were roughly on par with each other.
Chart 11: GBP Constrained optimal portfolios with gold and excluding gold
3.2%
Allocation (%)
Chart 11: GBP Constrained optimal portfolios with gold and excluding gold
Constrained Constrained (ex gold)
Level 1: Cash Level 1: Sovereign debt Level 1: Foreign sovereign debt Level 1: Euro agencies Level 2: Covered bonds Level 2: Gold
Source: World Gold Council
10
0
20
30
40
50
60
70
80
90
100
29%
45%
10%
10%
2%
29%
47%
10%
10%
4%
World Gold Council | Enhancing commercial bank liquidity buffers with gold | October 2012 18
Chart 12: GBP Regulatory optimal portfolios with gold and excluding gold
Chart 13: Resampled GBP efficient frontier with gold and excluding gold
4.9%
3% 2%
Allocation (%)
Chart 12: GBP Regulatory optimal portfolios with gold and excluding gold
Regulatory Regulatory (ex gold)
Level 1: Cash Level 1: Sovereign debt Level 1: Foreign sovereign debt Level 1: Euro agencies Level 2: Covered bonds Level 2: Gold
Source: World Gold Council
10
0
20
30
40
50
60
70
80
90
100
34% 36%
4% 5%
47% 47%
8% 10%
% Est. Return
Chart 13: Resampled GBP efficient frontier with gold and excluding gold
1.2
1.4
1.6
1.8
3.6 4.1 4.6 5.1 5.6 6.1 6.6
Liquidity buffer with gold can achieve lower levels of riskat the same level of return
% Est. Volatility
Constrained Constrained (ex gold)
Source: World Gold Council
World Gold Council | Enhancing commercial bank liquidity buffers with gold | October 2012 19
Table 7: Liquidity stress periods and asset performance
Event
Period range Asset returns
Sta
rt d
ate
En
d d
ate
Go
ld (
EU
R/o
z)
GE
R B
un
ds
FR
A O
ATs
US
Tre
asu
ry
UK
gilt
s
UK
Co
vere
d
bo
nd
s
Eu
rop
ean
C
ove
red
bo
nd
s
EU
R
sup
ran
atio
nal
s
EU
R a
gen
cy
JPM
EU
R
3-m
on
th c
ash
Lehman bankruptcy
12/09/2008 03/10/2008 11.26% 1.96% 1.78% 1.80% 1.96% 0.18% 1.03% 1.32% 0.23%
European rating downgrades
13/02/2009 27/02/2009 3.20% -1.26% -1.50% 0.73% -1.26% -1.28% -1.11% -1.20% 0.10%
Greek fiscal problems discovered
30/10/2009 27/11/2009 12.63% 0.64% 0.59% 1.23% 0.64% 0.42% 0.48% 0.62% 0.06%
EFSF launch 30/04/2010 07/05/2010 5.89% 0.85% 0.41% 5.40% 0.85% -1.09% 0.23% 0.75% 0.01%
Irish bailout 05/11/2010 12/11/2010 0.08% -1.51% -1.62% -0.58% -1.51% -1.64% -1.27% -1.45% 0.02%
Greek bailout restructured
16/09/2011 04/11/2011 -3.31% 2.85% -0.13% -0.68% 2.85% -1.26% 3.02% 0.26% 2.60% 0.18%
Greek elections
18/05/2012 22/06/2012 -0.12% 1.25% 3.34% 1.77% 1.25% 0.66% 1.38% 1.21% 1.25% 0.18%
Average 4.23% 0.68% 0.41% 1.38% 0.68% -0.30% 0.14% 0.12% 0.55% 0.11%
Note: Weekly data unavailable for UK Covered bonds prior to 2011
Chart 14: Performance of GBP Regualtory portfolio with gold and excluding gold
-2.5
-2.0
-1.5
-1.0
-0.5
0
0.5
1.0
1.5
2.0
2.5% Return
Chart 14: Performance of GBP Regualtory portfolio with gold and excluding gold
Regulatory Regulatory (ex gold)
Lehmanbankruptcy
European ratingdowngrades
Greek fiscalproblems
discovered
EFSF launch Irish bailout Greek bailoutrestructured
Greekelections
Events
Source: Barclays Capital, World Gold Council
World Gold Council | Enhancing commercial bank liquidity buffers with gold | October 2012 20
DisclaimersThis report is published by the World Gold Council, 10 Old Bailey, London EC4M 7NG, United Kingdom. Copyright ©2012. All rights reserved. This report is the property of the World Gold Council and is protected by US and international laws of copyright, trademark and other intellectual property laws.
This report is provided solely for general information and educational purposes. The information in this report is based upon information generally available to the public from sources believed to be reliable. While the accuracy of any information communicated herewith has been checked, neither the World Gold Council nor any of its affiliates can guarantee such accuracy. The World Gold Council does not undertake to update or advise of changes to the information in this report. Expressions of opinion are those of the author and are subject to change without notice. The information in this report is provided on an “as is” basis. The World Gold Council makes no express or implied representation or warranty of any kind concerning the information in this report, including, without limitation, (i) any representation or warranty of merchantability or fitness for a particular purpose or use, or (ii) any representation or warranty as to accuracy, completeness, reliability or timeliness. Without limiting any of the foregoing, in no event will the World Gold Council or any of its affiliates be liable for any decision made or action taken in reliance on the information in this report and, in any event, the World Gold Council and its affiliates shall not be liable for any consequential, special, punitive, incidental, indirect or similar damages arising from, related to or connected with this report, even if notified of the possibility of such damages.
No part of this report may be copied, reproduced, republished, sold, distributed, transmitted, circulated, modified, displayed or otherwise used for any purpose whatsoever, including, without limitation, as a basis for preparing derivative works, without the prior written authorisation of the World Gold Council. To request such authorisation, contact [email protected]. In no event may World Gold Council trademarks, artwork or other proprietary elements in this report be reproduced separately from the textual content associated with them; use of these may be requested from [email protected].
This report is not, and should not be construed as, an offer to buy or sell, or as a solicitation of an offer to buy or sell, gold, any gold related products or any other products, securities or investments. This report does not, and should not be construed as acting to, sponsor, advocate, endorse or promote gold, any gold related products or any other products, securities or investments.
This report does not purport to make any recommendations or provide any investment or other advice with respect to the purchase, sale or other disposition of gold, any gold related products or any other products, securities or investments, including without limitation, any advice to the effect that any gold related transaction is appropriate for any investment objective or financial situation of a prospective investor. A decision to invest in gold, any gold related products or any other products, securities or investments should not be made in reliance on any of the statements in this report. Before making any investment decision, prospective investors should seek advice from their financial advisers, take into account their individual financial needs and circumstances and carefully consider the risks associated with such investment decision.