European Airline Capacity – Winter 2013/14 Boeing...
30
BOEING is a trademark of Boeing Management Company. Copyright © 2014 Boeing. All rights reserved. European Airline Capacity – Winter 2013/14 Boeing Commercial Airplanes Network, Fleet and Schedule Strategic Planning Module 20: 14 March 2014 Istanbul Technical University Air Transportation Management M.Sc. Program
-
Upload
truongthien -
Category
Documents
-
view
218 -
download
2
Transcript of European Airline Capacity – Winter 2013/14 Boeing...

BOEING is a trademark of Boeing Management Company. Copyright © 2014 Boeing. All rights reserved.
European Airline Capacity – Winter 2013/14 Boeing Commercial Airplanes
Network, Fleet and Schedule
Strategic Planning
Module 20: 14 March 2014
Istanbul Technical University
Air Transportation Management
M.Sc. Program

Copyright © 2014 Boeing. All rights reserved. Boeing Proprietary
World Regional Definitions

COPYRIGHT © 2014 THE BOEING COMPANY
Executive Summary Scheduled capacity to/from/within Europe up 5.3% YoY (by ASKs), led by
Turkish, Norwegian, LCCs. Air France, IAG cutting back on intra-Europe capacity.
− Europe ASKs expanding yet still lags global ASK growth (7.6%) − Turkish, Norwegian continue rapid expansion with double-digit ASK growth
Flag carriers cutting intra-Western Europe frequencies for the winter while Turkish, Norwegian, and Ryanair expand
− Despite ASK capacity growth, frequency growth flat as increases by Turkish (23%), LCCs are offset by Lufthansa (-4%), Air France/KLM (-17%), IAG (-13%) cuts
Europe-Middle East continues to be fastest growing regional flow at 10%+
− All regional flows positive, or near positive, YoY growth after volatile 2013
Istanbul Ataturk Airport posting 8% YoY capacity growth; now 4th largest airport by seat capacity
− Spain and Italy continue to face challenges; Madrid, Rome, Barcelona airports are biggest losers
Focus Carrier Section includes Lufthansa, Ryanair, Air France / KLM, British Airways/Iberia(IAG),and Air Berlin Supplemental focus section: European airline financials 3rd quarter earnings
3 Source: Innovata, Dec 2013 database, commercial jets >= 30 seats for flights from, within, and to Europe. Analysis uses Mktg Airline.

COPYRIGHT © 2014 THE BOEING COMPANY
Europe Capacity Report: Included Nations
4
YoY Change – Total Offered Seats • Green –expanding capacity • Red – declining capacity
Source: Innovata, Dec 2013 database, commercial jets >= 30 seats for flights from, within, and to Europe. Analysis uses Mktg Airline.
COPYRIGHT © 2014 THE BOEING COMPANY
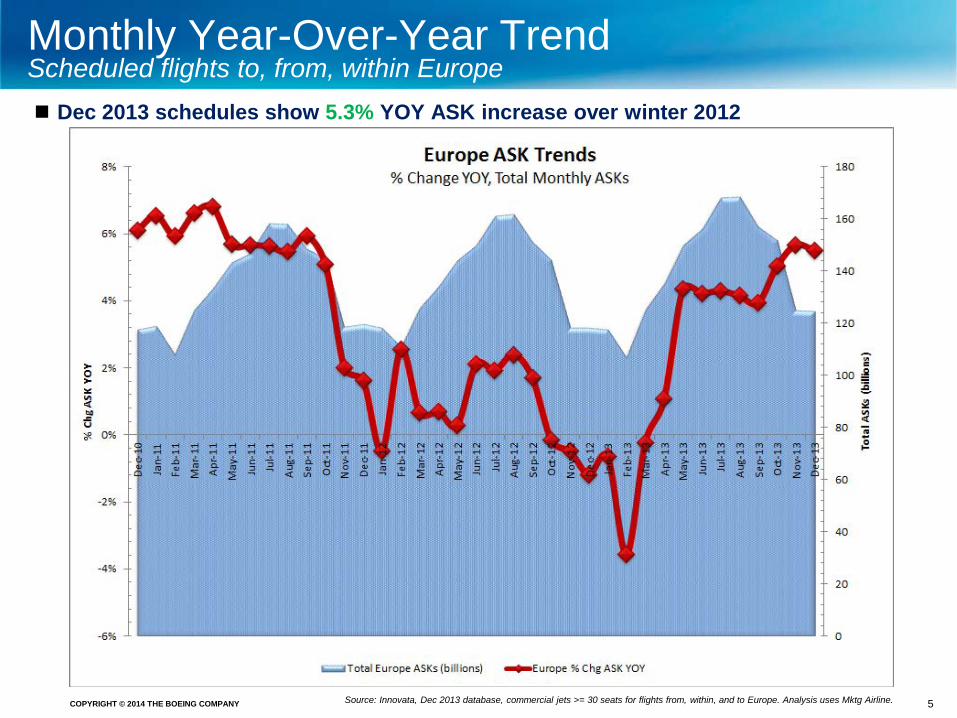
Monthly Year-Over-Year Trend Scheduled flights to, from, within Europe Dec 2013 schedules show 5.3% YOY ASK increase over winter 2012
5 Source: Innovata, Dec 2013 database, commercial jets >= 30 seats for flights from, within, and to Europe. Analysis uses Mktg Airline.
COPYRIGHT © 2014 THE BOEING COMPANY
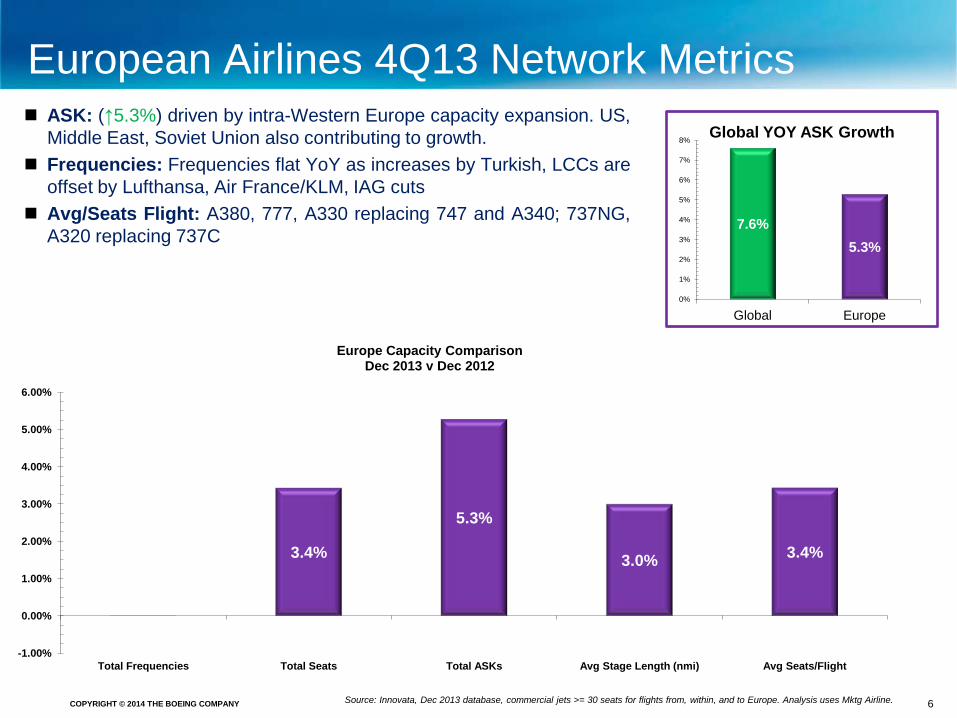
European Airlines 4Q13 Network Metrics ASK: (↑5.3%) driven by intra-Western Europe capacity expansion. US,
Middle East, Soviet Union also contributing to growth. Frequencies: Frequencies flat YoY as increases by Turkish, LCCs are
offset by Lufthansa, Air France/KLM, IAG cuts Avg/Seats Flight: A380, 777, A330 replacing 747 and A340; 737NG,
A320 replacing 737C
6
0.4%
2.1% 3.4%
+1.6%
0.0%
3.4%
5.3%
3.0% 3.4%
-1.00%
0.00%
1.00%
2.00%
3.00%
4.00%
5.00%
6.00%
Total Frequencies Total Seats Total ASKs Avg Stage Length (nmi) Avg Seats/Flight
Europe Capacity Comparison Dec 2013 v Dec 2012
7.6% 5.3%
0%
1%
2%
3%
4%
5%
6%
7%
8%
Global Europe
Global YOY ASK Growth
Source: Innovata, Dec 2013 database, commercial jets >= 30 seats for flights from, within, and to Europe. Analysis uses Mktg Airline.

COPYRIGHT © 2014 THE BOEING COMPANY
-
500
1,000
1,500
2,000
2,500
3,000
3,500
LUFTHANSA AIR FRANCE IAG TURKISH AIRLINES
RYANAIR EASYJET EMIRATES NORWEGIAN AIR SHUTTLE
UNITED AIRLINES
SAS SCANDINAVIAN
AIRLINES
Wee
kly
ASK
s (M
illio
ns)
Dec 13 ASK (per week) Change (neg)
Dec 13 ASK (per week) Change (pos)
Dec 12 ASK (per week)
Europe Capacity Comparison - ASKs Dec 2013 vs. Dec 2012 weekly available-seat-kilometers (ASKs)
European capacity up (ASKs ↑5.3%); intra-Europe capacity shifting away from AF, IAG Turkish Airlines moves to 4th largest operator (by ASKs) after 19% YoY capacity increase
7
4% 42%
3%
9%
2%
0%
-2%
Source: Innovata, Dec 2013 database, commercial jets >= 30 seats for flights from, within, and to Europe. Analysis uses Mktg Airline.
7%
3%
19%
↓W. Europe -17% ↑ Carribbean – 46%
↑ Africa – 11% ↑ C. America – 35%
↓E. Europe -28%
↑ former Soviet– NEW ↑ Africa – 14%
↑ Mid East – 5% ↓W. Europe -35%
↑ W. Europe– 34% ↑ US – NEW
↑ SE Asia– NEW
↑ W. Europe – 19% ↑ US – 26%
↑ Japan – 73% ↑ India – 50%
↑ SE Asia – 28% ↑ India – 50%
*Key drivers of change by airline, ranked by impact ↑ Europe - Region – %chg ↓Europe - Region -%chg
↑ W. Europe – 3% ↓Japan - 21%
↑ Canada – 25% ↓Asia - 9%
↑ W. Europe – 9% ↑ Africa – 102% ↓E. Europe -5%
↓W. Europe -7% ↓S. America -14% ↓Carribbean -31%
↑ India– 22% ↑US – 3%

COPYRIGHT © 2014 THE BOEING COMPANY
0
2000
4000
6000
8000
10000
12000
14000
16000
18000
20000
LUFTHANSA AIR FRANCE IAG RYANAIR EASYJET TURKISH AIRLINES
SAS SCANDINAVIAN
AIRLINES
NORWEGIAN AIR SHUTTLE
FLYBE AIR BERLIN
Tota
l Wee
kly
Flig
hts
Dec 12 Flights (per week) Dec 13 Flights (per week) change (pos) Dec 13 Flights (per week) change (neg)
Europe Capacity Comparison - Frequencies Dec 2013 vs. Dec 2012 weekly flights
Biggest Increases: Middle East (Arkia, Turkish), former Soviet Union (Ukraine, Aeroflot), Africa (Ryanair, Thomson,
RAM), United States (BA, Norwegian), Western Europe (Airlinair, Turkish, Germanwings)
Biggest Decreases: Western Europe (LH, AF, IAG)
8
0%
-4%
-5%
-13%
3% 23%
20%
-17%
-2%
Source: Innovata, Dec 2013 database, commercial jets >= 30 seats for flights from, within, and to Europe. Analysis uses Mktg Airline.
7%
↓W. Europe – (2,063) flights/wk
↓W. Europe – (1164) flights/wk
↑ W. Europe – 139 flights/wk
↓W. Europe – (1,173) flights/wk
↓W. Europe – (137) flights/wk
↑ W. Europe – 481 flights/wk
↑ W. Europe – 161 flights/wk ↓E. Europe – (46) flights/wk ↑ Africa– 72
flights/wk
↓W. Europe – (107) flights/wk
↑ W. Europe – 889 flights/wk
↑ Middle East – 52 flights/wk
*Key drivers of change by airline, ranked by impact
↑ Europe - Region – chg flights/week ↓Europe - Region -chg flights/week

COPYRIGHT © 2014 THE BOEING COMPANY
Regional Capacity by Flow
9
Europe-Middle East continues to be the fastest growing regional flow ~10% Transatlantic flows strengthening over 2013
Source: Innovata, Dec 2013 database, commercial jets >= 30 seats for flights from, within, and to Europe. Analysis uses Mktg Airline.

COPYRIGHT © 2014 THE BOEING COMPANY
Change in Regional Seat Capacity by Flow YOY change (December) in weekly seats deployed, by region
10
Capacity expanding in all regional flows; Turkish a key driver
↑ Turkish 18% ↑ Norwegian 18% ↑ Pegasus 24% ↑ Vueling 11% ↑ Germanwings 75% ↓Air France -18% ↓Iberia -22%
↑ Wizz Air 8% ↑ Lufthansa 10% ↑ Turkish 17% ↑ Austrian 7% ↑ EasyJet 7% ↓ Ryanair -6% ↓LOT -19%
↑LOT 8% ↑ Air Baltic 42% ↑ JAT 69% ↑ Bulgaria 25% ↓Czech -23%
↑ United 4% ↑ British 5% ↑ American 11% ↑ Air France 8% ↑ Turkish 23% ↓ Virgin -9% ↓ Iberia -7%
↑ Emirates 5% ↑ Qatar 17% ↑Turkish 13% ↑ Etihad 22% ↑ Arkia 51% ↑ Saudia 27% ↓ Lufthansa -5% ↓ El Al -15%
↑ RAM 27% ↑ Ryanair 104% ↑ Easyjet 15% ↓Air Algerie -19% ↓Tunisair -8% ↓Egyptair -10%
↑ Air China 3% ↑ GUN 7% ↑ Turkish 15% ↓KLM-5%
↑ Turkish 28% ↑ JAL 15% ↑ Malaysia 11% ↓Korean -12%
↑ KLM 11% ↓Iberia -16% ↓Lufthansa -5% ↓TAM-9%
Intra-Europe (LgSm) Transcontinental (LgSm)
Source: Innovata, Dec 2013 database, commercial jets >= 30 seats for flights from, within, and to Europe. Analysis uses Mktg Airline.

COPYRIGHT © 2014 THE BOEING COMPANY
-
1,000
2,000
3,000
4,000
5,000
6,000
7,000
8,000
A320 737NG 737C E-Jet 757 Other 777 A330 767 747 A340 A380 787 A300/310
Tota
l Sea
ts (
in th
ousa
nds)
Dec 13 Seats (per week) (000s) Dec 12 Seats (per week) (000s)
Europe Fleet Dynamics December YoY Fleet Change by Total Available Weekly Seats
Single Aisle Twin Aisle
• Single-Aisle (↑5.1%): 737NG growth outpacing A320 (↑4%) but total market share largely unchanged
• Twin-Aisle (↑5.2%): Boeing takes 3% of Airbus twin-aisle market share compared to December 2012 with 777/787s entering fleets and A340 leaving fleets faster than 747s
4%
10%
-8% -6% 4% 1% -5%
641%
14% 6%
-19%
10%
6% -2%
A320 ↑ Turkish 34% ↑ Lufthansa 13% ↑ Germanwings 51% ↑ SAS 125% ↓Iberia -25% ↓Air France -9% ↓ Alitalia -11%
A330 ↑ Iberia NEW ↓ Qatar -28% ↑ Etihad 8% ↑ Turkish 28%
737C ↑ Meridana 232% ↑ KLM 7% ↑ Transavia 94% ↓SAS -78% ↓Lufthansa -21% ↓ British -38%
737NG ↑ Pegasus 27% ↑ Norwegian 23% ↑ Sunexpress 210% ↑ Thomson NEW ↑ SAS 10% ↓Austrian -100%
A380 ↓ Lufthansa -33% ↑ Thai 1300% ↑ British NEW ↓ Singapore -14% ↓ Korean -100%
747 ↑ Lufthansa 31% ↓Thai -45% ↓ Cathay -81%
777 ↑ Turkish 103.4% ↑ Emirates 18% ↑ AF/KLM 18% ↑ American 46% ↑ Cathay 73% ↓ANA -44%
787 ↑ Qatar ↑ Thomson ↑ Jetairfly ↑ Norwegian ↑ LAN ↑ Air India ↑ British ↑ Royal Brunei ↑ Aeromexico ↑ China Southern ↑ Ethiopian ↑ JAL ↑ ANA ↑ LOT
E-Jet ↑ Air Dolomiti NEW ↑ Lufthansa 8% ↑ Airlinair NEW ↑ Alitalia 23% ↑ Air Europa 28% ↓Air France -17%
Source: Innovata, Dec 2013 database, commercial jets >= 30 seats for flights from, within, and to Europe. Analysis uses Mktg Airline.
A340 ↓Iberia -35% ↓Emirates -91%

COPYRIGHT © 2014 THE BOEING COMPANY
Europe Fleet Dynamics – Market Share Old-generation, out of production airplanes leaving fleets
SINGLE-AISLE OEM Market share shift (share shift Dec YoY):
• Airbus - 53.5% (↓0.4%)
• E-Jet - 5.8% (↑0.3%)
• 737NG, A320 expanding; 737C exiting fleets
TWIN-AISLE OEM Market share (share shift Dec YoY):
• Airbus - 43% (↓3.2%)
• Boeing – 57% (↑ 3.3%) Fleet market share by available seats (share shift Dec YoY):
• A330, A380, 777 expanding
• 777 – 30.1% (↑2.4%)
• A330 – 24.8% (↑0.2%)
• A380 – 5.3% (0%)
• 787 - 3.2% (↑2.7%)
• A340, 747 exiting fleets
• 747 – 11.5% (↓1.2%)
• A340 – 11.2% (↓3.4%)
• Boeing - 36.6% (↑0.7%)
• CRJ - 3.4% (↓0.3%)
Source: Innovata, Dec 2013 database, commercial jets >= 30 seats for flights from, within, and to Europe. Analysis uses Mktg Airline.

COPYRIGHT © 2014 THE BOEING COMPANY
Top 15 Europe Airports Ranked by size (December 2013 available originating seat capacity)
13
Total Europe seat capacity ↑ 3.4% in December year-over-year Istanbul Ataturk Airport continues strong year-over-year capacity growth (↑ 8%); 4th largest by Seat Capacity Frankfurt may be feeling pressure from Istanbul, Middle East Spain, Italy capacity down amidst continued uncertainty
Ranked largest to smallest, by seats
Source: Innovata, Dec 2013 database, commercial jets >= 30 seats for flights from, within, and to Europe. Analysis uses Mktg Airline.
3%
6%
-2%
8%
5% 4%
-12%
-6% -4%
4% 3%
8%
4%
-1%
4%
-15%
-10%
-5%
0%
5%
10%
Top 15 European Airports YoY Change in Seat Capacity
(Dec13 v. Dec12)

COPYRIGHT © 2014 THE BOEING COMPANY
Top 50 Intra-Europe City Pairs By weekly seats December 2013
14
*Data: capstats *sector is defined as one aircraft movement from Point A to Point B.

COPYRIGHT © 2014 THE BOEING COMPANY
Intra-European Market Analysis by Country
15
*Data: capstats *sector is defined as one aircraft movement from Point A to Point B.
As of Dec. 2013

COPYRIGHT © 2014 THE BOEING COMPANY
Domestic Market Analysis by Country
16
*Data: capstats *sector is defined as one aircraft movement from Point A to Point B.
As of Dec 2013

COPYRIGHT © 2014 THE BOEING COMPANY
Alliance Capacity Metrics
17 *Data:capstats/Innovata *sector is defined as one aircraft movement from Point A to Point B.
As of Dec. 2013

COPYRIGHT © 2014 THE BOEING COMPANY
Europe - Focus Carriers
18
Europe Focus Carriers • LCCs
• Ryanair
• Air Berlin
• Lufthansa
• Air France/KLM
• IAG
COPYRIGHT © 2014 THE BOEING COMPANY
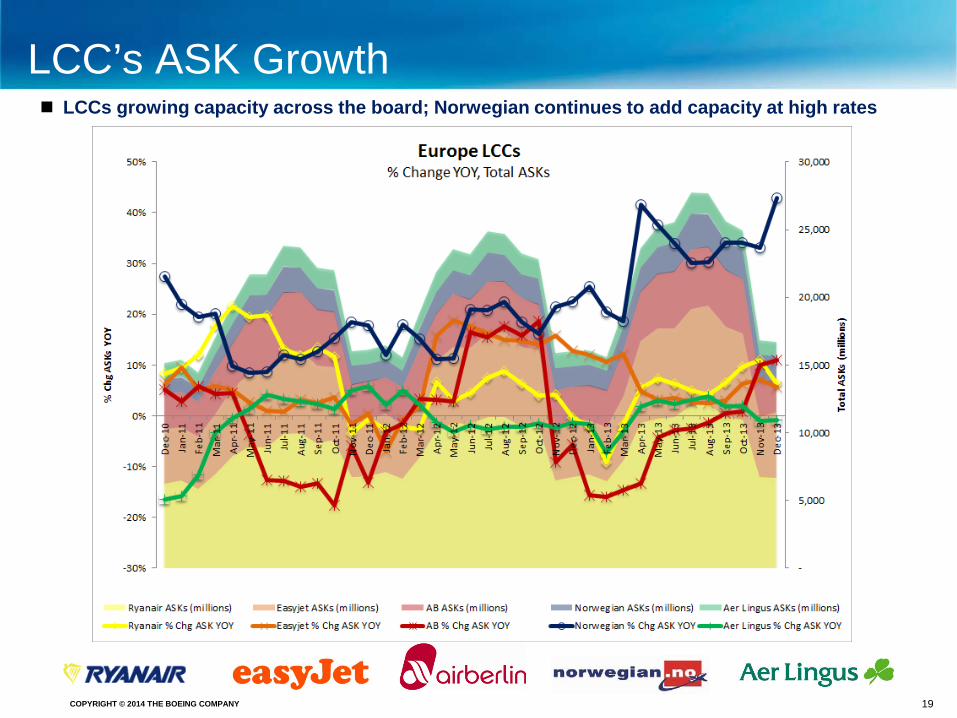
LCC’s ASK Growth
19
LCCs growing capacity across the board; Norwegian continues to add capacity at high rates
COPYRIGHT © 2014 THE BOEING COMPANY
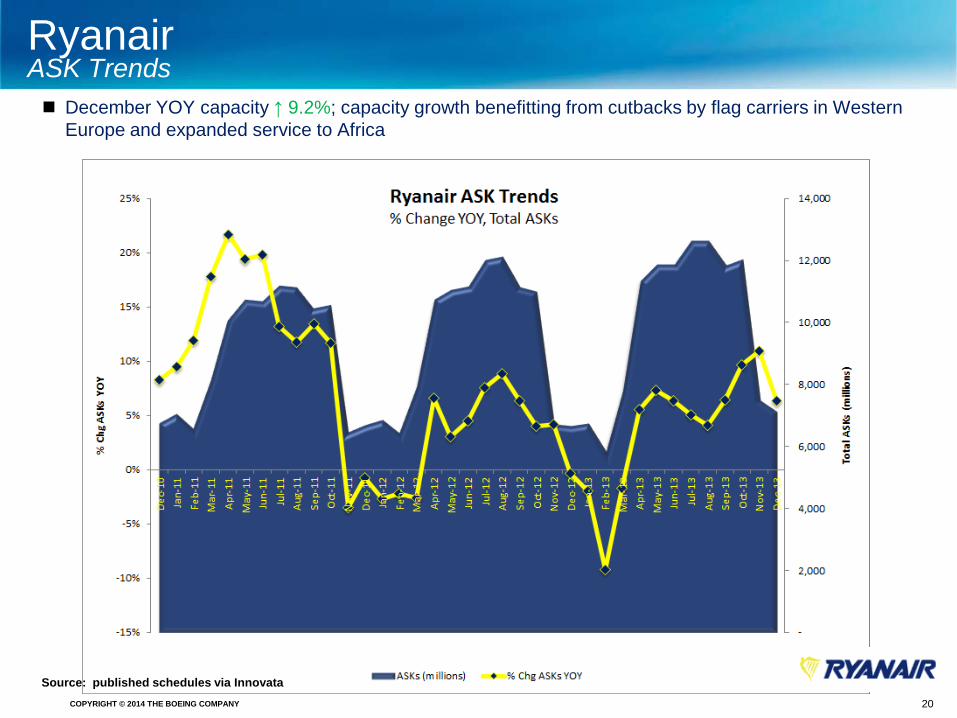
Ryanair ASK Trends December YOY capacity ↑ 9.2%; capacity growth benefitting from cutbacks by flag carriers in Western
Europe and expanded service to Africa
Source: published schedules via Innovata 20

COPYRIGHT © 2014 THE BOEING COMPANY
Ryanair Network Metrics – Dec 2013 v Dec 2012 YoY
21
Source: published schedules via Innovata
ASK growth driven by new intra-Western Europe and Africa routes
2.7% 2.7%
9.2%
6.4%
0.0% 0%
1%
2%
3%
4%
5%
6%
7%
8%
9%
10%
Total Frequencies Total Seats Total ASKs Avg Stage Length (nmi) Avg Seats/Flight

COPYRIGHT © 2014 THE BOEING COMPANY
Air Berlin ASK Trends
December schedules ↑ 12.6% YOY; AB aiming to cut costs 15% over the next two years “Turbine 2013” reducing fleet, focusing on short and medium-haul segments in core markets
o Expanding intra-Western Europe, US capacity; cutting Africa capacity
Source: published schedules via Innovata 22

COPYRIGHT © 2014 THE BOEING COMPANY
Air Berlin Network Metrics – Dec 2013 v Dec 2012 YoY
23
6.6%
8.7%
12.6%
3.2% 1.9%
0%
2%
4%
6%
8%
10%
12%
14%
Total Frequencies Total Seats Total ASKs Avg Stage Length (nmi) Avg Seats/Flight
ASK growth driven by routes to Germany, US, Turkey, and Spain

COPYRIGHT © 2014 THE BOEING COMPANY
Lufthansa ASK Trends December YOY schedules up 3.5% as European markets strengthen in second half
Source: published schedules via Innovata 24

COPYRIGHT © 2014 THE BOEING COMPANY
Lufthansa Group Network Metrics – Dec 2013 v Dec 2012 YoY
25
Source: published schedules via Innovata
Intra-Europe: capacity in Germany, Spain, Poland, UK; cutting capacity in Italy, Switzerland
International: growing capacity to Russia, Israel; cutting capacity in US, Korea, Iran, Thailand
-3.8%
5.2% 3.5%
2.1%
9.4%
-6%
-4%
-2%
0%
2%
4%
6%
8%
10%
12%
Total Frequencies Total Seats Total ASKs Avg Stage Length (nmi) Avg Seats/Flight

COPYRIGHT © 2014 THE BOEING COMPANY
Air France / KLM ASK Trends
Source: published schedules via Innovata 26
December YOY schedules ↑ 3% even as AF restructures capacity domestically (Western Europe: AF -17% reduction, KLM 8% expansion)

COPYRIGHT © 2014 THE BOEING COMPANY
-15.2%
-6.7%
3.0%
11.5% 9.9%
-20%
-15%
-10%
-5%
0%
5%
10%
15%
Total Frequencies Total Seats Total ASKs Avg Stage Length (nmi) Avg Seats/Flight
Air France / KLM Network Metrics – Dec 2013 v Dec 2012 YoY
27
Source: published schedules via Innovata
AF/KLM contracting in both Western and Eastern Europe while expanding in the Caribbean and
Central America, driven by Air France
AF expanding in SE Asia and Africa, KLM expanding in South America

COPYRIGHT © 2014 THE BOEING COMPANY
IAG (British Airways, Iberia) ASK Trends IAG December YOY schedules down 2.3% as BA growth offset by continued IB restructuring to focus on improving unit
revenues Iberia cutting capacity in all other markets except Eastern Europe…major drivers are in Western Europe (-21%), South
America (-16%), Caribbean (-100%) British Airways expanding in most markets except relatively small cuts to Japan, SE Asia, and Middle East…key capacity
growth markets are US (5%), Western Europe (4%), India (22%), and China + Asia (15%)
Source: published schedules via Innovata 28

COPYRIGHT © 2014 THE BOEING COMPANY
IAG Network Metrics – Dec 2013 v Dec 2012 YoY
29
Source: published schedules via Innovata
Large single-aisle capacity reductions by Iberia driving down ASKs, increasing average stage length
-12.6%
-8.3%
-2.3%
9.5%
5.0%
-15%
-10%
-5%
0%
5%
10%
15%
Total Frequencies Total Seats Total ASKs Avg Stage Length (nmi) Avg Seats/Flight

COPYRIGHT © 2014 THE BOEING COMPANY 30
Questions?