European Accounting and Management Review
111
European Accounting and Management Review Volume 7, Issue 1, November 2020 ISSN (online): 2385-3921 Published on https://eamr-accid.eu
Transcript of European Accounting and Management Review

European Accounting and
Management Review
Volume 7, Issue 1, November 2020
ISSN (online): 2385-3921
Published on
https://eamr-accid.eu

INDEX
How the Mission Internalization Works? An Empirical Research Marta Mas-Machuca and Frederic Marimon
...................1
Women with STEM qualifications on supervisory boards. Does a high women
quota in supervisory boards influence firm success? Bettina Binder
...................28
Open Innovation in Times of Covid-19: The case of Project OxyGEN Giovanna Lara Burbano
...................47
Does an internship in Business Administration enhance professional
competences? Ramon Bastida and Frederic Marimon
...................66
The Role of Awareness, Learning and Knowledge in Entrepreneurial and Firm
Leadership Processes Neus Vila brunet
...................78
European Accounting and
Management Review
Volume 7, Issue1, November 2020

EAMR
EUROPEAN ACCOUNTING AND MANAGEMENT REVIEW
1
VOLUME 7, ISSUE 1, ARTICLE 1, 1-27, NOVEMBER 2020
How the Mission Internalization Works? An Empirical
Research
Marta Mas-Machuca
Department of Economy and Business Organization
Universitat Internacional de Catalunya, Barcelona, Spain
Frederic Marimon
Department of Economy and Business Organization
Universitat Internacional de Catalunya, Barcelona, Spain
Received September 9, 2020; accepted October 27, 2020.
ABSTRACT
The objective of this paper is to analyse the process of the definition and deployment of a
company’s mission, to obtain a better understanding of the employees’ role. On the basis of
the literature investigating the dimensions of the internalization of a mission (leadership,
importance, knowledge, co-workers’ engagement and implication), the paper proposes a
model that shows the cause and effect relationships among these dimensions. A survey
addressed to Spaniards was launched, and 400 valid responses were received. The data was
analysed using Structural Equation Modelling (SEM) for an initial model that shows the
causal relations among the dimensions for the internalization of a mission. An array of
Lagrange multiplier tests suggested modifications for refining the model and proposed one
with acceptable fit indices, where the last dimension to be accomplished is
“Implication”. The findings show a direct effect between “Leadership” and “Implication”,
and double mediation. On the one hand, there is second order mediation through
“Knowledge” and “Importance”. On the other hand, there is mediation through “Co-workers’
engagement”. This sequencing among the five dimensions of the internalization of the

Marta Mas-Machuca and Frederic Marimon
2
mission gives new clues and evidence for managers that will help them to define and
implement a successful mission statement.
KEYWORDS
Mission internalization, Mission deployment, Leadership, Co-workers engagement
implication.

How the Mission Internalization Works? An Empirical Research
3
1. Introduction
A mission statement is commonly recognized by academics and practitioners as the first step
in strategic management (David, 1989). A mission statement provides a clear sense of what
the organization stands for (Bates & Dillard, 1991; Campbell, 1989). Traditionally, it has
been understood that the aim of a mission statement is to make a public declaration of the
purpose, goals, products, markets, and philosophical views of the organization (Bart, Bontis,
Taggar, Sufi, & Lyons, 2001; Campbell & Yeung, 1991; Ireland & Hitt, 1992; Klemm,
Sanderson, & Luffman, 1991). In fact, (Bartkus, Glassman, & McAfee, 2000, p. 28)
suggested that “the best mission statements simply define the company’s business and
suggest a future goal”. The second step is the internalization of the mission (“IM”) by the
employees, by which is meant providing a full sense of the mission that enables the
employees to work in the confidence that their work fulfils their own personal objectives and
at the same time is aligned with the organizational mission (Cardona & Rey, 2008).
Alegre et al. (2018) conducted a literature review on mission statement highlighting the
importance of an effective implementation of an organization's mission. The benefits
(financial and non-financial) that can be envisaged to arise from a consistent mission
definition and a wise implementation are of paramount importance, and this is a good reason
for understanding how the mission is defined (Baetz & Bart, 1996; Bart et al., 2001; Denton,
2001; Weiss & Piderit, 1999). Although “mission” is a wider concept than “mission
statement”, there is no doubt that the effort of writing the mission statement is a key element
of the definition of the mission (Ireland & Hitt, 1992). A useful mission statement that guides
and orients the daily operations of the firm can only be created by following a process that
guarantees its effective development (Mullane, 2002). Frequently cited as the benefits of a
mission statement are: (i) the provision of a sense of direction and purpose for the
organization (Bart et al., 2001; Ireland & Hitt, 1992); (ii) a focus on the allocation of
organizational resources (Bartkus et al., 2000; Gibson, Newton, & Cochran, 1999); (iii)
effective communication with internal and external stakeholders (Bartkus et al., 2000;
Klemm et al., 1991) ; and (iv) a description of the values of the organization that will guide
and inspire employees (Collins & Porras, 1996; Denison & Mishra, 1995; Ireland & Hitt,
1992).

Marta Mas-Machuca and Frederic Marimon
4
Apart from research on the benefits, another stream of research analyses the components of
mission statements (Baetz & Bart, 1996; Bart & Tabone, 1999; David, 1989; Davis, Ruhe,
Lee, & Rajadhyaksha, 2007; Klemm et al., 1991). Since a mission statement is considered
critical to an organization’s performance, many studies have attempted to identify the main
features of mission statement that have the most impact on a firm’s output (Duygulu, Ozeren,
Işıldar, & Appolloni, 2016; Macedo, Pinho, & Silva, 2016). Macedo et al. (2016) suggest a
model to examine the mediating role of organizational commitment to explain the mission-
performance relationship. Effectively, organizational commitment plays an important role in
this link. Additionally, Desmidt (2016) studied how employees perceived mission statements
and the effect of the mission Although perceived mission statement quality and employee
mission engagement are positively linked in the public sector, employees’ mission
acceptance differs depending on the message receiver, behavioural integrity and the mission
ambiguity (Desmidt, 2016).
According to Quinn and Thakor (2018, p. 78) a corporate mission and purpose “reflects
something more aspirational. It explains how people involved with an organization are
making a difference, gives them a sense of meaning, and draws their support.” Marimon et
al. (2016) focus their analysis on the internalization of the mission, which they define as “the
way in which employees assume the mission as their own and allow it to become part of their
personal beliefs and values”. Accordingly, it is not enough to have a solid and consistent
mission, and neither is it enough to invite employees to join in the process of defining the
mission. The next step that must be accomplished on this path is the internalization of the
mission. This provides guarantees and evidence that the mission is not just a statement on the
organization’s website or in its brochure, but is a statement of value that has real meaning for
the employees. In their recent publication, Marimon et al. (2016) distinguish five dimensions
in the multifactorial mission internalization construct: leadership, knowledge, importance,
co-workers’ engagement and implication (see annex). However, although it has been proved
to be a correlation among these factors and they have been grouped as second order factors,
there is still no evidence about the sequence in which these dimensions have to be
accomplished.
Because of this lack of knowledge, it is useful to study the path that must be followed to
define, create and manage a mission statement that has a real impact on the success of a

How the Mission Internalization Works? An Empirical Research
5
company. Consequently, the main aim of this article is to propose a sequence of the
dimensions of the internalization of the mission (leadership, knowledge, importance, co-
worker’s engagement and implication). In this sense, the main goal of this study is to assess
a model of the process of the mission statement’s internalization.
Results show that, on the one hand, there is a second order mediation through “Knowledge”
and “Importance”. On the other hand, there is mediation through “Co-workers’ engagement”.
In addition, the model also proposes a direct effect from “Leadership” to “Implication”. Our
research will contribute to the understanding of the creation of a mission statement and will
suggest the path that should be followed for the effective internalization of the mission within
organizations.
Our study answers the need identified by Desmidt et al. (2011) for more research on how to
create a successful mission statement. Along the same lines, Mullane (2002) proposes future
research on how to use a mission statement as a common strategic tool. Managers and
practitioners experience significant problems in creating and implementing their mission
objectives, so this is not easy work (Bart, 2007). In this sense, our study contributes towards
a theoretical contribution for the definition and implementation of mission statement, as well
as, helping managers to understand how a mission statement is defined and implemented.
Therefore, this research sheds light on the path towards a true internalization of the firm’s
mission by its employees. Globalization and environmental complexity create a need for
effective mission statements.
The article is organized as follows: the next section presents the literature review and the
proposed sequence, and then the methodology is described and the results of the analysis
presented. Finally, the results are discussed and the theoretical and practical contributions of
the paper are explained.
2. Literature review and proposed sequence
According to the holistic conceptualization of mission (Rey & Bastons, 2018) the
development of a mission is structured in three interconnected dimensions: formal, dynamic
and motivational. Mission as a dynamic practice considers that a mission statement is a
formal exercise but you need some processes to take it to life. It is relevant achieve the extent
to which the organization is doing what it states in its mission (Bart, 1997; Suh, Houston,
Barney, & Kwon, 2011). The formulation and implementation of a company’s mission is a

Marta Mas-Machuca and Frederic Marimon
6
difficult task, and more research is needed to guide companies in this process to put the
mission into practice (Lundberg, 1984; Macedo et al., 2016). In this sense, as mentioned
above, Marimon et al. (2016) propose a measure with five dimensions to assess the
internalization of the mission. First, the leadership dimension refers to the extent to which
the managers of the company are committed to the mission. Their engagement with the
mission can be seen through their daily actions and decisions. Second, the knowledge of the
mission refers to the extent to which an employee knows what the mission is, and is able to
explain, in his or her own words, the mission statement. Third, the dimension of the
importance of the mission can be defined as the extent to which an employee feels that the
mission is important in fulfilling his or her vital contribution to society. Fourth, co-worker’s
engagement is the extent to which an employee feels that his or her colleagues are committed
to the mission. Finally, fifth, the implications dimension can be considered to be the extent
to which an employee participates in conceptualizing and creating the mission of the
company and how he or she thinks about it as time goes on.
In order to propose the sequence for how these five dimensions are used to internalize the
mission, we review some previous studies in which different aspects of this process were
considered.
Previous studies suggest that the understanding and commitment towards the corporate
mission are higher at managerial levels than with non-managerial employees (Desmidt, 2016;
Vandijck, Desmidt, & Buelens, 2007). Their hierarchical position will provide access to more
and relevant mission information and a broad view of the company’s purpose. For that
reason, if the managers buy the mission and clearly communicate it through different means
(in a formal and informal way), employees will better understand the core ideals of the
mission.
In many companies, managers are responsible for communicating a clear and attractive
mission statement to the employees. This is complicated work because it is very important,
yet difficult, to transmit a compelling mission without ambiguity. Desmidt (2016) states that:
“High levels of ‘mission comprehension ambiguity’ have a detrimental impact on the
motivational power and perceived attractiveness of organizational goals”. In this sense,
managers have to identify and communicate the key concepts of the mission statement. A

How the Mission Internalization Works? An Empirical Research
7
positive attitude of top management towards the mission can be considered the first step
towards achieving an effective mission internalisation. The management’s commitment to
the corporate mission should affect employees’ understanding of the mission. Consequently,
we hypothesize that:
H1: The attitude of top management and leaders towards the mission (“Leadership”)
has a positive impact on the understanding of the mission statement (“Knowledge”).
Notwithstanding the above, the internalization of a mission is not simply to know the mission.
One of the crucial aspects in mission fulfilment is the degree to which employees know and
understand their corporate mission (Bart et al., 2001).
Following David (1989), developing and communicating a clear business mission is one of
the most commonly neglected tasks in strategic management. Only a clear definition of the
mission makes it possible to set realistic but motivating business objectives. On the same
lines, Bart (1997) found that 92 per cent of the managers in his survey considered that their
current mission statement was not fully clear or self-evident to the rest of the organization.
This author considers that one possible cause for the lack of success with missions could be
that many mission statements are not defined and communicated clearly. Therefore, it is
important to communicate the mission clearly in a way that can be understood by every
employee of the company. Employees must be able to explain and share with their colleagues
or with external parties the content and the spirit of the corporate mission. One important
dimension is the employees’ ability to explain the mission statement in their own words
(Wang, 2011). Good communication of the mission statement is essential to the effective
dissemination of this knowledge within the company (Mullane, 2002).
Once the organizational members have shared in the knowledge and understanding of the
corporate mission, they should consider their own importance in the sense of the need for
them to be efficient and to be inspired to improve the organization and society (Collins &
Porras, 1996; Wang, 2011). Once they have achieved this understanding, they can support
the mission passionately (Bart, 2007). Therefore, we propose the following hypothesis:

Marta Mas-Machuca and Frederic Marimon
8
H2: An understanding of the mission statement (“Knowledge”) has a positive impact
on the assessment of the importance of the mission (“Importance”).
However, when creating a mission it is not enough to hang it on the wall (Mullane, 2002) or
to put it on the website (Bart, Bontis, & Taggar, 2001) for it to be known by the employees.
It is relevant to consider the importance of understanding the mission statement (Marimon et
al., 2016). This is a deep process inside each employee, and each employee really has to live
the mission, and not only in an external or formal way. It is necessary to provide employees
with time to think about the purpose of the company. According to (Baetz & Bart, 1996), all
stakeholders, especially employees, should be involved in creating and developing the
mission statement. All employees should know the reasons that gave rise to the corporate
mission, and why the mission is important for each of them, for the company and for society.
This dimension is a subsequent and further step, and goes beyond a simple understanding of
the importance of the mission. If the employees agree the purpose of the company, they will
be aware of how they can participate in the process to define and work towards the fulfilment
of the mission (Bart et al., 2001).
Once they have realised its importance, employees can think reflectively, plan carefully and
work towards the mission (Williams, Morrell, & Mullane, 2014). Based on previous research,
the following hypothesis can be put forward:
H3: An assessment of the importance of the mission (“Importance”) has a positive
impact on whether the employees work on the basis of and according to the mission
(“Implication”).
As we have said before, the top management support towards the mission plays an important
role in the process of communicating and deployment the mission (Baetz & Bart, 1996). The
dearth of management commitment in the mission implementation could clarify some of the
dissatisfaction in mission statements.
According to Desmidt (2016), the effective communication of a corporate mission could be
considered as a function of their ability to impact on the employees’ beliefs, assumptions and
behaviours. As suggested by Desmidt (2016), higher levels of perceived mission statement

How the Mission Internalization Works? An Empirical Research
9
quality are positively related with employee mission engagement. One of the antecedents of
perceived mission quality is behavioural integrity. Leaders must look on ways to transcend
their own decisions (Paarlberg & Lavigna, 2010). In this sense, managers must encourage
employees to fulfil the corporate mission in order to succeed in the market. Moreover,
consequently, employees look for the commitment of their colleagues to reinforce their
application of the mission. The employee knowledge regarding the mission statement
disseminator (usually managers) could influence the motivations towards the mission at all
employees’ levels.
Top management commitment must involve the full process of defining, communicating and
developing the mission statement (Mullane, 2002). In addition, employees must participate
in this process. Babnik et al. (2014, p. 623) suggest that “in the process of mission
formulation, employees should be included and not only the top management”. The mission
will orient the employees’ daily work and decision, and in this context, it will be synergies
between employees’ mission engagement.
Previous research affirms that the provision of top-down communications is not enough to
achieve a uniform perception of a mission (Desmidt, 2016). All hierarchical levels of
companies must share the mission principles. All different managerial levels and staff
members must be involved in developing objectives that are resultant from the mission
statement (Mullane, 2002). In this vein, the commitment of leaders towards the corporate
mission could influence the engagement with the mission by employees’ colleagues, and
finally, affecting towards the mission internalization for all. Thus, we propose the following
hypothesis:
H4: The attitude of top management and leaders towards the mission (“Leadership”)
has a positive impact on the engagement with the mission by employees’ colleagues
(“Co-workers’ engagement”).
Many authors have suggested that employees must be involved in the process of practising
the mission statement (Babnik, Breznik, Dermol, & Širca, 2014; Williams et al., 2014). All
the organizational members must be involved if there is to be a guarantee that the mission
statement will have a positive impact on the firm (Mullane, 2002) . The involvement of all

Marta Mas-Machuca and Frederic Marimon
10
employees, not just the commitment of the top management, is crucial in implementing the
mission statement (Wang, 2011). To maintain the motivation to work with and accomplish
the mission statement over a long period of time, it is necessary for the whole department to
work in the same direction. The impact of the engagement of co-workers is relevant to
whether their colleagues really commit to the mission. When the majority of individuals are
engaged and motivated by the mission statement, the degree of participation by the
employees is greater. The involvement with and internalization of the mission in the daily
activities of colleagues could influence employees’ behaviour. For this reason, we propose
the following hypothesis:
H5: The engagement with the mission by employees’ colleagues (“Co-workers’
engagement”) has a positive impact on the way in which the employees will work in
line with the mission (“Implication”)
One reason for creating a mission statement is to assert leadership (Klemm et al., 1991). The
commitment of top management influences the performance-related actions and decisions of
employees (Williams et al., 2014). The involvement of leaders in the mission statement, and
the strategic role of the mission statement in communications, are important and are powerful
mechanisms for implementing and strengthening the mission (Ireland & Hitt, 1992). It is
crucial for leaders to disseminate the purpose of the firm in order to establish a good
understanding and integration of this purpose in the daily work of the employees (Hirota,
Kubo, Miyajima, Hong, & Won Park, 2010). A lack of top management involvement in the
process of creating and deploying the mission could be a reason for its failure (Baetz & Bart,
1996). Strong participation by the senior supervisors is therefore recommended for effective
mission development (Bart & Baetz, 1998). Lundberg (1984) suggests that managers’
commitment to the mission is a common and essential element for mission formulation.
Some previous studies, such as that of (Ireland & Hitt, 1992), suggest that a mission statement
should be formed only when the top-level managers have made the philosophical and
operational commitment required to focus the organization’s resources on the
accomplishment of the mission. Williams et al. (2014) suggested that commitment by the top
management to the mission statement moderates the mission’s impact on firm performance

How the Mission Internalization Works? An Empirical Research
11
by: (i) identifying and communicating the key concepts; (ii) involving all management levels
and functional areas; (iii) setting specific targets related to the mission statement; and (iv)
periodically reviewing and revising the mission. This means that it is not only the clarity of
the content of the mission that is related to performance, but also the commitment to the
mission by the leaders of the company. When managers show by example how to take into
account the mission in their decisions and strategies, and how they can translate the mission
statement into their daily procedures, employees are truly inspired, and this is a key
antecedent to achieving full participation by the employees in the mission. Based on the
foregoing, we suggest that:
H6: The attitude of top management and leaders towards the mission (“Leadership”)
has a positive impact on the way in which the employees work on the mission
(“Implication”)
The proposed model is shown in Figure 1. According to previous literature, the starting point
is the commitment by the leadership to the mission that will impact on the participation by
the employees in working in line with the mission (implication). One mediation relationship
is based on knowing and understanding the importance of the mission statement. Another
mediation relationship is the co-worker’s engagement with the mission.
Figure 1. Research model.

Marta Mas-Machuca and Frederic Marimon
12
3. Methodology
To proceed with the research on the chronological sequence for the accomplishment of the
five IM dimensions, we generated a survey of 257 Spanish residents, which was administered
April 2015. The target of the questionnaire was the whole Spanish population and it was pre-
established a ratio of respondents for the groups of gender and age in order to avoid bias. A
specialized company was required to conduct the survey to obtain the sample. Table 1 shows
the demographic characteristics of the sample. The questionnaire consisted of the 18 items
of the IM scale and some additional information related to the socio-demographic profile of
the respondent.
Number %
Gender
Male 131 51.0%
Female 126 49.0%
Total 257 100%
Age
Between 25 and 34 years 77 30,0%
Between 35 and 44 years 76 29,6%
Between 45 and 54 years 72 28,0%
Between 55 and 64 years 32 12,5%
Total 257 100,0%
Working status
Working full time 208 80.9%
Working part time 39 15.2%
School and work 10 3.9%
Total 257 100%
Annual income (in euros)
< 10,000 euros 43 16.7%

How the Mission Internalization Works? An Empirical Research
13
Between 10,000 and 30,000 129 50.2%
Between 30,000 and 40,000 33 12.8%
> 40,000 euros 5 1.9%
No answer 47 18.3%
Total 257 100%
Education
Basic studies 16 6.2%
High school diploma 64 24.9%
Vocational qualification 50 19.5%
University degree 127 49.4%
Total 257 100%
Table 1. Demographic characteristics of the sample.
The scale used the terms that were established by Marimon et al. (2016). It consists of 18
items arranged in five dimensions. The first step was to confirm the internal reliability of the
dimensions and their internal consistency, and to perform a discriminant analysis. Once this
had been done, the cause–effect model was developed, in order to explain the “Implication”
construct. The model was tested using Structural Equation Modelling (SEM) in order to find
out the sequence of how the IM dimensions were accomplished. The research model (Figure
1) was drawn from the review of the previous literature.
4. Results
4.1. Reliability and validity analysis for the scale
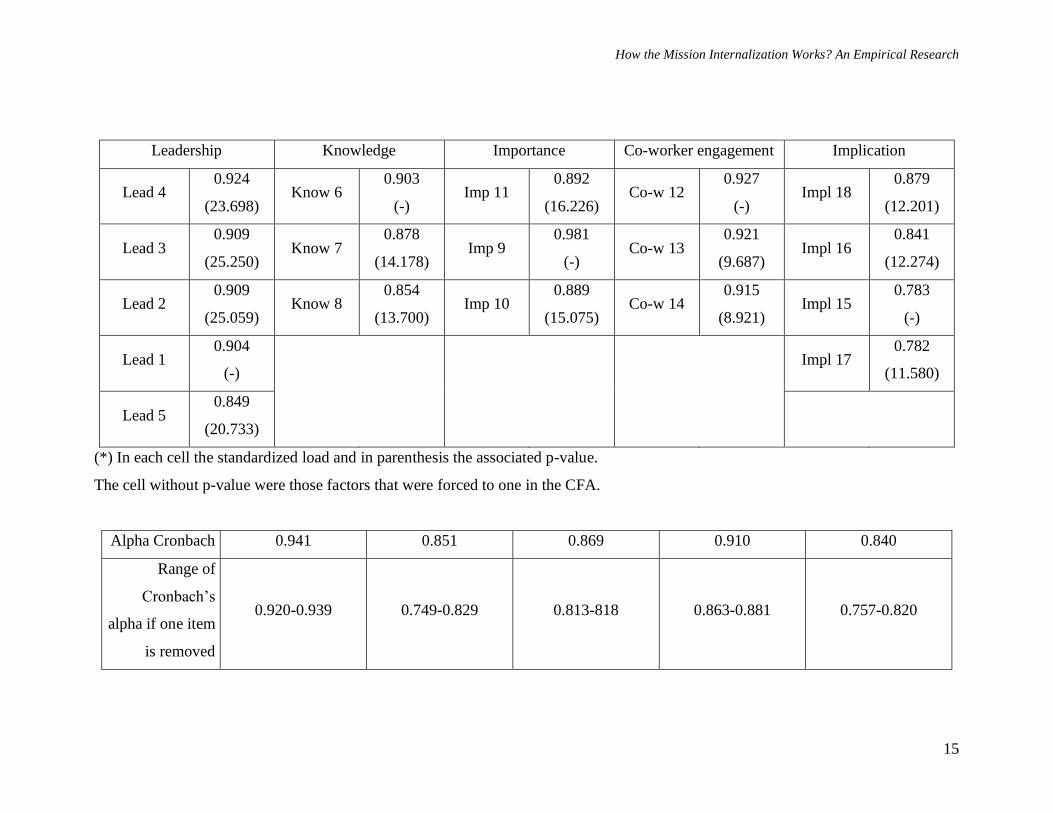
To examine the dimensionality of the five IM dimensions, five Confirmatory Factor Analysis
(CFA) were conducted, using EQS 6.2 software. The last objective of a CFA is to validate
whether the data fits a hypothesized research model. The five analyses each extracted only
one factor. Table 2 shows the statistics for reliability and convergent validity. The reliability
of these five factors was then assessed. Cronbach's alpha is a measure of internal consistency
among all items used. In every case Cronbach’s alpha coefficient and the composite
reliability exceeded the threshold value of 0.7 for internal consistency. Nunnally and

Marta Mas-Machuca and Frederic Marimon
14
Bernstein (1994) established 0.7 to be an acceptable reliability coefficient. In addition, the
variance extracted for each factor was greater than 0.5. Also, to validate a construct is
important to assess the convergent validity to confirm that measures that should be related
are in reality related (Hair et al., 2015). Convergent validity was confirmed for all the factors,
where all of the items were shown to have significant loads (t >2.58).
How the Mission Internalization Works? An Empirical Research
15
Leadership Knowledge Importance Co-worker engagement Implication
Lead 4 0.924
(23.698) Know 6
0.903
(-) Imp 11
0.892
(16.226) Co-w 12
0.927
(-) Impl 18
0.879
(12.201)
Lead 3 0.909
(25.250) Know 7
0.878
(14.178) Imp 9
0.981
(-) Co-w 13
0.921
(9.687) Impl 16
0.841
(12.274)
Lead 2 0.909
(25.059) Know 8
0.854
(13.700) Imp 10
0.889
(15.075) Co-w 14
0.915
(8.921) Impl 15
0.783
(-)
Lead 1 0.904
(-) Impl 17
0.782
(11.580)
Lead 5 0.849
(20.733)
(*) In each cell the standardized load and in parenthesis the associated p-value.
The cell without p-value were those factors that were forced to one in the CFA.
Alpha Cronbach 0.941 0.851 0.869 0.910 0.840
Range of
Cronbach’s
alpha if one item
is removed
0.920-0.939 0.749-0.829 0.813-818 0.863-0.881 0.757-0.820

Marta Mas-Machuca and Frederic Marimon
16
Range of
correlations
between items
and total
corrected scale
0.770-0.854 0.680-0.768 0.748-0.752 0.809-0.832 0.619-0.759
Composite
Reliability 0.955 0.910 0.920 0.944 0.893
Average
Variance
Extracted
0.809 0.772 0.793 0.848 0.676
Table 2. Loads of the five CFAs and statistics for their reliability analyses.
How the Mission Internalization Works? An Empirical Research
17
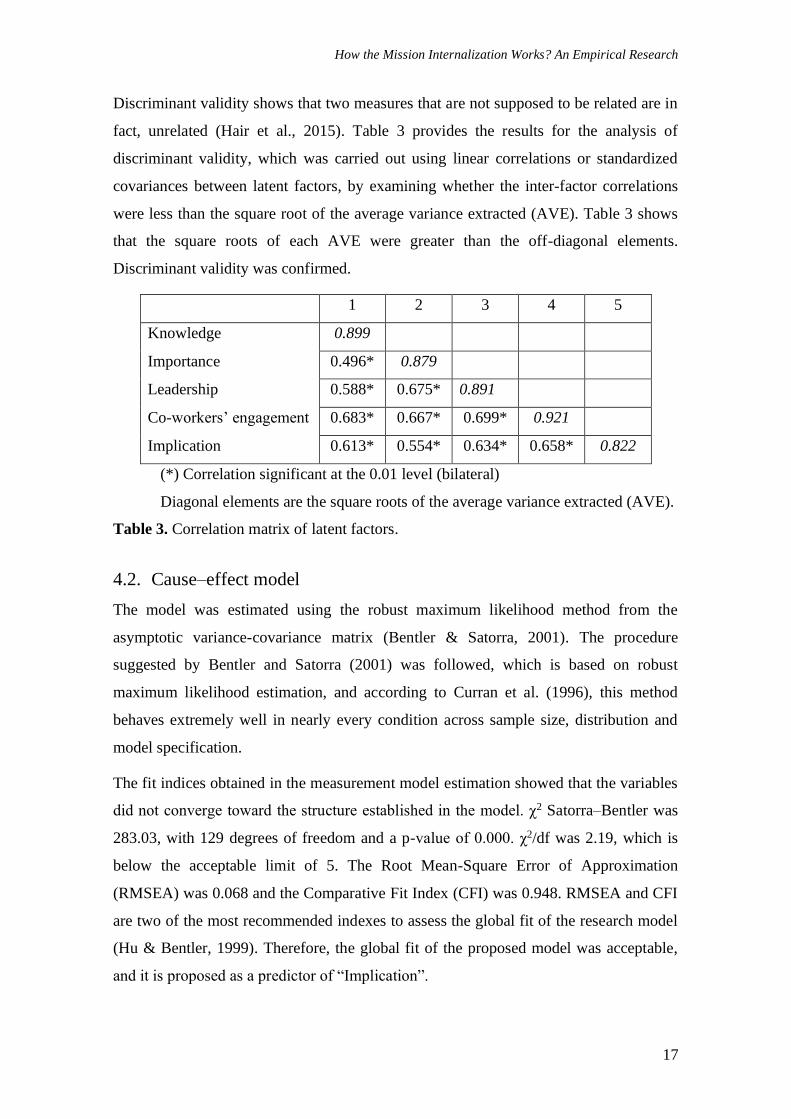
Discriminant validity shows that two measures that are not supposed to be related are in
fact, unrelated (Hair et al., 2015). Table 3 provides the results for the analysis of
discriminant validity, which was carried out using linear correlations or standardized
covariances between latent factors, by examining whether the inter-factor correlations
were less than the square root of the average variance extracted (AVE). Table 3 shows
that the square roots of each AVE were greater than the off-diagonal elements.
Discriminant validity was confirmed.
1 2 3 4 5
Knowledge 0.899
Importance 0.496* 0.879
Leadership 0.588* 0.675* 0.891
Co-workers’ engagement 0.683* 0.667* 0.699* 0.921
Implication 0.613* 0.554* 0.634* 0.658* 0.822
(*) Correlation significant at the 0.01 level (bilateral)
Diagonal elements are the square roots of the average variance extracted (AVE).
Table 3. Correlation matrix of latent factors.
4.2. Cause–effect model
The model was estimated using the robust maximum likelihood method from the
asymptotic variance-covariance matrix (Bentler & Satorra, 2001). The procedure
suggested by Bentler and Satorra (2001) was followed, which is based on robust
maximum likelihood estimation, and according to Curran et al. (1996), this method
behaves extremely well in nearly every condition across sample size, distribution and
model specification.
The fit indices obtained in the measurement model estimation showed that the variables
did not converge toward the structure established in the model. χ2 Satorra–Bentler was
283.03, with 129 degrees of freedom and a p-value of 0.000. χ2/df was 2.19, which is
below the acceptable limit of 5. The Root Mean-Square Error of Approximation
(RMSEA) was 0.068 and the Comparative Fit Index (CFI) was 0.948. RMSEA and CFI
are two of the most recommended indexes to assess the global fit of the research model
(Hu & Bentler, 1999). Therefore, the global fit of the proposed model was acceptable,
and it is proposed as a predictor of “Implication”.

Marta Mas-Machuca, Frederic Marimon
18
“Implications” was regressed on “Leadership”, resulting in an acceptable global fit
providing a total effect of 0.684 and an associated t-value of 4.54. In order to analyse the
composition of this total effect, the standardized solution of research model is provided
in Table 4.
Coefficient Standardized
solution
t-value Results
(a) Leadership Knowledge 0.625 8.45 Accepted
(b) Knowledge Importance 0.823 12.14 Accepted
(c) Importance Implication 0.375 5.97 Accepted
(d) Leadership Co-workers’ engagement 0.751 12.70 Accepted
(e) Co-workers’ engagement Implication 0.315 3.43 Accepted
(f) Leadership Implication 0.255 2.24 Accepted
Analysis of decomposition effects.
Indirect effect (a*b*c) 0.193 (28.18% of total effect)
Indirect effect (d*e) 0.237 (34.56% of total effect)
Total indirect effects (a*b*c) + (b*d) 0.429 (62.74% of total effect)
Direct effect (f) 0.255 (37.26% of total effect)
Total effect 0.684 (t-value = 4.54)
1.- Note that each letter (from “a” to “f”) before each coefficients corresponds to the
original hypothesis in the research model.
Table 4. Standardized coefficients of the research model Direct and indirect effects of
“Leadership” on “Implication”
Table 4 shows the direct effects between the model constructs with the letters from “a”
to “f”. Hence, each letter corresponds to one hypothesis of the research model. The second
section of the table provides the indirect effects according to the model. The calculations
are shown in each line of this second section table. Results indicated that the direct and
positive effect of “Leadership” on “Implication” is 0.255 (37.26% of the total effect).
This means that commitment by the top management to the mission statement influences
the likelihood that employees will work on the mission statement process. However, there
is an important indirect effect originating in two mediated paths. First, the understanding
of the mission (“Knowledge”) and the estimation of how important it is to have the right
mission for the company (“Importance”) have an indirect effect. This indirect effect has

How the Mission Internalization Works? An Empirical Research
19
a significant impact on “Implication”, at 0.193 (23.18% of the total effect). Second, the
other mediation is the relevance of the engagement and commitment of the co-workers
towards the fulfilment of the mission (“Co-workers’ engagement”). This second
mediation has an impact on “Implication” of 0.237 (34.56% of the total effect). Therefore,
the total of the indirect effects is 0.429 (62.74% of the total effect). To sum up, there is a
direct effect and a double mediation from “Leadership” to “Implications” that explains
the steps that must be followed for the mission to be created and internalized by
employees.
5. Discussion and theoretical and managerial implications
The paper provides clues and evidence for explaining the sequence of attaining the
different dimensions of the internalization of a company’s mission. While Marimon et al.
(2016) propose the components of the mission internalization construct, we analyse the
precedents to the accomplishment of these dimensions. There are some paths that can be
performed and achieved simultaneously, but there are other dimensions that have a pre-
established sequence, and this order must be respected (Macedo et al., 2016; Williams et
al., 2014). Respecting this tempus is of paramount importance when managers are
defining the mission and the implementation process.
This relationship from “Leadership” to “Implication” is directly (37.26% of the total
effect) and indirect (62.74% of the total effect). First, regarding the direct effect, the
findings suggest that the managers’ commitment and leadership have a positive influence
on the deployment and management of the mission within the company, as suggested by
Ireland and Hitt (1992) and Williams et al. (2014). Therefore, top-level managers must
accept responsibility for articulating a mission in ways that are meaningful for each
stakeholder group. If the leadership is oriented in line with mission statement, this has a
significant influence on the participation by the employees in the process of defining and
managing the mission within the company. The supervisors’ role and whether they orient
their daily decisions in a manner that is coherent with the mission is a key point in
engaging the employees to live the mission of the company. If the managers encourage
the development of the mission, the employees will participate more and better. These
results are consistent with the assertion that leadership is a critical success factor in other
fields such as Balanced Scorecard (Heras-Saizarbitoria, Marimon, & Casadesús, 2012;
Kaplan & Norton, 1992) or Knowledge Management (Hung, Huang, Lin, & Tsai, 2005;
Jennex, Smolnik, & Croasdell, 2007; Machuca & Costa, 2012).

Marta Mas-Machuca, Frederic Marimon
20
Second, understanding these indirect effects (higher than the direct effect) is a cornerstone
for academics and managers to know how to foster and reinforce this link. In this sense,
the findings suggest a double mediation to explain the relationship between leadership
and employees’ participation. The first mediation is through “Knowledge” and
“Importance”. It is also very important to consider the key role of understanding and
identifying the creation of the mission statement and its definition, as this is a critical
success factor in obtaining sustainable competitive advantage and a clear position in the
market. The first step is that employees can explain the main sense of the mission of the
company. The reality of many mission statements is that they are not known and
understood by several organizational members. However, it is not enough to know the
mission; employees must also understand its importance, and the assessment of the
importance is a consequence of the knowledge of the mission. On the path towards
employees becoming part of the mission, first comes knowing the mission, and after that,
consequently, they can assess its importance. Both steps must be taken and in this order.
If one of them is not accomplished, this way to participation is closed. This mediation is
a crucial point in whether the employees will create and think about the mission. So, it is
relevant that managers communicate the mission and its importance, as previous authors
have stated (Bart, 1997; David, 1989).
On the other hand, the second mediation is related to co-worker’s engagement. This
mediation has stronger weight than the other (34.54% of the total effect). Our results
suggest that it is relevant to create a general atmosphere in the company in which all the
employees work in the same direction, because this has an impact on the inclination of
employees to commit to the mission. One can identify that a powerful aspect in working
on the mission is to see that one’s colleagues think of it as a light that helps them to orient
their decisions and actions. The mission must impregnate the culture and values of the
company (Williams et al., 2014). The effectiveness of the mission depends on the
atmosphere within the company. In this way, when a new employee is recruited, he or
she will be inspired by the commitment of his or her colleagues. Therefore, we advise
that the degree to which the behaviour of the employees is consistent with the company’s
mission should be incorporated into climate surveys. With this information, managers
will know specifically the extent to which employees are engaged by the mission and can
propose actions to foster and align their commitment to it.
Understanding the path that follows the dimensions of the internalization of the mission
statement within a company is very relevant to propose an effective process. Managers
How the Mission Internalization Works? An Empirical Research
21
define a mission statement to achieve that employees feels that the mission is important
to fulfilling. To obtain that ideal situation, there are different paths but all of them related
to employees. Indeed, employees accept a company’s mission because they are aligned
with it and there is a pro-social motivation to work on it. According to Ireland and Hitt
(1992), a mission statement is intended to provide motivation, general direction or an
attitude through which actions are guided. The alignment between personal and
organizational mission is an effective aspect to be considered here. The consideration that
the mission of the company is important is related to the employees’ value scales.
To sum up, our findings suggest that, in order to obtain true agreement by the employee
to work on the mission, the commitment of the leadership is necessary. This impact is
mediated by the consideration of the understanding and the importance of the mission for
each employee, and also the influence of the co-worker’s engagement. All these factors
have an impact on the participation with the mission.
This area of research is particularly valuable for both academicians and managers. First,
our study could serve to reinforce the discussion on the mission statement’s definition
and communication. The process of the internalization of the mission from the top
management leader to the employee’s implication is a new source to strengthen. From a
theoretical view, there is a need to think about the firm’s mission and purpose. Canals
(2010, p. 203) states in his final thought that “The notion and purpose of the firm that we
have outlined here highlights the unique nature of companies as institutions made up of
people who seek economic efficiency, but also organizations led and developed by people
with motivations that go beyond pure financial aspirations. As important as profit is the
final outcome of a management process; board members and senior executives should
look at the process that leads that outcome”. In this sense, the proposed mediated effects
have solid theoretical backing and should be a first attempt to in exploring these
relationships. We offered empirical support to clarify the sequence of the dimensions of
the internalization of the mission. Form a theoretical perspective our results propose a
contribution to current knowledge.
Second, our research will contribute with some practical implications. The challenge
facing managers today is to have a thorough understanding of the process from the
definition of the mission to the true internalization of the mission statement, and to learn
what factors or conditions influence this. We hope that our article sheds light on this and

Marta Mas-Machuca, Frederic Marimon
22
contributes to the knowledge about the creation, internalization and implementation of
the mission within a company.
Our study is focused on the process of the definition, creation and internalization of the
mission by employees. Communicating the corporate mission is one thing, but achieving
a truly internalization of its meaning is another. Nevertheless, more research is needed to
try to assess the impact of this sequence on the performance of the company (economic
and non-economic). There are no conclusive arguments about the relationship between a
mission statement and performance (Baetz & Bart, 1996; Bart et al., 2001; Peyrefitte &
David, 2006). For this reason, future research is needed to assess this relationship.

How the Mission Internalization Works? An Empirical Research
23
Annex - Scale to assess internalization of the mission proposed by Marimon et al. (2016)
Dimension Code Item
1 Leadership
Lead 1 The managers’ behaviour is consistent with the company’s mission.
Lead 2 The managers are committed to the mission.
Lead 3 Through their example, the managers give visible signs of their
commitment to the mission.
Lead 4 The managers encourage the development of the mission.
Lead 5 The decisions made by the company are consistent with the mission.
2 Knowledge
Know 6 I am able to explain my company’s mission in my own words.
Know 7 I could explain my company’s mission to people outside the
organization if I were asked to.
Know 8 I understand my company’s mission.
3 Importance
Imp 9 I believe that the mission is important to society.
Imp 10 I accept my company’s mission because it is aligned with my individual
values.
Imp 11 I think that the company’s mission is important to me.
4 Co-workers’
engagement
Co-w 12 The behaviour of my colleagues is consistent with the company’s
mission.
Co-w 13 My colleagues push the development of the mission.
Co-w 14 In general, people who work with me are committed to the mission.
5 Implication
Impl 15 I am in a working group at the company where we work on the mission.
Impl 16 I have participated in the process of defining and reviewing the mission.
Impl 17 During the year, I spend time reflecting on the company’s mission.
Impl 18 I participate in activities where I can give my own opinion about the
mission.
Marta Mas-Machuca, Frederic Marimon
24
REFERENCES
Alegre I., Berbegal-Mirabent J., Guerrero A., and Mas-Machuca M.. (2018). The real
mission of the mission statement: A systematic review of the literature. Journal of
Management & Organization, 1-18. doi:10.1017/jmo.2017.82
Babnik K., Breznik K., Dermol V. and Trunk Širca N.. (2014). The Mission Statement:
Organisational Culture Perspective. Industrial Management & Data Systems, 114(4), 12–
27.
Baetz, Mark C. and Bart C.K.. (1996). Developing Mission Statements Which Work.
Long Range Planning, 29(4), 536-533.
Bart C.K.. (1997). Sex, Lies, and Mission Statements. Business Horizons, 40(6), 9 -18.
Bart C.K. and Tabone J.C.. (1999). Mission Statement Content and Hospital Performance
in the Canadian Not-for-Profit Health Care Sector. Health care management review,
24(3), 18–29.
Bart C.K.. (2007). A Comparative Analysis of Mission Statement Content in Secular and
Faith-Based Hospitals. Journal of Intellectual Capital, 8(4), 682–94.
Bart C.K., Bontis N. and Taggar S.. (2001). Exploring the Application of Mission
Statements on the World Wide Web. Internet Research Management, 11(4), 360-369.
Bart C.K., Bontis N., Taggar S., Sufi T. and Lyons H.. (2001). Management Decision A
Model of the Impact of Mission Statements on Firm Performance. Management Decision,
39(1), 19-35.
Bart C.K. and Baetz M.. (1998). The Relationship Between Mission Statements and Firm
Performance: An Exploratory Study. Journal of Management Studies, 35(6):823–53.
Bartkus B., Glassman M. and McAfee R.B.. (2000). Mission Statements: Are They
Smoke and Mirrors? Business Horizons, 43(6), 23–28.
Bates D.L. and Dillard E.. (1991). Desired Future Position A Practical Tool for Planning.
Long Range Planning, 24(3), 90–99.
Bentler P., and Satorra A.. (2001). A Scaled Difference Chi-square Test Statistic for
Moment Structure Analysis. Psychometrika, 66(4), 507–514.
https://cloudfront.escholarship.org/dist/prd/content/qt3141h70c/qt3141h70c.pdf
Campbell A.. (1989). Does your organisation need a mission? Leadership &
Organization Development Journal, (10)3, 3-9.
Campbell A. and Yeung S.. (1991). Creating a Sense of Mission. Long range planning,
24(4), 10–20.

How the Mission Internalization Works? An Empirical Research
25
Canals J.. (2010). Rethinking the firm's mission and purpose. European Management
Review, 7(4), 195-204.
Cardona P. and Rey C.. (2008). Mission-driven leadership. Management by Missions.
Collins J.C. and Porras J.I.. (1996). Building Your Company’s Vision. Harvard Business
Review, 74(5), 65.
Curran P.J., West S.G. and Finch J.F.. (1996). The robustness of test statistics to
nonnormality and specification error in confirmatory factor analysis. Psychological
methods, 1(1), 16-29.
David F. (1989). How Companies Define Their Mission. Long Range Planning, 22(1),
90–97.
Davis J., Ruhe J., Lee M. and Rajadhyaksha U.. ( 2007). Mission Possible: Do School
Mission Statements Work? Journal of Business Ethics, 70(1), 99–110.
Denison D.R. and Mishra A.. (1995). Toward a Theory of Organizational Culture and
Effectiveness. Organization Science, 6(2), 204–23.
Denton D.K.. (2001). Mission statements miss the point. Leadership & Organization
Development Journal, 22(7), 309-314.
Desmidt, S.. (2016). The relevance of mission statements: analysing the antecedents of
perceived message quality and its relationship to employee mission engagement. Public
Management Review, 18(6), 894-917.
Desmidt S., Prinzie A. and Decramer A.. (2011). Looking for the Value of Mission
Statememts: A Meta-Analysis of 20 Years of Research. Management Decision, 49(3),
468–83.
Duygulu E., Ozeren E., Işıldar P. & Appolloni A.. (2016). The sustainable strategy for
small and medium sized enterprises: The relationship between mission statements and
performance. Sustainability, 8(7), 698.
Gibson C.K., Newton D.J. and Cochran D.S.. (1999). An Empirical Investigation of the
Nature of Hospital Mission Statements. Health Care management review, 15(3), 35–46.
Hair Jr J.F., Wolfinbarger M., Money A.H., Samouel P. and Page M.J.. (2015). Essentials
of business research methods. Routledge.
Heras-Saizarbitoria I., Marimon F. and Casadesús M.. (2012). An Empirical Study of the
Relationships within the Categories of the EFQM Model. Total Quality Management &
Business Excellence, 23(5-6), 523–40.
Hirota, S., Kubo K., Miyajima H., Hong P. and Won Park Y.. (2010). Corporate Mission,
Corporate Policies and Business Outcomes: Evidence from Japan. Management Decision,
48(7), 1134-1153.

Marta Mas-Machuca, Frederic Marimon
26
Hu L. and Bentler P.M.. (1999). Cutoff criteria for fit indexes in covariance structure
analysis: Conventional criteria versus new alternatives. Structural Equation Modeling: A
Multidisciplinary Journal, 6(1), 1–55. https://doi.org/10.1080/10705519909540118
Yu-Chung H., Shi-Ming Huang, Quo-Pin Lin, and Mei-Ling -Tsai. (2005). Critical
Factors in Adopting a Knowledge Management System for the Pharmaceutical Industry.
Industrial Management & Data Systems, 105(2), 164–83.
Ireland R.D. and Hitt M.A.. (1992). Mission Statements: Importance, Challenge, and
Recommendations for Development. Business Horizons, May-June, 34–42.
Murray J., Smolnik S. and Croasdell D.T.. (2007). Knowledge Management Success
(Editorial Preface). International Journal of Knowledge Management, 3(2), i – iv.
Kaplan R.S. and Norton D.P.. (1992). The Balanced Scorecard - Measures That Drive
Performance. Harvard Business Review, January-Fe, 71–73.
Klemm M., Sanderson S. and Luffman G.. (1991). Mission Statements: Selling Corporate
Values to Employees. Long Range Planning, 24(3), 73–78.
Lundberg C.C.. (1984). Zero-in: A Technique for Formulating Better Mission Statements.
Business Horizons September, 30–33.
Macedo I.M., Pinho J.C.. and Silva A.M.. (2016). Revisiting the link between mission
statements and organizational performance in the non-profit sector: The mediating effect
of organizational commitment. European Management Journal, 34(1), 36-46.
Mas Machuca M. and Martínez Costa C.. (2012). A Study of Knowledge Culture in the
Consulting Industry. Industrial Management & Data Systems, 112(1), 24–41.
Marimon F., Mas Machuca M. and Rey C.. (2016). Assessing the Internalization of the
Mission. Industrial Management & Data Systems, 116(1), 170–87.
http://www.emeraldinsight.com/doi/10.1108/IMDS-04-2015-0144.
Mullane J.V.. (2002). The Mission Statement Is a Strategic Tool: When Used Properly.
Management Decision ,40(5), 448–55.
Nunnally J.C. and Bernstein I.H.. (1994). Psychometric Theory, 3rd edn, McGraw-Hill,
New York NY.
Paarlberg L.E. and Lavigna B.. (2010). Transformational leadership and public service
motivation: Driving individual and organizational performance. Public administration
review, 70(5), 710-718.
Peyrefitte J. & David F.R.. (2006). A Content Analysis of Mission Statement of United
States Firms in Four Industries. International Journal of Management, 23(2), 296–302.
Quinn R.E. and Thakor A.V.. (2018). Creating a purpose-driven organization. Harvard
Business Review, 96(4), 78-85.

How the Mission Internalization Works? An Empirical Research
27
Rey C. and Bastons M.. (2018). Three dimensions of effective mission implementation.
Long Range Planning, 51(4), 580-585.
Suh T., Houston M.B., Barney S.M. and Kwon I.W.G.. (2011). The impact of mission
fulfilment on the internal audience: psychological job outcomes in a services setting.
Journal of Service research, 14(1), 76-92.
Vandijck D., Desmidt S. and Buelens M.. (2007). Relevance of mission statements in
Flemish not‐for‐profit healthcare organizations. Journal of Nursing Management, 15(2),
131-141.
Wang Y.. (2011). Mission-Driven Organizations in Japan: Management Philosophy and
Individual Outcomes. Journal of Business Ethics, 101(1), 111-126.
Weiss J.A. and Piderit S.K.. (1999). The Value of Mission Statements in Public Agencies.
Journal of Public Administration Research & Theory, 9, 193.
Williams R.I., Morrell D.L. and Mullane J.V.. (2014). Reinvigorating the Mission
Statement through Top Management Commitment. Management Decision, 52(3), 446-
459.
Wang Y. and Jian L.. (2011). Empirical Research on Influence of Mission Statements on
the Performance of Nonprofit Organization. Procedia Environmental Sciences, 11, 328–
33.

EAMR
EUROPEAN ACCOUNTING AND MANAGEMENT REVIEW
VOLUME 7, ISSUE 1, ARTICLE 2, 28-46, NOVEMBER 2020
Women with STEM qualifications on supervisory boards.
Does a high women quota in supervisory boards influence
firm success?
Bettina Binder
Hochschule Pforzheim
Received October 31, 2019; accepted December 5, 2019.
ABSTRACT
Many large companies in Europe include mainly men in supervisory boards and the
women quota is often lower than 20 %. In Germany an optional women quota of 30 % in
supervisory boards was proposed for capital market oriented companies in 2016. Some
assume that without a gender quota the earnings of enterprises would shrink as male and
female members in supervisory teams do not work in such a harmonized and structured
way. Others think that a women quota in supervisory boards should be requested by law
and should not remain optional. In this context, conducting research and analyzing the
impact of the women’s presence in supervisory boards on the success of companies
appear as a necessary topic. The present article looks at the companies of EURO STOXX
50 in the year 2015 and their success and tries to establish whether this success can be
related to the percentage of female members in supervisory positions. It replicates in this
way the study of Binder, Alonso-Almeida and Bremser (2016) which analyzed the
relationship between female’s representation in the management board (executive board)
and firm performance (measured by earnings before taxes - EBT) of the EURO STOXX
50 companies in 2014. It is in the same time an extension of the original study as the
supervisory board is brought under scrutiny and a closer look at women qualifications,
and especially women with STEM qualifications is provided.
KEYWORDS
EURO STOXX 50, STEM qualifications, Key performance indicators, Firm
performance.

Women with STEM qualifications on supervisory boards. Does a high women quota in supervisory
boards influence firm success?
29
1. Introduction
Many large companies in Europe include mainly men in supervisory boards and the
women quota is often lower than 20 %. In Germany an optional women quota of 30 % in
supervisory boards was proposed for capital market oriented companies in 2016. The
present article looks at the companies of EURO STOXX 50 in the year 2015 and their
success and tries to establish whether this success can be related to the percentage of
female members in supervisory positions. It replicates in this way the study of Binder et
al. (2016) which analyzed the relationship between female’s representation in the
management board (executive board) and firm performance (measured by earnings before
taxes - EBT) of the EURO STOXX 50 companies in 2014. It is in the same time an
extension of the original study as the supervisory board is brought under scrutiny and more
details about the number of women in supervisory boards, the STEM qualifications of
women (STEM stands for science, technology, engineering, and mathematics), the women
quotas and the reasons behind are examined.
This article contributes to the literature in the field of Key Performance Indicators (KPIs)
as success factors e.g. the EBT. It offers an insight into the relationship between the
economic success of 50 European companies and the gender balance on supervisory
boards. A special focus lies on women with STEM qualifications in supervisory boards
to show if this situation is satisfying or whether it can be improved. For this purpose the
article builds upon existing literature in the field of KPIs, diversity management,
supervisory boards, and women quota, etc. The paper is structured as follows: the next
section presents the literature review and introduces the hypothesis. Section three contains
the research methodology. In section four the findings are discussed. Finally, section five
develops insights for investors and owners and shows the limitations of the study and
offers suggestions for future lines of research.
2. Literature Review
A controversial issue during the past decades was women’s presence in supervisory
boards. The underrepresentation of women in decision-making position is a known
problem in the business world and if an implementation of ethical principles might be
difficult, “by passing the legal regulations it is possible to set the rules of behaviour”
(Grbac and Lončarić, 2009: 145), in this case by imposing a gender quota for corporate

Bettina Binder
30
boards. This paper argues that images such as the “white, heterosexual, western,
middle/upper class, able man” (Zanoni et al., 2010: 13) ought to be challenged in
international business and it considers that companies which avoid appointing women in
top position are “unaware of new sources of value, and consequently, are sub-optimizing
both the economic value of the firm and value to society” (Mohammed, 2014: 243).
Nevertheless, women are still the exception in German supervisory boards, even though
their representation increased gradually (Holst and Kirsch, 2014). In Northern Europe
more women are present in supervisory boards (e.g. Norway, Iceland, Latvia, Finland and
Sweden to mention the top 5 countries with the highest women quota). It depends on the
examined countries if a study can find a significant link between firm performance and the
women quota in supervisory boards. On the one hand, it was shown e.g. for Denmark that
a higher women quota in supervisory boards can determine a better company performance
(Lückerath-Rovers, 2011) but on the other hand, this finding could not be verified for the
same country by other studies (Rose, 2007).
Beaufort and Summers (2013) identified at European level a 1.5% change of women
representation in mainly male supervisory boards between 2009 and 2013. If women were
already member in a supervisory board, the women quota was likely to increase further.
When one woman was a board member, the women quota stood at 3.2%; by already 3
women in the supervisory board, the women quota increased to 3.7%. According to the
above study the average women quota in supervisory boards in Europe in 2013 was 7.9%.
France stood out as a positive example with a women quota of 28.1% in 2013.
Another study on women in European listed companies suggests positive effects of diverse
boards on corporate governance and even on firm performance (Buchwald and Hottenrott,
2014). A similar result was registered by a Catalyst study which examines the relationship
between women on corporate boards and their companies’ financial performance in the
United States (Catalyst, 2007). The study “Women matter. Gender diversity, a corporate
performance driver” shows that companies with a higher proportion of women in top
management perform better (McKinsey, 2007). Other authors signal rather the lack of
evidence that female representation in supervisory boards improves profitability (Ferreira,
2014). It is suggested that rather benefits for the society should be measured when women
occupy supervisory board positions. In a study with 108 German large corporations which

Women with STEM qualifications on supervisory boards. Does a high women quota in supervisory
boards influence firm success?
31
took place between 2009 and 2013, there was not enough evidence to indicate a significant
relationship between gender diversity and firms’ financial performance (Dick, 2015).
There are however, institutional factors driving gender quotas in supervisory boards such
as e.g. welfare provision for state-owned enterprises, political coalitions and a legacy of
initiatives (Terjesen et al., 2015). It is more likely to establish a high gender quota in
supervisory board with left-leaning governments. In a survey of 201 Norwegian firms the
positive effect of the women quota in supervisory boards is seen in increased board
development activities and in a decreased level of conflict (Nielsen, 2010). Another
exhaustive study, in which 2.360 companies from the Morgan Stanley Capital
International All Country World Index (MSCI ACWI) were observed over a period of 6
years by the Credit Suisse Research Institute (2012) shows as a result a better mix of
leadership skills, a wider pool of talent and a better risk aversion, the higher the women
quota in supervisory boards in the companies is (Kersley and O’Sullivan, 2012). Many
studies (e.g. Bilimoria, 2006, Terjesen et al., 2009) suggest also a positive relationship
between female supervisory board members and the number of women officers in
management.
What needs to be acknowledged is the fact that gender balance became a priority and
diversifying corporate supervisory boards often represent a target to be achieved. Small
improvements can be seen with a law instituted quota for women in supervisory boards
(Corkery and Taylor, 2012). In Norway, Italy, France, Spain and starting with 2016 also
in Germany binding gender quota exist (Sullivan, 2015). Norway was the first country to
legislate board quotas in 2004 and many countries followed with law determined or
optional women quotas in supervisory boards, however, less than 10 % of the board
members consist of women (Dizik, 2015). Moreover, men in supervisory boards have
often better networks and for this reason the male supervisory board managers often recruit
male followers which minimizes the women quota in supervisory boards on the long run
(Terjesen et al., 2015). Rosa et al., (1996) analysed the impact of gender on small business
performance in the United Kingdom (UK) and concluded that there are “some
considerable differences by sex in quantitative economic and financial performance
measures” (p. 476). Kalleberg and Leicht (1991) examined organizational performance in
terms of survival and success and according to the results of their study, companies that

Bettina Binder
32
have a high women quota in supervisory boards are not more likely to go bankrupt than
those with a high male quota, because both men and women are equally successful with
regard to earnings growth.
Another study with reversed causality shows that in over 3,876 public companies the
presence of independent female directors is necessary in supervisory boards to contribute
best to the firms’ performance (Terjesen et al., 2015). This means that, when no women
are included as supervisory board members, the companies’ results are lower (measured
by Tobin’s Q and shown by the Return on assets ROA). Finally, another study with
reversed causality about 151 of the capital market listed German firms shows that only
after a critical mass of about 30% (e.g. 3 women in absolute positions) is attained, then a
higher firm performance can be reached (Joecks et al., 2012).
The present research focuses on the companies of the EURO STOXX 50 index, and aims
at exploring whether there is a link between the EBT of these successful European
companies and the number of women in supervisory boards. Britzelmaier et al., (2013)
focused on the same index while examining the remuneration of management in 2009,
during the financial crisis. It has to be noted that the relationship between the EBT and the
women quota in management boards was analysed thoroughly by Binder et al., (2016),
however, the focus of this article lies on the supervisory board and especially on the link
between firms’ performance measured by EBT and the proportion of women on the
supervisory boards with a STEM-educational background. The following hypothesis is
formulated and will be tackled in the following sections:
H1: Enterprises which have a higher gender quota in supervisory boards are
more successful and achieve a higher EBT.
3. Methodology
The EURO STOXX 50 Index was selected to represent the performance of the 50 largest
companies among 19 supersectors in the year 2015. There are enterprises of seven
Eurozone countries which are integrated in this index. This index has a fixed number of
components and is part of the STOXX blue-chip index family. The current study looks at
the number of women in supervisory boards and lists their names as presented in the 2015
annual reports (see table 1). The data regarding the EBT of each of the fifty companies

Women with STEM qualifications on supervisory boards. Does a high women quota in supervisory
boards influence firm success?
33
was collected via financial websites. It should be taken into account that women in
supervisory boards listed below are sometimes member in more than just one supervisory
board.
Source: own representation based on the information from:
https://www.stoxx.com/index-details?symbol=SX5E, retrival date: 03/03/2017.
Table 1. Overview of the 50 EURO STOXX companies in 2015, of their women qouta
and STEAM women quota
EURO STOXX 50 index is one of the most liquid indices for the Eurozone and serves for
benchmarking purposes. The index is a financial control index which ensures stable and
up-to-date figures. It represents the performance of only the largest and most liquid
companies in a sector (STOXX Limited, 2016).

Bettina Binder
34
The present research focuses on the interrelationship between company success and
women on supervisory boards on basis of the EURO STOXX 50 index. Therefore, the
aforementioned hypothesis will be tackled in the following sections. The interrelationship
between company success and women on supervisory boards is modeled in a univariate
single-equation model. Women on supervisory boards represent the independent variable,
company success represents the dependent variable. The independent variable is defined
as the numerical ratio of the number of women in supervisory board compared to the
number of total supervisory board members. The hypothesis is tested using the numerical
dependent variable EBT, as a measure for companies’ success.
The composition of EURO STOXX index in 2015 changed slightly in comparison to the
year before. Two new companies were included in the EURO STOXX index: Fresenius
(Germany) and Safran (France) replaced Repsol (Spain) and REWE (Germany), a change
which became effective on September 2015 (STOXX Limited, 2015). The composition
change of the index takes place once a year, in September, when only the biggest
companies are maintained on the basis of their market capitalization and their price index.
Out of the 50 EURO STOXX companies four have e.g. the highest index weights: Total
(France) with 4.78%, Sanofi-Aventis (France) with 4.39 %, Bayer (Germany) with 4.29
%, and Anheuser-Busch InBev (Belgium) with 4.11 %. In order to examine how
successful these companies are, the EBT was chosen as being a relevant KPI, taking thus
into consideration the fact that companies may face different tax rates in different states.
In other words, the lack of a harmonized taxation system across the Eurozone will not
affect the results of this study, the EBT making possible a comparison of the 50 EURO
STOXX companies at European level (see table 2).
Women with STEM qualifications on supervisory boards. Does a high women quota in supervisory
boards influence firm success?
35
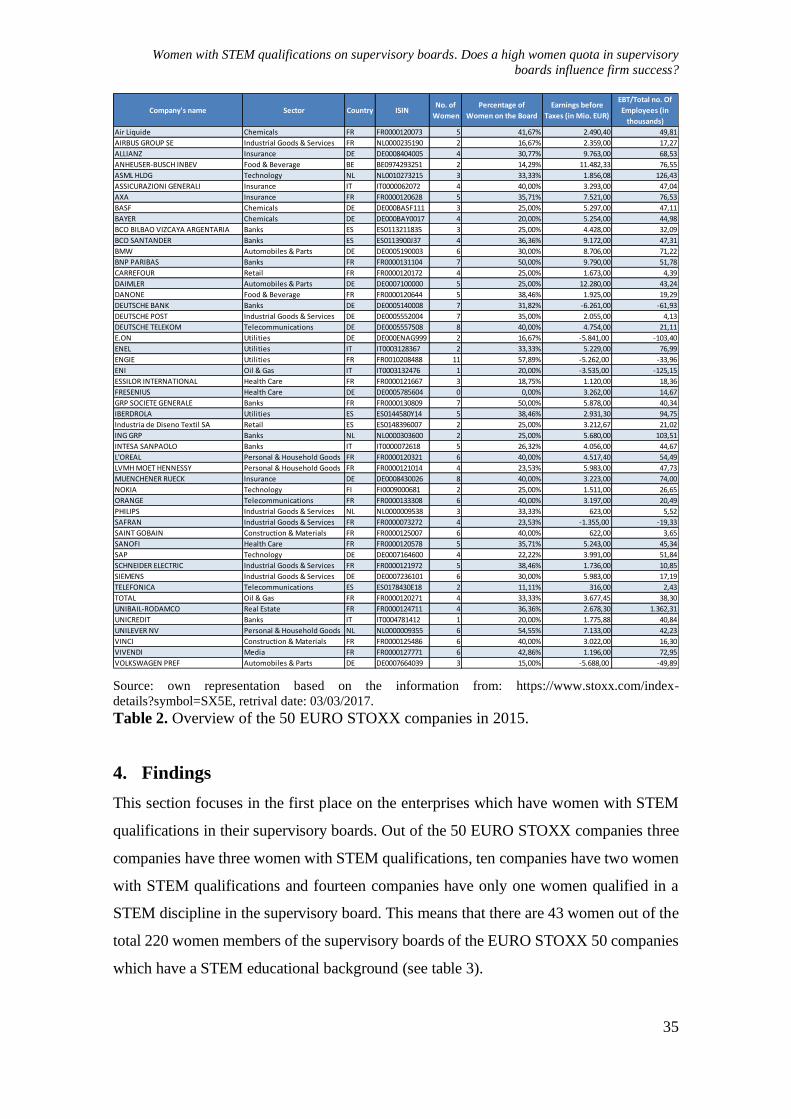
Source: own representation based on the information from: https://www.stoxx.com/index-
details?symbol=SX5E, retrival date: 03/03/2017.
Table 2. Overview of the 50 EURO STOXX companies in 2015.
4. Findings
This section focuses in the first place on the enterprises which have women with STEM
qualifications in their supervisory boards. Out of the 50 EURO STOXX companies three
companies have three women with STEM qualifications, ten companies have two women
with STEM qualifications and fourteen companies have only one women qualified in a
STEM discipline in the supervisory board. This means that there are 43 women out of the
total 220 women members of the supervisory boards of the EURO STOXX 50 companies
which have a STEM educational background (see table 3).
Company's name Sector Country ISINNo. of
Women
Percentage of
Women on the Board
Earnings before
Taxes (in Mio. EUR)
EBT/Total no. Of
Employees (in
thousands)
Air Liquide Chemicals FR FR0000120073 5 41,67% 2.490,40 49,81
AIRBUS GROUP SE Industrial Goods & Services FR NL0000235190 2 16,67% 2.359,00 17,27
ALLIANZ Insurance DE DE0008404005 4 30,77% 9.763,00 68,53
ANHEUSER-BUSCH INBEV Food & Beverage BE BE0974293251 2 14,29% 11.482,33 76,55
ASML HLDG Technology NL NL0010273215 3 33,33% 1.856,08 126,43
ASSICURAZIONI GENERALI Insurance IT IT0000062072 4 40,00% 3.293,00 47,04
AXA Insurance FR FR0000120628 5 35,71% 7.521,00 76,53
BASF Chemicals DE DE000BASF111 3 25,00% 5.297,00 47,11
BAYER Chemicals DE DE000BAY0017 4 20,00% 5.254,00 44,98
BCO BILBAO VIZCAYA ARGENTARIA Banks ES ES0113211835 3 25,00% 4.428,00 32,09
BCO SANTANDER Banks ES ES0113900J37 4 36,36% 9.172,00 47,31
BMW Automobiles & Parts DE DE0005190003 6 30,00% 8.706,00 71,22
BNP PARIBAS Banks FR FR0000131104 7 50,00% 9.790,00 51,78
CARREFOUR Retail FR FR0000120172 4 25,00% 1.673,00 4,39
DAIMLER Automobiles & Parts DE DE0007100000 5 25,00% 12.280,00 43,24
DANONE Food & Beverage FR FR0000120644 5 38,46% 1.925,00 19,29
DEUTSCHE BANK Banks DE DE0005140008 7 31,82% -6.261,00 -61,93
DEUTSCHE POST Industrial Goods & Services DE DE0005552004 7 35,00% 2.055,00 4,13
DEUTSCHE TELEKOM Telecommunications DE DE0005557508 8 40,00% 4.754,00 21,11
E.ON Utilities DE DE000ENAG999 2 16,67% -5.841,00 -103,40
ENEL Utilities IT IT0003128367 2 33,33% 5.229,00 76,99
ENGIE Utilities FR FR0010208488 11 57,89% -5.262,00 -33,96
ENI Oil & Gas IT IT0003132476 1 20,00% -3.535,00 -125,15
ESSILOR INTERNATIONAL Health Care FR FR0000121667 3 18,75% 1.120,00 18,36
FRESENIUS Health Care DE DE0005785604 0 0,00% 3.262,00 14,67
GRP SOCIETE GENERALE Banks FR FR0000130809 7 50,00% 5.878,00 40,34
IBERDROLA Utilities ES ES0144580Y14 5 38,46% 2.931,30 94,75
Industria de Diseno Textil SA Retail ES ES0148396007 2 25,00% 3.212,67 21,02
ING GRP Banks NL NL0000303600 2 25,00% 5.680,00 103,51
INTESA SANPAOLO Banks IT IT0000072618 5 26,32% 4.056,00 44,67
L'OREAL Personal & Household Goods FR FR0000120321 6 40,00% 4.517,40 54,49
LVMH MOET HENNESSY Personal & Household Goods FR FR0000121014 4 23,53% 5.983,00 47,73
MUENCHENER RUECK Insurance DE DE0008430026 8 40,00% 3.223,00 74,00
NOKIA Technology FI FI0009000681 2 25,00% 1.511,00 26,65
ORANGE Telecommunications FR FR0000133308 6 40,00% 3.197,00 20,49
PHILIPS Industrial Goods & Services NL NL0000009538 3 33,33% 623,00 5,52
SAFRAN Industrial Goods & Services FR FR0000073272 4 23,53% -1.355,00 -19,33
SAINT GOBAIN Construction & Materials FR FR0000125007 6 40,00% 622,00 3,65
SANOFI Health Care FR FR0000120578 5 35,71% 5.243,00 45,34
SAP Technology DE DE0007164600 4 22,22% 3.991,00 51,84
SCHNEIDER ELECTRIC Industrial Goods & Services FR FR0000121972 5 38,46% 1.736,00 10,85
SIEMENS Industrial Goods & Services DE DE0007236101 6 30,00% 5.983,00 17,19
TELEFONICA Telecommunications ES ES0178430E18 2 11,11% 316,00 2,43
TOTAL Oil & Gas FR FR0000120271 4 33,33% 3.677,45 38,30
UNIBAIL-RODAMCO Real Estate FR FR0000124711 4 36,36% 2.678,30 1.362,31
UNICREDIT Banks IT IT0004781412 1 20,00% 1.775,88 40,84
UNILEVER NV Personal & Household Goods NL NL0000009355 6 54,55% 7.133,00 42,23
VINCI Construction & Materials FR FR0000125486 6 40,00% 3.022,00 16,30
VIVENDI Media FR FR0000127771 6 42,86% 1.196,00 72,95
VOLKSWAGEN PREF Automobiles & Parts DE DE0007664039 3 15,00% -5.688,00 -49,89

Bettina Binder
36
In the following we provide a closer view on the companies having the highest women on
their supervisory board and their qualifications and positions on board.
The French company Engie has the highest women quota of all companies included in
EURO STOXX 50 index: 57,9%. The STEM quota of women in supervisory board is,
however, 10,5% (see table 1), which means again that only two women of the eleven have
a STEM background. These are Isabelle Kocher and Marie-Noelle Jégo-Laveissière, both
engineers graduating from Corps des Mines, a highly esteemed institution in France.
Isabelle Kocher is not just a member of the supervisory board, she is also the CEO of the
company. The other nine women on supervisory board have different backgrounds, e.g.
Ann-Kristin Achleitner graduated in economics and law. Françoise Malrieu has the chair
of nomination and compensation committee, Marie-José Nadeau is member of the audit
committee and Barbara Kux is member of the ethics, environment and sustainable
development committee. Elected directors are Stéphane Pallez and Caroline Simon. Lucie
Muniesa represents as director the French state, Catherine Gouillouard is director member
of the strategy, investment and technology committee, and Anne-Marie Mourer is member
of the appointments and compensation committee.
Unilever NV from the Netherlands has the second highest women quota (54,6%) of all 50
EURO STOXX companies. Six women are part of the supervisory board and three women
work as executive directors. Yet, none of them have a STEM qualification. We had a look
at the qualification the female supervisory members have in case of Unilever, and we
found out for instance that Laura Cha has a law degree, Ann Fudge and Judith Hartmann
hold a MBA, Louise Fresco has a degree in agriculture, Mary Ma has a bachelor of arts,
while Hixonia Nyasulu has a bachelor of arts in psychology.
On third place in terms of women quota (with 40%) are two German companies: Deutsche
Telekom and Muenchener Rueck. Again we saw that out all of the women serving as
supervisory board members in these two companies, only a few have a STEM
qualification. These are Sylvia Hauke, who is a skilled data processing officer, and Ines
Kolmsee, who is an industrial engineer, both working for Deutsche Telekom, and Ursula
Gather (working for Muenchener Rueck) with a degree in mathematics, which can be
identified as a typical profession in the insurance branch.
If one looks at the companies with the most women with STEM qualifications in the
supervisory board, the French company Sanofi leads with a STEM women quota of 21,4%,

Women with STEM qualifications on supervisory boards. Does a high women quota in supervisory
boards influence firm success?
37
n % Companies
< 0 Mio. EUR 6 12 SAFRAN, ENI, ENGIE, VOLKSWAGEN PREF, E.ON, DEUTSCHE
BANK
0-2.999 Mio. EUR 16 32 IBERDROLA, UNIBAIL-RODAMCO, AIR LIQUIDE, AIRBUS
GROUP SE, DEUTSCHE POST, DANONE, ASML HLDG,
UNICREDIT, SCHNEIDER ELECTRIC, CARREFOUR, NOKIA,
VIVENDI, ESSILOR INTERNATIONAL, PHILIPS, SAINT
GOBAIN, TELEFONICA
3.000-4.999 Mio. EUR 12 24 DEUTSCHE TELEKOM, L'OREAL, BCO BILBAO VIZCAYA
ARGENTARIA, INTESA SANPAOLO, SAP, TOTAL,
ASSICURAZIONI GENERALI, FRESENIUS, MUENCHENER
RUECK, INDITEX, ORANGE, VINCI
5.000-9.999 Mio. EUR 14 28 BNP PARIBAS, ALLIANZ, BCO SANTANDER, BMW, AXA,
UNILEVER NV, LVMH MOET HENNESSY, SIEMENS, GRP
SOCIETE GENERALE, ING GRP, BASF, BAYER, SANOFI, ENEL
> 9.999 Mio. EUR 2 4 DAIMLER; ANHEUSER BUSCH-INBEV
Total 50 100
EBT
followed by the German company SAP with a STEM women quota of 16,5%, and the
Spanish Industria de Diseno with a STEM women quota of 12,5%.
What is should be mention here is that several women are members of different
supervisory boards in different companies, e.g. Isabelle Kocher. In the same time, 27
companies out of the 50 EURO STOXX companies have at least one women with a STEM
qualification, which is more than 50%.
To move further, from a statistical point of view the EURO STOXX 50 companies can
be placed into five categories concerning the EBT as dependent variable (see table 3).
Only Daimler (Germany) and Anheuser Busch-Inbev (Belgium) have achieved an EBT
that is higher than 9.999 Mio. EUR. Most companies (16) are in the class between 0-
2.999 Mio. EUR, from sectors such as ‘Telecommunications’, ‘Media’, ‘Real-Estate’,
‘Oil & Gas’, ‘Banks’ and ‘Industrial Goods and Services’.
Source: own representation based on the information from: https://www.stoxx.com/index-
details?symbol=SX5E, retrival date: 03/03/2017 Table 3. Five categories for the EBT of the 50 EURO STOXX companies in 2015.
The independent variable women quota and the number of women in supervisory boards
can also be categorized into five classes (see table 4).
Interesting is that only one company has more than 10 women on the supervisory board
considering that all EURO STOXX 50 companies have different numbers of employees
and also different number of members on the supervisory boards. The company Engie
(France) has 11 women out of the total 19 supervisory board members, which makes a
women quota of 57.89%. As it can be seen Unilever NV too can be mentioned as a

Bettina Binder
38
n % Companies n % Companies
0-20 % 10 20 BAYER, UNICREDIT, ENI, ESSILOR INTERNATIONAL, AIRBUS
GROUP SE, E.ON, VOLKSWAGEN PREF, ANHEUSER-BUSCH
INBEV, TELEFONICA, FRESENIUS
0-1 women 3 6 UNICREDIT, ENI, FRESENIUS
21-30 % 13 26 BMW, SIEMENS, INTESA SANPAOLO, DAIMLER, ING GRP,
BASF, BCO BILBAO VIZCAYA ARGENTARIA, INDITEX,
CARREFOUR, NOKIA, LVMH MOET HENNESSY, SAFRAN, SAP
2-4 women 24 48 ASSICURAZIONI GENERALI, BCO SANTANDER, UNIBAIL-
RODAMCO, TOTAL, ALLIANZ, CARREFOUR, LVMH MOET
HENNESSY, SAFRAN, SAP, BAYER, ASML HLDG, PHILIPS,
BASF, BCO BILBAO VIZCAYA ARGENTARIA, ESSILOR
INTERNATIONAL, VOLKSWAGEN PREF, ENEL, ING GRP,
INDITEX, NOKIA, AIRBUS GROUP SE, E.ON, ANHEUSER-
BUSCH INBEV, TELEFONICA
31-40 % 21 42 DEUTSCHE TELEKOM, L'OREAL, ASSICURAZIONI GENERALI,
MUENCHENER RUECK, ORANGE, VINCI, SAINT GOBAIN,
IBERDROLA, DANONE, SCHNEIDER ELECTRIC, BCO
SANTANDER, UNIBAIL-RODAMCO, AXA, SANOFI, DEUTSCHE
POST, ENEL, TOTAL, ASML HLDG, PHILIPS, DEUTSCHE
BANK, ALLIANZ
5-6 women 16 32 UNILEVER NV, VIVENDI, L'OREAL, ORANGE, VINCI, SAINT
GOBAIN, BMW, SIEMENS, AIR LIQUIDE, IBERDROLA,
DANONE, SCHNEIDER ELECTRIC, AXA, SANOFI, INTESA
SANPAOLO, DAIMLER
41-50 % 4 8 BNP PARIBAS, GRP SOCIETE GENERALE, VIVENDI, AIR
LIQUIDE
7-10 women 6 12 DEUTSCHE TELEKOM, MUENCHENER RUECK, BNP PARIBAS,
GRP SOCIETE GENERALE, DEUTSCHE POST, DEUTSCHE
BANK
51-60 % 2 4 ENGIE, UNILEVER NV > 10 women 1 2 ENGIE
Total 50 100 Total 50 100
Women quota Number of women
company with a high women quota of 54.55%. In absolute figures, this means 6 women
in a supervisory board which has 11 supervisory board members.
Most companies in EURO STOXX 50 index have 5 to 6 women on the supervisory board
causing a women quota of 32% in average for this category.
Source: own representation based on the information from: https://www.stoxx.com/index-
details?symbol=SX5E, retrival date: 03/03/2017
Table 4. Five categories for the women quota of the 50 EURO STOXX companies in
2015.
In order to test the raised hypothesis (H1: Enterprises which have a higher gender quota
in supervisory boards are more successful and achieve higher EBT), two steps are
necessary. In a first step, the EBT and the EBT / employee of the selected companies
should be examined. In a second step, the gender quota per sector and in total should be
analyzed for supervisory boards and the findings should be brought together.
Source: own representation – the EBTs of all the 50 companies were taken from http://www.finanzen.net/
- retrival date: 03/03/2017.
Figure 1. Top 10 EURO STOXX companies by EBT with figures of 2015 in million
EUR.

Women with STEM qualifications on supervisory boards. Does a high women quota in supervisory
boards influence firm success?
39
Figure 1 shows a top 10 ranking of the EURO STOXX companies according to their
achieved EBT in 2015. On the first place in 2015 was Daimler (Germany) with an EBT of
€12.3 million, also the highest value of all companies analysed in this study. Daimler has
overtaken Volkswagen (Germany), which was on the first place in 2014 with €10.8
million, but it suffered a serious draw back in 2015 due to the emissions scandal. Daimler
is followed in the 2015 EBT ranking by Anheuser-Busch InBev (Belgium) with €11.5
million and BNP Paribas (France) with € 9.8 million.
However, at Daimler only one woman with a STEM qualification is present on the
supervisory board. Among the top ten companies by EBT only BNP Paribas can be
mentioned as having two women with STEM positions in supervisory board. BNP Paribas
is not a typical company where one could expect engineers on the supervisory board.
Nevertheless, two women with STEM qualifications are members of the supervisory
board. A clear correlation in general between women in total in supervisory boards and
especially STEM qualified women and EBT or EBT/ employee cannot be identified.
Due to the fact that the countries Germany and France have the highest number of
companies in EURO STOXX 50 index and the highest EBT per company and per
employee these two countries are examined more closely.
France is the country with the highest number of companies (20) included in EURO
STOXX 50 index and it is an important country in terms of EBT. When the most
important companies are analysed BNP Paribas is the biggest company with an EBT of
€9.790 million, followed by the insurance company AXA with €7.521 million and LVMH
Moet Hennessy with €5.983 million. GRP Société Générale and Sanofi are also in top 5
of the French companies by EBT and it can be observed that especially the sectors ‘Banks’
and ‘Insurance’ have the highest EBT values (see figure 2).

Bettina Binder
40
Source: own representation – the EBTs of all the 50 companies were taken from http://www.finanzen.net/
- retrival date: 03/03/2017.
Figure 2. Top 5 EURO STOXX companies in France by EBT with figures of 2015 in
million EUR.
Looking to the five best companies by EBT in France, Sanofi has three women with STEM
qualifications, while BNP Paribas and GRP Societé Generale have each two women with
STEM qualifications on the supervisory board. This is an indication that more than 50 %
of the French best companies by EBT have two or three women with STEM qualifications
in their supervisory boards, which shows a slightly positive correlation.
The second most important country from EURO STOXX 50 index in the year 2015 is
Germany, which has 14 companies in this index. The highest EBT of all German
companies was achieved by Daimler with €12.280 million followed by Allianz (€9.763
million) and BMW (€8.706 million). Siemens and BASF are also in this top 5 by EBT.
Compared to France it can be seen that especially the automotive sector is represented
twice in this range of companies with the highest EBT. The ‘Insurance’ sector seems to
be strong in both France and Germany as in both countries, companies such as Axa and
Allianz are in top 5 by EBT (see figure 3).
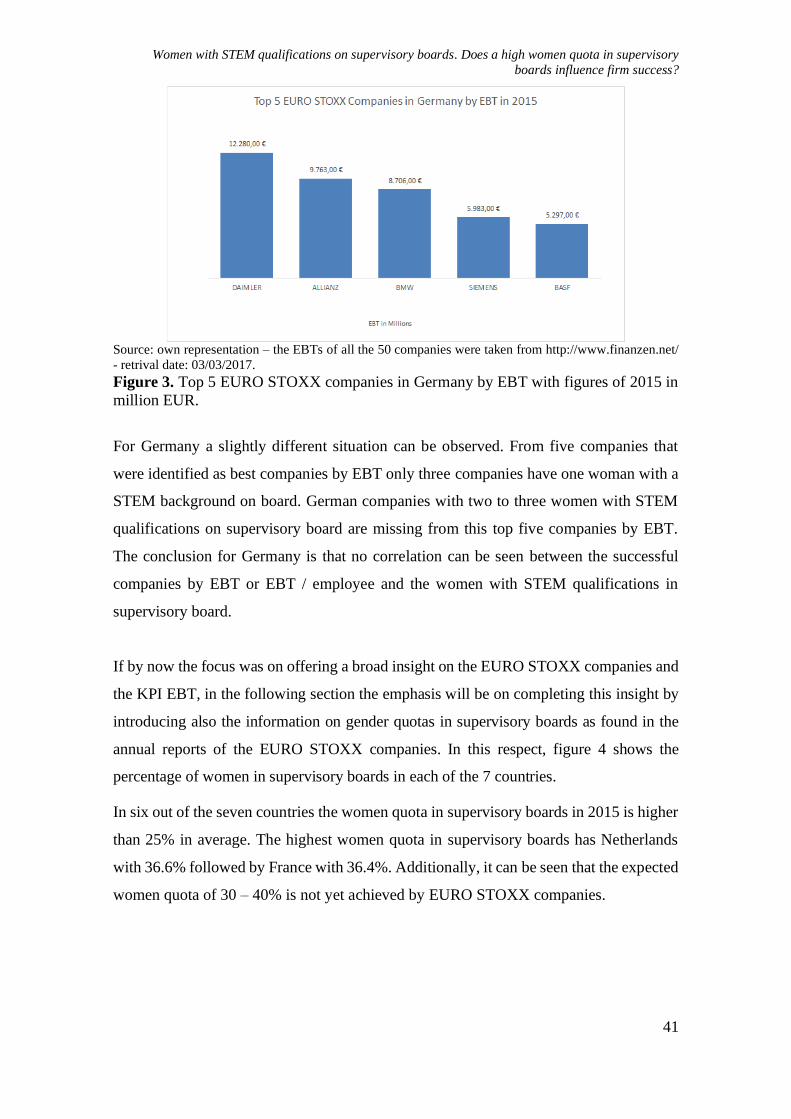
Women with STEM qualifications on supervisory boards. Does a high women quota in supervisory
boards influence firm success?
41
Source: own representation – the EBTs of all the 50 companies were taken from http://www.finanzen.net/
- retrival date: 03/03/2017.
Figure 3. Top 5 EURO STOXX companies in Germany by EBT with figures of 2015 in
million EUR.
For Germany a slightly different situation can be observed. From five companies that
were identified as best companies by EBT only three companies have one woman with a
STEM background on board. German companies with two to three women with STEM
qualifications on supervisory board are missing from this top five companies by EBT.
The conclusion for Germany is that no correlation can be seen between the successful
companies by EBT or EBT / employee and the women with STEM qualifications in
supervisory board.
If by now the focus was on offering a broad insight on the EURO STOXX companies and
the KPI EBT, in the following section the emphasis will be on completing this insight by
introducing also the information on gender quotas in supervisory boards as found in the
annual reports of the EURO STOXX companies. In this respect, figure 4 shows the
percentage of women in supervisory boards in each of the 7 countries.
In six out of the seven countries the women quota in supervisory boards in 2015 is higher
than 25% in average. The highest women quota in supervisory boards has Netherlands
with 36.6% followed by France with 36.4%. Additionally, it can be seen that the expected
women quota of 30 – 40% is not yet achieved by EURO STOXX companies.

Bettina Binder
42
Source: own representation – the information with regard to the number of women on the supervisory board
was extracted from the 2015 annual reports of the respective companies.
Figure 4. Number of women on the supervisory board of EURO STOXX companies in
2015 in different countries.
5. Discussion of Results and Conclusion
As the statistical analysis of the previous section has shown, hypothesis 1 (H1: Enterprises
which have a higher gender quota in supervisory teams are more successful and achieve a
higher EBT) cannot be supported.
Especially for women with STEM qualifications, hypothesis 1 cannot be supported
because no clear correlation can be seen between the EBT or the EBT / employee and the
STEM women quota in supervisory boards.
It should be mentioned that the success of companies is not only driven by women in
supervisory boards. All supervisory boards of the 50 EURO STOXX companies consist
of men and women and the success of a company is also a result of the entire supervisory
board, male and female alike. Furthermore, the presented findings should be supplemented
by further research into the topic. One future research direction might be a detailed study
on women in supervisory and management boards with STEM qualifications including for
instance their exact positions or their leadership span.
The quota of women in the supervisory boards is shown in this article on basis of the year
2015. However, the development of the women quota in supervisory boards remains to a
certain degree constant over a period of time. The reason is that the term of office of
supervisory board members is fixed via contracts for a certain time span – e.g. five years.

Women with STEM qualifications on supervisory boards. Does a high women quota in supervisory
boards influence firm success?
43
For this reason no massive change of the women quota in supervisory boards is be
expected in short term. Additional research is needed to shed more light on this issue.
Moreover, as presented in the literature review, female participation in supervisory boards
shows mixed results with regard to company performance. Therefore, a more holistic
approach is needed, researching not only the number of women on board but also
considering women participation in total workforce, industry’ sectors, management,
subsidiaries, etc.
In the same time EBT as a performance indicator provides only a rough approximation
of company success, a combination of indicators could provide better results. Even the
consequent measurement of the KPI EBT per employee in all cases as relative figure
brings additional insights.

Bettina Binder
44
REFERENCES
Beaufort, V. and Summers, L. (2013), “Women and Corporte Governance: Towards a
New Model!”, working paper [1312], ESSEC Business School, 17 September.
Bilimoria, D. (2006), “The relationship between women corporate directors and women
corporate officers”, Journal of Managerial Issues, Vol. 18 No. 1, pp. 47-61.
Binder, B.C.K., Alonso-Almeida, M.M. and Bremser, K. (2016), “Is enterprise success a
women’s topic?”, in Vrontis, D., Weber, Y. and Tsoukatos, E. (Eds.) 9th Annual
Conference of the EuroMed Academy of Business. Innovation, Entrepreneurship and
Digital Ecosystems, EuroMed Press, Warsaw, pp. 267 – 278.
Britzelmaier, B., Doll, A., Häberle, M. and Kraus, P. (2013), “Remuneration of
management in the financial crisis – a study of the 2009 annual reports of the Euro Stoxx
50 companies”, EuroMed Journal of Business, Vol. 8 No. 3, pp. 209-2019.
Buchwald, A. and Hottenrott, H. (2015), “Women on the Board and Executive Duration
– Evidence for European Listed Firms”, discussion paper [15-016], Düsseldorf Institute
for Competition Economics, 16 February.
Catalyst, (2007), “Catalyst census of women board directors of the FP500: Voices from
the board room”, available at: http://www.catalyst.org/system/files/Census%202007-
%20Financial%20Post.pdf (accessed 07 February 2018).
Corkery, J.F. and Taylor, M. (2012), “The gender gap: A quota for women on the board”,
available at:
http://epublications.bond.edu.au/cgi/viewcontent.cgi?article=1026&context=cgej
(accessed 31 March 2017).
Credit Suisse, (2012), “Gender Diversity and Corporate Performance”, available at:
https://publications.credit-suisse.com/tasks/render/file/index.cfm?fileid=88EC32A9-
83E8-EB92-9D5A40FF69E66808 (accessed 27 November 2017).
Dick, A. (2015), “Female directors on German supervisory boards and firms’ financial
performance”, available at: http://essay.utwente.nl/67308/1/DICK_BA_IBA.pdf
(accessed 31 March 2017).
Dizik, A. (2015), “Do quotas for corporate boards help women advance”, available at:
http://review.chicagobooth.edu/magazine/spring-2015/do-quotas-for-corporate-boards-
help-women-advance (accessed 31 March 2017).
Ferreira, D. (2015), “Board Diversity: Should we trust Research to Inform Policy?”,
Corporate Governance: An International Review, Vol. 23 No. 2, pp. 108-111.
Grbac, B. and Lončarić, D. (2009), “Ethics, social responsibility and business
performance in a transition economy”, EuroMed Journal of Business, Vol. 4 No. 2, pp.
143-158.

Women with STEM qualifications on supervisory boards. Does a high women quota in supervisory
boards influence firm success?
45
Holst, E. and Kirsch, A. (2014), “Women still the exception on executive boards of
Germany’s large firms: Gradually increasing representation on supervisory boards”, DIW
Economic Bulletin, Vol. 4 No. 3, pp. 3-15.
Joecks, J., Pull, K. and Vetter, K. (2013), “Gender Diversity in the Boardroom and Firm
Performance: What exactly constitutes a ‘Critical Mass’?”, Journal of Business Ethics,
Vol. 118 No. 1, pp. 61-72.
Kalleberg, A.L. and Leicht, K. (1991), “Gender and organizational performance:
determinants of small business survival and success”, Academy of Management Journal,
Vol. 34 No. 1, pp. 136–161.
Lückerath-Rovers, M. (2013), “Women on boards and firm performance”, Journal of
Management and Governance, Vol. 17 No. 2, pp. 491-509.
Mohammed, M. (2013), “Corporate accountability in the context of sustainability – a
conceptual framework”, EuroMed Journal of Business, Vol. 8 No. 3, pp. 243-254.
McKinsey&Company, (2007), “Women Matter: Gender Diversity, a Corporate
Performance Driver”, available at: http://www.raeng.org.uk/publications/other/women-
matter-oct-2007 (accessed 31 March 2017).
Nielsen, S. and Huse, M. (2010), “The Contribution of Women on Boards of Directors:
Going beyond the Surface”, Corporate Governance: An International Review, Vol. 18
No. 2, pp. 136-148.
Rosa, P., Carter, S. and Hamilton, D. (1996), “Gender as a determinant of small business
performance: insights from a British study”, Small Business Economics, Vol. 8 No. 4, pp.
463–478.
Rose, C. (2007), “Does female board representation influence firm performance? The
Danish evidence”, Corporate Governance: An International Review, Vol. 15 No. 2, pp.
404-413.
Sullivan, R. (2015), “Can Gender Quotas get more Women into Boardrooms?”, available
at: http://www.bloomberg.com/news/articles/2015-07-01/can-gender-quotas-get-more-
women-into-boardrooms- (accessed 31 March 2017).
STOXX, (2017), EURO STOXX 50, available at: https://www.stoxx.com/index-
details?symbol=SX5E (accessed 03 March 2017).
Terjesen, S., Couto, E.B. and Francisco, P.M. (2015), “Does the presence of independent
and female directors impact firm performance? A multi-country study of board diversity”,
Journal of Management and Governance, Vol. 20 No. 3, pp. 447-483.
Terjeen, S., Aguilera, R.V. and Lorenz, R. (2015), “Legislating a Woman’s Seat on the
Board: Institutional Factors Driving Gender Quotas for Boards of Directors”, Journal of
Business Ethics, Vol. 128 No. 2, pp. 233-251.

Bettina Binder
46
Terjesen, S., Sealy, R. and Singh, V. (2009), Women directors on on Corporate Boards:
A Review and Research Agenda”, Corporate Governance: An International Review, Vol.
17 No. 3, pp. 320-337.
Zanoni, P., Janssens, M., Benschop, Y. and Nkomo, S. (2010), Guest Editorial:
Unpacking Diversity, Grasping Inequality: Rethinking Difference Through Critical
Perspectives. Organization, Vol. 17 No. 1, pp. 9-29.

EAMR
EUROPEAN ACCOUNTING AND MANAGEMENT REVIEW
VOLUME 7, ISSUE 1, ARTICLE 3, 47-65, NOVEMBER 2020
Open Innovation in Times of Covid-19: The case of Project
OxyGEN
Giovanna Lara Burbano
University of Girona
Received October 8, 2020; accepted December 9, 2020.
ABSTRACT
In the face of the health crisis unleashed by Covid-19, experts worldwide took on the
challenge of designing a low-cost emergency ventilator that could be assembled quickly.
This study analizes the successful case of the Project OxyGEN, led by the Barcelona-
based design firm Protofy, which created an industrial-class emergency ventilator and
obtained approval from the Spanish Ministry of Health (AEMPS) for use on patients. The
project received scientific support from a local Research Hospital, and SEAT, a
Volkswagen subsidiary, collaborated in the OxyGEN ventilators' mass-production. This
open-hardware project sprung into action teams in more than 32 countries involved in the
collaborative design process, adopted or made an iteration of the technology. These teams
collaborated with suppliers, consultants, universities, and research institutes to drive this
innovation forward. The case highlights the Open Innovation approach, inter-
organisational relationships between firms of different sectors with research institutions,
and innovation communities.
KEYWORDS
Case study, Cooperation, Covid-19, Innovation communities, Inter-organisational
relationships, Open Innovation, Open Hardware.
ACKNOWLEDGMENT
A special thanks to Protofy and all the companies that participated in the OxyGEN
project. To Kairos Cano for his valuable contribution to this study's improvement and the
University of the Armed Forces ESPE for the financial support through grant No. 019-
2017-CCB.

Giovanna Lara Burbano
48
1. Introduction
In response to the Covid-19 pandemic, teams of experts worldwide took on the challenge
of designing a low-cost emergency ventilator that could be assembled quickly. A
particularly successful case is the OxyGEN Project, led by the Barcelona-based design
firm Protofy. Building on MIT's production guidelines and scientific support from a local
Research Hospital, Protofy created an industrial-grade emergency ventilator, which
obtained approval from the Spanish Ministry of Health (AEMPS) for patients. SEAT, a
Volkswagen subsidiary, collaborated with Protofy in the mass-production of OxyGEN
ventilators.
The OxyGEN ventilator is an open hardware project which sprung into action teams in
32 countries. This community contributed to the design process, adopted, or made an
iteration of the technology. These teams are also collaborating with suppliers, consultants,
clients, universities, and research centers in their countries to drive this innovation
forward.
This case study aims to describe and analyse the Project OxyGEN from the perspective
of open innovation. We asked ourselves what characteristics and internal organisational
practices of Protofy were remarkable to carry out this innovation during the Covid-19
pandemic and interact with the innovation community built around this open hardware
project.
The paper is organized as follows: Section 2 addresses the literature review, section 3
briefly describes the methodology and data collection, section 4 presents the case, section
5 discusses the findings, and finally, section 6 draws conclusions, limitations, and future
research.
2. Literature Review
2.1. Open Innovation
Open innovation holds that firms can and should use external and internal ideas and paths
to market as they look to advance their technology (Chesbrough et al., 2006). As a result
of firms adopting an Open innovation approach, Gassman and Enkel (2007) identify three

Open Innovation in Times of Covid-19: The case of Project OxyGEN
49
processes: a) The outside-in process (inbound), where the integration of suppliers,
customers, and external knowledge sourcing increase a company's innovativeness, b) The
inside-out process (outbound), occurs through external exploitation of internal ideas in
different markets, selling IP and multiplying technology, and c) The linking outside-in
and inside-out processes by working in alliances with complementary companies.
Although there are more studies focused on the inbound process (e.g., Bianchi et al., 2010;
Chesbrough and Crowther 2006; van de Vrande et al., 2009, Parida et al., 2012) than
those on the outbound process (e.g., Lichtentaler, 2009) both show positive effects on the
performance of the firm. However, there is consensus that to benefit from open innovation
successfully, a firm requires absorptive capacity and some higher-order management
capabilities to align inbound knowledge flows with the firm's in-house innovation
activities.
Besides, Brunswicker and Vanhaverbeke (2015a) argue that the nature of the external
source of knowledge (e.g., customers, suppliers, universities, research institutions,
competitors, consultants) for inbound processes are different, thus the organizations,
according to their internal organizational practices, adopt different strategies to take
advantages of each source purposely. These strategies are (1) minimal searcher, (2)
supply-chain, (3) technology-oriented, (4) application-oriented, and (5) full scope
sourcing.
The minimal searcher (Type 1) does not actively interact with external sources to combine
internal and external potentials. Supply-chain (Type 2) has relatively intense interactions
with direct customers and suppliers compared to other external sources. Technology-
oriented firms (Type 3) have a relatively high degree of cooperation with universities,
research organisations, and IPR experts. The application-oriented and demand-driven
innovation are characteristic of the application-oriented Searcher (Type 4). Finally, the
full scope-searcher (Type 5) is heavily involved in knowledge sourcing, shows a strong
interest in external ideas from various innovation sources, and built an innovation
ecosystem for new ideas.

Giovanna Lara Burbano
50
It is worth noting that the authors also suggest that these strategy types map onto four
internal organizational practices for innovation that help support and enable external
knowledge sourcing and alignment at strategic and operational levels: They are (1) long-
term investment activities, (2) innovation strategy processes, (3) innovation development
processes, and (4) innovation project control.
The first practice involves innovation management directing a company's innovation
efforts toward project-focused activities whose purpose is to build long-term knowledge
rather than produce short-term results (Brunswicker and Vanhaverbeke, 2015b). The
implementation of innovation strategy processes helps to identify and recognise the value
of new external information and knowledge and direct internal innovation activities
(Nelson and Winter, 1982). The third organisational practice: innovation development,
which helps to assimilate and transform new knowledge (Tidd, 2001). Finally, innovation
project control is related to the firm's actions to reconfigure activities (Benner, 2009;
Goffin and Mitchell, 2005) and ensure that innovation measures are carried out within
budget, schedule, and satisfactory level performance (Robertson et al., 2012).
Based on the typology mentioned above, this case study examines the firm Protofy to
determine its external knowledge sourcing strategy and internal organisational practices
to leverage inbound knowledge flows for the OxyGEN project.
2.2. Innovation Communities
The first studies on innovation communities were carried out in the context of open-
source software projects, typically initiated by individuals or small groups, where they
are more observable the interactions between users and the role of communities.
However, innovation communities have also been part of the development of physical
products in a very similar way (von Hippel, 2005). In 2011, inspired by the free software
movement, open-source hardware appeared. Both share similar characteristics and
benefits, such as a high level of transparency in the development process, a high level of
continuous improvement, and, again, high community participation (Merkel et al.,
2012a).

Open Innovation in Times of Covid-19: The case of Project OxyGEN
51
West and Lakhani (2008) point out that communities and their role in the innovation
process fit within and offer an opportunity to extend the firm-centric concept of open
innovation. Considering them to be a "voluntary association of actors, typically lacking
in a priori common organisational affiliation (i.e., not working for the same firm) but
united by a shared instrumental goal, creating, adapting, adopting, or disseminating
innovations."
Regarding intra-community interactions, the peer-to-peer community support facilitates
the adoption and use of innovation (Lakhani and von Hippel, 2003). Meanwhile,
identification and interaction within a community mean that innovations fuel imitation
and extension by other user innovators (von Hippel, 2001).
Fitcher K. (2009) highlights the role of innovation communities as networks of promoters,
redefining innovation communities as "An informal network of like-minded individuals,
acting as universal or specialised promoters, often from more than one company and
different organisations that team up in a project, and commonly promote a specific
innovation, either on one or across different levels of an innovation system."
Based on the framework mentioned above, the case study set out to analyse the
community created around the OxyGEN project and its participation in developing and
disseminating this innovation.
3. Methods
3.1. Case study methodology
This research used the case study methodology to document and analyse the OxyGEN
emergency ventilator's development during the first wave of the Covid-19 pandemic.
First, we describe Protofy, the firm that led, accelerated, and developed the project,
followed by the context of the Covid-19 outbreak in Spain. Then, we recount the design
and development of the Oxygen emergency ventilator itself and finally describe the
innovation community built around the project, which played a crucial role in its
manufacturing and global distribution.

Giovanna Lara Burbano
52
The case study method was chosen for its suitability for showing how open hardware and
the open innovation approach combined to drive innovation forward. As Yin (2009a)
remarks, one of the strengths of the case study research methodology is that it provides a
rich contextual analysis of the unit of study, at a qualitative detail that cannot be replicated
using quantitative or experimental methods.
3.2. Data collection
The primary data sources for this case-study are interviews, surveys, and documental
review. Interviews were conducted with the co-founders of Protofy to discuss their
perspectives and experiences. We used a semi-structured format for this interview. The
interviews were recorded and transcribed to assist in the analysis.
We applied the surveys in the second half of April, during the lockdown. The criterion
for selecting the sample subjects (project/team leaders) was the completion of a self-
administered questionnaire, through the Google Forms application (online), due to its
flexibility and suitability to adjust to the needs of the research for free and without
limitations (Abundis, 2016).
The questionnaire consists of 12 questions divided into three sections: general
information about the project and team profile, degree of involvement in the OxyGEN
project, and cooperation with partners in their respective countries.
Annex 1 shows the questionnaire applied to the OxyGEN community.
The questionnaire's link was sent to all OxyGEN community members registered on
Discord.com, the team members' platform to communicate and share relevant information
for each project's development. The response level reached 62%, which corresponds to
30 projects/teams worldwide.
Relevant company documents were also analysed. These included the blog, video journal,
tutorials, publications in newspapers and magazines, the project's dedicated website, and
participating partners' publications.

Open Innovation in Times of Covid-19: The case of Project OxyGEN
53
An active dialogue was maintained with Protofy to clarify inconsistencies and expand
and develop the data. In the case of study research, by collecting and cross-examining
data about the innovation process from multiple sources, data collection and interpretation
are likely to be an accurate representation of reality (Yin, 2009b).
4. The OxyGEN Project
4.1. The company
Protofy is a company based in Barcelona, specialized in the design, engineering, and rapid
prototyping of creative and innovative ideas. Protofy prides itself on its agility and its
ability to work in close collaboration with its customers and stakeholders.
The company was created in February of 2016 by a multidisciplinary team of young
engineers committed to quality, safety, and technology. The team currently consists of
seven people, equipped with the knowledge, tools, and talent to design all kinds of
electronic circuits incorporated and mechanical parts, Internet of Things (IoT)
development, and software development for both desktop and mobile devices.
Protofy's service includes all development stages, from idea generation, testing,
prototyping, and redesign of iterations. They aim to integrate hardware (mechanics,
electronics, electricity) and software to provide high-quality technological solutions.
This small but knowledge-intensive company stands out for its speed to carry out the
projects, between three and six weeks. According to Lluis Rovira, co-founder, this is due
to the use of project tools such as lean and scrum, which let them plan and develop
projects as design iterations validated by the clients and users. Protofy also has a distinctly
developed capacity to create collaboration networks with suppliers and other market
participants.
4.2. The problem
The first imported Covid-19 case in Spain was dated January 31, 2020, in the Spanish
Canary Islands. One month later, on February 25, 2020, the first case was reported in the
Spanish peninsula. However, Covid-19 cases were likely circulating in Catalonia before
the official cases were reported (Coma et al., 2020). As Covid-19 confirmed cases grew

Giovanna Lara Burbano
54
exponentially, on March 30, a national lockdown was declared, and all non-essential
activities were suspended.
By April 4, Spain had become one of the worst-hit countries by the pandemic. The number
of infected rose to 124,736 cases, 57,612 were hospitalized, and 11,700 deceased
(Department of National Security DNS, 2020). The number of patients admitted to ICUs
reached 3078 cases (Spanish Ministry of Health, 2020). According to the Spanish
Scientific News Agency SINC (2020), between 10% and 15% of patients admitted to
hospital with pneumonia caused by Covid-19 are admitted to the ICU, 90% of which
require intubation and mechanical ventilation, generally for at least two or three weeks.
Thus, one of the most challenging problems to face during the pandemic was the sudden
lack of ventilation equipment in intensive care units. With the international markets
undersupplied and countries outbidding each other for equipment, locally developing and
manufacturing ventilators became the most viable, if not the only option for Spain and
many other countries.
4.3. The OxyGEN Ventilator
According to the interview with the founders of Protofy, what motivated them to carry
out the OxyGEN Project was to contribute with their knowledge to solve the problem of
the insufficient number of mechanical ventilators in the local hospitals to avoid loss of
life, and to some extent also try to help alleviate the situation in remote small towns or
less developed countries. Thus, their team of engineers set out to design a low-cost
emergency ventilator that would be easy to build, with available materials that could be
easy to find amid curfews and nation-wide lockdowns.
The team began looking for the technical requirements for the ventilator design and found
valuable information shared by other experts who were also working around the world.
In particular, MIT's emergency ventilator design toolkit proved useful to the team, and
Protofy's design was eventually featured on MIT's website.
Very early, the team also adopted the Open-hardware strategy to carry out the project.
They decided to create a dedicated website to document their journey, share information
Open Innovation in Times of Covid-19: The case of Project OxyGEN
55
about the project, and make their design available to download by interested builders
worldwide. The decision to create a dedicated website and publish it both in English and
Spanish proved to be pivotal, as search engines eventually indexed and gave their site
great exposure, especially in Spanish-speaking countries.
The team had to overcome lockdown restrictions to procure the first set of pieces and
materials, but they moved quickly with creativity and teamwork. They tapped into their
network for expert advice when needed and created a community workspace, also known
as "server" on Discord.com, where they could communicate, share information, and
problem-solve about the project more effectively with people from their network, as well
as visitors to the project's website. In a record time of three days, the team built the first
version of the volume-controlled ventilator in wood with two innovative features: a) The
use of a Bag Valve Mask Unit (BMV), also known as Ambu bag or manual resuscitator.
A standard piece of medical equipment used for patient ventilation in ambulances and b)
A retrofitted windshield wiper motor to provide compression.
After a series of iterations, the team decided to separate the design into two versions: a)
OxyGEN-M, which can be made at makers' facilities using wood or methacrylate; and b)
OxyGEN-IP, an industrial model in sheet metal, designed for mass-production.
Further into the design process, they sought scientific support from the Hospital and
Research Institute Germans Trias and Pujol (IGTP) and the Faculty of Medicine and
Health Sciences of the University of Barcelona. The hospital's involvement during
ideation brought medical expertise and credibility into the project. It is worth noting the
absorptive capacity of the hospital staff. Interviewees commented that one of the medical
doctors happened to have an engineering degree, which created a natural affinity with
their team.
Under the supervision of the medical personnel of the hospital, they carried out all the
clinical trials. On March 30, 2020, they obtained a special authorization from the Spanish
Ministry of Health (AEMPS) for the OxyGEN model-IP to be used in patients.
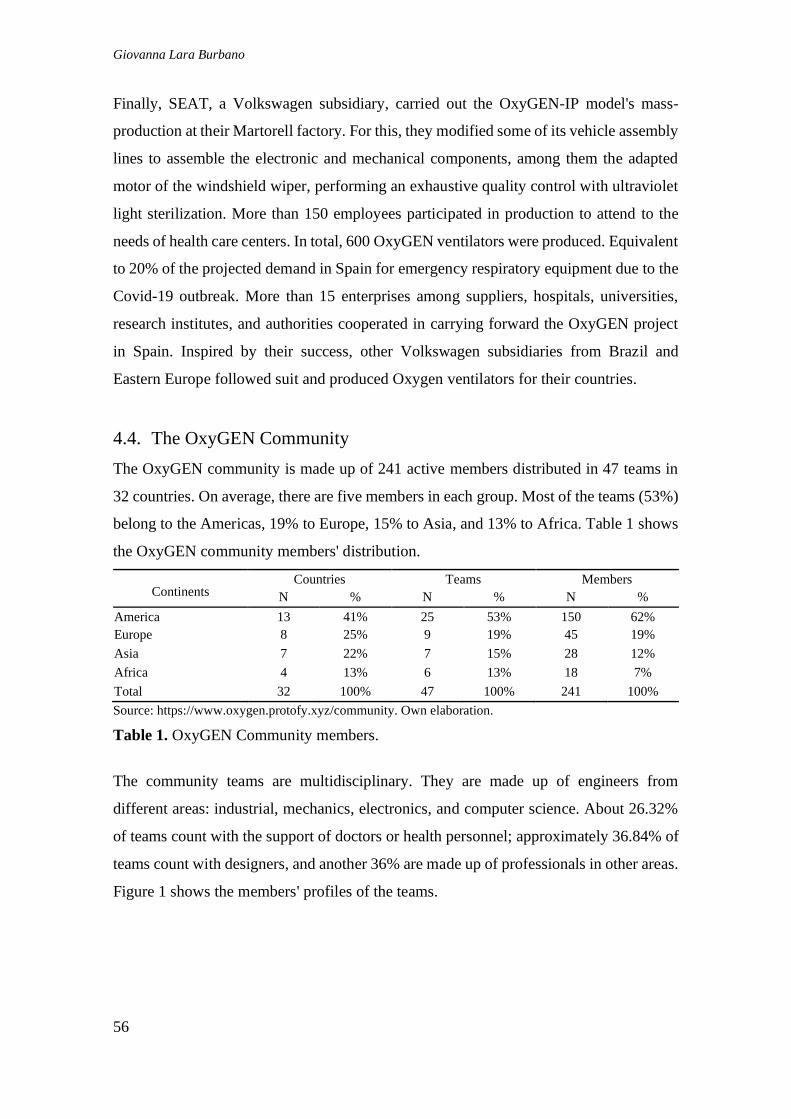
Giovanna Lara Burbano
56
Finally, SEAT, a Volkswagen subsidiary, carried out the OxyGEN-IP model's mass-
production at their Martorell factory. For this, they modified some of its vehicle assembly
lines to assemble the electronic and mechanical components, among them the adapted
motor of the windshield wiper, performing an exhaustive quality control with ultraviolet
light sterilization. More than 150 employees participated in production to attend to the
needs of health care centers. In total, 600 OxyGEN ventilators were produced. Equivalent
to 20% of the projected demand in Spain for emergency respiratory equipment due to the
Covid-19 outbreak. More than 15 enterprises among suppliers, hospitals, universities,
research institutes, and authorities cooperated in carrying forward the OxyGEN project
in Spain. Inspired by their success, other Volkswagen subsidiaries from Brazil and
Eastern Europe followed suit and produced Oxygen ventilators for their countries.
4.4. The OxyGEN Community
The OxyGEN community is made up of 241 active members distributed in 47 teams in
32 countries. On average, there are five members in each group. Most of the teams (53%)
belong to the Americas, 19% to Europe, 15% to Asia, and 13% to Africa. Table 1 shows
the OxyGEN community members' distribution.
Continents Countries Teams Members
N % N % N %
America 13 41% 25 53% 150 62%
Europe 8 25% 9 19% 45 19%
Asia 7 22% 7 15% 28 12%
Africa 4 13% 6 13% 18 7%
Total 32 100% 47 100% 241 100%
Source: https://www.oxygen.protofy.xyz/community. Own elaboration.
Table 1. OxyGEN Community members.
The community teams are multidisciplinary. They are made up of engineers from
different areas: industrial, mechanics, electronics, and computer science. About 26.32%
of teams count with the support of doctors or health personnel; approximately 36.84% of
teams count with designers, and another 36% are made up of professionals in other areas.
Figure 1 shows the members' profiles of the teams.

Open Innovation in Times of Covid-19: The case of Project OxyGEN
57
Figure 1. Profile of OxyGEN community members.
The OxyGEN community was formed very early in the project. Because of that, about
43% of teams collaborated directly in the design of the first OxyGEN prototype, but
others joined quickly and learned from the experience gained to apply it to their projects.
Once Protofy company released the manual for ventilator design and construction, 36%
of community member teams directly adopted the design. The remaining 64% iterated on
the design to develop their own derived version of the ventilator. Figure 2 shows the
technology adoption.
Figure 2. Technology adoption among members of the OxyGEN community
Mechanical,
Electronics,
Systems or
Industrial
Engineers
36.84%
Doctors or staff of
health areas
26.32%
Designers or staff
in graphic areas
18.42%
Others
profesionals
18.42%

Giovanna Lara Burbano
58
At the time of this study, 43% of the projects are in the prototyping phase, 38% are waiting
for authorization from other entities or institutions, and 21% have reached the
manufacturing stage. Figure 3 shows the status of the projects.
Figure 3. Status of projects in the OxyGEN community.
Most of the teams collaborated with suppliers of equipment, materials, components, and
software inside the community (31%), consultants and laboratories outside of the
community (27,6%), other teams in the OxyGEN community (17%), and the remaining
30% with universities or research institutes. Figure 4 shows the collaboration of the teams
with different partners.
Figure 4. Collaboration partners
Prototype
46%
Waiting for
authorization
39%
Manufacture
15%
10.3%
13.8%
17.2%
27.6%
31.0%
Public or private Research Institutions
Universities or Higher Education Institutions
Other teams in the OxyGEN community
Consultants or commercial labs
Suppliers of equipment, materials, components or
software

Open Innovation in Times of Covid-19: The case of Project OxyGEN
59
5. Discussion
According to the results, the characteristics and internal organisational practices of
Protofy and the Project Oxygen community which enabled them to develop and carry out
this innovation during the Covid-19 pandemic correspond to the three processes of open
innovation: the inbound process, the outbound process, and the linking of inbound and
outbound processes (Gassman and Enkel (2007).
5.1. Inbound Process
At the beginning of the process, Protofy had to find useful ideas and external information
to develop their project. Nevertheless, the firm had well developed internal organizational
practices for open inbound innovation already, which allow us to characterize it as a "full-
scope searcher." Brunswicker and Vanhaverbeke (2015) point out that firms in this
typology are heavily involved in knowledge sourcing, show a keen interest in external
ideas from various sources, and have built an innovation ecosystem for new ideas. The
number and diversity of Protofy's sources (researchers in universities, companies, or
teams in the world who also had taken on the challenge of creating an emergency
ventilator) are a straightforward exhibit of this profile.
The internal organizational practices observed implementing/supporting this innovation
sourcing profile are:
1. Innovation strategy processes. Protofy used the open hardware strategy for the
development of a low cost and quickly-to-assemble emergency ventilator. Precisely,
some benefits of the open-source hardware are a significant source of good ideas, high
participation of the community and a high level of transparency in the development
process, a high development speed, often high modularity in their solutions,
extraordinary development potential for free and a high level of continuous
improvement (Merkel et al., 2012b). Niezen et al. (2016) point out that such
advantages are particularly well suited for medical equipment production.
2. Innovation development processes. Protofy created an ecosystem to share ideas and
solutions to develop the OxyGEN project collaboratively. The practice to document
and make everything publicly available in different media formats and platforms, with

Giovanna Lara Burbano
60
a particular preoccupation on how others can make use of their design or how they
can be engaged in co-designing the prototype, was critical in building a community
of co-innovators and promoters of the innovation.
3. Innovation project control. Protofy used agile project management methodologies to
enable rapid prototyping. Well suited to the crisis, which demanded a fast response.
Furthermore, workflows built around close and constant communication with
customers translated well to dealing with Hospital staff to co-design the ventilator and
work with stakeholders in a clinical trial and industrial settings.
4. Long-term investment activities. Protofy carried out the OxyGEN project motivated
solely by its spirit of collaboration in the face of the health crisis. However, the
activities carried out for the construction of a medical device successfully in such a
short-time contributed to developing new knowledge and skills in the project's team.
The company could exploit this investment of time and resources in new healthcare
industry projects or others.
5.2. Outbound process
The inside-out (outbound) process occurred through the release of OxyGEN ventilator
design so that other individuals, teams, manufacturers, or companies could take it and
develop their projects. These individuals or firms became part of the community either
by adopting or interacting with the technology.
This community of co-innovators and promoters of innovation played a fundamental role
in developing and expanding this innovation to other countries. The community
interactions with Protofy helped overcome the challenges intrinsic to developing medical
technology, while support among the community members facilitated its adoption and
use. The leadership of promoters and managerial skills aforementioned allowed Protofy
to find complex solutions in a collaborative environment. Based on the results obtained
of the survey to the OxyGEN community, below we point out the characteristics beyond
the firm level that facilitated the adoption/iteration of the technology:

Open Innovation in Times of Covid-19: The case of Project OxyGEN
61
1. Multidisciplinary teams. This characteristic allows them to find rapid solutions to
complex problems or situations.
2. Collaborative technologies support effective communication. They enabled real-time
communication, mutual support and allowed massive exposure.
3. Open access to knowledge and information. The pandemic created the conditions for
the practice of open innovation to become widespread. This climate of willingness to
cooperate in response to the pandemic was further facilitated by using the Creative
Commons Licence, which removed legal barriers to involving enterprises such as car
manufacturers. In Canada, for instance, car manufacturing companies willing to
collaborate with medical technology firms also emerged in response to the pandemic.
However, the collaboration did not occur to the same degree due to legal concerns
(Globe and Mail, 2020).
4. No language barrier. The community quickly became populated by members from
different nationalities, who, in turn, facilitated access to the technology by people
from non-English speaking countries.
5. Low level of competition. Developing countries found themselves unable to compete
in international markets to acquire the necessary medical equipment during the
pandemic, nor did they have local companies to manufacture such equipment. This
issue could explain the predominance of teams from developing countries and the
absence of teams from advanced economies.
6. Network effects. The initial collaboration with all types of local partners: suppliers,
consultants, or commercial laboratories, universities, and research institutions, in turn,
fostered the involvement of similar institutions in other countries.
5.3. Linking of inbound and outbound processes
Protofy moved to established alliances with relevant and complementary companies to
advance the development and adoption of the OxyGEN Ventilator. The GTP Research
Hospital and SEAT, most notably, were the partners whose involvement in the project

Giovanna Lara Burbano
62
had the most transformative effect. Partnership with the Research Hospital resulted from
Protofy's initiative; however, SEAT's participation came about due to the prior
relationship with that company, which had hired Protofy in the past. Acquiring knowledge
through the partnership with the Research hospital, while recasting SEAT to make use of
one of their designs once again, demonstrates this firm's ability to link inbound and
outbound processes to advance their purpose.
6. Conclusions
This case study set out to describe and analyse the OxyGEN Project from the perspective
of Open Innovation. In response to the health crisis caused by the Covid-19 outbreak,
Protofy, a Barcelona-based design company, led this project, which prototyped,
developed, mass-produced, and distributed an industrial-class emergency ventilator to
hospitals worldwide by creating an innovation community around the project. Protofy
pursued this project with non-profit motivations, yet it provides a useful example of how
open innovation strategies and building innovation communities can reduce time to
market and increase technology adoption rates.
For this innovation project's design and development, the company directed its efforts to
search for external sources of knowledge through cooperation with clients, suppliers,
universities, and research centers. In other words, adopted an inbound open innovation
process. Also, it deployed its ability to create an innovation community, combining an
outbound open innovation process with an open hardware strategy, following the trend of
companies adopting practices and values of the open-source movement to advance
technological development and project goals.
The organizational practices observed and the strategies adopted by the company also
allowed us to characterize Protofy as a "full-scope searcher." Brunswicker and
Vanhaverbeke (2015) define firms in this typology as those which are: heavily involved
in knowledge sourcing, show a keen interest in external ideas from various sources, and
have built an innovation ecosystem for new ideas. Protofy's example, in particular, shows
how firms who adopt a full-scope searcher innovation strategy can respond quickly to
dramatic change.

Open Innovation in Times of Covid-19: The case of Project OxyGEN
63
The Oxygen community played a dual role in the project's development, as co-creators
and promoters of this innovation. As Von Hippel (2006) points out: "Democratization of
the opportunity to create is important beyond giving more users the ability to make
exactly the right product for themselves. The joy and the learning associated with
creativity and membership in creative communities are also important". It was this sense
of community the main factor which channeled international enthusiasm into action. This
factor, which combined others mainly: the teams' multidisciplinarity, collaborative tools
to support remote work and effective communication, and a climate of openness for inter-
organizational partnerships, resulted in a remarkable response to the Covid-19 pandemic.
For academics, this case study provides an example of open innovation in the crisis and
inter-organizational collaboration between firms of different sectors (industries and
services) with universities and research institutes. In particular, evidencing how
knowledge-intensive business services (KIBS) cooperate with research institutions to
receive scientific support and apply knowledge transfer for innovation. (Lee and Miozzo,
2019).
For companies, this case highlights the importance of community-building and
developing internal capabilities to co-create with innovation communities. As a way to
adopt external knowledge sourcing strategies and take advantage of open innovation.
Policymakers may use this case study to support the streamlining of approval processes
for medical equipment and policies to promote public-private research projects.
The main limitation of a case study is that it cannot be generalised but allows digging into
how and why questions. In that sense, further empirical research could analyze a sample
of industries and services that used open-source values and strategies to innovate during
the pandemic. Furthermore, future research could be performed regarding firms that
reinvented themselves, innovated their products or services using collaborative tools
during the pandemic. Also, to investigate the effects of the new forms of work enabled
by these technologies on their organizational structure.

Giovanna Lara Burbano
64
REFERENCES
Bianchi, M., C. Orto, S. and Vercesi, P. (2010). Enabling open innovation in small and
medium-sized enterprises: How to find alternative applications for your technologies? R
and D Management, 40, 414–431.
Benner, M.J. (2009). Dynamic or static capabilities? Process management practices and
response to technological change. Journal of Product Innovation Management, 26, 473–
486.
Brunswicker, S. and Vanhaverbeke, W. (2015). Open Innovation in Small and Medium-
Sized Enterprises (SMEs): External Knowledge Sourcing Strategies and Internal
Organizational Facilitators. Journal of Small Business Management, 53, 1241–1263.
Chesbrough, H. (2006). Open Innovation: A New Paradigm for Understanding Industrial
Innovation, in Chesbrough, H., Vanhaverbeke, W., West, J. (Eds.), Open Innovation:
Researching a New Paradigm. Oxford: Oxford University Press.
Chesbrough, H. and Crowther, A.K. (2006). Beyond high tech: Early adopters of open
innovation in other industries. R and D Management, 36, 229–236.
Coma, E., Mora, N., Prats-Uribe, A., Fina, F., Prieto-Alhambra, D., and Medina-Peralta,
M. (2020). Excess cases of influenza suggest an earlier start to the coronavirus epidemic
in Spain than official figures tell us: an analysis of primary care electronic medical records
from over 6 million people from Catalonia. medRxiv, 2020.04.09.20056259.
Department of National Security DNS. (2020, April). Coronavirus (COVID-19).
Retrieved from https://www.dsn.gob.es/en/actualidad/sala-prensa/coronavirus-covid-19-
04-abril-2020.
Fichter, K. (2009). Innovation communities: The role of networks of promoters in open
innovation. R and D Management, 39, 357–371.
Gassmann, O. and Enkel, E. (2007). Towards a theory of Open Innovation: three core
process archetypes. Proceedings of the R&D Management Conference, Lisbon, Portugal.
Goffin, K. and Mitchell, R. (2005). Innovation Management: Strategy and
Implementation Using the Pentathlon Framework. Houndmills, Basingstoke: Palgrave
Macmillan.
The Global and Mail. (2020, April). Emergency coronavirus bill could help auto parts
firms retool to produce ventilators. Retrieved from
https://www.theglobeandmail.com/politics/article-emergency-coronavirus-bill-could-
help-auto-parts-firms-retool-to/.
Lakhani, K. R. and von Hippel, E., (2003). How open-source software works: free user
to user assistance, Research Policy, 32(6), 923–943.

Open Innovation in Times of Covid-19: The case of Project OxyGEN
65
Lichtenthaler, U. (2009) Outbound open innovation and its effect on firm performance:
Examining environmental influences. R and D Management, 39, 317–330.
Merkel, A., Hopf, H., and Müller, E. (2012). Accelerating the Innovation Process with
the Help of Open Source Prototyping Hardware. Annals of the Faculty of Engineering
Hunedoara. International Journal of Engineering, 10(1), 105–112.
National Center for Epidemiology CNE. (2020, April). Informe nº 21. Situación de
COVID-19 en España a 6 de abril de 2020. Retrieved from https://www.isciii.es.
Nelson, R. and Winter, S.G (1982) An Evolutionary Theory of Economic Change.
Cambridge (Massachusetts), London: Harvard Business School Press.
Niezen, G., Eslambolchilar, P., and Thimbleby, H. (2016). Open-source hardware for
medical devices. BMJ Innovations, 2(2), 78–83.
Olson, J.S. and Olson, G.M. (2013). Working together apart: collaboration over the
internet. Synth Lect Hum Center Inform, 6(5), 1–151.
Parida, V., Westerberg, M. and Frishammar, J. (2012). Inbound Open Innovation
Activities in High-Tech SMEs: The Impact on Innovation Performance. Journal of Small
Business Management, 50(2), 283–309.
Robertson, P. L., Casali, G.L and Jacobson, D. (2012) Managing Open Incremental
Process Innovation: Absorptive Capacity and Distributed Learning, Research Policy,
41(5), 822–832.
SINC Agency. (2020, April). Así están trabajando las UCI en el centro de la tormenta de
la COVID-19. Retrieved from https://www.agenciasinc.es/Opinion/Asi-estan-
trabajando-las-UCI-en-el-centro-de-la-tormenta-de-la-COVID-19.
Van de Vrande, V., de Jong, J.P. and de Rochemont, M. (2009). Open innovation in
SMEs: Trends, motives and management challenges. Technovation, 29, 423–437.
Von Hippel, E. (2001). Open source shows the way: innovation by and for users no
manufacturer required, Sloan Management Review, 42(4), 82–86.
Von Hippel, E. (2005). 'Innovation Communities,' in von Hippel, E. (ed.) Democratizing
Innovation. Cambridge, MA: The MIT Press.
West, J. and Lakhani, K.R. (2008). Getting Clear About Communities in Open
Innovation, Industry and Innovation, 15(2), 223–231
Tidd, J. (2001) Innovation management in context: Environment, organization, and
performance. International Journal of Management Reviews, 3, 169–183.
Yin, R.K. (2009). Case Study Research: Design and Methods, 4th ed. Thousand Oaks
CA: Sage Publications.
Von. Hippel, E. (2005). Democratizing Innovation: The MIT Press.

EAMR
EUROPEAN ACCOUNTING AND MANAGEMENT REVIEW
VOLUME 7, ISSUE 1, ARTICLE 4, 66-77 NOVEMBER 2020
Does an internship in Business Administration enhance
professional competences?
Ramon Bastida
Universitat Internacional de Catalunya
Frederic Marimon
Universitat Internacional de Catalunya
Received April 26, 2020; accepted June 5, 2020.
ABSTRACT
The aim of this study was twofold. First, we want to determine which competences are
acquired through an internship, as well as the levels of attainment. Secondly, we want to
compare the levels of achievement in two different universities, since we are interested
in proving whether the university of origin affects the final results. We thus organized
competences following the classification made by the Tuning project, which groups them
as instrumental, interpersonal and professional. A questionnaire was distributed among
the students participating in internships, and the firms offering them in each university,
to assess their perceptions of the competences.
We used the SPSS statistical package to conduct a set of mean tests to identify differences
between the perceptions of the students and firms. Students acquire a higher level of
professional competences than instrumental or interpersonal competences. There are also
differences according to university, which suggests its importance.
KEYWORDS
Internship, Professional Competences, Higher Education.

Does an internship in Business Administration enhance professional competences?
67
1. Introduction
In recent years, many universities have started to offer internship opportunities to their
students. Although internships can be conducted as a curricular or an extracurricular
activity, studies have shown that the majority of colleges offer internships as a component
of their academic program (Hergert, 2009). Knouse and Fontenot (2008), undertook a
research review of the benefits of internships, and concluded that their main benefits are:
(a) enhancing employability, as they can help students find jobs or an internship can be
directly translated into a full-time job (b) creating real work experiences for students,
which motivate them to continue along a career path, and (c) creating realistic
expectations about the real business world and helping to clarify a student’s career
intentions. Although all these benefits are obtained from an internship experience, Milne
and Caldicott (2016) note that many universities basically incorporate internships (work
integrated learning) to fulfil their mission of providing graduates who are ready for work
within industry.
Evaluating and assessing internship activities is considered important in order to improve
university business programs (Beard, 2007). Internship programs often consider the
opinions and evaluations of employers in assessing student performance, as employers
are the best judges of professional competences (Milne and Caldicott, 2016). The
combined assessment of the learning experience by the student, the company employer,
and the academic supervisor can be an integral part of the overall program evaluation
(Beard, 2007).
The interaction and evaluations of students, employers, and university faculty members
provide information about student traits, knowledge, skills, and behavior, as well as
perspectives on coursework activities, and can even suggest curriculum changes. These
outcomes are priceless and can help both future students and professionals (Beard, 2007).
After analyzing the importance of the evaluations and interactions between a student and
their employer, this paper compares the skills and knowledge acquired after an internship
program from both sides (student and employer) in two different universities.
2. Sample and Methodology
This study analyses the skills and competences acquired by students on a Bachelor’s
Degree program in Business Administration after their internship placement. The
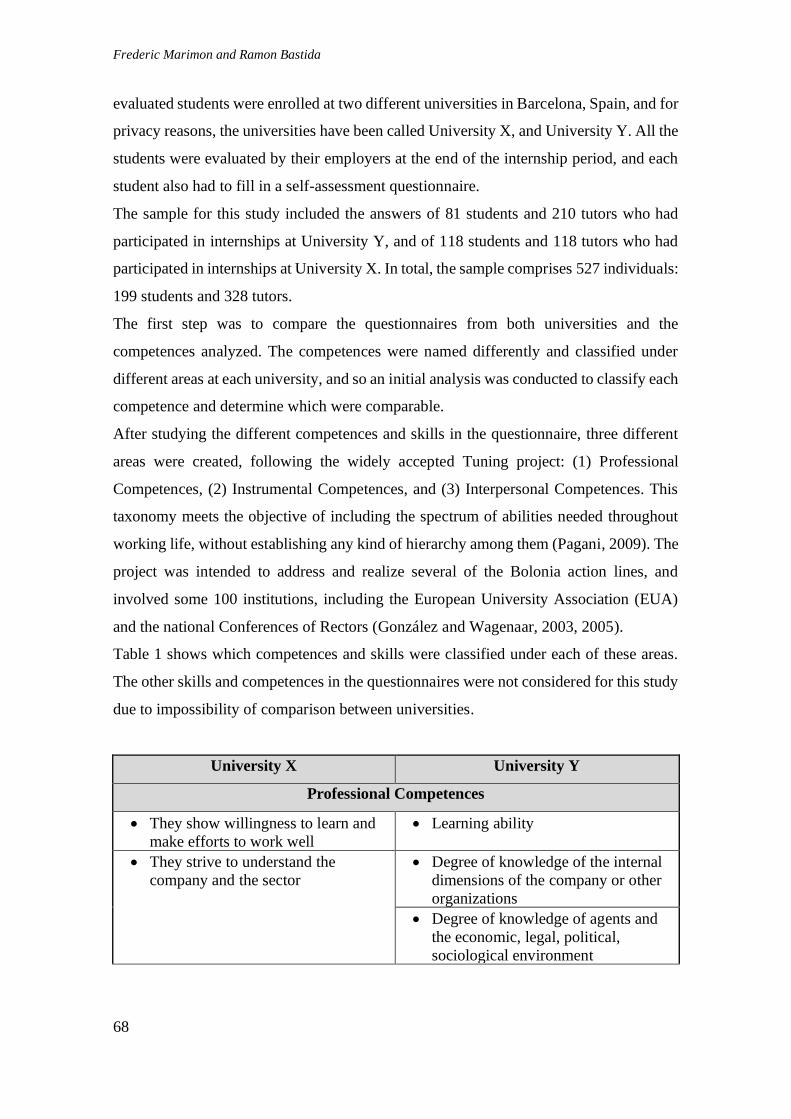
Frederic Marimon and Ramon Bastida
68
evaluated students were enrolled at two different universities in Barcelona, Spain, and for
privacy reasons, the universities have been called University X, and University Y. All the
students were evaluated by their employers at the end of the internship period, and each
student also had to fill in a self-assessment questionnaire.
The sample for this study included the answers of 81 students and 210 tutors who had
participated in internships at University Y, and of 118 students and 118 tutors who had
participated in internships at University X. In total, the sample comprises 527 individuals:
199 students and 328 tutors.
The first step was to compare the questionnaires from both universities and the
competences analyzed. The competences were named differently and classified under
different areas at each university, and so an initial analysis was conducted to classify each
competence and determine which were comparable.
After studying the different competences and skills in the questionnaire, three different
areas were created, following the widely accepted Tuning project: (1) Professional
Competences, (2) Instrumental Competences, and (3) Interpersonal Competences. This
taxonomy meets the objective of including the spectrum of abilities needed throughout
working life, without establishing any kind of hierarchy among them (Pagani, 2009). The
project was intended to address and realize several of the Bolonia action lines, and
involved some 100 institutions, including the European University Association (EUA)
and the national Conferences of Rectors (González and Wagenaar, 2003, 2005).
Table 1 shows which competences and skills were classified under each of these areas.
The other skills and competences in the questionnaires were not considered for this study
due to impossibility of comparison between universities.
University X University Y
Professional Competences
• They show willingness to learn and
make efforts to work well
• Learning ability
• They strive to understand the
company and the sector
• Degree of knowledge of the internal
dimensions of the company or other
organizations
• Degree of knowledge of agents and
the economic, legal, political,
sociological environment

Does an internship in Business Administration enhance professional competences?
69
• Ability to value the
internationalization strategies of the
company or other organizations
• They demonstrate initiative in their
work
• Initiative and entrepreneurship
• They are motivated in their work • Self-sufficiency and motivation for
success
Instrumental Competences
• They are effective in solving
problems and dealing with incidents
• Problem solving
• They know how to plan and
prioritize their work
• Organization and planning capacity
• They show self-confidence and
autonomy in the development of
their functions
• Capacity to work autonomously
• They are able to correctly use the
new technological resources
• Computer skills
• They are able to apply theoretical
knowledge in their job
• Ability to apply knowledge to
practice
Interpersonal Competences
• They are a good team player and
perform the part of the work that is
assigned to them
• Ability to work as a team
• They communicate in a
concrete/precise and clear way
• Oral communication in Catalan
and/or Spanish
• Ability to transmit knowledge
Table 1. Equivalent Competences for Comparison Purposes.
The next step was to homogenize the data obtained from the questionnaires. The
questionnaires were classified into four groups: (1) University X Student Self-
Evaluations, (2) University Y Student Self-Evaluations, (3) University X Employer
Evaluations, and (4) University Y Employer Evaluations.
The questionnaires from University X consisted of statements that had to be rated by each
student/employer using a scale from 1 to 4, with 1 being the lowest value and 4 the highest
(excellent). The questionnaires from University Y had to be rated on a scale from 1 to 10,
however, with 1 being the lowest (worst) value and 10 the highest. In order to compare
all data, the answers from University Y were converted to a 1 to 4 scale. It is important
to remember that this difference in scales may have introduced bias into the analysis.
After eliminating the questionnaires that were not completed correctly or included blank
answers, we finished with 74 valid questionnaires for the University X Student Self-
Frederic Marimon and Ramon Bastida
70
Evaluations, 76 valid questionnaires for the University Y Student Self-Evaluations, 71
valid questionnaires for the University X Employer Evaluations, and 198 valid
questionnaires for the University Y Employer Evaluations.
3. Results
The t-test was used (via SPSS software) to search for significant differences between
means. This was first in order to compare the student self-assessments between the two
universities for each set of competences. Secondly it was used to assess the existence of
differences between students from both universities, according to the assessment made
by the employer. Again the three sets of competences were tested. In each case Levene’s
test was conducted to identify invariance and an associated t-value was found.
3.1. Student self-evaluations
Figure 1 shows the means obtained from the student self-evaluations, grouped according
to the different competence areas. Interpersonal Competences were aspects related to
teamwork and proper communication. The Instrumental Competences included topics
like problem solving, prioritization and work organization, the appropriate use of
technological resources and the application of theoretical knowledge to real case
scenarios, and the set of Professional Competences included aspects related to motivation
and initiative at work, as well as aspects related to effort and willingness to learn about
the company and its sector or industry.
Students from University X rated themselves significantly higher than students from
University Y. Although there is little difference (Table 2) between Instrumental and
Interpersonal Competences (0.34 and 0.31 respectively), it is interesting to notice that the
difference for professional competences jumps to 0.82.

Does an internship in Business Administration enhance professional competences?
71
Figure 1. Student Self-evaluation Means.
University
X
University
Y
Differences t-test
Professional Competences 3.67 2.84 0.82 9.13
Instrumental
Competences 3.56 3.21 0.34 4.31
Interpersonal
Competences 3.64 3.33 0.31 4.14
Table 2. Differences Between Student Self-Evaluations.
3.2. Employer self-evaluations
Figure 2 shows the average results when comparing the employer self-evaluations for
each student. Table 3 summarizes the significance level of the differences. Again, those
companies with interns studying at University X, rated the student competences with
higher values than those from University Y. The differences follow a similar pattern to
that obtained in the analysis of the student self-evaluations, however, in this case, the
discrepancies for Instrumental and Interpersonal Competences increased to 0.49 and 0.46
respectively. Professional Competences is again the area with the greatest gap (0.78
points).
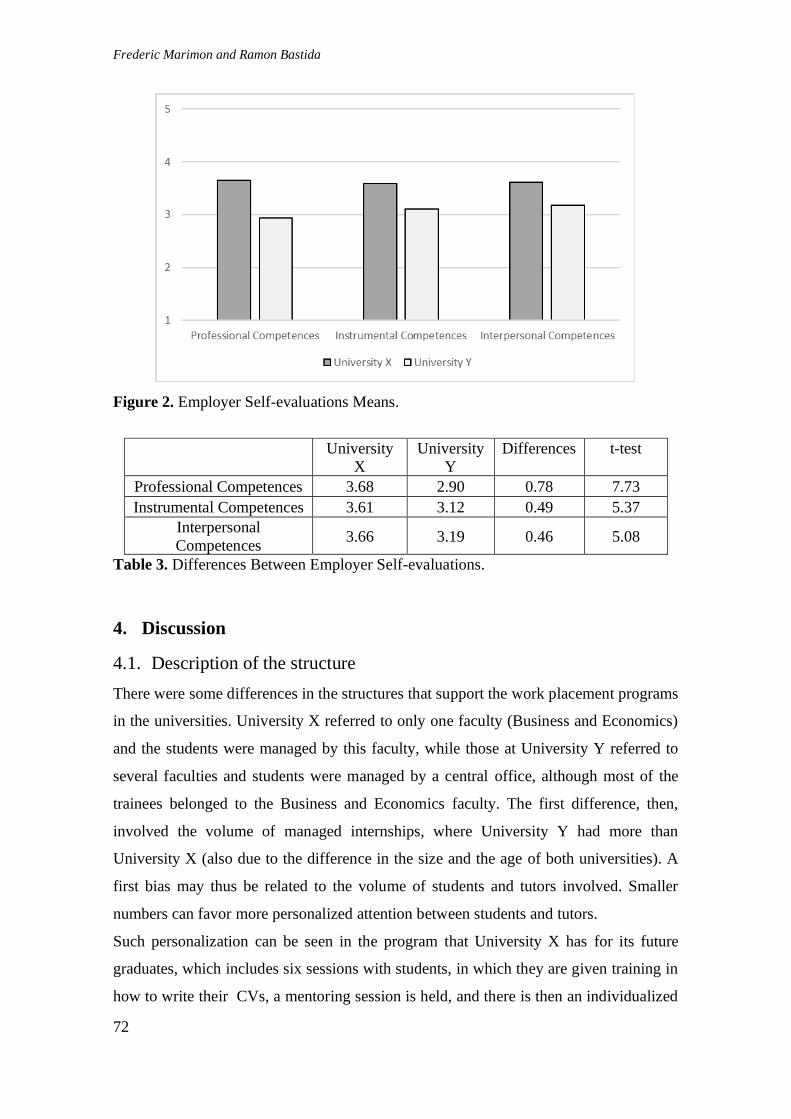
Frederic Marimon and Ramon Bastida
72
Figure 2. Employer Self-evaluations Means.
University
X
University
Y
Differences t-test
Professional Competences 3.68 2.90 0.78 7.73
Instrumental Competences 3.61 3.12 0.49 5.37
Interpersonal
Competences 3.66 3.19 0.46 5.08
Table 3. Differences Between Employer Self-evaluations.
4. Discussion
4.1. Description of the structure
There were some differences in the structures that support the work placement programs
in the universities. University X referred to only one faculty (Business and Economics)
and the students were managed by this faculty, while those at University Y referred to
several faculties and students were managed by a central office, although most of the
trainees belonged to the Business and Economics faculty. The first difference, then,
involved the volume of managed internships, where University Y had more than
University X (also due to the difference in the size and the age of both universities). A
first bias may thus be related to the volume of students and tutors involved. Smaller
numbers can favor more personalized attention between students and tutors.
Such personalization can be seen in the program that University X has for its future
graduates, which includes six sessions with students, in which they are given training in
how to write their CVs, a mentoring session is held, and there is then an individualized
Does an internship in Business Administration enhance professional competences?
73
meeting about their preferences and to provide advice. There is also a simulation session
on how to pass a personal interview, and another with instructions on how to manage a
professional career in the short and medium term. Finally, a session on personal skills in
professional practice is offered. University Y offers a wide range of courses and training
sessions for students who are finishing their studies. They are managed from a centralized
office by technicians with extensive experience in the entrance of students into the labor
market. The various faculties thus hold workshops for the development of professional
competences (personal branding, communication skills, assessment center etc.) are also
held, as well as colloquia and round tables with the participation of companies, and a
series of quick interviews or speed networking sessions. It is not clear whether all students
attend one or more of these training sessions, however, since there is no obligation to do
so. Both universities organize a University-Enterprise Day, in which different companies
are invited to introduce themselves to the faculty, and where students can leave their CVs
and speak with representatives of these companies.
4.2. Design and evaluation of the procedures
Overall procedures are a crucial duty of any organization. They ensure consistency and
help gain compliance. Correctly drafted procedures guide actions towards success. They
should thus be designed to appropriately document the steps required towards the final
purpose, detailing all the tasks to be performed. It is paramount that they are constantly
reviewed and updated. This requires to focus on the evaluation of procedures and how
improvements are expected to be incorporated. Nor should it be forgotten to collect
evidence that will allow the recommended improvements to be identified.
In this study it was important to establish a double follow-up, the purely professional,
linked to the company, and the academic, linked to the university, and to organize
everything around an academic coordinator, who would develop tasks in both areas, the
company area, mainly dealing with the establishment or renewal of agreements, the
validation of internship offers, the dissemination and assignment of students; and the
academic area, involving the designation of the tutor (who decides whether to ask the
students and the company tutor for an intermediate follow-up report), is responsible for
the evaluation of learning and student satisfaction, and assesses the internship period and
suggests modifications and improvements.

Frederic Marimon and Ramon Bastida
74
It is crucial that the documentary evidence collected during the process allows
improvements to be made, which should be clearly stated in the evaluation of the
procedure made by the management centers and decision-making regarding
improvements to be introduced.
Needless to say, the level of implementation of the procedures and the related tasks will
improve the performance of the organization, and it will certainly exert a positive
influence on the satisfaction of its members.
4.3. Satisfaction analysis
The second step was to analyze the satisfaction of the students and that of the company
tutors separately. In relation to student satisfaction, the Catalonian Agency for University
Quality and Excellence (AQU) offers information1 about the evaluation of internships in
relation to the Catalan University System (SUC), as a whole. The public data is grouped
by faculties, but there is no data for individual universities, because this information is
only offered in aggregate form. Business and Economics faculties are shown to obtain a
lower score for internships than the SUC average (5.8 / 10 compared to 6.6 / 10 of the
SUC). This could mean that economics and business students are more demanding of
external internships, since, as stated in the aforementioned report, 9 out of 10 companies
are satisfied that graduates are adequate for labor market needs (AQU, 2019, page 18).
The third step was to conduct interviews with company tutors to see if the deviation that
appears between the two universities can be explained based on a qualitative analysis.
Personal interviews were conducted with nine tutors (five from University Y and four
from University X). First, they were asked if they had experience with students from other
universities which allowed them to make comparisons, and most (except one tutor)
answered yes. The majority stated that results depended more on people rather than on
the university. Among the weaknesses highlighted by tutors from University Y, which do
not coincide with those indicated by those of University X, a lack of
motivation/commitment to the internships was notable. Three tutors connected to
University Y explained that internships are compulsory, and that this is detrimental to the
1 http://www.aqu.cat/doc/doc_51787985_1.pdf pag. 11. This report, published in 2019, shows the effect of
the incorporation of Bologna.

Does an internship in Business Administration enhance professional competences?
75
performance of the students, since they do not see them as either having potential for
learning or as a project towards their future work.
The tutors were also asked what the universities could do to improve the skills of their
future graduates. The tutors linked to University Y suggested (based on observed deficits)
improvements in the use of the Office package and languages, and emphasized the
expansion of relationships between the university and companies in order to establish a
productive dialogue. The tutors linked to University X suggested something similar,
although they placed less emphasis on expanding the university-company relationship, so
we infer that there is more fluidity in this relationship. This was confirmed by the answers
to the question about practices and procedures, and the relationship that companies have
with the technicians and tutors of the university. While the tutors at University X arrange
a set of meetings, email exchanges and telephone calls with university tutors, those at
University Y say that they have contact with the academic tutors when a direct link
between university and firms exists (i.e. they are a start-up company, or the firm’s tutor
is an associate professor).
Finally, the tutors were asked about the assessments that the companies made of their
work as tutors. Greater acknowledgement of the work of the tutors of University X is
revealed, which undoubtedly positively influences the assessment made by the tutors of
both universities.
5. Conclusions
This study identified the competences acquired by undergraduate students during their
internship and assessed the level of acquisition of these competences, by comparing the
student and company tutor evaluation reports, in two universities from the Catalan Higher
Education System.
The quality systems of both universities demonstrate that objectives are designed by the
management center; they also detail the procedure to be followed in order to develop a
work placement. We believe it is important that the procedure includes the idea of
continuous improvement, which facilitates the detection of problems and their solutions.
If this is true, then the tutors play a crucial role, and believe that a real exchange is taking
place with the university, and that their opinions count.
Three main conclusions can be drawn from the analysis of the student and tutor
achievement of competence. First, the type of university matters. In six out of six

Frederic Marimon and Ramon Bastida
76
analyses, University X performed significantly better than University Y. Regardless of
whether it was the student self-assessments or the employer opinions, the students from
University X scored higher in the three dimensions/sets under analysis. Further
investigation is needed to assess the main reasons for this. There are many possible
causes: student motivation, the degree of academic instructor involvement, employer
expectations, the resources invested in the internship program, the positions in which
students start working, the average student performance in their degrees, and so on.
Second, a consistency in the differences corresponding to the three types of competences
was detected. The gap between Professional Competences in the universities is twice as
big as the gap recorded for the other two competences, from both the student and
employer one point of view. The results also seem to suggest that the students at
University X work harder. Further research is also required to determine why students at
University X are more motivated.
Finally, there is a similar gap between Instrumental and Interpersonal competences, no
matter which group made the assessment (students or employers).

Does an internship in Business Administration enhance professional competences?
77
REFERENCES
Beard, Deborah F. 2007. “Assessment of Internship Experiences and Accounting Core
Competencies.” Accounting Education 16(2): 207–20. DOI:
10.1080/09639280701234625
González, J., Wagenaar, R. 2003. "Tuning Educational Structures in Europe. Final report
Phase one". Publicaciones de la Universidad de Deusto, Bilbao.
González, J., Wagenaar, R. 2005. "Tuning Educational Structures in Europe.
Universities’ contribution to the Bologna Process. Final report Phase two". Publicaciones
de la Universidad de Deusto, Bilbao.
Hergert, Michael. 2009. “Student Perceptions of The Value of Internships in Business
Education.” American Journal of Business Education 2(8): 9–14. DOI:
10.19030/ajbe.v2i8.4594
Milne, Lisa, and Julia Caldicott. 2016. “Exploring Differences in Industry Supervisors’
Ratings of Student Performance on WIL Placements and the Relative Importance of
Skills: Does Remuneration Matter?” Asia-Pacific Journal of Cooperative Education
17(2): 175–87.
Pagani, R. 2009. "Una introducción a Tuning Educational Structures in Europe. La
contribución de las universidades al proceso de Bolonia". Publicaciones de la Universidad
de Deusto, Bilbao.
Knouse, S. B. and Fontenot, G. 2008. “Benefits of the Business College Internship : A
Research Review.” Journal of Employment Counseling 45(June): 61–66. DOI:
10.1002/j.2161-1920.2008.tb00045.x
EAMR
EUROPEAN ACCOUNTING AND MANAGEMENT REVIEW
VOLUME 7, ISSUE 1, ARTICLE 5, 78-109, NOVEMBER 2020
The Role of Awareness, Learning and Knowledge in
Entrepreneurial and Firm Leadership Processes
Neus Vila Brunet
Department of Economics and Social Sciences
Universitat Internacional de Catalunya
Received October 2, 2020; accepted December 9, 2020.
ABSTRACT
Scholars in recent years have urged researchers to shift from their traditional focus on
specific characteristics of entrepreneurs and leaders toward research on entrepreneurship
and leadership processes. To do this, researchers must better understand entrepreneurs
and leaders’ cognitive processes involved in learning, awareness and knowledge
acquisition. In this paper systems thinking theory and system dynamics methodologies
are used in the development of a dynamic conceptual framework of learning
effectiveness. The research applies the conceptual framework to nine U.S. wineries and
identifies the consequences of varying levels of awareness and types of knowledge, as
well as alternative learning processes on entrepreneurship and leadership effectiveness.
Results indicate that one’s level of awareness and knowledge are key factors in enhancing
one’s ability to learn. The types of awareness and knowledge identified most critical for
enhancing entrepreneurship and leadership effectiveness are: (a) awareness of one’s
mental models and learning patterns, (b) systemic knowledge and (c) business related
knowledge. Results also identify that there is a positive relationship between the level of
entrepreneurs’ intangible key resources and the scope of the learning process undergone.
The higher the level of the intangible resources the entrepreneur moves from conducting
single loop learning to double loop learning.
KEYWORDS
Management, Learning, Knowledge, Awareness, Capabilities.
The Role of Awareness, Learning and Knowledge in Entrepreneurial and Firm Leadership Processes
79
1. Introduction
Currently, there is a growing societal demand for entrepreneurship and leadership
processes that can effectively direct businesses practices under a more holistic approach
that considers business relations with society and with its environment (Porter, 2011;
Bocken et al. 2014; Joice and Paquin 2016). This demand requires understanding the
whole system that encompasses leadership and entrepreneurship from a dynamic
perspective (Senge et al., 2008; Leih and Teece 2016).
The substantial growth in entrepreneurship and leadership in the U.S. wine sector during
the last decade goes hand in hand with the double number of U.S. wineries since 1995
and the increasing competition domestically and internationally (Silverman, 2004;
Taplin, 2006; Alonso et al. 2013). An interesting result of this change in the U.S. wine
sector is the success of some wineries to integrate the social and environmental
dimensions in their business goals (Lorenzo et al. 2018). As a result, the U.S. wine sector
provides a good scenario for further understanding which tangible and intangible
resources and learning capabilities enhance entrepreneurship and leadership effectiveness
in satisfying consumer needs and to identify what is the relative importance of each
resource and capability.
Given the current need to expand our understanding of entrepreneurship and leadership
processes under a systemic approach the present paper answers the following three
questions under a systems thinking and system dynamics framework: (a) what are the key
intangible resources that enhance entrepreneurship and leadership effectiveness to satisfy
consumer needs?, (b) which learning capabilities are associated with each winery, and
how these capabilities relate to the primary intangible resources that enhance
entrepreneurship and leadership effectiveness to satisfy consumer needs?, and (c) how
wineries’ intangible resources and capabilities vary based on winery’s size and activities
undertaken?.
We proceed to review the literature related to the four questions posited. The first part of
the literature review focuses on the topic of entrepreneurship and leadership and what
makes these processes successful. After identifying the primary intangible resources that
enhance entrepreneurship and leadership effectiveness to satisfy consumer needs the
literature on learning processes is revised in order to identify the relationships between
the key intangible resources and three types of learning capabilities. Afterwards, the
literature that explores businesses size and activities of operation and the acquisition and

Neus Vila Brunet
80
management of intangible resources is revised. Finally, the systems thinking literature on
system archetypes is summarized.
The propositions explored in this study are posited in the concluding part of this section.
1.1. Entrepreneurship and Leadership
Literature on entrepreneurship and what makes entrepreneurs successful has grown
substantially during the last two decades (Carland, 2002; Freytag & Thurik, 2010; Dimov,
2011; Ayala and Manzano, 2014). Initially research focused on identifying the shared
personality characteristics among entrepreneurs that make them willing to start new
businesses or other activities (Casson, 1982; Brockhaus & Horwitz, 1986; Blanchflower
& Oswald, 1990). However, researchers noticed that these variables could not by
themselves explain the various successful entrepreneurial practices and their dynamics
since they just focused on specific personal traits and events and not on the underlying
cognitive processes and outside factors such as society, culture and physical resources
constraints (Mitchell, 2002; Welter, 2011; Wiklund, 2011). As a result, scholars and
practitioners are now focusing more on studying the internal cognitive processes involved
during entrepreneurial learning, and the impacts that the economic system, institutions
and culture have on entrepreneurship success (Ashar, & Lane-Maher, 2004; Zahra, 2006;
Weick, & Putnam, 2006; Holcomb, 2009; Grégoire, 2011; E St-Jean and Audet, 2012).
Literature on leadership has followed a similar trajectory as the research done on the
entrepreneurship field. Over the first decades leadership research developed several
classifications of leaders based on the qualities that the leader possesses and the leadership
tasks for which the person is responsible. The main leadership theories developed in
chronologic order are: (a) “great man” leadership theory (Carlyle, 1841); (b) trait
leadership theory (Galton, 1869), (c) contingency and situational leadership theory
(Hersey, 1985); (d) transactional leadership theory (Bass, 1985); (e) transformational
leadership theory (Burns, 1998); (f) horizontal or collaborative leadership theory
(Chrislip and Larson, 1994); and (g) ethical leadership theory (Mayer et al. 2009). Van
Wart (2013) presents a succinct literature review of the abovementioned leadership
theories. As a result, research has moved toward further understanding how to manage
people instead of tasks and the role of cognition and group factors throughout the
leadership process.

The Role of Awareness, Learning and Knowledge in Entrepreneurial and Firm Leadership Processes
81
Researchers have found that some of the key aspects that enhance the evolution of one’s
cognition relate to one’s ability to sense, ability to be present, ability to reflect, and ability
to understand systems (Senge 1993; Teece 1994; Scharmer 2005; Scharmer and Kaeufer
2013; Vago et al. 2018). In that direction, Peter Senge in the Fifth Discipline book (1991)
presents what it is called the “personal mastery discipline” as one of the five disciplines
for successful leadership and entrepreneurship. The personal mastery discipline is the
discipline of aspiration that enhances the creative process that moves people from their
current reality to their personal vision. Senge et al. indicate that people who develop the
capability to sustain a creative tension between their current reality and their vision are
able to achieve their vision in a more serene way. Hence, personal mastery can be
associated with characteristics such as self-knowledge, self-control, self-confidence and
innovative. Psychology and neuroscience research suggest that people that develop
clearer pictures of what they envision are more able to identify the means towards them
(Johnson-Laird 1983; Denzau 1994; Hill and Levenhagen 1995). Weiner notes that
aspiration is a fundamental driver for recognizing opportunities to achieve one’s vision
(1972). Psychology research also indicates that people who develop the capacity to hold
inner dialogue are less reactive and experience higher mental clarity that allows them to
achieve their goals more effectively (Fonagy and Target 1997; Siegel 2007; Kong, 2017).
As mentioned above part of the evolution of one’s cognition goes hand in hand with the
ability to understand systems as a result of the globalization process and the resulting
increasing interdependence among people. Developing such a cognitive process is
paramount nowadays for the success of companies so that they can properly understand
the consequences of changes in their supply chain and markets where they operate.
Successful leaders and entrepreneurs are building new partnerships that enhance their
sustainable competitive advantage by including the social and environmental systems into
the business framework (Senge 2008; Porter 2011; Scharmer and Kaeufer 2013). Two
examples of these new partnerships and ways of producing and delivering are Whole
Foods Market and Nestlé. Whole Foods Market envisions people and societal well-being
as their primary goal (Porter and Kramer 2006), and Nestlé collaborates with NGOs in
South America in order to ensure the well-being of the communities and environment
where they operate (Brugmann and Prahalad 2007).
As the recent research of entrepreneurship and leadership is suggesting, in order to fully
understand what makes entrepreneurship and leadership successful we need to consider

Neus Vila Brunet
82
also how entrepreneurs and leaders understand their company, group, society and their
surroundings. Entrepreneurship research has noticed that on average just a small
percentage of entrepreneurs develop the vision, plan their innovation, and execute all the
stages necessary for its full materialization (Stevenson and Jarillo 1990; Zahra 2006).
Normally, entrepreneurs focus on the core innovation of the new output and partner with
other people in order to develop the other ingredients necessary for the success of the new
product or service (Meyer 2002; Sinisammal et al. 2016). When entrepreneurs are not
able to fully transform the inspiration of their creation into a business vision the success
rate diminishes. Researchers have complemented this argument by identifying the
frequently low managerial skills that entrepreneurs possess and how this constrains the
materialization and expansion of their ideas (Hitt 2002; Ikupolati et al. 2017)
Summing up, the recent literature on entrepreneurship and leadership points out that the
intangible source of the success of these processes depends on the cognitive processes
that entrepreneurs and leaders undertake when dealing with themselves and their
surroundings. Furthermore, evolutionary cognition literature indicates the emergence of
some capabilities and the globalization process demands the acquisition of systemic
knowledge. As a result, proposition 1 posits:
The four primary intangible resources that enhance entrepreneurship and leadership
effectiveness to satisfy consumer needs are: a) basic managerial knowledge, b) project
clear vision, c) systemic knowledge, and d) personal mastery (personal growth)1
1.2. Learning Capabilities
In order to approach entrepreneurs and leaders learning capabilities from a system
dynamics approach three learning theories are examined that distinguish the learning
process based on the structural scope chosen by the individual. The three learning theories
are: a) single loop learning, b) double-loop learning, and c) theory U.
Argyris and Schön (1978) defined the process of learning as the “detection and correction
of error”. In system dynamics jargon this process is named “anchoring and adjustment”.
It means that people have a goal, target that they want to achieve, and the learning process
focuses on reducing the gap between the goal and the current situation.
1 Personal mastery as defined by Peter Senge et al. (1991) relates to one’s level of self-confidence, self-
awareness, and ability to manage stress by “continually clarifying and deepening our personal vision, of
focusing our energies, of developing patience, and of seeing reality objectively”.

The Role of Awareness, Learning and Knowledge in Entrepreneurial and Firm Leadership Processes
83
Argyris and Schön (1978) described the single loop learning and the double loop learning
processes in the context of organizational learning in the following way: “When the error
detected and corrected permits the organization to carry on its present policies or achieve
its presents objectives, then that error-and-correction process is single-loop learning.
Single-loop learning is like a thermostat that learns when it is too hot or too cold and turns
the heat on or off. The thermostat can perform this task because it can receive information
(the temperature of the room) and take corrective action. Double-loop learning occurs
when error is detected and corrected in ways that involve the modification of an
organization’s underlying norms, policies and objectives.”
Hence, both learning processes are aimed to reduce the gap between the desired outcome
and the current situation by thinking and doing. What distinguishes both learning
processes is the scope of attention and performance. The scope of single loop learning
relies on the correction of existing practices that are not working properly. The scope of
the learning process does not question the existing macro organizational drivers as the
company vision, goals, and main strategies, but rather focuses on micro organizational
practices. As a result, proposition two and three identify that the level of the key intangible
resources that enhance entrepreneurship and leadership effectiveness identified in
proposition one varies under each learning process. Proposition two posits:
The level of the four primary intangible resources identified that enhance
entrepreneurship and leadership effectiveness to satisfy consumer needs under the single
loop learning process in a range of low to high is: a) business managerial knowledge –
low; b) systemic thinking – low; c) clear business/project vision – low; and d) personal
mastery – medium.
Proposition three posits:
The level of the four primary intangible resources identified that enhance
entrepreneurship and leadership effectiveness to satisfy consumer needs under the single
loop learning process in a range of low to high is: a) business managerial knowledge –
medium; b) systemic thinking – medium; c) clear business/project vision – high; and d)
personal mastery – medium.
Scharmer (2005) presents Theory U as a learning process that involves sensing and
presence before the thinking and doing stage takes place. As a result, the author uses the
term “presencing” (sensing + presence) to expose that deeper scopes of learning can take
place when people “stop and listen to others and to what life calls you to do… allow the

Neus Vila Brunet
84
inner knowing to emerge” (2005). Hence, the practice of the Theory U learning process
requires the integration of the so called “right-brain and left-brain” capabilities and its
scope encompasses micro and macro business practices. As Scharmer points out (2005),
what differ from one type of learning to the other is the depth of the awareness about the
forces that shape the current reality and the consequent source of action. Hence, with the
development of our consciousness deeper learning occurs by sensing, witnessing and
realizing. After this initial deeper learning process, thinking and doing finishes the details
and integration process (Scharmer 2005). The power of deeper levels of learning is that
it increases individuals' awareness of the larger whole -both as it is and as it is evolving.
Hence, the development of the capability to undergo theory U learning process leads to
entrepreneurial actions that increasingly serve the emerging whole and the satisfaction of
consumer needs is enhanced.
Proposition four posits:
The level of the four primary intangible resources identified that enhance
entrepreneurship and leadership effectiveness to satisfy consumer needs under the single
loop learning process in a range of low to high is: a) business managerial knowledge –
medium; b) systemic thinking – high; c) clear business/project vision – high; and d)
personal mastery – high.
1.3. Businesses Intangible Resources by Size
One of the major soft internal challenges faced by small and medium wineries is the
background of the founder or manager (Aggelogiannopoulos 2007; Charters, Clark-
Murphy et al. 2008) and the ability to develop adequate managerial skills (Dillon 1992).
Dillon et al. study indicates that adequate planning and management are key determinants
of small and medium winery’s success or failure. As the authors point out “economically
unsuccessful wineries are not managed by individuals who plan to fail, but by managers
who often fail to plan.” It is normally the case that wineries are operated by a grape grower
that has vertically integrate downstream into winemaking (Chaddad 2013). When this is
the case, and when wineries are small, there is a major need to ensure that the new winery
owners acquire the necessary managerial knowledge to ensure the winery’s sustainability.
Poor time management and poor financial management tend to bring these wineries to
failure (Morris 2008; Dobie 2009). White (2010) mentions that it is necessary to think

The Role of Awareness, Learning and Knowledge in Entrepreneurial and Firm Leadership Processes
85
first about who is the ideal customer (the target market), before deciding about the
produce, price, promotion and distribution strategies, a step that is frequently not taken.
Proposition five posits:
Small wineries’ entrepreneurs and leaders have a relative lower level of winery
managerial knowledge and systemic knowledge.
1.4. Entrepreneur Personal Mastery and Activities Engaged
Peter Senge in the Fifth Discipline (1991) presents what it is called the “personal mastery
discipline.” The personal mastery discipline is the discipline of aspiration that enhances
the creative process that moves people from their current reality to their personal vision.
Senge et al. indicate that people who develop the capability to sustain a creative tension
between their current reality and their vision are able to achieve their vision in a more
serene way. Hence, personal mastery can be associated with characteristics such as self-
knowledge, self-control, self-confidence and innovative. Psychology and neuroscience
research suggest that people that develop clearer pictures of what they envision are more
able to identify the means towards them (Johnson-Laird 1983; Denzau 1994; Hill and
Levenhagen 1995). Weiner notes that aspiration is a fundamental driver for recognizing
opportunities to achieve one’s vision (1972)
Recent research indicates that the key for sustained competitive advantage is to expand
businesses mission beyond the creation of profit for shareholders to the creation of what
is being called “shared value” (Wilber 2001; Porter 2011; Scharmer and Kaeufer 2013).
Shared value is produced when the company’s motivation is to provide something
beneficial for people, animals, beings or the ecosystems, shifting the current standards
towards the notion of serving the systems that the company is part of. The idea is to have
the intention and create value not just for the company’s stakeholders and direct
consumers but also for the other systems that the company is part of (Senge 2008; Kramer
2011). As Porter argued (2011), it is the shift from seeing that if businesses increase profit
it is good for society to seeing that what is good for society is good for businesses. One
of the underlying principles is that by giving more at all levels, the company receives
more at all levels as well. Employees feel more fulfilled, and some consumers and
investors feel better directing their money to companies that take care of the bigger system
and genuinely care about their customers (Friedman and Miles 2001; Sen and
Bhattacharya 2001; Vargo and Lusch 2008)

Neus Vila Brunet
86
Proposition 6 posits:
Entrepreneurs with higher level of personal growth (self-confidence, stress management,
self-awareness) diversify winery activities to satisfy social and environmental consumer
preferences.
Section two introduces the data sources and presents the research methodology. Section
three exposes the results and section four presents the main discussion. Finally, section
five summarizes the conclusions.
2. Methodology and Data
The present section describes the methods used to study the entrepreneurship and
leadership processes in nine U.S. wineries including the data collected and its analysis.
2.1. Systems thinking
There are several methods typically used to study complex systems but systems thinking
is the most suitable for the present study because it provides the tools to answer the
systemic questions without having to run a simulation model. The particular systems
thinking tools used to study the nine wineries are related with the construction of causal
loop diagrams (CLD).
2.1.1. Causal loop diagrams and systemic features of wineries
Causal loop diagrams are a central tool used in system thinking. CLD summarize the
direction and sequence of key relationships involved in the system under study. Systems
thinking leads researchers through a series of steps that produce the CLD (Sterman, 2010).
The main steps involved in developing meaningful causal loop diagrams are: (1) to define
the problem or challenge, (2) to name the main variables that intervene in the problem,
(3) to draw the reference mode2 of the main variables over time, and (4) to develop
dynamic hypotheses3 that explain the shape of the reference modes identified.
The main components of causal loop diagrams are the variables studied and the
relationships between the variables studied. The relationships can be either positive, self-
2 A reference mode is a pattern of dynamic behavior among system variables due to interrelationships and
feedback loops among the variables.
3 A dynamic hypothesis is a tentative explanation of how a system structure leads to observed dynamic
behavior.

The Role of Awareness, Learning and Knowledge in Entrepreneurial and Firm Leadership Processes
87
reinforcing loops that generate growth and amplify deviations, or negative, self-balancing
loops that bring stability to the system. A third component of a CLD is delays that indicate
the elapsed time between change in the causal variable and its effect on the influenced
variable.
An example of a causal loop diagram for winery C. Winery C, when faced with a difficult
financial situation, decided to cut salaries in order to bring the firm to a break-even
situation. This strategy is represented by the negative –-balancing feedback loop on the
left, which indicates a symptomatic solution. A year after, winery C decided to
professionalize the winery and hired a professional financial manager to handle the short
run and long run winery decisions. The negative balancing feedback loop with a delay on
the right reflects this fundamental solution.
Figure 1. Causal loop diagram example.
2.2. System Dynamics
In order to elucidate the behavior generated by the systemic features identified in the
causal loop diagrams the stocks and flows variables must be distinguished. Stock
variables are those that can accumulate units over time. Flow variables increase or reduce
the level of units in stock variables over time. For instance, we have a variable that
measures the stock of systemic knowledge (amount of systemic knowledge that we have
accumulated over time) assuming a range from zero to a hundred, and we have another
variable that measures how much systemic knowledge the individual has gained during
the last year. The name of the variable that measures the amount of systemic knowledge
that the individual has gained during the last year can be “systemic knowledge gained”
and it measures the inflow of systemic knowledge. On the other hand, if during last year
the individual has forgotten some systemic knowledge then we have an outflow of
systemic knowledge. This variable can be called “systemic knowledge forgotten”. The
surveys developed distinguish variables in terms of stocks and flows.
Debt
Hire ProfessionalFinancial Manager,
ProfesionalizeSalaries Cut
+
-+
-
- -
FundamentalSolution
SymptomaticSolution

Neus Vila Brunet
88
The rate of inflow or outflow is modeled with feedbacks that go from stock variables to
flow variables and converters that directly affect the rate of flow. Finally, the system is
modeled with variables that introduce delays in the process.
2.3. Sources of information
The data gathered are both, quantitative and qualitative in nature and come from four
sources: (a) documentation, (b) observation, (c) interviews, and (d) surveys.
E-mails were sent to all wineries in Missouri that had websites – sixty out of one hundred
and twelve—inviting them to participate in the research. Two additional wineries, one
form Virginia and another from Maine were invited to participate in the study to provide
a contrast to Missouri’s system of wine distribution.
Seven Missouri wineries expressed an interest in participating in the study. Face to face
interviews with these wineries took place during the months of March, April and May of
2013. The nine wineries participating in the study were categorized into small wineries
(less than 10,000 cases per year), medium wineries (between 10,000 cases and 99,999
cases per year), and large wineries (equal or more than 100,000 cases per year) as the
study of Dillon, 1992 et al. suggest.
2.3.1. Face-to-face interviews and methods
Two methods were combined to gather the first set of data. These were qualitative
interviews and the observation method. Given the nature of the face-to-face interviews
conducted, mainly with winery managers and owners, a combination of the general
interview guide approach and the standardized open-ended interview approach were
implemented during the qualitative interview (Patton 1990). The general interview guide
approach involves outlining a set of issues that are to be explored with the interviewee
before the interview begins. The guide serves as a basic checklist during the interview to
make sure that all relevant topics are covered. Under this approach as Patton mentions,
“the interviewee remains free to build a conversation within a particular subject area, to
word questions spontaneously, and to establish a conversational style but with the focus
on a particular subject that has been predetermined” (1990). The standardized open-ended
interview approach consists of a set of questions carefully worded and arranged. This
approach is used when it is important to minimize variation in the questions posed to
interviewees.

The Role of Awareness, Learning and Knowledge in Entrepreneurial and Firm Leadership Processes
89
The rationale behind combining the general interview guide approach and the
standardized open-ended interview approach is that the first allows the flexibility to
explore specific areas that come into the conversation while having a clear direction about
the key points that need to be elucidated. Having this flexibility is crucial for achieving
the process feedback, the connection between interviewer and interviewee that allows
sincere responses and a deeper understanding of the case studied (Patton 2005). The
combination of these approaches also helps the development of probes and follow-up
questions that allow the triangulation of observations that ensures the accuracy of the
answers gathered. Also, having some questions carefully worded and being able to posit
them at the appropriate time allows the comparison among case studies. This is necessary
because as research has indicated (Creswell 2012), how a question is worded and asked
affects how the interviewee responds. Finally, this approach to data collection allows the
sequence of questions to move from less-controversial questions related to their
background, present behaviors, activities and experiences, to more opinions and feelings
about present and past situations, and to finally attitudes towards the future. This sequence
is recommended when conducting qualitative interviewing (Patton 1990).
The observational methods applied were both as participant and onlooker, since in some
occasions I walked with the winery manager to each part of the winery and I was invited
to try some technologies or take part of some production processes, and in some other
occasions I just observed while waiting. In every case the winery managers knew that I
was there and that I was collecting data for the present research (the overt observational
method). Researchers have posited some concerns about the validity of observational data
since applying an overt methodology has an impact on what is being observed, since
people may behave differently when they know that are being observed. However,
researchers have also claimed the ethical issues involved when conducting covert
observations, naming them “the debate over secrecy” (Patton 2005).
Observational research allows the researcher to capture information that winery managers
are not aware of given their daily routines and greater familiarity with their business. It is
important to acknowledge that the data gathered from overt observation may not fully
reflect the standard winery behavior since people were aware that they were being
observed. Furthermore, the observational data reported are affected by the perspective of
the observer that at the same time is being affected by its environment. The duration of
the interview and observational processes was between 2 hours and 5 hours, the time

Neus Vila Brunet
90
required to answer the interview questions and make the necessary observations.
Researchers evaluate the quality of observational reports by the extent to which the report
permits the reader to enter into and understand the situation described (Patton 1990).
All the conversations took place during at each winery and are recorded. This is crucial
when conducting qualitative research since what matters the most is how interviewees
phrase their responses and how they convey them (Patton 2005). Recording all the
conversations allows the researcher to not worry about capturing the specific words
expressed by the winery manager and to be able to take notes about the specific points
that need to be emphasized. Hence, in this type of research the mechanics of gathering
data require complete recording of all the conversations with each winery manager,
specific notes taken during the face-to-face interviews and field observations, as well as
the acquisition of certain documents that were requested from winery managers (mainly
financial documents).
The questionnaire items used in the face-to-face interview are either open ended questions
or questions requiring answers in the form of a Likert scale of five points (Likert 1932).
One point represents a 'low degree' and five points represents a 'high degree'. The
information gathered during the face-to-face interview covers the following topics: (a)
background information; (b) winery goals – specificity, alignment, diversification; (c)
winery performance – production, sales, costs and revenues; (d) winery inputs – grapes
source, employees types; (e) winery specific assets; (f) winery’s strategic means –
imitability level, relevance level; (g) winery’s values – fairness, truth, altruism; (h)
employee and manager characteristics – well-being level, winery identification level, ; (i)
employee management – learning enhancement, knowledge level, relationships quality
and uniqueness; rewards system; (j) relationships with suppliers and distributors – quality
and uniqueness; (k) organizational structure – fit, adaptation level; (l) intangible resources
management – relevance level, imitability level, (m) main external challenges, (n) main
internal challenges, (o) main external opportunities, and (p) main internal opportunities.
Finally, the specific learning processes that the research focuses on are: (a) winery
managerial knowledge; (b) personal mastery knowledge; (c) group knowledge; and (d)
systemic knowledge.
The specific questions considered in the face-to-face interview can be found together with
the consent form are reported in appendix 2.
The Role of Awareness, Learning and Knowledge in Entrepreneurial and Firm Leadership Processes
91
After gathering the first set of winery information (face-to-face interview recordings,
complementary documents and observational notes) it was coded and introduced into an
excel document. The questions from the face-to-face interview that are based on a five-
point Likert scale were converted into a scale of 0 or 100 points. The relevant information
from the open-ended questions was coded based on the ranges observed from all the
answers and relevant sentences and paragraphs are written down and used as a
complementary proof to the results presented.
Once the data are organized and allocated certain codes, inductive analysis is used in
order to identify patterns, to label themes and to develop category systems, insights and
new understandings. System thinking theory and the system dynamics approach is used
in order to elucidate generic structures from each winery and identify if there is any
relationship between the patterns observed and the systems thinking archetypes.
The questionnaire can be improved by introducing additional questions similar to those
above, to ensure the consistency of the answers. This strategy is sometimes introduced
when researchers want to estimate the level of answers deviation related to key questions.
In the present study the interviewer double checked interviewees’ explanations and
reasoning by positing extra questions not included in the questionnaire when necessary.
However, it would be beneficial to develop the extra validation questions before the
interview takes place. Finally, the coding process from the open-ended questions was
conducted by the present author. A second researcher that also coded the open-ended
questions would enhance the validity of the results presented in the aggregated results
tables.
2.3.2. Online survey questions and methods
Following preliminary analysis of the face-to-face interview data, an online survey with
questions designed to gather complementary data using a five-points Likert scale was
distributed to all the nine participants via e-mail. These additional questions related to the
wineries’ strategies related to: (a) their desired production and sales, (b) their desired
relationships among personnel, (c) their desired relationships with customers, and (d)
their desired relationships with government officials. In particular, the questions were
designed to identify the limiting factors that are blocking the success of each strategy,
together with their evolution over time, and the main processes that have alleviated these
limiting factors and affected their evolution over time. The specific questions related to

Neus Vila Brunet
92
managers and personnel traits were designed to determine: (a) the leadership level, (b)
the leadership type, (c) the level of risk aversion, and (d) the level of uncertainty borne.
Some questions were open-ended, and some involved a five-point Likert scale.
The method used to code and analyze the data from the online survey is the same as the
method used to code and analyze the data from the face-to-face survey explained above.
The online survey questionnaire can be found in appendix three. The specific questions
considered the online survey can be found in appendix 2.
3. Results
The present study addresses the four questions posited by testing the validation of seven
propositions and providing complementary information from the face-to-face interviews
and online survey. In order to summarize the relationship among the four questions
posited, the propositions and the data collected table 1 and 2 are presented.
Research Questions Propositions
1. What are the key intangible
resources (stocks) that enhance
entrepreneurship and leadership
effectiveness in order to satisfy
consumer needs?
1. The four primary intangible resources that
enhance entrepreneurship and leadership
effectiveness to satisfy consumer needs are: a)
winery related knowledge, b) systemic
knowledge, c) business clear vision and d)
personal growth level
2. What learning capabilities are
associated with each winery, and
how these capabilities relate to the
four primary intangible resources
identified that enhance
entrepreneurship and leadership
effectiveness to satisfy consumer
needs?
2. The level of the four primary intangible
resources identified that enhance entrepreneurship
and leadership effectiveness to satisfy consumer
needs under the single loop learning process in a
range of low to high is: a) business managerial
knowledge – low; b) systemic thinking – low; c)
clear business/project vision – low; and d)
personal mastery – medium.
3. The level of the four primary intangible
resources identified that enhance entrepreneurship
and leadership effectiveness to satisfy consumer
needs under the double loop learning process in a
range of low to high is: a) business managerial
knowledge – medium; b) systemic thinking –
medium; c) clear business/project vision – high;
and d) personal mastery – medium.

The Role of Awareness, Learning and Knowledge in Entrepreneurial and Firm Leadership Processes
93
4. The level of the four primary intangible
resources identified that enhance entrepreneurship
and leadership effectiveness to satisfy consumer
needs under Theory U learning process in a range
of low to high is: a) business managerial
knowledge – medium; b) systemic thinking – high;
c) clear business/project vision – high; and d)
personal mastery – high.
3. How do wineries' intangible
resources and capabilities vary
based on winery's size and
activities undertaken?
5. Small wineries’ entrepreneurs and leaders have
a relative lower level of winery managerial
knowledge and systemic knowledge
6. Entrepreneurs with higher level of personal
growth (self-confidence, stress management, self-
awareness) diversify winery activities to satisfy
social and environmental consumer preferences.
Table 1. Research Questions and Propositions Correspondence.
Propositions
Survey Questions Number
that relate to the
Proposition
1. The four primary intangible resources that enhance
entrepreneurship and leadership effectiveness to satisfy
consumer needs are: a) winery related knowledge, b)
systemic knowledge, c) business clear vision and d)
personal growth level
Q.13, Q.14, Q.21, Q.22,
Q.29, Q.30, Q.32, Q.34,
Q.35, Q.37, Q.53, Q.66,
(Face-to-face survey);
Q.39, Q.40 (Online
survey)
2. The level of the four primary intangible resources
identified that enhance entrepreneurship and leadership
effectiveness to satisfy consumer needs under the single
loop learning process in a range of low to high is: a)
business managerial knowledge – low; b) systemic
thinking – low; c) clear business/project vision – low; and
d) personal mastery – medium.
Q.21, Q.29, Q.35 (Face-
to-face survey); Q.39,
Q.40 (Online survey)
3. The level of the four primary intangible resources
identified that enhance entrepreneurship and leadership
effectiveness to satisfy consumer needs under the single
loop learning process in a range of low to high is: a)
business managerial knowledge – medium; b) systemic
thinking – medium; c) clear business/project vision –
high; and d) personal mastery – medium.
Q.21, Q.29, Q.35 (Face-
to-face survey); Q.39,
Q.40 (Online survey)
4. The level of the four primary intangible resources
identified that enhance entrepreneurship and leadership
effectiveness to satisfy consumer needs under the single
loop learning process in a range of low to high is: a)
business managerial knowledge – medium; b) systemic Q.21, Q.29, Q.35 (Face-
to-face survey); Q.39,
Q.40 (Online survey)
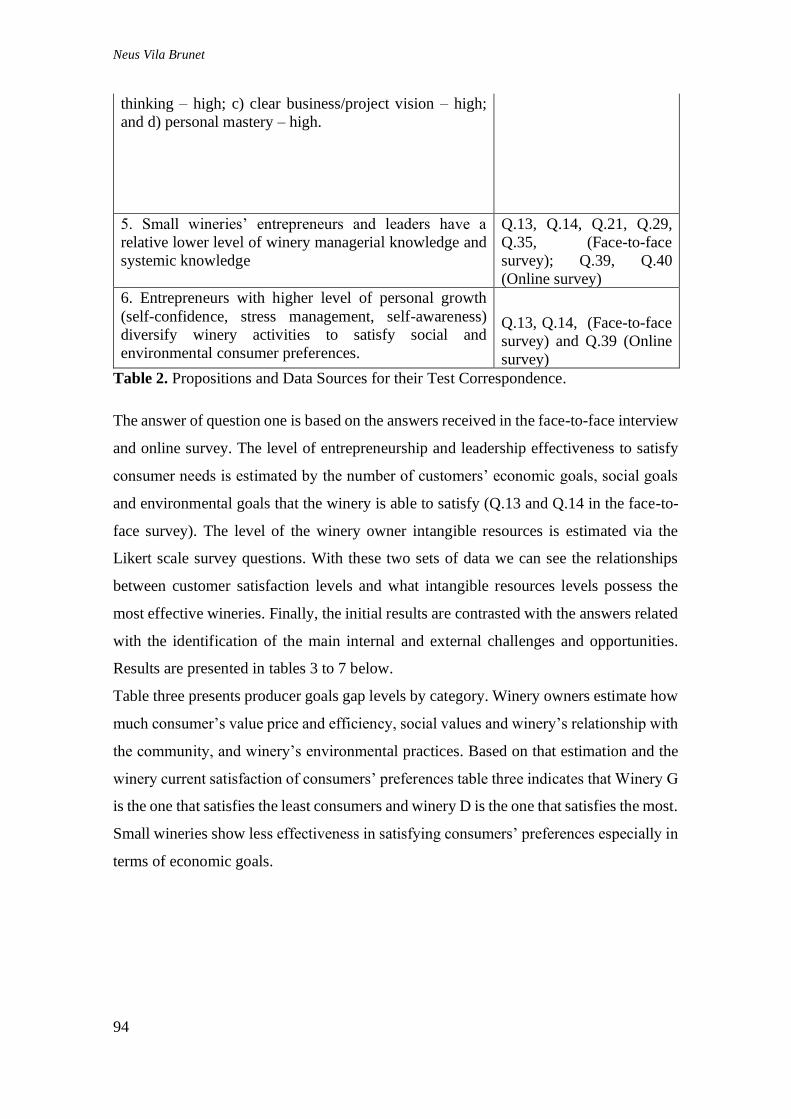
Neus Vila Brunet
94
thinking – high; c) clear business/project vision – high;
and d) personal mastery – high.
5. Small wineries’ entrepreneurs and leaders have a
relative lower level of winery managerial knowledge and
systemic knowledge
Q.13, Q.14, Q.21, Q.29,
Q.35, (Face-to-face
survey); Q.39, Q.40
(Online survey)
6. Entrepreneurs with higher level of personal growth
(self-confidence, stress management, self-awareness)
diversify winery activities to satisfy social and
environmental consumer preferences.
Q.13, Q.14, (Face-to-face
survey) and Q.39 (Online
survey)
Table 2. Propositions and Data Sources for their Test Correspondence.
The answer of question one is based on the answers received in the face-to-face interview
and online survey. The level of entrepreneurship and leadership effectiveness to satisfy
consumer needs is estimated by the number of customers’ economic goals, social goals
and environmental goals that the winery is able to satisfy (Q.13 and Q.14 in the face-to-
face survey). The level of the winery owner intangible resources is estimated via the
Likert scale survey questions. With these two sets of data we can see the relationships
between customer satisfaction levels and what intangible resources levels possess the
most effective wineries. Finally, the initial results are contrasted with the answers related
with the identification of the main internal and external challenges and opportunities.
Results are presented in tables 3 to 7 below.
Table three presents producer goals gap levels by category. Winery owners estimate how
much consumer’s value price and efficiency, social values and winery’s relationship with
the community, and winery’s environmental practices. Based on that estimation and the
winery current satisfaction of consumers’ preferences table three indicates that Winery G
is the one that satisfies the least consumers and winery D is the one that satisfies the most.
Small wineries show less effectiveness in satisfying consumers’ preferences especially in
terms of economic goals.
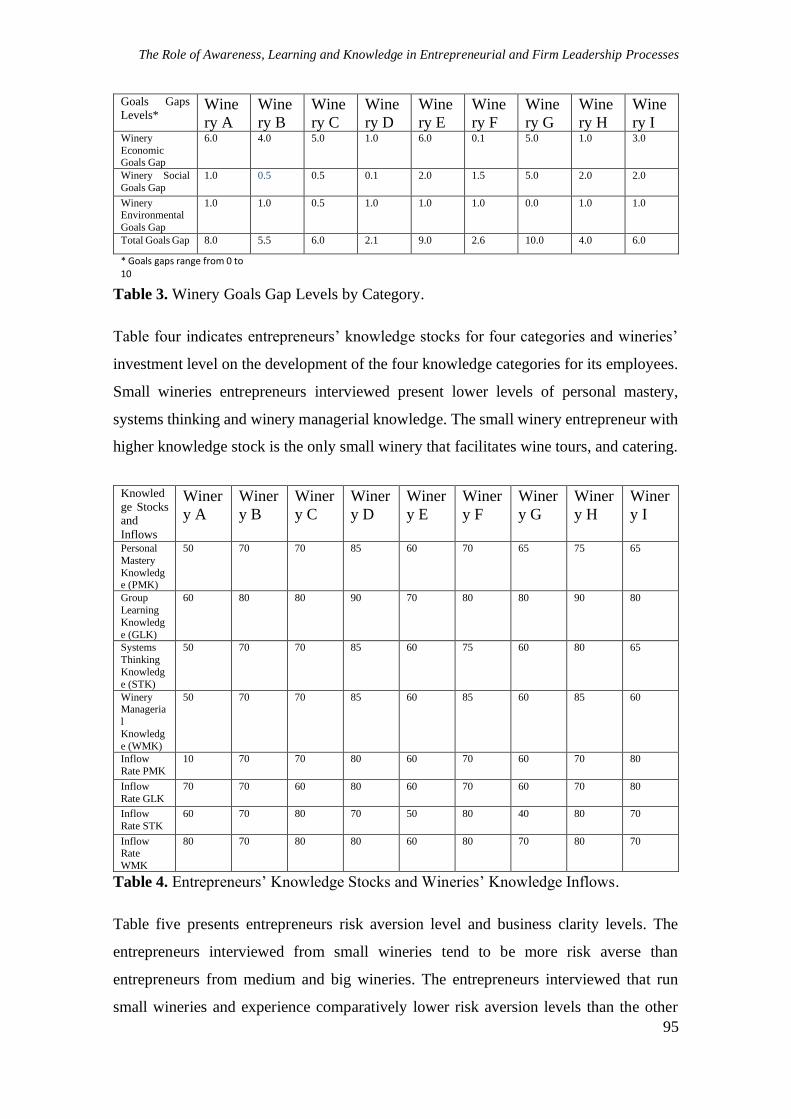
The Role of Awareness, Learning and Knowledge in Entrepreneurial and Firm Leadership Processes
95
Goals Gaps
Levels* Wine
ry A
Wine
ry B
Wine
ry C
Wine
ry D
Wine
ry E
Wine
ry F
Wine
ry G
Wine
ry H
Wine
ry I Winery
Economic Goals Gap
6.0 4.0 5.0 1.0 6.0 0.1 5.0 1.0 3.0
Winery Social
Goals Gap
1.0 0.5 0.5 0.1 2.0 1.5 5.0 2.0 2.0
Winery Environmental
Goals Gap
1.0 1.0 0.5 1.0 1.0 1.0 0.0 1.0 1.0
Total Goals Gap 8.0 5.5 6.0 2.1 9.0 2.6 10.0 4.0 6.0
* Goals gaps range from 0 to 10
Table 3. Winery Goals Gap Levels by Category.
Table four indicates entrepreneurs’ knowledge stocks for four categories and wineries’
investment level on the development of the four knowledge categories for its employees.
Small wineries entrepreneurs interviewed present lower levels of personal mastery,
systems thinking and winery managerial knowledge. The small winery entrepreneur with
higher knowledge stock is the only small winery that facilitates wine tours, and catering.
Knowled
ge Stocks
and
Inflows
Winer
y A
Winer
y B
Winer
y C
Winer
y D
Winer
y E
Winer
y F
Winer
y G
Winer
y H
Winer
y I
Personal
Mastery
Knowledge (PMK)
50 70 70 85 60 70 65 75 65
Group
Learning
Knowledg
e (GLK)
60 80 80 90 70 80 80 90 80
Systems
Thinking
Knowledg
e (STK)
50 70 70 85 60 75 60 80 65
Winery Manageria
l
Knowledg
e (WMK)
50 70 70 85 60 85 60 85 60
Inflow
Rate PMK
10 70 70 80 60 70 60 70 80
Inflow
Rate GLK
70 70 60 80 60 70 60 70 80
Inflow
Rate STK
60 70 80 70 50 80 40 80 70
Inflow Rate
WMK
80 70 80 80 60 80 70 80 70
Table 4. Entrepreneurs’ Knowledge Stocks and Wineries’ Knowledge Inflows.
Table five presents entrepreneurs risk aversion level and business clarity levels. The
entrepreneurs interviewed from small wineries tend to be more risk averse than
entrepreneurs from medium and big wineries. The entrepreneurs interviewed that run
small wineries and experience comparatively lower risk aversion levels than the other

Neus Vila Brunet
96
small wineries entrepreneurs experience lower economic goals gap than their peers. The
entrepreneurs from the present research that lead big and medium wineries have higher
levels of business vision clarity.
Risk
Aversion
&
Business
Vision
Clarity
Level*
Winery
A
Winery
B
Winery
C
Winery
D
Winery
E
Winery
F
Winery
G
Winery
H
Winery
I
Risk
Aversion
9 2 2 1 8 3 6 3 3
Business Vision
Clarity
8 8 9 10 3 8 6 10 7
* Risk aversion and Business/Project vision levels range from 0 to 10
Table 5. Entrepreneurs’ Risk Aversion and Business Clarity Levels.
Wineries’ main internal and external challenges are presented in table 6. Most small
wineries interviewed identify that one of their main internal challenges it the low business
background that limits the efficiency and effectiveness of the managerial side of the
winery. Difficulties with personnel management and capitalization are identified as the
main internal challenges in the medium and big size wineries interviewed.
Main
Challen
ges
Wine
ry A
Winer
y B
Winer
y C
Winer
y D
Wine
ry E
Winer
y F
Wine
ry G
Winer
y H
Wine
ry I
Internal
First Low
Sales
Accounti
ng
Effective
ness
Capitaliza
tion
Keeping
up supply
to satisfy
demand
Business
backgro
und
Strategy
to utilize
the
facility to
its maximu
m
Marketi
ng
Personnel
Managem
ent
Right
Size
Equipm
ent
Strategy
Second Low
Tasting
Room Capacity
Personnel
Managem
ent
Accounti
ng
Effectiveness
No clear
business
vision
Personne
l
Management
Location Effective
Capital
Management
Marketi
ng
Third Business
backgro
und
Accounti
ng
Effectiveness
No clear
sales
strategy
Low
Tasting
Room Capacity
Retail
Room
Underinvested
Business
backgro
und
Externa
l
First Distribution
Distribution
Distribution
Bugs and Animals
from
Grapes
Distribution
Demand Seasonal
ity
Retailers Negotiatio
n Power
Distribution
Second Weather Weather Grape Provision
Online Distributi
on
Competition
Poor Distribut
ion
Contract

The Role of Awareness, Learning and Knowledge in Entrepreneurial and Firm Leadership Processes
97
Third New
Competit
ors Closer
to Main
Market
Table 6. Wineries’ Main Internal and External Challenges.
The main sources of wineries’ success identified during the interviews are location and
natural amenities for small wineries. For the medium and big wineries interviewed the
main sources of success identified are a clear business vision, high quality products, high
quality treatment and nice atmosphere, and business background.
Main
Succe
ss
Sourc
es
Winery
A
Winery
B
Winery
C
Winery
D
Winery
E
Winery
F
Winery
G
Winery
H
Winery
I
First Location
Good
communi
ty and politician
s
connectio
ns
Pets
Friendly
Long Term
Vision
Natural Amenitie
s Around
High Quality
Products
Quality
Wine
Business Backgrou
nd
Location
Seco
nd
Same
wine in
sweet
and dry
Both
family
generations
engaged
Inside
and
Outside
Areas
Confident
and
Motivate
d People
High
Quality Facility
Good Combina
tion with
B&B and
Restaura
nt
Sufficient
Initial Capital
Good
partnershi
p with close
wineries
Third Location
Happy
atmosphe
re
High
Quality Treatmen
t
Clear
Vision
and Constanc
y of Aim
and Effort
Communi
ty relationsh
ips
Table 7. Wineries’ Main Success Sources.
Based on the information presented the above tables the four primary intangible resources
that enhance entrepreneurship and leadership effectiveness to satisfy consumer needs in
the wine sector are the: a) business managerial knowledge, b) clear business vision, c)
systemic knowledge, and d) personal mastery.
In order to answer the second question, “what learning capabilities are associated with
each winery, and how these capabilities relate to the four primary intangible resources
identified that enhance entrepreneurship and leadership effectiveness to satisfy consumer
needs?” we first need to present wineries sizes and activities engaged. The next two tables
indicate the size of wineries, based on the number of cases that they sell per year, and the
type of activities in which they engage. Small wineries produce less than 15,000 cases
per year and big wineries produce more than 100,000 cases per year based on mid-west

Neus Vila Brunet
98
and east coast standards (Dillon et al. 1992). Results indicate that small wineries do not
engage in as many activities as medium and big wineries. In particular, some wineries do
not offer tours and do not host business related events. On the other side, the big winery
distributes the wine through a national chain distributor. See table 9 for a detail of all the
activities engaged in by each winery.
Winery
A
Winery
B
Winery
C
Winery
D
Winery
E
Winery
F
Winery
G
Winery
H
Winery
I
Size Small Small Medium Medium Small Medium Small Big Small
Table 8. Wineries’ Size.
Activities Winer
y A
Winer
y B
Winer
y C
Winer
y D
Winer
y E
Winer
y F
Winer
y G
Winer
y H
Winer
y I grapes production 1 1 1 1 1 1 1 1 1
several wines 1 1 1 1 1 1 1 1 1
wines and other
beverages
0 1 1 1 1 1 1 1 1
wine tasting 1 1 1 1 1 1 1 1 1
winery tours 0 1 1 1 1 1 0 1 0
winery events
families/community
1 1 1 1 1 1 1 1 1
businesses 0 0 0 1 0 1 0 0 0
self-wine distribution 1 1 1 1 0 1 1 0 1
hostel service 0 1 0 1 0 0 1 0 0
catering 0 1 0 1 0 0 0 0 0
restaurant 0 1 0 0 0 1 1 0 0
Table 9. Wineries Activities Engaged.
Based on the above two tables, the results presented in table 4, and entrepreneurs’ verbal
explanations about the strategies and approaches implemented in order to reduce goals
gaps and the gaps that they see in terms of their relationships with employees, customers,
suppliers and politicians, we see that small wineries interviewed mainly apply the single
loop learning technique. In some instances, when experiencing critical situations, double
loop learning technique is applied. The medium and big wineries interviewed are able to
apply single and double loop learning processes. No winery interviewed has reported the
application of Theory U learning. A summary of these results is presented in table 10.
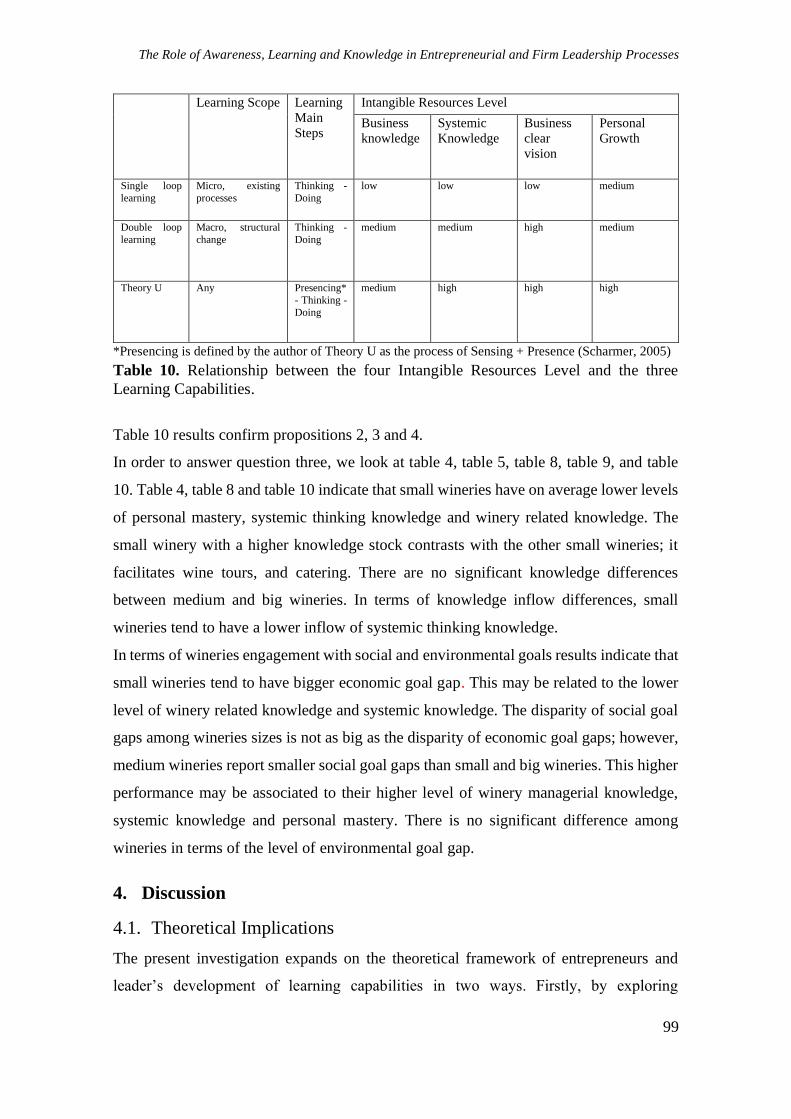
The Role of Awareness, Learning and Knowledge in Entrepreneurial and Firm Leadership Processes
99
Learning Scope Learning
Main
Steps
Intangible Resources Level
Business
knowledge
Systemic
Knowledge
Business
clear
vision
Personal
Growth
Single loop
learning
Micro, existing
processes
Thinking -
Doing
low low low medium
Double loop
learning
Macro, structural
change
Thinking -
Doing
medium medium high medium
Theory U Any Presencing*
- Thinking -
Doing
medium high high high
*Presencing is defined by the author of Theory U as the process of Sensing + Presence (Scharmer, 2005)
Table 10. Relationship between the four Intangible Resources Level and the three
Learning Capabilities.
Table 10 results confirm propositions 2, 3 and 4.
In order to answer question three, we look at table 4, table 5, table 8, table 9, and table
10. Table 4, table 8 and table 10 indicate that small wineries have on average lower levels
of personal mastery, systemic thinking knowledge and winery related knowledge. The
small winery with a higher knowledge stock contrasts with the other small wineries; it
facilitates wine tours, and catering. There are no significant knowledge differences
between medium and big wineries. In terms of knowledge inflow differences, small
wineries tend to have a lower inflow of systemic thinking knowledge.
In terms of wineries engagement with social and environmental goals results indicate that
small wineries tend to have bigger economic goal gap. This may be related to the lower
level of winery related knowledge and systemic knowledge. The disparity of social goal
gaps among wineries sizes is not as big as the disparity of economic goal gaps; however,
medium wineries report smaller social goal gaps than small and big wineries. This higher
performance may be associated to their higher level of winery managerial knowledge,
systemic knowledge and personal mastery. There is no significant difference among
wineries in terms of the level of environmental goal gap.
4. Discussion
4.1. Theoretical Implications
The present investigation expands on the theoretical framework of entrepreneurs and
leader’s development of learning capabilities in two ways. Firstly, by exploring

Neus Vila Brunet
100
entrepreneurs and leader’s relationship with two well-known learning processes (single
loop, and double loop), and a newer learning process associated with higher levels of
awareness (Theory U), and identifying the level of intangible resources needed in order
to be able to engage in each type of learning process. Secondly, by using the systems
thinking framework and identifying the relative importance of certain stock and flow
variables in the development of learning capabilities in order to ensure the satisfaction of
clients.
4.2. Practitioners Implications
The results from the present study to nine wineries of different sizes (small, medium and
large) indicate that the four primary intangible resources that enhance entrepreneurship
and leadership effectiveness to satisfy consumer needs are: a) business management
knowledge, b) business/project clear vision, c) systemic knowledge and d) personal
mastery. In order to ensure the satisfaction of economic goals business management
knowledge and business clear vision are identified of paramount, hence, entrepreneurs
have to ensure that there are sufficiently equipped with these foundations in order for the
business to not go bankrupt soon after its inception. Systemic knowledge and personal
mastery skills are associated with the ability of entrepreneurial and leadership abilities to
sustain the business as long as the management knowledge and business clear vision are
in place. Hence, managers that invest in enhancing their systemic understanding and
personal mastery will be more equipped to maneuver the business over time.
Results also indicate that the level of a) business management knowledge, b)
business/project clear vision, c) systemic knowledge and d) personal mastery, effect
entrepreneurs learning capabilities. The owners of the small wineries interviewed
presented on average lower levels of the above four intangible resources and reported to
undertake single loop learning processes. Entrepreneurs of the medium and large wineries
mainly experience higher business vision and systemic knowledge, and undergo single
loop learning processes and double loop learning processes. None of the entrepreneurs
interviewed express to follow Theory U learning process. Hence, it is important to
implement time-management strategies as well as networking strategies that will allow
small wineries to develop their intangible resources and be able to perform more double-
loop learning processes.

The Role of Awareness, Learning and Knowledge in Entrepreneurial and Firm Leadership Processes
101
Finally, research indicates that in both tangible and intangible resources, small wineries
experience lower levels of resources, which limits their ability to undertake effective
entrepreneurship and leadership processes and develop more effective capabilities. In this
regard, business owners would benefit by identifying which public administrations can
support them during the initial years in order to be more equipped and be able to compete
in seemingly more equal conditions.
The results presented are part of a pilot study conducted to nine wineries. Further research
that investigates the questions posited to a larger number of wineries is necessary. Besides
the need of investigating a larger sample, interesting systemic features to study in future
research are the key feedbacks, converters and delays that enhance entrepreneurship and
leadership learning capabilities to satisfy consumer needs, and to identify which are their
characteristics under the three main learning processes studied. Furthermore, research on
practitioners that apply Theory U learning processes is needed in order to identify other
intangible stocks, converters and feedback loops that may be unique for this type of
capability.
4.3. Educators Implications
Results indicate that tools and techniques to enhance entrepreneurs and leader’s ability to
undergo theory U or deep learning processes need to more available and taught so that
the people who are able to undergo this learning process can actually undertake it.
Complementarily, more tools and techniques that enhance systems thinking and system
archetypes education for entrepreneurs and leaders would help to substantially enhance
their ability to effectively address recurring detrimental behaviors.
5. Conclusion
This paper investigates entrepreneurship and leadership learning processes and their
effectiveness in satisfying consumer’s needs in nine wineries. Results from the case
studies show that in order for entrepreneurs and leader to effectively satisfy consumer
needs the primary intangible resource that has to be acquired is substantial managerial
knowledge together with a clear business vision. The other two intangible resources that
are key for entrepreneurship and leadership ability to satisfy consumer needs are above
average systemic knowledge and personal growth.

Neus Vila Brunet
102
Results also indicate that there is a positive relationship between the type and level of
intangible resources possessed by entrepreneurs and leaders and the type of learning
performed. The higher the level of the four intangible resources the wider and deeper the
learning scope results. However, entrepreneurs and leaders with high levels of the four
intangible resources explored are not equipped enough with tools and techniques that
would allow them to undergo deep learning processes.

The Role of Awareness, Learning and Knowledge in Entrepreneurial and Firm Leadership Processes
103
REFERENCES
Alonso, A. D., Bressan, A., O’Shea, M., & Krajsic, V. (2013). The challenges in the wine
sector, and winery entrepreneurs’ ways of coping: an international
perspective. International Journal of Business Environment, 5(3), 211-231.
Amit, R. & C. Zott. (2001). Value creation in e‐business. Strategic management journal
22(6‐7): 493-520.
Anderson, J. C., Rungtusanatham, M., & Schroeder, R.G. (1994). A theory of quality
management underlying the Deming management method. Academy of management
review 19(3): 472-509.
Ashar, H., & Lane-Maher, M. (2004). Success and spirituality in the new business
paradigm. Journal of Management Inquiry, 13(3), 249-260.
Avolio, B. J. & W. L. Gardner. (2005). Authentic leadership development: Getting to the
root of positive forms of leadership. The Leadership Quarterly 16(3): 315-338.
Ayala, J. C., & Manzano, G. (2014). The resilience of the entrepreneur. Influence on the
success of the business. A longitudinal analysis. Journal of Economic Psychology, 42,
126-135.
Barbuto, J. E. & M. E. Burbach. (2006). The emotional intelligence of transformational
leaders: A field study of elected officials. The Journal of social psychology 146(1): 51-
64.
Bass, B. (1985). Leadership and Performance Beyond Expectations. New York, NY: The
Free Press. pp. 14,121–124.
Bass, B. M. & R. E. Riggio. (2005). Transformational leadership, Psychology Press.
Baumeister, R. F., Bratslavsky, E., Muraven, M., and Tice, D.M. (1998). Ego depletion:
is the active self a limited resource?. Journal of Personality and Social Psychology 74(5):
1252.
Baumeister, R. F., Sparks, E.A., Stillman, T.F., & Vohs, K.D. (2008). Free will in
consumer behavior: Self-control, ego depletion, and choice. Journal of Consumer
Psychology, 18(1): 4-13.
Bennis, W. G., Parikh, J., & Lessem, R. (1996). Beyond leadership: Balancing
economics, ethics and ecology. Blackwell.
Bocken, N. M., Short, S. W., Rana, P., & Evans, S. (2014). A literature and practice
review to develop sustainable business model archetypes. Journal of cleaner
production, 65, 42-56.
Braun, W. (2002). The system archetypes. System, 2002, 27.
Neus Vila Brunet
104
Brockhaus, R. H. & P. Horwitz. (1986). The psychology of the entrepreneur. (1996)
Entrepreneurship: Critical Perspectives on Business and Management 2: 260-283.
Brugmann, J. & C. K. Prahalad (2007). Cocreating business's new social compact.
Harvard business review 85(2): 80.
Burns, J. M. (1998). Transactional and transforming leadership. Leading organizations,
133-134.
Carland, J. W., Hoy, F., Boulton, W.R., & Carland, J.C. (1984). Differentiating
entrepreneurs from small business owners: A conceptualization. Academy of management
review 9(2): 354-359.
Carlyle, T. (1993). On heroes, hero-worship, and the heroic in history (Vol. 1). Univ of
California Press.
Casson, M. (1982). The entrepreneur: An economic theory. Rowman & Littlefield.
Choi, Y. R. & D. A. Shepherd. (2004). Entrepreneurs’ decisions to exploit opportunities.
Journal of management 30(3): 377-395.
Chrislip, D. D., & Larson, C. E. (1994). Collaborative leadership: How citizens and civic
leaders can make a difference (pp. 52-54). San Francisco: Jossey-Bass.
Chudek, M. & J. Henrich. (2011). Culture–gene coevolution, norm-psychology and the
emergence of human prosociality. Trends in cognitive sciences 15(5): 218-226.
Ciulla, J. B. (1995). Leadership ethics: Mapping the territory. Business Ethics Quarterly:
5-28.
Ciulla, J. B. (2004). Ethics, the heart of leadership. Greenwood Publishing Group.
Cook, S. D., & Yanow, D. (1993). Culture and organizational learning. Journal of
Management Inquiry, 2(4), 373-390.
Deming, W. E. (2000). The new economics for industry, government, education. MIT
press.
Denzau, A. T., & North, D.C. (1994). Shared mental models: ideologies and institutions.
Kyklos, 47(1): 3-31.
Deutschman, A. (2001). The second coming of Steve Jobs. Random House Digital, Inc.
Dillon, C. R., Morris, J.R., Price, C., Ward, D., & Metz, D., (1992). Economic
Considerations for Small-Sized to Medium-Sized Wineries. Wine East, 6-23.
Dimov, D. (2011). Grappling with the unbearable elusiveness of entrepreneurial
opportunities. Entrepreneurship Theory and Practice 35(1): 57-81.

The Role of Awareness, Learning and Knowledge in Entrepreneurial and Firm Leadership Processes
105
Drucker, P. F. (1995). People and performance: The best of Peter Drucker on
management. Routledge.
Fonagy, P. & M. Target. (1997). Attachment and reflective function: Their role in self-
organization. Development and psychopathology 9(04): 679-700.
Ford, J. & N. Harding. (2011). The impossibility of the ‘true self’of authentic leadership.
Leadership 7(4): 463-479.
Forrester, J. W. (1994). System dynamics, systems thinking, and soft OR. System
Dynamics Review, 10(2‐3), 245-256.
Freytag, A. & R. Thurik. (2010). Entrepreneurship and its determinants in a cross-country
setting. Springer.
Friedman, A. L. & S. Miles. (2001). Socially responsible investment and corporate social
and environmental reporting in the UK: an exploratory study. The British Accounting
Review 33(4): 523-548.
Galton, F. (1869). Hereditary genius. Macmillan and Company.
Gardner, W. L., Avolio, B.J,. Luthans, F., May, D.R., & Walumbwa, F. (2005). Can you
see the real me? A self-based model of authentic leader and follower development. The
Leadership Quarterly 16(3): 343-372.
George, G. & A. J. Bock (2011). The business model in practice and its implications for
entrepreneurship research. Entrepreneurship Theory and Practice 35(1): 83-111.
Goleman, D., & Boyatzis, R.E. & A. MacKee (2004). Primal leadership: Learning to lead
with emotional intelligence, Harvard Business Press.
Grégoire, D. A., Corbett, A.C., & McMullen, J.S. (2011). The cognitive perspective in
entrepreneurship: An agenda for future research. Journal of Management Studies, 48(6):
1443-1477.
Hashemi, S. (2013). Voices: What'S Love Got to Do with Leadership?. Business Strategy
Review 24(2): 80-81.
Heifetz, R. A. (1994). Leadership without easy answers. Harvard University Press.
Hersey, P. (1985). Situational Leader: The Other Fifty-Nine Minutes. Warner Books.
Hill, R. C. & M. Levenhagen. (1995). Metaphors and mental models: Sensemaking and
sensegiving in innovative and entrepreneurial activities. Journal of management 21(6):
1057-1074.
Hitt, M. A. (2002). Strategic entrepreneurship: Creating a new mindset. Wiley-Blackwell.
Hoang, H. & B. Antoncic. (2003). Network-based research in entrepreneurship: A critical
review. Journal of Business Venturing, 18(2): 165-187.

Neus Vila Brunet
106
Holcomb, T. R., Ireland, R.D., Holmes Jr, R.M., & Hitt, M.A. (2009). Architecture of
entrepreneurial learning: exploring the link among heuristics, knowledge, and action.
Entrepreneurship Theory and Practice, 33(1): 167-192.
Ikupolati, A. O., Adeyeye, M. M., Oni, E. O., Olatunle, M. A., & Obafunmi, M. O. (2017).
Entrepreneurs’ managerial skills as determinants for growth of small and medium
enterprises (SMEs) in Nigeria. Journal of small business and entrepreneurship
development, 5(1), 1-6.
Johnson-Laird, P. N. (1983). Mental models: Towards a cognitive science of language,
inference, and consciousness. Harvard University Press.
Joyce, A., & Paquin, R. L. (2016). The triple layered business model canvas: A tool to
design more sustainable business models. Journal of cleaner production, 135, 1474-
1486.
Judge, T. A., Bono, J.E., Ilies, R., & Gerhardt, M.W. (2002). Personality and leadership:
a qualitative and quantitative review. Journal of Applied Psychology 87(4): 765.
Karoly, P. (1993). Mechanisms of self-regulation: A systems view. Annual review of
psychology 44(1): 23-52.
Kim, D. H. (1993). Systems archetypes I: diagnosing systemic issues and designing high-
leverage interventions. Pegasus Communications.
Kohlberg, L. (1981). The philosophy of moral development: Moral stages and the idea of
justice (essays on moral development, volume 1). San Fancisco: Harper & Row.
Kong, C. (2017). Mental Capacity in relationship: Decision-making, dialogue, and
autonomy (Vol. 34). Cambridge University Press.
Kramer, M. R. (2011). Creating shared value. Harvard business review.
Leih, S., & Teece, D. (2016). Campus leadership and the entrepreneurial university: A
dynamic capabilities perspective. Academy of Management Perspectives, 30(2), 182-210.
Leithwood, K., Jantzi, D., & Steinbach, R. (1999). Changing Leadership for Changing
Times. Changing Education Series, ERIC.
Lewis, C. W. & S. C. Gilman. (2005). The ethics challenge in public service: a problem-
solving guide. John Wiley & Sons.
Lord, R. G., De Vader, C.L., & Alliger, G.M. (1986). A meta-analysis of the relation
between personality traits and leadership perceptions: An application of validity
generalization procedures. Journal of Applied Psychology 71(3): 402.
Lorenzo, J. R. F., Rubio, M. T. M., & Garcés, S. A. (2018). The competitive advantage
in business, capabilities and strategy. What general performance factors are found in the
Spanish wine industry?. Wine Economics and Policy, 7(2), 94-108.

The Role of Awareness, Learning and Knowledge in Entrepreneurial and Firm Leadership Processes
107
Lowe, K. B., Kroeck, K.G., & Sivasubramaniam, N. (1996). Effectiveness correlates of
transformational and transactional leadership: A meta-analytic review of the MLQ
literature. The Leadership Quarterly 7(3): 385-425.
Lutz, A., & Thompson, E. (2003). Neurophenomenology integrating subjective
experience and brain dynamics in the neuroscience of consciousness. Journal of
Consciousness Studies, 10 9(10): 31-52.
Maani, K. E. & V. Maharaj (2004). Links between systems thinking and complex decision
making. System Dynamics Review 20(1): 21-48.
Mayer, D. M., Kuenzi, M., Greenbaum, R., Bardes, M., & Salvador, R. B. (2009). How
low does ethical leadership flow? Test of a trickle-down model. Organizational behavior
and human decision processes, 108(1), 1-13.
McKenna, J. (2009). Spiritual enlightenment: The damnedest thing. Wisefool Press.
Meyer, G. D., Neck, H.M., & Meeks, M.D. (2002). The entrepreneurship-strategic
management interface. Strategic entrepreneurship: Creating a new mindset: 19-44.
Palich, L. E. & D. Ray Bagby. (1995). Using cognitive theory to explain entrepreneurial
risk-taking: Challenging conventional wisdom. Journal of Business Venturing 10(6): 425-
438.
Patton, M. Q. (2005). Qualitative research. Wiley Online Library.
Porter, M. E. & M. R. Kramer (2006). Strategy and society. Harvard business review,
84(12): 78-92.
Porter, M., & Kramer, M.R. (2011). Creating shared value. Harvard business review,
89(1/2): 62-77.
Scharmer, C. O. (2007). Theory U: Leading from the Future as it Emerges. Society for
Organisational Learning. Cambridge.
Scharmer, C. O., Jaworski, J., Flowers, B.S., & Senge, P.M. (2005). Presence: An
exploration of profound change in people, organizations, and society. Crown Business.
Scharmer, C. O. & K. Kaeufer. (2013). Leading from the Emerging Future: From Ego-
System to Eco-System Economies. Berrett-Koehler Publishers.
Schneider, M. & M. Somers. (2006). Organizations as complex adaptive systems:
Implications of complexity theory for leadership research. The Leadership Quarterly,
17(4): 351-365.
Sen, S. & C. B. Bhattacharya. (2001). Does doing good always lead to doing better?
Consumer reactions to corporate social responsibility. Journal of marketing Research:
225-243.

Neus Vila Brunet
108
Senge, P. M. (1991). The fifth discipline: The art and practice of the learning
organization. Century Business.
Senge, P., Kleiner, A., Roberts, C., Ross, R., Roth, G., Smith, B., & Guman, E.C. (1999).
The dance of change: The challenges to sustaining momentum in learning organizations.
Nicholas Brealey Publishing Lt.
Senge, P. M., Smith, B., Kruschwitz, N., Laur, J., & Schley, S. (2008). The necessary
revolution: How individuals and organizations are working together to create a
sustainable world. Crown Business.
Siegel, D. J. (2007). The mindful brain: Reflection and attunement in the cultivation of
well-being. WW Norton & Company.
Sinisammal, J., Leviäkangas, P., Autio, T., & Hyrkäs, E. (2016). Entrepreneurs'
perspective on public-private partnership in health care and social services. Journal of
health organization and management.
Smith, K. K. & D. N. Berg. (1987). Paradoxes of group life: Understanding conflict,
paralysis, and movement in group dynamics. Jossey-Bass.
St-Jean, E., & Audet, J. (2012). The role of mentoring in the learning development of the
novice entrepreneur. International entrepreneurship and management journal, 8(1), 119-
140.
Steingard, D. S. (2005). Spiritually-informed management theory toward profound
possibilities for inquiry and transformation. Journal of Management Inquiry, 14(3), 227-
241.
Sterman, J. D. (2000). Business dynamics: systems thinking and modeling for a complex
world. Irwin McGraw-Hill.
Sterman, J. D. (2010). Does formal system dynamics training improve people's
understanding of accumulation?. System Dynamics Review, 26(4): 316-334.
Stevenson, H. H. & J. C. Jarillo. (1990). A paradigm of entrepreneurship: entrepreneurial
management. Strategic management journal 11(5): 17-27.
Sweeney, L. & J. Sterman. (2000). Bathtub dynamics: initial results of a systems thinking
inventory. System Dynamics Review 16(4): 249-286.
Taplin, I. M. (2006). Competitive pressures and strategic repositioning in the California
premium wine industry. International Journal of Wine Marketing 18(1): 61-70.
Teece, D., & Pisano, G. (1994). The dynamic capabilities of firms: an introduction.
Industrial and Corporate Change, 3(3): 537-556.
Teece, D. J. (2007). Explicating dynamic capabilities: the nature and microfoundations
of (sustainable) enterprise performance. Strategic management journal 28(13): 1319-
1350.

The Role of Awareness, Learning and Knowledge in Entrepreneurial and Firm Leadership Processes
109
Teece, D. J. (2009). Dynamic capabilities and strategic management: organizing for
innovation and growth. Oxford University Press, USA.
Vago, D. R., Gupta, R., & Lazar, S. (2018). How does mindfulness affect cognition? A
reflection on confounding issues surrounding mindfulness-based intervention research
targeting cognitive outcomes.
Van Wart, M. (2013). Lessons from leadership theory and the contemporary challenges
of leaders. Public Administration Review, 73(4), 553-565.
Vargo, S. L. & R. F. Lusch. (2008). Why “service”? Journal of the Academy of marketing
Science 36(1): 25-38.
Vohs, K. D. & R. F. Baumeister. (2004). Ego-depletion, self-control, and choice.
Handbook of experimental existential psychology 15: 398-410.
Weick, K. E., & Putnam, T. (2006). Organizing for mindfulness Eastern wisdom and
Western knowledge. Journal of Management Inquiry, 15(3), 275-287.
Weiner, B. (1972). Theories of motivation: From mechanism to cognition. Oxford,
England: Markham. (1972). ix 474 pp.
Wiklund, J., Davidsson, P., Audretsch, David B., & Karlsson, C. (2011). The future of
entrepreneurship research. Entrepreneurship Theory and Practice 35(1): 1-9.
Wilber, K. (2001). A theory of everything: An integral vision for business, politics,
science, and spirituality. Shambhala publications.
Wolstenholme, E. (2004). Using generic system archetypes to support thinking and
modelling. System Dynamics Review, 20(4), 341-356.
Zahra, S. A., Sapienza, H.J., & Davidsson, P. (2006). Entrepreneurship and dynamic
capabilities: a review, model and research agenda*. Journal of Management Studies
43(4): 917-955.