Europe Working Capital Survey 2015 - Michael C. … · 1 I REL I 2015 Europe Working Capital Survey...
20
2015 Europe Working Capital Survey
Transcript of Europe Working Capital Survey 2015 - Michael C. … · 1 I REL I 2015 Europe Working Capital Survey...
2015
Eu
rop
e W
ork
ing
Cap
ital
S
urv
ey

1 I REL I 2015 Europe Working Capital Survey
Reliance on debt orSigns of a changing
2015 study highlights: In Europe, the cash conversion cycle (CCC) in 2014 improved 5.5% (2.1 days). Having levelled off from 2011 to 2013, working capital performance is again progressing, continuing the positive trend seen since the last recession – with 2014 performance demonstrating an 18.5% improvement in the CCC compared to 2007 levels.
The United States saw flat working capital performance over the year as the economy has improved more rapidly than Europe. However, a large source of the increase in cash on hand has also been funded through increased debt. European companies have demonstrated cash release through operational efficiencies, but at the same time have increased debt levels (40% increase to 2007), mirroring the trend to take advantage of low interest rates.
In 2014 this additional cash on hand has been used to fund investment. There are similarities in both regions but in Europe specifically, companies increasing their debt 100% or more since 2007 had an 800% increase in cash on hand, although their CCC worsened by 51%. The companies that decreased their debt since 2007 had a 225% increase in cash on hand but their CCC improved 27%. A €1.1 trillion cash flow opportunity exists when comparing top and bottom performers with most opportunity in Payables and Receivables.
As the EU economy returns to growth, notable improvements (while still relatively small) have been seen in the cash conversion cycle since 2012. The reduction witnessed in 2014 indicates debt is still viewed as an attractive
source of cash in Europe but working capital is returning to the corporate agenda. In contrast the US, experiencing GDP growth in excess of 2%, has demonstrated an increased reliance on debt and a stagnation in CCC as companies look outside of their organizations for quick and easy sources of cash. We see a higher rate of growth in revenues for US, but it is mostly funded by debt as the CCC performance is stagnating. In Europe there is less reliance on debt and the beginnings of focus on working capital as the CCC has improved almost 20% in the past 7 years. While European companies are investing in themselves and in acquisitions, they are funding it through both debt and cash from operations.

2015 Europe Working Capital Survey I REL I 2
working capital? focus in Europe
Post-recession European companies fund growth through debt and operational cash
FY '04 FY '05 FY '06 FY '07 FY '08 FY '09 FY '10 FY '11 FY '12 FY '13 FY '140.0
5.0
10.0
15.0
20.0
25.0
30.0
35.0
40.0
45.0
Days
€B
€1,000 B
€2,000 B
€3,000 B
€4,000 B
€5,000 B
€6,000 B
€7,000 B
€8,000 B
€9,000 B
Bill
ion
€
TOTAL DEBT REVENUE CCC

3 I REL I 2015 Europe Working Capital Survey
Cash, Debt and the Cash Conversion CycleCash on hand has continued to increase in 2014, up 6% from 2013 and 62% over the past seven years for the European survey. Although this statistic is impressive, during the same time revenue increased 31% -- meaning the actual improvement in cash on hand as a percentage of revenue increased only 2%. As cash has increased, so has spending. CAPEx investment has increased 21% over a seven- year period although this slowed with only a 1% rise in 2014. Dividend pay-outs, however, continued an upward trend, up 25% over seven years and 9% from 2013. 2014 also saw some notable mergers and acquisitions as companies took advantage of available cash. More cash is available and is being spent, but where is it coming from? Debt is a large contributor with a worrying increase of 40% since 2007. Debt levels now stand at €3 trillion, while the European Central Bank (ECB) interest rate declined sharply from 4.3% in 2007 to 0.01% at the end of 2014. Top European companies have taken advantage of the cheap debt available and often in the short term have rewarded shareholders through dividend pay-outs and share buy-backs. Companies should however be concerned about the long term risks such as changes in interest rates, debt dependence or pressured cash flow; what companies must not forget is that you can only run out of cash ONCE.
Some companies have understood these facts. Mr. Bellé, CFO and CEO of LEONI AG commented,“Strong free cash flow is of key importance to our investors and provides LEONI with the necessary financial scope for both expansion through internal growth and acquisition”.
Companies with large debt have worse cash management performanceA comparison of debt levels, working capital performance and cash on hand levels yields some interesting results. Only 35% of the companies reduced their debt over the past seven years, while 65% increased their debt -- out of which 28% saw debt levels increase more than 100%. Those companies managing to reduce debt since 2007 have seen an improved CCC, on average, by 27% while their cash on hand increased by 225%. At the same time, companies increasing debt 100% or more since 2007 had an average 51% deterioration in the CCC while their debt coverage was down by 98% on average at a worrying ratio of 0.24 by the end of 2014.
0
100
200
300
400
500
600
700
800
Cash on hand increases 62%
2007
€494B
€800B
2014
62%
0
500
1000
1500
2000
2500
3000
3500
0
20
40
60
80
100
Debt increases 40% while borrowing rates are attractive
2007
€2,171B 40%
4.30%
€3,041B
0.01%
2014
DEBT ECB RATE
0
2
4
6
8
10
Companies are not hoarding cashCash on hand as a % of revenue
2007 2014
8%
10%
2%
0
100
200
300
400
500
600
CAPEX increases 21%
2007 2014
€423B
€512B
21%
0
50
100
150
200
250
Dividends increase 25%
2007 2014
€177B 25%
€222B
0
10
20
30
40
50
Internal generation of cash ignoredCCC as a % of sales
2007 2014
42.7
-18% 34.9

2015 Europe Working Capital Survey I REL I 4
Debt Range
% Chng
2007 - 2014
# of
Comp-
anies
CCC1
%
Chng
2007 -
2014
Debt
Coverage
Ratio1
% Chng
2007 - 2014
Cash On
Hand1
% Chng
2007 -
2014
Reduction in
Debt323 -27% >900% 225%
Debt
Increase of
100% +
269 51% -98% >800%
Companies reducing debt vs. companies increasing
debt 100% or more
1 Average of percentage change at individual company level
Improvements are visible, but sustainability remains a challengeReducing the CCC shortens the amount of time each euro is tied up in the buying, production and sales process before being converted back into cash again. The lower the better, with some industries (for example: media, retailing and telecommunications) achieving negative CCC where receivables are banked before payables are due. But companies need to be cautious as different industries operate with different requirements of working capital. While CCC needs to be lower, it also has to be optimal.
For some companies there is evidence of emerging cash awareness. Working capital is a corporate focus for 124 companies (13%) that have managed to improve their CCC every year for three years. However, as the time frame increases, the number of organisations maintaining those improvements substantially decreases. Difficulties in achieving sustainable
These findings raise some questions, the most important of which is whether companies are prepared for an increase in interest rates and if they are proactively managing the level of debt?

5 I REL I 2015 Europe Working Capital Survey
improvement are evident. Only 3% (33) of companies achieved year-on-year improvement over five years. Since 2007, only four companies (less than1%) have managed to demonstrate continuous and sustainable CCC reduction. These companies (Unilevel, Heidelbergcement, PKC Group and Luxottica Group) have also achieved better growth (38% more revenue on average vs. the companies in the survey), acquired less debt (29% less on average ), had more cash as a percent of revenue (6% on average) and improved CCC (79% on average). One of the 124 companies that improved CCC for three consecutive years shared with us their approach and vision for working capital. Mr. Bellé, the CFO and CEO of LEONI AG, said: “Along with profitability, working capital is an essential component” and management of LEONI AG “has the responsibility to sustainably improve working capital by managing the key improvement levers through the operational processes”. This proves there are still companies out there keeping their eyes on the ball, continuously improving operational working capital performance to support expansion through internal growth and acquisitions.
Performance varies at Industry level The latest survey has identified an opportunity gap between top and bottom performers by industry totalling €1.1 trillion. While all three areas of working capital offer improvement potential, the largest performance gaps in 2014 lie within payables and receivables.
Some select industries have improved performance over the past year. Transportation infrastructure has seen a move into a negative CCC for the first time since 2010. Oil and gas performance has improved due to strategic reductions in oil stocks by large players, while the dropping oil price has also reduced inventory values, particularly raw materials, in selected industries. On the other hand, several industries have seen working capital performance decline over the past year. European Airlines, while maintaining a negative CCC, has experienced challenges in working capital management with global events and increased competition from Gulf carriers impacting revenue growth, while household products and IT services, among others, have experienced declining receivables performance in 2014.
What next?As the European economy continues the return to growth, improvements in working capital management and the CCC are encouraging.
Profile of companies in 2015 Europe Working Capital Survey
13%
3%
<1%
(13%) 124 companies improved CCC every yearduring the last three years
(3%) 33 companies improved CCC every yearduring the last five years
(<1%) 4 companies improved CCC every yearduring the last seven years
0
10
20
30
40
50
60
70
80
0
100
200
300
400
500
0
5
10
15
20
25
0
5
10
15
20
25
Revenue Cash on hand
69%
31%
>500%
62%
25%
4 COMPANIES (7YR IMPROVEMENT IN CCC)
COMPANIES IN 2015 EUROPE WORKING CAPITAL SURVEY
13%
21%
8%
0
20
40
60
80
100
0
5
10
15
20
25
30
35
40
0
1
2
3
4
5
6
7
8
11%
40%
-97%
-18%
7%
1%
Capex Dividend
Debt Cash as % of revenue
CCC

2015 Europe Working Capital Survey I REL I 6
However, increased debt levels as companies capitalise low interest rates are a cause for concern. In 2015 we expect this trend to continue as companies take advantage of cheap borrowing costs. If and when interest rates rise, those companies focusing on optimising their CCC will be best positioned to mitigate their risk, continue utilising cash for investment activities, and outperform their peers not only in areas directly related to cash, but also the downstream elements impacting cost and internal/external service.
A good starting point for companies wishing to be one step ahead and improve their cash conversion cycle is to understand the gaps in each of the working capital components: days sales outstanding (DSO), days payables outstanding (DPO) and days inventory outstanding (DIO). Making use of peer group comparisons with similar organisations or within industry groupings is a good way to initially estimate the potential cash flow opportunity trapped in the operations and determine if it’s worth pursuing.
7 I REL I 2015 Europe Working Capital Survey
Aerospace and Defense Industry
BAE Systems plc UK 61 5% 57 55 -1% 56 41 8% 38 36 -3% 37
QinetiQ Group Plc UK 62 -4% 65 70 -1% 71 7 -15% 8 15 6% 14
Ultra Electronics Holdings plc UK 73 -15% 86 87 -17% 105 54 35% 40 69 15% 60
Zodiac Aerospace FR 200 10% 182 78 13% 69 223 8% 206 102 9% 94
Safran SA FR 201 2% 197 121 14% 106 199 4% 192 119 17% 102
Dassault Aviation SA FR 440 44% 306 49 52% 32 491 39% 354 100 24% 81
Median Performance 148 4% 143 82 8% 76 96 0% 96 69 15% 60
Air Freight and Logistics Industry
Royal Mail plc UK (35) -6% (33) 31 3% 30 1 -11% 1 67 5% 64
Logwin AG LU (7) 12% (8) 46 22% 38 1 4% 1 53 16% 46
Oesterreichische Post AG AU (2) -59% (1) 37 -4% 39 3 -4% 3 43 -2% 43
PostNord AB SW 18 144% 8 42 -1% 43 2 -23% 3 26 -31% 38
Posten Norge AS NO 19 -9% 21 43 4% 41 0 -19% 1 24 18% 20
TNT Express N.V. NL 28 -1% 29 56 7% 53 1 31% 1 29 17% 24
Median Performance 11 60% 7 43 4% 41 1 4% 1 38 -1% 38
Airlines Industry
SAS AB SW (19) 1% (19) 10 -14% 12 9 5% 8 38 -3% 39
International Consolidated Airlines Group, S.A.
UK (11) 25% (14) 23 -4% 24 10 -1% 10 43 -10% 48
Ryanair Holdings plc EI (10) -4% (9) 4 0% 4 0 -12% 0 14 3% 14
Finnair Oyj FI 11 -15% 13 18 -9% 20 3 -24% 4 11 -6% 11
Aegean Airlines S.A. GR 28 -6% 30 35 -12% 40 6 -6% 7 12 -22% 16
Dart Group plc UK 64 2% 62 76 0% 76 1 83% 1 13 -6% 14
Median Performance 4 1535% 0 20 -11% 22 5 -3% 6 16 1% 16
Auto Components Industry
Cie Automotive, S.A. ES (30) 0% (30) 46 30% 35 80 0% 80 156 7% 145
Valeo SA FR (13) -4% (12) 48 6% 46 33 6% 31 94 6% 89
Autoneum Holding AG CH (4) -176% (2) 41 6% 39 49 20% 41 95 16% 81
Schaeffler AG DE 76 -2% 78 57 5% 55 72 3% 70 53 14% 47
Compagnie Generale DES Etablissements Michelin SCA
FR 104 6% 98 48 6% 45 115 10% 105 59 14% 52
Nokian Renkaat Oyj FI 199 -6% 211 92 -5% 97 137 -5% 143 30 3% 29
Median Performance 34 -4% 35 49 2% 48 59 3% 57 70 6% 67
Automobiles Industry
Renault Société Anonym FR (30) -23% (24) 11 28% 9 37 8% 34 78 16% 67
Peugeot S.A. FR (24) -170% (9) 8 -26% 11 34 -24% 45 67 2% 65
Fiat Chrysler Automobiles N.V. UK (23) 3% (23) 10 -9% 11 55 8% 50 87 3% 85
Volkswagen AG DE 55 7% 51 21 0% 21 79 8% 73 45 6% 42
Daimler AG DE 68 11% 61 22 -1% 22 87 10% 79 41 3% 40
CROSS Industries AG AU 85 -1% 86 33 -2% 33 107 -5% 112 54 -8% 59
Median Performance 10 169% 4 18 -14% 21 83 9% 76 72 9% 66
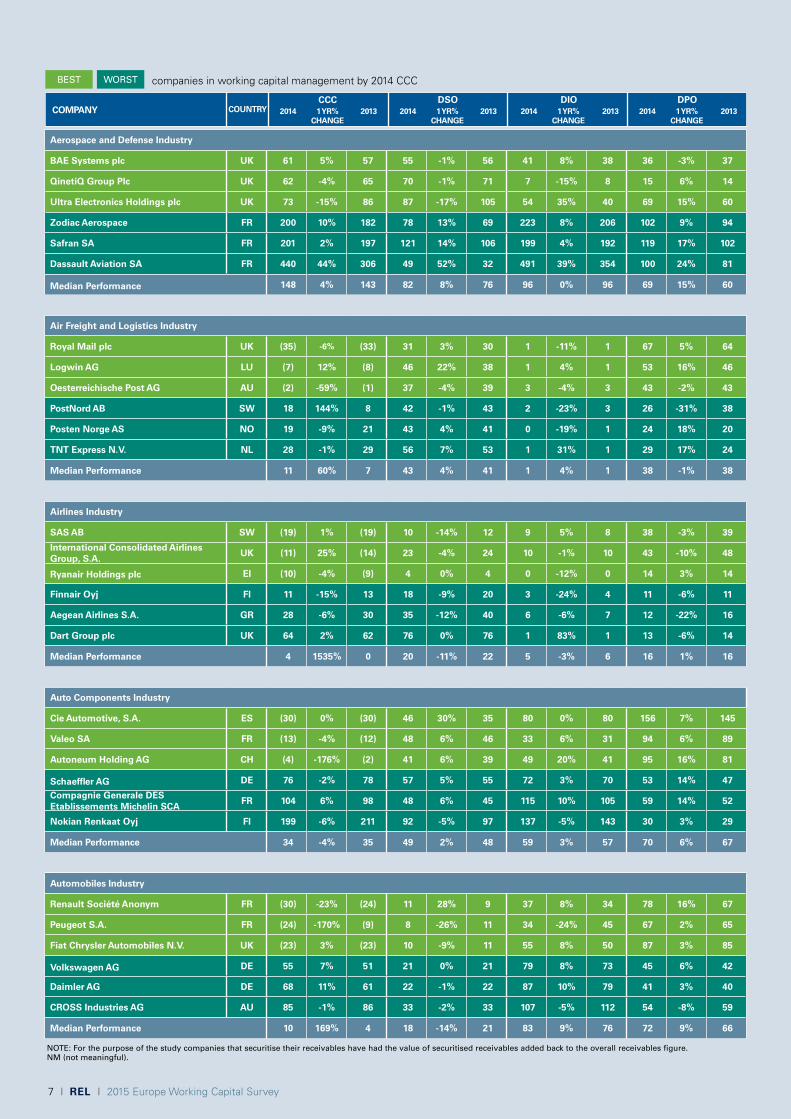
BEST WORST
COMPANyCCC
2014 1 yR%CHANGE
2013DSO
2014 1 yR%CHANGE
2013DIO
2014 1 yR%CHANGE
2013DPO
2014 1 yR%CHANGE
2013COUNTRy
NOTE: For the purpose of the study companies that securitise their receivables have had the value of securitised receivables added back to the overall receivables figure. NM (not meaningful).
companies in working capital management by 2014 CCC
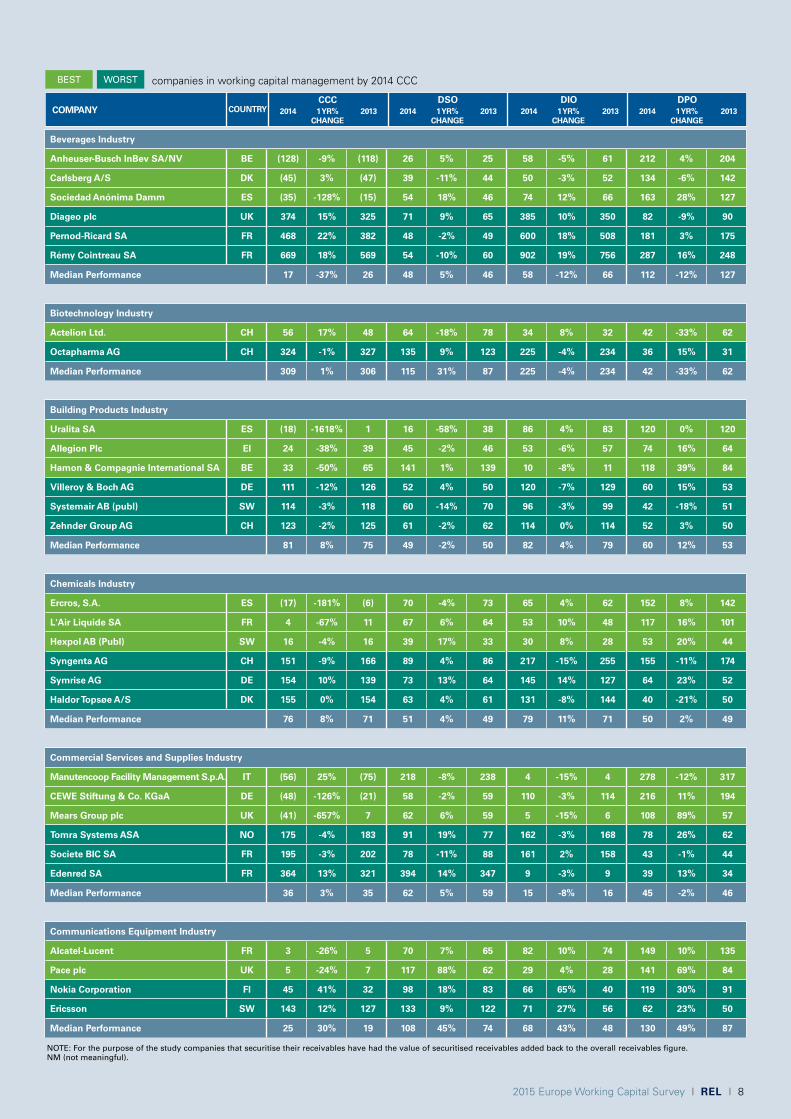
2015 Europe Working Capital Survey I REL I 8
Beverages Industry
Anheuser-Busch InBev SA/NV BE (128) -9% (118) 26 5% 25 58 -5% 61 212 4% 204
Carlsberg A/S DK (45) 3% (47) 39 -11% 44 50 -3% 52 134 -6% 142
Sociedad Anónima Damm ES (35) -128% (15) 54 18% 46 74 12% 66 163 28% 127
Diageo plc UK 374 15% 325 71 9% 65 385 10% 350 82 -9% 90
Pernod-Ricard SA FR 468 22% 382 48 -2% 49 600 18% 508 181 3% 175
Rémy Cointreau SA FR 669 18% 569 54 -10% 60 902 19% 756 287 16% 248
Median Performance 17 -37% 26 48 5% 46 58 -12% 66 112 -12% 127
Biotechnology Industry
Actelion Ltd. CH 56 17% 48 64 -18% 78 34 8% 32 42 -33% 62
Octapharma AG CH 324 -1% 327 135 9% 123 225 -4% 234 36 15% 31
Median Performance 309 1% 306 115 31% 87 225 -4% 234 42 -33% 62
Building Products Industry
Uralita SA ES (18) -1618% 1 16 -58% 38 86 4% 83 120 0% 120
Allegion Plc EI 24 -38% 39 45 -2% 46 53 -6% 57 74 16% 64
Hamon & Compagnie International SA BE 33 -50% 65 141 1% 139 10 -8% 11 118 39% 84
Villeroy & Boch AG DE 111 -12% 126 52 4% 50 120 -7% 129 60 15% 53
Systemair AB (publ) SW 114 -3% 118 60 -14% 70 96 -3% 99 42 -18% 51
Zehnder Group AG CH 123 -2% 125 61 -2% 62 114 0% 114 52 3% 50
Median Performance 81 8% 75 49 -2% 50 82 4% 79 60 12% 53
Chemicals Industry
Ercros, S.A. ES (17) -181% (6) 70 -4% 73 65 4% 62 152 8% 142
L'Air Liquide SA FR 4 -67% 11 67 6% 64 53 10% 48 117 16% 101
Hexpol AB (Publ) SW 16 -4% 16 39 17% 33 30 8% 28 53 20% 44
Syngenta AG CH 151 -9% 166 89 4% 86 217 -15% 255 155 -11% 174
Symrise AG DE 154 10% 139 73 13% 64 145 14% 127 64 23% 52
Haldor Topsøe A/S DK 155 0% 154 63 4% 61 131 -8% 144 40 -21% 50
Median Performance 76 8% 71 51 4% 49 79 11% 71 50 2% 49
Commercial Services and Supplies Industry
Manutencoop Facility Management S.p.A. IT (56) 25% (75) 218 -8% 238 4 -15% 4 278 -12% 317
CEWE Stiftung & Co. KGaA DE (48) -126% (21) 58 -2% 59 110 -3% 114 216 11% 194
Mears Group plc UK (41) -657% 7 62 6% 59 5 -15% 6 108 89% 57
Tomra Systems ASA NO 175 -4% 183 91 19% 77 162 -3% 168 78 26% 62
Societe BIC SA FR 195 -3% 202 78 -11% 88 161 2% 158 43 -1% 44
Edenred SA FR 364 13% 321 394 14% 347 9 -3% 9 39 13% 34
Median Performance 36 3% 35 62 5% 59 15 -8% 16 45 -2% 46
Communications Equipment Industry
Alcatel-Lucent FR 3 -26% 5 70 7% 65 82 10% 74 149 10% 135
Pace plc UK 5 -24% 7 117 88% 62 29 4% 28 141 69% 84
Nokia Corporation FI 45 41% 32 98 18% 83 66 65% 40 119 30% 91
Ericsson SW 143 12% 127 133 9% 122 71 27% 56 62 23% 50
Median Performance 25 30% 19 108 45% 74 68 43% 48 130 49% 87
BEST WORST
COMPANyCCC
2014 1 yR%CHANGE
2013DSO
2014 1 yR%CHANGE
2013DIO
2014 1 yR%CHANGE
2013DPO
2014 1 yR%CHANGE
2013COUNTRy
NOTE: For the purpose of the study companies that securitise their receivables have had the value of securitised receivables added back to the overall receivables figure. NM (not meaningful).
companies in working capital management by 2014 CCC

9 I REL I 2015 Europe Working Capital Survey
Construction and Engineering Industry
Abengoa SA ES (351) -12% (314) 71 47% 48 26 -3% 27 448 15% 389
Sacyr SA ES (190) -78% (107) 188 0% 188 120 3% 117 498 21% 411
Ferrovial, S.A. ES (175) 73% (650) 71 -3% 73 34 -67% 100 280 -66% 824
Fluidra, S.A. ES 188 20% 157 69 -7% 74 168 6% 158 49 -36% 76
SRV Group Plc FI 209 -12% 237 29 31% 22 194 -16% 231 14 -17% 17
Galliford Try plc UK 217 -4% 225 68 13% 60 200 -6% 212 51 8% 47
Median Performance 39 -15% 46 80 4% 78 26 -19% 32 63 2% 61
Construction Materials Industry
Caltagirone SpA IT 14 -36% 22 81 3% 79 163 37% 119 230 31% 176
CEMEX Latam Holdings, S.A. ES 22 46% 15 26 -25% 34 43 -3% 44 47 -26% 64
Lafarge S.A. FR 30 5% 28 45 5% 43 55 5% 52 70 5% 67
Titan Cement Company S.A. GR 96 14% 85 30 -17% 36 117 22% 95 50 7% 47
Imerys SA FR 126 18% 107 53 5% 51 188 20% 156 115 15% 100
RHI AG AU 140 20% 117 72 19% 60 116 12% 103 47 3% 46
Median Performance 70 -1% 70 48 2% 47 94 10% 85 68 3% 66
Containers and Packaging Industry
Papeles y Cartones de Europa S.A. ES (54) -19% (46) 15 -28% 20 74 5% 71 143 5% 137
Smurfit Kappa Group plc EI 8 -82% 42 64 18% 55 45 -1% 46 102 75% 58
DS Smith Plc UK 12 -49% 24 48 -14% 56 27 -13% 30 62 0% 62
Huhtamaki Oyj FI 61 -4% 64 50 2% 49 60 -1% 61 49 7% 46
BillerudKorsnäs Aktiebolag (publ) SW 68 -26% 91 46 3% 44 110 2% 107 88 46% 60
Ardagh Packaging Holdings Limited EI 78 -7% 83 47 -11% 53 71 -2% 72 40 -4% 42
Median Performance 27 -36% 42 47 -3% 49 71 0% 71 88 46% 60
Distributors Industry
John Menzies plc UK (11) -379% 4 28 5% 27 3 -35% 4 42 57% 27
Connect Group PLC UK (3) -88% (2) 22 0% 22 10 2% 10 35 6% 33
Headlam Group plc UK 27 -44% 49 68 22% 56 96 -4% 100 136 27% 107
Inchcape plc UK 30 4% 28 16 54% 10 63 -7% 68 49 0% 50
S.A. D'Ieteren N.V. BE 57 6% 53 18 -10% 20 58 12% 52 20 5% 19
Medion AG DE 120 17% 102 116 35% 86 46 14% 40 42 77% 24
Median Performance 29 -26% 39 25 3% 24 52 13% 46 42 40% 30
Diversified Consumer Services Industry
AcadeMedia AB SW (23) -19% (19) 10 -27% 14 0 10% 0 33 0% 33
Median Performance (23) 19% (19) 10 -27% 14 0 10% 0 33 0% 33
Diversified
TDC A/S DK (202) -24% (163) 54 -4% 56 19 1% 18 275 16% 238
Telecom Italia S.p.A. IT (152) -33% (114) 94 44% 65 10 -21% 12 255 33% 191 Hellenic Telecommunications Organization SA
GR (145) -25% (115) 66 1% 66 20 -4% 21 231 14% 202
TeliaSonera Aktiebolag (publ) SW (13) 37% (20) 43 -1% 43 11 12% 10 67 -9% 74
Cable & Wireless Communications Plc UK 8 -25% 10 39 -15% 46 11 26% 9 42 -4% 44
Elisa Oyj FI 44 24% 35 70 2% 69 23 0% 23 49 -13% 57
Median Performance (47) 13% (42) 53 7% 50 11 1% 11 105 -4% 109
BEST WORST
COMPANyCCC
2014 1 yR%CHANGE
2013DSO
2014 1 yR%CHANGE
2013DIO
2014 1 yR%CHANGE
2013DPO
2014 1 yR%CHANGE
2013COUNTRy
NOTE: For the purpose of the study companies that securitise their receivables have had the value of securitised receivables added back to the overall receivables figure. NM (not meaningful).
companies in working capital management by 2014 CCC

2015 Europe Working Capital Survey I REL I 10
Electric Utilities Industry
TenneT Holding B.V. NL (554) -344% (125) 243 0% 243 5 7% 5 802 115% 372
TERNA - Rete Elettrica Nazionale Società per Azioni
IT (429) 91% (4,853) 136 -60% 340 17 -17% 20 582 -89% 5,213
Elia System Operator SA BE (147) -229% (45) 141 115% 66 15 73% 9 303 155% 119
Helsingin Energia FI 77 14% 68 9 -47% 16 78 -2% 79 9 -68% 28
Electricite de FR SA FR 115 6% 109 116 9% 107 117 8% 109 118 10% 107
Axpo Holding AG CH 117 0% 117 117 3% 113 40 -6% 42 40 4% 38
Median Performance 16 -30% 23 57 0% 57 19 -8% 21 48 2% 47
Electrical Equipment Industry
Gamesa Corporación Tecnológica S.A. ES (70) 25% (94) 141 -25% 188 106 -8% 115 317 -20% 397
PKC Group Oyj FI 26 -21% 33 39 2% 38 57 5% 54 70 18% 59
Prysmian S.p.A. IT 38 28% 30 75 2% 73 83 13% 73 119 2% 117
Alstom SA FR 132 -12% 150 152 -11% 170 67 -5% 70 87 -4% 90
SGL Carbon SE DE 142 2% 139 48 -1% 48 152 1% 151 58 -4% 60
Huber+Suhner AG CH 155 5% 148 64 22% 52 127 11% 114 36 93% 18
Median Performance 78 -3% 81 68 11% 62 83 -1% 83 70 8% 64
Electronic Equipment
Esprinet SpA IT 10 43% 7 44 4% 42 43 4% 42 77 0% 77
Ingenico S.A. FR 27 -3% 28 93 8% 86 49 2% 48 114 8% 105
ALSO Holding AG CH 28 24% 22 39 2% 38 34 13% 30 45 -2% 46
Premier Farnell plc UK 142 3% 139 42 -3% 44 142 5% 135 42 5% 40
Hexagon AB SW 164 11% 148 86 12% 77 133 7% 125 55 2% 54
Jenoptik AG DE 191 9% 176 72 9% 66 170 11% 153 51 18% 43
Median Performance 78 -2% 79 62 1% 61 72 -16% 85 57 2% 56
Energy Equipment and Services Industry
Tecnicas Reunidas, S.A. ES (122) 3% (126) 167 5% 159 4 -9% 5 293 1% 289
Amec Foster Wheeler plc UK (6) -118% 34 138 70% 81 1 361% 0 145 204% 48
Technip SA FR 7 133% (20) 90 1% 89 15 9% 14 98 -20% 122
Petrofac LimitedChannel Islands
214 24% 173 141 25% 112 113 7% 105 40 -11% 45
SBM Offshore N.V. NL 251 39% 180 272 24% 219 1 -41% 1 22 -46% 41
Frank's International N.V. NL 255 1% 252 112 -2% 115 155 -1% 156 13 -33% 19
Median Performance 82 8% 76 83 -6% 89 28 9% 26 52 8% 48
Food and Staples Retailing Industry
Jeronimo Martins SGPS SA PT (57) -1% (57) 1 -9% 2 21 -7% 23 80 -1% 81
Distribuidora Internacional de Alimentación, S.A.
ES (46) -12% (41) 11 40% 8 32 26% 25 89 20% 75
O'KEy GROUP SA LU (42) -7% (39) 1 10% 1 41 16% 35 83 11% 75
Fyffes plc EI 31 10% 29 39 51% 26 33 14% 29 41 54% 26
MARR SpA IT 47 2% 46 99 -7% 106 38 9% 35 89 -6% 95
Amsterdam Commodities NV NL 121 10% 109 41 7% 38 116 21% 96 36 49% 24
Median Performance (12) 6% (11) 9 11% 8 32 6% 30 49 9% 45
BEST WORST
COMPANyCCC
2014 1 yR%CHANGE
2013DSO
2014 1 yR%CHANGE
2013DIO
2014 1 yR%CHANGE
2013DPO
2014 1 yR%CHANGE
2013COUNTRy
NOTE: For the purpose of the study companies that securitise their receivables have had the value of securitised receivables added back to the overall receivables figure. NM (not meaningful).
companies in working capital management by 2014 CCC

11 I REL I 2015 Europe Working Capital Survey
Food Products Industry
Campofrio Food Group, S.A. ES (77) -6% (73) 25 -5% 26 113 -2% 115 215 0% 214
Greencore Group plc EI (39) -4% (37) 26 1% 26 22 -4% 23 87 1% 86
Danone FR (33) 7% (35) 33 6% 31 44 6% 42 110 2% 108
Austevoll Seafood ASA NO 187 -18% 229 42 -18% 51 193 -20% 242 48 -25% 64
Chocoladefabriken Lindt & Sprüngli AG CH 224 17% 192 99 14% 86 182 3% 176 57 -20% 70
Viscofan SA ES 352 2% 344 66 -3% 68 322 -5% 337 35 -42% 61
Median Performance 35 -19% 44 41 11% 37 57 -8% 61 61 3% 59
Gas Utilities Industry
Ascopiave S.p.A. IT (12) -354% 5 92 -6% 98 2 57% 1 106 13% 94
Gas Natural SDG SA ES 9 -32% 14 84 24% 68 23 26% 18 98 35% 72
Rubis FR 30 -5% 32 29 -5% 30 23 -11% 26 22 -12% 25
HMN Naturgas I/S DK 106 17% 90 94 -6% 100 39 30% 30 28 -31% 40
Median Performance 20 -13% 23 88 7% 83 23 4% 22 63 12% 56
Health Care Technology Industry
Agfa-Gevaert N.V. BE 132 -6% 140 75 -12% 85 103 6% 97 46 8% 43
Median Performance 132 -6% 140 75 -12% 85 103 6% 97 46 8% 43
Healthcare Equipment and Supplies Industry
GN Store Nord A/S DK 98 3% 95 95 16% 82 80 -1% 81 77 15% 67
Sartorius Aktiengesellschaft DE 128 0% 129 57 -10% 64 115 -7% 125 45 -26% 60
Sorin SpA IT 129 16% 111 86 11% 77 173 28% 135 130 29% 101
Carl Zeiss Meditec AG DE 187 12% 167 81 -6% 86 150 16% 129 43 -11% 49
Getinge AB SW 187 13% 166 101 5% 96 142 14% 125 56 2% 55
William Demant Holding A/S DK 202 4% 194 78 3% 76 173 2% 171 49 -6% 52
Median Performance 144 -2% 146 85 5% 82 128 2% 125 56 2% 55
Healthcare Providers and Services Industry
Oriola-KD Corporation FI (47) -2% (46) 40 -47% 76 52 -52% 108 140 -39% 231
Korian-Medica FR (32) 22% (41) 23 0% 24 2 -15% 2 57 -14% 66
Générale de Santé Société Anonyme FR (10) -5% (10) 22 9% 20 14 31% 10 46 13% 40
Lifco AB SW 82 0% 82 41 2% 41 71 0% 71 30 1% 29
Fresenius Medical Care AG & Co. KGAA
DE 93 -4% 97 80 -2% 81 38 -7% 41 24 -2% 25
Fresenius SE & Co KGaA DE 98 4% 95 70 7% 65 52 -1% 53 23 1% 23
Median Performance 22 3% 21 40 -5% 42 32 2% 32 45 8% 42
Hotels, Restaurants and Leisure Industry
NH Hoteles S.A. ES (145) -97% (73) 40 15% 35 7 -89% 62 191 13% 170
GTECH S.p.A. IT (129) -34% (97) 90 -16% 108 38 6% 36 258 7% 241
Whitbread PLC UK (117) -8% (108) 11 9% 10 10 2% 10 137 8% 128
Sodexo S.A. FR 28 4% 27 64 5% 61 6 0% 6 42 6% 40
Pierre & Vacances SA FR 85 -12% 96 100 -1% 100 90 14% 80 105 25% 84
Millennium & Copthorne Hotels plc UK 107 112% 51 46 337% 11 83 49% 56 22 39% 16
Median Performance (17) 20% (14) 17 7% 16 10 1% 10 43 8% 40
BEST WORST
COMPANyCCC
2014 1 yR%CHANGE
2013DSO
2014 1 yR%CHANGE
2013DIO
2014 1 yR%CHANGE
2013DPO
2014 1 yR%CHANGE
2013COUNTRy
NOTE: For the purpose of the study companies that securitise their receivables have had the value of securitised receivables added back to the overall receivables figure. NM (not meaningful).
companies in working capital management by 2014 CCC

2015 Europe Working Capital Survey I REL I 12
Household Durables Industry
Kaufman & Broad SA FR (8) -265% 5 113 9% 104 133 -7% 143 254 5% 242
TomTom NV NL 19 30% 15 55 14% 48 40 14% 35 75 11% 68
Electrolux AB SW 21 -29% 30 67 3% 65 58 14% 50 104 21% 86
Crest Nicholson Holdings plc UK 545 10% 497 21 13% 19 654 19% 548 130 87% 70
Redrow plc UK 549 -5% 580 9 -19% 11 624 -6% 665 84 -13% 97
The Berkeley Group Holdings plc UK 731 10% 663 30 7% 28 815 5% 778 114 -21% 144
Median Performance 122 -4% 128 42 -5% 44 133 3% 130 58 24% 47
Household Products Industry
Henkel AG & Co. KGaA DE 3 141% (6) 61 15% 53 71 10% 64 129 5% 124
McBride plc UK 14 -12% 16 66 -1% 66 49 -19% 61 100 -9% 111
Svenska Cellulosa Aktiebolaget SCA (publ) SW 58 -2% 59 59 -3% 61 64 -2% 65 65 -2% 67
PZ Cussons plc UK 90 6% 85 54 0% 54 113 1% 112 77 -5% 81
Median Performance 19 -1% 19 59 9% 54 71 8% 65 97 9% 89
Independent Power Producers and Energy Traders Industry
Pohjolan Voima Oy FI 50 -13% 58 32 -31% 47 41 34% 30 23 17% 19
Statkraft AS NO 68 -8% 74 65 11% 58 32 23% 26 28 184% 10
Median Performance 51 -16% 60 32 -31% 47 37 22% 30 23 127% 10
Industrial Conglomerates Industry
DCC plc EI 2 -63% 5 28 -21% 35 18 21% 14 44 -2% 44
COFIDE - Gruppo De Benedetti SpA IT 2 -78% 10 66 -28% 92 39 103% 19 102 2% 101
Carr's Milling Industries plc UK 47 6% 45 51 4% 49 32 10% 29 36 7% 33
Rheinmetall AG DE 123 12% 110 89 10% 81 133 -4% 138 99 -10% 109
Smiths Group plc UK 123 -6% 130 71 -3% 74 96 -6% 102 44 -3% 46
Siemens Aktiengesellschaft DE 127 -1% 128 74 0% 74 108 1% 107 54 4% 52
Median Performance 96 4% 93 66 -11% 74 71 2% 69 54 4% 52
Internet and Catalog Retail Industry
Cnova N.V. NL (93) -41% (66) 15 5% 14 51 -6% 54 158 18% 134
Selecta Group B.V. NL (24) -142% (10) 20 7% 19 29 12% 26 73 34% 55
Zalando SE DE (19) -109% (9) 23 28% 18 101 -13% 116 143 0% 143
ASOS plc UK 103 -15% 120 3 30% 2 120 -15% 141 20 -11% 23
Findel plc UK 157 -1% 158 140 -3% 143 89 5% 84 71 2% 70
N Brown Group plc UK 279 4% 268 253 3% 246 83 -3% 86 57 -10% 63
Median Performance 67 -2% 69 31 -6% 33 83 8% 77 61 -3% 63
Internet Software and Services Industry
United Internet AG DE (33) -25% (27) 23 23% 19 8 -18% 9 64 17% 54
Cimpress N.V. NL (26) -286% (7) 7 -2% 7 10 41% 7 43 107% 21
Median Performance (30) 78% (17) 23 23% 19 9 8% 8 64 17% 54
BEST WORST
COMPANyCCC
2014 1 yR%CHANGE
2013DSO
2014 1 yR%CHANGE
2013DIO
2014 1 yR%CHANGE
2013DPO
2014 1 yR%CHANGE
2013COUNTRy
NOTE: For the purpose of the study companies that securitise their receivables have had the value of securitised receivables added back to the overall receivables figure. NM (not meaningful).
companies in working capital management by 2014 CCC

13 I REL I 2015 Europe Working Capital Survey
IT Services Industry
Northgate Information Solutions Holdings Limited
UK (181) -30% (139) 49 10% 45 0 152% 0 230 25% 184
ComputaCenter plc UK 3 -92% 30 82 5% 78 7 -16% 8 86 53% 56
Cancom SE DE 5 262% (3) 60 -12% 68 14 9% 13 69 -18% 84
Reply S.p.A. IT 136 -1% 138 165 -5% 173 27 68% 16 56 10% 51
Indra Sistemas, S.A. ES 146 133% 63 196 126% 87 36 -47% 68 86 -6% 92
Engineering Ingegneria Informatica S.p.A.
IT 161 -18% 197 281 -11% 317 0 -71% 0 121 1% 120
Median Performance 25 -32% 37 76 0% 76 14 35% 11 63 17% 53
Leisure Equipment and Products Industry
LEGO A/S DK 60 15% 52 75 7% 70 99 10% 90 114 6% 108
Trigano Société Anonyme FR 77 -26% 104 41 -12% 46 128 -16% 151 91 -2% 93
Amer Sports Corp. FI 140 9% 129 89 1% 88 121 12% 108 69 5% 66
Bénéteau S.A. FR 158 9% 145 57 33% 42 175 8% 163 73 23% 60
Median Performance 136 5% 129 57 23% 46 128 -13% 147 73 10% 66
Life Sciences Tools and Services Industry
Eurofins Scientific SA LU 51 -3% 52 83 2% 81 8 8% 7 40 11% 36
Gerresheimer AG DE 86 3% 83 59 6% 56 76 -4% 79 49 -5% 51
Qiagen NV NL 141 5% 135 72 -1% 73 106 4% 102 37 -9% 41
Lonza Group Ltd CH 153 27% 121 62 10% 57 128 24% 104 37 -6% 40
Median Performance 125 3% 121 72 -1% 73 76 -4% 79 37 -6% 40
Machinery Industry
Carraro SpA IT (19) -787% 3 38 -4% 39 97 21% 80 154 31% 117
Melrose Industries PLC UK 4 -94% 65 68 30% 52 69 -9% 76 134 111% 63
Duro Felguera, S.A. ES 20 40% 14 158 2% 155 15 33% 11 153 0% 152
Wacker Neuson SE DE 194 7% 183 49 -5% 52 171 13% 151 26 30% 20
Heidelberger Druckmaschinen Aktiengesellschaft
DE 208 -1% 209 56 -4% 58 199 5% 189 47 26% 38
TRUMPF GmbH + Co. KG DE 211 3% 204 80 8% 74 173 2% 169 41 7% 39
Median Performance 113 14% 99 67 4% 64 100 1% 99 61 7% 57
Marine Industry
Hapag-Lloyd AG DE (23) -337% (5) 38 46% 26 9 -14% 10 70 68% 42
A.P. Møller - Mærsk A/S DK (12) -64% (7) 31 -12% 36 12 -8% 13 55 -1% 56
CMA CGM S.A. FR (3) -114% 23 52 28% 41 9 -22% 12 64 122% 29
Stolt-Nielsen Limited UK 27 -10% 30 34 0% 34 13 -16% 15 20 3% 19
Wilh. Wilhelmsen Holding ASA NO 32 -3% 33 59 -7% 63 45 -12% 52 72 -12% 82
DryShips, Inc. GR 38 -3% 39 68 -14% 79 8 -41% 13 37 -29% 52
Median Performance 18 -31% 27 39 1% 38 10 -23% 13 43 21% 35
BEST WORST
COMPANyCCC
2014 1 yR%CHANGE
2013DSO
2014 1 yR%CHANGE
2013DIO
2014 1 yR%CHANGE
2013DPO
2014 1 yR%CHANGE
2013COUNTRy
NOTE: For the purpose of the study companies that securitise their receivables have had the value of securitised receivables added back to the overall receivables figure. NM (not meaningful).
companies in working capital management by 2014 CCC

2015 Europe Working Capital Survey I REL I 14
Media Industry
Numericable-SFR FR (603) -157% (234) 312 306% 77 70 112% 33 985 186% 344
Publicis Groupe SA FR (381) -10% (347) 386 5% 367 26 0% 26 793 7% 740
NOS SGPS SA PT (226) -122% (102) 95 -8% 103 30 17% 25 351 53% 230
Pearson plc UK 55 15% 48 72 16% 62 37 5% 35 55 9% 50
ITV plc UK 58 11% 52 39 -16% 47 34 48% 23 15 -15% 18
Solocal Group SA FR 115 22% 94 172 16% 148 1 25% 1 58 7% 55
Median Performance (16) 47% (11) 72 5% 69 10 -24% 13 89 6% 84
Metals and Mining Industry
Vedanta Resources plc UK (74) -40% (53) 20 2% 20 63 0% 63 157 16% 136
New World Resources Plc NL 8 -5% 8 29 -9% 32 24 88% 13 45 24% 36
Antofagasta plc UK 12 -80% 57 56 21% 46 39 -37% 61 83 66% 50
Elval Hellenic Aluminium Industry SA GR 137 0% 137 57 8% 52 113 1% 112 32 16% 27
Schmolz + Bickenbach AG CH 138 6% 130 48 -4% 50 150 14% 131 60 15% 52
TUBACEX S.A. ES 232 17% 199 59 -10% 66 268 26% 212 95 21% 79
Median Performance 75 1% 74 37 1% 37 89 -1% 90 52 13% 46
Multiline Retail Industry
Marks & Spencer Group plc UK (12) -54% (8) 4 14% 4 47 7% 44 64 14% 56
Debenhams plc UK 7 35% 6 4 26% 3 62 -6% 66 59 -8% 64
Poundland Group plc UK 25 -16% 30 9 6% 9 52 -2% 53 36 13% 32
Mothercare plc UK 38 -8% 41 21 17% 18 53 -17% 63 36 -10% 40
Stockmann Oyj ABP FI 57 -21% 73 4 -65% 11 89 -11% 100 35 -8% 38
Next Plc UK 97 13% 85 69 8% 64 56 13% 50 28 0% 28
Median Performance 31 -11% 35 7 -31% 10 54 -6% 58 36 -8% 39
Multi-Utilities Industry
National Grid plc UK (123) 28% (171) 39 17% 34 20 -39% 33 183 -23% 237
Eneco Holding NV NL (108) -46% (74) 59 0% 59 6 4% 6 173 24% 139
ACEA S.p.A. IT (54) -386% (11) 157 1% 156 5 3% 5 216 26% 172
E.ON SE DE 43 -13% 49 39 -11% 44 12 -13% 14 8 -6% 9
Centrica plc UK 46 -5% 49 51 -11% 57 8 -10% 9 13 -28% 18
Telecom Plus plc UK 67 -9% 73 70 -8% 76 1 234% 0 5 47% 3
Median Performance 3 -80% 15 51 -12% 58 10 -12% 12 62 6% 59
Oil, Gas and Consumable Fuels Industry
Hellenic Petroleum SA GR (63) -182% (22) 11 -26% 15 25 -36% 39 99 29% 77
Fluxys BE SA BE (29) -157% 52 60 58% 38 59 -20% 75 148 144% 61
Nostrum Oil & Gas Plc NL (26) -33% (19) 14 -48% 27 42 49% 28 82 9% 75
Repsol, S.A. ES 57 -11% 65 40 3% 38 44 -20% 55 26 -9% 29
Premier Oil plc UK 71 17% 61 92 22% 75 10 -54% 21 30 -14% 35
Nynas AB SW 79 -1% 79 26 -12% 29 66 1% 65 13 -16% 16
Median Performance 12 -51% 25 29 -19% 36 28 -12% 32 33 -16% 39
BEST WORST
COMPANyCCC
2014 1 yR%CHANGE
2013DSO
2014 1 yR%CHANGE
2013DIO
2014 1 yR%CHANGE
2013DPO
2014 1 yR%CHANGE
2013COUNTRy
NOTE: For the purpose of the study companies that securitise their receivables have had the value of securitised receivables added back to the overall receivables figure. NM (not meaningful).
companies in working capital management by 2014 CCC

15 I REL I 2015 Europe Working Capital Survey
Paper and Forest Products Industry
ENCE Energia y Celulosa SA ES (43) 3% (44) 52 10% 48 36 -41% 60 131 -14% 152
Sonae Indústria, S.G.P.S., S.A. PT (3) -114% 18 35 -13% 40 65 -15% 77 103 4% 100
Munksjö Oyj SW 28 -23% 37 36 -33% 54 100 -17% 120 108 -21% 137
Metsä Board Oyj FI 72 -17% 87 46 -1% 46 86 5% 82 60 45% 42
UPM-Kymmene Oyj FI 73 4% 71 52 3% 51 57 7% 54 36 7% 34
Holmen Aktiebolag (publ) SW 108 17% 92 52 12% 46 135 7% 126 80 -1% 81
Median Performance 47 -13% 54 48 3% 46 73 0% 73 63 5% 59
Personal Products Industry
L'Oreal SA FR (55) 0% (55) 53 7% 50 127 6% 119 236 5% 224
Ontex Group N.V. BE 29 1% 29 46 -5% 49 63 3% 61 79 -1% 80
Beiersdorf AG DE 38 41% 27 74 13% 65 121 2% 119 158 0% 157
Oriflame Cosmetics SA LU 99 -34% 150 23 78% 13 155 -9% 171 79 132% 34
Median Performance 34 20% 28 50 1% 49 124 4% 119 119 0% 119
Pharmaceuticals Industry
H. Lundbeck A/S DK (180) -20% (150) 78 25% 63 175 -3% 180 433 10% 393
AstraZeneca PLC UK (31) -185% 36 67 -15% 78 125 -8% 136 222 25% 178
Galenica Ltd. CH 56 3% 54 51 -2% 53 62 6% 58 57 1% 57
Endo International plc EI 203 44% 140 157 55% 101 129 -2% 131 83 -10% 92
Novo Nordisk A/S DK 214 14% 189 54 13% 48 285 15% 247 124 17% 106
Roche Holding AG CH 216 19% 181 65 0% 65 219 31% 167 68 34% 50
Median Performance 141 -7% 152 67 0% 67 156 -2% 159 108 5% 103
Professional Services Industry
Experian plc EI 30 16% 26 51 0% 50 0 -72% 1 21 -18% 26
DKSH Holding Ltd. CH 32 8% 30 69 13% 61 40 15% 34 77 17% 66
SGS SA CH 71 13% 63 79 7% 74 13 20% 11 22 -4% 22
Intertek Group plc UK 87 64% 53 92 53% 60 3 25% 2 8 -13% 10
Bertrandt AG DE 98 -2% 100 105 -1% 106 0 -27% 0 6 8% 6
Pöyry PLC FI 129 8% 119 73 4% 70 77 5% 73 20 -15% 24
Median Performance 73 18% 62 67 12% 60 3 45% 2 22 -4% 22
Road and Rail Industry
Schweizerische Bundesbahnen SBB AG CH (18) 11% (20) 23 -12% 26 29 2% 29 70 -6% 75
Société Nationale des Chemins de fer Français
FR (15) 5% (16) 42 -16% 51 10 -36% 16 68 -18% 82
Deutsche Bahn Aktiengesellschaft DE (8) -469% (1) 38 -1% 38 11 1% 11 56 13% 50
Northgate plc UK 34 -7% 37 42 1% 41 16 7% 15 23 22% 19
Motability Operations Group Plc UK 40 15% 35 27 0% 27 27 16% 23 14 -11% 16
NSB AS NO 66 17% 56 22 -9% 24 74 10% 68 31 -15% 36
Median Performance (3) -6% (3) 25 -5% 26 11 -28% 15 31 -9% 34
BEST WORST
COMPANyCCC
2014 1 yR%CHANGE
2013DSO
2014 1 yR%CHANGE
2013DIO
2014 1 yR%CHANGE
2013DPO
2014 1 yR%CHANGE
2013COUNTRy
NOTE: For the purpose of the study companies that securitise their receivables have had the value of securitised receivables added back to the overall receivables figure. NM (not meaningful).
companies in working capital management by 2014 CCC
2015 Europe Working Capital Survey I REL I 16
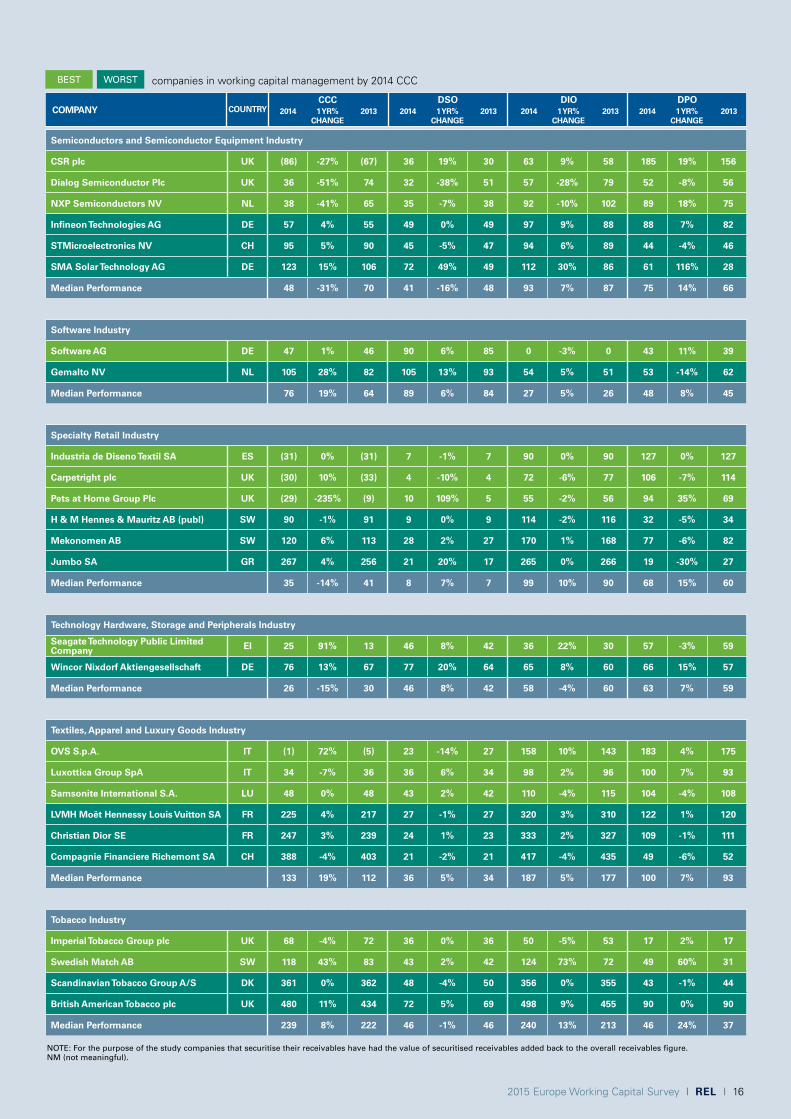
Semiconductors and Semiconductor Equipment Industry
CSR plc UK (86) -27% (67) 36 19% 30 63 9% 58 185 19% 156
Dialog Semiconductor Plc UK 36 -51% 74 32 -38% 51 57 -28% 79 52 -8% 56
NXP Semiconductors NV NL 38 -41% 65 35 -7% 38 92 -10% 102 89 18% 75
Infineon Technologies AG DE 57 4% 55 49 0% 49 97 9% 88 88 7% 82
STMicroelectronics NV CH 95 5% 90 45 -5% 47 94 6% 89 44 -4% 46
SMA Solar Technology AG DE 123 15% 106 72 49% 49 112 30% 86 61 116% 28
Median Performance 48 -31% 70 41 -16% 48 93 7% 87 75 14% 66
Software Industry
Software AG DE 47 1% 46 90 6% 85 0 -3% 0 43 11% 39
Gemalto NV NL 105 28% 82 105 13% 93 54 5% 51 53 -14% 62
Median Performance 76 19% 64 89 6% 84 27 5% 26 48 8% 45
Specialty Retail Industry
Industria de Diseno Textil SA ES (31) 0% (31) 7 -1% 7 90 0% 90 127 0% 127
Carpetright plc UK (30) 10% (33) 4 -10% 4 72 -6% 77 106 -7% 114
Pets at Home Group Plc UK (29) -235% (9) 10 109% 5 55 -2% 56 94 35% 69
H & M Hennes & Mauritz AB (publ) SW 90 -1% 91 9 0% 9 114 -2% 116 32 -5% 34
Mekonomen AB SW 120 6% 113 28 2% 27 170 1% 168 77 -6% 82
Jumbo SA GR 267 4% 256 21 20% 17 265 0% 266 19 -30% 27
Median Performance 35 -14% 41 8 7% 7 99 10% 90 68 15% 60
Technology Hardware, Storage and Peripherals Industry
Seagate Technology Public Limited Company EI 25 91% 13 46 8% 42 36 22% 30 57 -3% 59
Wincor Nixdorf Aktiengesellschaft DE 76 13% 67 77 20% 64 65 8% 60 66 15% 57
Median Performance 26 -15% 30 46 8% 42 58 -4% 60 63 7% 59
Textiles, Apparel and Luxury Goods Industry
OVS S.p.A. IT (1) 72% (5) 23 -14% 27 158 10% 143 183 4% 175
Luxottica Group SpA IT 34 -7% 36 36 6% 34 98 2% 96 100 7% 93
Samsonite International S.A. LU 48 0% 48 43 2% 42 110 -4% 115 104 -4% 108
LVMH Moët Hennessy Louis Vuitton SA FR 225 4% 217 27 -1% 27 320 3% 310 122 1% 120
Christian Dior SE FR 247 3% 239 24 1% 23 333 2% 327 109 -1% 111
Compagnie Financiere Richemont SA CH 388 -4% 403 21 -2% 21 417 -4% 435 49 -6% 52
Median Performance 133 19% 112 36 5% 34 187 5% 177 100 7% 93
Tobacco Industry
Imperial Tobacco Group plc UK 68 -4% 72 36 0% 36 50 -5% 53 17 2% 17
Swedish Match AB SW 118 43% 83 43 2% 42 124 73% 72 49 60% 31
Scandinavian Tobacco Group A/S DK 361 0% 362 48 -4% 50 356 0% 355 43 -1% 44
British American Tobacco plc UK 480 11% 434 72 5% 69 498 9% 455 90 0% 90
Median Performance 239 8% 222 46 -1% 46 240 13% 213 46 24% 37
BEST WORST
COMPANyCCC
2014 1 yR%CHANGE
2013DSO
2014 1 yR%CHANGE
2013DIO
2014 1 yR%CHANGE
2013DPO
2014 1 yR%CHANGE
2013COUNTRy
NOTE: For the purpose of the study companies that securitise their receivables have had the value of securitised receivables added back to the overall receivables figure. NM (not meaningful).
companies in working capital management by 2014 CCC

17 I REL I 2015 Europe Working Capital Survey
Trading Companies and Distributors Industry
Cramo Oyj FI (12) -2% (12) 56 3% 54 15 21% 13 83 6% 79
Travis Perkins plc UK 13 -58% 32 61 47% 41 69 -1% 69 117 48% 79
Grafton Group plc EI 21 12% 18 53 38% 39 46 -33% 69 79 -12% 89
Jacquet Metal Service S.A. FR 106 31% 81 47 4% 45 123 15% 108 64 -11% 72
Indutrade AB (publ) SW 112 -5% 118 64 7% 59 91 -6% 97 43 14% 38
Beijer Ref AB (publ) SW 159 6% 150 76 2% 75 142 5% 135 59 -2% 60
Median Performance 53 1% 53 53 -1% 54 56 -15% 66 59 -2% 60
Transportation Infrastructure Industry
Aéroports de Paris Société Anonyme FR (67) -106019% (0) 67 -8% 72 6 -3% 6 140 78% 79
Avinor AS NO (59) -374% (12) 41 4% 39 3 -1% 3 102 88% 54
Groupe Eurotunnel SA FR (57) -923% (6) 44 1% 44 2 -12% 2 103 100% 51
Flughafen Zürich AG CH 6 48% 4 42 -9% 46 10 -8% 10 45 -13% 52
BBA Aviation plc UK 34 -4% 35 44 9% 41 40 0% 41 51 11% 46
Ansaldo STS SpA IT 202 33% 152 284 7% 265 33 -36% 52 116 -30% 165
Median Performance (23) 505% (4) 44 0% 44 10 0% 10 85 59% 53
Water Utilities Industry
Southern Water Services Ltd. UK 21 -1% 21 36 0% 36 2 25% 1 17 2% 17
Severn Trent Plc UK 46 -16% 55 50 -4% 52 21 -16% 25 25 10% 23
Median Performance 44 114% 21 50 -4% 52 9 6% 8 25 10% 23
Wireless Telecommunication Services Industry
VimpelCom Ltd. NL (254) -1% (250) 34 -10% 38 9 -27% 12 297 -1% 300 Vodafone Group Public Limited Company
UK (21) -55% (14) 35 3% 34 6 19% 5 62 18% 53
freenet AG DE 6 163% 2 49 1% 48 12 23% 10 55 -1% 56
Tele2 AB (publ) SW 29 -13% 34 86 -13% 99 12 6% 11 69 -10% 77
Median Performance (6) 236% (2) 35 -7% 38 12 3% 11 62 12% 56
BEST WORST
COMPANyCCC
2014 1 yR%CHANGE
2013DSO
2014 1 yR%CHANGE
2013DIO
2014 1 yR%CHANGE
2013DPO
2014 1 yR%CHANGE
2013COUNTRy
NOTE: For the purpose of the study companies that securitise their receivables have had the value of securitised receivables added back to the overall receivables figure. NM (not meaningful).
“REL hit the bull’s eye with a pragmatic, straight forward process that met our needs. Their professionals found real solutions that our team embraced and implemented with line of sight impact on our target KPI. These guys get the job done.”
Tim Wild,Vice President,
Supply Chain, Brunswick Boat Group
“REL brings in good professionals, who roll up their sleeves and start working with local teams to make things happen. They have a hands-on mentality and a no-nonsense approach. They are not like typical consultants who only give you plans to follow.”
Rens Blankers, Head of Shared Business Services Finance
Philips
companies in working capital management by 2014 CCC
2015 Europe Working Capital Survey I REL I 18
Scorecard methodologyThe REL’s working capital survey calculates working capital performance based on the latest publicly available annual financial statements of the 1,0002 largest listed non-financial companies with headquarters in the US. The survey takes an industry-based approach to ranking companies according to the four key working capital metrics: days sales outstanding (DSO), days inventory outstanding (DIO), days payables outstanding (DPO) and cash conversion cycle (CCC). For each industry the companies are ranked according to overall CCC, the top three and bottom three performers are listed in the scorecard.
Companies are classified according to the Standard and Poor’s Global Industry Classification Standard (GICS), using data sourced from S&P Capital IQ. Historical comparisons within the survey are made on a like-for-like basis. Where off-balance sheet arrangements are used by the company, adjustments have been made to the data in order to provide true, consistent and comparable figures.
Days Sales Outstanding (DSO) = Accounts Receivable/(One day revenue) – Year-end trade receivables net of allowance for doubtful accounts, divided by one day of average
revenue– A decrease in DSO represents an improvement, an increase a deterioration
Days Inventory Outstanding (DIO) = Inventory/(One Day Cost of Goods Sold (COGS))– Year-end inventory balance divided by average days COGS– A decrease is an improvement, an increase a deterioration
Days Payables Outstanding (DPO) = Accounts Payable/(One Day COGS)– Year-end trade accounts payable balance divided by average days COGS– An increase in DPO represents an improvement, a decrease a deterioration
Cash Conversion Cycle (CCC) = (DSO + DIO - DPO)– Year-end DSO + DIO - DPO performance (in days as calculated above)– The lower the number of days, the better
2 REL targets the 1,000 largest (by revenue) publicly traded companies for inclusion in the survey. To be included in the survey
the companies must file their FY2014 financials before the survey closes. This year, the survey included 947.

19 I REL I 2015 Europe Working Capital Survey
ATLANTA1000 Abernathy Road NWSuite 1400Atlanta, GA 30328
CHICAGO525 W. Monroe StreetSuite 1550Chicago, IL 60661
FRANKFURTTorhaus WesthafenSpeicherstrasse 5960327 Frankfurt am Main
HyDERABADPlot# 6, 1-55/4/RP/L1/W1&W2Raja Prasadam, KondapurHyderabad 500084, India +91 40 4488 4000
LONDONMartin House5 Martin LaneLondon EC4R 0DP
MONTEVIDEOWTC Free ZoneDr. Luis Bonavita 1294, Office 1701Montevideo, Uruguay 11300
MIAMI1001 Brickell Bay Drive30th FloorMiami, Florida 33131
NEW yORK270 Madison AvenueSuite 401New York, NY 10016
PARIS8, rue de Port Mahon75002 Paris
PHILADELPHIA101 West Elm StreetSuite 330Conshohocken, PA 19428
SAN FRANCISCO505 Montgomery Street10th FloorSan Francisco, CA 94111
SyDNEySuite 40335 Lime StreetSydney, NSW2000Australia
VANCOUVER7360 137 StreetSuite 382Surrey, Vancouver, BCV3W 1A3, Canada
To receive a complimentary cash flow assessment, call +44 20 7398 9100 or register your details online to take the first step toward releasing more cash from your operations today. To download our Working Capital Survey and its summary of findings, please register your details at www.thehackettgroup.com/workingcapital.
About REL
REL, a division of The Hackett Group, Inc., is a world-leading
consulting firm dedicated to delivering sustainable cash flow
improvement from working capital and across business operations.
REL’s tailored solutions balance client trade-offs between working
capital, operating costs, service performance and risk. REL’s expertise
has helped clients free up billions in cash, creating the financial
freedom to fund acquisitions, product development, debt reduction
and share buy-back programs. In-depth process expertise, analytical
rigor and collaborative client relationships enable REL to deliver an
exceptional return on investment in a short timeframe. REL has
delivered work in over 60 countries for Global 1000 companies.
About The Hackett Group
The Hackett Group (NASDAQ: HCKT) is an intellectual property-based
strategic consultancy and leading enterprise benchmarking and best
practices implementation firm to global companies. Services include
business transformation, enterprise performance management,
working capital management, and global business services. The
Hackett Group also provides dedicated expertise in business
strategy, operations, finance, human capital management, strategic
sourcing, procurement and information technology, including its
award-winning Oracle EPM and SAP practices.
The Hackett Group has completed more than 11,000 benchmarking
studies with major corporations and government agencies,
including 93% of the Dow Jones Industrials, 86% of the Fortune 100,
87% of the DAX 30 and 51% of the FTSE 100. These studies drive its
Best Practice Intelligence Center™, which includes the firm’s
benchmarking metrics, best practices repository, and best practice
configuration guides and process flows. It is this intellectual capital
that enables The Hackett Group’s clients and partners to achieve
world-class performance.
www.thehackettgroup.com
© 2015 The Hackett Group, Inc.; All Rights Reserved