Europe & Israel 1Q15 VC Trends Review
40
Venture Capital in Europe & Israel Venture Investment Data: First Quarter, 2015 Prepared by Gil Dibner @gdibner blog: yankeesabralimey Marsaxlokk Harbor, Malta, population 4,000
-
Upload
gil-dibner -
Category
Technology
-
view
5.564 -
download
0
Transcript of Europe & Israel 1Q15 VC Trends Review

Venture Capital in Europe & Israel Venture Investment Data: First Quarter, 2015
Prepared by Gil Dibner @gdibner blog: yankeesabralimey Marsaxlokk Harbor, Malta, population 4,000

The data • Around the middle of last year, I decided I wasn’t happy with available data sources on VC
rounds in Europe & Israel, and that I’d need to build my own • The data in this report consists entirely of data I’ve gathered manually based on publically
available, free sources • No paid data sources or API calls were harmed in the making of this dataset, every
investment was manually classified • This allows analysis of some aspects of the data I consider important – aspects that don’t
appear in other data sources • Seed investment is still under-reported, but I got a bit better at capturing it in the fourth
quarter. Rounds smaller than $500K are generally excluded from this analysis • The analysis is limited to ICT categories and excludes life sciences • The analysis excludes Turkey and FSU countries • I’m converting EUR and GBP into USD using monthly average exchange rates
2 @gdibner blog: yankeesabralimey Syndicate for European & Israeli Enterprise Companies

Monthly pace of venture investment • During the nine months
ended March, 2015, there were 596 reported venture investments across Europe & Israel
• A total of $6.487B was invested in Europe & Israel during this period, an average of $721M per month
• During these nine months, January, February, and March were each – in turn – record-breaking months
• March saw $998M invested across 103 rounds
@gdibner blog: yankeesabralimey 3
493565
644 625562
725
903971 998
42 30 50 79 73 5292 75 103
0
200
400
600
800
1,000
1,200
Jul Aug Sep Oct Nov Dec Jan Feb Mar
Qtr3 Qtr4 Qtr1
2014 2015
Num
ber o
f inv
estm
ents
VC Investments in Europe & Israel, July 2014 - March 2015
Invested amount (US $M) Number of investments
Syndicate for European & Israeli Enterprise Companies

Quarterly pace of venture investment • The first quarter of 2015 saw
a significant uptick in activity over the third and fourth quarters of 2014
• In 1Q15, over $2.8B was invested across 270 companies in Europe & Israel
4 @gdibner blog: yankeesabralimey
1,7031,912
2,872122
204
270
0
500
1,000
1,500
2,000
2,500
3,000
3,500
0
50
100
150
200
250
300
Qtr3 Qtr4 Qtr1
2014 2015
Amou
nt in
vest
ed (U
S $M
)
Num
ber o
f inv
estm
ents
VC Investments in Europe & Israel
Invested amount (US $M) Number of investments
Syndicate for European & Israeli Enterprise Companies

Mega-rounds skew the investment totals • This analysis breaks down VC
investments into brackets by size: • Seed (less than $2M) • Early venture ($2-8M) • Venture ($8-20M) • Growth ($20-100M) • Mega ($100M+)
• Five mega-rounds took place in Europe in the first quarter:
• Taboola, an Israeli content-recommendation company, raised $117M in February
• Sigfox, a French wireless network for IoT, raised $115M in February
• WorldRemit, a British money transfer company raised $100M in February
• Simplivity, an Israeli enterprise systems company, raised $175M in March
• Financial Force, a British ERP SaaS provider, raised $110M in March
• Even adjusting for mega-rounds, 1Q is still significantly above the previous two quarters
5 @gdibner blog: yankeesabralimey
98 57 92 121 120 102 85 82 118118
60168 109 76 127 169 226 161
171 342 26
366340 229
613
153
387
0
200
400
600
800
1,000
1,200
Jul Aug Sep Oct Nov Dec Jan Feb Mar
Qtr3 Qtr4 Qtr1
2014 2015
Amou
nt In
vest
ed (U
S $M
)
Pace of VC Investment in Europe and Israel
Mega (>100) Growth (20-100) Venture (8-20) Early Venture (2-8) Seed (.5-2)
Syndicate for European & Israeli Enterprise Companies
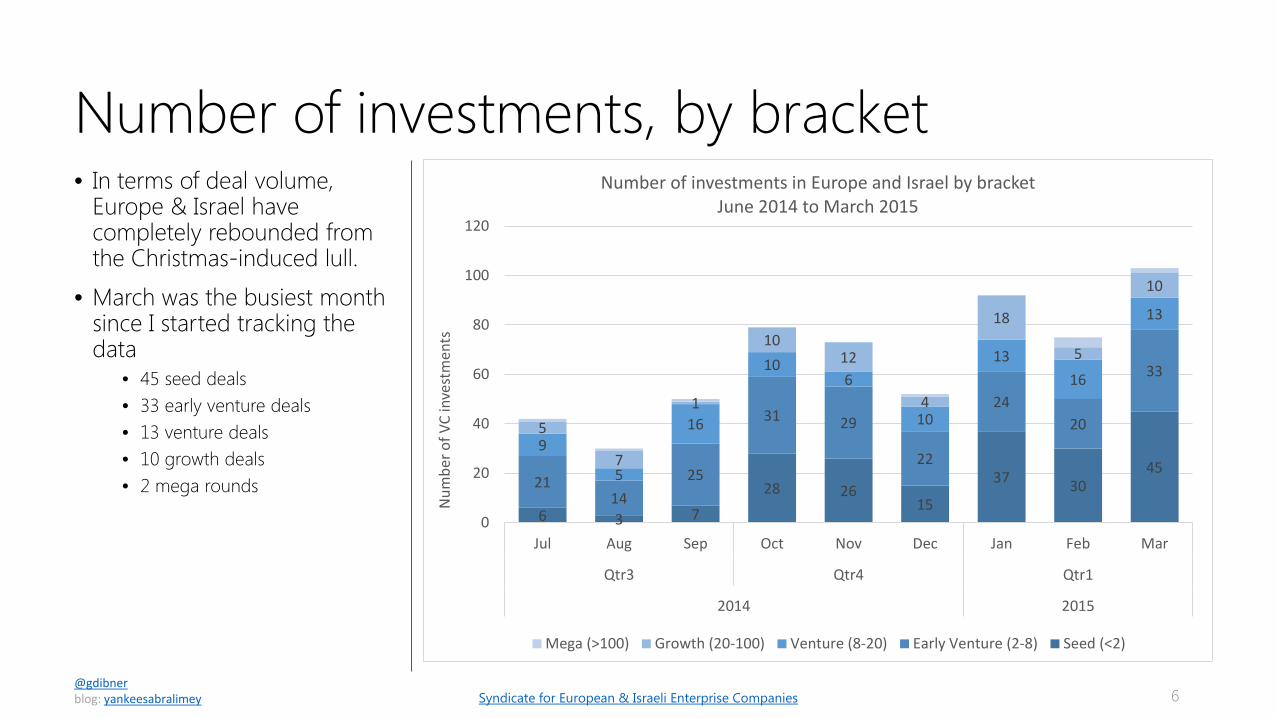
Number of investments, by bracket • In terms of deal volume,
Europe & Israel have completely rebounded from the Christmas-induced lull.
• March was the busiest month since I started tracking the data
• 45 seed deals • 33 early venture deals • 13 venture deals • 10 growth deals • 2 mega rounds
6 @gdibner blog: yankeesabralimey
6 3 7
28 2615
37 3045
2114
25
31 29
22
2420
33
9
5
16
106
10
1316
13
5
7
1
1012
4
18
5
10
0
20
40
60
80
100
120
Jul Aug Sep Oct Nov Dec Jan Feb Mar
Qtr3 Qtr4 Qtr1
2014 2015
Num
ber o
f VC
inve
stm
ents
Number of investments in Europe and Israel by bracketJune 2014 to March 2015
Mega (>100) Growth (20-100) Venture (8-20) Early Venture (2-8) Seed (<2)
Syndicate for European & Israeli Enterprise Companies
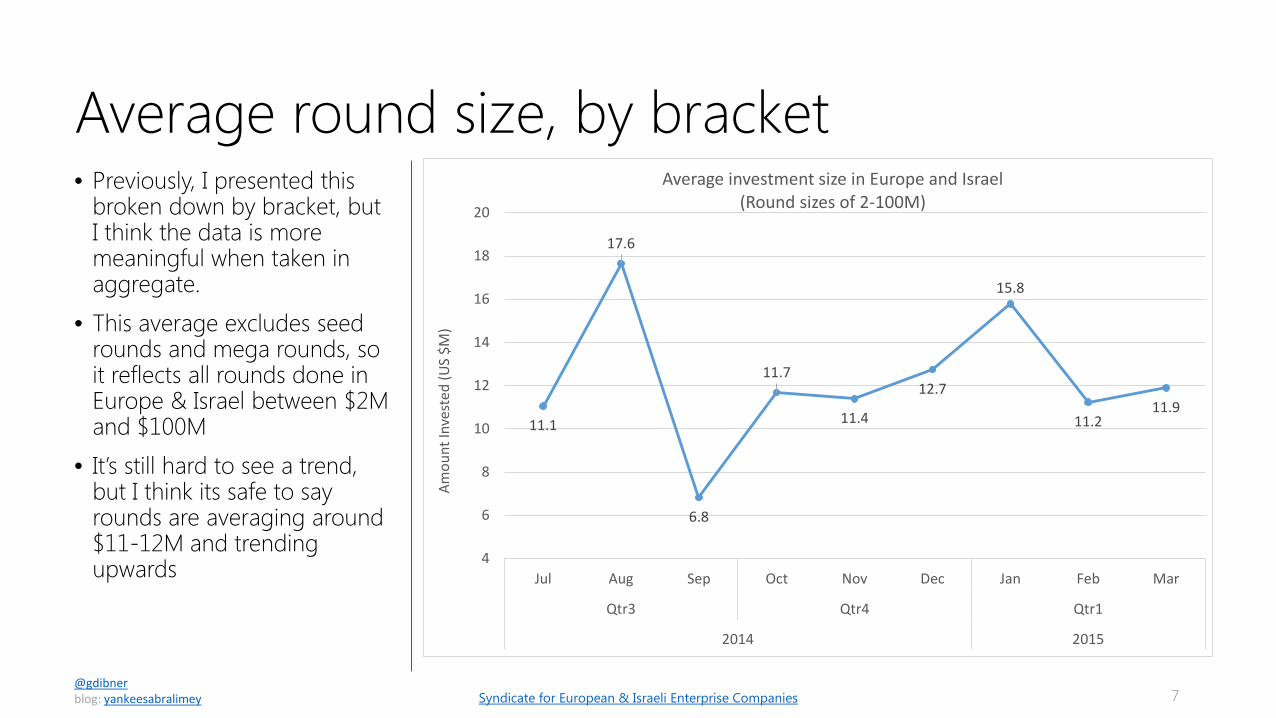
Average round size, by bracket • Previously, I presented this
broken down by bracket, but I think the data is more meaningful when taken in aggregate.
• This average excludes seed rounds and mega rounds, so it reflects all rounds done in Europe & Israel between $2M and $100M
• It’s still hard to see a trend, but I think its safe to say rounds are averaging around $11-12M and trending upwards
7 @gdibner blog: yankeesabralimey
11.1
17.6
6.8
11.7
11.4
12.7
15.8
11.211.9
4
6
8
10
12
14
16
18
20
Jul Aug Sep Oct Nov Dec Jan Feb Mar
Qtr3 Qtr4 Qtr1
2014 2015
Amou
nt In
vest
ed (U
S $M
)
Average investment size in Europe and Israel(Round sizes of 2-100M)
Syndicate for European & Israeli Enterprise Companies

Total venture investment by country, 2H 2014 • The UK overtook Israel to
regain its position as the country with the largest amount of VC activity in 1Q15
• Germany, France, and Sweden rounded out the rest of the top five
8 @gdibner blog: yankeesabralimey
930.1834.6
537.6233.0
88.952.750.6
38.934.3
23.417.2
7.85.43.83.42.72.51.31.00.90.90.60.3
UKIsrael
GermanyFrance
SwedenSpain
DenmarkNetherlandsSwitzerland
EstoniaFinland
BelgiumItaly
NorwayLatvia
IrelandPolandAustria
PortugalIcelandSerbia
LithuaniaGreece
0 100 200 300 400 500 600 700 800 900 1,000
Total VC investment volume by country, 1Q15 (US $M)
Syndicate for European & Israeli Enterprise Companies

Total venture investment by country, 3Q & 4Q 2014 • To get a better sense of VC
volumes in various countries, this analysis excludes mega-rounds
• UK venture activity skyrocketed in 1Q15, doubling that of 3Q14
• Investment volume in Israel stayed roughly flat from a record-breaking 4Q
• Investment volume in Germany continued to show strong increases
• France & Sweden both declined slightly, but France held on to its fourth place slot
9 @gdibner blog: yankeesabralimey
Israel, 315.2
Israel, 567.5
Israel, 542.6
UK, 369.0
UK, 262.9
UK, 720.1
Germany, 180.2
Germany, 284.4Germany, 388.6
France, 29.3
France, 163.3
France, 118.0Sweden, 74.4 Sweden, 123.2 Sweden, 88.9
Qtr3 Qtr4 Qtr10
100
200
300
400
500
600
700
800
Tota
l VC
inve
stm
ent (
US
$M)
Total VC investment, 3Q14 - 1Q15 (top 5 countries, excluding mega-rounds)
Syndicate for European & Israeli Enterprise Companies

Average venture round sizes, by country • Looking across all VC deals in
the second half of 2014, it’s possible to draw some conclusions about the funding environments in various countries
• This analysis excludes mega-rounds and rounds less than $2M
• UK & Ireland companies raised the largest round sizes on average in 1Q, a significant jump from 4Q
• DACH startups seem to raise consistently large rounds on average
10 @gdibner blog: yankeesabralimey
Benelux, 10.6
Benelux, 4.7
Benelux, 7.2
DACH, 18.0
DACH, 14.9DACH, 14.4
France, 3.7
France, 5.6
Iberia, 10.4
Iberia, 7.2
Iberia, 14.1
Israel, 11.6
Israel, 15.9
Israel, 12.1
Nordic, 7.7
Nordic, 11.5Nordic, 11.4
UK & Ireland, 11.9
UK & Ireland, 18.9
0.0
2.0
4.0
6.0
8.0
10.0
12.0
14.0
16.0
18.0
20.0
Qtr3 Qtr4 Qtr1
2014 2015
Aver
age
roun
d siz
e (U
S $M
)
Average investment size in Europe and Israel (rounds of $2-20M)
Syndicate for European & Israeli Enterprise Companies

Total venture investment by region, 3Q14 to 1Q15 • When VC investments across
Europe are aggregated into regions, Israel, DACH, UK & Ireland, the Nordics, and France are the clear and consistent leaders
• Benelux, Iberia, Southern Europe, and Eastern Europe do produce meaningful VC investments (Adyen, Prezi, and many others), but the volumes are still low
11 @gdibner blog: yankeesabralimey
Israel, 315.2Israel, 567.5
Israel, 834.6UK & Ireland, 399.0
UK & Ireland, 262.9
UK & Ireland, 932.8
DACH, 532.2 DACH, 290.2
DACH, 573.2
Nordic, 124.0 Nordic, 219.3
Nordic, 188.6
France, 129.3 France, 163.3
France, 233.0
Benelux, 284.9Iberia, 168.1
0
500
1,000
1,500
2,000
2,500
3,000
3,500
Qtr3 Qtr4 Qtr1
2014 2015
Tota
l VC
inve
stm
ent (
US
$M)
Total VC investment by region
Israel UK & IrelandDACH NordicFrance BeneluxIberia East. Eur.South. Eur.
Syndicate for European & Israeli Enterprise Companies

Rounds by bracket & country • To get a better sense of deal
volume, this analysis excludes seed deals which are often poorly reported
• Excluding seed deals, Israel led the region in the number of VC deals reported
• The UK and France followed • Interestingly, France and the
UK saw an equal number of early venture and growth deals, but the UK saw 13 “venture deals” compared to only 5 in France
12 @gdibner blog: yankeesabralimey
17 15 15 158
4
18
13
52
3
9
9
9
3
2
2
0
5
10
15
20
25
30
35
40
45
50
Israel UK &Ireland
DACH France Nordic Benelux Iberia East. Eur. South. Eur.
Num
ber o
f inv
estm
ents
Number of investments in Europe and Israel by bracket, 1Q 2015
Mega (>100) Growth (20-100) Venture (8-20) Early Venture (2-8)
Syndicate for European & Israeli Enterprise Companies

Investment by region, by bracket • In 1Q, UK & Ireland led in
terms of total VC dollars invested, even with mega-rounds included
• Israeli was in second place, DACH was third
• Excluding Sigfox’s $115M, France came in fifth; including it would catapult France ahead of the Nordics
13 @gdibner blog: yankeesabralimey
74 70 46 28 45
165 235
63 49
460226
308
82
210
292
149
115
0
100
200
300
400
500
600
700
800
900
1,000
UK &Ireland
Israel DACH Nordic France Iberia Benelux South. Eur. East. Eur.
Tota
l am
ount
inve
sted
(US
$M)
Investment in Europe and Israel by bracket by region, 1Q 2015(ranked excluding mega-rounds)
Mega (>100) Growth (20-100) Venture (8-20) Early Venture (2-8) Seed (<2)
Syndicate for European & Israeli Enterprise Companies

Participation rate of US VC firms, by bracket • US VC firms are increasingly
active in the European and Israeli VC markets
• Over the past nine months, US VC firms participated in 16% of the venture rounds in Europe
• US VCs participated in only 5% of seed rounds, 11% of early venture rounds, and 24% of venture rounds
• As a company moves from bracket to bracket, the chance of US VC participation doubles with each bracket change
14 @gdibner blog: yankeesabralimey
5% 11%24%
44%
80%
95% 89%76%
56%
20%
0%
10%
20%
30%
40%
50%
60%
70%
80%
90%
100%
Seed (.5-2) Early Venture (2-8) Venture (8-20) Growth (20-100) Mega (>100)
Tota
l am
ount
inve
sted
(US
$M)
Did US VC firms participate in European VC rounds? (3Q14-1Q15)
No Yes
Syndicate for European & Israeli Enterprise Companies

Rate of participation by US firms is declining • As the pace of European and
Israeli VC investment increased, the rate of participation by US firms did not keep pace
• Within rounds of between $2M and $20M, US VC participation dropped from 24% of rounds in October to just 11% of rounds in March
15 @gdibner blog: yankeesabralimey
10% 5%17%
24%17% 16% 19%
8% 11%
90% 95%83%
76%83% 84% 81%
92% 89%
0%
10%
20%
30%
40%
50%
60%
70%
80%
90%
100%
Jul Aug Sep Oct Nov Dec Jan Feb Mar
Qtr3 Qtr4 Qtr1
2014 2015
Tota
l am
ount
inve
sted
(US
$M)
Did US VC firms participate in European VC rounds? (3Q14-1Q15)
No Yes
Syndicate for European & Israeli Enterprise Companies

Participation of US VC firms by country • In 1Q, US VCs firms were
active in 10 different European countries, down from 12 in 4Q
• US VC firms were most active in Israel, where they participated in 15 investment rounds
• The UK saw 10 investments with US VC participation, double the number in 4Q
16 @gdibner blog: yankeesabralimey
15 104
43 49
28
13 11 11 100
10
20
30
40
50
60
70
Isra
el UK
Germ
any
Spai
n
Denm
ark
Switz
erla
nd
Net
herla
nds
Swed
en
Irela
nd
Aust
ria
Num
ber o
f VC
inve
stm
ents
In which countries are US VCs most active?1Q, 2015
No US VC involved US VC involved
Syndicate for European & Israeli Enterprise Companies

Dimension Categories Explanation/Example
1. Target market Consumer, SMB, Enterprise, Government, Telecom, OEM
What sort of customer does the company target?
2. Vertical market
Adtech, Communications, Data, Development, Durables, Education, Electronics, Employment, Energy, Fashion, Financial, Food, Gaming, Health, HMI, Industrial, Infrastructure, Lifestyle, Logistics, Marketing, Media, Productivity, Real Estate, Security, Sports, Storage, Transportation, Travel, Water
What type of problem does the company solve?
3. Business model Commerce, Components, Content, Marketplace, SaaS, Semiconductors, Services, Software, Systems,
How does the company make money? What are customers paying for?
Combined segment descriptor Consumer + Travel + Marketplace AirBnB has built a travel-related marketplace for consumers 17
Three-dimensional approach to sector mapping

• The increase in venture investment activity was seen across both consumer and enterprise
• Consumer deal volume increased 65% from 4Q14 to 1Q15
• Enterprise deal volume increased only 20% during the same period
• SMB-oriented and OEM-oriented investment volume declined
18 @gdibner blog: yankeesabralimey
475 595980
494
794
951
78
133
122
78
114
47
0
500
1,000
1,500
2,000
2,500
Qtr3 Qtr4 Qtr1
2014 2015
Tota
l VC
inve
stm
ents
(US
$M)
European & Israeli venture financing by target market3Q14 to 1Q15 (in US $M)
Government
Telecom
OEM
SMB
Enterprise
Consumer
What target markets are attracting the most VC investment in Europe & Israel?
Syndicate for European & Israeli Enterprise Companies

• Last quarter ’s trend reversed itself, with consumer-oriented companies accounting for 43% of all VC investment in Europe & Israel, up from 31%
• Enterprise dropped from 55% to 47%
• Other categories declined, with SEM, OEM, and Government-oriented companies nearly disappearing from the deal volumes
19 @gdibner blog: yankeesabralimey
The return of consumer investment
54%
31%43%
29%55%
47%
5% 7%5%6%7%
0%10%20%30%40%50%60%70%80%90%
100%
Qtr3 Qtr4 Qtr1
2014 2015
Tota
l VC
inve
stm
ents
(US
$M)
European & Israeli venture financing by target market3Q14 to 1Q15 (in US $M)
Government Telecom OEM SMB Enterprise Consumer
Syndicate for European & Israeli Enterprise Companies

Breakdown by region & target market • The Israeli VC landscape
continued to be dominated by non-consumer companies
• The DACH region saw a return to the dominance of consumer-oriented companies in VC financing
• Sigfox’s massive round meant that the majority of VC dollars flowing into France went into the telecom space – clearly an anomaly
• The Nordics seemed to echo Israel’s emphasis on enterprise
• UK dealflow was split almost evenly
20 @gdibner blog: yankeesabralimey
464
80
504
55 50
407
670
64
80122
60
46
115
0
100
200
300
400
500
600
700
800
900
1,000
UK & Ireland Israel DACH France Nordic Iberia Benelux
Tota
l am
ount
inve
sted
(US
$M)
Investment in Europe and Israel by target market by country1Q, 2015 (US $M)
Government Telecom OEM SMB Enterprise Consumer
Syndicate for European & Israeli Enterprise Companies

Distribution of investment rounds by country • Across Europe & Israel, 47%
of VC investment rounds were in consumer companies in 1Q, up from 41% in 4Q
• Israel and Nordics were the only geographies to see a majority of investment rounds happen into non-consumer companies – for Israel that’s normal, for the Nordic’s it’s a reversal
• Most other European markets saw 50-60% of rounds go into consumer companies
21 @gdibner blog: yankeesabralimey
26%
37%
52%
53%
56%
57%
67%
76%
100%
60%
47%
36%
29%
39%
41%
33%
18%
7%
9%
12%
3%
3%
6%
5%
7%
6%
6%
0% 10% 20% 30% 40% 50% 60% 70% 80% 90% 100%
Israel
Nordic
France
Benelux
UK & Ireland
DACH
South. Eur.
Iberia
East. Eur.
Investment in Europe and Israel by target market by country1Q 2015 (Number of investments)
Consumer Enterprise SMB OEM Telecom Government
Syndicate for European & Israeli Enterprise Companies

Seed and growth swing back to consumer • Unlike last quarter, a clear
majority of both growth deals and seed deals were in consumer-oriented companies
22 @gdibner blog: yankeesabralimey
59%
44%
43%
66%
31%
47%
57%
28%
5%
5%
6%
4%
4%
0% 10% 20% 30% 40% 50% 60% 70% 80% 90% 100%
Seed (<2)
Early Venture (2-8)
Venture (8-20)
Growth (20-100)
Investment in Europe (excluding Israel) by target market by stage bracket 1Q 2015 (Number of investments)
Consumer Enterprise SMB OEM Government
Syndicate for European & Israeli Enterprise Companies

DACH investors shift back to consumer • DACH is clearly a region with
a record of strong consumer-oriented investment
• In 4Q14 this began to change, but this trend may not be long-lived
• 1Q15 saw a majority of investments in DACH go into consumer companies
23 @gdibner blog: yankeesabralimey
100%
67%60%
40%
13%
57% 60%
33%
73%
17%20%
40%88%
43% 40%
67%
20%20%
10%
7%17%
10%
0%
10%
20%
30%
40%
50%
60%
70%
80%
90%
100%
Jul Aug Sep Oct Nov Dec Jan Feb Mar
2014 2015
Investment in DACH by target market by stage bracketJuly 2014 to March 2015 (Number of investments)
OEM SMB Enterprise Consumer
Syndicate for European & Israeli Enterprise Companies

The Nordics shift towards the enterprise… • The Nordic region saw pretty
diverse investment patterns in 3Q14 and 4Q14, but in 1Q15 there was a clear shift towards the enterprise
• Interestingly, but not surprisingly, OEM-oriented deals seemed to disappear from the landscape almost entirely
24 @gdibner blog: yankeesabralimey
40%25%
67%
83%
50%64%
20%
50%38%
60%
50%
17%42%
27%
60%
50%
38%
8%
10% 14%25%
17% 17%9% 10% 10%
0%
10%
20%
30%
40%
50%
60%
70%
80%
90%
100%
Jul Aug Sep Oct Nov Dec Jan Feb Mar
2014 2015
Investment in the Nordics by target marketJuly 2014 to March 2015 (Number of investments)
OEM SMB Enterprise Consumer
Syndicate for European & Israeli Enterprise Companies

…especially in terms of dollars invested • When we look at dollars
investment as opposed to the number of investments, the trend in the Nordics is even clearer
• Interestingly, but not surprisingly, OEM-oriented deals seemed to disappear from the landscape almost entirely (from 40% in August to just 4% in March)
25 @gdibner blog: yankeesabralimey
32%
11%
72% 75%
44%52%
44%
20%12%
68%
49%
6%55%
24%54%
80%
72%
12%
40%
21% 25% 24%
4%
0%
10%
20%
30%
40%
50%
60%
70%
80%
90%
100%
Jul Aug Sep Oct Nov Dec Jan Feb Mar
2014 2015
Investment in the Nordics by target marketJuly 2014 to March 2015 (Total US $M invested)
OEM SMB Enterprise Consumer
Syndicate for European & Israeli Enterprise Companies

About 40% of French VC deals were enterprise… • In France, the ratio of
enterprise deals to consumer deals seems roughly constant from September 2014 to March 2015
26 @gdibner blog: yankeesabralimey
100% 100%
50% 46% 58%
50% 62% 60%
46%
38% 38%
33% 50% 31% 40%
46%
15% 8% 13% 8% 8%
0%
10%
20%
30%
40%
50%
60%
70%
80%
90%
100%
Jul Aug Sep Oct Nov Dec Jan Feb Mar
Qtr3 Qtr4 Qtr1
2014 2015
VC Investment in France by target market July 2014 to March 2015 (Number of investments)
OEM SMB Enterprise Consumer
Syndicate for European & Israeli Enterprise Companies

…but money increasingly flows to enterprise • When the data is presented
by the amount of dollars, it becomes clear that more and more of French VC dollars are flowing towards enterprise-oriented companies
27 @gdibner blog: yankeesabralimey
100% 100%
59%44%
65%77%
33% 31%19%
23%46% 10%
23%
64% 69%
74%
10%25%
18%3% 7%
0%
10%
20%
30%
40%
50%
60%
70%
80%
90%
100%
Jul Aug Sep Oct Nov Dec Jan Feb Mar
2014 2015
VC Investment in France by target marketJuly 2014 to March 2015 (Number of investments)
OEM SMB Enterprise Consumer
Syndicate for European & Israeli Enterprise Companies

• 4Q saw a reshuffling of popular verticals
• Market, lifestyle, adtech and infrastructure were the most often funded verticals across Europe & Israel
• Finance dropped to the fifth slot
28 @gdibner blog: yankeesabralimey
Marketing displaced finance as the top vertical
Marketing, 20
Lifestyle, 18
Adtech, 17Infrastructure, 17 Financial, 15
Electronics, 14
Employment, 13
Security, 11
Travel, 11
Communications, 10
Productivity, 10
Development, 10
Health, 10
Logistics, 10Data, 9
Education, 9Fashion, 9Payments, 6Gaming, 5
ERP, 5
European & Israeli venture financing by target market1Q 2015 (number of investments)
Syndicate for European & Israeli Enterprise Companies

• Enterprise and SMB marketing companies were the most popular category of investment across Europe & Israel
• Various consumer lifestyle companies were the second-most popular category
• Adtech, despite falling dramatically out of favor in the US, took the third slot
• Infrastructure companies (mostly for the enterprise) took the fourth slot
• Fintech was dominated by consumer companies
29 @gdibner blog: yankeesabralimey
Health
Development
Productivity
Logistics
Communicati…
Security
Travel
Employment
Electronics
Financial
Infrastructure
Adtech
Lifestyle
Marketing
0 5 10 15 20 25
European & Israeli venture financing by target market1Q, 2015 (number of investments, top 10 verticals)
ConsumerEnterpriseSMBOEMTelecomGovernment
Which verticals for which segments?
Syndicate for European & Israeli Enterprise Companies

• Not surprisingly, enterprise infrastructure and security were the most popular categories for investment in Israel
• Adtech took the third spot • Consumer communications
companies and enterprise marketing companies were two other popular categories
30 @gdibner blog: yankeesabralimey
A closer look at Israeli venture in 1Q15
Health
Education
ERP
Lifestyle
Payments
Financial
Development
Marketing
Productivity
Communications
Adtech
Security
Infrastructure
0 1 2 3 4 5 6 7 8 9
Israeli venture financing by target market1Q, 2015 (number of investments, top 10 verticals)
Consumer
Enterprise
SMB
OEM
Telecom
Syndicate for European & Israeli Enterprise Companies

• In 1Q15, the most popular vertical in the UK was consumer fintech
• Adtech was the second most popular vertical
• Consumer fashion and consumer durables were also popular categories for UK VCs in 1Q
31 @gdibner blog: yankeesabralimey
Consumer fintech led the UK
Infrastructure
Lifestyle
Logistics
Music
Marketing
Security
Real Estate
Communications
Durables
Travel
Fashion
Employment
Health
Adtech
Financial
0 1 2 3 4 5 6 7
UK venture financing by target market1Q, 2015 (number of investments, top 10 verticals)
Consumer
Enterprise
SMB
OEM
Syndicate for European & Israeli Enterprise Companies

• In terms of dollars invested during 1Q15, services (31%) and commerce (18%) were the leaders
• Software and SaaS came in third and fourth, respectively
• Marketplace business models took fourth place, with 10% of invested capital
• Physical products (systems, components, and semiconductors) accounted for only 4% of total investment combined, down from 14% in 4Q14
32 @gdibner blog: yankeesabralimey
Services, 666, 31% Commerce, 389, 18%
Software, 374, 18%
SaaS, 332, 16%
Marketplace, 206, 10%
Media, 57, 3%
Systems, 49, 2%
Components, 18, 1%
Semiconductors, 15, 1%
European & Israeli venture financing by target market1Q, 2015 (in US $M) (excluding mega-rounds)
Service models led the pack in 1Q
Syndicate for European & Israeli Enterprise Companies
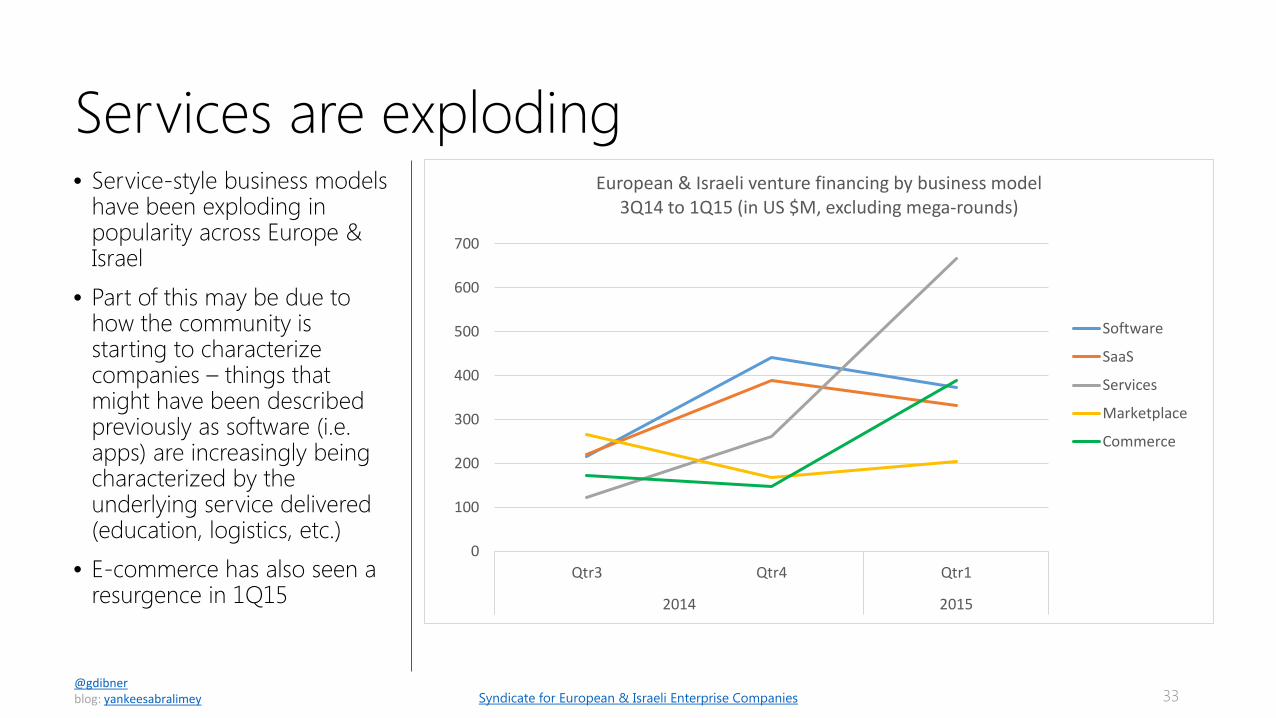
• Service-style business models have been exploding in popularity across Europe & Israel
• Part of this may be due to how the community is starting to characterize companies – things that might have been described previously as software (i.e. apps) are increasingly being characterized by the underlying service delivered (education, logistics, etc.)
• E-commerce has also seen a resurgence in 1Q15
33 @gdibner blog: yankeesabralimey
Services are exploding
0
100
200
300
400
500
600
700
Qtr3 Qtr4 Qtr1
2014 2015
European & Israeli venture financing by business model3Q14 to 1Q15 (in US $M, excluding mega-rounds)
Software
SaaS
Services
Marketplace
Commerce
Syndicate for European & Israeli Enterprise Companies

US VCs focused on SaaS, software, and services • US VC firms investing in
Europe & Israel continued to focus mainly on SaaS, software, and services
• Last quarter, no commerce-oriented companies in Europe or Israel attracted US VC interest – this quarter US VCs backed five companies in that category
• Components, and semiconductors attracted almost no interest from local VCs, and no interest at all from US VCs
• Marketplaces attracted US VCs in only two cases
34 @gdibner blog: yankeesabralimey
12 11 7 5 2 2
46 47 54
17 25 2118
0
10
20
30
40
50
60
70
Services Software SaaS Commerce Marketplace Systems Media Components Semiconductors
VC Investments in Europe & Israel1Q, 2015 (number of investments)
No US VC involved US VC involved
Syndicate for European & Israeli Enterprise Companies

• Enterprise marketing SaaS was the most popular segment for VC investment in 1Q15 with 17 investments across the region
• Consumer electronics systems was the second most popular segment, with 11 investments
• The UK was the clear leader in consumer financial services.
• Israel completely dominated the enterprise security software segment
35 @gdibner blog: yankeesabralimey
0 2 4 6 8 10 12 14 16 18
Consumer Employment Marketplace
Enterprise Development SaaS
Enterprise Infrastructure Software
Enterprise Development Software
Enterprise Adtech Services
Enterprise Data Software
Consumer Lifestyle Commerce
Consumer Lifestyle Media
Enterprise Employment SaaS
Consumer Fashion Commerce
Consumer Education Services
Enterprise Security Software
Consumer Financial Services
Consumer Electronics Systems
Enterprise Marketing SaaS
Number of VC investments
Investment in Europe & Israel by segment by country1Q15 (segments with 5 or more investments)
UK & Ireland IsraelNordic DACHFrance BeneluxIberia South. Eur.East. Eur.
Enterprise marketing & consumer electronics
Syndicate for European & Israeli Enterprise Companies

• Across Europe & Israel, US VC firms invested in 21 enterprise companies, 11 consumer companies, and 1 SMB company
• In the consumer space, US VC interest was concentrated on UK services companies and DACH commerce companies
36 @gdibner blog: yankeesabralimey
0 1 2 3 4 5 6 7 8 9 10
SaaS
Media
Commerce
Services
Marketplace
Systems
SaaS
Services
Software
SMB
Cons
umer
Ente
rpris
e
US VC Investments in Europe and Israel by end market, business model, & country, 1Q 2014
Israel
UK & Ireland
DACH
Iberia
Nordic
What business models attract US VC investments?
Syndicate for European & Israeli Enterprise Companies

Focus on dev tools: everywhere you look • Over the past nine months,
22 dev tooling companies raised VC money across Europe & Israel
• These companies were distributed across ten countries
• Israel led the pack with 6; UK and the Netherlands each saw 3, Germany and Estonia each saw 2
37 @gdibner blog: yankeesabralimey
0
1
2
3
4
5
6
7
Jul Sep Oct Nov Dec Jan Feb Mar
2014 2015
Num
nber
of i
nves
tmen
t
Development tools VC investment in Europe and Israel3Q14 to 1Q15, Number of investments
Ireland France Latvia Norway Sweden
Estonia Germany Netherlands UK Israel
Syndicate for European & Israeli Enterprise Companies

Focus on services: what’s behind the boom • 49 services-oriented
companies raised VC financing across Europe & Israel in 1Q15
• Finance, education, and communications were the most popular verticals for consumer-oriented services companies
• Adtech was the only services vertical with significant enterprise investment
38 @gdibner blog: yankeesabralimey
0 2 4 6 8 10 12 14
Entertainment
Lifestyle
Social
Music
Infrastructure
Logistics
Payments
Communications
Adtech
Education
Financial
Services-oriented VC investment in Europe and Israelby vertical and target market, 1Q 2015 (top 10 verticals)
Consumer Enterprise SMB Telecom
Syndicate for European & Israeli Enterprise Companies

Focus on enterprise SaaS: verticals by country • Marketing remained in the
top spot within enterprise SaaS, but data dropped from second place to fifth
• Employment and HR-related SaaS offerings were the second-most popular category within enterprise SaaS
• Development tooling SaaS offerings were the third most popular category
• Enterprise infrastructure, the fourth most popular category, saw only Israeli companies get funded
39 @gdibner blog: yankeesabralimey
0 5 10 15 20
LogisticsProductivity
TravelCRM
CommunicationsSecurity
HealthDataERP
AdtechInfrastructureDevelopmentEmployment
Marketing
Enterprise SaaS VC investment in Europe and Israelby vertical by country, 1Q 2015 (number of investments)
Israel FranceUK GermanyDenmark EstoniaSweden NetherlandsLithuania NorwayAustria Ireland
Syndicate for European & Israeli Enterprise Companies
Based in , I was previously a partner at . Before that, I helped run the European seed program for . I moved to London after seven years in during which I worked as a VC with and . I’m originally from . My VC investments include and . Angel investments include and three more that haven’t been announced yet. If you found this useful, I hope you’ll subscribe to my blog.
40
Gil Dibner To invest in the best European & Israeli enterprise startups,
consider backing me on here. Lots of exciting stuff in the
pipeline – and you’ll be in pretty good company.