EUROFIMA: Annual report 2007 - Portugal Reports/annual_Report_2007_… · European Company for the...
42
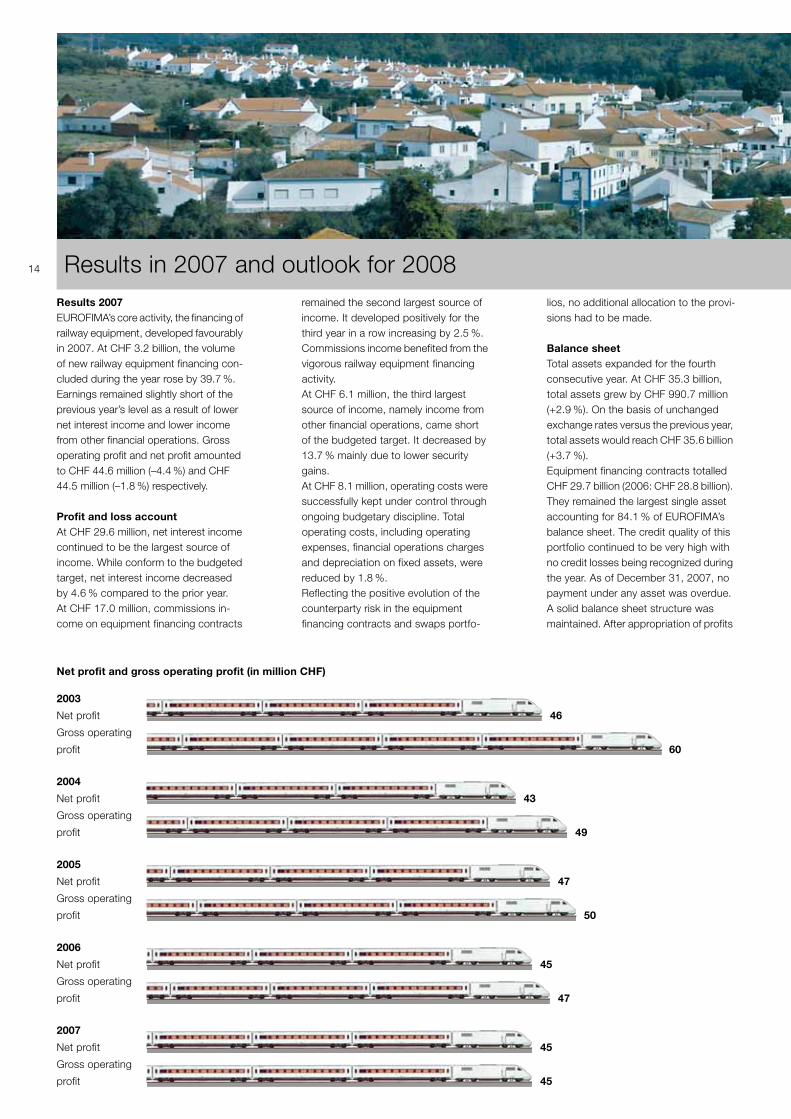
Entrecampos railway station, 18:00 Annual report 2007
Transcript of EUROFIMA: Annual report 2007 - Portugal Reports/annual_Report_2007_… · European Company for the...
Entrecampos railway station, 18:00
Annual report 2007
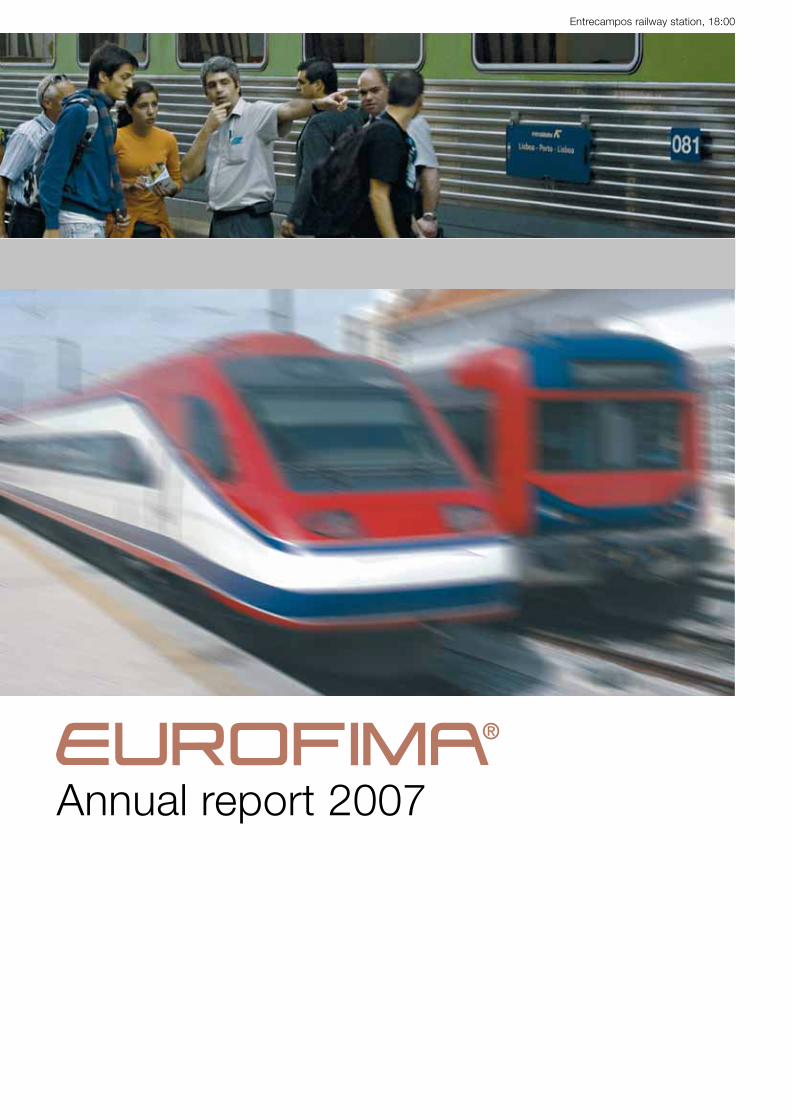
Important data2003 2004 2005 2006 2007
Balance sheet
Total 28 611 29 204 33 501 34 344 35 335
Assets
Equipment financing contracts 23 232 23 921 28 433 28 787 29 722
Unpaid subscribed share capital 2 080 2 080 2 080 2 080 2 080
Liabilities
Borrowings (1) 24 501 25 156 29 344 30 121 31 194
– of which subordinated liabilities 100 100 100 0 0
Equity capital 3 005 3 027 3 053 3 078 3 102
– Subscribed share capital 2 600 2 600 2 600 2 600 2 600
– Reserves + unappropriated surplus to be carried forward (2) 405 427 453 478 502
Net profit, gross operating profit and appropriation to reserves
Net profit for the financial year 46 43 47 45 45
Gross operating profit 60 49 50 47 45
Appropriation to reserves 25 23 25 25 24
Ratios in %
Operating cost (3)/Net operating income 11.5 14.2 14.0 15.1 15.4
Net profit/Equity capital (4) 5.0 4.6 4.9 4.6 4.4
Gross operating profit/Equity capital (4) 6.6 5.2 5.2 4.7 4.4
Equity capital/Borrowings 12.3 12.0 10.4 10.2 9.9
(Equity capital + subordinated liabilities)/Borrowings 12.7 12.4 10.7 10.2 9.9
(Equity capital + subordinated liabilities
+ joint shareholders’ guarantee)/Borrowings 23.3 22.8 19.6 18.9 18.3
Guarantees
Equipment financing contracts with guarantee (5) 24 465 24 978 29 777 30 252 31 943
Joint shareholders’ guarantee 2 600 2 600 2 600 2 600 2 600
Financing and repayments
Financing 4 015 5 112 5 330 3 422 5 000
Repayments 4 557 3 823 2 470 2 169 3 733
Repayment rate in % 113.5 74.8 46.3 63.4 74.7
Railway equipment financed during the financial year
Locomotives 284 414 369 348 257
Multiple-unit trains
– Motor units 177 399 600 150 267
– Trailer cars 182 689 675 149 254
Passenger cars 745 96 1 365 1 387 480
Freight cars 176 259 59 0 1 106
Other equipment 0 0 0 0 0
Financial data: in million CHF
Railway equipment financed: in units
(1) Amounts due to credit institutions and customers and debts evidenced by certificates
(2) After appropriation of surplus according to proposal on page 29
(3) Including financial operations charges and depreciation on fixed assets
(4) Equity capital: average of two consecutive year-end figures, after appropriation of net profit and deduction of unpaid subscribed share capital
(5) Original values before adjustment for valuation difference of related swaps
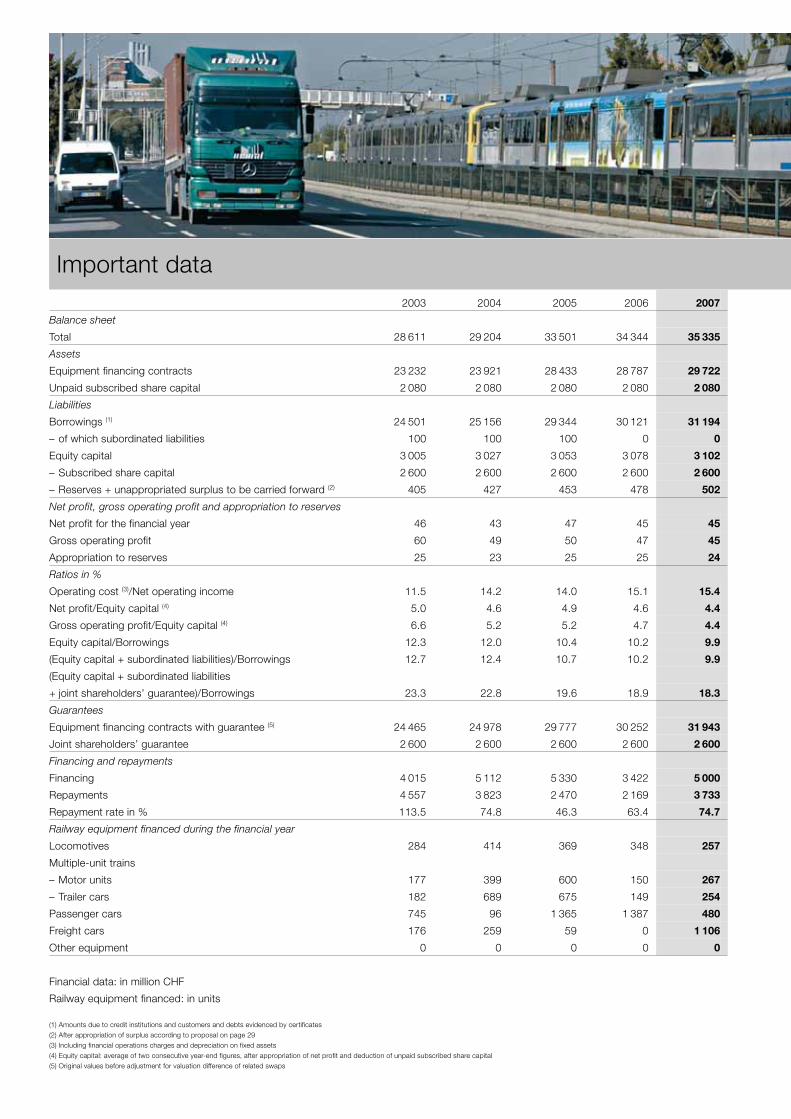
European Company for the Financing of RailroadEUROFIMA is a supranational organization. Its shareholders, which
are also its customers, are the railways of its member States.
EUROFIMA fulfills a task of public interest. It is located in Basle,
Switzerland.
Constitution and mission
EUROFIMA was established on November 20, 1956 based on an
international treaty (the “Convention”) between sovereign States. It
is governed by the Convention signed by its member States, its
articles of association (“Statutes”) and in a subsidiary manner by the
law of the country in which it is located. It was originally founded
for a period of 50 years. The decision taken by the extraordinary
General Assembly of February 1, 1984 to extend this period for
an additional 50 years, until 2056, was approved by all member
States. EUROFIMA’s shareholders are railways of the European
member States which are parties to the Convention.
EUROFIMA’s mission is to support the development of rail transpor-
tation in Europe and to support the railways which are its share-
holders, as well as other railway bodies, in renewing and
modernizing their equipment.
Activity
EUROFIMA finances railway equipment through borrowings or equity
capital and encourages joint purchases. EUROFIMA secures title
to or obtains security interests deemed equivalent (in particular
pledges) on or in respect of equipment. The general principles of
EUROFIMA’s activity are defined in an agreement (the “Basic Agree-
ment”) between the railways and EUROFIMA. The Basic Agreement
remains valid for the entire duration of EUROFIMA’s existence
and can only be altered with the consent of all the railways and
EUROFIMA. EUROFIMA’s equity capital (paid-in share capital and
reserves) is primarily used for investments in money market paper or
bonds and, to a limited extent, for financing railway equipment.
Shareholders’ distribution at December 31, 2007
Shareholders
Number
of shares
in % of
share capital
Deutsche Bahn AG DB AG 58 760 22.60
French National Railways SNCF 58 760 22.60
Ferrovie dello Stato S.p.A. FS 35 100 13.50
SNCB Holding SNCB 25 480 9.80
NV Nederlandse Spoorwegen NS 15 080 5.80
RENFE Operadora RENFE 13 572 5.22
Swiss Federal Railways SBB 13 000 5.00
Železnice Srbije ŽS 5 824 (1) 2.24
Swedish State Railways SJ 5 200 2.00
Luxembourg National Railways CFL 5 200 2.00
ÖBB-Holding AG ÖBB 5 200 2.00
Portuguese Railways CP 5 200 2.00
Hellenic Railways OSE 5 200 2.00
Ceské dráhy, a.s. CD 2 600 1.00
Hungarian State Railways Ltd. MÁV 1 820 0.70
Željeznicná spolocnost’ Slovensko, a.s. ZSSK 1 300 0.50
HŽ Putnicki prijevoz d.o.o. HŽ 520 0.20
Slovenske železnice d.o.o. SŽ 520 0.20
Bosnia and Herzegovina Railways ŽBH 520 0.20
Bulgarian State Railways Ltd. BDZ 520 0.20
Javno pretprijatie Makedonski Železnici-Infrastruktura MŽI 208 0.08
Željeznica Crne Gore a.d. ŽCG 156 0.06
Turkish State Railways TCDD 104 0.04
Danish State Railways DSB 52 0.02
Norwegian State Railways NSB 52 0.02
Makedonski Železnici-Transport AD MŽT 52 0.02
Total 260 000 100.00
(1) 2 830 shares of which EUROFIMA holds in trust

Lisboa–Pereira, 08:24
Rolling StockEquipment
EUROFIMA ever holds title to the equipment until the financing has
been completely reimbursed or it holds a direct or indirect security
interest deemed equivalent, particularly pledges. The equipment is
recorded in the company’s register with its number and type. Each
railway is responsible for maintaining the equipment. In case of
damage or loss, the equipment must be replaced without delay and
at the railway’s expense. If a railway does not fulfill its obligations,
EUROFIMA has the right to repossess the equipment to cover its
exposure. The railway continues to assume responsibility for all
contracts into which it has entered with the company. EUROFIMA
has never experienced a loss due to the failure of a railway to
assume its contractual obligations.
Guarantee reserve and joint shareholders’ guarantee
In the event of default by a railway, the guarantee reserve, as
described in Article 30 of the Statutes, may be called upon. Accord-
ing to this article, the yearly allocation to the guarantee reserve
corresponds to the balance of the net annual profit, after allocation
to the ordinary reserve of 5 % of the net profit and the payment
of a dividend, statutorily fixed at a maximum of 4 % of the paid-in
share capital. After appropriation of the surplus, the guarantee
reserve reached CHF 439.0 million on December 31, 2007.
In addition, according to Article 27 of the Statutes, each share-
holder guarantees the fulfilment of all of EUROFIMA’s equipment
financing contracts in proportion to its holding in EUROFIMA’s share
capital and up to a maximum amount equal to the par value of its
holding. This joint shareholders’ guarantee is invoked only if the
obligations due by a railway exceed the guarantee reserve and are
not covered by its member State.
State guarantee
The railway shareholders’ obligations towards EUROFIMA benefit
from a double guarantee. Firstly, each member State is either
directly liable for or guarantees the obligations of its railway under
the equipment financing contracts. Secondly, each member State
is either directly liable for or guarantees the obligations of its railway
in such railway’s capacity as a shareholder of EUROFIMA. In addi-
tion, the member States take the necessary measures to assure the
transfer of funds arising from the company’s activity.
On December 31, 2007, borrowings were 120 % covered by equity
capital and the various guarantees.
Rating of the member States
at December 31, 2007
Moody’s Investors Standard & Poor’s
Service Inc. Corporation
Germany Aaa AAA
France Aaa AAA
Italy Aa2 A+
Belgium Aa1 AA+
Netherlands Aaa AAA
Spain Aaa AAA
Switzerland Aaa AAA
Serbia – BB–
Sweden Aaa AAA
Luxembourg Aaa AAA
Austria Aaa AAA
Portugal Aa2 AA–
Czech Republic A1 A
Greece A1 A
Hungary A2 BBB+
Croatia Baa3 BBB
Slovenia Aa2 AA
Bosnia and Herzegovina B2 –
Bulgaria Baa3 BBB+
Slovakia A1 A
FYR Macedonia – BB+
Montenegro – BB+
Turkey Ba3 BB–
Denmark Aaa AAA
Norway Aaa AAA
Rating of EUROFIMA’s liabilities
at December 31, 2007
Moody’s Investors Standard & Poor’s
Service Inc. Corporation
Long term Aaa AAA
Short term P-1 A-1+
Outlook stable stable
Lisboa, 10:58
01Report of the Board of Directors to the General AssemblyAnnual report 2007
51st financial year
European Company
for the Financing
of Railroad Rolling Stock
Société européenne
pour le financement
de matériel ferroviaire
Europäische Gesellschaft
für die Finanzierung
von Eisenbahnmaterial
Società europea
per il finanziamento
di materiale ferroviario
This annual report is available on EUROFIMA’s website www.eurofima.org
or upon request from the company’s office.
02
Porto, 13:49
Vila Nova de Gaia, 09:48
03Contents Page
Foreword 04
Governing bodies 06
Report on the company’s situation
Economic environment 09
Financing and repayments during the financial year 2007 10
Equipment financed during the financial year 2007 11
Equipment financing contracts at December 31, 2007 12
Equipment at December 31, 2007 13
Results in 2007 and outlook for 2008 14
Annual accounts
Profit and loss account 2007 20
Balance sheet at December 31, 2007 21
Flow of funds statement 2007 22
Appendix
Accounting and valuation principles 24
Explanatory notes 26
Off-balance sheet business 29
Proposed appropriation of surplus 29
Debts evidenced by certificates 30
Distribution by currency of the amounts due to credit institutions and
customers and of debts evidenced by certificates at December 31, 2007 34
Auditors’ reports 35
Milestones in development 36
Oriente railway station, Lisboa, 18:27
04 Foreword
The year 2007 has seen an unprece-
dented increase in commodity and en-
ergy prices; from the start of the year,
the price of oil has nearly doubled, from
USD 50 per barrel to almost USD 100.
The arrival on the world market of more
than one billion of new workers – from
India, China and the Central Eastern
European countries mainly – during the
last 15 years has considerably acceler-
ated world growth. The demand for
commodities and energy has exploded
accordingly and pushed their prices to
new highs, the rise in the global demand
dramatically exceeding the supply
capacity.
This sharp but at least partly structural
increase in energy price is strongly felt
by consumers and industries. For most
sectors, it mechanically deteriorates
their competitiveness; for individuals,
it reduces their purchasing power. Such
an evolution brings therefore by itself
a strong motivation for each of us to
screen its own organization, in order to
save energy, make a better use of it,
rely more on renewable energy sources
and fight carbon dioxide emission.
In other words, global warming being
obviously a major challenge worldwide
for both present and future generations,
the massive and durable surge in the
cost of energy is, in fact, the most effi-
cient incentive for all to adopt a new
behavior in terms of energy consump-
tion, including transportation.
The sector of transportation – railways in
particular – has indeed a significant role
to play in reducing energy waste and
complacent attitudes. By providing safer,
more efficient and competitive links for
both passengers and freight, railways
could significantly contribute to a better
global energy balance and an improved
purchasing power for many. The influ-
ence of the cost of transportation for
households is indeed far from negligible:
in terms of disposable income, trans-
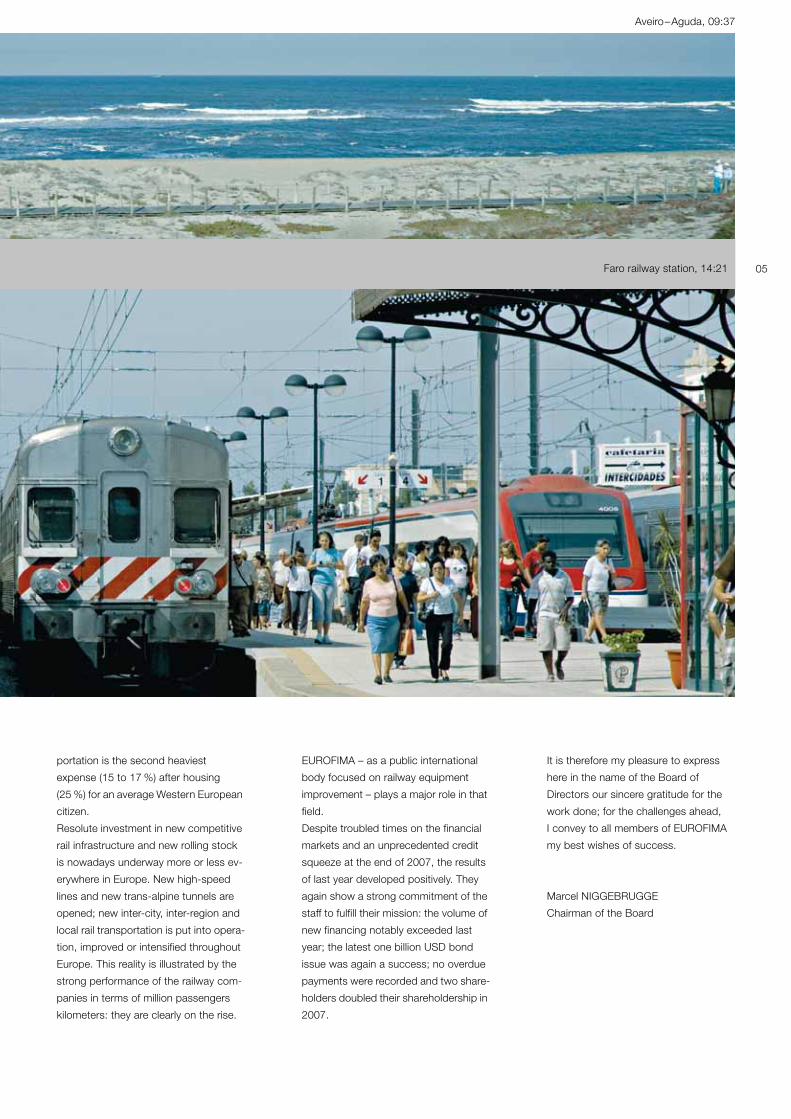
portation is the second heaviest
expense (15 to 17 %) after housing
(25 %) for an average Western European
citizen.
Resolute investment in new competitive
rail infrastructure and new rolling stock
is nowadays underway more or less ev-
erywhere in Europe. New high-speed
lines and new trans-alpine tunnels are
opened; new inter-city, inter-region and
local rail transportation is put into opera-
tion, improved or intensified throughout
Europe. This reality is illustrated by the
strong performance of the railway com-
panies in terms of million passengers
kilometers: they are clearly on the rise.
EUROFIMA – as a public international
body focused on railway equipment
improvement – plays a major role in that
field.
Despite troubled times on the financial
markets and an unprecedented credit
squeeze at the end of 2007, the results
of last year developed positively. They
again show a strong commitment of the
staff to fulfill their mission: the volume of
new financing notably exceeded last
year; the latest one billion USD bond
issue was again a success; no overdue
payments were recorded and two share-
holders doubled their shareholdership in
2007.
It is therefore my pleasure to express
here in the name of the Board of
Directors our sincere gratitude for the
work done; for the challenges ahead,
I convey to all members of EUROFIMA
my best wishes of success.
Marcel NIGGEBRUGGE
Chairman of the Board
Aveiro–Aguda, 09:37
05Faro railway station, 14:21
06 Governing bodiesAs a public international body,
EUROFIMA is governed in the first place
by an International Treaty (the “Conven-
tion”) concluded between 25 sovereign
member States, its articles of associa-
tion (“Statutes”) and only subsidiarily by
Swiss law. The member States have
reserved extensive corporate govern-
ance rights over EUROFIMA. The follow-
ing changes to EUROFIMA’s organiza-
tion require the consent of the member
States: head office, objective, duration,
conditions for admission of sharehold-
ers, quora applicable to important share-
holders’ resolutions, equal voting rights
of directors, all terms dealing with the
shareholders’ liability and the establish-
ment of branches. EUROFIMA has to
report annually on its activities to the
member States.
EUROFIMA is managed and adminis-
tered by the General Assembly, the
Board of Directors and the Management.
The General Assembly convenes at least
once a year. It decides on the maximum
amount of borrowings to be contracted
during a given period. It approves
the management rules established by
the Board of Directors and the annual
accounts. Decisions are taken by the
majority of votes of the shares repre-
sented. However, to amend the Stat-
utes, to reduce or to increase the stated
share capital, to transfer shares and sub-
scription rights, to dissolve the company,
to appoint liquidators and to extend
the company’s duration, a majority rep-
resenting at least seven-tenths of
the stated share capital is required.
The Board of Directors is responsible for
conducting the company’s business. It
adopts decisions in matters that involve
lending, borrowing and administrative
matters. It meets at least once quarterly,
taking decisions on the basis of the
majority of the directors present or repre-
sented. With the exception of certain
reserved powers, the Board of Directors
is authorized to entrust all or part of the
management of the company to one or
several of its members (representatives)
or third persons who need not necessar-
ily be directors (members of the Man-
agement). As a result, the day to day
management has been delegated to
members of the Management. In this
regard, the Board of Directors estab-
lishes management rules and guidelines
determining the rights and responsibili-
ties of the Board of Directors, its repre-
sentatives and the Management. The
Board of Directors authorizes all equip-
ment financing contracts and all borrow-
ings within the limits laid down by the
General Assembly. Board members are
appointed by the General Assembly, with
two members for each shareholder
holding at least 2 % of the share capital.
They are appointed for a period of three
years and are eligible for re-election. The
Board of Directors consists of 25 mem-
bers. The Chairman and Vice-Chairmen
of the Board of Directors are designated
by the General Assembly.
The company’s body of Auditors is com-
posed of five members appointed by
the General Assembly. It approves the
yearly internal control programme and
usually meets twice a year in connection
with the examination of the internal
control reports, the drawing up of the
company’s annual accounts and their
audit by the independent auditors.
No advance or credit is granted to
members of EUROFIMA’s administrative,
managerial and supervisory bodies, and
no commitment is entered into on their
behalf by way of guarantees of any kind.
Board of Directors
at January 1, 2008
Honorary Chairpersons:
Claire Dreyfus-Cloarec
Paris
Etienne Schouppe
Liedekerke
Wolfgang Vaerst
Frankfurt am Main
Chairman:
Marcel Niggebrugge
Member of the Board,
Chief Financial Officer,
NV Nederlandse Spoorwegen, Utrecht
Vice Chairmen:
Claude Alain Dulex
Chief Financial Officer,
Member of the General Management,
Swiss Federal Railways SBB, Bern
Luigi Lenci
Financial Director,
Ferrovie dello Stato S.p.A., Rome
Jean-Pierre Menanteau
Member of the Executive Committee,
in charge of Finance, Purchase, IT
and Telecommunications, French
National Railways Company, Paris
Wolfgang Reuter
Group Treasurer,
Deutsche Bahn AG, Berlin
Members:
Michel Allé
General Director,
SNCB Holding, Brussels
Aggelos N. Androulidakis
President of the Board of Directors,
Hellenic Railways, Athens
Nicolas Th. Beis
General Director of Administration and
Finance, Hellenic Railways, Athens
Pilar Cutanda González
Financial Director,
RENFE Operadora, Madrid
Lennart Dahlborg
President,
Swedish State Railways, Stockholm
Paulo José da Silva Magina
Member of the Board of Directors,
Portuguese Railways, Lisbon
Jean-Luc Drugeon
Director of Financial Operations, French
National Railways Company, Paris
Reto Feissli
Head Corporate Treasury,
Swiss Federal Railways SBB, Bern
Natalia Garzón Pacheco
General Manager of Finance and
Planning, RENFE Operadora, Madrid
Jannie Haek
Chief Executive Officer,
SNCB Holding, Brussels
Mats Hanser
Member of the Board of Directors,
Swedish State Railways, Stockholm
Bojan Ilkic
Assistant General Manager for
Strategy and Development,
Železnice Srbije, Belgrade
Ronald Klein Wassink
Corporate Treasurer,
NV Nederlandse Spoorwegen, Utrecht
Alex Kremer
General Director, Luxembourg National
Railways, Luxembourg
Gerhard Leitner
Chief Financial Officer,
Rail Cargo Austria AG, Vienna
Alfeu Pimentel Saraiva
Director of Finance,
Portuguese Railways, Lisbon
Milanko Šarandic
General Director,
Železnice Srbije, Belgrade
Hartwig Schneidereit
Head of Capital Market Department,
Deutsche Bahn AG, Berlin
Erich Söllinger
Chief Financial Officer,
ÖBB-Holding Ltd., Vienna
Jeannot Waringo
Chairman of the Board of Directors,
Luxembourg National Railways,
Luxembourg
Secretary:
Bernard de Closset
Senior Vice President,
EUROFIMA
College of Auditors:
José Luis Martínez Giménez
Director of Accounting Systems,
RENFE Operadora, Madrid
Alfred Lutschinger
Director of Finance and Participations,
ÖBB-Infrastruktur Betrieb AG, Vienna
Stefano Pierini
Head of Financial Markets,
Ferrovie dello Stato S.p.A., Rome
Dick Snel
Chief Financial Officer,
NV Nederlandse Spoorwegen/Servex,
Utrecht
Marc Wengler
Deputy General Director,
Luxembourg National Railways,
Luxembourg
Management:
André Bovet
Chief Executive Officer
Bernard de Closset
Senior Vice President,
Head of Treasury
Martin Fleischer
Senior Vice President,
Head of Capital Markets
Marco Termignone
Senior Vice President,
Head of Accounting, IT, Payments
Independent auditors:
PricewaterhouseCoopers AG
St. Jakobs-Strasse 25
P.O. Box
CH-4002 Basle
Tel: + 41 58 792 51 11
Fax: + 41 58 792 58 82
Changes in the Board of Directors
and Auditors during 2007:
The following members resigned:
Claire Dreyfus-Cloarec
Chairwoman
Diethelm Sack
Vice-President of the Board of Directors
Dolores Herrero Perez de Castro
Auditor
The outgoing members were sincerely
thanked for their active service.
Lisboa–Entroncamento, 07:31
07
08 Report on the company’s situation
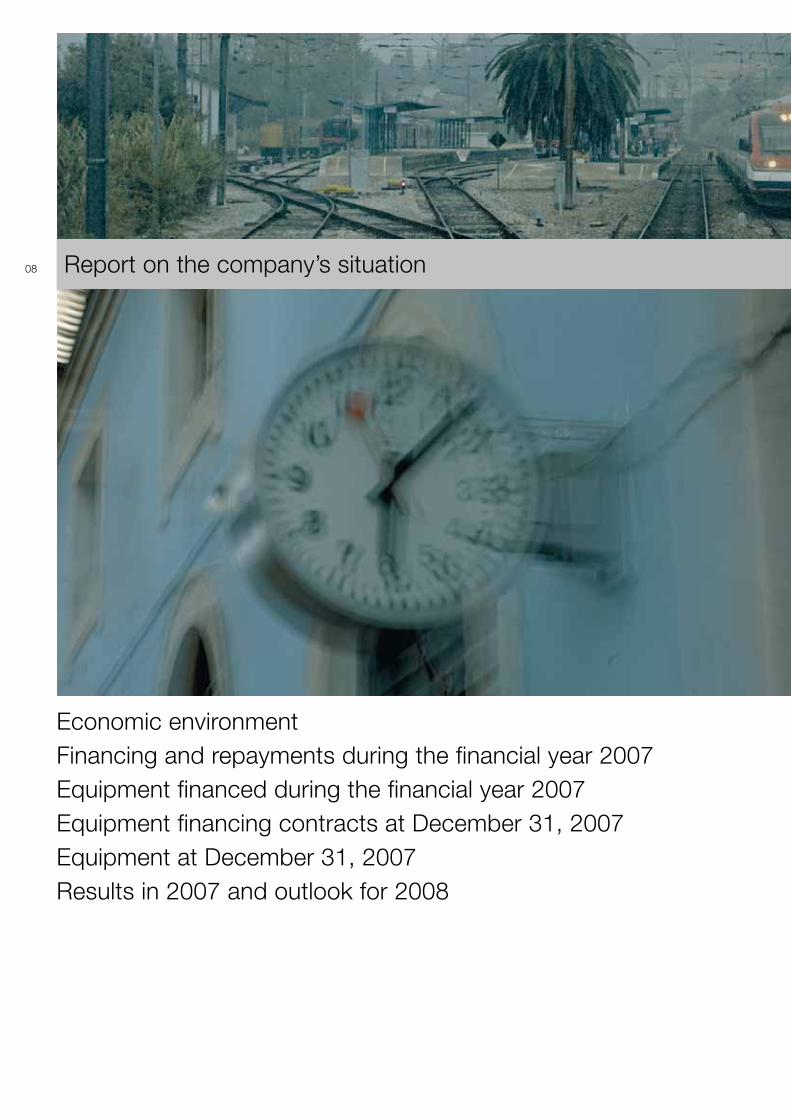
Economic environmentFinancing and repayments during the financial year 2007Equipment financed during the financial year 2007Equipment financing contracts at December 31, 2007Equipment at December 31, 2007Results in 2007 and outlook for 2008
Casais–Coimbra, 08:49
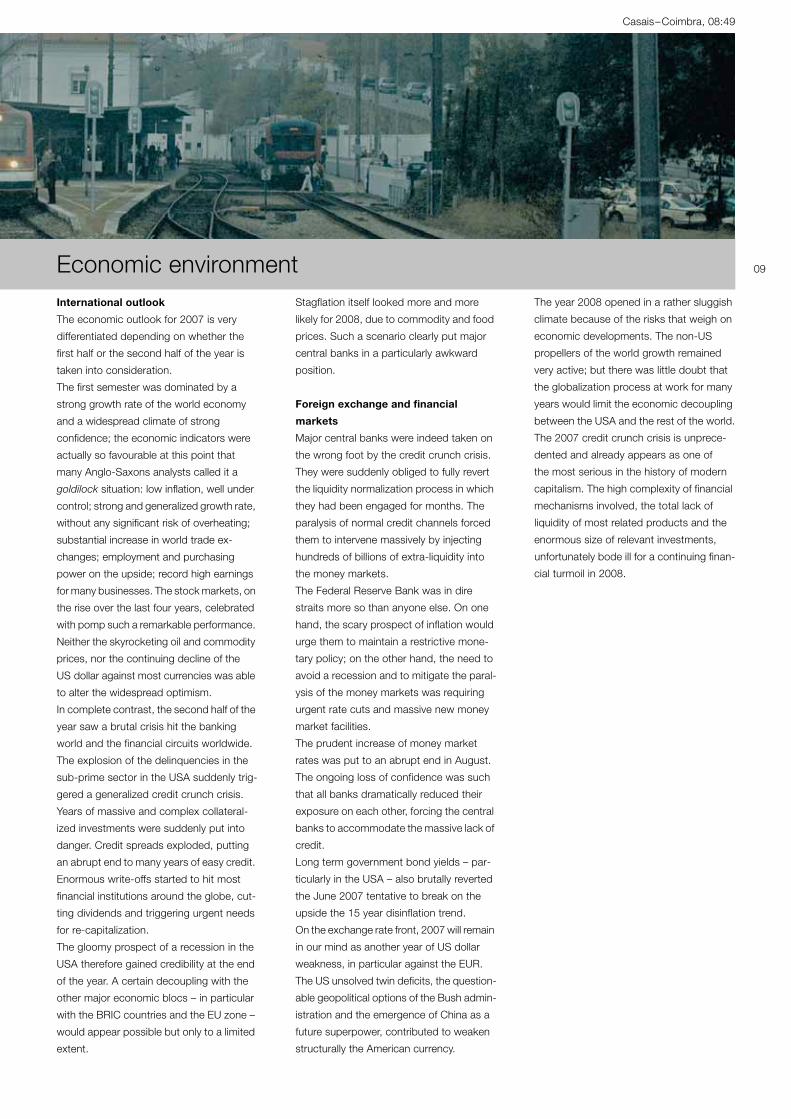
09Economic environmentInternational outlook
The economic outlook for 2007 is very
differentiated depending on whether the
first half or the second half of the year is
taken into consideration.
The first semester was dominated by a
strong growth rate of the world economy
and a widespread climate of strong
confidence; the economic indicators were
actually so favourable at this point that
many Anglo-Saxons analysts called it a
goldilock situation: low inflation, well under
control; strong and generalized growth rate,
without any significant risk of overheating;
substantial increase in world trade ex-
changes; employment and purchasing
power on the upside; record high earnings
for many businesses. The stock markets, on
the rise over the last four years, celebrated
with pomp such a remarkable performance.
Neither the skyrocketing oil and commodity
prices, nor the continuing decline of the
US dollar against most currencies was able
to alter the widespread optimism.
In complete contrast, the second half of the
year saw a brutal crisis hit the banking
world and the financial circuits worldwide.
The explosion of the delinquencies in the
sub-prime sector in the USA suddenly trig-
gered a generalized credit crunch crisis.
Years of massive and complex collateral-
ized investments were suddenly put into
danger. Credit spreads exploded, putting
an abrupt end to many years of easy credit.
Enormous write-offs started to hit most
financial institutions around the globe, cut-
ting dividends and triggering urgent needs
for re-capitalization.
The gloomy prospect of a recession in the
USA therefore gained credibility at the end
of the year. A certain decoupling with the
other major economic blocs – in particular
with the BRIC countries and the EU zone –
would appear possible but only to a limited
extent.
Stagflation itself looked more and more
likely for 2008, due to commodity and food
prices. Such a scenario clearly put major
central banks in a particularly awkward
position.
Foreign exchange and financial
markets
Major central banks were indeed taken on
the wrong foot by the credit crunch crisis.
They were suddenly obliged to fully revert
the liquidity normalization process in which
they had been engaged for months. The
paralysis of normal credit channels forced
them to intervene massively by injecting
hundreds of billions of extra-liquidity into
the money markets.
The Federal Reserve Bank was in dire
straits more so than anyone else. On one
hand, the scary prospect of inflation would
urge them to maintain a restrictive mone-
tary policy; on the other hand, the need to
avoid a recession and to mitigate the paral-
ysis of the money markets was requiring
urgent rate cuts and massive new money
market facilities.
The prudent increase of money market
rates was put to an abrupt end in August.
The ongoing loss of confidence was such
that all banks dramatically reduced their
exposure on each other, forcing the central
banks to accommodate the massive lack of
credit.
Long term government bond yields – par-
ticularly in the USA – also brutally reverted
the June 2007 tentative to break on the
upside the 15 year disinflation trend.
On the exchange rate front, 2007 will remain
in our mind as another year of US dollar
weakness, in particular against the EUR.
The US unsolved twin deficits, the question-
able geopolitical options of the Bush admin-
istration and the emergence of China as a
future superpower, contributed to weaken
structurally the American currency.
The year 2008 opened in a rather sluggish
climate because of the risks that weigh on
economic developments. The non-US
propellers of the world growth remained
very active; but there was little doubt that
the globalization process at work for many
years would limit the economic decoupling
between the USA and the rest of the world.
The 2007 credit crunch crisis is unprece-
dented and already appears as one of
the most serious in the history of modern
capitalism. The high complexity of financial
mechanisms involved, the total lack of
liquidity of most related products and the
enormous size of relevant investments,
unfortunately bode ill for a continuing finan-
cial turmoil in 2008.

Funding activity
Besides an increased activity in the money markets through its
commercial paper programme to benefit from much improved
terms for top rated issuers EUROFIMA played in 2007 again a
visible role in the debt capital markets.
EUROFIMA’s public bond issuance amounted to a total of CHF
4 billion and streched over 10 different currencies. Total funding in
its strategic US dollar, Australian dollar and Swiss franc markets
accounted for 76 %.
In the US dollar market, EUROFIMA continued its presence in the
benchmark segment and launched another 1 billion bond, again
with a 10-year maturity. A further tightened spread to the most
expensive supranational and agency borrowers, a significant over-
subscription and a broad distribution by region evidence the
progress made.
In the Australian dollar market, the organization opened a new 2022
line, offering the longest maturity available in the Kangaroo market.
Existing lines were systematically increased to add liquidity: the
2014 bond was tapped to become already EUROFIMA’s 3rd Kan-
garoo with an aggregate amount of 1 billion. The 2016 bond now
stands at 650 million, the 2020 bond at 500 million.
In the Swiss franc market, the focus was on long tenors and liquid
sizes as well. A new 2024 bond found strong demand and reached
a volume of 600 million by year-end. The 2026 bond was further
increased to become EUROFIMA’s first outstanding 1 billion bond in
its own domestic market. The 2030 bond now reaches 400 million.
The remaining funding was more opportunistic, arbitrage driven
and very diversified with regards to tenors and markets, ranging
from several 1-year bonds in currencies like Turkish lira, South
African rand or Mexican peso, to a 20-year “Maple” bond in
Canadian dollars.
Financing
Based on the exchange rates fixed at the date of the balance
sheet, financing in 12 different currencies reached the equivalent of
CHF 5 000 million. This total is distributed as follows:
Repayments
Based on the exchange rates fixed at the date of the balance
sheet, repayments reached the equivalent of CHF 3 733 million,
CHF 778 million of which are due to repayments on short-term
financing.
2003 4 015
2004 5 112
2005 5 330
2006 3 422
2007 5 000
Evolution of financing (in million CHF)
Distribution of repayments according to currencies
EUR 51 %
TRY 1 %AUD 9 %
USD 18 %
CHF 21 %
Type of financing Equivalent
in million CHF
Bond issues 1 046
Programme for the Issuance of Debt Instruments 2 920
Loans 15
Commercial Paper 1 019
Total 5 000
Distribution of financing according to currencies
AUD 16 %
EUR 13 %
TRY 4 %Others 9 %
USD 30 %
CHF 21 %
CAD 7 %
10 Financing and repayments during the financial year 2007
Lisboa–Entroncamento, 07:47
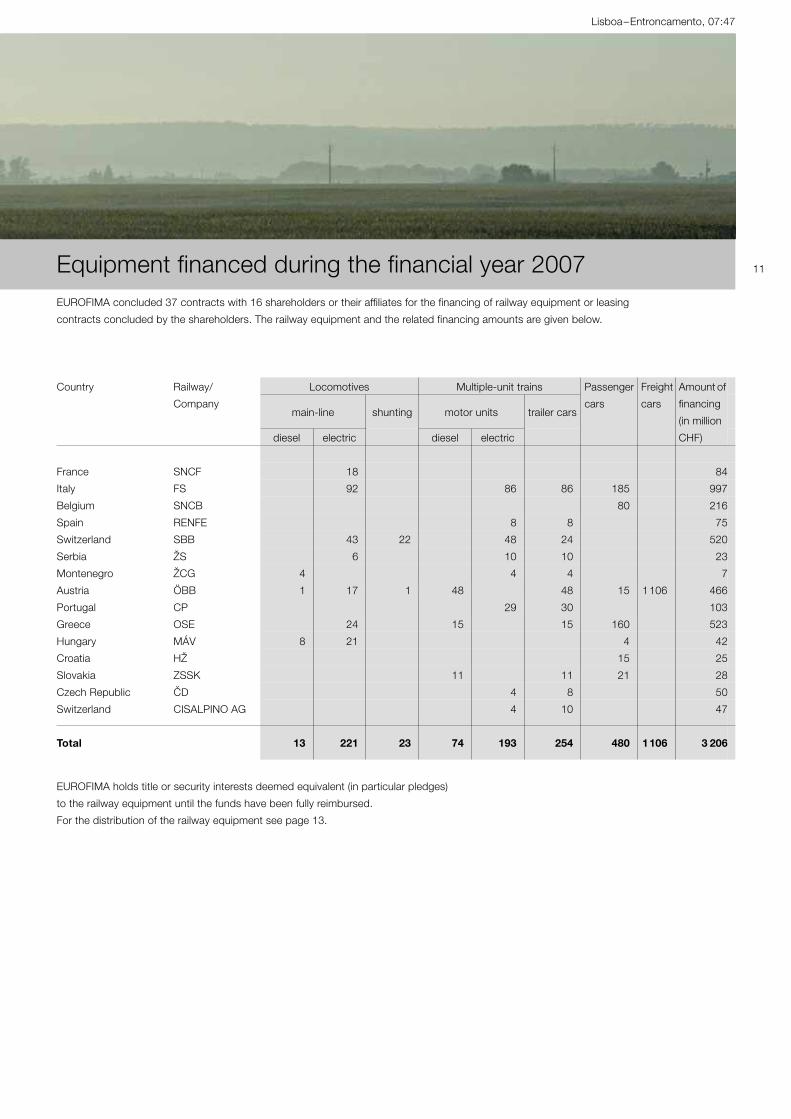
11Equipment financed during the financial year 2007EUROFIMA concluded 37 contracts with 16 shareholders or their affiliates for the financing of railway equipment or leasing
contracts concluded by the shareholders. The railway equipment and the related financing amounts are given below.
EUROFIMA holds title or security interests deemed equivalent (in particular pledges)
to the railway equipment until the funds have been fully reimbursed.
For the distribution of the railway equipment see page 13.
Country Railway/
Company
Locomotives Multiple-unit trains Passenger
cars
Freight
cars
Amount of
financing
(in million
CHF)
main-line shunting motor units trailer cars
diesel electric diesel electric
France SNCF 18 84
Italy FS 92 86 86 185 997
Belgium SNCB 80 216
Spain RENFE 8 8 75
Switzerland SBB 43 22 48 24 520
Serbia ŽS 6 10 10 23
Montenegro ŽCG 4 4 4 7
Austria ÖBB 1 17 1 48 48 15 1106 466
Portugal CP 29 30 103
Greece OSE 24 15 15 160 523
Hungary MÁV 8 21 4 42
Croatia HŽ 15 25
Slovakia ZSSK 11 11 21 28
Czech Republic CD 4 8 50
Switzerland CISALPINO AG 4 10 47
Total 13 221 23 74 193 254 480 1106 3 206
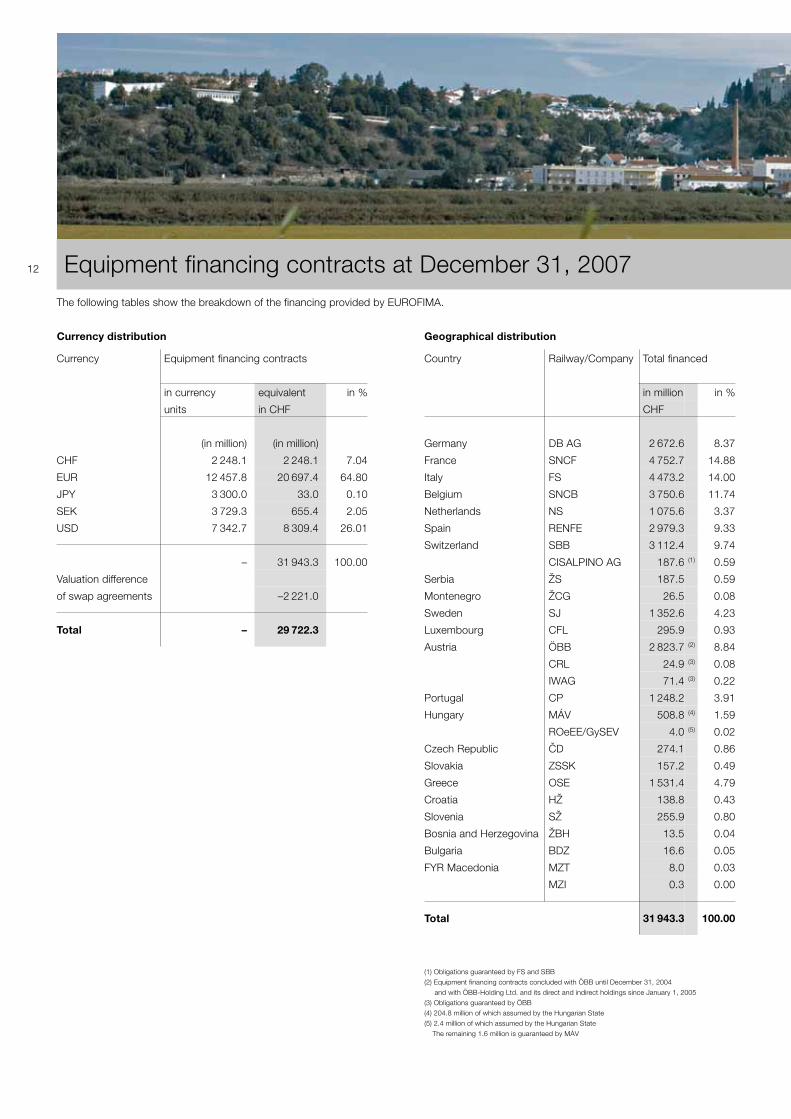
12 Equipment financing contracts at December 31, 2007The following tables show the breakdown of the financing provided by EUROFIMA.
Currency distribution Geographical distribution
Currency Equipment financing contracts
in currency
units
equivalent
in CHF
in %
(in million) (in million)
CHF 2 248.1 2 248.1 7.04
EUR 12 457.8 20 697.4 64.80
JPY 3 300.0 33.0 0.10
SEK 3 729.3 655.4 2.05
USD 7 342.7 8 309.4 26.01
– 31 943.3 100.00
Valuation difference
of swap agreements –2 221.0
Total – 29 722.3
Country Railway/Company Total financed
in million in %
CHF
Germany DB AG 2 672.6 8.37
France SNCF 4 752.7 14.88
Italy FS 4 473.2 14.00
Belgium SNCB 3 750.6 11.74
Netherlands NS 1 075.6 3.37
Spain RENFE 2 979.3 9.33
Switzerland SBB 3 112.4 9.74
CISALPINO AG 187.6 (1) 0.59
Serbia ŽS 187.5 0.59
Montenegro ŽCG 26.5 0.08
Sweden SJ 1 352.6 4.23
Luxembourg CFL 295.9 0.93
Austria ÖBB 2 823.7 (2) 8.84
CRL 24.9 (3) 0.08
IWAG 71.4 (3) 0.22
Portugal CP 1 248.2 3.91
Hungary MÁV 508.8 (4) 1.59
ROeEE/GySEV 4.0 (5) 0.02
Czech Republic CD 274.1 0.86
Slovakia ZSSK 157.2 0.49
Greece OSE 1 531.4 4.79
Croatia HŽ 138.8 0.43
Slovenia SŽ 255.9 0.80
Bosnia and Herzegovina ŽBH 13.5 0.04
Bulgaria BDZ 16.6 0.05
FYR Macedonia MZT 8.0 0.03
MZI 0.3 0.00
Total 31 943.3 100.00
(1) Obligations guaranteed by FS and SBB
(2) Equipment financing contracts concluded with ÖBB until December 31, 2004
and with ÖBB-Holding Ltd. and its direct and indirect holdings since January 1, 2005
(3) Obligations guaranteed by ÖBB
(4) 204.8 million of which assumed by the Hungarian State
(5) 2.4 million of which assumed by the Hungarian State
The remaining 1.6 million is guaranteed by MÁV
Alcácer do Sal, 09:55
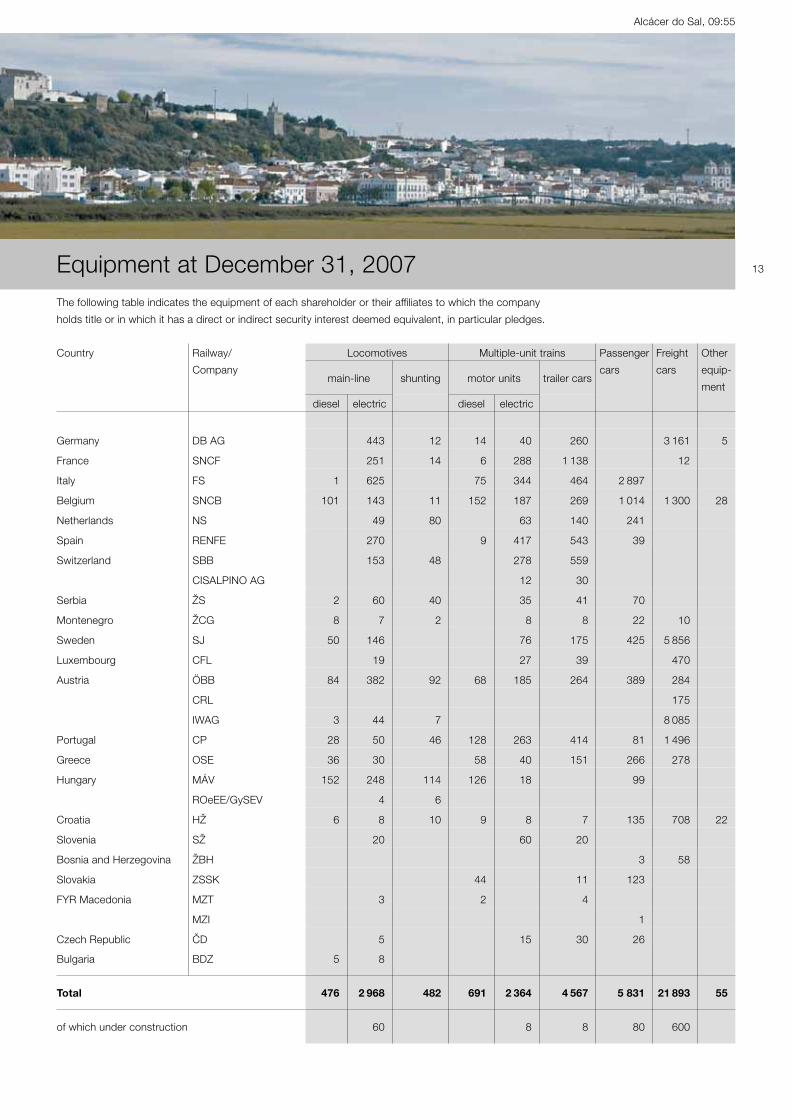
13Equipment at December 31, 2007The following table indicates the equipment of each shareholder or their affiliates to which the company
holds title or in which it has a direct or indirect security interest deemed equivalent, in particular pledges.
Country Railway/
Company
Locomotives Multiple-unit trains Passenger
cars
Freight
cars
Other
equip-
mentmain-line shunting motor units trailer cars
diesel electric diesel electric
Germany DB AG 443 12 14 40 260 3 161 5
France SNCF 251 14 6 288 1 138 12
Italy FS 1 625 75 344 464 2 897
Belgium SNCB 101 143 11 152 187 269 1 014 1 300 28
Netherlands NS 49 80 63 140 241
Spain RENFE 270 9 417 543 39
Switzerland SBB 153 48 278 559
CISALPINO AG 12 30
Serbia ŽS 2 60 40 35 41 70
Montenegro ŽCG 8 7 2 8 8 22 10
Sweden SJ 50 146 76 175 425 5 856
Luxembourg CFL 19 27 39 470
Austria ÖBB 84 382 92 68 185 264 389 284
CRL 175
IWAG 3 44 7 8 085
Portugal CP 28 50 46 128 263 414 81 1 496
Greece OSE 36 30 58 40 151 266 278
Hungary MÁV 152 248 114 126 18 99
ROeEE/GySEV 4 6
Croatia HŽ 6 8 10 9 8 7 135 708 22
Slovenia SŽ 20 60 20
Bosnia and Herzegovina ŽBH 3 58
Slovakia ZSSK 44 11 123
FYR Macedonia MZT 3 2 4
MZI 1
Czech Republic CD 5 15 30 26
Bulgaria BDZ 5 8
Total 476 2 968 482 691 2 364 4 567 5 831 21 893 55
of which under construction 60 8 8 80 600
14 Results in 2007 and outlook for 2008Results 2007EUROFIMA’s core activity, the financing of railway equipment, developed favourably in 2007. At CHF 3.2 billion, the volume of new railway equipment financing con-cluded during the year rose by 39.7 %. Earnings remained slightly short of the previous year’s level as a result of lower net interest income and lower income from other financial operations. Gross operating profit and net profit amounted to CHF 44.6 million (–4.4 %) and CHF 44.5 million (–1.8 %) respectively.
Profit and loss accountAt CHF 29.6 million, net interest income continued to be the largest source of income. While conform to the budgeted target, net interest income decreased by 4.6 % compared to the prior year.At CHF 17.0 million, commissions in-come on equipment financing contracts
remained the second largest source of income. It developed positively for the third year in a row increasing by 2.5 %. Commissions income benefited from the vigorous railway equipment financing activity.At CHF 6.1 million, the third largest source of income, namely income from other financial operations, came short of the budgeted target. It decreased by 13.7 % mainly due to lower security gains. At CHF 8.1 million, operating costs were successfully kept under control through ongoing budgetary discipline. Total operating costs, including operating expenses, financial operations charges and depreciation on fixed assets, were reduced by 1.8 %. Reflecting the positive evolution of the counterparty risk in the equipment financing contracts and swaps portfo-
lios, no additional allocation to the provi-sions had to be made.
Balance sheetTotal assets expanded for the fourth consecutive year. At CHF 35.3 billion, total assets grew by CHF 990.7 million (+2.9 %). On the basis of unchanged exchange rates versus the previous year, total assets would reach CHF 35.6 billion (+3.7 %). Equipment financing contracts totalled CHF 29.7 billion (2006: CHF 28.8 billion). They remained the largest single asset accounting for 84.1 % of EUROFIMA’s balance sheet. The credit quality of this portfolio continued to be very high with no credit losses being recognized during the year. As of December 31, 2007, no payment under any asset was overdue. A solid balance sheet structure was maintained. After appropriation of profits
Net profit and gross operating profit (in million CHF)
2003
Net profit 46
Gross operating
profit 60
2004
Net profit 43
Gross operating
profit 49
2005
Net profit 47
Gross operating
profit 50
2006
Net profit 45
Gross operating
profit 47
2007
Net profit 45
Gross operating
profit 45
Albufeira – Funcheira, 15:57
15
from the financial year 2007, equity capi-tal amounted to 9.9 % of total borrowings, compared to 10.2 % in 2006. Provisions and reserves totalled CHF 753.6 million (2006: CHF 730.0 million).
Financial risk managementEUROFIMA’s financial risk management aims to ensure sustainable profitability and to maintain financial viability. As a result, EUROFIMA’s approach towards financial risk taking is conservative. Risk management activities seek to ap-propriately identify, measure and report financial risks as well as to limit their potential adverse effect on the financial performance to levels acceptable to EUROFIMA. A comprehensive set of internal guide-lines and policies has been laid down by the management. It covers specific areas such as foreign exchange risk, interest rate risk, liquidity risk and the use of deriv-ative financial instruments. Such guide-lines and policies are reviewed regularly and can be viewed by all staff on the intra-net. Exposure to foreign exchange risk, interest rate risk and counterparty risk is controlled by a system of pre-approved maximum limits. Such limits are reviewed and adjusted periodically in the light of external developments and experience.
EUROFIMA is an end user of derivative financial instruments. Used derivative financial instruments are primarily interest rate and currency swaps, forward rate agreements and foreign exchange con-tracts. EUROFIMA is not a user of credit derivatives. EUROFIMA uses derivative financial instruments to protect itself against market risks in its borrowing, lending and investment activities.
(i) Foreign exchange and interest rate risksEUROFIMA’s exposure to foreign ex-change and interest rate risks arises pri-marily from the fact that borrowing opera-tions are often carried out in a currency and with interest rate structures differing from those of the equipment financing contracts. The resulting foreign exchange and interest rate risk created in this nor-mal course of business are hedged by using interest rate and currency swaps systematically on a back-to-back basis. As a result, the currency and interest rate risk profile of the borrowings is matched synthetically with the profile of the equip-ment financing contracts and the funds warehoused pending their disbursement to the railways.Pre-funding is limited to a maximum amount of EUR 1 billion. Pre-funding
allows tapping into the capital markets when borrowing conditions are favour-able. All pre-funding operations are trans-acted (after swaps) on a variable interest basis so that the funds can be ware-housed with a minimum interest rate risk until they are needed for lending disburse-ment.An open exposure to foreign exchange and interest rate risks exists only in the investment of the equity and the manage-ment of the liquidity. Such exposure is kept within very narrow limits. The largest part of the equity is invested in interest-bearing securities and place-ments with credit institutions. The interest bearing securities consist primarily of securities issued by highly rated financial institutions (including asset backed securities), governments and suprana-tional public institutions. It is also used to a limited extent (at year end: CHF 222.3 million) to fund individual equip-ment financing contracts. Such invest-ments of the equity are exposed to changes in market interest rates. Indeed, the interest income derived from such investments is influenced by the level of market interest rates prevailing at the time of their investment or re-investment. The organization’s earnings are also affected by the fluctuations in the market value of
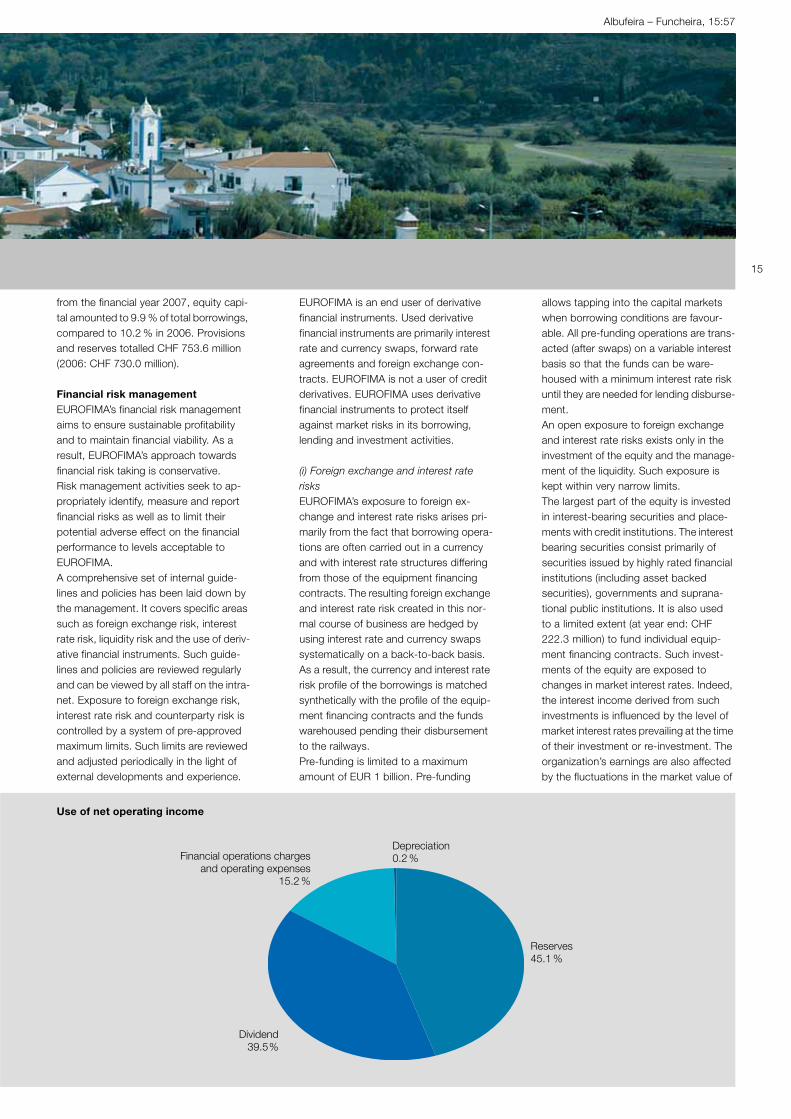
Use of net operating income
Reserves45.1 %
Depreciation0.2 %
Dividend39.5%
Financial operations chargesand operating expenses
15.2 %

the marked-to-market security holdings which can be induced by changes in market interest rates and credit spreads.
(ii) Credit riskCredit risk corresponds to the potential loss that could result from a deterioration in the creditworthiness of counterparties or their default. Credit risk is the main financial risk inherent in EUROFIMA’s operations. EUROFIMA is primarily ex-posed to credit risk in its core activities, namely borrowing and lending. It is also exposed to credit risk in its treasury operations through the financial assets and derivative instruments used for investing and managing the liquidity and equity funds. EUROFIMA follows a prudent approach towards credit and counterparty risk. Only financial counterparties with a high credit rating are accepted. Individual counterparty limits are monitored and reviewed on a regular basis.
Swap counterparty exposure is carefully monitored. EUROFIMA follows a policy of provisioning for its counterparty risk with financial swap counterparties. In 2007, it intensified its use of one way credit support agreements to minimize its exposure to swap counterparty risks. Such credit support agreements result in collateral being posted by the swap counterparty once the exposure ex-ceeds a pre-agreed threshold. The credit risk inherent in the portfolio of equipment financing contracts is reviewed and monitored regularly. EUROFIMA aims at adequately covering the potential counterparty exposure with the weakest railways by the sum of the country risk provision and the guarantee reserve.
(iii) Liquidity riskEUROFIMA’s objective is to maintain an adequate pool of liquidity to cover any short-term cash requirements. This pool of funds is invested in placements with
credit institutions as well as highly rated debt instruments. EUROFIMA strives to secure a level of net liquidity that would meet its liquidity needs under distressed conditions for a period of twelve months.
Outlook for 2008The year 2007 has seen unprecedented turbulences in the world credit markets. With the problems the financial commu-nity faced in the past year not having disappeared, the year 2008 is likely to be a generally difficult year in the financial markets. Therefore, the monitoring and management of financial risks, in partic-ular credit risk, will remain a key priority of EUROFIMA in 2008. Despite these difficult market conditions EUROFIMA is confident to achieve a satisfactory finan-cial performance over the next twelve months. While a moderate increase in earnings is budgeted, the demand for new equipment financing contracts should not exceed the high level of the previous year.
Borrowings (1) and equity capital in million CHF
2003
Borrowings 24 501
Equity capital 3 005
2004
Borrowings 25 156
Equity capital 3 027
2005
Borrowings 29 344
Equity capital 3 053
2006
Borrowings 30 121
Equity capital 3 078
2007
Borrowings 31 194
Equity capital 3 102 (1) Amounts due to credit institutions and customers and debts evidenced by certificates
16
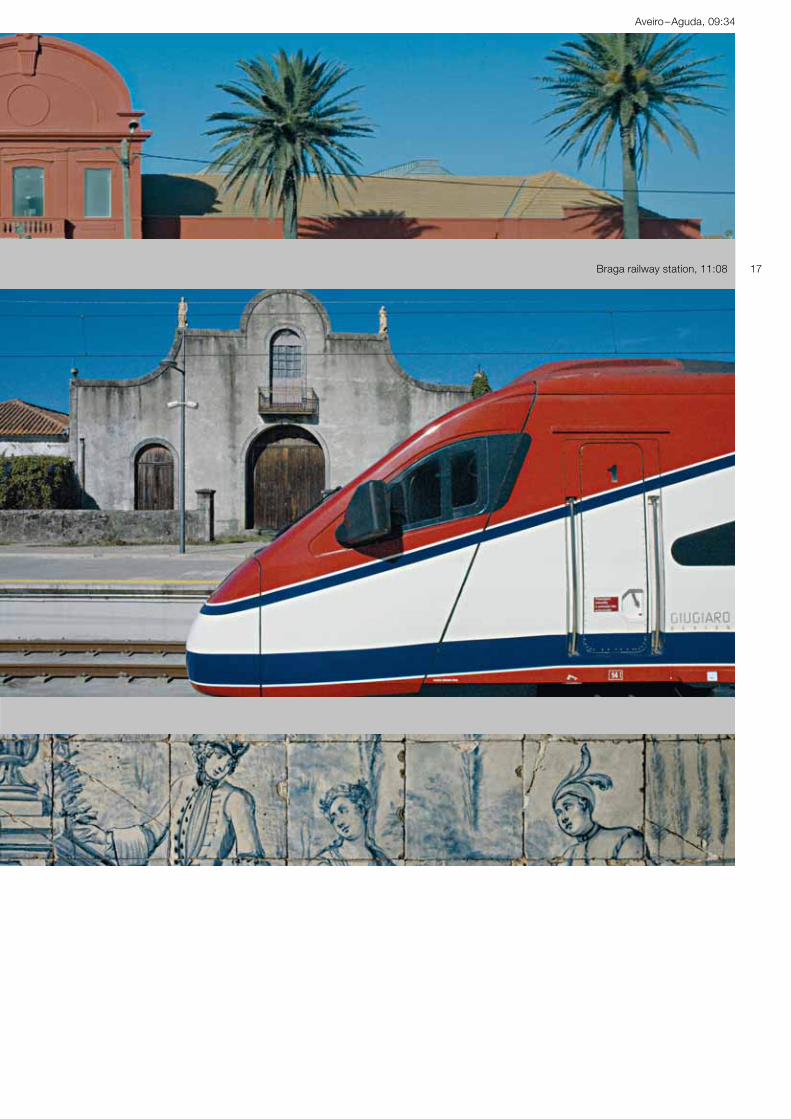
Aveiro–Aguda, 09:34
17Braga railway station, 11:08
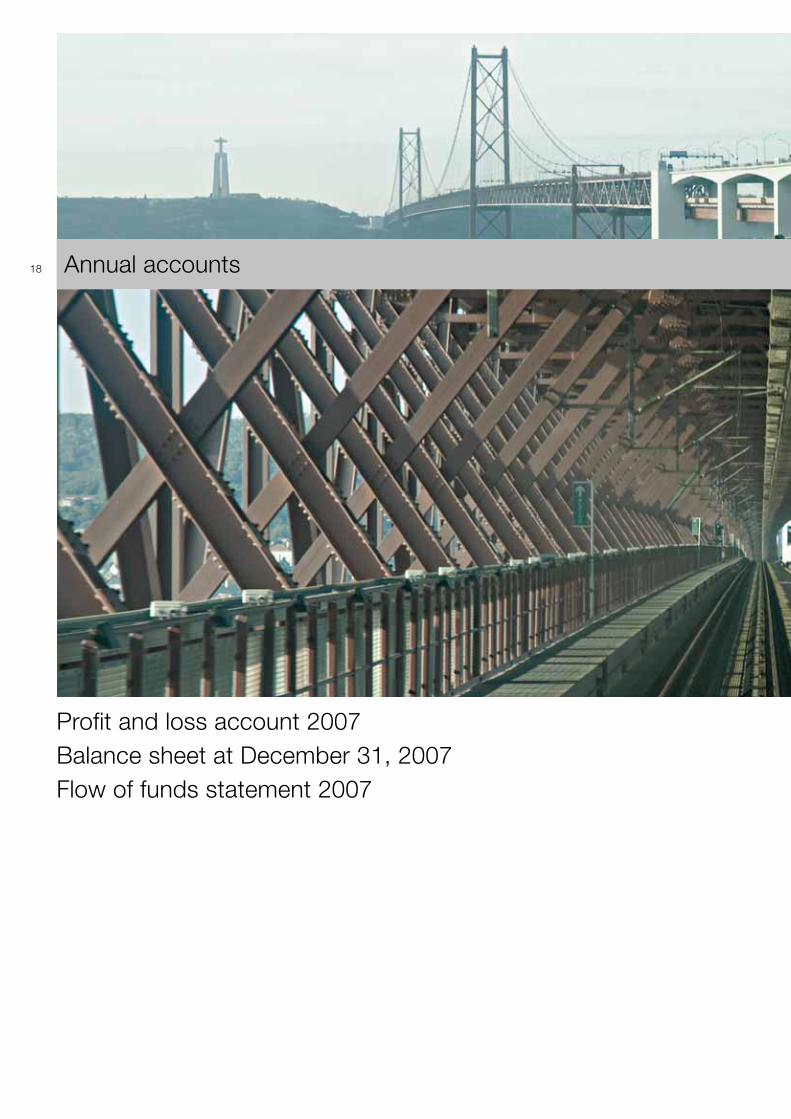
18 Annual accounts
Profit and loss account 2007Balance sheet at December 31, 2007Flow of funds statement 2007

Ponte de 25 Abril, Lisboa, 08:57
19Ponte de 25 Abril, Lisboa, 08:57

20 Profit and loss account 2007Notes 2006 2007
CHF CHF
Interest and similar income (1) 1 566 560 839 1 779 612 696
Interest and similar charges (2) –1 535 568 997 –1 750 053 789
Net interest income 30 991 842 29 558 907
Commissions income (3) 16 605 293 17 014 553
Income from other financial operations (4) 7 035 401 6 073 600
Net operating income 54 632 536 52 647 060
Financial operations charges (5) –858 498 –1 006 351
Operating expenses (6) –7 047 292 –6 992 627
a) Personnel expenses –5 785 871 –5 818 308
b) Other operating expenses –1 261 421 –1 174 319
Gross operating profit 46 726 746 44 648 082
Depreciation on fixed assets (7) –361 054 –116 066
Provisions and other value adjustments (8) –1 000 000 0
Net profit for the financial year 45 365 692 44 532 016

Faro railway station, 11:57
21Balance sheet at December 31, 2007 Before appropriation of surplus
Assets Notes 2006 % 2007 %
CHF CHF
Cash, postal account, due from banks
and money market paper (9) 1 679 341 040 4.9 1 785 519 667 5.0
Fixed income and other securities (10) 928 206 377 2.7 975 415 668 2.8
Equipment financing contracts (11) 28 787 038 312 83.8 29 722 306 559 84.1
Fixed assets (12) 1 . 1 .
Unpaid subscribed share capital (13) 2 080 000 000 6.1 2 080 000 000 5.9
Other assets (14) 7 454 438 . 6 449 932 .
Accrued income and prepaid expenses (15) 861 901 022 2.5 764 948 465 2.2
Total 34 343 941 190 100.0 35 334 640 292 100.0
Liabilities
Amounts due to credit institutions
and customers (16) 4 315 696 484 12.6 3 826 838 537 10.8
Debts evidenced by certificates (17) 25 805 276 303 75.1 27 367 506 268 77.5
a) Senior borrowings 24 024 598 050 25 523 326 339
b) Other debts evidenced by certificates 1 780 678 253 1 844 179 929
Other liabilities (18) 28 470 335 0.1 25 628 162 0.1
Accrued expenses and deferred income (19) 842 341 368 2.5 739 482 352 2.1
Provisions for liabilities and charges (20) 253 326 127 0.7 252 622 384 0.7
Subscribed share capital (21) 2 600 000 000 7.6 2 600 000 000 7.4
Reserves (22) 451 940 000 1.3 476 709 000 1.3
Surplus to be distributed 46 890 573 0.1 45 853 589 0.1
a) Unappropriated surplus previous year 1 524 881 1 321 573
b) Net profit for the financial year 45 365 692 44 532 016
Total 34 343 941 190 100.0 35 334 640 292 100.0
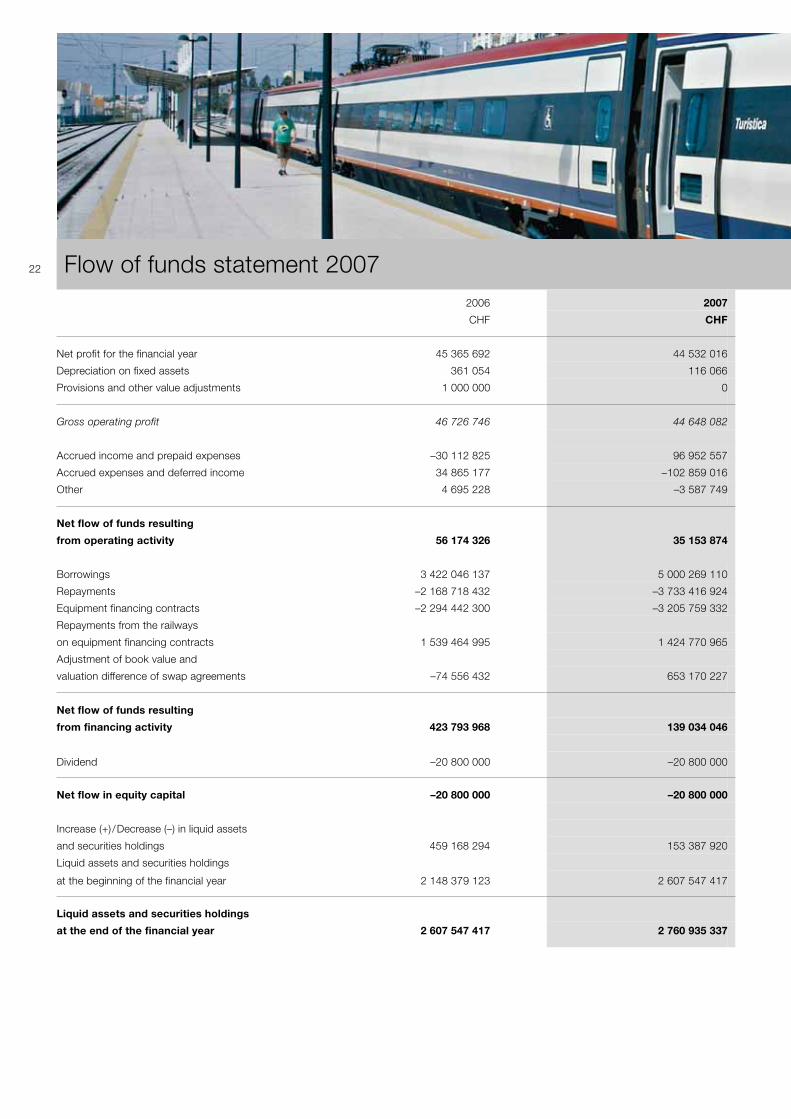
22 Flow of funds statement 20072006 2007
CHF CHF
Net profit for the financial year 45 365 692 44 532 016
Depreciation on fixed assets 361 054 116 066
Provisions and other value adjustments 1 000 000 0
Gross operating profit 46 726 746 44 648 082
Accrued income and prepaid expenses –30 112 825 96 952 557
Accrued expenses and deferred income 34 865 177 –102 859 016
Other 4 695 228 –3 587 749
Net flow of funds resulting
from operating activity 56 174 326 35 153 874
Borrowings 3 422 046 137 5 000 269 110
Repayments –2 168 718 432 –3 733 416 924
Equipment financing contracts –2 294 442 300 –3 205 759 332
Repayments from the railways
on equipment financing contracts 1 539 464 995 1 424 770 965
Adjustment of book value and
valuation difference of swap agreements –74 556 432 653 170 227
Net flow of funds resulting
from financing activity 423 793 968 139 034 046
Dividend –20 800 000 –20 800 000
Net flow in equity capital –20 800 000 –20 800 000
Increase (+) /Decrease (–) in liquid assets
and securities holdings 459 168 294 153 387 920
Liquid assets and securities holdings
at the beginning of the financial year 2 148 379 123 2 607 547 417
Liquid assets and securities holdings
at the end of the financial year 2 607 547 417 2 760 935 337
Faro, 14:26
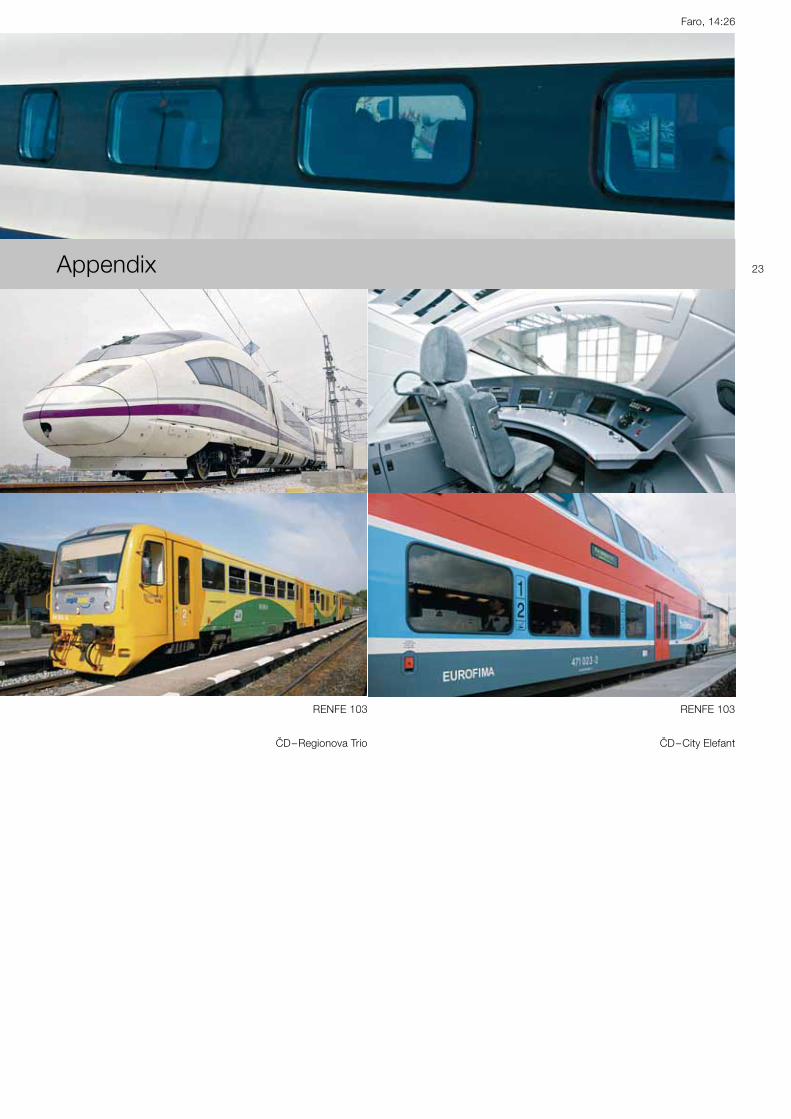
23Appendix
RENFE 103 RENFE 103
CD–Regionova Trio CD–City Elefant

24 Accounting and valuation principlesGeneral principles
The company’s annual accounts include
the profit and loss account, the balance
sheet, the flow of funds statement
and the appendix. Even though not
subject to legislation by the European
Union, EUROFIMA prepares its annual
accounts in conformity with the fourth
directive of the European Union
(78/660/EEC) as well as with the direc-
tive of December 8, 1986 relating to
annual accounts and consolidated
accounts of banks and other financial
institutions (86/635/EEC).
The items of the profit and loss account
and the balance sheet are detailed in the
explanatory notes.
Assessments made in preparing
the annual accounts
In the process of preparing the com-
pany’s annual accounts, the manage-
ment has to make estimates affecting
the company’s net profit and its financial
situation as well as other information
disclosed in the annual report. Such
assessments are based on the available
information and the management’s best
estimates of the situation. Therefore,
the future financial outcome may deviate
from the assessments made.
Introduction of the euro
The introduction of the euro in 1999 led
to a change in the distribution by cur-
rency of certain elements in the balance
sheet. The euro, the former ECU, and
all the currencies which joined the Euro-
pean Monetary Union are presented in
a consolidated manner.
However, debts evidenced by certifi-
cates, which are not subject to re-
denomination by EUROFIMA, continue
to be listed under their original curren-
cies and denominations.
Accounting conventions
The annual accounts are prepared in
accordance with the historical cost
convention, except some items
described in the explanatory notes,
which are recorded at their market value.
All transactions concluded up to the
closing of the books are recorded.
Transactions are booked on the balance
sheet on a value date basis. They are
recorded off-balance sheet upon con-
clusion until their value date. Their total
is indicated under the item “Off-balance
sheet business”.
Foreign currency conversion
The annual accounts are expressed in
Swiss francs. All book entries are
recorded in their original currencies.
Income and expenses are converted
at the exchange rates prevailing on the
day of their booking. As of the closing
of the books, the accounts on the bal-
ance sheet and the outstanding foreign
exchange contracts are revalued at the
exchange rates prevailing on the balance
sheet date. Profits and losses resulting
from this revaluation are taken to the
profit and loss account. Exchange rates
used for the closure of the financial year
are listed in the explanatory notes.
Amounts due from banks and money
market paper
Amounts due from banks are recorded
at their nominal values. Money market
paper is valued at adjusted cost, while
the difference between the effective cost
and redemption value is included linearly
in the profit and loss account over its
residual life.
Fixed-income and other securities
Within the framework of its liquidity
management and the reinforcement of
its creditworthiness, EUROFIMA has
split its holdings of debt securities into
two categories:
a) Investment securities holdings
These securities are purchased with the
intention of holding them on a durable
basis and for use on a continuous basis
in the activities of the company (financial
investments). The risks associated with
these securities, related funding and risk
hedging are managed to generate a
steady profit stream from the investment
securities holdings. These securities are
divided into two categories: first, those
intended to be kept until their final matu-
rity; second, those available for sale,
but not constituting trading positions.
They are booked at the cost at which
they were acquired, excluding the
accrued coupon. Premiums or discounts
are amortized linearly over the remaining
life. Interest rate related fluctuations are
not taken into account. At every closing
of the books, a global value adjustment
is made on the securities’ book value
for possible diminution in value of a per-
manent nature.
b) Marked-to-market securities holdings
These security positions are held for
the shorter term against first liquidity
requirements or for temporary hedging
purposes (current assets). These securi-
ties are part of the item “Cash, postal
account, due from banks and money
market paper” which constitutes the
first liquidity of the company. They are
marked to market and the resulting
unrealized profits and losses are taken
to the profit and loss account.
Equipment financing contracts
Equipment financing contracts are
recorded on the balance sheet at their
nominal values. Interest relating thereto
is booked in the profit and loss account
under “Interest and similar income”.
When the proceeds from a borrowing in
a given currency are transformed by a
currency swap into the currency desired
by the railways, the equipment financing
contracts concerned are booked in the
currencies resulting from the exchanges.
Contrarily, the borrowings are booked in
the original currencies. At every closure
of the accounts, the valuation of the
related currency swaps adjusts the item
"Equipment financing contracts".
Fixed assets
Fixed assets are recorded on the bal-
ance sheet at their acquisition cost
increased by the appreciation resulting
from investments and after deduction
of cumulative depreciation. Fixed assets
acquired in the course of normal
replacement are written off fully during
the year of their acquisition.
Provisions
General risk provisions are maintained to
cover prudently the overall counterparty
risks inherent in the equipment financing
contracts and swaps portfolios. The
accumulated provisions are based on
a periodic review and assessment of
the existing and anticipated collectibility
risks in the total portfolios. While
EUROFIMA has not written off any of
its outstanding equipment financing
contracts, a 100 % interest and other
charges provisioning is established with
respect to principals and interests
overdue by more than 180 days. Adjust-
ments to the accumulated provisions are
recorded in the profit and loss account.
Reverse repurchase transactions
(reverse repos)
These consist of transactions through
which the company invests part of its
short-term liquidity with credit institu-
tions, which in turn provide collateral in
the form of debt securities. This type of
transaction constitutes an irrevocable
engagement to terminate the transaction
at a predetermined date and price.
They are recorded in the balance sheet
at the net amount paid under “due from
banks”.
Derivative financial instruments
In the normal course of its borrowing,
lending and investment activities,
EUROFIMA is a careful end-user of
financial derivatives. These instruments
include primarily swaps, foreign
exchange forward contracts, options
and forward rate agreements. They are
used by EUROFIMA to protect or hedge
itself against interest rate and foreign
exchange risks associated with its
assets, liabilities and anticipated future
cash flows. The total amount of the
outstanding contracts with external
counterparties (i.e. non-shareholders)
is given under the item “Off-balance
sheet business”.
Derivative instruments used for such
protection or hedging purposes are
generally valued in the same way as the
underlying items they are designed to
hedge. Most of these instruments are
held on a long-term basis, with no turn-
over before maturity. Derivative trans-
actions treated in the accounts as
hedges are clearly designated as such at
the inception of the contract. Realized
net profits resulting from the early termi-
nation of a hedge are spread over the
remaining term of the instrument, i.e. up
to the original final maturity.
Taxation
The Additional Protocol to the Conven-
tion relative to EUROFIMA’s constitution
of October 20, 1955 and amended
March 4, 1998 defines the tax exemp-
tions to which the company is entitled
in Switzerland.
Depreciation
The railway equipment represented by
the equipment financing contracts is
depreciated directly by the railways.
Lisboa–Entroncamento, 07:40
25

The financial year coincides with the calendar year
(January 1 – December 31). The amounts are indicated in CHF.
Exchange rates at the date of the balance sheet
Profit and loss account
1 Interest and similar income
This position includes interest from equipment financing contracts
(1 686 277 746), bank deposits (17 578 512), money market paper
(34 043 279) as well as fixed income and other securities
(37 828 490). The foreign exchange result (11 523) and other inter-
est and similar income (3 873 146) are also included in this position.
This item increased by 213.1 million or +13.6 %.
2 Interest and similar charges
This item is composed of interest on amounts due to credit institu-
tions and customers (209 147 921), interest on debts evidenced by
certificates (1 290 462 696), net interest balance on swap agree-
ments (250 243 141) as well as other interest and similar charges
(200 031).
This item increased by 214.5 million or +14.0 %.
3 Commissions income
Income from commissions on equipment financing contracts is
reported here. The commission rate is based on the borrower’s
creditworthiness, varying between 0.025 % and 0.5 % per annum.
These commissions increased by 0.4 million or +2.5 %.
4 Income from other financial operations
This item is composed of income on securities transactions
(290 221) and commissions from leasing transactions (15 000).
The remaining amount contains earnings from swap agreements as
well as various other sources of income (5 768 379).
This item decreased by 1.0 million or –13.7 %.
5 Financial operations charges
These are bank and borrowing charges.
This item increased by 0.1 million or +17.2 %.
6 Operating expenses
Personnel expenses
This item includes salaries (4 493 217) and employee benefits
(1 340 658), particularly contributions to the pension funds for the
personnel. The employees’ retirement plans are guaranteed by a
multi-employer plan independent of the company. Net allocations
to the provisions for accrued holiday (–16 000) and seniority
allowances (433) are also booked as personnel expenses. On
31.12.2007 EUROFIMA had 30 employees in permanent positions.
Other operating expenses
This item contains primarily IT services, legal and other expertise
provided by third parties as well as the maintenance of the com-
pany’s premises.
The operating expenses decreased by 0.1 million or –0.8 %.
7 Depreciation on fixed assets
This depreciation applies to furnishings, hardware and software as
well as other fixed assets.
This item decreased by 0.2 million or –67.9 %.
8 Provisions and other value adjustments
There were no further allocations to the provisions.
This item decreased by 1.0 million or –100.0 %.
Balance sheet
Assets
9 Cash, postal account, due from banks and money market paper
This item consists of cash and postal account (37 010), amounts
due from banks on demand (4 401 490), amounts due from banks
due on time (769 084 100), money market paper (732 853 588) as
well as the marked-to-market securities holdings (279 143 479).
The maturity structure of these assets was as follows:
The increase of this item was 106.2 million or +6.3 %.
Currency CHF Currency CHF
1 AUD 0.992950 100 MXN 10.409850
1 CAD 1.156650 100 NOK 20.845000
100 DKK 22.279650 1 NZD 0.874950
1 EUR 1.661400 100 SEK 17.575000
1 GBP 2.258300 1 TRY 0.966650
1 HKD 0.145050 1 USD 1.131650
100 ISK 1.816700 1 ZAR 0.165900
100 JPY 0.999350
– Amounts due from banks on demand and
marked-to-market securities holdings 283 581 979 15.9 %
– Other assets having a maturity of
less than or equal to 3 months 958 749 231 53.7 %
– Other assets having a maturity of
more than 3 months 543 188 457 30.4 %
1 785 519 667 100.0 %
26 Explanatory notes
Campanhã railway station, 14:20
27
10 Fixed income and other securities
These securities constitute the investment securities holdings.
At 31.12.2007, their market value reached 952 182 798 (nominal
value 986 074 250).
They consist primarily of highly rated securities. At 31.12.2007 the
average rating of these securities was Aaa/AAA. None of these is
pledged or subordinated and the predominant part (87.8 %) is listed
on stock exchanges. The nominal value of securities due in less
than one year amounted to 100 000 000.
The global value adjustment included in the book value was
9 424 000 or 1.0 %.
EUROFIMA participates in the program of loans and borrowings of
securities managed by Euroclear. At 31.12.2007, the market value
of the securities on-lent reached 21 495 880.
This position increased by 47.2 million or +5.1 %.
11 Equipment financing contracts
These equipment financing contracts were concluded exclusively
with shareholders or their guaranteed affiliates.
The nominal amount of equipment financing contracts represented
by debt securities was 4 473 153 360.
The net value of the equipment financing contracts increased by
935.3 million or +3.2 %.
12 Fixed assets
Fixed assets are listed as follows:
13 Unpaid subscribed share capital
The unpaid subscribed share capital may be called in uncondition-
ally at any time by decision of the Board of Directors.
14 Other assets
These assets pertain to the refinancing of amounts due by a railway
(5 000 000) as well as various other assets (1 449 932).
This item decreased by 1.0 million or –13.5 %.
15 Accrued income and prepaid expenses
This item covers mainly accrued, but at 31.12.2007 not yet
matured, interest and commissions on equipment financing con-
tracts (743 526 667), interest on bank deposits, fixed income and
other securities (21 332 114) as well as other accrued income and
prepaid expenses (89 684).
The decrease was 97.0 million or –11.2 %.
Balance at 01.01.2007 28 787 038 312
Valuation difference of swap agreements
at 31.12.2006 1 465 419 601
30 252 457 913
Equipment financings 2007 3 205 759 332
33 458 217 245
Amortization 2007 –1 424 770 965
32 033 446 280
Difference resulting from a currency change
of some equipment financing contracts –399
Adjustment of the book value at 01.01.2007
at the foreign currency exchange rates
at 31.12.2007 –90 127 839
Valuation difference of swap agreements
at 31.12.2007 –2 221 011 483
Net book value of the equipment
financing contracts 29 722 306 559
The maturity structure of these amounts was as
follows:
– less than or equal to 1 year 981 487 598 3.1 %
– more than 1 but less than or equal to 5 years 9 349 546 304 29.3 %
– more than 5 years 21 612 284 140 67.6 %
100.0 %
– valuation difference of swap agreements
at 31.12.2007 –2 221 011 483
29 722 306 559
Premises “Ritterhof”, the company’s offices
Purchase price (investments included) 4 429 434
. /. cumulative depreciation 4 429 433
Net book value 1
Fire insurance value at 01.01.2008 9 988 000
IT systems and other fixed assets
Purchase price 2 671 276
. /. cumulative depreciation 2 671 276
Net book value –

Liabilities
16 Amounts due to credit institutions and customers
The total of these liabilities was:
Amounts due to shareholders and related entities included in this
item came to 2 095 542 106.
The amount due to credit institutions and customers payable on
demand was 0.
17 Debts evidenced by certificates
The sum of debts evidenced by certificates was:
A table with details on the debts evidenced by certificates at
31.12.2007 can be found on pages 30 to 33.
18 Other liabilities
This item contains future fiscal agency costs on outstanding issues
(15 800), withholding tax to be paid (15 176 875) as well as other
liabilities (10 435 487).
These liabilities decreased by 2.8 million or –10.0 %.
19 Accrued expenses and deferred income
This item consists of accrued, but at 31.12.2007 not yet matured,
interest on amounts due to credit institutions and customers
(136 358 092) as well as on debts evidenced by certificates
(498 682 816), net interest on swap agreements (103 326 015) and
other accrued expenses and deferred income (1 115 429).
The decrease was 102.9 million or –12.2 %.
20 Provisions for liabilities and charges
This item includes provisions covering country risks (168 250 000),
risks on swaps (81 118 388) as well as expenses for various
projects (2 589 525). Provisions for possible claims of the collective
pension plan for the personnel (241 420), for accrued holiday
(353 000) and seniority allowances (70 051) are also included in this
item.
The provisions decreased by 0.7 million or –0.3 %.
21 Subscribed share capital
The subscribed share capital is made up of 260 000 registered
shares of a nominal value of 10 000, 20 % of which are paid in.
22 Reserves
This item is composed of the ordinary reserve (59 709 000) and the
guarantee reserve (417 000 000).
Balance at 01.01.2007 4 315 696 484
Financing during 2007 14 933 512
4 330 629 996
Redemptions during 2007 –332 103 944
3 998 526 052
Adjustment of the book value at 01.01.2007
at the foreign exchange rates at 31.12.2007 –171 687 515
3 826 838 537
The structure according to the maturities was as
follows:
– less than or equal to 1 year 105 140 605 2.7 %
– more than 1 but less than or equal to 5 years 1 078 364 638 28.2 %
– more than 5 years 2 643 333 294 69.1 %
3 826 838 537 100.0 %
Balance at 01.01.2007 25 805 276 303
Financing during 2007 4 985 335 599
30 790 611 902
Redemptions during 2007 –3 401 312 980
27 389 298 922
Adjustment of the book value at 01.01.2007
at the foreign exchange rates at 31.12.2007 –21 792 654
27 367 506 268
The structure according to maturities was as
follows:
– less than or equal to 1 year 2 422 266 152 8.8 %
– more than 1 but less than or equal to 5 years 8 893 513 996 32.5 %
– more than 5 years 16 051 726 120 58.7 %
27 367 506 268 100.0 %
28

Pinhal Novo–Tunes, 09:40
29
Off-balance sheet business 31.12.2006 31.12.2007 Change 31.12.2006 31.12.2007 Change
Contingent liabilities 0 0 0
Transactions with value dateSettlement amounts
after balance sheet date
Loans, security sales 12 810 257 0 –12 810 257
Deposits, security purchases 14 284 720 175 750 –14 108 970
Notional amounts
Off-balance liabilities for which
recourse is limited to or which are
offset by a matching off-balance
asset of the company 1 208 022 855 1 109 920 372 –98 102 483
Open derivative contracts Notional amounts Estimated gross replacement values
Interest rate contracts 5 038 776 373 4 981 112 724 –57 663 649 280 124 881 255 819 534 –24 305 347
OTC FRAs 363 072 600 0 –363 072 600 83 468 0 –83 468
Swaps 4 675 703 773 4 981 112 724 305 408 951 280 041 413 255 819 534 –24 221 879
Options 0 0 0 0 0 0
Exchange traded Futures 0 0 0 0 0 0
Options 0 0 0 0 0 0
Foreign exchange contracts 23 020 590 804 26 999 698 348 3 979 107 544 306 806 792 386 326 428 79 519 636
OTC Forward contracts 498 483 580 284 633 527 –213 850 053 1 265 872 321 111 –944 761
Swaps 22 522 107 224 26 715 064 821 4 192 957 597 305 540 920 386 005 317 80 464 397
Options 0 0 0 0 0 0
Exchange traded Futures 0 0 0 0 0 0
Options 0 0 0 0 0 0
Total open derivative contracts 28 059 367 177 31 980 811 072 3 921 443 895 586 931 673 642 145 962 55 214 289
Estimated positive net replacement value of swaps
taking into account legally enforceable netting arrangements 233 913 212 139 886 581 –94 026 631
Total estimated net replacement value of swaps
taking into account legally enforceable netting arrangements –840 146 725 –2 135 557 075 –1 295 410 350
The estimated gross replacement value is the sum of the positive marked-to-market values of contracts without
taking into account any netting arrangements. For exchange traded contracts subject to daily margin posting,
no replacement value is computed. Only external counterparties are taken into account.
Proposed appropriation of surplus
With last year’s unappropriated surplus of 1 321 573 carried forward, the surplus to be distributed
is 45 853 589. According to Article 30 of the Statutes, the Board of Directors proposes the following allocation
of the surplus to the General Assembly:
Appropriation to the ordinary reserve
Dividend of 4 % (statutory maximum) on the paid-in share capital of 520 million
Appropriation to the guarantee reserve
Unappropriated surplus to be carried forward
2 227 000
20 800 000
22 000 000
826 589

30 Debts evidenced by certificatesMaturity Callable Interest rate in % Initial amount Year(s) of issuance Outstanding amounts
at December 31, 2007
Listed bond issues
AUD
15.09.2009 5.5 335 000 000 (1) 2004/2005 335 000 000
15.08.2010 6 400 000 000 (1) 2005/2007 400 000 000
22.08.2011 6.5 1 000 000 000 (1) 2001/2002 1 000 000 000
28.01.2014 6 1 000 000 000 (1) 2004/2005/2006/2007 1 000 000 000
29.07.2015 5.625 175 000 000 (1) 2005/2007 175 000 000
24.10.2016 5.625 650 000 000 (1) 2005/2006/2007 650 000 000
28.12.2018 6.25 1 000 000 000 (1) 2003/2004/2005 1 000 000 000
30.06.2020 5.5 500 000 000 (1) 2005/2007 500 000 000
30.03.2022 6 200 000 000 (1) 2007 200 000 000
CAD
30.12.2008 3.625 195 000 000 (1) 2003 195 000 000
30.01.2009 4 150 000 000 (1) 2004 150 000 000
18.07.2012 5.25 200 000 000 (1) 2002/2003 200 000 000
04.12.2012 4.875 200 000 000 (1) 2002 200 000 000
12.05.2014 4.875 100 000 000 (1) 2004 100 000 000
13.12.2019 5.15 250 000 000 (1) 2004 250 000 000
30.03.2027 4.55 300 000 000 (1) 2007 300 000 000
CHF
30.06.2008 3.375 200 000 000 1998 200 000 000
03.07.2008 2 215 000 000 2003 215 000 000
30.10.2009 2.75 600 000 000 1999 600 000 000
27.07.2010 3.375 250 000 000 2001 250 000 000
26.09.2011 2.625 200 000 000 2003 200 000 000
16.11.2011 3.375 250 000 000 2001 250 000 000
19.12.2011 2.5 445 000 000 2003/2004 445 000 000
27.02.2012 3.5 500 000 000 2002 500 000 000
09.08.2012 4.375 200 000 000 2000 200 000 000
04.12.2012 2.375 515 000 000 2003 515 000 000
19.06.2015 2.75 565 000 000 2003/2004 565 000 000
15.06.2016 2.25 350 000 000 2005 350 000 000
28.12.2018 3.25 450 000 000 2003/2004 450 000 000
03.08.2020 2.375 345 000 000 2005 345 000 000
29.12.2020 3.375 115 000 000 2004 115 000 000
22.05.2024 3 600 000 000 2007 600 000 000
15.05.2026 3 1 000 000 000 2006/2007 1 000 000 000
04.02.2030 2.875 400 000 000 2005/2007 400 000 000
Lisboa, 08:42
31
Maturity Callable Interest rate in % Initial amount Year(s) of issuance Outstanding amounts
at December 31, 2007
Listed bond issues (continued)
EUR
27.10.2009 5.75 400 000 000 (1) 1999 400 000 000
27.12.2012 4.02 120 202 400 (3) 1998 120 202 400
17.09.2014 5.41 300 000 000 (1) 2001 300 000 000
18.11.2014 11 120 202 400 (3) 1994 120 202 400
03.11.2015 10.68 120 202 000 (3) 1995 120 202 000
25.02.2019 2009 structured 75 000 000 (1) 1999 75 000 000
21.10.2019 4.375 500 000 000 (1) 2004 500 000 000
(DEM) (2)
18.12.2009 5.625 525 000 000 1997 525 000 000
(ITL) (2)
30.12.2009 structured 100 000 000 000 (1) 1997 100 000 000 000
16.02.2011 structured 200 000 000 000 (1) 1998 200 000 000 000
(1) Issued under the Programme for the Issuance of Debt Instruments
(2) The ISO codes in parentheses correspond to the original currencies of bond issues
which have not been re-denominated by EUROFIMA
(3) Re-denominated / originally ESP
32 Debts evidenced by certificates
Maturity Callable Interest rate in % Initial amount Year(s) of issuance Outstanding amounts
at December 31, 2007
Listed bond issues (continued)
(PTE) (2)
28.05.2008 FRN 2 864 000 000 (1) 1998 2 864 000 000
GBP
11.02.2013 4.375 100 000 000 (1) 2003 100 000 000
14.10.2014 6.125 265 000 000 (1) 1999/2000 265 000 000
07.06.2032 5.5 150 000 000 (1) 2001/2002 150 000 000
ISK
03.11.2008 10 11 000 000 000 (1) 2006/2007 11 000 000 000
JPY
14.05.2009 structured 3 000 000 000 (1) 1997 3 000 000 000
21.05.2009 structured 400 000 000 (1) 1997 400 000 000
MXN
25.07.2008 7.5 750 000 000 (1) 2007 750 000 000
21.12.2010 10 700 000 000 (1) 2005 700 000 000
Pinhal Novo–Tunes, 09:52
33
Maturity Callable Interest rate in % Initial amount Year(s) of issuance Outstanding amounts
at December 31, 2007
Listed bond issues (continued)
NOK
15.04.2009 6.625 400 000 000 (1) 2002 400 000 000
NZD
21.10.2010 6.5 300 000 000 (1) 2004/2005/2007 300 000 000
SEK
05.02.2008 5.625 750 000 000 (1) 1998 750 000 000
29.12.2011 4.375 700 000 000 (1) 2004/2007 700 000 000
TRY
04.06.2008 18.25 100 000 000 (1) 2007 100 000 000
05.05.2009 14.25 100 000 000 (1) 2007 100 000 000
USD
15.12.2009 4.36 140 000 000 (1) 2003 140 000 000
15.12.2009 3.92 100 000 000 (1) 2003 100 000 000
02.08.2012 5.125 500 000 000 (1) 2002 500 000 000
14.12.2012 4.39 100 000 000 (1) 2004 100 000 000
04.02.2014 4.25 1 000 000 000 (1) 2004 1 000 000 000
06.03.2015 4.5 1 000 000 000 (1) 2005 1 000 000 000
07.04.2016 5.25 1 000 000 000 (1) 2006 1 000 000 000
03.04.2017 5 1 000 000 000 (1) 2007 1 000 000 000
25.03.2022 2010 6.31 20 000 000 (1) 2002 20 000 000
ZAR
08.05.2008 9 500 000 000 (1) 2007 500 000 000
30.06.2008 7 250 000 000 (1) 2005 250 000 000
15.06.2011 8.5 460 000 000 (1) 2006 460 000 000
Equivalent in CHF 25 523 326 340
Other debts evidenced by certificates
Unlisted stand-alone issues Equivalent in CHF 261 330 500
Unlisted issues under the Programme for the Issuance of Debt Instruments Equivalent in CHF 563 527 455
Commercial Paper Equivalent in CHF 1 019 321 973
Total debts evidenced by certificates Equivalent in CHF 27 367 506 268
(1) Issued under the Programme for the Issuance of Debt Instruments
(2) The ISO codes in parentheses correspond to the original currencies of bond issues
which have not been re-denominated by EUROFIMA
(3) Re-denominated / originally ESP
34
Distribution by currency of the amounts due
to credit institutions and customers and of
debts evidenced by certificates at December 31, 2007
Currency Currency units Equivalent in CHF in %
(in million) (in million)
AUD 5 260.0 5 222.9 16.74
CAD 1 395.0 1 613.5 5.17
CHF 7 957.2 7 957.2 25.51
EUR 2 634.7 4 377.4 14.03
GBP 515.0 1 163.0 3.73
HKD 1 232.0 178.7 0.57
ISK 11 000.0 199.8 0.64
JPY 150 906.0 1 508.1 4.83
MXN 1 450.0 151.0 0.48
NOK 400.0 83.4 0.27
NZD 300.0 262.5 0.84
SEK 2 474.1 434.8 1.40
TRY 200.0 193.3 0.62
USD 6 758.3 7 648.0 24.52
ZAR 1 210.0 200.7 0.65
Total – 31 194.3 100.00
CP maintenance hall, Campolide
35Auditors’ reportsReport of the independent auditors
Report to the Board of Directors and the Auditors of EUROFIMA
European Company for the Financing of Railroad Rolling Stock,
Basle
In accordance with the mandate given to us, we have audited,
as independent auditors, the accounting records and the financial
statements consisting of the profit and loss account, the balance
sheet, the flow of funds statement and the notes for the year ended
December 31, 2007 (as on the attached pages 20 to 34 of the
annual report).
These financial statements are the responsibility of the Board of
Directors. Our responsibility is to express an opinion on these
financial statements based on our audit. We confirm that we meet
the legal requirements concerning professional qualification and
independence.
Our audit was conducted in accordance with the Swiss Auditing
Standards and the International Standards on Auditing, which
require that an audit be planned and performed to obtain reason-
able assurance about whether the financial statements are free
from material misstatement. We have examined on a test basis
evidence supporting the amounts and disclosures in the financial
statements. We have also assessed the accounting principles
used, significant estimates made and the overall financial statement
presentation. We believe that our audit provides a reasonable basis
for our opinion.
In our opinion, the financial statements for the year then ended give
a true and fair view of the financial position, the results of operations
and the cash flows in accordance with the general directives of
the European Union and the accounting and valuation principles
described in the annual report. Furthermore, the accounting
records and the financial statements comply with the international
Convention for the establishment of the company, the Statutes and
the Swiss law.
We recommend that the financial statements submitted to you be
approved.
Basle, March 7, 2008
Report of the auditors
to the General Assembly of the shareholders of EUROFIMA
European Company for the Financing of Railroad Rolling Stock,
Basle
Mr. Chairman, Ladies and Gentlemen,
As auditors of your company, elected by the General Assembly
according to Article 28 of the Statutes, we have audited the
accounting records and the financial statements, consisting of the
profit and loss account, the balance sheet, the flow of funds
statement and the appendix for the year ended December 31,
2007.
These financial statements are the responsibility of the Board of
Directors. Our responsibility is to express an opinion on these
financial statements based on our audit. We confirm that we have
the professional qualification and independence necessary to
fulfill this task.
We believe that our own examination and the review of the
independent auditors’ report of March 7, 2008 prepared by
PricewaterhouseCoopers AG, Basle, constitute a reasonable
basis for our opinion.
In our opinion, the financial statements for the year then ended
give a true and fair view of the financial position, the results of
operations and the cash flows in accordance with the general
directives of the European Union and the accounting and valuation
principles described in the annual report. Furthermore, the
accounting records and the financial statements comply with the
international Convention for the establishment of the company,
the Statutes and the Swiss law.
We recommend that the financial statements submitted to you be
approved.
Basle, March 7, 2008
PricewaterhouseCoopers AG
Martin Frei Diego J. Alvarez
José Luis Martínez Giménez Alfred Lutschinger
Stefano Pierini Marc Wengler
Dick Snel
36 Milestones in development1957 First issue in Swiss francs
1961 First issue in Dutch guilders
1962 First share capital increase from 50 to 100 million
Swiss francs
1964 First issue in Deutsche Mark
1967 First issue in US dollars in the Euromarket
1970 Second share capital increase from 100 to 300 million
Swiss francs
1971 First issue in French francs
First issue in Luxembourg francs
1972 First issue in Belgian francs
1974 First issue in US dollars in the Middle East
1975 First issue in US dollars in the “Yankee” market:
Aaa/AAA ratings
1976 Third share capital increase from 300 to 500 million
Swiss francs
1978 First issue in yen in the “Samurai” market
1979 First issue in Austrian shillings
1982 First issue in Sterling
1984 Extension of the duration of the company for another
50 years, until 2056
Fourth share capital increase from 500 to 750 million
Swiss francs
First issue in ECU
1986 Total assets exceed 10 billion Swiss francs for the first time
Aaa/AAA ratings for various Eurobond issues
First issue in Italian lira
1987 EUROFIMA opens the Spanish “Matador” market
First issue in Australian, Canadian and New Zealand dollars
1988 Multi-currency Euro and US commercial paper programs:
P-1/A-1+ ratings
1989 First issue in Swedish krona
First issue in Portuguese escudos
1990 Fifth share capital increase from 750 to 1 050 million
Swiss francs
1991 Total assets exceed 20 billion Swiss francs for the first time
Programme for the Issuance of Debt Instruments in
various currencies: Aaa/AAA ratings
1992 First global bond issue in Australian dollars
Admission of the Hungarian State Railways (MÁV)
1993 Sixth share capital increase from 1 050 to 2 100 million
Swiss francs
1994 Total assets exceed 30 billion Swiss francs for the first time
Admission of the Croatian (H®) and the Slovenian (S®)
Railways
1995 First issue in Hong Kong dollars
1996 First subordinated issue in Swiss francs to strengthen
the equity capital basis
Admission of the Railways of Bosnia and Herzegovina (®BH)
and the Railways of the Former Yugoslav Republic of
Macedonia (CFARYM)
1997 First issue in South African rands
Seventh share capital increase from 2 100 to 2 600 million
Swiss francs
First financing of other railway equipment
1998 First issue in Czech koruna
First issue in Polish zlotys
First issue in Greek drachmas
1999 First issue in Euro
Admission of the Bulgarian State Railways (BDZ)
2000 Adhesion of the Slovak Republic to EUROFIMA’s
Convention
2001 Admission of the Railways of the Slovak Republic (ZSSK)
2002 First issue in Norwegian krona
Admission of the Railways of the Czech Republic (CD)
2003 Increase of Railway Company JSC’s (ZSSK) participation
in EUROFIMA’s share capital
Increase of Hungarian State Railways Ltd.’s (MÁV)
participation in EUROFIMA’s share capital
2004 Increase of Czech Railways JSC’s (CD) participation
in EUROFIMA’s share capital
Increase of Hellenic Railways’ (OSE) participation
in EUROFIMA’s share capital
First US dollar 1 billion benchmark issue
2005 First issue in Mexican pesos
First issue in Turkish lira
2006 Increase of Hungarian State Railways Ltd.’s (MÁV)
participation in EUROFIMA’s share capital
First issue in Icelandic krona
50th Anniversary of EUROFIMA
2007 Increase of Portuguese Railways’ (CP) participation in
EUROFIMA’s share capital
Increase of Hellenic Railways’ (OSE) participation in
EUROFIMA’s share capital
First Swiss franc 1 billion benchmark issue
Castelo de Loulé, 11:48
The paper used in this report is made of chlorine-free cellulose.
The photographs illustrating this annual report were either taken
by Thomas Buser, EUROFIMA, or kindly provided by CD and
RENFE.
Designed by Matthias Bernhard AG, Baden-Dättwil
Printed by Neue Druck AG, Busslingen
BER
NH
ARD
Lisboa–Entroncamento, 07:37
Registered office:
Ritterhof
Rittergasse 20
P.O. Box
CH-4001 Basle
Tel: +41 61 287 33 40
Fax: +41 61 287 32 40
www.eurofima.org