Euro Pricing of Crude Oil: An OPEC's Perspective
19
Loyola University Chicago Loyola University Chicago Loyola eCommons Loyola eCommons Topics in Middle Eastern and North African Economies Journals and Magazines 9-1-2004 Euro Pricing of Crude Oil: An OPEC's Perspective Euro Pricing of Crude Oil: An OPEC's Perspective Mohana Rajamanickam Southern New Hampshire University Massood V. Samii Southern New Hampshire University Arul Thirunavukkarasu Southern New Hampshire University Follow this and additional works at: https://ecommons.luc.edu/meea Part of the Economics Commons Recommended Citation Recommended Citation Rajamanickam, Mohana; Samii, Massood V.; and Thirunavukkarasu, Arul, "Euro Pricing of Crude Oil: An OPEC's Perspective". Topics in Middle Eastern and North African Economies, electronic journal, 6, Middle East Economic Association and Loyola University Chicago, 2004, http://www.luc.edu/orgs/meea/ This Article is brought to you for free and open access by the Journals and Magazines at Loyola eCommons. It has been accepted for inclusion in Topics in Middle Eastern and North African Economies by an authorized administrator of Loyola eCommons. For more information, please contact [email protected]. © 2004 the authors
Transcript of Euro Pricing of Crude Oil: An OPEC's Perspective
Loyola University Chicago Loyola University Chicago
Loyola eCommons Loyola eCommons
Topics in Middle Eastern and North African Economies Journals and Magazines
9-1-2004
Euro Pricing of Crude Oil: An OPEC's Perspective Euro Pricing of Crude Oil: An OPEC's Perspective
Mohana Rajamanickam Southern New Hampshire University
Massood V. Samii Southern New Hampshire University
Arul Thirunavukkarasu Southern New Hampshire University
Follow this and additional works at: https://ecommons.luc.edu/meea
Part of the Economics Commons
Recommended Citation Recommended Citation Rajamanickam, Mohana; Samii, Massood V.; and Thirunavukkarasu, Arul, "Euro Pricing of Crude Oil: An OPEC's Perspective". Topics in Middle Eastern and North African Economies, electronic journal, 6, Middle East Economic Association and Loyola University Chicago, 2004, http://www.luc.edu/orgs/meea/
This Article is brought to you for free and open access by the Journals and Magazines at Loyola eCommons. It has been accepted for inclusion in Topics in Middle Eastern and North African Economies by an authorized administrator of Loyola eCommons. For more information, please contact [email protected]. © 2004 the authors
Euro Pricing of Crude Oil: An OPEC's Perspective Samii, V. Massood
Thirunavukkarasu, Arul Rajamanickam, Mohana
Southern New Hampshire University
Emails: [email protected], [email protected], [email protected] JEL Codes: F3, G1, Q3 Key Words: Crude Oil, OPEC, Oil Prices and Euro
Abstract
In the late 1970s and the early part of the 1980s, a debate emerged within the Long Term Strategy Committee of the Organization of Petroleum Exporting Countries (OPEC) whether to continue the pricing of crude oil in United States dollars or to shift to an alternative currency. This debate was rooted in the persistent decline in the value of the United States dollar relative to other global currencies. The choice of currencies available to price crude oil was limited for OPEC because of the inadequate liquidity of most other currencies. With the recent emergence of the euro, the issue of choice of currency for pricing crude oil has emerged once again for policy discussion. The current paper is focused on the implications of a shift in the pricing of crude oil from United States dollar to euro on OPEC members. Winners and losers are identified based on economic gains and losses. It is concluded that while such a policy would incrementally benefit OPEC en bloc, it would result in a disadvantage for the countries whose major trading partner is the United States and, therefore, would not be a Pareto optimal solution.
I. Introduction
In the late 1970s and the early part of the 1980s a debate within the Organization of Petroleum Exporting Countries (OPEC) was whether to continue the pricing of crude oil in United States dollars or to shift to an alternative currency. This debate is rooted in the persistent decline in the value of the United States dollar relative to other global currencies such as the Japanese Yen and German Deutsche Mark. The core debate of OPEC's Long-Term Strategy Committee [1] was focused on the issue of oil price stability as well as maintaining the purchasing power of OPEC's oil revenues (Evans, 1986). This debate eventually led to the discussion of benchmarking oil prices to a basket of currencies to maintain the buying power of crude oil. The limited liquidity of other currencies was a major concern as it implied a shift to an alternative currency would lead to excessive fluctuations of the same.
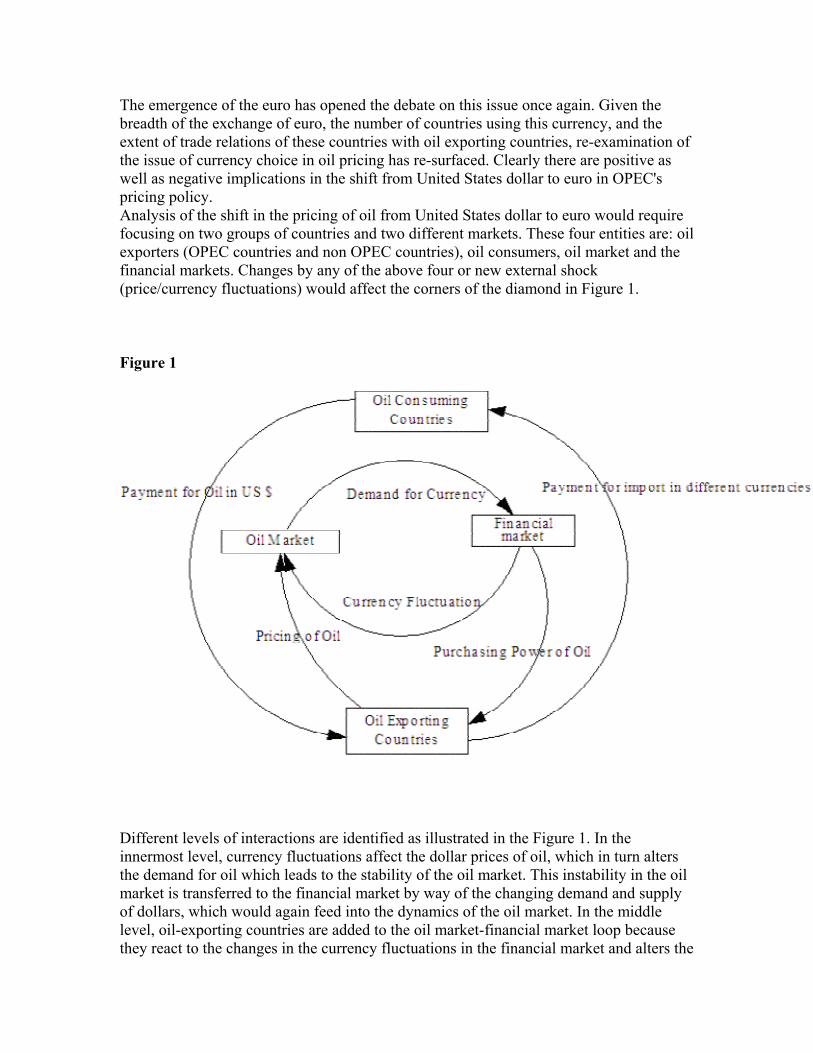
The emergence of the euro has opened the debate on this issue once again. Given the breadth of the exchange of euro, the number of countries using this currency, and the extent of trade relations of these countries with oil exporting countries, re-examination of the issue of currency choice in oil pricing has re-surfaced. Clearly there are positive as well as negative implications in the shift from United States dollar to euro in OPEC's pricing policy. Analysis of the shift in the pricing of oil from United States dollar to euro would require focusing on two groups of countries and two different markets. These four entities are: oil exporters (OPEC countries and non OPEC countries), oil consumers, oil market and the financial markets. Changes by any of the above four or new external shock (price/currency fluctuations) would affect the corners of the diamond in Figure 1.
Figure 1
Different levels of interactions are identified as illustrated in the Figure 1. In the innermost level, currency fluctuations affect the dollar prices of oil, which in turn alters the demand for oil which leads to the stability of the oil market. This instability in the oil market is transferred to the financial market by way of the changing demand and supply of dollars, which would again feed into the dynamics of the oil market. In the middle level, oil-exporting countries are added to the oil market-financial market loop because they react to the changes in the currency fluctuations in the financial market and alters the
price of oil. In the outermost level, oil exporting countries and oil consuming countries interact with each other in their trading relationships. Various factors are affecting these three levels of interaction. In earlier research, the impact of exchange rate fluctuations on the oil market and the ability of OPEC to stabilize this market have been studied (Samii and Clemenz, 1988). The variation in the exchange rate is a destabilizing factor for the oil market. The current paper focuses on the interactions between the financial market and the oil market and proposes to determine the implications of a shift in the currency denomination of oil from United States dollar to euro only on OPEC members.
II. Currency Dilemma
OPEC sets their prices, as well as receives payments, in United States dollars. Between 1971 and 1973, when the United States dollar faced trouble and devalued twice, the OPEC countries devised a formula to revise the nominal price of oil automatically. Since then, the issue of dollar devaluation leading to the loss of purchasing power of OPEC has been widely discussed (Allen, 1979). We have been witnessing a similar pattern of a declining dollar since February 2002, when the dollar depreciated by 19.3 percent against the Japanese yen, 28.8 percent against the euro, 18.6 percent against the UK pound, and 25.4 percent against the Swiss franc. Any movement in the value of the dollar against other currencies will affect the real value of OPEC's export earnings. Because the United States dollar serves as the denominator for pricing crude oil, one can argue that due to differences in the individual country's trade direction and reserve composition, losses resulting from the dollar movements are not equal (Dailami, 1982). For those members who purchase a large share of its import needs from outside of the United States as well as for those that invest a large share of their reserves in United States dollar and dollar denominated assets, this loss is more evident.
The choice of currency most favorable for oil pricing would be in realization of the following conditions. First, the main objective of currency selection should be to minimize the currency exposure, which translates to minimizing the gap between oil revenues and import expenses. Selection of a currency should be such that maintains its value over time vis-à-vis other major currencies. This implies a comparison of the price of a barrel of oil in United States dollars with that of the euro. For this purpose, we used a GDP weighted synthetic euro [2] exchange rate from DataStream until the emergence of the euro on January 1, 1999. One can argue that the oil prices should be based on the currency of the country that has the highest import from OPEC.
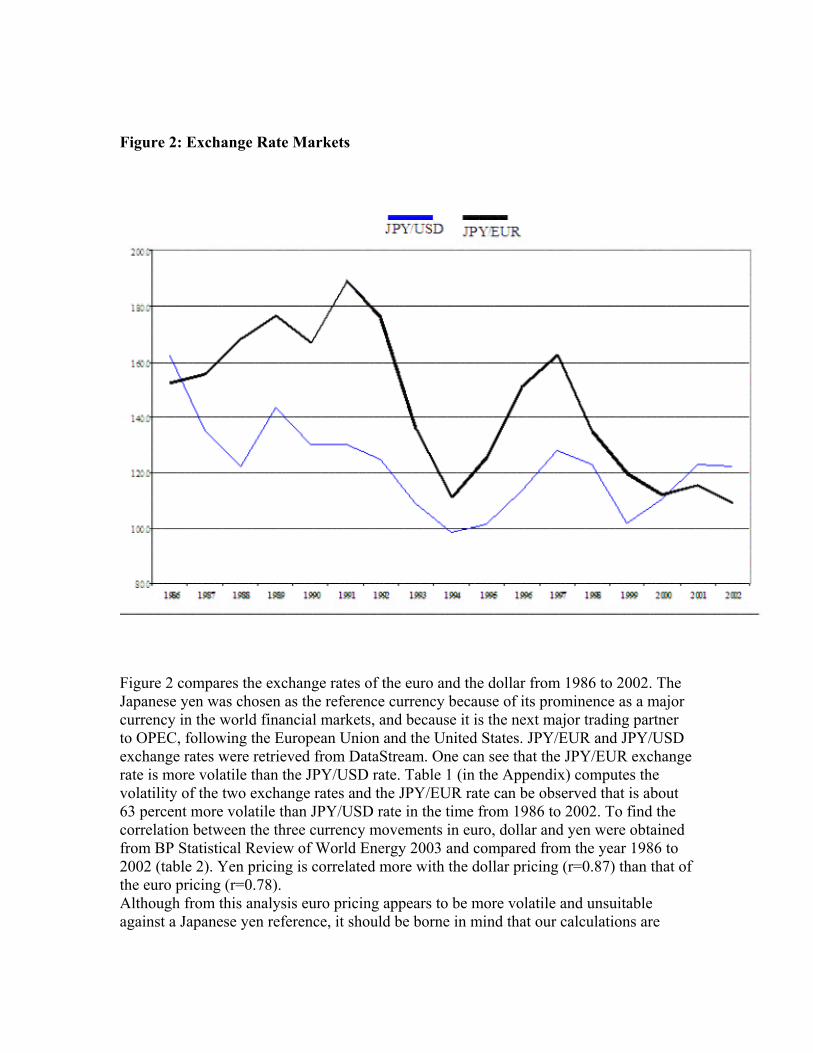
Figure 2: Exchange Rate Markets
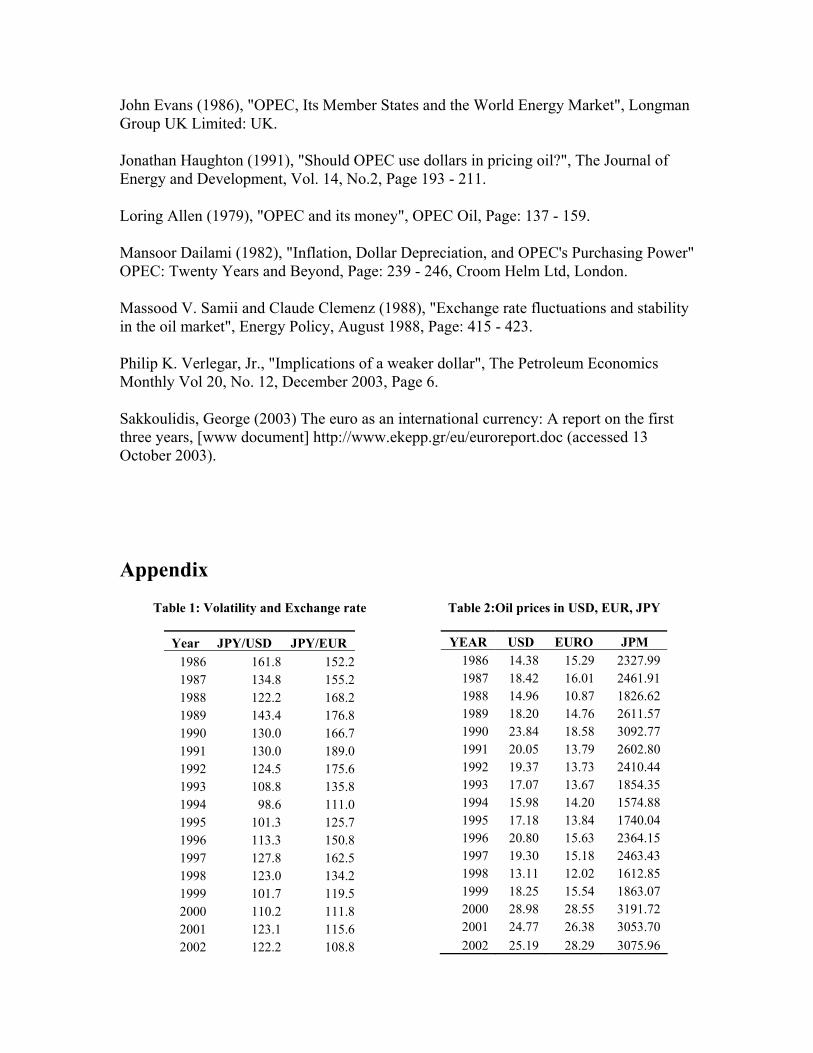
Figure 2 compares the exchange rates of the euro and the dollar from 1986 to 2002. The Japanese yen was chosen as the reference currency because of its prominence as a major currency in the world financial markets, and because it is the next major trading partner to OPEC, following the European Union and the United States. JPY/EUR and JPY/USD exchange rates were retrieved from DataStream. One can see that the JPY/EUR exchange rate is more volatile than the JPY/USD rate. Table 1 (in the Appendix) computes the volatility of the two exchange rates and the JPY/EUR rate can be observed that is about 63 percent more volatile than JPY/USD rate in the time from 1986 to 2002. To find the correlation between the three currency movements in euro, dollar and yen were obtained from BP Statistical Review of World Energy 2003 and compared from the year 1986 to 2002 (table 2). Yen pricing is correlated more with the dollar pricing (r=0.87) than that of the euro pricing (r=0.78). Although from this analysis euro pricing appears to be more volatile and unsuitable against a Japanese yen reference, it should be borne in mind that our calculations are

based on synthetic euro rates. Further, euro is a comparatively new currency and its stability is yet to be proved.
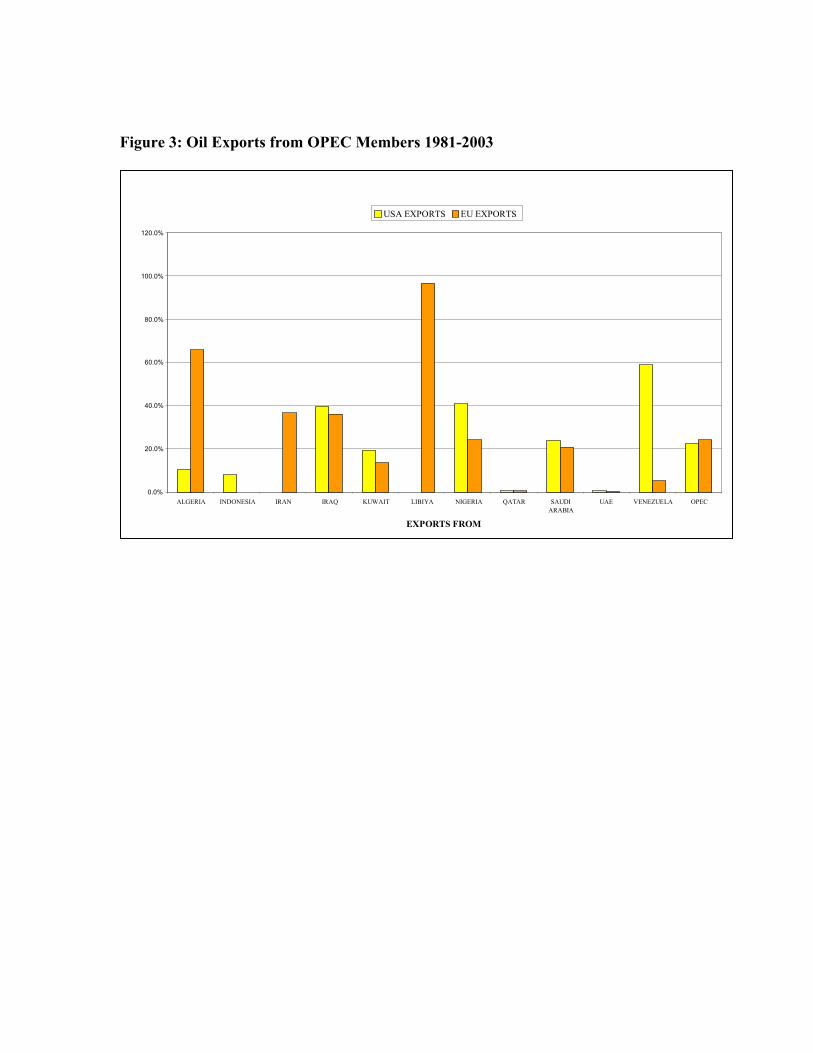
Figure 3: Oil Exports from OPEC Members 1981-2003
0.0%
20.0%
40.0%
60.0%
80.0%
100.0%
120.0%
ALGERIA INDONESIA IRAN IRAQ KUWAIT LIBIYA NIGERIA QATAR SAUDI ARABIA UAE VENEZUELA OPEC
EXPORTS FROM
USA EXPORTS EU EXPORTS
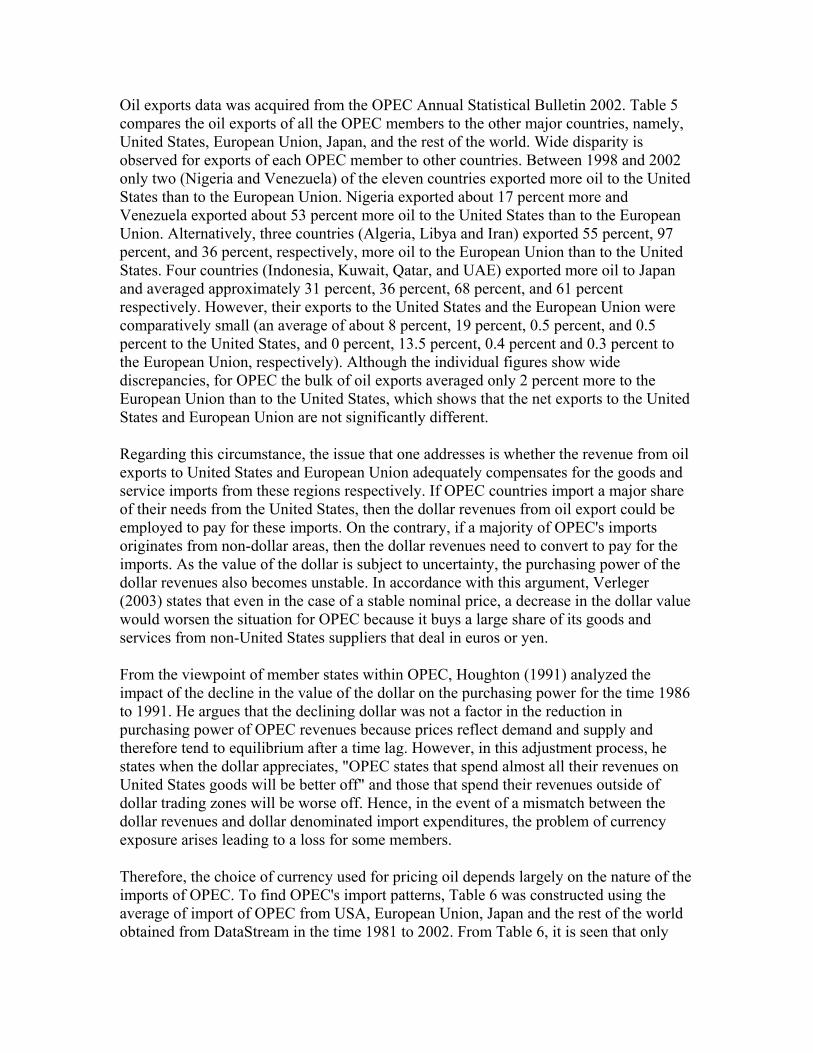
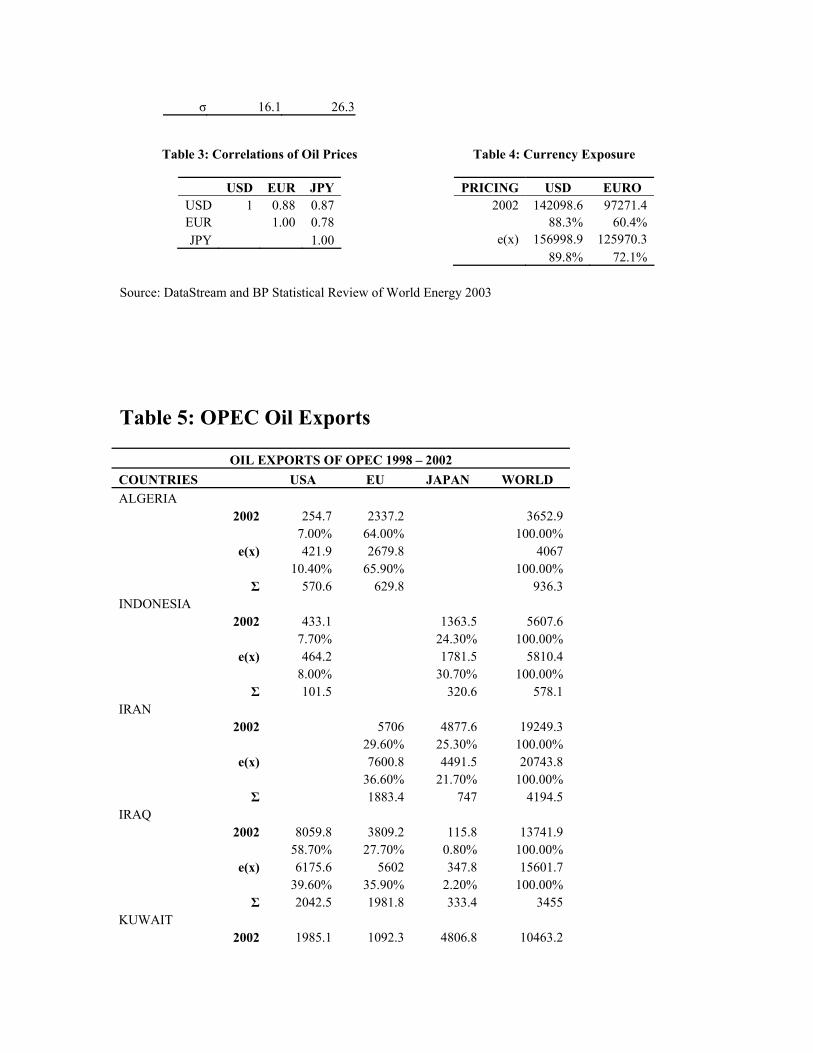
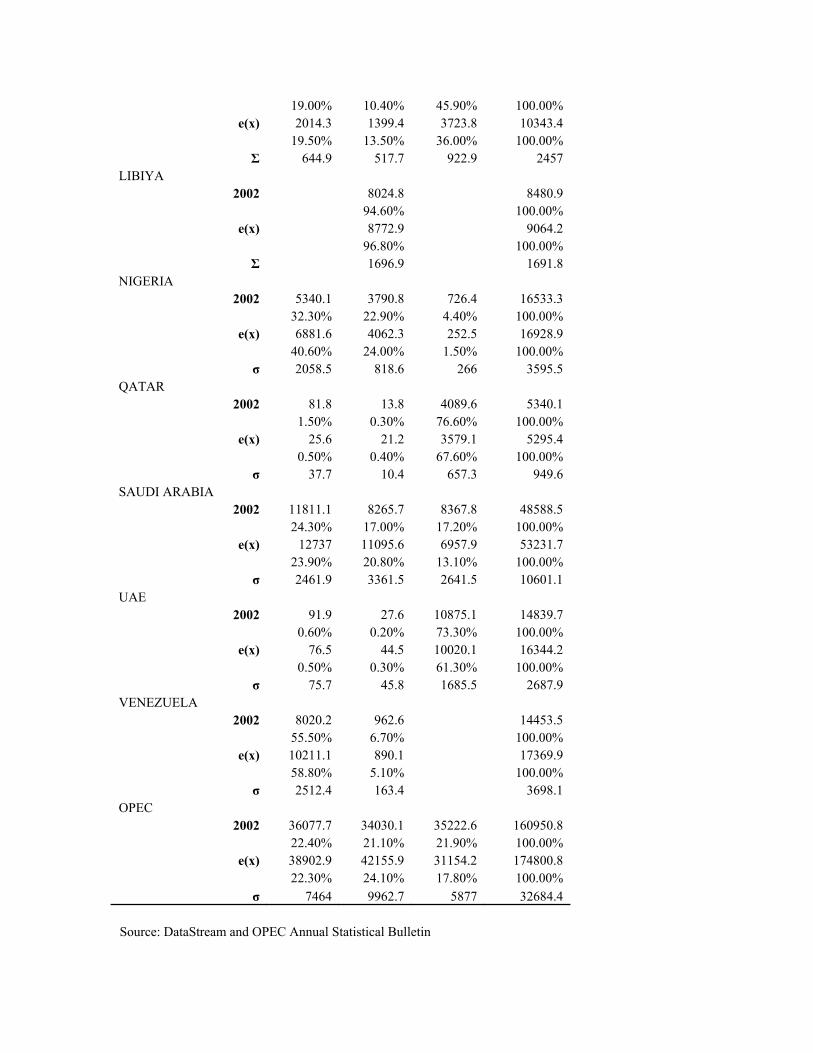
Oil exports data was acquired from the OPEC Annual Statistical Bulletin 2002. Table 5 compares the oil exports of all the OPEC members to the other major countries, namely, United States, European Union, Japan, and the rest of the world. Wide disparity is observed for exports of each OPEC member to other countries. Between 1998 and 2002 only two (Nigeria and Venezuela) of the eleven countries exported more oil to the United States than to the European Union. Nigeria exported about 17 percent more and Venezuela exported about 53 percent more oil to the United States than to the European Union. Alternatively, three countries (Algeria, Libya and Iran) exported 55 percent, 97 percent, and 36 percent, respectively, more oil to the European Union than to the United States. Four countries (Indonesia, Kuwait, Qatar, and UAE) exported more oil to Japan and averaged approximately 31 percent, 36 percent, 68 percent, and 61 percent respectively. However, their exports to the United States and the European Union were comparatively small (an average of about 8 percent, 19 percent, 0.5 percent, and 0.5 percent to the United States, and 0 percent, 13.5 percent, 0.4 percent and 0.3 percent to the European Union, respectively). Although the individual figures show wide discrepancies, for OPEC the bulk of oil exports averaged only 2 percent more to the European Union than to the United States, which shows that the net exports to the United States and European Union are not significantly different.
Regarding this circumstance, the issue that one addresses is whether the revenue from oil exports to United States and European Union adequately compensates for the goods and service imports from these regions respectively. If OPEC countries import a major share of their needs from the United States, then the dollar revenues from oil export could be employed to pay for these imports. On the contrary, if a majority of OPEC's imports originates from non-dollar areas, then the dollar revenues need to convert to pay for the imports. As the value of the dollar is subject to uncertainty, the purchasing power of the dollar revenues also becomes unstable. In accordance with this argument, Verleger (2003) states that even in the case of a stable nominal price, a decrease in the dollar value would worsen the situation for OPEC because it buys a large share of its goods and services from non-United States suppliers that deal in euros or yen.
From the viewpoint of member states within OPEC, Houghton (1991) analyzed the impact of the decline in the value of the dollar on the purchasing power for the time 1986 to 1991. He argues that the declining dollar was not a factor in the reduction in purchasing power of OPEC revenues because prices reflect demand and supply and therefore tend to equilibrium after a time lag. However, in this adjustment process, he states when the dollar appreciates, "OPEC states that spend almost all their revenues on United States goods will be better off" and those that spend their revenues outside of dollar trading zones will be worse off. Hence, in the event of a mismatch between the dollar revenues and dollar denominated import expenditures, the problem of currency exposure arises leading to a loss for some members.
Therefore, the choice of currency used for pricing oil depends largely on the nature of the imports of OPEC. To find OPEC's import patterns, Table 6 was constructed using the average of import of OPEC from USA, European Union, Japan and the rest of the world obtained from DataStream in the time 1981 to 2002. From Table 6, it is seen that only

Venezuela has a major share of its imports from the United States at an average of 42.3 percent (1981 - 2002), while all the other OPEC members import a major share of goods and services from the European Union. For OPEC taken as a whole, 37 percent of the imports originate from the European Union and only about 14 percent of the imports originate from the United States. This mismatch in the trade directions exposes OPEC to currency risk, which leads to wealth disruptions by way of currency exposure.
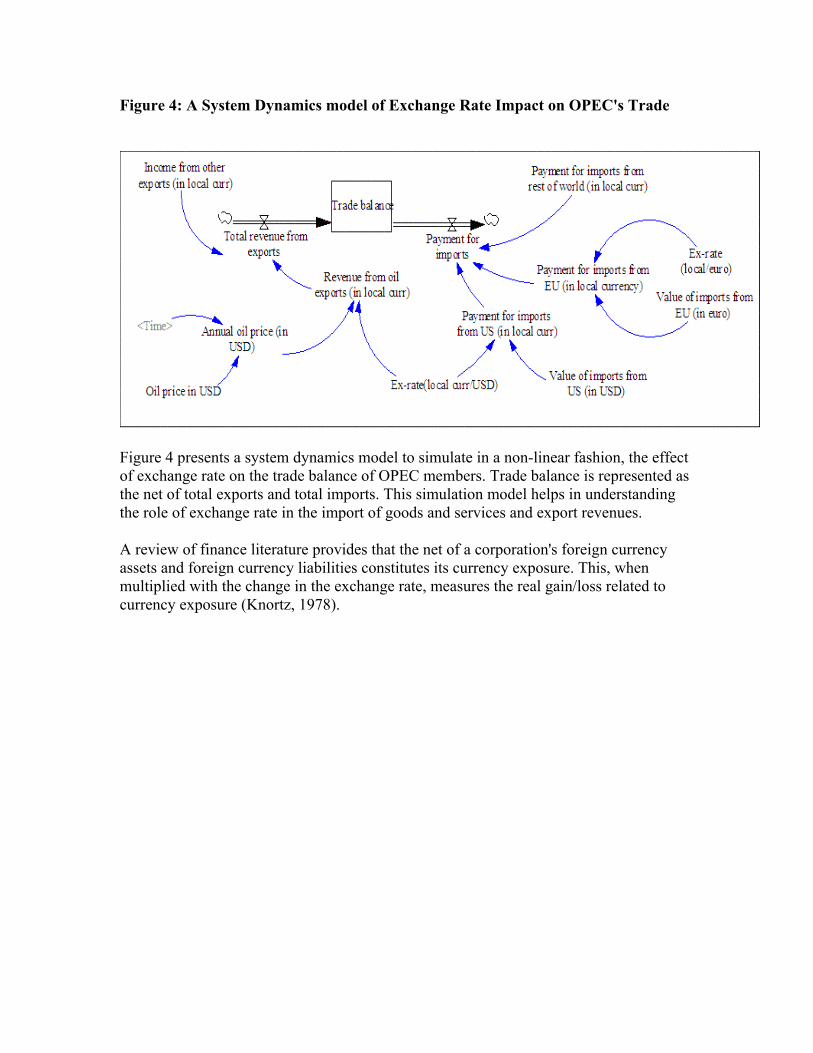
Figure 4: A System Dynamics model of Exchange Rate Impact on OPEC's Trade
Figure 4 presents a system dynamics model to simulate in a non-linear fashion, the effect of exchange rate on the trade balance of OPEC members. Trade balance is represented as the net of total exports and total imports. This simulation model helps in understanding the role of exchange rate in the import of goods and services and export revenues.
A review of finance literature provides that the net of a corporation's foreign currency assets and foreign currency liabilities constitutes its currency exposure. This, when multiplied with the change in the exchange rate, measures the real gain/loss related to currency exposure (Knortz, 1978).
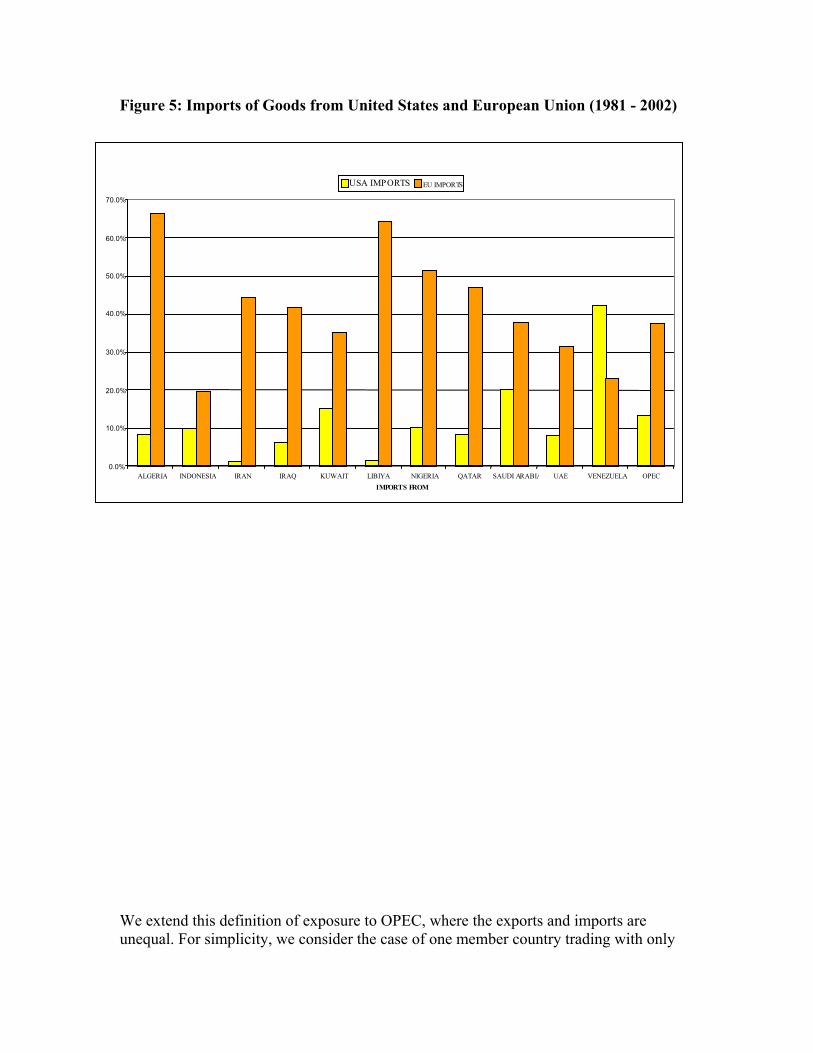
Figure 5: Imports of Goods from United States and European Union (1981 - 2002)
0.0%
10.0%
20.0%
30.0%
40.0%
50.0%
60.0%
70.0%
ALGERIA INDONESIA IRAN IRAQ KUWAIT LIBIYA NIGERIA QATAR SAUDI ARABIA UAE VENEZUELA OPECIMPORTS FROM
USA IMPORTS EU IMPORTS
We extend this definition of exposure to OPEC, where the exports and imports are unequal. For simplicity, we consider the case of one member country trading with only
two partners, European Union and United States. If and represent the oil exported to the United States and European Union respectively, then the foreign currency revenue to the exporting country can be expressed as [ + ]. If and represent the goods imported from United States and European Union respectively then the currency exposure for the OPEC countries under dollar pricing of crude oil is derived as follows:
USOX
X
EUOX
EUOX
USO
USgM EU
gM
Currency Exposure = Foreign currency revenue – Foreign currency expense
= [ + ] (1) USOX −EU
OXUSgM
We first considered the existing scenario where the oil is priced in United States dollar. If
)( USLC
rδ represents the change in the exchange rate (exporting country’s local
currency/United States dollar) then the actual loss related to currency exposure for the
exporting country in its local currency is given as
Actual Loss = [ + ]* USOX −EU
OXUSgM )( US
LC
rδ (2.a)
Alternatively, when the oil is priced in euros, the actual loss to the OPEC country in
terms of its local currency is
Actual Loss = [ + ]* USOX −EU
OXEUgM )( EU
LC
rδ (2.b)
where )( EULC
rδ represents the change in the exchange rate (exporting country’s local
currency/euro). It is necessary to choose that currency such that the loss due to currency
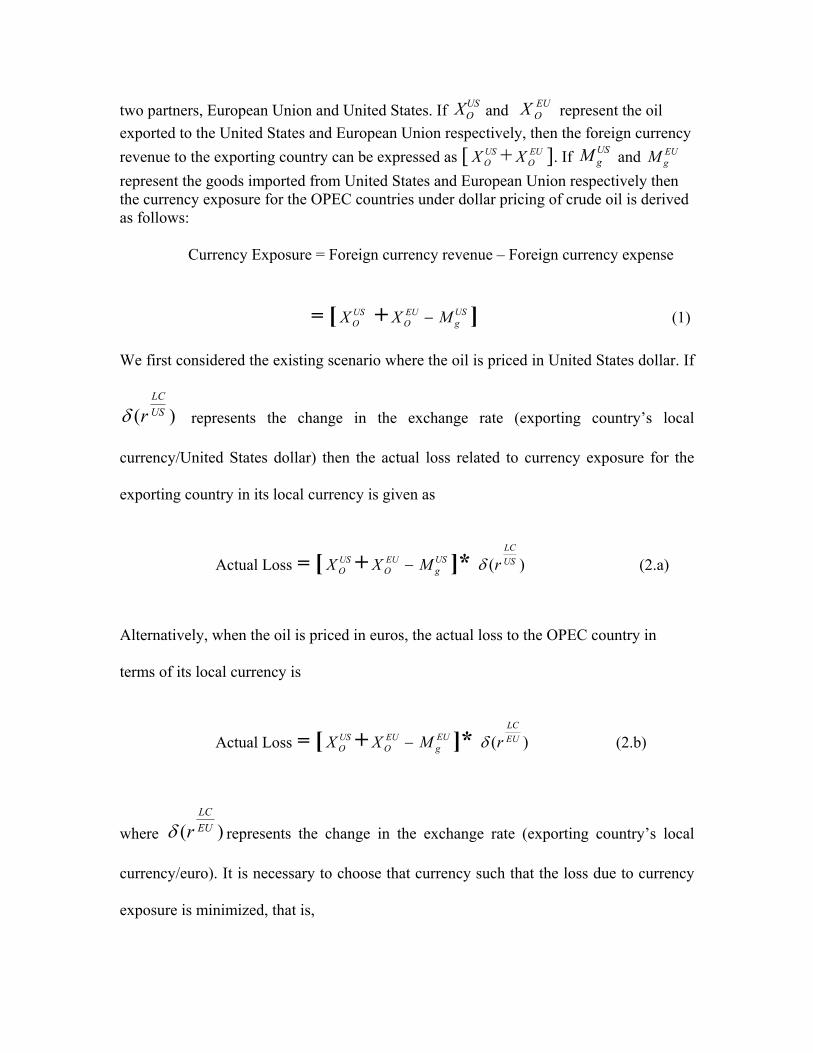
exposure is minimized, that is,
Min {([ + ]*USOX −EU
OXUSgM )( US
LC
rδ ), ([ + ]*USOX −EU
OXEUgM )( EU
LC
rδ )}
Using the above equation, Table 4 computes the loss due to currency exposure under the
alternatives of dollar and euro pricing. It can be seen that when priced in dollars the loss
for OPEC as a whole is 88.3 percent of the total exports for the year 2002, which is about
28 percent in excess of the condition when oil is priced in euros. The figures are also
averaged from 1981 to 2002, and the argument still holds in favor of pricing in euros, as
the exposure loss is 89.8 percent of total exports under dollar pricing, which is about 17
percent in excess of euro pricing.
III. Alternatives Raised at OPEC
To compensate for the volatility of oil revenue caused by the import-export mismatch, OPEC discussed various alternatives. In all of the agreements, the aim was to use a basket of currencies representative of the traditional hard currencies, such as the dollar, mark, sterling, yen, Swiss and French francs (Seymour, 1980).
In January 1972, the first alternative that was agreed upon was to adjust the price of oil proportionate to the plunge in the value of dollar according to the price of gold. This was named Geneva I according to which future postings were to be adjusted in line with an index based on the movement of nine major industrialized countries' currencies [3]. The difficulty arose in the uncertainty of the movement of the dollar in the future. As a result, they made the Geneva II (June 1973) agreement. This led to the revision of the adjustment formula to make it more responsive to the future exchange rate movements, including monthly rather than quarterly adjustments. Eleven currencies were used this time, which included two additional currencies - the Canadian and the Australian dollar. However, after the October 1973 price debacle, the Geneva adjustments were abandoned entirely.
A third alternative, discussed in June 1975, was the use of the International Monetary Fund's Special Drawing Rights (SDR) in place of the United States dollar. The SDR was originally designed with 16 currencies in 1974, but in 1981 it consisted of only five currencies: the U.S. dollar, German mark, French franc, Japanese yen and United Kingdom pound sterling. The weight of each country's currency was based on its share of world trade. The problem with using the SDR was at times when the SDR depreciated against the dollar, OPEC members would suffer loss [4]. Various modifications of the
SDR were suggested: to use an asymmetrical SDR to reflect only the appreciation of the underlying currency, the establishment of a safety net for the SDR to offset the future depreciation of the SDR against the United States dollar, and the usage of the SDR as a medium of exchange between OPEC and its trading nations. However, using SDR would lead to unwanted financial transactions, as trading partners rush to acquire the currencies of the underlying SDR. In any case, all of the suggestions would lead to a significant supply of United States dollars in the market and a loss of confidence in the United States dollar, which would have undesirable impacts on the world economy. Moreover, "to the extent the major trading partners follow widely divergent growth, employment, price system, and budgetary policies at home�. any fixed exchange rate system would be subject to violent twists and turns. �With no firm commitment on the part of the industrial countries to coordinate their employment and price policies, a return to a system of 'fixed but adjustable' par values would be impractical�." and the strategy of OPEC shifting to SDR was not exactly the best alternative (Amuzenager, 1978).
In recent times, the euro has become a major currency since it was created. A series of factors contribute towards promoting the use of the euro as an international currency. The first factor is the grand scale of the economy in the region, which represents 16 percent of world GDP, constituting the second highest GDP in the world, next to the GDP of United States, which represents 21 percent of the world GDP. The second factor is the sound foundation of the economy of the euro zone. The third factor is the integration of national financial markets in Europe, leading to the creation of financial markets of high liquidity (Sakkoulidis, 2003). Therefore, with the current emergence of the euro, because of strict coordination from the participating members in terms of their economic and monetary policies, it is, to an extent, a representative of a currency that was envisioned in the 1980 debate. Hence, the euro could be considered a suitable alternative compared to Geneva I, Geneva II, and SDR for pricing oil.
Another rational option is the multiple pricing of oil in the different currencies of the trading partners. The current strategy of pricing oil in a single currency that is foreign to OPEC and some of its trading partners carries an unnecessary element of currency exposure for both players involved. Hence, a shift to a strategy whereby every country uses its own local currency to trade with OPEC seems ideal as it would eliminate the currency risk for the oil importers. However, this would necessitate that oil be priced in different currencies. The major drawback of this proposal lies in the fact that purchasing power parity does not always hold true in the currency markets and this disequilibrium in the currency market would translate to potential arbitrage in the oil market.
Winners and Losers
A carefully structured policy in pursuit of the betterment of all members is the goal of OPEC, however what is good for the organization as a whole may not be beneficial to the individual members; winners and losers emerge within the organization. The currency alternative in oil pricing facing OPEC must be analyzed along the following dimensions: a) Collectively from OPEC's perspective and b) from the individual country's perspective to satisfy Pareto optimality condition.
Evaluating from OPEC's perspective, losses due to currency exposure can be minimized by pricing in euro because, as explained earlier, oil exports to the European Union is 1.8 percent in excess of exports to the United States and goods imported from the European Union is 23.6 percent in excess of imports originating from the United States. Consequently, this reduces the value of the oil revenues exposed to the fluctuations in the exchange rate and economic losses are minimized. Other things held constant, Table 4 shows that the average currency exposure could have been reduced by 17.7 percent if oil were priced in euros between 1986 and 2002.
Looking at the scenario from the individual member's perspective, one can see that Venezuela would be negatively affected if oil were priced in euros. This is because Venezuela's major trading partner is the United States, with 58.5 percent oil exports and only 5.1 percent flows to the European Union. While 42.3 percent of imports originate from the United States, only 23.1 percent of imports originate from the European Union. Therefore, pricing in dollars would expose a huge share of its oil revenues to fluctuations in euros and, therefore, it is inferred that the euro pricing would be detrimental to Venezuela.
Another equally important factor that is identified, but beyond the scope of the discussion of this paper, is the impact of fluctuations on the dollar and dollar denominated assets and liabilities that is largely held by OPEC members. In addition, the impact of fluctuations and implications of a shift to the euro on oil importers and financial markets are recognized as a probe for further research.
Finally, the scope of this research did not include those countries whose currencies are pegged to the dollar and the euro. This study has not identified the weight of dollar and euro in the overall global trade.
IX. Conclusion
The emergence and rise of the euro as a prominent trading currency has offered an opportunity for OPEC to reconsider pricing of its crude oil in the new currency. The main consideration in making such a policy change by the oil exporters is the ability to maintain their purchasing power of a barrel of their oil exports in an era of persistent dollar decline and to avoid uncertainty regarding their oil revenues in real terms.
While the majority of oil exporting countries trade with non-dollar areas, particularly with European countries, switching to euro - based oil prices seems to be a realistic possibility. However, for countries such as Venezuela, which trades mainly with the United States, this strategy would be counterproductive. Therefore, such a shift in strategy would not be Pareto optimal and would result in disadvantage for the countries having United States as a major trading partner.
Moreover, such a policy would seem impossible to implement given the political dynamics and the governance of OPEC. Within OPEC, any decision taken by the ministerial conference has to be agreed upon unanimously. The fact that there will be
losers in such a policy shift would imply that these countries would categorically not support such a decision and therefore status quo will remain.
**Authors are with the Southern New Hampshire University, International Business Department. V.S. Samii was the senior economist and head of the financial section of OPEC secretariat from 1978 to 1987
*The ideas presented in this paper are those of the authors and do not necessarily represent official OPEC's views
Endnotes:
1. The OPEC's Long Term Strategy Committee was chaired by Sheikh Zaki Yamani, Oil minister of Saudi Arabia and met on a number of occasions, including May 6 and 7, 1978 at Taif, Saudi Arabia.
2. Synthetic euro exchange rate is obtained from the DataStream service and has been calculated by FTSE International Ltd against various other currencies. Calculations are based on the deutsche/euro irrevocable fixed conversion rate of 1.95583, the cross-rates to the deutsche mark as published on May 4, 1998 and the weighting factor used is a constant (1996 GDP weight of each country).
3. The nine currencies were Belgian, Swiss and French francs, German mark, Italian lira, Japanese yen, Dutch guilder, Swedish krone and the pound sterling.
4. The decline in the value of the dollar with respect to other currencies gradually altered the SDR value of the dollar. In the early November 1978, the value of the dollar was only 78 percent of that of the SDR.
References
Ian Seymour (1980), "OPEC: Instrument of Change", The Macmillan Press Limited: London.
Jahangir Amuzegar (1978), "OPEC and the Dollar Dilemma", Foreign Affairs, July 1978, Page: 740-750.
John Evans (1986), "OPEC, Its Member States and the World Energy Market", Longman Group UK Limited: UK.
Jonathan Haughton (1991), "Should OPEC use dollars in pricing oil?", The Journal of Energy and Development, Vol. 14, No.2, Page 193 - 211.
Loring Allen (1979), "OPEC and its money", OPEC Oil, Page: 137 - 159.
Mansoor Dailami (1982), "Inflation, Dollar Depreciation, and OPEC's Purchasing Power" OPEC: Twenty Years and Beyond, Page: 239 - 246, Croom Helm Ltd, London.
Massood V. Samii and Claude Clemenz (1988), "Exchange rate fluctuations and stability in the oil market", Energy Policy, August 1988, Page: 415 - 423.
Philip K. Verlegar, Jr., "Implications of a weaker dollar", The Petroleum Economics Monthly Vol 20, No. 12, December 2003, Page 6.
Sakkoulidis, George (2003) The euro as an international currency: A report on the first three years, [www document] http://www.ekepp.gr/eu/euroreport.doc (accessed 13 October 2003).
Appendix
Table 1: Volatility and Exchange rate
Year JPY/USD JPY/EUR 1986 161.8 152.21987 134.8 155.21988 122.2 168.21989 143.4 176.81990 130.0 166.71991 130.0 189.01992 124.5 175.61993 108.8 135.81994 98.6 111.01995 101.3 125.71996 113.3 150.81997 127.8 162.51998 123.0 134.21999 101.7 119.52000 110.2 111.82001 123.1 115.62002 122.2 108.8
Table 2:Oil prices in USD, EUR, JPY
YEAR USD EURO JPM 1986 14.38 15.29 2327.99 1987 18.42 16.01 2461.91 1988 14.96 10.87 1826.62 1989 18.20 14.76 2611.57 1990 23.84 18.58 3092.77 1991 20.05 13.79 2602.80 1992 19.37 13.73 2410.44 1993 17.07 13.67 1854.35 1994 15.98 14.20 1574.88 1995 17.18 13.84 1740.04 1996 20.80 15.63 2364.15 1997 19.30 15.18 2463.43 1998 13.11 12.02 1612.85 1999 18.25 15.54 1863.07 2000 28.98 28.55 3191.72 2001 24.77 26.38 3053.70 2002 25.19 28.29 3075.96
σ 16.1 26.3
Table 3: Correlations of Oil Prices
USD EUR JPY USD 1 0.88 0.87 EUR 1.00 0.78 JPY 1.00
Table 4: Currency Exposure
PRICING USD EURO 2002 142098.6 97271.4
88.3% 60.4% e(x) 156998.9 125970.3
89.8% 72.1%
Source: DataStream and BP Statistical Review of World Energy 2003
Table 5: OPEC Oil Exports
OIL EXPORTS OF OPEC 1998 – 2002 COUNTRIES USA EU JAPAN WORLD ALGERIA
2002 254.7 2337.2 3652.9 7.00% 64.00% 100.00%
e(x) 421.9 2679.8 4067 10.40% 65.90% 100.00%
Σ 570.6 629.8 936.3 INDONESIA
2002 433.1 1363.5 5607.6 7.70% 24.30% 100.00%
e(x) 464.2 1781.5 5810.4 8.00% 30.70% 100.00%
Σ 101.5 320.6 578.1 IRAN
2002 5706 4877.6 19249.3 29.60% 25.30% 100.00%
e(x) 7600.8 4491.5 20743.8 36.60% 21.70% 100.00%
Σ 1883.4 747 4194.5 IRAQ
2002 8059.8 3809.2 115.8 13741.9 58.70% 27.70% 0.80% 100.00%
e(x) 6175.6 5602 347.8 15601.7 39.60% 35.90% 2.20% 100.00%
Σ 2042.5 1981.8 333.4 3455 KUWAIT
2002 1985.1 1092.3 4806.8 10463.2
19.00% 10.40% 45.90% 100.00% e(x) 2014.3 1399.4 3723.8 10343.4
19.50% 13.50% 36.00% 100.00% Σ 644.9 517.7 922.9 2457
LIBIYA 2002 8024.8 8480.9
94.60% 100.00% e(x) 8772.9 9064.2
96.80% 100.00% Σ 1696.9 1691.8
NIGERIA 2002 5340.1 3790.8 726.4 16533.3
32.30% 22.90% 4.40% 100.00% e(x) 6881.6 4062.3 252.5 16928.9
40.60% 24.00% 1.50% 100.00% σ 2058.5 818.6 266 3595.5
QATAR 2002 81.8 13.8 4089.6 5340.1
1.50% 0.30% 76.60% 100.00% e(x) 25.6 21.2 3579.1 5295.4
0.50% 0.40% 67.60% 100.00% σ 37.7 10.4 657.3 949.6
SAUDI ARABIA 2002 11811.1 8265.7 8367.8 48588.5
24.30% 17.00% 17.20% 100.00% e(x) 12737 11095.6 6957.9 53231.7
23.90% 20.80% 13.10% 100.00% σ 2461.9 3361.5 2641.5 10601.1
UAE 2002 91.9 27.6 10875.1 14839.7
0.60% 0.20% 73.30% 100.00% e(x) 76.5 44.5 10020.1 16344.2
0.50% 0.30% 61.30% 100.00% σ 75.7 45.8 1685.5 2687.9
VENEZUELA 2002 8020.2 962.6 14453.5
55.50% 6.70% 100.00% e(x) 10211.1 890.1 17369.9
58.80% 5.10% 100.00% σ 2512.4 163.4 3698.1
OPEC 2002 36077.7 34030.1 35222.6 160950.8
22.40% 21.10% 21.90% 100.00% e(x) 38902.9 42155.9 31154.2 174800.8
22.30% 24.10% 17.80% 100.00% σ 7464 9962.7 5877 32684.4
Source: DataStream and OPEC Annual Statistical Bulletin