EUMETNET OPERA weather radar information model for ...
51
EUMETNET OPERA 5 Work Package OD8 01/07/2021 Page 1 of 1 EUMETNET OPERA weather radar information model for implementation with the HDF5 file format Version 2.4 Original authors: Daniel B. Michelson 1 , Rafał Lewandowski 2 , Maciej Szewczykowski 2 , and Hans Beekhuis 3 Additional authors: Günther Haase 1 , Theodor Mammen 4 , and Daniel Johnson 1 1 Swedish Meteorological and Hydrological Institute, Norrköping, Sweden 2 Institute of Meteorology and Water Management, Warsaw, Poland 3 Royal Netherlands Meteorological Institute, De Bilt, Netherlands 4 German Weather Service, Hamburg, Germany
Transcript of EUMETNET OPERA weather radar information model for ...

EUMETNET OPERA 5 Work Package OD8
01/07/2021
Page 1 of 1
EUMETNET OPERA weather radar information model for
implementation with the HDF5 file format
Version 2.4
Original authors:
Daniel B. Michelson 1, Rafał Lewandowski2, Maciej Szewczykowski2, and Hans Beekhuis 3
Additional authors:
Günther Haase1, Theodor Mammen4, and Daniel Johnson 1
1Swedish Meteorological and Hydrological Institute, Norrköping, Sweden
2Institute of Meteorology and Water Management, Warsaw, Poland
3Royal Netherlands Meteorological Institute, De Bilt, Netherlands
4German Weather Service, Hamburg, Germany

EUMETNET OPERA weather radar information model forimplementation with the HDF5 file format
Version 2.4
Original authors:
Daniel B. Michelson1, Rafał Lewandowski2,Maciej Szewczykowski2, and Hans Beekhuis3
Additional authors:
Günther Haase1, Theodor Mammen4, and Daniel Johnson1
1Swedish Meteorological and Hydrological Institute, Norrköping, Sweden2Institute of Meteorology and Water Management, Warsaw, Poland3Royal Netherlands Meteorological Institute, De Bilt, Netherlands
4German Weather Service, Hamburg, Germany
on behalf of EUMETNET OPERA
July 1, 2021
Abstract
This document specifies an information model with which the encoding, decoding and managementof data and products from weather radar systems may be facilitated, primarily for the purposes of in-ternational exchange in Europe. An implementation of this information model is also specified whichmakes use of the HDF5 file format developed and maintained by the HDF Group. The result manifestsitself in the form of truly self-describing weather radar data files highly suitable for environments wheredata exchange between radars from different manufacturers, different organizations, and/or differentcountries is conducted. The ability to include quality information, in the forms of metadata and binaryarrays, is included in a powerful and flexible manner. This information model constitutes an officialsecond-generation European standard exchange format for weather radar datasets. Because the netCDFfile format is built on HDF5, we also try to ensure that our information model will be compliant withnetCDF.

OPERA Data Information Model for HDF5 i
RELEASE NOTES
Version 2.4, 1 July 2021
In addition to the optional how Attributes a few mandatory how Attributes have been defined tofacilitate the use of radar data for e.g. NWP. Even the NOD identifier in /what/source is now mandatory.Two-dimensional how Attributes attributes (e.g. melting layer height, parameters in the Z-R and KDP-R relationships) have been introduced. Moreover new attributes (e.g. pulse repetition time, radar towerheight, applied method to derive the vertical profile) and quantities (e.g. unfiltered SNR) have been added.Note that all new attributes and quantities follow the CfRadial2 conventions. Definitions and descriptionshave been improved and SI units are applied where applicable.
Version 2.3, 9 January 2019
The list of how Attributes has been split into highly desirable and recommended attributes.User-definable subgroups (including sub-subgroups) may be added to existing how groups: e.g.how/rsp (radar signal processor parameters), how/radar_parameters (general radar system param-eters), how/bite (BITE information), how/radar_monitoring (external monitoring information),how/radar_scheduling (additional scheduling information), how/radar_processing_chain(processing chain), and how/noden, where n is the index of a radar node included in a composite. User-definable attributes may be added to these subgroups. Quantities that have not been subject to any filter orcorrection have been added. The WIGOS identifier is now included in the list of source type identifiers.
Version 2.2, 21 March 2014
Table 8 contains additional how Attributes for all objects while new quantities have been added toTable 16. Some attributes (like TXloss, RXloss, SQI, SNR, VRAD, and WRAD) were assumed to behorizontally-polarized only. For consistency and clarity attributes that exist in both H and V polarization aredenoted accordingly. The new ODIM version also contains a minimum specification for a vertical profileand a polar RHI representation. The latter resembles sector objects and scans. Table 2 includes a newfile object “ELEV” (Elevational object) to accommodate this polar representation. The ELEV object mayonly contain the polar product how/product “RHI” as already specified in Table 14. Previously existingquantities have been marked for deprecation. Optional Attributes with ambiguous polarities have beenremoved where new attributes supersede them.
Version 2.1, 28 April 2011
The “simple array” type has been introduced and some attributes have been redefined to use it. The/what/source attribute has undergone revision. Several new optional how metadata attributes havebeen added. Section 7 has been reformulated to also identify prioritized optional how attributes in supportof various applications. Clarifications have been added where ambiguities have been found, and errors havebeen corrected. Due to the scope of the changes introduced, this version has been incremented to the nextminor version number.
Version 2.0.1, 21 September 2010
The composite object and product are now officially accepted as OPERA standard. A couple of clarificationshave been made, without changing any of the contents of the information model itself. The UML annexhas been broken out to be its own working document. To mark this, and that we’ve released an updateddocument, a minor-subversion has been introduced.
ODIM_H5 2.4

OPERA Data Information Model for HDF5 ii
Version 2.0, 9 June 2009
A few inconsistencies between metadata in the tables and the diagrams in the UML representation have beenidentified and corrected. These fixes do not motivate a version number increment.
Version 2.0, 1 June 2009
This is the first version of ODIM_H5 to be officially accepted as an OPERA standard. Notwithstanding thisstatus, the official parts are the definitions of polar scans and volumes, along with all associated metadata.All other objects retain their draft status, and will achieve official status in due course, subject to approval inOPERA.
ODIM_H5 2.4

OPERA Data Information Model for HDF5 iii
Contents
1 Introduction and motivation 1
2 Information model concept 2
3 Definitions 73.1 Scalars (integers, real values, and strings) . . . . . . . . . . . . . . . . . . . . . . . . . . . 7
3.1.1 Booleans . . . . . . . . . . . . . . . . . . . . . . . . . . . . . . . . . . . . . . . . 73.1.2 Sequences . . . . . . . . . . . . . . . . . . . . . . . . . . . . . . . . . . . . . . . . 73.1.3 Simple arrays . . . . . . . . . . . . . . . . . . . . . . . . . . . . . . . . . . . . . . 8
3.2 Attributes . . . . . . . . . . . . . . . . . . . . . . . . . . . . . . . . . . . . . . . . . . . . 83.3 Datasets . . . . . . . . . . . . . . . . . . . . . . . . . . . . . . . . . . . . . . . . . . . . . 83.4 Groups . . . . . . . . . . . . . . . . . . . . . . . . . . . . . . . . . . . . . . . . . . . . . . 8
4 Metadata attribute specification 94.1 Root Group . . . . . . . . . . . . . . . . . . . . . . . . . . . . . . . . . . . . . . . . . . . 94.2 Top-level what Group . . . . . . . . . . . . . . . . . . . . . . . . . . . . . . . . . . . . . 104.3 where Group . . . . . . . . . . . . . . . . . . . . . . . . . . . . . . . . . . . . . . . . . 11
4.3.1 where for polar data Groups . . . . . . . . . . . . . . . . . . . . . . . . . . . . . 114.3.2 where for geographically referenced image Groups . . . . . . . . . . . . . . . . . 124.3.3 where for cross-section data Group . . . . . . . . . . . . . . . . . . . . . . . . . 134.3.4 where for vertical profiles . . . . . . . . . . . . . . . . . . . . . . . . . . . . . . 15
4.4 how Group . . . . . . . . . . . . . . . . . . . . . . . . . . . . . . . . . . . . . . . . . . . 154.5 what Group for Dataset objects . . . . . . . . . . . . . . . . . . . . . . . . . . . . . . 27
5 Data specification 325.1 Polar Data . . . . . . . . . . . . . . . . . . . . . . . . . . . . . . . . . . . . . . . . . . . . 335.2 Image Data . . . . . . . . . . . . . . . . . . . . . . . . . . . . . . . . . . . . . . . . . . . 335.3 RHIs, cross sections and side panels . . . . . . . . . . . . . . . . . . . . . . . . . . . . . . 335.4 Profiles . . . . . . . . . . . . . . . . . . . . . . . . . . . . . . . . . . . . . . . . . . . . . 345.5 Rays and sectors . . . . . . . . . . . . . . . . . . . . . . . . . . . . . . . . . . . . . . . . 345.6 Embedded graphical images . . . . . . . . . . . . . . . . . . . . . . . . . . . . . . . . . . 34
6 Optional objects 356.1 Palettes . . . . . . . . . . . . . . . . . . . . . . . . . . . . . . . . . . . . . . . . . . . . . 356.2 Legends . . . . . . . . . . . . . . . . . . . . . . . . . . . . . . . . . . . . . . . . . . . . . 35
7 Mandatory metadata per product 387.1 Polar volume . . . . . . . . . . . . . . . . . . . . . . . . . . . . . . . . . . . . . . . . . . 387.2 Composite . . . . . . . . . . . . . . . . . . . . . . . . . . . . . . . . . . . . . . . . . . . . 417.3 Vertical profile . . . . . . . . . . . . . . . . . . . . . . . . . . . . . . . . . . . . . . . . . 427.4 RHI . . . . . . . . . . . . . . . . . . . . . . . . . . . . . . . . . . . . . . . . . . . . . . . 43
A Derivation of the radar calibration constant 45
ODIM_H5 2.4

OPERA Data Information Model for HDF5 iv
List of Tables
1 Mandatory top-level what header Attributes for all weather radar files. . . . . . . . . . 102 File object strings and their meanings. . . . . . . . . . . . . . . . . . . . . . . . . . . . . . 103 Source type identifiers and their associated values. . . . . . . . . . . . . . . . . . . . . . . . 114 where Attributes for polar data objects. . . . . . . . . . . . . . . . . . . . . . . . . . 125 where Attributes for geographical image data Groups. . . . . . . . . . . . . . . . . . 136 where Attributes for cross-section data. . . . . . . . . . . . . . . . . . . . . . . . . . 147 where Attributes for vertical profiles. . . . . . . . . . . . . . . . . . . . . . . . . . . . 158 how Attributes for all objects. Shading indicates mandatory Attributes for single-
site data depending on the polarization mode applied and the moments provided (e.g. NIcan be omitted if no radial velocity data are available). The non-shaded Attributes areoptional. . . . . . . . . . . . . . . . . . . . . . . . . . . . . . . . . . . . . . . . . . . . . . 16
9 Examples radar “places” and their node designations. . . . . . . . . . . . . . . . . . . . . . 2510 Radar system abbreviations and their meanings. . . . . . . . . . . . . . . . . . . . . . . . . 2611 Processing Software abbreviations and their meanings. . . . . . . . . . . . . . . . . . . . . 2612 Method abbreviations and their meanings. . . . . . . . . . . . . . . . . . . . . . . . . . . . 2613 Dataset-specific what header Attributes. . . . . . . . . . . . . . . . . . . . . . . . . 2714 Product abbreviations and their meanings. . . . . . . . . . . . . . . . . . . . . . . . . . . . 2815 Product parameters. . . . . . . . . . . . . . . . . . . . . . . . . . . . . . . . . . . . . . . . 2816 Quantity (variable) identifiers. . . . . . . . . . . . . . . . . . . . . . . . . . . . . . . . . . 2917 Mandatory 8-bit Image attributes. Note that these are part of a Dataset object. . . . . . . 3218 Example for a hydrometeor classification legend. . . . . . . . . . . . . . . . . . . . . . . . 3619 Polar volume. . . . . . . . . . . . . . . . . . . . . . . . . . . . . . . . . . . . . . . . . . . 3820 Cartesian image with palette. . . . . . . . . . . . . . . . . . . . . . . . . . . . . . . . . . . 4121 Vertical profile. . . . . . . . . . . . . . . . . . . . . . . . . . . . . . . . . . . . . . . . . . 4222 Range-height indicator. . . . . . . . . . . . . . . . . . . . . . . . . . . . . . . . . . . . . . 43
ODIM_H5 2.4

OPERA Data Information Model for HDF5 1
1 Introduction and motivation
During OPERA’s second incarnation, the goal of work package 2.1 “HDF5 exchange software development”was to formulate a second-generation information model for use with weather radar data and the HierarchicalData Format version 5 (HDF5) file format. This information model has since been adopted and implementedin operational software both inside and outside OPERA.
This document presents an information model developed for use with weather radar data and products.Its implementation is also presented, which makes use of the HDF5 file format. HDF5 is developed andmaintained by the HDF Group. All references to attributes, data, types, and so on, are in relation to thosedefined and used in the HDF5 documentation. The official HDF5 format documentation should be consultedfor details on this format. This information model is an elaboration of the model presented by COST 717and used in real-time operations in the Nordic countries1. Several enhancements have been made based onoperational experience, and based on data quality issues addressed in OPERA II and the EU Voltaire project.The model presented here is not backwardly compatible with previous versions (version 1.2 and earlier), butthe advantages of its new structure outweigh this disadvantage.
The information model given here is designed from the point of view of trying to harmonize all relevant in-formation independently of the radar manufacturer and organization from which the data originates. Whilethe information model is intended to enable the representation of the data and products agreed upon todaywithin the framework of EUMETNET OPERA, we also look ahead to future needs and have tried to en-sure that they are appropriately met with this information model. This means that the known products aresupported, as are polarization diversity variables and virtually any quality-related information characteriz-ing a given dataset. It is also vital to recognize the importance of being able to represent polar (sphericalcoordinate space) data, and this is accommodated as well in a flexible manner.
This information model has become the modern European standard, and as such can be used in forthcomingmeteorological standard exchange mechanisms, ie. the WMO Information System (WIS) and its infrastruc-ture. There is also an important link to OPERA’s operational data centre (Odyssey), in that quality informa-tion in the information model is being used by Odyssey, thus supporting efforts to improve the quality ofoperational products covering the European continent.
In this way, weather radar data data and products are well-organized for data exchange infrastructure, andwe have tried to ensure that the use of the modern technology will facilitate access to and use of Europeanradar data both within and outside the meteorological community.
1Michelson D.B., Holleman I., Hohti H., and Salomonsen M., 2003: HDF5 information model and implementation for weatherradar data. COST 717 working document WDF_02_200204_1. version 1.2.
ODIM_H5 2.4

OPERA Data Information Model for HDF5 2
2 Information model concept
The information model attempts to achieve a general-purpose model for storing both individual scans, im-ages and products, while also allowing series (time and/or space) of these types of information to be storedusing the same building-blocks. The hierarchical nature of HDF5 can be described as being similar to di-rectories, files, and links on a hard-drive. Actual metadata are stored as so-called “attributes”, and theseattributes are organized together in so-called “groups”. Binary data are stored as so-called “datasets”. Thechallenge in formulating an information model is in defining the way in which these general building-blocksare organized. This section illustrates the information model defined in detail later in this document, in anattempt to present and clarify its structure.
The first example is given in Figure 1, which shows how a simple Cartesian product, for example a CAPPI,is represented. At the top level, the HDF5 file contains the so-called “root” group. This group is al-ways there. Following that, three groups contain metadata; these are called “what” (object, informationmodel version, and date/time information), “where” (geographical information), and “how” (quality andoptional/mandatory metadata). The data is organized in a group called “dataset1” which contains anothergroup called “data1” where the actual binary data are found in “data”. This organization may seem overlycomplicated at first, but we will see shortly how powerful and necessary this organization is.
Figure 1: Cartesian product.
In terms of the analogy with a file system on a hard-disk, the HDF5 file containing this simple Cartesianproduct is organized like this:
//what/where/how/dataset1/dataset1/data1/dataset1/data1/data
In Figure 2, the exact same structure is used to represent a polar scan of data.
When we use this structure to represent a complete scan of data containing three parameters, the seeminglycomplicated organization used to store the binary data becomes easier to understand. Figure 3 shows how“dataset1” now contains three “data” groups, each containing a binary array of data. What we also see isthe way in which the metadata groups “what” and “where” can be used recursively to hold metadata whichare unique to their place in the hierarchy. In this case, “where” in “dataset1” contains the elevation angle ofthe scan used to collect the three parameters, and the three local “what” groups contain the information onwhich parameter is stored in each. In this way, “dataset1” can contain Z, V, and W in this case, but it canalso contain an arbitrary number of other parameters.
ODIM_H5 2.4

OPERA Data Information Model for HDF5 3
Figure 2: Simple polar scan.
Figure 3: A complete polar scan containing three parameters.
The use of dataset-specific metadata groups is illustrated in Figure 4. Both methods of using “what”, “where”and “how” are acceptable. In the example on the left, the metadata groups contain attributes which are validfor every dataset in that group. In the case on the right, the metadata groups contain attributes which arevalid only for that single dataset. In Figure 3, “where” is valid for all three datasets in the group, whereas“what” is only valid locally. The local metadata always have top priority, so if a mistake is made where afile contains the same metadata at different levels, the most local level will always take precedence.
Figure 4: Use of dataset-specific metadata groups.
Continuing from the single scan in Figure 3, we can easily extend the same structure every time wewant to add a new scan. This is illustrated in Figure 5. Here, the new elevation angle will be stored in/dataset2/where, and the information on the parameters stored in the datasets are found in each lo-
ODIM_H5 2.4

OPERA Data Information Model for HDF5 4
cal “what”. Note that optional/mandatory metadata can be added in a “how” group either directly under“dataset2” or together with each parameter, but this hasn’t been included in this example. A completevolume containing an arbitrary number of scans, each containing an arbitrary number of parameters, is or-ganized using this structure. A Cartesian volume can be constructed in exactly the same way. Time seriesof polar or Cartesian products can be constructed in the same way too.
Figure 5: A polar volume containing two scans.
This information model uses the same logic to include the representation of quality information. Figure 6illustrates how quality data can be added to polar data in a scan containing two parameters. In the same waythat metadata can be applicable to all parameters in the scan, so too can quality information be representativeeither generally or locally. In this example, /dataset1/quality1 can contain quality based on beamblockage since this is applicable to all parameters collected at the same elevation angle. However there maybe different quality metrics which are applicable to each individual radar parameter, and these are storedlocally. In this case, “data1” contains two such local quality metrics which are unique to that parameter,whereas “data2” only contains one. And we also see that each quality metric can be described using localmetadata groups. The quality metrics should follow the guidelines set out in OPERA II2.
Using this hierarchical structure, it becomes clear that we now have an information model capable of rep-resenting a volume containing an arbitrary number of scans/images, each of which can contain an arbitrarynumber of parameters which, in turn, can be characterized by an arbitrary number of quality metrics.
The examples provided in this discussion have focused on polar data, but they can also be applied to all theobjects supported in this information model. These objects are polar scans, Cartesian images, profiles, RHIs,cross-sections, side-panels, individual rays, sectors, and even embedded graphics images in an industrial
2Holleman I., Michelson D., Galli G., Germann U., and Peura M., 2006: Quality information for radars and radar data. OPERAII deliverable OPERA_2005_19.
ODIM_H5 2.4

OPERA Data Information Model for HDF5 5
Figure 6: A polar scan containing two parameters and associated quality metrics.
graphics file format.
There are additional objects which are complementary to this information model and which are includedsince they are quite useful in various situations. One of them is the ability to add a color palette to an 8-bitdataset. There are standard mechanisms for this in the HDF5 library, and these are used without modifica-tion. Another object is a legend. This is a useful object when the data in a dataset is classified, discrete, orjust level-sliced. The legend provides the ability to describe which quantitative values are represented byeach qualitative value in the dataset, or which qualitative class is represented by a given value. The legendis used to tell the user that a certain value in the data represents e.g. “0.1–0.5 mm/h” in the case of a rainrateproduct, and e.g. “sleet” in the case of a hydrometeor classification. Both the palette and the legend objectsare illustrated in Figure 7.
Finally, this information model enables the exchange of graphics representations of data. Using the samestructure as that shown in Figure 1, Figure 8 illustrates this.
In the rest of this document, the detail specification of the information model is presented. With this speci-fication, it shall be possible to read, write, and understand HDF5 files using this information model.
ODIM_H5 2.4

OPERA Data Information Model for HDF5 6
Figure 7: A polar scan containing a color palette and a legend.
Figure 8: An embedded Slovak picture in an industrial graphics file format.
ODIM_H5 2.4

OPERA Data Information Model for HDF5 7
3 Definitions
HDF5 allows data to be stored as Attributes, Datasets, Groups, and user-defined Compound types.For use here, all types except user-defined Compound are permitted for use. Only Compound types definedin this document are permitted, in practise the optional legend object described in Section 6.2. In practice,all of these types are manipulated through the use of general-purpose Node objects, i.e., a Node may beany of the above mentioned types.
3.1 Scalars (integers, real values, and strings)
Scalar values are stored in Attribute objects and may be strings, integers, or real (floating-point) values.For the sake of consistency and simplicity, integer values shall be represented as 8-byte long, and realvalues shall be represented as double. These can be written to file as native types. They will be read andautomatically returned as the corresponding native type on another platform. Endianness is therefore nocause for concern.
A clarification is however necessary; a long on one machine may have a different length than that onanother machine. This is because a native long could, perhaps, be returned as an int in some cases. Toprevent this, you should ensure that all integer scalar attributes are written with a length of 8 bytes. In somecases, this may require writing values of type long long, but it can also be enforced on POSIX-compliantsystems by using the int64_t typedef.
Strings shall be encoded in ASCII or the ASCII representation of UTF-8. Strings should never be terminatedby the application, because they shall be automatically null-terminated by the HDF5 library. This is done bysetting the string termination to STRPAD=H5T_STR_NULLTERM. Other methods of termination availablein the HDF5 library shall not be used. It is also necessary to specify the length of each string (STRSIZE).Even when H5T_STR_NULLTERM is used, the value of STRSIZE must be incremented manually by oneto ensure that it includes the NULL character. Other methods of specifying the length of the string providedby the HDF5 library (ie. H5T_VARIABLE) shall not be used.
3.1.1 Booleans
A string is used to store truth value information. The string “True” is used to represent true, and “False”is used to represent false.
3.1.2 Sequences
A special kind of string may be used to store sequences. A sequence contains comma-separated scalar valuesin string notation. For example, a sequence is useful for storing the radar stations contributing to a compositeimage, and in storing the elevation angles used in a polar volume of data.
ODIM_H5 2.4

OPERA Data Information Model for HDF5 8
3.1.3 Simple arrays
Sometimes it is necessary to store numeric metadata whose geometry corresponds with the number of az-imuth gates in a scan or bins along a ray, or both. The simple array provides this ability. Instead of using acomplete HDF5 Dataset object provided by the HDF5 library (H5D Dataset interface), the simple ar-ray uses the H5S dataspace interface. To simplify this further, only one- and two-dimensional simple arraysare allowed, and to remain consistent with scalar integer and real value attributes, the simple arrays shallcontain either “long” integers or “double” floats, as defined above.
3.2 Attributes
An Attribute is an HDF5 object used to store a header attribute or data. For our purposes, it is only usedto store header attributes. In order to facilitate the management of so-called “atomic” attributes, ie. individualvalues, we use double precision for both integers (long) and floating-point (double) values. Note that thespecification of strings is intended to be case sensitive.
3.3 Datasets
An HDF5 Dataset is a self-describing data object containing an n-dimensional binary array and attributesdescribing it. The array type may be any of char, schar, uchar, short, ushort, int, uint, long,ulong, llong, ullong, float, double on a given platform.
In this document the text formatting of Dataset (in Courier font) means an HDF5 dataset, whereas thetext formatting of dataset (in bold face) refers to the binary data in that dataset.
3.4 Groups
A Group is a top-level object which is used to organize other objects. For example, a Group may containa collection of header Attributes, a collection of Datasets, or be the root object for the completecontents of an HDF5 file.
ODIM_H5 2.4

OPERA Data Information Model for HDF5 9
4 Metadata attribute specification
Header attributes are collected in three Group objects, all of which may be used recursively. Attributeswhich describe a given file’s contents and the time and place for which it represents are collected in aGroup called what. Attributes which describe a given file’s geographical characteristics (projection,corner coordinates, dimensions, scales) are collected in a Group called where. The what and whereGroups both contain mandatory Attributes only. Those Attributes which collectively describeadditional data/product characteristics, such as radar system, chosen algorithm, and quality-related meta-data, are stored in a Group called how. All Attributes found in how may be considered optional ormandatory. Additional Attributes not specified in this document may only be stored in the how Group.
Top-level header attributes are collected in what, where and how Group objects located directly underthe root Group ’/’. Each attribute is stored as an Attribute object containing a scalar value. Somedata/products may have Dataset-specific header attributes, in which case a the Dataset and its headerAttributes are collected in lower-level what, where and how Groups which are associated with thatDataset.
The concept used here is that each Attribute is identified with a string, the idea being that this is a moreintuitive means of organizing data compared to numeric descriptors. It also means that a file may be queriedusing the h5dump utility to easily see and understand the contents of a file.
Mandatory header attributes for all files are given in Table 1.
Note that all date and time information is for the nominal time of the data, ie. the time for which the dataare valid. (The nominal time is not the exact acquisition time which is found elsewhere in the file.)
Note that all scans belonging to the same volume must have the same nominal date and time.
Note that all geographical longitude/latitude coordinates are specified with positive easting values east ofthe Greenwich meridian and positive northing values north of the equator.
Note that by convention, the “polarization” of electromagnetic waves refers to the direction of the electricfield.
4.1 Root Group
No HDF5 file can exist without this Group, since it is the starting point of the hierarchy. However, in orderto take the first steps towards interoperatility with Climate and Forecast (CF) Conventions, we require anAttribute in the root Group. This Attribute is called “Conventions” and its value is a stringcontaining the acronym of the information model being used, and its version, in a format which lends itselfto a directory structure. This is done to comply with the documentation policy maintained by the communitymanaging CF Conventions3.
This information model is called the “OPERA Data Information Model for HDF5” which gives the acronym“ODIM_H5”. Recognizing the history of this information model, we start at version 2.0. The resulting valuefor “/Conventions” is “ODIM_H5/V2_0”, and this Attributemust be present in all ODIM_H5 files.
3http://cfconventions.org/
ODIM_H5 2.4

OPERA Data Information Model for HDF5 10
The present version is 2.4, which translates to “ODIM_H5/V2_4”.
4.2 Top-level what Group
In this section the content of the top-level what is described.
This Group contains mandatory Attributes only which collectively describe a given file’s contents.These Attributes are given in Tables 1-14.
Table 1: Mandatory top-level what header Attributes for all weather radar files.
Name Type Format Descriptionobject string - According to Table 2version string H5rad M.m Format or information model version. “M” is the major version.
“m” is the minor version. Software is encouraged to warn if itreceives a file stored in a version which is different from the oneit expects. The software should, however, proceed to read thefile, ignoring Attributes it does not understand. Note thatthis Attribute shall be synchronized with“/Conventions”.
date string YYYYMMDD Nominal Year, Month, and Day of the data/producttime string HHmmss Nominal Hour, Minute, and Second, in UTC of the data/productsource string TYP:VALUE Variable-length string containing pairs of identifier types and
their values, separated by a colon. Several pairs can beconcatenated, separated by commas, in the formTYP:VALUE,TYP:VALUE, etc. For single-site data the NODidentifier is mandatory, for composites the ORG identifier ismandatory (Table 3). All identifiers assigned to a given radarshall be provided.
Object strings may be any of those given in Table 2. For each Dataset, there may be an accompanyingwhat Group with information specific to that Dataset, according to Table 13.
Table 2: File object strings and their meanings.
String DescriptionPVOL Polar volumeCVOL Cartesian volumeSCAN Polar scanRAY Single polar ray
AZIM Azimuthal objectELEV Elevational object
IMAGE 2-D cartesian imageCOMP Cartesian composite image(s)XSEC 2-D vertical cross section(s)
VP 1-D vertical profilecontinued on next page
ODIM_H5 2.4

OPERA Data Information Model for HDF5 11
continued from previous page
String DescriptionPIC Embedded graphical image
Note that a file containing a single scan of polar data may not be represented using object type PVOL; theobject type in these cases must be SCAN. Note also that an RHI polar volume can be represented using anumber of Datasets and the ELEV object.
Table 3: Source type identifiers and their associated values.
Identifier Description ExampleWIGOS WIGOS (WMO Integrated Global Observing System) identifier WIGOS:0-246-0-101234WMO Combined WMO block and station number in the form
A1bwnnnnn, or 0 if none assigned. The first two digitsrepresent the block number, where the first digit A1 is theregional association area and the second digit bw is thesub-area. Remaining digits are the station number. (Accordingto the WMO, numbers in the form A1bwnnn are consideredequivalent to the form A1bw00nnn).
WMO:02954
RAD Radar site as indexed in the OPERA database. RAD:FI44PLC Place according to the left column of Table 9 of this document PLC:AnjalankoskiNOD Node according to the right column of Table 9 of this
document. Mandatory to identify single-site data.NOD:fianj
ORG Originating centre according to BUFR descriptor 0 01 033.Mandatory to identify composites.
ORG:86
CTY Country according to BUFR descriptor 0 01 101 CTY:613CMT Comment: allowing for a variable-length string CMT:Suomi tutka
4.3 where Group
In this section the Attributes for the where Group are described. These are different for polar orcartesian Datasets, i.e. containing Dataset and Dataset Groups respectively.
Note that the use of the where Group is mandatory but that its placement will be at the top level of a givenfile, and/or at a lower level associated with a given Dataset. This is because some attributes are validglobally (e.g. the coordinates of a radar) whereas others are local (e.g. the elevation angle used for a givensweep).
4.3.1 where for polar data Groups
This where Group contains mandatory Attributes only which collectively describe geographical andgeometrical characteristics of a given Dataset dataset. Note that the dataset itself is the object containingthe binary data and that where in this context describes that dataset but is located in the correspondingDataset which contains all these objects. Section 2 illustrates how these two objects are related to eachother.
ODIM_H5 2.4

OPERA Data Information Model for HDF5 12
Polar data, i.e. raw radar data as a function of azimuth and range, are stored in a Dataset Group, andpolar volume data are stored as a stack of these Dataset Groups. Each Dataset Group containsazimuthal data from a single elevation.
Table 4: where Attributes for polar data objects.
Name Type Units Descriptionlon double degrees_east Longitude position of the radar antenna, normalized to the
WGS-84 reference ellipsoid and datum. Fractions of a degree aregiven in decimal notation.
lat double degrees_north Latitude position of the radar antenna, normalized to the WGS-84reference ellipsoid and datum. Fractions of a degree are given indecimal notation.
height double meters Height of the centre of the antenna above mean sea levelDataset specificelangle double degrees Antenna elevation angle above the horizonnbins long – Number of range bins in each rayrstart double meters The range of the start of the first range binrscale double meters The distance between two successive range binsnrays long – Number of azimuth or elevation gates (rays) in the objecta1gate long – Index of the first azimuth gate radiated in the scanSector specificstartaz double degrees The azimuth angle of the start of the first gate in the sectorstopaz double degrees The azimuth angle of the end of the last gate in the sectorstartel double degrees The elevation angle of the start of the first gate in the sectorstopel double degrees The elevation angle of the end of the last gate in the sector
4.3.2 where for geographically referenced image Groups
This where Group contains mandatory Attributes only which collectively describe a givenDataset’s geographical and geometrical characteristics. Note that the dataset is the object containingthe binary data and that where in this context describes that dataset but is located in the correspondingDataset which contains all these objects. Section 2 illustrates how these two objects are related to eachother.
The PROJ.4 cartographic projections library4 is a comprehensive means of managing geographically ref-erenced information which has become a de facto standard. PROJ.4 is being used increasingly throughoutEurope and the world. As a result, the most straightforward way of representing projection information inradar files is by means of the projection definition string which is used with the library itself. For example,the arguments used with PROJ.4 to define the Google Maps projection are +proj=merc +lat_ts=0+lon_0=0 +k=1.0 +R=6378137.0 +nadgrids=@null +no_defs so this is what should befound as an Attribute in the where Group associated with the Dataset used to store the data geo-located using this projection. Similarly, the standard “longitude, latitude” projection, also known as EPSG4326, is defined as +proj=latlong +ellps=WGS84 +datum=WGS84 +no_defs.
Note that PROJ.4 contains a complete set of arguments for specifying a given projection, including false4Originally from the United States Geological Survey, now from MapTools
ODIM_H5 2.4

OPERA Data Information Model for HDF5 13
easting/northing, rescaling of coordinates, choice of ellipsoid (or defining your own), choice of geodeticdatum, and defining oblique (rotated) projections.
Table 5: where Attributes for geographical image data Groups.
Name Type Units Descriptionprojdef string – The projection definition arguments, described above, which
can be used with PROJ.4. See the PROJ.4 documentationfor usage. Longitude/Latitude coordinates are normalized tothe WGS-84 ellipsoid and geodetic datum.
xsize long – Number of pixels in the X dimensionysize long – Number of pixels in the Y dimensionzsize long – Number of vertical layers. Only used for three-dimensional
products.zstart double meters Height above mean sea level of the lowest pixel in the Z
dimension. Marked for DEPRECATION. To be replaced bywhere Attributes “ztop” and “zbottom”.
xscale double meters Pixel size in the X dimension, in projection-specificcoordinates
yscale double meters Pixel size in the Y dimension, in projection-specificcoordinates
zscale double meters Pixel size in the Z dimension. Marked for DEPRECATION.To be replaced by where Attributes “ztop” and“zbottom”.
ztop simple arrayof doubles
meters Layer top heights above mean sea level. The size of thisone-dimensional array corresponds with the number ofvertical layers. Only used for three-dimensional products.
zbottom simple arrayof doubles
meters Layer bottom heights above mean sea level. The size of thisone-dimensional array corresponds with the number ofvertical layers. Only used for three-dimensional products.
LL_lon double degrees_east Longitude of the lower left corner of the lower left pixelLL_lat double degrees_north Latitude of the lower left corner of the lower left pixelUL_lon double degrees_east Longitude of the upper left corner of the upper left pixelUL_lat double degrees_north Latitude of the upper left corner of the upper left pixelUR_lon double degrees_east Longitude of the upper right corner of the upper right pixelUR_lat double degrees_north Latitude of the upper right corner of the upper right pixelLR_lon double degrees_east Longitude of the lower right corner of the lower right pixelLR_lat double degrees_north Latitude of the lower right corner of the lower right pixel
4.3.3 where for cross-section data Group
RHI and cross-sections are treated as a special form of cartesian image. The x-dimension of the imagerepresents the coordinate in the x/y-plane, while the y-dimension describes the vertical coordinate of theRHI or cross-section. To describe the geographical orientation and extend of a RHI or cross-section adedicated set of Attributes in the where Group has been defined.
The geographical location of cross-sections is just given by longitudes and latitudes of start and stop posi-
ODIM_H5 2.4

OPERA Data Information Model for HDF5 14
tions (Figure 9). The cross-sections are thus assumed to be taken along great-circles. In case they are takenalong a line in a plane of a geographical projection, the deviation from the great-circle will be negligible forvisualization purposes.
Table 6: where Attributes for cross-section data.
Name Type Units DescriptionCommon attributesxsize long – Number of pixels in the horizontal dimensionysize long – Number of pixels in the vertical dimensionxscale double meters Horizontal resolutionyscale double meters Vertical resolutionminheight double meters Minimum height above mean sea levelmaxheight double meters Maximum height above mean sea levelRHI specificlon double degrees_east Longitude position of the radar antenna. Fractions of a degree
are given in decimal notation.lat double degrees_north Latitude position of the radar antenna. Fractions of a degree
are given in decimal notation.az_angle double degrees Azimuth anglerange double meters Maximum rangeCross section and side panel specificstart_lon double degrees_east Longitude of the upper left corner of the upper left pixel (start
position, Figure 9)start_lat double degrees_north Latitude of the upper left corner of the upper left pixel (start
position, Figure 9)stop_lon double degrees_east Longitude of the lower right corner of the lower right pixel
(stop position, Figure 9)stop_lat double degrees_north Latitude of the lower right corner of the lower right pixel (stop
position, Figure 9)
x
y
Figure 9: Cartesian MAX product with horizontal (HSP) and vertical side panels (VSP). The red boxesindicate the start position for each panel.
ODIM_H5 2.4

OPERA Data Information Model for HDF5 15
4.3.4 where for vertical profiles
This where Group contains mandatory Attributes only which collectively describe the geographicaland geometrical characteristics of vertical profiles of horizontal winds and/or radar reflectivity.
Table 7: where Attributes for vertical profiles.
Name Type Units Descriptionlon double degrees_east Longitude position of the radar antenna. Fractions of a degree
are given in decimal notation.lat double degrees_north Latitude position of the radar antenna. Fractions of a degree
are given in decimal notation.height double meters Height of the centre of the antenna above mean sea level.levels long – Number of points in the profileinterval double meters Vertical distance between height intervals, or 0.0 if variableminheight double meters Minimum height above mean sea levelmaxheight double meters Maximum height above mean sea level
4.4 how Group
This Group contains Attributes which provide additional and complimentary information which canbe used to describe a given Dataset object, for example information related to an object’s quality.Attributes in how can be added, but they won’t officially constitute the OPERA standard until theyare added to the tables in this information model. Note that the placement of the how Group may be eitherat the top level of a given file, or at a lower level associated with a given Dataset. If how is found at thetop level, then it is assumed that its contents apply to all Datasets in the file. If how is found at a lowerlevel, then it must be located in the Dataset Group to which its contents apply. If how exists at both thetop and lower levels, then the contents of the local how override the contents of the top level how.
Note that user-definable subgroups (including sub-subgroups) may be added to existing how Groups,e.g. how/rsp (radar signal processor parameters), how/radar_parameters (general radar sys-tem parameters), how/bite (BITE information), how/monitoring (external monitoring information),how/scheduling (additional scheduling information), how/radar_processing_chain (process-ing chain), how/product_parameters (product parameters), and how/noden, where n is the indexof a radar node included in a composite. User-definable Attributes may be added to these subgroups aslong as they do not conflict with each other or with existing Attributes.
Note as well that there can often be cases where some Attributes apply for all Datasets in a file andothers may be different for each Dataset. In such cases, the Attributes which apply to all Datasetsmay be held in a top level how Group and those that change may be held in local how Groups.
For clarity, Table 8 containing mandatory and recommended how Attributes, respectively, is partitionedsuch that different partitions contain different product-specific Attributes.
ODIM_H5 2.4

OPERA Data Information Model for HDF5 16
Table 8: how Attributes for all objects. Shading indicates mandatory Attributes for single-site datadepending on the polarization mode applied and the moments provided (e.g. NI can be omitted if no radialvelocity data are available). The non-shaded Attributes are optional.
Name Type Units DescriptionGeneralextensions string – Name of the extensions of
/what/versiontask string – Name of the acquisition task or product
generatortask_args string – Task argumentsdata_origin sequence – If a quantity or quality field has been
modified, the originating quantity or qualityfield together with the applied quantity orquality field(s) should be provided, e.g.[/datasetM/dataN,/datasetM/dataN/qualityP] or [DBZH,se.smhi.detector.beamblockage].
startepochs double seconds since1970-01-01T00:00:00Z
Starting time of the data/product. Acompliment to “date” and “time” in Table 1,for those who prefer to calculate timesdirectly in epoch seconds.
endepochs double seconds since1970-01-01T00:00:00Z
Ending time of the data/product. Acompliment to “date” and “time” in Table 1,for those who prefer to calculate timesdirectly in epoch seconds.
system string – According to Table 10TXtype string – Transmitter type [magnetron; klystron; solid
state]poltype string – Polarization type of the radar [single;
simultaneous-dual; switched-dual]polmode string – Current polarity mode [LDR-H; single-H;
LDR-V; single-V; simultaneous-dual;switched-dual]
software string – According to Table 11sw_version string – Software version in string format, e.g. “5.1”
or “8.11.6.2”zr_a double – Z-R constant a in Z = a Rb, applicable to
any product containing reflectivity orprecipitation data
zr_a_A simple arrayof doubles
– Z-R constant a in Z = a Rb, applicable toany product containing reflectivity orprecipitation data. The size of thistwo-dimensional array corresponds with thevalues of where/nrays andwhere/nbins for that dataset.
continued on next page
ODIM_H5 2.4

OPERA Data Information Model for HDF5 17
continued from previous page
Name Type Units Descriptionzr_b double – Z-R exponent b in Z = a Rb, applicable to
any product containing reflectivity orprecipitation data
zr_b_A simple arrayof doubles
– Z-R exponent b in Z = a Rb, applicable toany product containing reflectivity orprecipitation data. The size of thistwo-dimensional array corresponds with thevalues of where/nrays andwhere/nbins for that dataset.
kr_a double – Kdp-R constant a in R = a Kdpb
kr_a_A simple arrayof doubles
– Kdp-R constant a in R = a Kdpb. The size
of this two-dimensional array correspondswith the values of where/nrays andwhere/nbins for that dataset.
kr_b double – Kdp-R exponent b in R = a Kdpb
kr_b_A simple arrayof doubles
– Kdp-R exponent b in R = a Kdpb. The size
of this two-dimensional array correspondswith the values of where/nrays andwhere/nbins for that dataset.
simulated boolean – “True” if data are simulated, otherwise“False”. Note that this Attribute can beapplied to forecasted and backcasted radarquantities as well.
platform_type string – Options are: “fixed”, “vehicle”, “ship”,“aircraft”, “aircraft_fore”,“aircraft_aft”,“aircraft_tail”, “aircraft_belly”,“aircraft_roof”, “aircraft_nose”,“satellite_orbit”, “satellite_geostat”.Assumed “fixed” if missing.
Data from individual radarsbeamwidth double degrees The radar’s half-power beamwidth. Marked
for DEPRECATION. To be replaced by howAttributes “beamwH” and “beamwV”.
wavelength double cm Wavelength. Marked for DEPRECATION.To be replaced by how Attribute“frequency”.
frequency double Hz Radar frequencyantspeed double degrees/s Antenna speed (positive for clockwise and
ascending, negative for counter-clockwiseand descending)
pulsewidth double seconds PulsewidthRXbandwidth double Hz Bandwidth that the receiver is set to when
operating the radar with the abovementioned pulsewidth
lowprf double Hz Low pulse repetition frequencycontinued on next page
ODIM_H5 2.4

OPERA Data Information Model for HDF5 18
continued from previous page
Name Type Units Descriptionmidprf double Hz Intermediate pulse repetition frequencyhighprf double Hz High pulse repetition frequencyprt simple array
of doublesseconds Pulse repetition time. For staggered prt, also
see prt_ratio. The size of thisone-dimensional array corresponds with thevalue of where/nrays for that dataset.
prt_ratio simple arrayof doubles
– Ratio of prt/prt2. For dual/staggered prtmode. The size of this one-dimensionalarray corresponds with the value ofwhere/nrays for that dataset.
TXlossH double dB Total loss in the transmission chain forhorizontally-polarized signals, defined as thelosses that occur between the calibrationreference plane and the feed horn, inclusive
TXlossV double dB Total loss in the transmission chain forvertically-polarized signals, defined as thelosses that occur between the calibrationreference plane and the feed horn, inclusive
injectlossH double dB Total loss between the calibration referenceplane and the test signal generator forhorizontally-polarized signals
injectlossV double dB Total loss between the calibration referenceplane and the test signal generator forvertically-polarized signals
RXlossH double dB Total loss in the receiving chain forhorizontally-polarized signals, defined as thelosses that occur between the antennareference point and the receiver, inclusive.
RXlossV double dB Total loss in the receiving chain forvertically-polarized signals, defined as thelosses that occur between the antennareference point and the receiver, inclusive.
radomelossH double dB One-way dry radome loss forhorizontally-polarized signals
radomelossV double dB One-way dry radome loss forvertically-polarized signals
antgainH double dB Antenna gain for horizontally-polarizedsignals
antgainV double dB Antenna gain for vertically-polarized signalsbeamwH double degrees Geometrical horizontal half-power (-3 dB)
beamwidthbeamwV double degrees Geometrical vertical half-power (-3 dB)
beamwidthcontinued on next page
ODIM_H5 2.4

OPERA Data Information Model for HDF5 19
continued from previous page
Name Type Units Descriptiongasattn double dB/m Gaseous specific attenuation assumed by the
radar processor (zero if no gaseousattenuation is assumed)
radconstH double dB Radar constant for the horizontal channel.For the precise definition, see Appendix A.
radconstV double dB Radar constant for the vertical channel. Forthe precise definition, see Appendix A.
nomTXpower double dBm Nominal transmitted peak power at theoutput of the transmitter(magnetron/klystron output flange)
TXpower simple arrayof doubles
dBm Transmitted peak power at the calibrationreference plane. The values given areaverage powers over all transmitted pulses ineach azimuth gate. The size of thisone-dimensional array corresponds with thevalue of where/nrays for that dataset.
powerdiff double dB Power difference between transmittedhorizontally and vertically-polarized signalsat the the feed horn
phasediff double degrees Phase difference between transmittedhorizontally and vertically-polarized signalsas determined from the first valid range bins
NI double m/s Unambiguous velocity (Nyquist) intervalVsamples long – Number of samples used for radial velocity
measurementsPolar datascan_index long – Which scan this is in the temporal sequence
(starting with 1) of the total number of scanscomprising the volume.
scan_count long – The total number of scans comprising thevolume.
scan_optimized string – Scan optimized for quantity [DBZH;VRADH; etc.]
astart double degrees Azimuthal offset from 0◦ of the start of thefirst ray in the sweep. This value is positivewhere the gate starts clockwise after 0◦, andit will be negative if it starts before 0◦. Ineither case, the value must be no larger thanhalf a ray’s width.
azmethod string – How raw data in azimuth are processed toarrive at the given value, according toTable 12
elmethod string – How raw data in elevation are processed toarrive at the given value, according toTable 12
continued on next page
ODIM_H5 2.4

OPERA Data Information Model for HDF5 20
continued from previous page
Name Type Units Descriptionbinmethod string – How raw data in range are processed to
arrive at the given value, according toTable 12
binmethod_avg long – How many original data elements in rangeare averaged to arrive at the given value
startazA simple arrayof doubles
degrees Azimuthal start angles used for each gate ina scan. The size of this one-dimensionalarray corresponds with the value ofwhere/nrays for that dataset.
stopazA simple arrayof doubles
degrees Azimuthal stop angles used for each gate ina scan. The size of this one-dimensionalarray corresponds with the value ofwhere/nrays for that dataset.
startelA simple arrayof doubles
degrees Elevational start angles used for each gate ina scan. The size of this one-dimensionalarray corresponds with the value ofwhere/nrays for that dataset.
stopelA simple arrayof doubles
degrees Elevational stop angles used for each gate ina scan. The size of this one-dimensionalarray corresponds with the value ofwhere/nrays for that dataset.
startT simple arrayof doubles
seconds since1970-01-01T00:00:00Z
Acquisition start times for each gate in thesector or scan. The size of thisone-dimensional array corresponds with thevalue of where/nrays for that dataset.The required precision is to the millisecond.
stopT simple arrayof doubles
seconds since1970-01-01T00:00:00Z
Acquisition stop times for each gate in thesector or scan. The size of thisone-dimensional array corresponds with thevalue of where/nrays for that dataset.The required precision is to the millisecond.
Cartesian images including compositestop_heights simple array
of doublesmeters Layer top heights above mean sea level. The
size of this one-dimensional arraycorresponds with the number of layers in theproduct. Marked for DEPRECATION. To bereplaced by where Attribute “ztop”.
bottom_heights simple arrayof doubles
meters Layer bottom heights above mean sea level.The size of this one-dimensional arraycorresponds with the number of layers in theproduct. Marked for DEPRECATION. To bereplaced by where Attribute“zbottom”.
continued on next page
ODIM_H5 2.4

OPERA Data Information Model for HDF5 21
continued from previous page
Name Type Units Descriptionangles simple array
of doublesdegrees Elevation angles in the order in which they
were acquired, used to generate the product.The size of this one-dimensional arraycorresponds with the number of elevationangles used to generate the product.
arotation simple arrayof doubles
degrees/s Antenna rotation speed (positive forclockwise, negative for counter-clockwise).The size of this one-dimensional arraycorresponds with the value ofhow/angles.
camethod string – How Cartesian data are processed, accordingto Table 12
nodes sequence – Radar nodes (Table 9) which havecontributed data to the composite, e.g.“’fikor’,’nohur’,’sebaa’,’sehem”’
ACCnum long – Number of images used in precipitationaccumulation
Vertical profile specificminrange double meters Minimum range at which data is used when
generating profilemaxrange double meters Maximum range at which data is used when
generating profilesample_size simple array
of longs– Number of valid data points in a level of a
vertical profile. The size of thisone-dimensional array corresponds with thevalue of where/levels for that dataset.
dealiased boolean – “True” if data has been dealiased, “False” ifnot
vpmethod string – Applied method to derive the vertical profile[VAD; VVP; etc.]
QualitypointaccEL double degrees Antenna pointing accuracy in elevation.
Possible pointing errors in elevation includee.g. tilt of turning level of the head (tilt ofpedestal), non-linearities in gears, backlashin gearboxes, and uncertainties in angleadjustment e.g. using the sun. The value isexpected to be in the range [-90◦, 90◦]. Adeviation of 0.0◦ means that the antenna isperfectly aligned.
continued on next page
ODIM_H5 2.4

OPERA Data Information Model for HDF5 22
continued from previous page
Name Type Units DescriptionpointaccAZ double degrees Antenna pointing accuracy in azimuth.
Possible pointing errors in azimuth includee.g. non-linearities in gears, backlash ingearboxes, and uncertainties in angleadjustment e.g. using the sun. The value isexpected to be in the range [-180◦, 180◦). Adeviation of 0.0◦ means that the antenna isperfectly aligned.
anglesync string – Antenna angle synchronization mode[azimuth; elevation]
anglesyncRes double degrees Resolution of angle synchronizationmalfunc boolean – Radar malfunction indicator. If a quantity
should not be used for any application due toradar hardware and/or software failure,how/malfunc should be “True”,otherwise “False”.
radar_msg string – Radar malfunction messageradhoriz double meters Radar horizon (maximum range)NEZH double dBZ The total system noise expressed as the
horizontally-polarized reflectivity it wouldrepresent at one km distance from the radar
NEZH_A simple arrayof doubles
dBZ The total system noise expressed as thehorizontally-polarized reflectivity it wouldrepresent at one km distance from the radar.The size of this one-dimensional arraycorresponds with the value of where/nraysfor that dataset.
NEZV double dBZ The total system noise expressed as thevertically-polarized reflectivity it wouldrepresent at one km distance from the radar
NEZV_A simple arrayof doubles
dBZ The total system noise expressed as thevertically-polarized reflectivity it wouldrepresent at one km distance from the radar.The size of this one-dimensional arraycorresponds with the value of where/nraysfor that dataset.
OUR double percent Overall uptime reliability. Marked forDEPRECATION.
Dclutter sequence – Doppler clutter filters used when collectingdata
clutterType string – Description of clutter filter used in the signalprocessor
clutterMap string – Filename of clutter mapzcalH double dB Calibration offset for the horizontal channelzcalV double dB Calibration offset for the vertical channel
continued on next page
ODIM_H5 2.4

OPERA Data Information Model for HDF5 23
continued from previous page
Name Type Units Descriptionzdrcal double dB ZDR calibration offsetnsampleH double dBm Noise sample for the horizontal channelnsampleH_A simple array
of doublesdBm Noise sample for the horizontal channel.
The size of this one-dimensional arraycorresponds with the value of where/nraysfor that dataset.
nsampleV double dBm Noise sample for the vertical channelnsampleV_A simple array
of doublesdBm Noise sample for the vertical channel. The
size of this one-dimensional arraycorresponds with the value of where/nraysfor that dataset.
comment string – Free text description. Anecdotal qualityinformation.
SQI double – Signal Quality Index threshold valueCSR double – Clutter-to-signal ratio threshold valueLOG double dB Security distance above mean noise level
threshold value. Marked forDEPRECATION. To be replaced by howAttribute “LOG_threshold”.
LOG_threshold double dB Security distance above mean noise level,i.e. all data below noise+LOG_threshold arethresholded. It is usually set in the radarsoftware.
VPRCorr boolean – “True” if vertical reflectivity profilecorrection has been applied, otherwise“False”
melting_layer_top double meters Melting layer top height above mean sealevel
melting_layer_top_A simple arrayof doubles
meters Melting layer top height above mean sealevel. The size of this two-dimensional arraycorresponds with the values ofwhere/nrays and where/nbins forthat dataset.
melting_layer_bottom double meters Melting layer bottom height above mean sealevel
melting_layer_bottom_A simple arrayof doubles
meters Melting layer bottom height above mean sealevel. The size of this two-dimensional arraycorresponds with the values ofwhere/nrays and where/nbins forthat dataset.
min double – Minimum value for continuous quality datamax double – Maximum value for continuous quality datastep double – Step value for continuous quality datalevels long – Number of levels in discrete data legendpeakpwr double dBm Peak power
continued on next page
ODIM_H5 2.4

OPERA Data Information Model for HDF5 24
continued from previous page
Name Type Units Descriptionavgpwr double dBm Average powerdynrange double dB Dynamic rangeRAC double dB Range attenuation correctionBBC boolean – “True” if bright-band correction applied,
otherwise “False”PAC double dB Precipitation attenuation correctionSNRT double dB Signal-to-noise ratio threshold. Marked for
DEPRECATION. To be replaced by howAttribute “SNR_threshold”.
SNR_threshold double dB Signal-to-noise ratio thresholdSNRHCT double dB Signal-to-noise ratio co-polar H threshold.
Marked for DEPRECATION. To be replacedby how Attribute “SNRHC_threshold”.
SNRHC_threshold double dB Signal-to-noise ratio co-polar H threshold.This attribute should be used for a STAR(simultaneous transmit and receive) moderadar.
SNRHXT double dB Signal-to-noise ratio cross-polar Hthreshold. Marked for DEPRECATION. Tobe replaced by how Attribute“SNRHX_threshold”.
SNRHX_threshold double dB Signal-to-noise ratio cross-polar H thresholdSNRVCT double dB Signal-to-noise ratio co-polar V threshold.
Marked for DEPRECATION. To be replacedby how Attribute “SNRVC_threshold”.
SNRVC_threshold double dB Signal-to-noise ratio co-polar V threshold.This attribute should be used for a STARmode radar.
SNRVXT double dB Signal to noise ratio cross-polar V threshold.Marked for DEPRECATION. To be replacedby how Attribute “SNRVX_threshold”.
SNRVX_threshold double dB Signal to noise ratio cross-polar V thresholdpolarization string – Type of polarization (H, V) transmitted by
the radarMDS double dBm Minimum detectable signal at the antenna
feedbase_1km_hc double dBZ Reflectivity at 1 km for SNR = 0 dB
noise-corrected H co-polar channelbase_1km_vc double dBZ Reflectivity at 1 km for SNR = 0 dB
noise-corrected V co-polar channelsmoothed_PHIDP boolean – “True” if PHIDP or UPHIDP has been
smoothed, “False” if notaltitude_agl double meters Altitude of the center of rotation of the
antenna above ground level.continued on next page
ODIM_H5 2.4

OPERA Data Information Model for HDF5 25
continued from previous page
Name Type Units Descriptionmetadata_changed sequence – Metadata which have been changed
afterwards, e.g. “’beamwH’,’gasattn”’.
Table 9: Examples of radar “places” and their node designations. The first two letters in the “node”represent the country, following the Internet convention. The “place” name may use ASCII representationsof UTF-85. The “node” must only use ASCII. Radars not in this table can be added.
Place NodeHasvik nohasAndøya noandRøst norstRissa norsaBømlo nobmlHægebostad nohgbOslo nooslKiruna sekrnLuleå sellaÖrnsköldsvik seoerÖstersund seosdHudiksvall sehuvLeksand selekBålsta sebaaÅtvidaberg seatvVara sevaxHemse sehemKarlskrona sekaaÄngelholm seangKorpo fikorVantaa fivanAnjalankoski fianjIkaalinen fiikaKuopio fikuoVimpeli fivimUtajärvi fiutaLuosto filuoBornholm dkborStevns dksteSindal dksinRømø dkromDe Bilt nldblDen Helder nldhlTallinn eetalSürgavere eesurRiga lvrix
continued on next page
ODIM_H5 2.4

OPERA Data Information Model for HDF5 26
continued from previous page
Place NodeLegionowo pllegPoznan plpozGdansk plgdaSwidwin plswiRzeszow plrzeBrzuchania plbrzRamza plramPastewnik plpas
Table 10: Radar system abbreviations and their meanings (“xxx” is a placeholder for the model/abbreviationused by the manufacturer, e.g. DWSR-2501C-SDP). Radar systems not in this table can be added.
String MeaningGEMAxxx Gematronik Meteor ACxxx Radar
EECxxx EEC xxx RadarERICxxx Ericsson xxx RadarVAISxxx Vaisala xxx Radar
Table 11: Processing Software abbreviations and their meanings. Systems not in this table can be added.
String MeaningBALTRAD BALTRAD toolboxCASTOR Météo France’s systemSERVAL Météo France’s system
EDGE EEC EdgeFROG Gamic FROG, MURAN . . .IRIS Vaisala Sigmet IRIS
METEOCELL IRAM’s systemNORDRAD NORDRADRADARNET UKMO’s centralised processing systemCYCLOPS UKMO’s site processing systemRAINBOW Selex Gematronik RainbowPOLARA DWD-Polarimetric-Radar SW-Suite
Table 12: Method abbreviations and their meanings.
String MeaningNEAREST Nearest neighbour or closest radarINTERPOL InterpolationAVERAGE Average of all values
continued on next page
5For example, the character ñ (UNICODE character U+00F1) is represented in binary UTF-8 as \xf1 whereas its ASCIIrepresentation is \xc3\xb1.
ODIM_H5 2.4

OPERA Data Information Model for HDF5 27
continued from previous page
String MeaningQAVERAGE Quality-weighted averageRANDOM Random
MDE Minimum distance to earthLATEST Most recent radar
MAXIMUM Maximum valueQMAXIMUM Maximum quality
DOMAIN User-defined compositingVAD Velocity azimuth displayVVP Volume velocity processingRGA Gauge-adjustment
4.5 what Group for Dataset objects
In this section the content of the what Group to be used with each Dataset is described. Note that thelinear transformation coefficients “gain” and “offset” in
quantity_value = offset + gain× raw_value
should be set to 1 and 0 respectively if they are not intended for use with a given Dataset.
Table 13: Dataset-specific what header Attributes.
Name Type Format Descriptionproduct string – According to Table 14prodname string – Product name. Only used for non-polar products.prodpar string – According to Table 15. Only used for non-polar
products.quantity string – According to Table 16
startdate string Starting YYYYMMDD Year, Month, and Day for the productstarttime string Starting HHmmss Hour, Minute, and Second for the productenddate string Ending YYYYMMDD Year, Month, and Day for the productendtime string Ending HHmmss Hour, Minute, and Second for the productgain double – Coefficient in quantity_value = offset + gain ×
raw_value used to convert to physical unit. Defaultvalue is 1.0.
offset double – Coefficient in quantity_value = offset + gain ×raw_value used to convert to physical unit. Defaultvalue is 0.0.
nodata double – Raw value used to denote areas void of data (neverradiated). Note that this Attribute is always afloat even if the data in question is in another format.
continued on next page
ODIM_H5 2.4

OPERA Data Information Model for HDF5 28
continued from previous page
Name Type Format Descriptionundetect double – Raw value used to denote areas below the
measurement detection threshold (radiated butnothing detected). Note that this Attribute isalways a float even if the data in question is inanother format.
Table 14: Product abbreviations and their meanings.
String MeaningSCAN A scan of polar data
PPI Plan position indicator (cartesian)CAPPI Constant altitude PPI
PCAPPI Pseudo-CAPPIETOP Echo top
EBASE Echo baseMAX MaximumRR AccumulationVIL Vertically integrated liquid water
SURF Information valid at the Earth’s surfaceCOMP Composite
VP Vertical profileRHI Range height indicator
XSEC Arbitrary vertical sliceVSP Vertical side panelHSP Horizontal side panelRAY Ray
AZIM Azimuthal type productQUAL Quality metric
Table 15: Product parameters.
Product Type Units Product parameterCAPPI double meters Layer height above the radarPCAPPI double meters Layer height above the radarPPI double degrees Elevation angle usedETOP double dBZ Reflectivity level thresholdEBASE double dBZ Reflectivity level thresholdRHI double degrees Azimuth angleVIL simple array
of doublesmeters Bottom and top heights of the
integration layer
ODIM_H5 2.4

OPERA Data Information Model for HDF5 29
Table 16: Quantity (variable) identifiers. Radar moments are those received by the radar or derived thereof.
String Units DescriptionTH dBZ Logged horizontally-polarized total (uncorrected) reflectivity factorTV dBZ Logged vertically-polarized total (uncorrected) reflectivity factorDBZH dBZ Logged horizontally-polarized (corrected) reflectivity factorDBZV dBZ Logged vertically-polarized (corrected) reflectivity factorZDR dB Logged differential reflectivityUZDR dB Logged differential reflectivity that has not been subject to a
Doppler filterRHOHV – Correlation coefficient between Zh and Zv. The values are
expected to be in the range [0, 1].URHOHV – Correlation coefficient between Zh and Zv that has not been
subject to any filter or correction. The values are expected to be inthe range [0, 1].
LDR dB Linear depolarization ratioULDR dB Linear depolarization ratio that has not been subject to a Doppler
filterPHIDP degrees Differential phaseUPHIDP degrees Differential phase that has not been subject to any filter or
correctionPIA dB Path Integrated AttenuationKDP degrees/km Specific differential phaseUKDP degrees/km Specific differential phase that has not been subject to any filter or
correctionSQIH – Signal quality index - horizontally-polarized. The values are
expected to be in the range [0, 1].USQIH – Signal quality index - horizontally-polarized - that has not been
subject to a Doppler filter. The values are expected to be in therange [0, 1].
SQIV – Signal quality index - vertically-polarized. The values are expectedto be in the range [0, 1].
USQIV – Signal quality index - vertically-polarized - that has not beensubject to a Doppler filter. The values are expected to be in therange [0, 1].
SNR dB Signal-to-noise ratioSNRHC dB Signal-to-noise ratio co-polar H. This attribute should be used for a
STAR mode radar.SNRHX dB Signal-to-noise ratio cross-polar HSNRVC dB Signal-to-noise ratio co-polar V. This attribute should be used for a
STAR mode radar.SNRVX dB Signal to noise ratio cross-polar VUSNRHC dB Signal-to-noise ratio co-polar H that has not been subject to a
Doppler filter. This attribute should be used for a STAR moderadar.
continued on next page
ODIM_H5 2.4

OPERA Data Information Model for HDF5 30
continued from previous page
String Units DescriptionUSNRVC dB Signal-to-noise ratio co-polar V that has not been subject to a
Doppler filter. This attribute should be used for a STAR moderadar.
CCORH dB Clutter correction - horizontally-polarizedCCORV dB Clutter correction - vertically-polarizedCPA – Clutter phase alignment. The values are expected to be in the range
[0, 1] (0: low probability of clutter, 1: high probability of clutter).RATE mm/h Rain rateURATE mm/h Uncorrected rain ratePOR – Probability of rain. The values are expected to be in the range [0, 1]
(0: low probability, 1: high probability).HI dBZ Hail intensityPOH – Probability of hail. The values are expected to be in the range [0, 1]
(0: low probability, 1: high probability).POSH – Probability of severe hail. The values are expected to be in the
range [0, 1] (0: low probability, 1: high probability).MESH mm Maximum expected severe hail sizeACRR mm Accumulated precipitationHGHT meters Height above mean sea levelVIL kg/m2 Vertical Integrated Liquid waterVRADH m/s Radial velocity - horizontally-polarized. Radial winds towards the
radar are negative, while radial winds away from the radar arepositive (PANT).
UVRADH m/s Radial velocity - horizontally-polarized - that has not been subjectto any filter or correction. Radial winds towards the radar arenegative, while radial winds away from the radar are positive(PANT).
VRADV m/s Radial velocity - vertically-polarized. Radial winds towards theradar are negative, while radial winds away from the radar arepositive (PANT).
UVRADV m/s Radial velocity - vertically-polarized - that has not been subject toany filter or correction. Radial winds towards the radar are negative,while radial winds away from the radar are positive (PANT).
VRADDH m/s Dealiased horizontally-polarized radial velocityVRADDV m/s Dealiased vertically-polarized radial velocityWRADH m/s Spectral width of radial velocity - horizontally-polarizedUWRADH m/s Spectral width of radial velocity - horizontally-polarized - that has
not been subject to any filter or correctionWRADV m/s Spectral width of radial velocity - vertically-polarizedUWRADV m/s Spectral width of radial velocity - vertically-polarized - that has not
been subject to any filter or correctionUWND m/s Component of wind in x-directionVWND m/s Component of wind in y-directionRSHR m/s km Radial shearASHR m/s km Azimuthal shear
continued on next page
ODIM_H5 2.4

OPERA Data Information Model for HDF5 31
continued from previous page
String Units DescriptionCSHR m/s km Range-azimuthal shearESHR m/s km Elevation shearOSHR m/s km Range-elevation shearHSHR m/s km Horizontal shearVSHR m/s km Vertical shearTSHR m/s km Three-dimensional shearPSPH dBm Power spectrum peak - horizontally-polarizedPSPV dBm Power spectrum peak - vertically-polarizedUPSPH dBm Power spectrum peak - horizontally-polarized - that has not been
subject to any filter or correctionUPSPV dBm Power spectrum peak - vertically-polarized - that has not been
subject to any filter or correctionBRDR – 1 denotes a border where data from two or more radars meet in
composites, otherwise 0QIND – Spatially analyzed quality indicator, according to OPERA II,
normalized to between 0 (poorest quality) to 1 (best quality)CLASS – Indicates that data are classified and that the classes are specified
according to the associated legend object (Section 6.2) which mustbe present.
Vertical profile specificff m/s Mean horizontal wind velocitydd degrees Mean horizontal wind directionff_dev m/s Velocity variabilitydd_dev m/s Direction variabilityDBZH_dev dBZ Variability of the logged horizontally-polarized (corrected)
reflectivity factorDBZV_dev dBZ Variability of the logged vertically-polarized (corrected) reflectivity
factorw m/s Vertical velocity (positive upwards)w_dev m/s Vertical velocity variabilitydiv s−1 Divergencediv_dev s−1 Divergence variabilitydef s−1 Deformationdef_dev s−1 Deformation variabilityad degrees Axis of dilation. The values are expected to be in the range [0◦,
360◦).ad_dev degrees Variability of the axis of dilation. The values are expected to be in
the range [0◦, 360◦).rhohv_dev – Variability of the correlation coefficient. The values are expected to
be in the range [0, 1].
ODIM_H5 2.4

OPERA Data Information Model for HDF5 32
5 Data specification
All data arrays, for polar, cartesian, and profile data, are stored as dataset objects. Any of the types/depthsstated in Sec. 3.3 are allowed. Any of compression levels 1 to 6 are recommended. (HDF5’s built-incompression levels range from 0 (none) to 9 (maximum); levels above 6 tend to result in the algorithm usingdisproportionate resources relative to gains in file size, which is why their use is not encouraged.) HDF5provides support for SZIP compression in addition to default ZLIB compression, but SZIP compressionlibrary is proprietary and will therefore not be supported in any official OPERA software.
All Dataset Groups are called datasetn, no matter which kind of data they hold. The character nrepresents the index of the Dataset Group in acquisition order in terms of elevation angle (polar data),and ascending order in terms of height (Cartesian products) starting at 1. A Dataset Group can holdan arbitrary number of binary datasets. In the case of radar parameters (e.g. Z, V, W, etc.) the datasetscontaining each parameter are each contained in a Group called datan, where n is the index of the datasetholding the binary data. This dataset is simply called data.
Within each datan Group, there may be an arbitrary number of quality indicators, each of which is heldin a Group called qualityn, where n is the index of the dataset (in application order in terms of qualityindicator) holding the binary data. This dataset is simply called data. Because the quality indicator(s)describe a given quantity, they need not be assigned values of “nodata and” “undetect”, as this informationis already contained in the quantity being described. However, if one wishes to represent a quality indicatoror index as a stand-alone product, then this should be done by representing it in its own dataset and assigningit the QIND quantity according to Table 16.
Each Dataset Group can store local what, where and how Groups to store metadata which are uniqueto that Dataset.
Note that data with 8-bit unsigned depth (uchar) can be represented as an HDF5 Image (H5IM) (Table 17).This applies to any 2-D Dataset, be it polar, Cartesian, sector, or cross-section. This is a Dataset witha few added Attributes which facilitate the Image’s management by third-party software5.
Table 17: Mandatory 8-bit Image attributes. Note that these are part of a Dataset object.
Attribute Type DescriptionCLASS string Should be “IMAGE”
IMAGE_VERSION string Should be “1.2”, the current version number
There are several optional Attributes describing an HDF5 Image, including Palette information (seeSection 6.1).
A schematic of this organization is found in Section 2. What follows is details pertaining to each type ofdata that may be represented as binary data.
5https://portal.hdfgroup.org/display/HDF5/HDF5+Image+and+Palette+Specification%2C+Version+1.2
ODIM_H5 2.4

OPERA Data Information Model for HDF5 33
5.1 Polar Data
If possible, the start of the first azimuth gate (the first pulse) always points due north and the first rangebin is that starting at the radar. This azimuthal precision may not be achievable in practice, in which casethe first azimuth gate is the one in the sweep with a starting azimuthal angle closest to 0◦. This appliesto data representing a full sweep, but not sector scans. For full sweeps, this implies that the first azimuthgate covers the interval 0-1◦ assuming 360 azimuth gates per scan. Azimuth gates are ordered clockwiseexcept for sector scans which can be clockwise or counter-clockwise. In other words, range bins are storedin the array’s equivalent X-dimension and azimuth gates in the Y-dimension. There is no mechanism forspecifying missing azimuth gates or range bins in SCAN objects. This means that partial scans/rays mustbe filled-in in order to complete them. Filled-in areas are identified by the “nodata” value specified in thecorresponding what Group. Radiated areas with no echo are represented with the “undetect” value alsoin the corresponding what Group. Alternatively, collections of rays can be stored in the RAY object, andsectors can be stored in the AZIM object. The first azimuth gate in the scan does not have to be the first ray ofdata collected for that scan, but the /datasetn/where/a1gate Attribute contains the informationon this, thereby allowing a temporal reconstruction of the data collection.
All full-sweep data must be sorted according to the above description: clockwise and starting from north,even if they haven’t been acquired that way. Azimuthal overlap is not allowed. Rays whose starting az-imuthal angle go beyond 360◦ from a1gate, ie. start a second sweep or replicate previous rays, must beomitted. It is therefore the responsibility of each supplier to comply with this specification.
All parameters collected in a single scan of data are contained in one Dataset Group with the same indexnumber, as seperate data Dataset Groups.
5.2 Image Data
An image product in this context refers to 2-D cartesian quantitative data and not a visual graphic product(PIC, see Section 5.6 below).
Binary arrays are stored as one long unpadded binary string starting in the upper-left corner and proceedingrow by row (north to south), from left (west) to right (east). Areas void of the specified variable are flaggedusing the “nodata” value specified in the corresponding what Group. Radiated areas with no echo arerepresented with the “undetect” value also in the corresponding what Group.
5.3 RHIs, cross sections and side panels
RHI, cross sections and side panels are a special form of image. RHIs taken with the antenna pointing eaststart on the left and end on the right. If the antenna points west, then the RHI starts on the right and endson the left. RHIs pointing exactly south or north always start on the left and end on the right. For crosssections, the left side of the image is the starting point and the right side is the finishing point, regardlessof the antenna’s azimuth angle. For side panels, the starting point is north for vertical panels and west forhorizontal panels. As with other image files, the first pixel is the upper-left one and image content is orderedrow-wise from top to bottom and left to right.
ODIM_H5 2.4

OPERA Data Information Model for HDF5 34
5.4 Profiles
In contrast to polar or cartesian data which use Datasets to store 2-D arrays, profiles use severalDatasets to store 1-D arrays representing different variables along a given profile. One variable is storedin each Dataset. Levels in the profile are ordered sequentially in ascending order. A profile is a Groupcontaining several Datasets, each of which stores a variable for that level. This profile formulation is notrestricted to wind variables, but can easily accommodate reflectivity and other variables as well.
Each Dataset containing a parameter making up the the profile contains a quantity designator accordingto Table 16.
Note that all datasets must be of equal length, in order to match the heights given in the dataset containingthe quantity HGHT.
5.5 Rays and sectors
It is unlikely that individual rays or sectors of data will be exchanged operationally and internationally, butthese objects are added for the sake of completeness and in cases where quality information can be efficientlyrepresented using these objects. Also, there may be production chains where the radar transmits each rayindividually, so the availability of this means of representation can support them.
An individual ray of data is stored as a dataset with the most proximate data first. Missing data along theray must be assigned the “nodata” and/or “undetect” values.
A sector is similar to a scan with the difference being that the sector doesn’t cover the horizon completely.A sector is stored the same was as a scan, the only clarification being the object name (Table 2 or 14) andthe metadata in
Alternatively, sectors can be represented as a collection of rays. This might be handy if the rays are few andwith variable starting and ending rays, and/or with different range bin spacing from one ray to the next.
5.6 Embedded graphical images
Image files in industrial graphics formats, e.g. PNG, JPEG, GIF, TIFF, etc., can be written directly into adataset as is. When this file is then retrieved, all that is necessary is to read the dataset contents as is andwrite a new file containing them.
ODIM_H5 2.4

OPERA Data Information Model for HDF5 35
6 Optional objects
There are two kind of objects which may be included in the HDF5 files and which are considered op-tional in this information model. These are palettes which may be attached to a given dataset to “color”them intuitively, and discrete legends which may complement a given dataset with what can be consideredquality-related information. Each of these objects is specified below.
6.1 Palettes
The HDF5 Image API contains functionality for associating palettes (or color tables) with 8-bit and 24-bitarrays. Since we have not defined 24-bit graphic images explicitely in this information model, the treatmentof palettes will be limited to 8-bit datasets. Most radar data exchanged in Europe today is 8-bit, so the abilityto complement them with palettes can be considered an enhancement. This is particularly interesting sincethe standard HDF5 binary tool h52gif converts an 8-bit dataset to a GIF file with or without an associatedpalette. And the hdfview tool visualizes the data with the palette if one is available. The reader is referred tothe HDF5 documentation for complete information.
In order for an 8-bit Dataset to work with a palette, it must be defined as an Image. This is done byadding a few attributes to the Dataset, and this process does not impact at all on the binary array data. Inother words, applications that only read the data won’t be affected. This means that those applications thatwish to use the palette can do so and those that don’t can do so without having to modify any routines. Thepalette is defined as a seperate Dataset and then the palette is linked to the binary array Dataset. Thisdoes not affect the binary data either. The result is a straight-forward and unobtrusive mechanism for addingcolor to data.
An example of how a palette complements an 8-bit dataset is given in Table 20.
6.2 Legends
The HDF5 library enables users to define and store so-called “compound” data type objects. Compounddata type objects are heterogeneous elements - a multi-dimensional array of fields. Such arrays consist offields that either represent atomic data types defined in the HDF5 API, or compound data types. In thelatter case such construction is referred to as “nested compound type”. The reader is referred to the HDF5documentation for complete information; what follows here is summarized.
Compound data type objects are handled by the HDF5 library which provides functions for reading andwriting data to and from a dataset of a compound type. With these functions, either the whole record (aninstance of compond data type) can be read or written or particular fields can be accessed in both read andwrite mode.
The compound data type is designed for use mainly in C language applications. This is a direct consequenceof the approach to memory organization and access, which is based on C structures. However, it is stillpossible to use compound data types in Java applications, as well as to map compound data types to XMLnode structures.
The compound data type is suitable for holding and processing legend data relating to discrete quality in-formation. In most cases, such a legend would contain two elements: key and value. Key is an abbreviated
ODIM_H5 2.4

OPERA Data Information Model for HDF5 36
character code for a given level of quality parameter it describes. Value holds the actual parameter value inthe form of a character string. This pair of fields can be represented by the following C structure:
struct legend{
char[] key;char[] value;
};
The structure describes a given discrete quality parameter which, for example, can be a data quality indicatordepending on distance to the radar. Such quality indicator can be stratified into several discrete categories,represented by character strings of a given contstant length. Another example is a hydrometeor classificationbased on polarimetric variables (Table 18). In both case, the key field of the legend structure will holdthe category string, while the corresponding value will be stored in value field, which is also an array ofcharacters. The length of particular fields can be either given explicitly (e.g. described in dedicated qualityparameters table) or can be determined at runtime.
Table 18: Example for a hydrometeor classification legend.
Value Key0 NONE1 GROUNDCLUTTER2 SEACLUTTER3 BIOLOGICAL4 DRYSNOW5 WETSNOW6 ICECRYSTALS7 GRAUPEL8 BIGDROPS9 RAIN
10 HEAVYRAIN11 RAINHAIL12 CHAFF
Since HDF5 approaches data object in the way the C language does, it is crutial to meet C standards whiledesigning and processing compound data structures. Because C does not support string objects (stringsof characters of variable length), the string object can only be represented by an array of characters. Inaddtition, to provide the possibility to determine the length of a legend dataset at runtime, an instance of alegend struture object should have fixed and constant byte length. This can be achieved by using characterarrays of constant length. For the purpose of legend dataset, it seems reasonable to use 64-byte array for thekey field, and 32-byte array for value field. The space used by the actual content of each legend structuredepends on the user. The only requirement is that character is null terminated (the last character in array isnull character).
struct legend{
char[64] key;char[32] value;
};
ODIM_H5 2.4

OPERA Data Information Model for HDF5 37
Once the legend structure is defined, instances of the legend structure are stored in a dedicated dataset.When defining a dataset data type, H5T_COMPOUND type must be used.
Endnote on software compatibility and versions
The use of the netCDF file format has also gained momentum within the meteorological and climatologicalcommunities. Today netCDF is a high-level layer built upon HDF5. Starting with HDF5 version 1.8.0 andnetCDF version 4, HDF5 is able to manage netCDF files. There are also Java tools with netCDF whichenable reading and writing of some kinds of HDF5 files. Since we recognize the benefits of being able tomanage HDF5 files with netCDF (and vice versa), we require that any implementation of the informationmodel specified in this document must use HDF5 version 1.8.0 or later. By organizing data in HDF5 in thestraight-forward way specified in this document, the simplicity should facilitate for netCDF to manage suchattributes and datasets.
ODIM_H5 2.4

OPERA Data Information Model for HDF5 38
7 Mandatory metadata per product
The purpose of this section is to clarify exactly which metadata attributes are mandatory for each type ofproduct. So far, we have only mentioned that what and where Groups are mandatory, whereas how ispartly mandatory. Here, we are specific about which metadata must always be present for each kind ofproduct. In order for this to be a reasonable level of ambition, only those metadata which are fundamentallynecessary to be able to manage the product at all, ie. at a purely functional level, are mandatory.
When it comes to optional how attributes, we don’t forget that these attributes are recommended and shouldbe included if they are available. In the presentations that follow, the recommended locations of the manda-tory how attributes are included.
The method used to present the metadata is in the form of terse listings, using the file-system analogy shownin Section 2 on page 2. The exact format of each node in the HDF5 file is according to the tables referred toin this document.
Datasets are also included in the following tables, for clarity.
7.1 Polar volume
The following example represents a polar volume consisting of two scans, each of which contains twoparameters. The polar geometry is the same in both scans, the only differences being the elevation angle andthe first measured azimuth gate in each scan. Using different pulsewidths and/or antenna rotation speedsbetween scans would necessitate placing the how attributes in their respective datasets instead of at the toplevel.
Table 19: Polar volume.
Node Type/ Root Group/Conventions Attribute, Section 4.1/what Group/what/object Atttribute, Table 2/what/version Atttribute, Table 1/what/date Atttribute, Table 1/what/time Atttribute, Table 1/what/source Atttribute, Table 3/where Group/where/lon Attribute, Table 4/where/lat Attribute, Table 4/where/height Attribute, Table 4/how Group/how/antgainH Attribute, Table 8/how/antgainV Attribute, Table 8/how/beamwH Attribute, Table 8/how/beamwV Attribute, Table 8/how/frequency Attribute, Table 8
continued on next page
ODIM_H5 2.4

OPERA Data Information Model for HDF5 39
continued from previous page
Attribute name Type/how/NI Attribute, Table 8/how/radconstH Attribute, Table 8/how/radconstV Attribute, Table 8/how/RXbandwidth Attribute, Table 8/how/RXlossH Attribute, Table 8/how/RXlossV Attribute, Table 8/how/scan_count Attribute, Table 8/dataset1 Group/dataset1/what Group/dataset1/what/product Attribute, Table 14/dataset1/what/prodname Attribute, Table 13/dataset1/what/startdate Attribute, Table 13/dataset1/what/starttime Attribute, Table 13/dataset1/what/enddate Attribute, Table 13/dataset1/what/endtime Attribute, Table 13/dataset1/where Group/dataset1/where/elangle Attribute, Table 4/dataset1/where/a1gate Attribute, Table 4/dataset1/where/nbins Attribute, Table 4/dataset1/where/rstart Attribute, Table 4/dataset1/where/rscale Attribute, Table 4/dataset1/where/nrays Attribute, Table 4/dataset1/how Group/dataset1/how/scan_index Attribute, Table 8/dataset1/how/startazA Attribute, Table 8/dataset1/how/stopazA Attribute, Table 8/dataset1/data1 Group/dataset1/data1/what Group/dataset1/data1/what/quantity Attribute, Table 16/dataset1/data1/what/gain Attribute, Table 13/dataset1/data1/what/offset Attribute, Table 13/dataset1/data1/what/nodata Attribute, Table 13/dataset1/data1/what/undetect Attribute, Table 13/dataset1/data1/data Dataset/dataset1/data1/data/CLASS Attribute, Table 17/dataset1/data1/data/IMAGE_VERSION Attribute, Table 17/dataset1/data2 Group/dataset1/data2/what Group/dataset1/data2/what/quantity Attribute, Table 16/dataset1/data2/what/gain Attribute, Table 13/dataset1/data2/what/offset Attribute, Table 13/dataset1/data2/what/nodata Attribute, Table 13/dataset1/data2/what/undetect Attribute, Table 13/dataset1/data2/data Dataset/dataset1/data2/data/CLASS Attribute, Table 17
continued on next page
ODIM_H5 2.4

OPERA Data Information Model for HDF5 40
continued from previous page
Attribute name Type/dataset1/data2/data/IMAGE_VERSION Attribute, Table 17/dataset2 Group/dataset2/what Group/dataset2/what/product Attribute, Table 14/dataset2/what/prodname Attribute, Table 13/dataset2/what/startdate Attribute, Table 13/dataset2/what/starttime Attribute, Table 13/dataset2/what/enddate Attribute, Table 13/dataset2/what/endtime Attribute, Table 13/dataset2/where Group/dataset2/where/elangle Attribute, Table 4/dataset2/where/a1gate Attribute, Table 4/dataset2/where/nbins Attribute, Table 4/dataset2/where/rstart Attribute, Table 4/dataset2/where/rscale Attribute, Table 4/dataset2/where/nrays Attribute, Table 4/dataset2/how Group/dataset2/how/scan_index Attribute, Table 8/dataset2/how/startazA Attribute, Table 8/dataset2/how/stopazA Attribute, Table 8/dataset2/data1 Group/dataset2/data1/what Group/dataset2/data1/what/quantity Attribute, Table 16/dataset2/data1/what/gain Attribute, Table 13/dataset2/data1/what/offset Attribute, Table 13/dataset2/data1/what/nodata Attribute, Table 13/dataset2/data1/what/undetect Attribute, Table 13/dataset2/data1/data Dataset/dataset2/data1/data/CLASS Attribute, Table 17/dataset2/data1/data/IMAGE_VERSION Attribute, Table 17/dataset2/data2 Group/dataset2/data2/what Group/dataset2/data2/what/quantity Attribute, Table 16/dataset2/data2/what/gain Attribute, Table 13/dataset2/data2/what/offset Attribute, Table 13/dataset2/data2/what/nodata Attribute, Table 13/dataset2/data2/what/undetect Attribute, Table 13/dataset2/data2/data Dataset/dataset2/data2/data/CLASS Attribute, Table 17/dataset2/data2/data/IMAGE_VERSION Attribute, Table 17
ODIM_H5 2.4

OPERA Data Information Model for HDF5 41
7.2 Composite
The following example shows how a composite image is represented. It also contains the standard HDF5mechanisms for including a palette, assuming the image payload is 8-bit, along with a quality indicator fielddescribing the given composite product. The COMP object can use /dataset1/data1/what/quantity, if theobject contains more than one parameter/quantity.
Table 20: Cartesian image with palette.
Attribute name Type/ Root Group/Conventions Attribute, Section 4.1/what Group/what/object Atttribute, Table 2/what/version Atttribute, Table 1/what/date Atttribute, Table 1/what/time Atttribute, Table 1/what/source Atttribute, Table 3/where Group/where/projdef Attribute, Table 5/where/xsize Attribute, Table 5/where/ysize Attribute, Table 5/where/xscale Attribute, Table 5/where/yscale Attribute, Table 5/where/LL_lon Attribute, Table 5/where/LL_lat Attribute, Table 5/where/UL_lon Attribute, Table 5/where/UL_lat Attribute, Table 5/where/UR_lon Attribute, Table 5/where/UR_lat Attribute, Table 5/where/LR_lon Attribute, Table 5/where/LR_lat Attribute, Table 5/dataset1 Group/dataset1/what Group/dataset1/what/product Attribute, Table 14/dataset1/what/prodname Attribute, Table 13/dataset1/what/prodpar Attribute, Table 15/dataset1/what/quantity Attribute, Table 16/dataset1/what/startdate Attribute, Table 13/dataset1/what/starttime Attribute, Table 13/dataset1/what/enddate Attribute, Table 13/dataset1/what/endtime Attribute, Table 13/dataset1/what/gain Attribute, Table 13/dataset1/what/offset Attribute, Table 13/dataset1/what/nodata Attribute, Table 13/dataset1/what/undetect Attribute, Table 13/dataset1/data1 Group
continued on next page
ODIM_H5 2.4

OPERA Data Information Model for HDF5 42
continued from previous page
Attribute name Type/dataset1/data1/data Dataset/dataset1/data1/data/CLASS Attribute, Table 17/dataset1/data1/data/IMAGE_VERSION Attribute, Table 17/dataset1/data1/quality1 Group/dataset1/data1/quality1/data Dataset/dataset1/data1/quality1/what Group/dataset1/data1/quality1/what/gain Attribute, Table 13/dataset1/data1/quality1/what/offset Attribute, Table 13H5IM optional attributes/dataset1/data1/data/PALETTE Link to /dataset1/data1/palette/dataset1/data1/data/IMAGE_SUBCLASS Attribute/dataset1/data1/palette Dataset/dataset1/data1/palette/CLASS Attribute/dataset1/data1/palette/PAL_VERSION Attribute
7.3 Vertical profile
The following example shows how a vertical profile is represented.
Table 21: Vertical profile.
Attribute name Type/ Root Group/Conventions Attribute, Section 4.1/what Group/what/object Atttribute, Table 2/what/version Atttribute, Table 1/what/date Atttribute, Table 1/what/time Atttribute, Table 1/what/source Atttribute, Table 3/where Group/where/lon Attribute, Table 7/where/lat Attribute, Table 7/where/height Attribute, Table 7/where/levels Attribute, Table 7/where/interval Attribute, Table 7/where/minheight Attribute, Table 7/where/maxheight Attribute, Table 7/dataset1 Group/dataset1/what Group/dataset1/what/product Attribute, Table 14/dataset1/what/prodname Attribute, Table 13/dataset1/what/startdate Attribute, Table 13/dataset1/what/starttime Attribute, Table 13
continued on next page
ODIM_H5 2.4
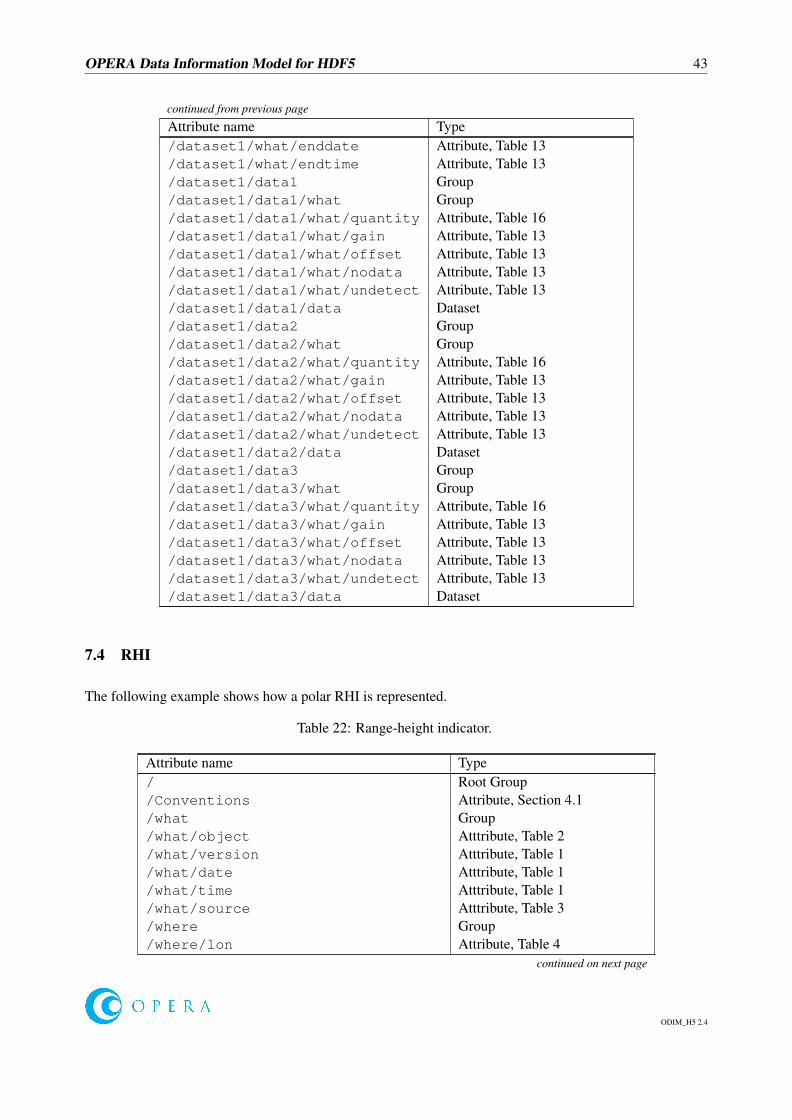
OPERA Data Information Model for HDF5 43
continued from previous page
Attribute name Type/dataset1/what/enddate Attribute, Table 13/dataset1/what/endtime Attribute, Table 13/dataset1/data1 Group/dataset1/data1/what Group/dataset1/data1/what/quantity Attribute, Table 16/dataset1/data1/what/gain Attribute, Table 13/dataset1/data1/what/offset Attribute, Table 13/dataset1/data1/what/nodata Attribute, Table 13/dataset1/data1/what/undetect Attribute, Table 13/dataset1/data1/data Dataset/dataset1/data2 Group/dataset1/data2/what Group/dataset1/data2/what/quantity Attribute, Table 16/dataset1/data2/what/gain Attribute, Table 13/dataset1/data2/what/offset Attribute, Table 13/dataset1/data2/what/nodata Attribute, Table 13/dataset1/data2/what/undetect Attribute, Table 13/dataset1/data2/data Dataset/dataset1/data3 Group/dataset1/data3/what Group/dataset1/data3/what/quantity Attribute, Table 16/dataset1/data3/what/gain Attribute, Table 13/dataset1/data3/what/offset Attribute, Table 13/dataset1/data3/what/nodata Attribute, Table 13/dataset1/data3/what/undetect Attribute, Table 13/dataset1/data3/data Dataset
7.4 RHI
The following example shows how a polar RHI is represented.
Table 22: Range-height indicator.
Attribute name Type/ Root Group/Conventions Attribute, Section 4.1/what Group/what/object Atttribute, Table 2/what/version Atttribute, Table 1/what/date Atttribute, Table 1/what/time Atttribute, Table 1/what/source Atttribute, Table 3/where Group/where/lon Attribute, Table 4
continued on next page
ODIM_H5 2.4

OPERA Data Information Model for HDF5 44
continued from previous page
Attribute name Type/where/lat Attribute, Table 4/where/height Attribute, Table 4/dataset1 Group/dataset1/what Group/dataset1/what/product Attribute, Table 14/dataset1/what/prodname Attribute, Table 13/dataset1/what/prodpar Attribute, Table 15/dataset1/what/startdate Attribute, Table 13/dataset1/what/starttime Attribute, Table 13/dataset1/what/enddate Attribute, Table 13/dataset1/what/endtime Attribute, Table 13/dataset1/where Group/dataset1/where/az_angle Attribute, Table 6/dataset1/where/range Attribute, Table 6/dataset1/where/nbins Attribute, Table 4/dataset1/where/nrays Attribute, Table 4/dataset1/where/rstart Attribute, Table 4/dataset1/where/rscale Attribute, Table 4/dataset1/data1/what/quantity Attribute, Table 16/dataset1/data1/what/gain Attribute, Table 13/dataset1/data1/what/offset Attribute, Table 13/dataset1/data1/what/nodata Attribute, Table 13/dataset1/data1/what/undetect Attribute, Table 13/dataset1/data1 Group/dataset1/data1/data Dataset/dataset1/data1/data/CLASS Attribute, Table 17/dataset1/data1/data/IMAGE_VERSION Attribute, Table 17
ODIM_H5 2.4

OPERA Data Information Model for HDF5 45
A Derivation of the radar calibration constant
It is very important for the radar constant to be defined properly. The following definition is used.
C = 10 log10
(2.025 · 214 · ln(2) · λ2cm
π5 · 10−23 · c · PtkW · θdeg · φdeg · τµs · |K|2
)− 2G+ 2Lr + LTx + LRx (1)
where λ2cm is the wavelength in cm,c is the speed of light in vacuum in m/s (3.0× 10⁸),PtkW is the nominal transmitted power in kW,θdeg and φdeg are horizontal and vertical -3 dB beamwidths in degrees,τµs is the pulse length in microseconds,|K|2 is the dielectric factor (0.93 for liquid water),G is the antenna gain in dB,Lr is the one-way radome loss in dB,LTx is the loss in the complete transmission chain, in dB, andLRx is the loss in the complete reception chain, in dB.
This definition of the radar constant is based on the following radar equation
dBZ = C + 20 log10 rkm + 10 log10 PrmW (2)
where rkm is the distance from the radar in km, andPrmW is the received power in mW.
ODIM_H5 2.4