
WMO WMO INTEGRATED GLOBAL OBSERVING SYSTEM (WIGOS) TT-PWPP-2 Chair's Opening Remarks WMO; OBS.

EUMETCast-Africa Dissemination Baseline Overview
Doc.No. : EUM/OPS/DOC/13/707607 Issue : v1 Date : 3 June 2013
EUMETSAT Eumetsat-Allee 1, D-64295 Darmstadt, Germany
Tel: +49 6151 807-7 Fax: +49 6151 807 555 http://www.eumetsat.int
© EUMETSAT
The copyright of this document is the property of EUMETSAT.

EUM/OPS/DOC/13/707607 v1, 3 June 2013
EUMETCast-Africa Dissemination Baseline Overview
Table of Contents
1 Introduction ..................................................................................................................................3 1.1 Scope...................................................................................................................................3 1.2 Document Structure.............................................................................................................3
2 EUMETCast-Africa Baseline .......................................................................................................3 2.1 Overview of Near Real-time Data and Products on EUMETCast .......................................3
2.1.1 Level 1 Satellite Data..............................................................................................3 2.1.2 Level 2 Products .....................................................................................................4 2.1.3 Observational and Model Data ...............................................................................4
2.2 Detailed breakdown of Products on EUMETCast-Africa.....................................................4 2.2.1 Level 1 Satellite Data on EUMETCast-Africa .........................................................5 2.2.2 Atmospheric Products on EUMETCast-Africa ........................................................7 2.2.3 Marine Products on EUMETCast-Africa ...............................................................18 2.2.4 Land Products on EUMETCast-Africa ..................................................................29
3 Future Products In Preparation................................................................................................53 3.1 Overview of Products Pending ..........................................................................................53 3.2 Future Products from the Central Application Facility (CAF) – Meteosat, Metop, Jason-253 3.3 New O3MSAF Products ....................................................................................................54 3.4 New Hydrology SAF Products ...........................................................................................54 3.5 Third-Party Products..........................................................................................................54
3.5.1 Electro-L N1 image data from ROSHYDROMET .................................................54 3.5.2 Enhancement of Météo-France Forecast Products for Africa ..............................54 3.5.3 Fire Products for the AMESD Programme ...........................................................55 3.5.4 Products for the IGAD AMESD Thema Project ....................................................55 3.5.5 EPort Training data for Africa ...............................................................................57 3.5.6 New SARAL Products...........................................................................................57 3.5.7 New Megha-Tropiques Products ..........................................................................57
4 Products to be withdrawn from the EUMETCast-Africa Baseline ........................................58 5 Future EUMETSAT Provided Products....................................................................................59
5.1 Centrally Produced Meteosat Products.............................................................................59 5.2 Future OSI SAF Products..................................................................................................59 5.3 Future LSA SAF Products .................................................................................................60 5.4 Future O3M SAF Products ................................................................................................60 5.5 Future ROM SAF Products................................................................................................60 5.6 Future Hydrology SAF Products........................................................................................61 5.7 Future Suomi NPP Ocean and Atmospheric Composition Products ................................61
6 Products Excluded from EUMETCast-Africa ..........................................................................63 7 Request for Modification to the Baseline................................................................................79
7.1 Baseline Criteria ................................................................................................................79 7.2 Modification Procedure......................................................................................................80
Appendix A EUMETCast-Africa Baseline Feedback Form ..................................................82
2

EUM/OPS/DOC/13/707607 v1, 3 June 2013
EUMETCast-Africa Dissemination Baseline Overview
1 INTRODUCTION
1.1 Scope This document is intended to support the National Meteorological & Hydrological Services (NMHSs) of the World Meteorological Organization Regional Association I (WMO RA-I) in the identification of new and obsolete data streams for the EUMETCast-Africa service. This document is provided to the WMO for onward distribution to the Members of the WMO RA-I Expert Group on EUMETCast Products and Dissemination. Updates to the document are typically prepared by EUMETSAT on an annual basis in the June/July timeframe.
1.2 Document Structure This document provides information on the baseline status of products disseminated in Near real-time (NRT) on EUMETCast. Section 3 of the document comprises of a set of tables indicating the current list of Near real-time (NRT) products available on EUMETCast as is structured to include those products provided by:
• The EUMETSAT Application Ground Segment - level 1 generated centrally at EUMETSAT and level 2 products generated by EUMETSAT and the network of Satellite Application Facilities (SAFs)
• Third Parties – level 1 and level 2 products distributed by EUMETSAT via
EUMETCast broadcast, but originating from an external data provider. The procedure for requesting updates to the Baseline is outlined in Section 7. 2 EUMETCAST-AFRICA BASELINE
2.1 Overview of Near Real-time Data and Products on EUMETCast
2.1.1 Level 1 Satellite Data EUMETSAT currently disseminates on the EUMETCast-Africa service the near real-time Level 1.5 satellite data from the geostationary Meteosat First and Second Generation satellites with the exception of the Rapid Scan service from Meteosat-9. Near real-time global Level 1 satellite data from the Metop polar orbiting satellite are not included on the EUMETCast-Africa service.
3

EUM/OPS/DOC/13/707607 v1, 3 June 2013
EUMETCast-Africa Dissemination Baseline Overview
4
In addition, through bilateral agreements with other satellite operators, EUMETSAT provides level 1 geostationary satellite data from the GOES, MT-SAT and FengYun satellites. For full details of the level 1 data services see Section 2.2.1
2.1.2 Level 2 Products EUMETSAT currently disseminates on EUMETCast-Africa a comprehensive set of near real-time level 2 processed products derived from both the Meteosat, Metop and Jason-2 satellites. This includes a range of products from the both the Central Application Facility (CAF) and the network of Satellite Application Facilities (SAF’s) with the exception of the products generated by the Radio-Occultation Meteorology (ROM) and the Hydrology SAFs. In addition, EUMETSAT provides a range of level 2 and level 3 processed products from Third-Party data providers For full details of the level 2 products see Section 2.2.2, 2.2.3 and 2.2.4.
2.1.3 Observational and Model Data The EUMETCast-Africa service also includes the Meteorological Data Dissemination (MDD) data stream. This service aimed primarily at the African members of the World Meteorological Organization (WMO) comprises observations, analyses and forecasts from major meteorological centres. Operators of Data Collection Platforms (DCPs) can receive their DCP messages via EUMETCast. Currently EUMETSAT retransmits DCP messages from the Meteosat-10 (0 degree service) and Meteostat-7 (IODC service) on EUMETCast-Africa.
2.2 Detailed breakdown of Products on EUMETCast-Africa The following tables indicate the current EUMETCast-Africa dissemination status of those NRT products from the EUMETSAT Application Ground Segment and from Third-Party data providers. For full details on the individual products listed, please consult the Product Navigator - http://navigator.eumetsat.int/ Content status at end May 2013:
EUM/OPS/DOC/13/707607 v1, 3 June 2013
EUMETCast-Africa Dissemination Baseline Overview
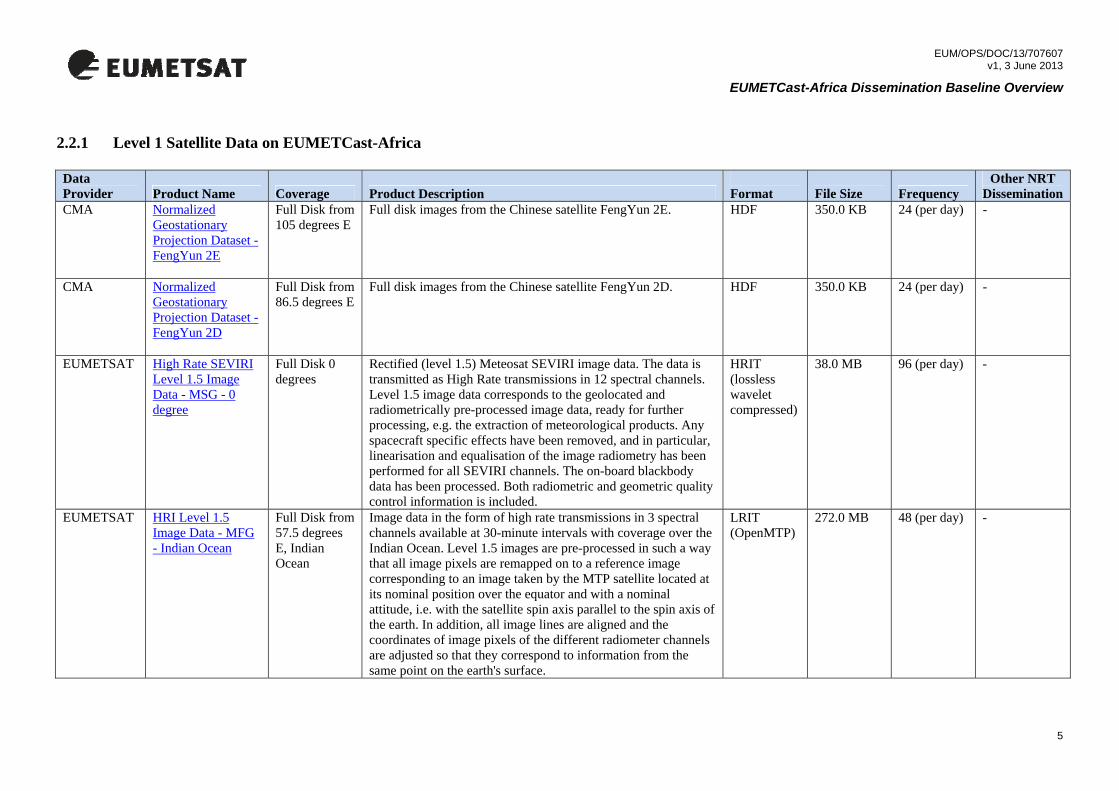
2.2.1 Level 1 Satellite Data on EUMETCast-Africa Data Provider Product Name Coverage Product Description
Format
File Size Frequency
Other NRT Dissemination
CMA Normalized Geostationary Projection Dataset - FengYun 2E
Full Disk from 105 degrees E
Full disk images from the Chinese satellite FengYun 2E. HDF 350.0 KB 24 (per day) -
CMA Normalized Geostationary Projection Dataset - FengYun 2D
Full Disk from 86.5 degrees E
Full disk images from the Chinese satellite FengYun 2D. HDF 350.0 KB 24 (per day) -
EUMETSAT High Rate SEVIRI Level 1.5 Image Data - MSG - 0 degree
Full Disk 0 degrees
Rectified (level 1.5) Meteosat SEVIRI image data. The data is transmitted as High Rate transmissions in 12 spectral channels. Level 1.5 image data corresponds to the geolocated and radiometrically pre-processed image data, ready for further processing, e.g. the extraction of meteorological products. Any spacecraft specific effects have been removed, and in particular, linearisation and equalisation of the image radiometry has been performed for all SEVIRI channels. The on-board blackbody data has been processed. Both radiometric and geometric quality control information is included.
HRIT (lossless wavelet compressed)
38.0 MB 96 (per day) -
EUMETSAT HRI Level 1.5 Image Data - MFG - Indian Ocean
Full Disk from 57.5 degrees E, Indian Ocean
Image data in the form of high rate transmissions in 3 spectral channels available at 30-minute intervals with coverage over the Indian Ocean. Level 1.5 images are pre-processed in such a way that all image pixels are remapped on to a reference image corresponding to an image taken by the MTP satellite located at its nominal position over the equator and with a nominal attitude, i.e. with the satellite spin axis parallel to the spin axis of the earth. In addition, all image lines are aligned and the coordinates of image pixels of the different radiometer channels are adjusted so that they correspond to information from the same point on the earth's surface.
LRIT (OpenMTP)
272.0 MB 48 (per day) -
5

EUM/OPS/DOC/13/707607 v1, 3 June 2013
EUMETCast-Africa Dissemination Baseline Overview
Data Provider Product Name Coverage Product Description
Format
File Size
Other NRT Frequency Dissemination
INPE/CPTEC Composites - GOES-MSG - Africa, South America
Africa and South America
GOES/MSG Composite is a product created by composing the GOES-12 IR images with MSG IR images, every 15 minutes. Every 3 hours, the composite will be derived from the full disk of GOES and full disk of MSG, in the 13-North to 50-South Latitude; 85-West to 55-East Longitude region, encompassing South America and Africa.
GEOTIFF 400.0 KB 96 (per day) -
JMA Image data (3-hourly) - MTSAT-2
Full Disk from 140 degrees E
Image data in the form of Low Rate transmissions, in 4 spectral channels: Visible (VIS) 0.55 - 0.90, Infrared 1 (IR1) 10.3 - 11.3, Infrared 3 (IR3) 6.5 - 7.0, Infrared 4 (IR4) 3.5 - 4.0. Note: For the VIS channel 007 there are no data between 12.00 - 19.00 UTC due to under illumination.
LRIT (Wavelet compressed)
1.0 MB 8 (per day) -
NOAA Image data (3-hourly) - GOES East
Full Disk from 75 degrees W
Image data in the form of Low Rate transmissions, in 4 spectral channels: IR 3.9, IR 10.7, VIS 007, WV 6.6. Note: For the VIS channel 007 slots there are no data between 03.00 - 09.00 UTC due to under illumination.
LRIT (Wavelet compressed)
1.0 MB 8 (per day) -
NOAA Image data (3-hourly) - GOES West
Full Disk from 135 degrees W
Image data in the form of Low Rate transmissions, in 4 spectral channels: IR 3.9, IR 10.7, VIS 007, WV 6.6. Note: For the VIS channel 007 slots there are no data between 06.00 - 12.00 UTC due to under illumination.
LRIT (Wavelet compressed)
1.0 MB 8 (per day) -
UMD Image data - Landsat
Central Africa Land application products for Central Africa from OSFAC (Observatoire Satellital des Forêts d'Afrique Centrale). Landsat L1T (terrain corrected) data from the Landsat 7 satellite. The Level 1T (L1T) data product provides systematic radiometric and geometric accuracy by incorporating ground control points, while also employing a Digital Elevation Model (DEM) for topographic accuracy. Geodetic accuracy of the product depends on the accuracy of the ground control points and the resolution of the DEM used. All Landsat 7 scenes collected since May of 2003 have data gaps. Although the scenes have only 78 percent of their pixels, these data are still some of the most geometrically and radiometrically accurate of all civilian satellite data in the world.
TIF (bz2, gz), TXT
180.0MB 1 set (per day)
-
6
EUM/OPS/DOC/13/707607 v1, 3 June 2013
EUMETCast-Africa Dissemination Baseline Overview
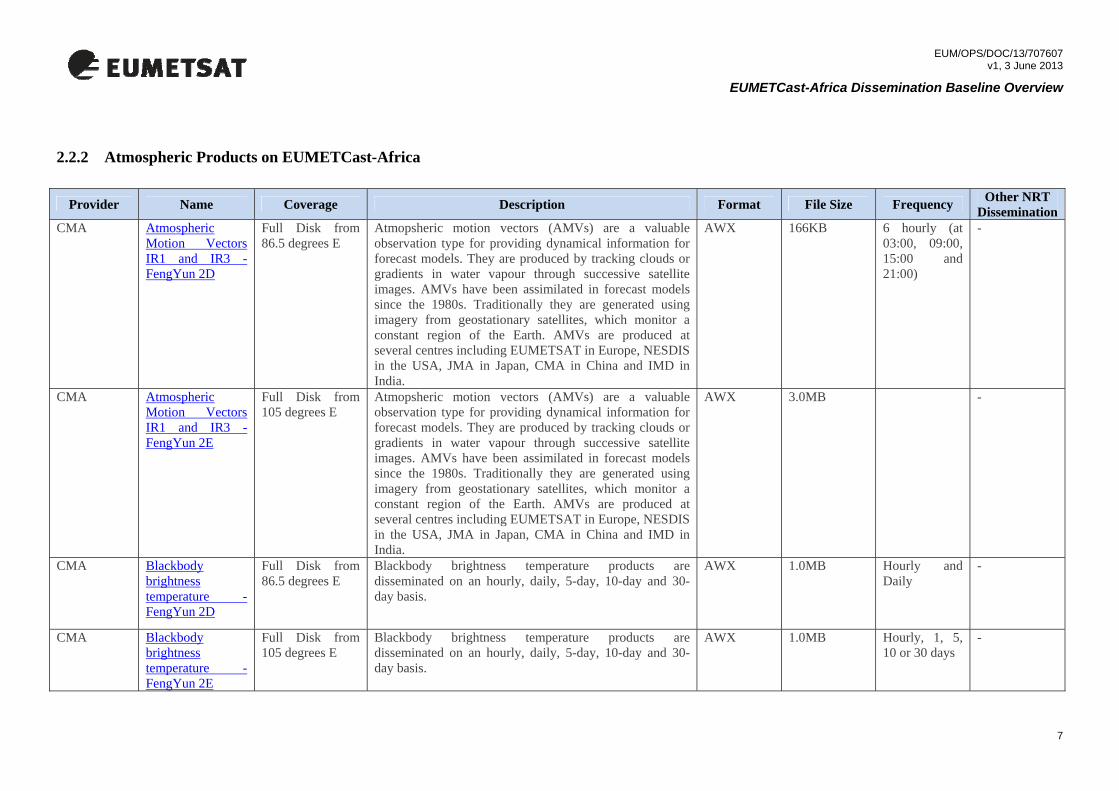
2.2.2 Atmospheric Products on EUMETCast-Africa
Provider Name Coverage Description Format File Size Frequency Other NRT Dissemination
CMA Atmospheric Motion Vectors IR1 and IR3 - FengYun 2D
Full Disk from 86.5 degrees E
Atmopsheric motion vectors (AMVs) are a valuable observation type for providing dynamical information for forecast models. They are produced by tracking clouds or gradients in water vapour through successive satellite images. AMVs have been assimilated in forecast models since the 1980s. Traditionally they are generated using imagery from geostationary satellites, which monitor a constant region of the Earth. AMVs are produced at several centres including EUMETSAT in Europe, NESDIS in the USA, JMA in Japan, CMA in China and IMD in India.
AWX 166KB 6 hourly (at 03:00, 09:00, 15:00 and 21:00)
-
CMA Atmospheric Motion Vectors IR1 and IR3 - FengYun 2E
Full Disk from 105 degrees E
Atmopsheric motion vectors (AMVs) are a valuable observation type for providing dynamical information for forecast models. They are produced by tracking clouds or gradients in water vapour through successive satellite images. AMVs have been assimilated in forecast models since the 1980s. Traditionally they are generated using imagery from geostationary satellites, which monitor a constant region of the Earth. AMVs are produced at several centres including EUMETSAT in Europe, NESDIS in the USA, JMA in Japan, CMA in China and IMD in India.
AWX 3.0MB -
CMA Blackbody brightness temperature - FengYun 2D
Full Disk from 86.5 degrees E
Blackbody brightness temperature products are disseminated on an hourly, daily, 5-day, 10-day and 30-day basis.
AWX 1.0MB Hourly and Daily
-
CMA Blackbody brightness temperature - FengYun 2E
Full Disk from 105 degrees E
Blackbody brightness temperature products are disseminated on an hourly, daily, 5-day, 10-day and 30-day basis.
AWX 1.0MB Hourly, 1, 5, 10 or 30 days
-
7

EUM/OPS/DOC/13/707607 v1, 3 June 2013
EUMETCast-Africa Dissemination Baseline Overview
Provider Name Coverage Description Format File Size Other NRT Frequency Dissemination CMA Cloud
Classification Product - FengYun 2D
Full Disk from 86.5 degrees E
Cloud Classification Product. AWX 1.0MB -
CMA Cloud Classification Product - FengYun 2E
Full Disk from 105 degrees E
Cloud Classification Product. AWX 1.0MB -
CMA Humidity product analysed by cloud information - FengYun 2D
Full Disk from 86.5 degrees E
Humidity product analysed by cloud information Product. AWX 1.0MB 8 (*7 products per day)
-
CMA Humidity product analysed by cloud information - FengYun 2E
Full Disk from 105 degrees E
Humidity product analysed by cloud information Product. AWX 1.0MB 72 (per day) -
CMA Outgoing Longwave Radiation Product - FengYun 2D
Full Disk from 86.5 degrees E
Outgoing Longwave Radiation Product - 3 hours; 5, 10 and 30 days.
AWX 3.0MB 8 and 1 (per day) and 6, 3, 1 (per month)
-
CMA Outgoing Longwave Radiation Product - FengYun 2E
Full Disk from 105 degrees E
Outgoing Longwave Radiation Product - 3 hours; 5, 10 and 30 days.
AWX 3.0MB 8 (per day) and 6, 3, 1 (per month)
-
CMA Snow Fraction Product - FengYun 2D
Full Disk from 86.5 degrees E
Snow Fraction Product for FengYun 2D AWX 1.0MB -
CMA Snow Fraction Product - FengYun 2E
Full Disk from 105 degrees E
Snow Fraction Product for FengYun 2E AWX 1.0MB -
8

EUM/OPS/DOC/13/707607 v1, 3 June 2013
EUMETCast-Africa Dissemination Baseline Overview
Provider Name Coverage Description Format File Size Other NRT Frequency Dissemination CMA Surface Solar
Irradiance Product - FengYun 2D
Full Disk from 86.5 degrees E
Surface Solar Irradiance Product. AWX 1.0MB 1 (per day) -
CMA Surface Solar Irradiance Product - FengYun 2E
Full Disk from 105 degrees E
Surface Solar Irradiance Product. AWX 1.0MB -
CMA Total Cloud Amount Product - FengYun 2D
Full Disk from 86.5 degrees E
Total Cloud Amount Product. AWX 1.0MB 24 (per day) -
CMA Total Cloud Amount Product - FengYun 2E
Full Disk from 105 degrees E
Total Cloud Amount Product. AWX 1.0MB -
CMA Total Precipitable Water Product - FengYun 2D
Full Disk from 86.5 degrees E
Total Precipitable Water Product. AWX 1.0MB 1 (per day) -
CMA Total Precipitable Water Product - FengYun 2E
Full Disk from 105 degrees E
Total Precipitable Water Product. AWX 1.0MB 1 (per day) -
ECMWF ECMWF NWP data for ACMAD members - NWP Model
Africa Surface and pressure level parameters from ECMWF IFS for African domain, produced twice a day for 00 and 12 UTC; analysis and forecast steps out to 5-6 days.
GRIB 200KB 119 files (twice per day) (forecast run 00 and 12)(*D1F1)
-
ECMWF ECMWF NWP data for the GTS (essential and additional) - NWP Model
Global Global surface and pressure level parameters from ECMWF IFS, produced twice a day for 00 and 12 UTC; analysis and forecast steps out to 6-10 days.
GRIB 200KB 267 files (twice per day) (run 00 and 12)(*D1F1)
GTS
9
EUM/OPS/DOC/13/707607 v1, 3 June 2013
EUMETCast-Africa Dissemination Baseline Overview
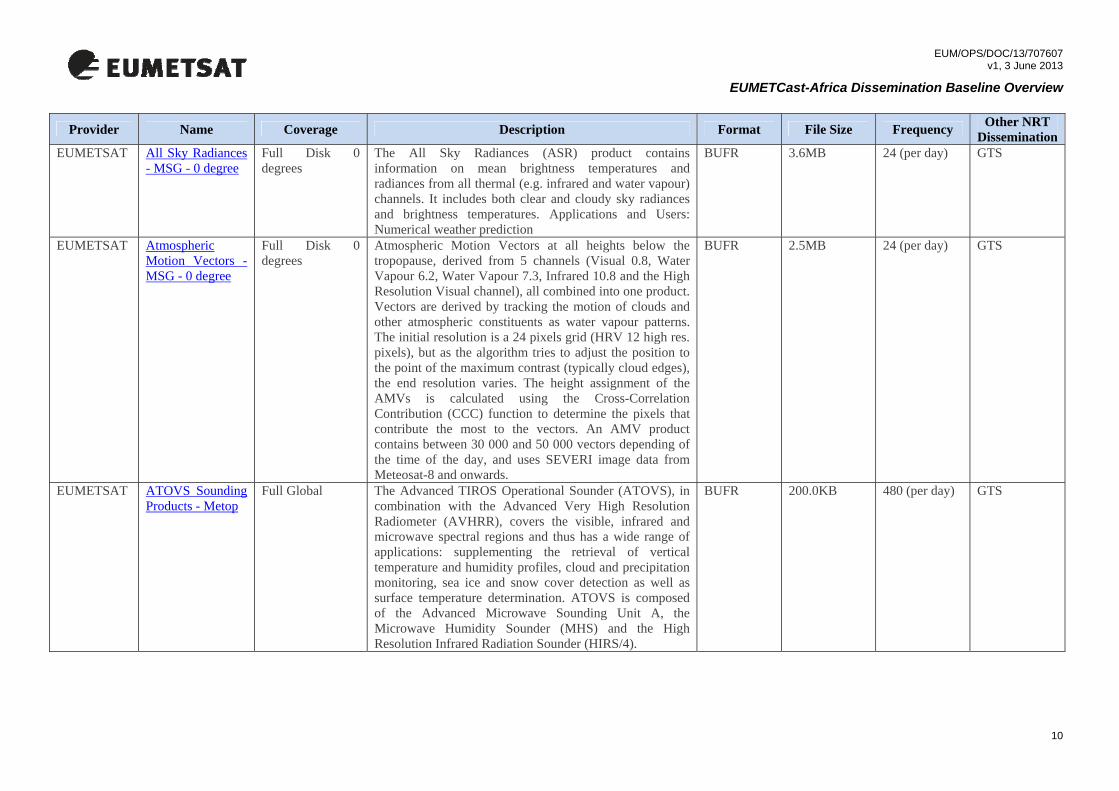
Provider Name Coverage Description Format File Size Other NRT Frequency Dissemination EUMETSAT All Sky Radiances
- MSG - 0 degree Full Disk 0 degrees
The All Sky Radiances (ASR) product contains information on mean brightness temperatures and radiances from all thermal (e.g. infrared and water vapour) channels. It includes both clear and cloudy sky radiances and brightness temperatures. Applications and Users: Numerical weather prediction
BUFR 3.6MB 24 (per day) GTS
EUMETSAT Atmospheric Motion Vectors - MSG - 0 degree
Full Disk 0 degrees
Atmospheric Motion Vectors at all heights below the tropopause, derived from 5 channels (Visual 0.8, Water Vapour 6.2, Water Vapour 7.3, Infrared 10.8 and the High Resolution Visual channel), all combined into one product. Vectors are derived by tracking the motion of clouds and other atmospheric constituents as water vapour patterns. The initial resolution is a 24 pixels grid (HRV 12 high res. pixels), but as the algorithm tries to adjust the position to the point of the maximum contrast (typically cloud edges), the end resolution varies. The height assignment of the AMVs is calculated using the Cross-Correlation Contribution (CCC) function to determine the pixels that contribute the most to the vectors. An AMV product contains between 30 000 and 50 000 vectors depending of the time of the day, and uses SEVERI image data from Meteosat-8 and onwards.
BUFR 2.5MB 24 (per day) GTS
EUMETSAT ATOVS Sounding Products - Metop
Full Global The Advanced TIROS Operational Sounder (ATOVS), in combination with the Advanced Very High Resolution Radiometer (AVHRR), covers the visible, infrared and microwave spectral regions and thus has a wide range of applications: supplementing the retrieval of vertical temperature and humidity profiles, cloud and precipitation monitoring, sea ice and snow cover detection as well as surface temperature determination. ATOVS is composed of the Advanced Microwave Sounding Unit A, the Microwave Humidity Sounder (MHS) and the High Resolution Infrared Radiation Sounder (HIRS/4).
BUFR 200.0KB 480 (per day) GTS
10

EUM/OPS/DOC/13/707607 v1, 3 June 2013
EUMETCast-Africa Dissemination Baseline Overview
Provider Name Coverage Description Format File Size Other NRT Frequency Dissemination EUMETSAT ATOVS Sounding
Products - NOAA Full Global The Advanced TIROS Operational Sounder (ATOVS), in
combination with the Advanced Very High Resolution Radiometer (AVHRR), covers the visible, infrared and microwave spectral regions and thus has a wide range of applications: supplementing the retrieval of vertical temperature and humidity profiles, cloud and precipitation monitoring, sea ice and snow cover detection as well as surface temperature determination. ATOVS is composed of the Advanced Microwave Sounding Unit A, the Microwave Humidity Sounder (MHS) and the High Resolution Infrared Radiation Sounder (HIRS/4).
BUFR 200.0KB 480 (per day) GTS
EUMETSAT Clear-Sky Radiances - MSG - 0 degree
Full Disk 0 degrees
The Clear-Sky Radiances (CSR) product is a subset of the information derived during the Scenes Analysis processing. The product provides the radiances for a subset of the MSG channels averaged over all pixels within a processing segment which have been identified as clear, except for channel WV6.2 where the CSR is also derived for areas containing low-level clouds. The final CSR product is BUFR encoded at every third quarter of the hour (e.g 00:45, 01:45 ...) and distributed to the users via EUMETCAST and GTS. It is also stored in the EUMETSAT Data Centre. Applications and Users: Numerical weather prediction
BUFR 3.0MB 24 (per day) GTS
EUMETSAT Clear Sky Radiances - MFG - Indian Ocean
Full Disk 57 degrees
The Clear Sky Radiances (CSR) product contains information on mean brightness temperatures and radiances from all thermal (e.g. infrared and water vapour) channels, for those regions containing no or only low-level clouds. Applications and users: Numerical weather prediction
BUFR 24 KB 24 (per day) GTS
11

EUM/OPS/DOC/13/707607 v1, 3 June 2013
EUMETCast-Africa Dissemination Baseline Overview
Provider Name Coverage Description Format File Size Other NRT Frequency Dissemination EUMETSAT Clear-Sky
Reflectance Map - MSG - 0 degree
Full Disk 0 degrees
Reflectances from the four MSG solar channels. Seven-day average of cloud-free pixels in the 12:00 UTC images. Applications and Users: Used to perform cloud masking with visible channels. Also information source for climate and land surface applications. The product is available on request only. In addition to the daily 12:00 UTC images, the Data Centre offers also some products generated at different times of day. These 6 additional products are provided once a week (Wednesdays) in the time range between 06:00 and 18:00 UTC.
GRIB 20.0MB 1 (per day) -
EUMETSAT Clear Sky Water Vapour Winds - MFG - Indian Ocean
Full Disk 57 degrees
Vectors are derived by tracking structures in the WV image from non-cloudy areas. It uses essentially the same algorithm as the other Meteosat First Generation vector products and the low resolution 80x80 segment matrix. Height information is supplied - the 10%, 50% and 90% levels of the cumulative contribution function (based on ECMWF forecast data) - and the levels of the maximum gradient of the cumulative contribution function are inserted. These values allow characteristics of the layer being tracked to be determined. A typical WVW product contains about 1000 Clear Sky WV vectors.
BUFR 24 KB 24 (per day) GTS
EUMETSAT Cloud Analysis - MSG - 0 degree
Full Disk 0 degrees
Identification of cloud layers with cloud type and coverage, height and temperature. Applications and Users: Weather forecasting, numerical weather prediction, climate research and monitoring.
BUFR 1.5MB 24 (per day) GTS
EUMETSAT Cloud Analysis Image - MSG - 0 degree
Full Disk 0 degrees
Identification of scenes type for each image segment. This is an image product derived along with CLA. Applications and Users: Weather forecasting, numerical weather prediction, climate research and monitoring.
GRIB 1.2MB 8 (per day) -
12

EUM/OPS/DOC/13/707607 v1, 3 June 2013
EUMETCast-Africa Dissemination Baseline Overview
Provider Name Coverage Description Format File Size Other NRT Frequency Dissemination EUMETSAT Cloud Mask -
MSG - 0 degree Full Disk 0 degrees
The Cloud Mask product describes the scene type (either 'clear' or 'cloudy') on a pixel level. Each pixel is classified as one of the following four types: clear sky over water, clear sky over land, cloud, or not processed (off Earth disc). Applications & Uses: The main use is in support of Nowcasting applications, where it frequently serves as a basis for other cloud products, and the remote sensing of continental and ocean surfaces.
GRIB2 3.45MB 96 (per day) -
EUMETSAT Cloud Top Height - MSG - 0 degree
Full Disk 0 degrees
The product indicates the height of highest cloud. Based on a subset of the information derived during Scenes and Cloud Analysis, but also makes use of other external meteorological data. Applications and Users: Aviation meteorology.
GRIB 800KB 96 (per day) -
EUMETSAT Data Collection and Retransmission
Full Global One of the functions of the system of geostationary meteorological satellites is the collection of environmental data from Data Collection Platforms (DCP). The Data Collection and Retransmission service enables DCP Operators to use the Meteosat system to retransmit those DCP data collected from their DCP platforms to their own reception stations and to the Global Telecommunication System (GTS) community.
LRIT 1.0MB GTS
EUMETSAT Divergence Product - MSG
Full Disk 0 degrees
The Divergence is calculated directly from the field of the MSG channel 6.2 Atmospheric Motion Vectors. Only high level (above 400 hPa) vectors are considered, and the output variables are Horizontal Divergence and Relative Vorticity on a 32 x 32 pixel grid.
GRIB2 20.0KB 24 (per day) -
EUMETSAT Global Instability Index - MSG - 0 degree
Full Disk 0 degrees
Atmospheric air mass instability in cloud free areas. The algorithm is a physical retrieval scheme developed at EUMETSAT. Applications and Users: Nowcasting and short term forecasting (up to 12 hours). Resolution is 3x3 pixels.
BUFR 10.0MB 96 (per day) -
13

EUM/OPS/DOC/13/707607 v1, 3 June 2013
EUMETCast-Africa Dissemination Baseline Overview
Provider Name Coverage Description Format File Size Other NRT Frequency Dissemination EUMETSAT Expanded Low-
resolution Cloud Motion Winds - MFG - Indian Ocean
Full Disk 57 degrees
Vectors at all heights below the tropopause, derived from the Meteosat First Generation (MFG) IR channel by tracking the motion of clouds. The MFG low resolution 80 x 80 segment matrix (with 32 x 32 pixel segments) is used and vectors are derived by tracking the motion of clouds only; height assignment is based on IR EBBT. Before 2 December 2002 the ELW product derived vectors from all three MFG channels. A typical ELW product contains about 2000 IR vectors.
BUFR 0.6MB 16 (per day) GTS
EUMETSAT Multi-Sensor Precipitation Estimate (GRIB) - MSG - 0 degree
Full Disk 0 degrees
The Multi-Sensor Precipitation Estimate (MPE) product consists of the near-real-time rain rates in mm/hr for each Meteosat image in original pixel resolution. The algorithm is based on the combination of polar orbiter microwave measurements and images in the Meteosat IR channel by a so-called blending technique. The MPE is most suitable for convective precipitation. Applications and Users: Operational weather forecasting in areas with poor or no radar coverage, especially in Africa and Asia.
GRIB 2.0MB 96 (per day) -
EUMETSAT Total Ozone - MSG - 0 degree
Full Disk 0 degrees
Total density of ozone in atmospheric column for each image segment, based on the SEVIRI 9.7 micron Ozone channel and other IR and WV channels. Applications and Users: Numerical Weather Prediction Centres, Ozone Monitoring Services and Research Institutes.
BUFR 6.5MB 24 (per day) -
EUMETSAT Tropospheric Humidity - MSG - 0 degree
Full Disk 0 degrees
Relative humidity in both mid and upper layers of the troposphere, using a 16 x 16 pixel segment grid. The upper level is derived from the mean layer relative humidity between about 600 hPa and 300 hPa using the WV6.2 micron channel, while mid-tropospheric humidity represents the mean value between 850 hPa and 600 hPa using the WV7.3 micron channel
BUFR 0.4MB 24 (per day) -
EUMETSAT Volcanic Ash Detection (CAP) - MSG - 0 degree
Full Disk 0 degrees
The Volcanic Ash Detection product is restricted to those National Meteorological Services that are members of EUMETSAT. The ash detection is based on a reversed split window technique, supported by tests in the other IR
CAP (Common Alerting Protocol)
10.0KB 96 (per day) -
14

EUM/OPS/DOC/13/707607 v1, 3 June 2013
EUMETCast-Africa Dissemination Baseline Overview
Provider Name Coverage Description Format File Size Other NRT Frequency Dissemination channels and two VIS channels. The execution of the ash detection algorithm is limited to a 5° circle around a volcano. This limit is a requirement to be able to derive the proposed CAP formatted product. The CAP formatted product provides an ash cloud centre and a radius. The generation and dissemination shall only be activated after the reception of an alert from the VAAC-London. Applications & Users: Support to ash monitoring, aviation. Current users are the Volcanic Ash Advisory Centre and Member States National Meteorological Services (NMS). Used input data include: the reflectances in the VIS0.6 and the IR3.9 channels; the brightness temperatures in the IR3.9, IR8.7, IR10.8 and IR12:0 channels; the solar zenith angle on pixel level; the scenes type and; the locations of active volcanoes.
INPE/CPTEC ForTraCC Images - GOES - South America
South America A DevCoCast product, Fortracc Images are short term predictions (120 minutes) of convective systems displacement, area and life stage. This nowcasting product is based on the ForTraCC technique developed by INPE using as input GOES-12 images every 15 minutes, from the infrared channel (channel 4). Colours correspond to life stage; red is intensifying, yellow is unchanged and green is de-intensifying. Fortracc allows tracking of convective systems and forecasts their evolution.
JPG 700.0KB 96 (per day) -
INPE/CPTEC Lightning Discharge Image - GOES - South America
South America A DevCoCast product, Lightning Discharges Images (LDI) are a combination of GOES-12 (IR) cloud images and lightning occurrence information collected by the RINDAT ground Network (Integrated National Network for Detection of Atmospheric Lightning Discharges). Colours correspond to the number of lightning occurrences every 15 minutes.
JPG 180.0KB 96 (per day) -
15

EUM/OPS/DOC/13/707607 v1, 3 June 2013
EUMETCast-Africa Dissemination Baseline Overview
Provider Name Coverage Description Format File Size Other NRT Frequency Dissemination INPE/CPTEC Rainfall Satellite
Image - Multimission - South America
South America This DevCoCast product comprises the instantaneous and the accumulated convective rainfall estimates, based on GOES images, for the South America region. The estimation is based in the adjusted hydro-estimator methodology from South America, using INPE information about precipitated water, relative humidity and winds.
GEOTIFF 60.0KB 96 (per day) -
INPE/CPTEC Ultaviolet Index - Multimission - South America
South America A DevCoCast product, the Ultraviolet Index indicates the maximum daily value of the ultraviolet radiation. It takes into consideration the ozone concentration based on AURA-OMI and SBUV sensor measurements provided by NASA, and the images of nebulosity derived from GOES data.
JPG 150.0KB 24 (per day) -
Météo-France
Météo-France Forecast Products for Africa - NWP Model
The products are composed of 9 fields on 15 isobaric levels plus surface pressure, CAPE, precipitations, 2m and 10m temperature-humidity-wind. The model starts the product generation at 00:00UTC for the up-to-96 hour/4 day forecast and at 12:00UTC for the up-to-72-hour/3 day forecast (forecast step 6H). The products generated at 06:00UTC and 18:00UTC are exclusively analysis.
GRIB2 290KB 4 batches (per day), 34 files for batch 1, 2 for batch 2, 28 for batch 3, 2 for batch 4
-
Met Office Lightning Detection Data from ground based ATDNET network
Africa The ATDnet system is an automatic lightning location network capable of sensing lightning flashes over a wide and variable geographical area. The system locates lightning by timing the arrival of unique very low frequency radio waves (know as atmospherics, or simply 'sferics') generated by individual lightning strokes at the ATDnet outstations. The differences in the arrival times of these strokes at the outstations are used to calculate the lightning's location. Data are collected every minute and BUFR encoded using the 'Universal BUFR template for lightning data' with 15 minutes of data combined into one file which is then sent to EUMETSAT.
BUFR 20KB 96 per day -
16

EUM/OPS/DOC/13/707607 v1, 3 June 2013
EUMETCast-Africa Dissemination Baseline Overview
Provider Name Coverage Description Format File Size Other NRT Frequency Dissemination WMO Meteorological
Data Dissemination
The Meteorological Data Dissemination (MDD) is a service primarily for the African members of the World Meteorological Organization (WMO). It comprises observations, analyses and forecasts from major meteorological centres, including the Africa Limited Area model Output (Africa LAM).
GRIB & BUFR
1.0MB 1 (per day) GTS
17

EUM/OPS/DOC/13/707607 v1, 3 June 2013
EUMETCast-Africa Dissemination Baseline Overview
2.2.3 Marine Products on EUMETCast-Africa Data Provider Product Name Coverage Product Description
Format
File Size Frequency
Other NRT Dissemination
CNES Absolute Dynamic Topography - Multimission
Along-track sea surface heights above geoid; dynamic topography is the sum of sea level anomaly (SLA) and mean dynamic topography (MDT, Rio05 here). Mono altimeter satellite product homogeneous with other satellites. Available in delayed time or near-real time. Jason-1 and Jason-2 data only.
netCDF 3.5MB 12 files, 4 times per annum for delayed time
-
CNES Absolute Sea Level Anomaly - Jason 1 - Mozambique
Along-track sea surface heights computed with respect to a seven-year mean. Mono altimeter satellite product homogeneous with other satellites available in near real time.
netCDF (gzip)
40KB 21 files (per day)
-
CNES Absolute Sea Level Anomaly - Jason 2 - Mozambique
Along-track sea surface heights computed with respect to a seven-year mean. Mono altimeter satellite product homogeneous with other satellites available in near real time.
netCDF (gzip)
86KB 21 files (per day)
-
CNES Absolute Sea Level Anomaly - Multimission
Along-track sea surface heights computed with respect to a seven-year mean. Mono altimeter satellite product homogeneous with other satellites. Available in delayed time or near-real time. Jason-1 and Jason-2 data only.
netCDF 4.0MB 12 files, 4 times per annum for delayed time
-
CNES Corrected Sea Surface Height - Multimission
Along-track corrected sea surface heights with regard to reference ellipsoid. Mono altimeter satellite product, with corrections and geophysical parameters. Significant wave heights and backscatter coefficient are also provided. Used in stationary or long-term geophysical and ocean phenomenon studies. Jason-1 and Jason-2 data only.
netCDF 25.0MB 12 files, 4 times per annum for delayed time
-
CNES Global Map of Absolute Dynamic Topography - Multimission
Gridded sea surface heights above geoid; dynamic topography is the sum of sea level anomaly (SLA) and mean dynamic topography (MDT, Rio05 here). Available in delayed time or near-real time. High resolution (1/3°x1/3°, Mercator grid).
netCDF 1.8MB 90 files, 4 times per annum for delayed time
-
18

EUM/OPS/DOC/13/707607 v1, 3 June 2013
EUMETCast-Africa Dissemination Baseline Overview
CNES Global Map of Sea Level Anomalies - Multimission
Multimission gridded sea surface heights computed with respect to a seven-year mean. Available in delayed time or near-real time. High resolution (1/3°x1/3°, Mercator grid).
netCDF 1.8MB 90 files, 4 times per annum for delayed time
-
CNES Global Map of Sea Level Anomalies - Multimission - Mozambique
Along-track sea surface heights computed with respect to a seven-year mean. Mono altimeter satellite product homogeneous with other satellites available in near real time.
netCDF (gzip)
150KB 1 (per day) -
CNES Gridded Wind Products - Multimission
Near-real time wind speed modulus. Gridded (1°x1°, regular grid) multimission product. Used in marine meteorology and ocean-atmosphere gas transfer studies.
netCDF 140.0KB 1 (per day) -
CNES Interim Geophysical Data Records - Jason-1
Full Global The applied NetCDF format and filename conventions are identical to those of the upcoming Jason-2 Operational Geophysical Data Record (OGDR), the Jason-2 Interim Geophysical Data Record (IGDR), and the Jason-2 Geophysical Data Record (GDR) products. In addition, the format is fully compliant with NetCDF Climate and Forecast (CF) Metadata Convention, providing a definitive description of each variable and enabling users to easily compare data from different sources. The disseminated Jason-1 IGDR NetCDF product is originally generated by CNES. It basically comprises the same data content as the native Jason-1 IGDR product. Hence, besides wind speed, wave height and brightness temperature data, it will contain the full set of the sea level height measurements and corrections (surface backscatter, sea level height, sea level height correction).
netCDF 5.0MB 25 (per day)
-
CNES Operational Sensor Data Record - Jason-1
Full Global The Operational Sensor Data Record (OSDR) comprises: wind speed data, significant wave height data, surface backscatter data, range data and brightness temperature data. Applications: marine meteorology, ocean forecasting applications.
BUFR & netCDF
1.0MB 12 (per day)
-
19

EUM/OPS/DOC/13/707607 v1, 3 June 2013
EUMETCast-Africa Dissemination Baseline Overview
EUMETSAT ASCAT Regional Ocean Surface Winds at 12.5 km Node Grid - Metop
Northern Hemisphere
The ASCAT Wind Product contains measurements of the wind direction and wind speed at 10 m above the sea surface. The measurements are obtained through the processing of scatterometer data originating from the ASCAT instrument on EUMETSAT's Metop satellite, as described in the ASCAT Wind Product User Manual. In the context of this regional service, the data is acquired both from the last 30 minutes of the ASCAT Metop main Svalbard dump, as well as from several AHRPT stations in Europe and the middle East. All data are processed jointly by the EARS ground system and the Koningklijk Nederlands Meteorologisch Instituut (KNMI) within 45 minutes. This product in intended for Nowcasting applications, where high timeliness and resolution are very important.
BUFR 1.8MB ~36 (per day)
GTS
EUMETSAT ASCAT Regional Ocean Surface Winds at 25 km Node Grid - Metop
Northern Hemisphere
The ASCAT Wind Product contains measurements of the wind direction and wind speed at 10 m above the sea surface. The measurements are obtained through the processing of scatterometer data originating from the ASCAT instrument on EUMETSAT's Metop satellite, as described in the ASCAT Wind Product User Manual. In the context of this regional service, the data is acquired both from the last 30 minutes of the ASCAT Metop main Svalbard dump, as well as from several AHRPT stations in Europe and the middle East. All data are processed jointly by the EARS ground system and the Koningklijk Nederlands Meteorologisch Instituut (KNMI) within 45 minutes. This product is intended for assimilation in Regional Numerical Weather prediction models, where high timeliness is very important in order to address the short model cut-off times.
BUFR 0.47MB ~36 (per day)
GTS
20
EUM/OPS/DOC/13/707607 v1, 3 June 2013
EUMETCast-Africa Dissemination Baseline Overview
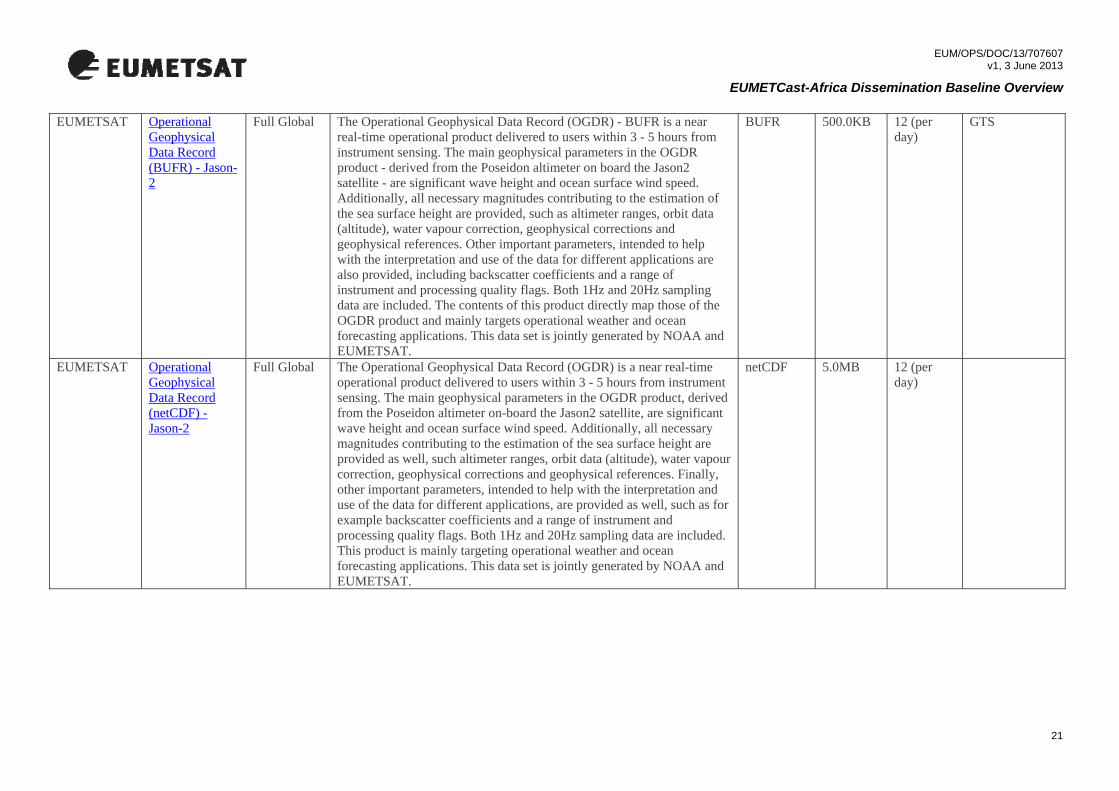
EUMETSAT Operational Geophysical Data Record (BUFR) - Jason-2
Full Global The Operational Geophysical Data Record (OGDR) - BUFR is a near real-time operational product delivered to users within 3 - 5 hours from instrument sensing. The main geophysical parameters in the OGDR product - derived from the Poseidon altimeter on board the Jason2 satellite - are significant wave height and ocean surface wind speed. Additionally, all necessary magnitudes contributing to the estimation of the sea surface height are provided, such as altimeter ranges, orbit data (altitude), water vapour correction, geophysical corrections and geophysical references. Other important parameters, intended to help with the interpretation and use of the data for different applications are also provided, including backscatter coefficients and a range of instrument and processing quality flags. Both 1Hz and 20Hz sampling data are included. The contents of this product directly map those of the OGDR product and mainly targets operational weather and ocean forecasting applications. This data set is jointly generated by NOAA and EUMETSAT.
BUFR 500.0KB 12 (per day)
GTS
EUMETSAT Operational Geophysical Data Record (netCDF) - Jason-2
Full Global The Operational Geophysical Data Record (OGDR) is a near real-time operational product delivered to users within 3 - 5 hours from instrument sensing. The main geophysical parameters in the OGDR product, derived from the Poseidon altimeter on-board the Jason2 satellite, are significant wave height and ocean surface wind speed. Additionally, all necessary magnitudes contributing to the estimation of the sea surface height are provided as well, such altimeter ranges, orbit data (altitude), water vapour correction, geophysical corrections and geophysical references. Finally, other important parameters, intended to help with the interpretation and use of the data for different applications, are provided as well, such as for example backscatter coefficients and a range of instrument and processing quality flags. Both 1Hz and 20Hz sampling data are included. This product is mainly targeting operational weather and ocean forecasting applications. This data set is jointly generated by NOAA and EUMETSAT.
netCDF 5.0MB 12 (per day)
21

EUM/OPS/DOC/13/707607 v1, 3 June 2013
EUMETCast-Africa Dissemination Baseline Overview
EUMETSAT Operational Geophysical Data Record - Sea Surface Height Anomaly - Jason-2
Full Global The Operational Geophysical Data Record - Sea Surface Height Anomaly (OGDR-SSHA) is a near real-time operational product delivered to users within 3 - 5 hours from instrument sensing. It can be considered a subset, or derived data set from the complete OGDR product. The main geophysical parameter in the OGDR-SSHA product is sea surface height anomaly, derived from the Poseidon altimeter on-board the Jason2 satellite. This product is given at I Hz sampling, and includes all the parameters used in the calculation of sea surface height anomalies, such as altimeter ranges, orbit data (altitude), water vapour correction, geophysical corrections and geophysical references. Other important parameters, intended to help with the interpretation and use of the data for different applications, are also included in the product. These include backscatter coefficients and a range of processing quality flags. This product is mainly targeted at operational weather and ocean forecasting applications. This data set is jointly generated by NOAA and EUMETSAT.
netCDF 300.0KB 12 (per day)
NASA Chlorophyll Alpha (MODIS, Mapped 4km) - Aqua
Full Global MODIS provides the unprecedented ability to measure chlorophyll fluorescence, which gives insight into the health of phytoplankton in the ocean. When phytoplankton are under stress, they no longer photosynthesise and begin to emit absorbed sunlight as fluorescence. Measurements of the chlorophyll fluorescence can be used to describe the physiological state of the phytoplankton, help to determine the cause of phytoplankton bloom collapses and help to make more robust estimates of primary productivity on a global scale.
HDF 3.5MB 1 (per day) -
OSI SAF ASCAT Coastal Winds at 12.5 km Swath Grid - Metop
Full Global Equivalent neutral 10m winds over the global oceans, with specific sampling to provide as many observations as possible near the coasts.
BUFR 400.0KB 480 (per day)
Download
22

EUM/OPS/DOC/13/707607 v1, 3 June 2013
EUMETCast-Africa Dissemination Baseline Overview
OSI SAF ASCAT Winds and Soil Moisture at 12.5 km Swath Grid - Metop
Full Global This ASCAT Multi-parameter product contains surface wind vectors over ocean and soil moisture index over land. Additionally, the backscatter values involved in the retrieval of the geophysical parameters above are also included, as well as several quality flags to facilitate the use of the data. For NWP users this product is provided in BUFR format. The netCDF version of this product contains Winds ONLY. For users interested in either ASCAT backscatter, wind or soil moisture index data in other formats, please refer to the relevant product entries available for the specific parameters. Finally, note that although the OSI SAF is identified as the originating centre for this product, it is not responsible for the processing of soil moisture index values, which is currently carried out at EUMETSAT.
BUFR 400.0KB 480 (per day)
Download
OSI SAF ASCAT Winds and Soil Moisture at 25 km Swath Grid - Metop
Full Global This ASCAT Multi-parameter product contains surface wind vectors over ocean and soil moisture index over land. Additionally, the backscatter values involved in the retrieval of the geophysical parameters above are also included, as well as several quality flags to facilitate the use of the data. For NWP users this product is provided in BUFR format. The netCDF version of this product contains Winds ONLY. For users interested in either ASCAT backscatter, wind or soil moisture index data in other formats, please refer to the relevant product entries available for the specific parameters. Finally, note that although the OSI SAF is identified as the originating centre for this product, it is not responsible for the processing of soil moisture index values, which is currently carried out at EUMETSAT.
BUFR 240.0 KB 480 (per day)
Download
OSI SAF Atlantic High Latitude Downward Longwave Irradiance - Multimission
Regional Europe
Daily averaged estimation of the solar irradiance reaching the Earth surface, derived from AVHRR on NOAA and Metop polar orbiting satellites. The product covers the Atlantic High Latitudes, is delivered on a 5km polar stereographic grid and expressed in W/m2.
GRIB 300KB 1 (per day) Download
OSI SAF Atlantic High Latitude Sea Surface Temperature - Multimission
Regional Europe
Calculation of underskin temperature (°C) with multispectral algorithm. The product covers the Atlantic High Latitudes and is delivered twice daily on a 5km polar stereographic grid.
GRIB 150KB 2 (per day) Download
23
EUM/OPS/DOC/13/707607 v1, 3 June 2013
EUMETCast-Africa Dissemination Baseline Overview
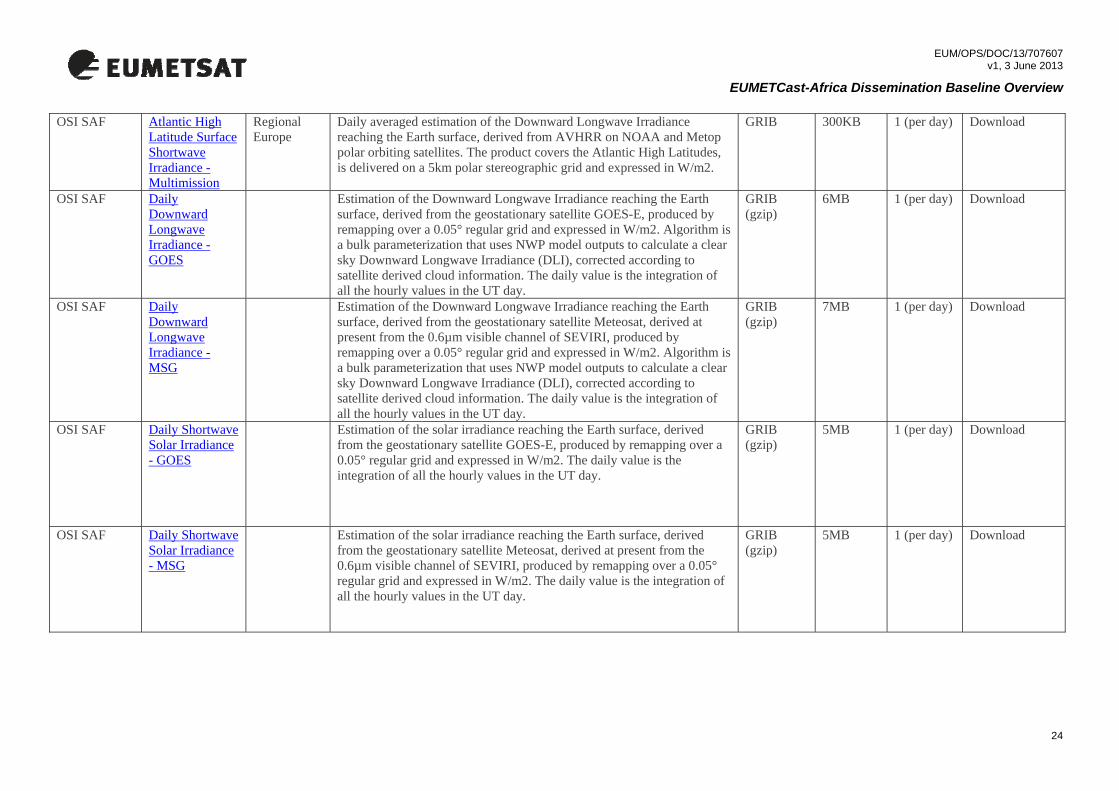
OSI SAF Atlantic High Latitude Surface Shortwave Irradiance - Multimission
Regional Europe
Daily averaged estimation of the Downward Longwave Irradiance reaching the Earth surface, derived from AVHRR on NOAA and Metop polar orbiting satellites. The product covers the Atlantic High Latitudes, is delivered on a 5km polar stereographic grid and expressed in W/m2.
GRIB 300KB 1 (per day) Download
OSI SAF Daily Downward Longwave Irradiance - GOES
Estimation of the Downward Longwave Irradiance reaching the Earth surface, derived from the geostationary satellite GOES-E, produced by remapping over a 0.05° regular grid and expressed in W/m2. Algorithm is a bulk parameterization that uses NWP model outputs to calculate a clear sky Downward Longwave Irradiance (DLI), corrected according to satellite derived cloud information. The daily value is the integration of all the hourly values in the UT day.
GRIB (gzip)
6MB 1 (per day) Download
OSI SAF Daily Downward Longwave Irradiance - MSG
Estimation of the Downward Longwave Irradiance reaching the Earth surface, derived from the geostationary satellite Meteosat, derived at present from the 0.6µm visible channel of SEVIRI, produced by remapping over a 0.05° regular grid and expressed in W/m2. Algorithm is a bulk parameterization that uses NWP model outputs to calculate a clear sky Downward Longwave Irradiance (DLI), corrected according to satellite derived cloud information. The daily value is the integration of all the hourly values in the UT day.
GRIB (gzip)
7MB 1 (per day) Download
OSI SAF Daily Shortwave Solar Irradiance - GOES
Estimation of the solar irradiance reaching the Earth surface, derived from the geostationary satellite GOES-E, produced by remapping over a 0.05° regular grid and expressed in W/m2. The daily value is the integration of all the hourly values in the UT day.
GRIB (gzip)
5MB 1 (per day) Download
OSI SAF Daily Shortwave Solar Irradiance - MSG
Estimation of the solar irradiance reaching the Earth surface, derived from the geostationary satellite Meteosat, derived at present from the 0.6µm visible channel of SEVIRI, produced by remapping over a 0.05° regular grid and expressed in W/m2. The daily value is the integration of all the hourly values in the UT day.
GRIB (gzip)
5MB 1 (per day) Download
24
EUM/OPS/DOC/13/707607 v1, 3 June 2013
EUMETCast-Africa Dissemination Baseline Overview
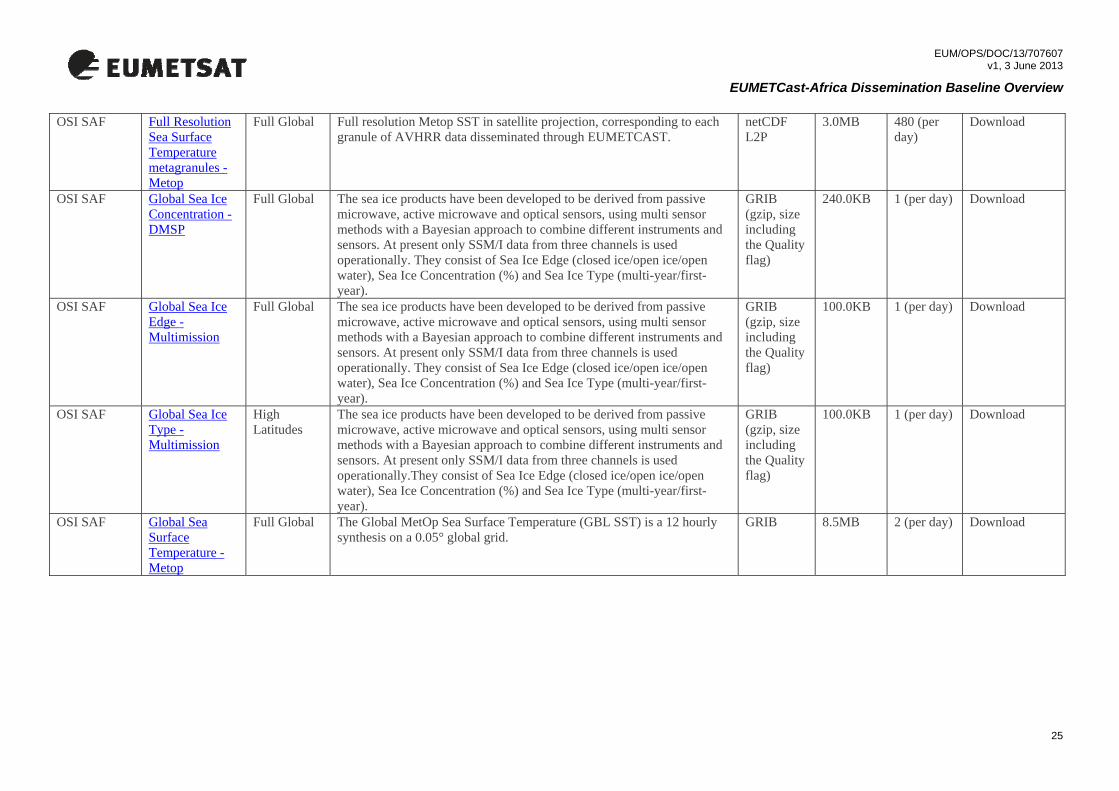
OSI SAF Full Resolution Sea Surface Temperature metagranules - Metop
Full Global Full resolution Metop SST in satellite projection, corresponding to each granule of AVHRR data disseminated through EUMETCAST.
netCDF L2P
3.0MB 480 (per day)
Download
OSI SAF Global Sea Ice Concentration - DMSP
Full Global The sea ice products have been developed to be derived from passive microwave, active microwave and optical sensors, using multi sensor methods with a Bayesian approach to combine different instruments and sensors. At present only SSM/I data from three channels is used operationally. They consist of Sea Ice Edge (closed ice/open ice/open water), Sea Ice Concentration (%) and Sea Ice Type (multi-year/first-year).
GRIB (gzip, size including the Quality flag)
240.0KB 1 (per day) Download
OSI SAF Global Sea Ice Edge - Multimission
Full Global The sea ice products have been developed to be derived from passive microwave, active microwave and optical sensors, using multi sensor methods with a Bayesian approach to combine different instruments and sensors. At present only SSM/I data from three channels is used operationally. They consist of Sea Ice Edge (closed ice/open ice/open water), Sea Ice Concentration (%) and Sea Ice Type (multi-year/first-year).
GRIB (gzip, size including the Quality flag)
100.0KB 1 (per day) Download
OSI SAF Global Sea Ice Type - Multimission
High Latitudes
The sea ice products have been developed to be derived from passive microwave, active microwave and optical sensors, using multi sensor methods with a Bayesian approach to combine different instruments and sensors. At present only SSM/I data from three channels is used operationally.They consist of Sea Ice Edge (closed ice/open ice/open water), Sea Ice Concentration (%) and Sea Ice Type (multi-year/first-year).
GRIB (gzip, size including the Quality flag)
100.0KB 1 (per day) Download
OSI SAF Global Sea Surface Temperature - Metop
Full Global The Global MetOp Sea Surface Temperature (GBL SST) is a 12 hourly synthesis on a 0.05° global grid.
GRIB 8.5MB 2 (per day) Download
25

EUM/OPS/DOC/13/707607 v1, 3 June 2013
EUMETCast-Africa Dissemination Baseline Overview
OSI SAF Hourly Downward Longwave Irradiance - GOES
Estimation of the Downward Longwave Irradiance reaching the Earth surface, derived from the geostationary satellite GOES-E, produced by remapping over a 0.05° regular grid and expressed in W/m2. Algorithm is a bulk parameterization that uses NWP model outputs to calculate a clear sky Downward Longwave Irradiance (DLI), corrected according to satellite derived cloud information. An essential point is the calculation of products interpolated at rounded UT hours. A radiative flux calculated on a satellite image is not homogeneous in time (the pixel time varies from north to south, of about 24 minutes for GOES-E data).
GRIB (gzip)
6MB 24 (per day)
Download
OSI SAF Hourly Downward Longwave Irradiance - MSG
Estimation of the Downward Longwave Irradiance reaching the Earth surface, derived from the geostationary satellite Meteosat, derived at present from the 0.6µm visible channel of SEVIRI, produced by remapping over a 0.05° regular grid and expressed in W/m2. Algorithm is a bulk parameterization that uses NWP model outputs to calculate a clear sky Downward Longwave Irradiance (DLI), corrected according to satellite derived cloud information. An essential point is the calculation of products interpolated at rounded UT hours. A radiative flux calculated on a satellite image is not homogeneous in time (the pixel time varies from north to south, of about 12 minutes for Meteosat data).
GRIB (gzip)
7MB 24 (per day)
Download
OSI SAF Hourly Sea Surface Temperature - GOES
Calculation of underskin temperature (°K) with multispectral algorithm. Operational products are produced by remapping over a 0.05° regular grid SST fields obtained by collecting all SST data available from various slots within one hour. The present GOES-E platform (GOES-13) does not have a 12 micron channel enabling daytime SST calculations; GOES-E derived SST are restricted to nighttime conditions.
GRIB (gzip)
1.7MB 24 (per day)
Download
OSI SAF Hourly Sea Surface Temperature - MSG
Full Global Calculation of underskin temperature (°K) with multispectral algorithm. Operational products are produced by remapping over a 0.05° regular grid SST fields obtained by aggregating all SST data available in one hour time, the priority being given to the value the closest in time to the product nominal hour.
GRIB (gzip)
2.5MB 24 (per day)
Download
26

EUM/OPS/DOC/13/707607 v1, 3 June 2013
EUMETCast-Africa Dissemination Baseline Overview
OSI SAF Hourly Shortwave Solar Irradiance - GOES
Estimation of the solar irradiance reaching the Earth surface, derived from the geostationary satellite GOES-E, produced by remapping over a 0.05° regular grid and expressed in W/m2. Algorithm is a physical parameterization applied separately to every pixel of a satellite image to derive an instantaneous field of the Solar Surface Irradiance. An essential point is the calculation of products interpolated at rounded UT hours. A radiative flux calculated on a satellite image is not homogeneous in time (the pixel time varies from north to south, of about 24 minutes for GOES-E data).
GRIB (gzip)
2MB 24 (per day)
Download
OSI SAF Hourly Shortwave Solar Irradiance - MSG
Estimation of the solar irradiance reaching the Earth surface, derived from the geostationary satellite Meteosat, derived at present from the 0.6µm visible channel of SEVIRI, produced by remapping over a 0.05° regular grid and expressed in W/m2. Algorithm is a physical parameterization applied separately to every pixel of a satellite image to derive an instantaneous field of the Solar Surface Irradiance. An essential point is the calculation of products interpolated at rounded UT hours. A radiative flux calculated on a satellite image is not homogeneous in time (the pixel time varies from north to south, of about 12 minutes for Meteosat data).
GRIB (gzip)
5MB 24 (per day)
Download
OSI SAF Low Resolution Sea Ice Drift - Multimission
Full Global Ice motion vectors with a time span of 48 hours are estimated by an advanced cross-correlation method (the Continuous MCC, CMCC) on pairs of satellite images. Several single-sensor products are available, along with a merged (multi-sensor) dataset. Due to high atmospheric Liquid Water Content and to ice surface melting, it is not possible to track ice motion during Arctic summer, from the channels we are processing. Accordingly, the NH product files distributed between 1 May and 30 September do not contain any valid vector.
netCDF 140.0KB 1 (per day) Download
OSI SAF North Atlantic and Regional Sea Surface Temperature - Multimission
Regional Ocean Northern Hemisphere
Sea surface temperature for the NAR (Northern Atlantic and Regional Seas) based on Metop & NOAA-19 AVHRR data.
GRIB 4.5MB 2 (per day) Download
27

EUM/OPS/DOC/13/707607 v1, 3 June 2013
EUMETCast-Africa Dissemination Baseline Overview
PML Composite Ocean Products - Multimission - AMESD Regions
These products are 3-day composites of the MODIS near-real-time ocean products. These are combined versions of all satellite passes over an area within the compositing period. Part of the EAMNET and AMESD projects. Regional data is available for east and north east of Madagascar, Cape Verde, Mozambique, Nigeria, South Somalia (SSomalia) and Tanzania.
netCDF (MODIS)
10.0MB Variable -
PML Near Real Time Ocean Products - Multimission - Africa
Mapped ocean data products from NASA's MODIS (Aqua) sensor, including chlorophyll-a, sea surface temperature, K490 (turbidity) and water leaving radiances. Regional data available for Algeria, Egypt, Ghana, Libya, Mozambique, Morocco (North), Red Sea, Sierra Leone, or Morocco (South). Part of the EAMNET and AMESD projects.
netCDF (MODIS)
1.0MB 24 (2 per area, per day)
-
PML Near Real Time Ocean Products - Multimission - AMESD Regions
Near real time products from NASA's MODIS (Aqua) sensor, including chlorophyll-a, sea surface temperature, K490 (turbidity) and water leaving radiances. Part of the EAMNET and AMESD projects. Regional data is available for east and north east of Madagascar, Cape Verde, Mozambique, Nigeria, South Somalia (SSomalia) and Tanzania.
netCDF (MODIS)
1.0MB 4 (per day) -
PML Refined Ocean Products - Aqua - Africa
Mapped ocean data products from NASA's MODIS (Aqua) sensor, including chlorophyll-a, sea surface temperature, K490 (turbidity) and water leaving radiances. Regional data available for Algeria, Egypt, Ghana, Libya, Mozambique, Morocco (North), Red Sea, Sierra Leone, or Morocco (South). Part of the DevCoCast, EAMNET and AMESD projects.
netCDF (MODIS)
2.0MB 24 (2 per area, per day)
-
PML Refined Ocean Products - Aqua - AMESD Regions
These are ocean products for the AMESD regions of the African coastline and are the MODIS 'refined mode' version of the near-real-time (NRT) products already distributed under the AMESD project. The refined mode versions use accurate atmospheric measurements vs. estimates in the NRT and are produced after a week or two delay. Regional data is available for the Indian Ocean: east and north east of Madagascar, Cape Verde, Mozambique, Nigeria, South Somalia (SSomalia) and Tanzania.
netCDF (MODIS)
2.0MB Variable -
UCT Ocean Colour Products - MODIS - Aqua
Sub-Saharan African coastal seas
MODIS Aqua SST and Ocean Colour products. Daily at 1 km resolution, OC3v6 default products: Chlorophyll-A, Kd490, fluorescence line height. Regional data available for Angola, Ivory Coast, South Africa (East), Guinea, Namibia, Somalia (North), Senegal, South Africa (South), Tanzania or South Africa (West).
netCDF format, bz2 compressed
1.0MB 1 (per day) -
28
EUM/OPS/DOC/13/707607 v1, 3 June 2013
EUMETCast-Africa Dissemination Baseline Overview
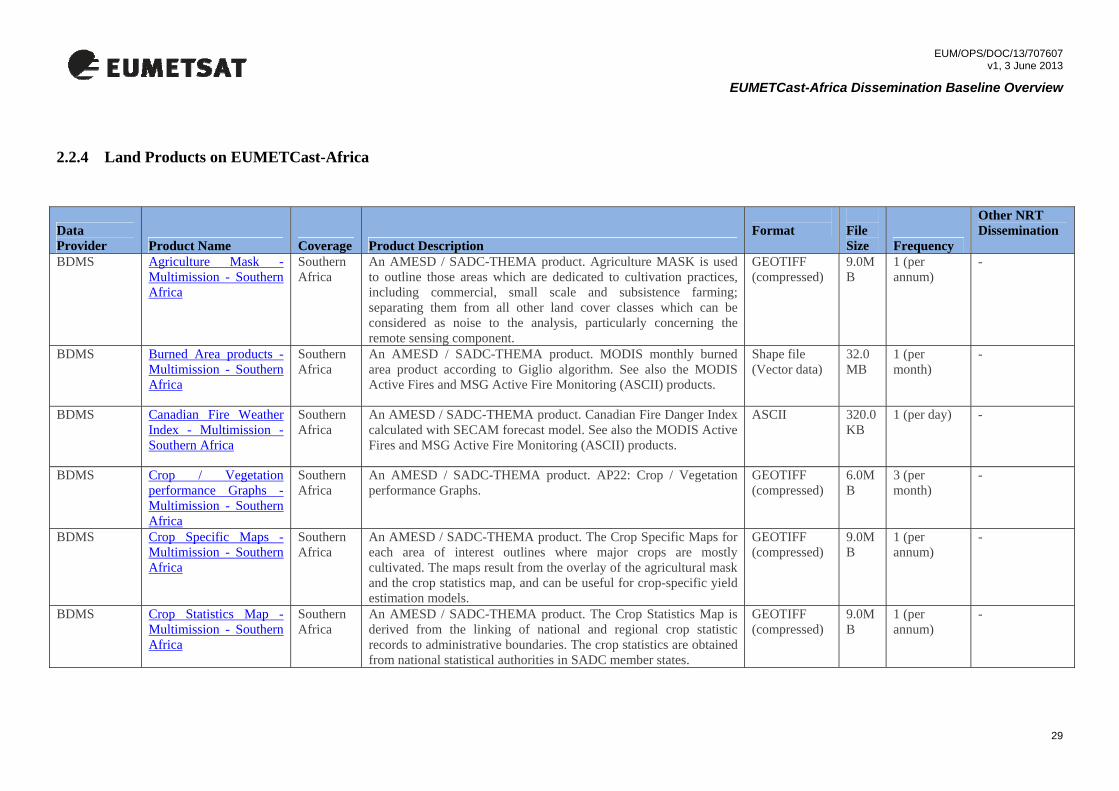
2.2.4 Land Products on EUMETCast-Africa
Data Provider Product Name Coverage Product Description
Format
File Size Frequency
Other NRT Dissemination
BDMS Agriculture Mask - Multimission - Southern Africa
Southern Africa
An AMESD / SADC-THEMA product. Agriculture MASK is used to outline those areas which are dedicated to cultivation practices, including commercial, small scale and subsistence farming; separating them from all other land cover classes which can be considered as noise to the analysis, particularly concerning the remote sensing component.
GEOTIFF (compressed)
9.0MB
1 (per annum)
-
BDMS Burned Area products - Multimission - Southern Africa
Southern Africa
An AMESD / SADC-THEMA product. MODIS monthly burned area product according to Giglio algorithm. See also the MODIS Active Fires and MSG Active Fire Monitoring (ASCII) products.
Shape file (Vector data)
32.0MB
1 (per month)
-
BDMS Canadian Fire Weather Index - Multimission - Southern Africa
Southern Africa
An AMESD / SADC-THEMA product. Canadian Fire Danger Index calculated with SECAM forecast model. See also the MODIS Active Fires and MSG Active Fire Monitoring (ASCII) products.
ASCII 320.0KB
1 (per day) -
BDMS Crop / Vegetation performance Graphs - Multimission - Southern Africa
Southern Africa
An AMESD / SADC-THEMA product. AP22: Crop / Vegetation performance Graphs.
GEOTIFF (compressed)
6.0MB
3 (per month)
-
BDMS Crop Specific Maps - Multimission - Southern Africa
Southern Africa
An AMESD / SADC-THEMA product. The Crop Specific Maps for each area of interest outlines where major crops are mostly cultivated. The maps result from the overlay of the agricultural mask and the crop statistics map, and can be useful for crop-specific yield estimation models.
GEOTIFF (compressed)
9.0MB
1 (per annum)
-
BDMS Crop Statistics Map - Multimission - Southern Africa
Southern Africa
An AMESD / SADC-THEMA product. The Crop Statistics Map is derived from the linking of national and regional crop statistic records to administrative boundaries. The crop statistics are obtained from national statistical authorities in SADC member states.
GEOTIFF (compressed)
9.0MB
1 (per annum)
-
29

EUM/OPS/DOC/13/707607 v1, 3 June 2013
EUMETCast-Africa Dissemination Baseline Overview
Data Provider Product Name Coverage Product Description
Format
File Size
Other NRT Dissemination
Frequency BDMS Cumulate dry matter
productivity comparison with average maps - Multimission - Southern Africa
Southern Africa
An AMESD / SADC-THEMA product. Graphs representing the trend of the dekadal dry matter productivity from the start of the season to the current period. The graphs will also show the comparison of the current season with average seasonal trends. These graphs will be plotted using the dekadal dry matter productivity averaged per zone of season. The graphs will be plotted for the period September-April.
GEOTIFF (compressed)
14.0MB
3 (per month)
-
BDMS Cumulate dry matter productivity graphs - Multimission - Southern Africa
Southern Africa
An AMESD / SADC-THEMA product. A map representing the sum of the dekadal dry matter productivity maps from the start of the season to the current period. This map provides an indicator of the performance of the crops and vegetation in general.
GEOTIFF (compressed)
6.0MB
3 (per month)
-
BDMS Cumulate dry matter productivity map - Multimission - Southern Africa
Southern Africa
An AMESD / SADC-THEMA product. This is the sum of the DMP from start of season (First dekad of September) to the current period. Calculated for the period September-April.
GEOTIFF (compressed)
40.0MB
3 (per month)
-
BDMS Cumulate Rainfall Map - Multimission - Southern Africa
Southern Africa
An AMESD / SADC-THEMA product. This is the sum of the rainfall measurements from Remote sensing from start of season (First dekad of September ) to the current period.
GEOTIFF (compressed)
9.0MB
3 (per month)
-
BDMS Cumulate Rainfall Map compared with Average (% Anomaly) - Multimission - Southern Africa
Southern Africa
An AMESD / SADC-THEMA product. Map of current cumulate Rainfall (from Remote sensing) compared with the Long Term Average values for assessment and detection of possible anomalies (%). The product is calculated as follows: (Current t cumulate Rainfall ¿ LTAvg t cumulate Rainfall)*100 / LTAvg cumulate Rainfall.
GEOTIFF (compressed)
4.0MB
3 (per month)
-
BDMS Current Condition Cumulate Rainfall Map - Multimission - Southern Africa
Southern Africa
An AMESD / SADC-THEMA product. This is the sum of the rainfall measurements from ground rain gauges from start of season (first dekad of September) to the current period.
GEOTIFF (compressed)
2.0MB
3 (per month)
-
BDMS Current Conditions Air Temperature Map - Multimission - Southern Africa
Southern Africa
An AMESD / SADC-THEMA product. Ten Day temperature map from ground measurements interpolated to create a 1x1 km grid in Geographic Lat/Long projection.
GEOTIFF (compressed)
300.0MB
3 (per month)
-
30

EUM/OPS/DOC/13/707607 v1, 3 June 2013
EUMETCast-Africa Dissemination Baseline Overview
Data Provider Product Name Coverage Product Description
Format
File Size
Other NRT Dissemination
Frequency BDMS Current Conditions
Rainfall Map - Multimission - Southern Africa
Southern Africa
An AMESD / SADC-THEMA product. Ten Day Rainfall totals from ground rain gauges interpolated to create a 1x1 km grid in Geographic Lat/Long projection.
GEOTIFF (compressed)
500.0KB
3 (per month)
-
BDMS Current Rainfall Estimates Map - Multimission - Southern Africa
Southern Africa
An AMESD / SADC-THEMA product. Satellite rainfall estimates using Meteosat, the Special Sensor Microwave/Imager (SSM/I) on board Defense Meteorological Satellite Program satellites, and the Advanced Microwave Sounding Unit (AMSU) on board NOAA satellites.
GEOTIFF (compressed)
5.0MB
3 (per month)
-
BDMS Current Water Requirements Satisfaction Index (WRSI) Map - Multimission - Southern Africa
Southern Africa
The moisture index (MI) is an agrometeorological indicator defined by a simple supply/demand ratio, then multiplied by 100 to provide a percent value. The MI is determined by [(PPT + SW) / PET] * 100 where PPT is the 10-day accumulated rainfall (mm), SW is the 10-day accumulated available soil water (mm), and PET is the 10-day accumulated potential ET (mm).
GEOTIFF (compressed)
500.0KB
3 (per month)
-
BDMS Drought risk map (Boolean type) (DP13) - Southern Africa
Southern Africa
An image based on the observed rainfall anomalies coupled with the expected anomalies based on the three-month forecast from the SAWS. Only two values, with areas probably at risk of drought conditions (based on the combination of information) indicated with a value of 1 and the rest with a value of 0. An AMESD / SADC-THEMA product.
GEOTIFF (compressed, 8-bit)
2.0MB
1 (per month)
-
BDMS Drought risk map (Graded type) (DP14) - Southern Africa
Southern Africa
An image based on the observed rainfall anomalies coupled with the expected anomalies based on the three-month forecast from the SAWS. Both the observed rainfall and the rainfall forecast are scaled in order to yield a product that indicates the areas with the greatest risk of being drought stressed within three months with a value of 100 down to the least drought stressed regions with a value of 0. An AMESD / SADC-THEMA product.
GEOTIFF (compressed, 8-bit)
2.0MB
1 (per month)
-
BDMS Graph of Cumulate Rainfall of the current season compared to the LTA, LTMax, LTMin - Multimission - Southern Africa
Southern Africa
An AMESD / SADC-THEMA product. Graphs showing Cumulate Rainfall trends for the current season and the average , maximum amd minimum per current season rainfall administrative areas.
GEOTIFF (compressed)
5.0MB
3 (per month)
-
31

EUM/OPS/DOC/13/707607 v1, 3 June 2013
EUMETCast-Africa Dissemination Baseline Overview
Data Provider Product Name Coverage Product Description
Format
File Size
Other NRT Dissemination
Frequency BDMS Graph of Rainfall Events
in the Current Season - Multimission - Southern Africa
Southern Africa
An AMESD / SADC-THEMA product. Current season rainfall events graph computed by extracting average rainfall values for administrative areas from the current season rainfall maps.
GEOTIFF (compressed)
7.0MB
3 (per month)
-
BDMS Graphs based on area within polygon where an index is lower than a specific cut-off value (DP16) - Southern Africa
Southern Africa
Graph representing the current and long term average cummulative NDVI from July-June pre administrative area. This graph provides an indicator of vegetation perfomance at district level. An AMESD / SADC-THEMA product.
TIFF (zipped) 10.0MB
1 every 10 days
-
BDMS Graphs based on average value of summarising polygon (DP15) - Southern Africa
Southern Africa
Percentage of Long term average rainfall Graph computed per administrative area showing the latest 12 months of data. An AMESD / SADC-THEMA product.
PNG (zipped) 10.0MB
1 every 10 days
-
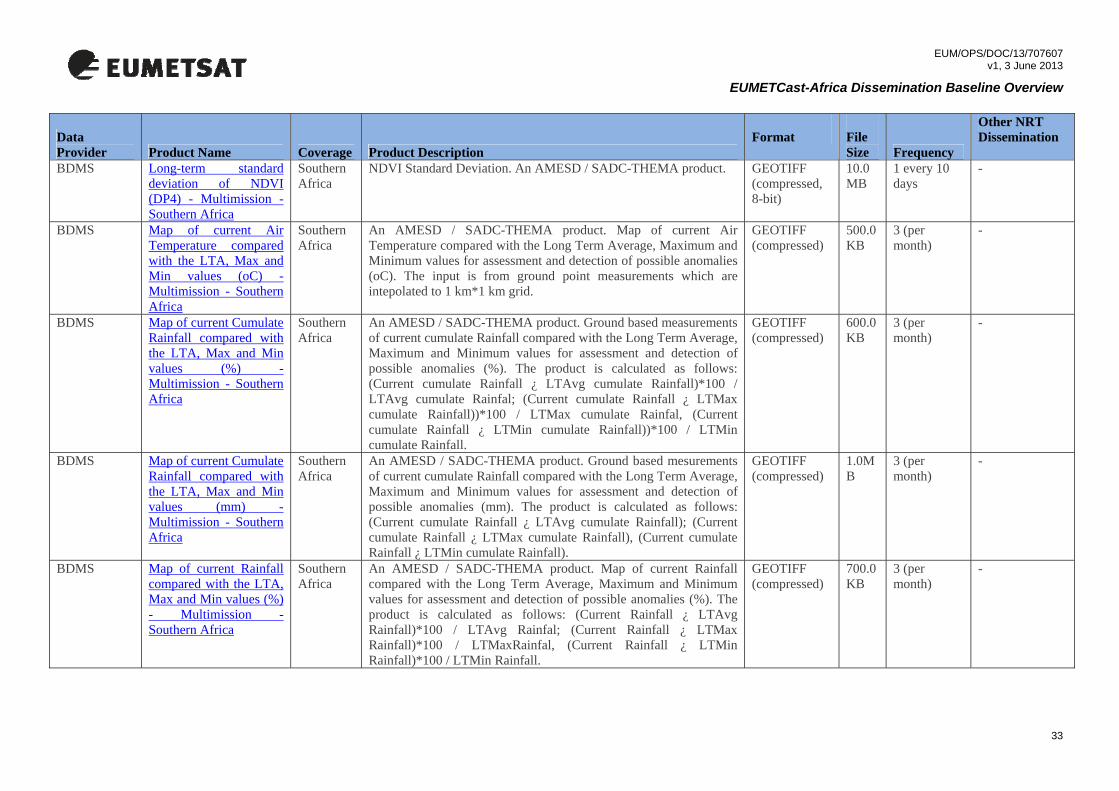
BDMS Long-term average cumulative NDVI (DP3) - Multimission - Southern Africa
Southern Africa
Long-term average cumulative NDVI. An AMESD / SADC-THEMA product.
GEOTIFF (compressed, 8-bit)
38.0MB
1 every 10 days
-
BDMS Long-term average NDVI (DP2) - Multimission - Southern Africa
Southern Africa
Long-term average NDVI. An AMESD / SADC-THEMA product. GEOTIFF (compressed, 8-bit)
10.0MB
1 every 10 days
-
BDMS Long-term average rainfall Ten-daily (DP11) - Southern Africa
Southern Africa
Long-term average rainfall per dekad in mm. An AMESD / SADC-THEMA product.
GEOTIFF (compressed, 8-bit)
2.0MB
1 every 10 days
-
BDMS Long-term maximum of NDVI (DP5) - Multimission - Southern Africa
Southern Africa
Maximum of NDVI. An AMESD / SADC-THEMA product. GEOTIFF (compressed, 8-bit)
10.0MB
1 every 10 days
-
BDMS Long-term minimum of NDVI (DP6) - Multimission - Southern Africa
Southern Africa
Minimum of NDVI. An AMESD / SADC-THEMA product. GEOTIFF (compressed, 8-bit)
12.0MB
1 every 10 days
-
32
EUM/OPS/DOC/13/707607 v1, 3 June 2013
EUMETCast-Africa Dissemination Baseline Overview
Data Provider Product Name Coverage Product Description
Format
File Size
Other NRT Dissemination
Frequency BDMS Long-term standard
deviation of NDVI (DP4) - Multimission - Southern Africa
Southern Africa
NDVI Standard Deviation. An AMESD / SADC-THEMA product. GEOTIFF (compressed, 8-bit)
10.0MB
1 every 10 days
-
BDMS Map of current Air Temperature compared with the LTA, Max and Min values (oC) - Multimission - Southern Africa
Southern Africa
An AMESD / SADC-THEMA product. Map of current Air Temperature compared with the Long Term Average, Maximum and Minimum values for assessment and detection of possible anomalies (oC). The input is from ground point measurements which are intepolated to 1 km*1 km grid.
GEOTIFF (compressed)
500.0KB
3 (per month)
-
BDMS Map of current Cumulate Rainfall compared with the LTA, Max and Min values (%) - Multimission - Southern Africa
Southern Africa
An AMESD / SADC-THEMA product. Ground based measurements of current cumulate Rainfall compared with the Long Term Average, Maximum and Minimum values for assessment and detection of possible anomalies (%). The product is calculated as follows: (Current cumulate Rainfall ¿ LTAvg cumulate Rainfall)*100 / LTAvg cumulate Rainfal; (Current cumulate Rainfall ¿ LTMax cumulate Rainfall))*100 / LTMax cumulate Rainfal, (Current cumulate Rainfall ¿ LTMin cumulate Rainfall))*100 / LTMin cumulate Rainfall.
GEOTIFF (compressed)
600.0KB
3 (per month)
-
BDMS Map of current Cumulate Rainfall compared with the LTA, Max and Min values (mm) - Multimission - Southern Africa
Southern Africa
An AMESD / SADC-THEMA product. Ground based mesurements of current cumulate Rainfall compared with the Long Term Average, Maximum and Minimum values for assessment and detection of possible anomalies (mm). The product is calculated as follows: (Current cumulate Rainfall ¿ LTAvg cumulate Rainfall); (Current cumulate Rainfall ¿ LTMax cumulate Rainfall), (Current cumulate Rainfall ¿ LTMin cumulate Rainfall).
GEOTIFF (compressed)
1.0MB
3 (per month)
-
BDMS Map of current Rainfall compared with the LTA, Max and Min values (%) - Multimission - Southern Africa
Southern Africa
An AMESD / SADC-THEMA product. Map of current Rainfall compared with the Long Term Average, Maximum and Minimum values for assessment and detection of possible anomalies (%). The product is calculated as follows: (Current Rainfall ¿ LTAvg Rainfall)*100 / LTAvg Rainfal; (Current Rainfall ¿ LTMax Rainfall)*100 / LTMaxRainfal, (Current Rainfall ¿ LTMin Rainfall)*100 / LTMin Rainfall.
GEOTIFF (compressed)
700.0KB
3 (per month)
-
33

EUM/OPS/DOC/13/707607 v1, 3 June 2013
EUMETCast-Africa Dissemination Baseline Overview
Data Provider Product Name Coverage Product Description
Format
File Size
Other NRT Dissemination
Frequency BDMS Map of current Rainfall
compared with the LTA, Max and Min values (mm) - Multimission - Southern Africa
Southern Africa
An AMESD / SADC-THEMA product. Map of current Rainfall compared with the Long Term Average, Maximum and Minimum values for assessment and detection of possible anomalies (mm). The product is calculated as follows: (Current Rainfall / LTAvg Rainfall); (Current Rainfall / LTMax Rainfall), (Current Rainfall / LTMin Rainfall).
GEOTIFF (compressed)
500.0KB
3 (per month)
-
BDMS NDVI difference (DP1) - Multimission - Southern Africa
Southern Africa
Drought Severity Index - NDVI compared to long-term average. An AMESD / SADC-THEMA product.
GEOTIFF (compressed, 8-bit)
15.0MB
1 every 10 days
-
BDMS Onset of rains anomaly maps - Multimission - Southern Africa
Southern Africa
An AMESD / SADC-THEMA product. Calculated as: Current Onset of rainfall - the long-term average.
GEOTIFF (compressed)
600.0KB
3 (per month)
-
BDMS Onset of Rains Maps - Multimission - Southern Africa
Southern Africa
An AMESD / SADC-THEMA product. The onset-of-rains is determined using a threshold amount and distribution of rainfall received in three consecutive dekads. Onset of rain is established when there is at least 25 mm of rainfall in one dekad followed by a total of at least 20 mm of rainfall in the next two consecutive decades.
GEOTIFF (compressed)
9.0MB
3 (per month)
-
BDMS Percentage of Average Seasonal Greenness (DP9) - Multimission - Southern Africa
Southern Africa
Percentage of Average Seasonal Greenness - Cumulative NDVI compared to long-term cumulative NDVI, expressed as a precentage. An AMESD / SADC-THEMA product.
GEOTIFF (compressed, 8-bit)
20.0MB
1 every 10 days
-
BDMS Percentage of long-term average rainfall: Ten-daily or longer period (DP12) - Southern Africa
Southern Africa
Rainfall for a period (usually for the month, or for rainfall accumulated over several months) expressed in percentage values ranging from 0% through 100% to 1,000%. An AMESD / SADC-THEMA product.
GEOTIFF (compressed, 8-bit)
2.0MB
1 every 10 days
-
BDMS Rainfall decile (DP17) - Southern Africa
Southern Africa
Deciles provide a measure of the spread of rainfall experienced in the past. Rainfall in the current year can be compared against decile information to see where it stands in relation to historical records. The monthly rainfall deciles are calculated by ranking the totals in ascending order, and then splitting the data into 10 equally sized
TIFF (compressed, 8-bit)
10.0MB
1 (per month)
-
34

EUM/OPS/DOC/13/707607 v1, 3 June 2013
EUMETCast-Africa Dissemination Baseline Overview
Data Provider Product Name Coverage Product Description
Format
File Size
Other NRT Dissemination
Frequency groups. An AMESD / SADC-THEMA product.
BDMS Rainfall Estimates Compared with average [%] - Multimission - Southern Africa
Southern Africa
An AMESD / SADC-THEMA product. Map of current Rainfall (from remote sensing)compared with the Long Term Averagefor assessment and detection of possible anomalies (%). The product is calculated as follows: (Current Rainfall ¿ LTAvg Rainfall)*100 / LTAvg Rainfall.
GEOTIFF (compressed)
4.0MB
3 (per month)
-
BDMS Rainfall Estimates Compared with average [difference] - Multimission - Southern Africa
Southern Africa
An AMESD / SADC-THEMA product. Map of current Rainfall (from remote sensing) compared with the Long Term Average for assessment and detection of possible anomalies (mm). The product is calculated as follows: (Current Rainfall / LTAvg Rainfall).
GEOTIFF (compressed)
4.0MB
3 (per month)
-
BDMS Soil Moisture Index Maps - Multimission - Southern Africa
Southern Africa
An AMESD / SADC-THEMA product. The moisture index (MI) is an agrometeorological indicator defined by a simple supply/demand ratio, then multiplied by 100 to provide a percent value. The MI is determined by [(PPT + SW) / PET] * 100 where PPT is the 10-day accumulated rainfall (mm), SW is the 10-day accumulated available soil water (mm), and PET is the 10-day accumulated potential ET (mm).
GEOTIFF (compressed)
600.0KB
3 (per month)
-
BDMS Standardised Difference Vegetation Index (SDVI) (DP8) - Multimission - Southern Africa
Southern Africa
Standardised Difference Vegetation Index - NDVI compared to the long-term Standard Deviation. An AMESD / SADC-THEMA product.
GEOTIFF (compressed, 8-bit)
20.0MB
1 every 10 days
-
BDMS Total cumulative rainfall monthly, seasonal so far (DP10) - Southern Africa
Southern Africa
Total observed accumulated rainfall since July or January up to a 12-month period in mm. An AMESD / SADC-THEMA product.
GEOTIFF (compressed, 8-bit)
2.0MB
1 every 10 days
-
BDMS Vegetation Condition Index (DP7) - Multimission - Southern Africa
Southern Africa
Vegetation Condition Index - NDVI compared to long-term minimum and maximum expressed as a percentage. An AMESD / SADC-THEMA product.
GEOTIFF (compressed, 8-bit)
10.0MB
1 every 10 days
-
35

EUM/OPS/DOC/13/707607 v1, 3 June 2013
EUMETCast-Africa Dissemination Baseline Overview
Data Provider Product Name Coverage Product Description
Format
File Size
Other NRT Dissemination
Frequency BDMS Vegetation Index
Compared with average [%] - Multimission - Southern Africa
Southern Africa
An AMESD / SADC-THEMA product. vegetation index anomaly as a percentage deviation from the average. Calculated as: (current NDVI- average NDVI )*100 / average NDVI.
GEOTIFF (compressed)
9.0MB
3 (per month)
-
BDMS Vegetation Index Compared with average [difference] - Multimission - Southern Africa
Southern Africa
An AMESD / SADC-THEMA product. Shows the vegetation deviation from the average. Calculated as: current NDVI- average NDVI.
GEOTIFF (compressed)
20.0MB
3 (per month)
-
BDMS WRSI Anomaly maps - Multimission - Southern Africa
Southern Africa
An AMESD / SADC-THEMA product. AP24: WRSI Anomaly maps
GEOTIFF (compressed)
500.0KB
3 (per month)
-
CMA Precipitation Estimation Product - 6 & 24 Hours - FengYun 2D
Full Disk from 86.5 degrees E
Precipitation estimation product - 6 and 24 hours. AWX 1.0MB
1 or 4 (per day)
-
CMA Precipitation Estimation Product - 6 & 24 Hours - FengYun 2E
Full Disk from 105 degrees E
Precipitation estimation product - 6 and 24 hours. AWX 1.0MB
1 or 4 (per day)
-
CSIR Canadian Fire Weather Index - CCAM Model - Southern Africa
Southern Africa
Canadian Fire Weather Index calculated with CCAM forecast model covering the whole Southern Africa
Gridded ASCII
320.0KB
1 (per day) -
CSIR Lowveld Fire Danger Index
South Africa
A DevCoCast product, the current fire danger rating model used in parts of South Africa is an adaptation of a Fire Hazard Index developed by Michael Laing in Zimbabwe in 1968. The basic model uses the same inputs as the McArthur models, which are scaled to produce a simple model that can calculate numbers easily without needing any complex calculations. It is often referred to as the Lowveld Fire Danger System since this is where it has been most widely used. Note that the process by which the system was developed, and the assumptions that were made, were never
ASCII 250.0KB
1 (per day) -
36
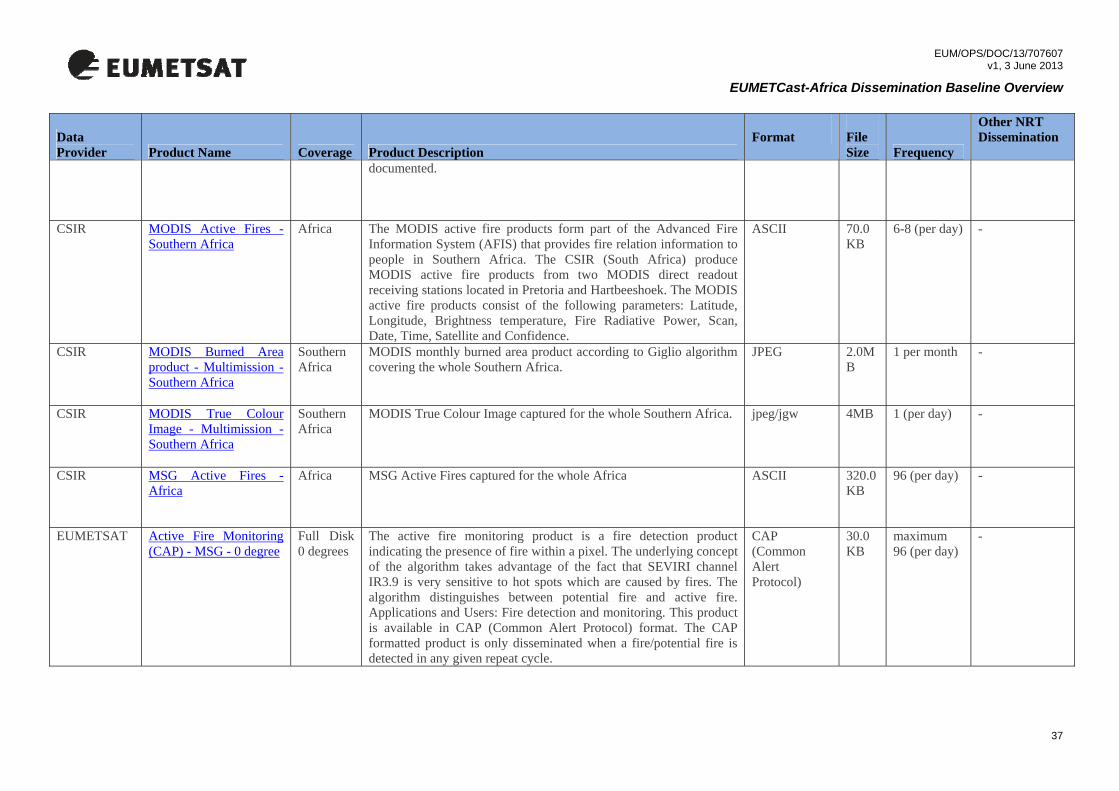
EUM/OPS/DOC/13/707607 v1, 3 June 2013
EUMETCast-Africa Dissemination Baseline Overview
Data Provider Product Name Coverage Product Description
Format
File Size
Other NRT Dissemination
Frequency documented.
CSIR MODIS Active Fires - Southern Africa
Africa The MODIS active fire products form part of the Advanced Fire Information System (AFIS) that provides fire relation information to people in Southern Africa. The CSIR (South Africa) produce MODIS active fire products from two MODIS direct readout receiving stations located in Pretoria and Hartbeeshoek. The MODIS active fire products consist of the following parameters: Latitude, Longitude, Brightness temperature, Fire Radiative Power, Scan, Date, Time, Satellite and Confidence.
ASCII 70.0KB
6-8 (per day) -
CSIR MODIS Burned Area product - Multimission - Southern Africa
Southern Africa
MODIS monthly burned area product according to Giglio algorithm covering the whole Southern Africa.
JPEG 2.0MB
1 per month -
CSIR MODIS True Colour Image - Multimission - Southern Africa
Southern Africa
MODIS True Colour Image captured for the whole Southern Africa.
jpeg/jgw 4MB 1 (per day) -
CSIR MSG Active Fires - Africa
Africa MSG Active Fires captured for the whole Africa
ASCII 320.0KB
96 (per day) -
EUMETSAT Active Fire Monitoring (CAP) - MSG - 0 degree
Full Disk 0 degrees
The active fire monitoring product is a fire detection product indicating the presence of fire within a pixel. The underlying concept of the algorithm takes advantage of the fact that SEVIRI channel IR3.9 is very sensitive to hot spots which are caused by fires. The algorithm distinguishes between potential fire and active fire. Applications and Users: Fire detection and monitoring. This product is available in CAP (Common Alert Protocol) format. The CAP formatted product is only disseminated when a fire/potential fire is detected in any given repeat cycle.
CAP (Common Alert Protocol)
30.0KB
maximum 96 (per day)
-
37

EUM/OPS/DOC/13/707607 v1, 3 June 2013
EUMETCast-Africa Dissemination Baseline Overview
Data Provider Product Name Coverage Product Description
Format
File Size
Other NRT Dissemination
Frequency EUMETSAT Active Fire Monitoring
(GRIB) - MSG - 0 degree
Full Disk 0 degrees
The active fire monitoring product is a fire detection product indicating the presence of fire within a pixel. The underlying concept of the algorithm takes advantage of the fact that SEVIRI channel IR3.9 is very sensitive to hot spots which are caused by fires. The algorithm distinguishes between potential fire and active fire. Applications and Users: Fire detection and monitoring.
GRIB 20.0KB
96 (per day) -
EUMETSAT ASCAT Soil Moisture at 12.5 km Swath Grid - Metop
Full Global, Global Land
The Surface Soil Moisture L2 product is derived from the Advanced SCATterometer (ASCAT) data and given in swath geometry. This product provides an estimate of the water saturation of the 5 cm topsoil layer, in relative units between 0 and 100 [%]. The algorithm used to derive this parameter is based on a linear relationship of soil moisture and scatterometer backscatter and uses change detection techniques to eliminate the contributions of vegetation, land cover and surface topography, considered invariant from year to year. Seasonal vegetation effects are modelled by exploiting the multiple viewing capabilities of ASCAT. The processor has been developed by the Institute of Photogrammetry and Remote Sensing of the Vienna University of Technology. Note that some of the data are reprocessed. Please refer to the associated product validation reports or product release notes for further information.
BUFR 350.0KB
480 (per day)
GTS
EUMETSAT ASCAT Soil Moisture at 25 km Swath Grid - Metop
Full Global, Global Land
The Surface Soil Moisture L2 product is derived from the Advanced SCATterometer (ASCAT) data and given in swath geometry. This product provides an estimate of the water saturation of the 5 cm topsoil layer, in relative units between 0 and 100 [%]. The algorithm used to derive this parameter is based on a linear relationship of soil moisture and scatterometer backscatter and uses change detection techniques to eliminate the contributions of vegetation, land cover and surface topography, considered invariant from year to year. Seasonal vegetation effects are modelled by exploiting the multiple viewing capabilities of ASCAT. The processor has been developed by the Institute of Photogrammetry and Remote Sensing of the Vienna University of Technology. Note that some of the data are reprocessed. Please refer to the associated product validation reports or product release notes for further information.
BUFR 90.0KB
480 (per day)
GTS
38

EUM/OPS/DOC/13/707607 v1, 3 June 2013
EUMETCast-Africa Dissemination Baseline Overview
Data Provider Product Name Coverage Product Description
Format
File Size
Other NRT Dissemination
Frequency EUMETSAT Normalised Difference
Vegetation Index - MSG - 0 degree
Full Disk 0 Degree
The Normalised Difference Vegetation Index product is derived from the differences in the VIS reflectances. The daily NDVI product estimates the land surface characteristics derived from satellite data. It is widely used to characterize the density and vigour of the given vegetation cover as well as to identify vegetation stress and drought. Note that no NDVI retrievals will be conducted in cloudy or night time conditions.
HDF5 9.0MB
1 (per day) -
EUMETSAT Normalised Difference Vegetation Index Decadal - MSG - 0 degree
Full Disk 0 Degree
The decadal Normalised Difference Vegetation Index product is derived from the daily NDVI products. The NDVD is an aggregated product based on the daily NDVI products using the following aggregation periods: Aggregated NDVD product covering Days 1 to 10 of each month, Days 11 to 20 of each month and covering Day 21 to the last day of each month. The NDVD product estimates the land surface characteristics derived from satellite data. It is widely used to characterise the density and vigour of the given vegetation cover as well as to identify vegetation stress and drought. Applications and Users: Land surface applications. Used Input Data: Reflectances from the SEVIRI Level 1.5 image data for the VIS0.6 µm and the VIS0.8 µm channels.
HDF5 9.0MB
3 (per month)
-
INPE/CPTEC Colour Composite CCD-HRC - CBERS - Africa, South America
South America, Africa
A DevCoCast product, these level-2 color composites are created by a fusion process that combines the high-resolution CCD Camera's color bands and the High Resolution Camera's (HRC) panchromatic band. The composite scene (sector) images will have approximately the boundaries of the HRC imagery (27km swath), 10 meter average resolution and are radiometrically and geometrically corrected. They are broadcast as 3-band GeoTiff images, with a frequency of 1 scene per day over some regions (about 27x27 km) of Africa and one scene over South America.
GEOTIFF 7.0MB
1 (per day) -
INPE/CPTEC Fire Detection - GOES - South America
South America
A DevCoCast product, Fire Detection consists of an image that contains fire maps indicating hot spot occurrences in individual states of Brazil and other South American countries.
JPEG 200.0KB
24 (per day) -
39

EUM/OPS/DOC/13/707607 v1, 3 June 2013
EUMETCast-Africa Dissemination Baseline Overview
Data Provider Product Name Coverage Product Description
Format
File Size
Other NRT Dissemination
Frequency INPE/CPTEC Fire Detection -
Multimission - South America
South America
A DevCoCast product, the Fire Detection Product represents a set of products such as fire occurrence in individual states, occurrence in the South American countries, maps of fire risk, and smoke estimate and dispersion. Fire maps are derived from the NOAA 3.7um thermal band, MODIS and GOES thermal bands (especially band 2 on GOES and bands 20 and 21 on MODIS). Maps of Fire Risk are derived from the number of days without precipitation, air relative humidity, air temperature, distance of fire spots, and class of vegetation (predicted fire risk maps uses forecast modeling). Smoke estimate and dispersion products show carbon monoxide and other pollutants emitted by the fire spots. The model receives as input the AVHRR, GOES and MODIS fire observations and takes into account the type of vegetation being burned.
JPG 200.0KB
1 (per day) -
INPE/CPTEC Fire Detection ASCII - GOES - South America
South America
A DevCoCast product, the Fire Detection ASCII files consist of the set of geographical coordinates of each fire spot identified with GOES thermal images, assembled in ASCII files.
TAR ball (3 files)
30.0KB
24 (per day) -
INPE/CPTEC Fire Detection ASCII - NOAA - South America
South America
A DevCoCast product, the Fire Detection ASCII files consist of the set of geographical coordinates of each fire spot, identified on NOAA-AVHRR.
Shape file 10.0KB
2 (per day) -
INPE/CPTEC Normalized Difference Vegetation Index (15 day) - Multimission - South America
South America
A DevCoCast product, these NDVI images are computed from visible reflective and near-infrared channels data from NOAA AVHRR instrument (0.6 micrometre red channel and 0.8 micrometre near-infrared channel). Two mosaiced images are created every 15 days, the first 15 days interval mosaic and the second 15 days interval mosaic
GEOTIFF 24.0MB
2 (per month)
-
INPE/CPTEC Normalized Difference Vegetation Index (Monthly) - NOAA - Africa, South America
Africa, South America
A DevCoCast product, these NDVI images are computed from visible reflective and near-infrared channels data from NOAA AVHRR instrument (0.6 micrometre red channel and 0.8 micrometre near-infrared channel). Two mosaiced images are created every 15 days, the first 15 days interval mosaic and the second 15 days interval mosaic.
GEOTIFF (compressed)
24.0MB
1 (per month)
-
40

EUM/OPS/DOC/13/707607 v1, 3 June 2013
EUMETCast-Africa Dissemination Baseline Overview
Data Provider Product Name Coverage Product Description
Format
File Size
Other NRT Dissemination
Frequency INPE/CPTEC Number of Days
Without Rain / Dry Season Monitoring - Multimission - South America
South America
A DevCoCast product, Number of Days Without Rain (for dry season monitoring) indicates the number of days without convective rainfall, making use of GOES images and an hydro-estimator.
GEOTIFF (compressed)
250.0KB
1 (per day) -
INTA Anomaly of Normalised Difference Vegetation Index Map - NOAA - South America
South America
A DevCoCast product which depicts the current decade's NOAA AVHRR NDVI compared with the NDVI values of the same decade in the NDVI time series since 1996. The color coding identifies pixels where the current NDVI is: below the series mimimum (red); over the minimum but below the average (yellow); around the average (blue); over the average but below the maximum (light green); over the maximum (dark green).
GIF 300.0KB
3 (per month)
-
INTA Fire Danger Index - NOAA - South America
South America (Argentina)
A DevCoCast product, the 10 day Fire Danger Index (FDI) is obtained as the accumulated value of the fractional increment of the decadial NDVI (NDVIpres - NDVIprev) / (NDVIpres) among two consecutive decades (present and previous in the formula above). The accumulation process starts by the middle of the spring. The more negative the FDI the higher the risk of having a fire event. The output images are classified in four danger categories. The FDI is defined for grasslands and forestry areas, excluding intensive crop production areas.
GIF 300.0KB
3 (per month)
-
INTA Normalised Difference Vegetation Index Map - NOAA - South America
South America
A DevCoCast product, the 10-daily NDVI Map is calculated as the maximum NDVI for each pixel of a 10 days set of NOAA AVHRR input images.
GIF 300.0KB
3 (per month)
INTA Real Evapotranspiration - NOAA - South America
South America (Argentina)
A DevCoCast product, the ETR represents the amount of water, in mm/day, which is effectively evaporated from the ground surface and transpirated by the vegetation coverage. ETR values for each image pixel are calculated weekly from the best daily Normalized Difference Vegetation Index (NDVI) and surface temperature (Ts) images, as ETR = (-88.34 + 1.77 * Ts + 286.4 * NDVI) / 30
GIF 300.0KB
3 (per month)
41

EUM/OPS/DOC/13/707607 v1, 3 June 2013
EUMETCast-Africa Dissemination Baseline Overview
Data Provider Product Name Coverage Product Description
Format
File Size
Other NRT Dissemination
Frequency LSA SAF Downwelling Surface
LW Fluxes - MSG Europe, North Africa, South Africa, South America
Downwelling Surface Longwave Radiation Flux (DSLF)is the result of atmospheric absorption, emission and scattering within the entire atmospheric column and may be defined as the thermal irradiance reaching the surface in the thermal infrared spectrum (4-100mm). In clear sky situations DSLF depends on the vertical profiles of temperature and gaseous absorbers (primarily the water-vapour followed by CO2, and others of smaller importance like O3, CH4, N2O and CFCs). DSLF is directly related to the greenhouse effect and its monitoring has an important role in climate change studies. Other applications include meteorology (land applications) and oceanography (air-sea-ice interaction studies). Two products are operationally available, the first is available every 30 minutes and the second is a composite daily product (See distribution for details).
HDF5 4.0MB
48 (per day) Download
LSA SAF Downwelling Surface SW Fluxes - MSG
Europe, North Africa, South Africa, South America
The down-welling surface short-wave radiation flux (DSSF) refers to the radiative energy in the wavelength interval [0.3 microns, 4.0 microns] reaching the Earth's surface per time and surface unit. It essentially depends on the solar zenith angle, on cloud coverage, and to a lesser extent on atmospheric absorption and surface albedo. DSSF fields are crucial for a wide number of applications involving scientific domains like weather forecast, hydrology, climate, agriculture and environment-related studies. In numerical weather prediction and general circulation models of the atmosphere, satellite-derived DSSF estimates can either be used as a control variable or as a substitute to surface radiation measurement networks. Two products are operationally available, the first is available every 30 minutes and the second is a composite daily product (See distribution for details).
HDF5 3.0MB
48 (per day) Download
LSA SAF Evapotranspiration - MSG - 0 degree
Europe, North Africa, South Africa, South America
Evapotranspiration (ET) accounts for the flux of water evaporated at the Earth-atmosphere interface (from soil, water bodies and interception) and transpired by vegetation through stomata in its leaves as a consequence of photosynthetic processes. ET is an important component of the water cycle and it is associated with the latent heat flux (LE), a key link between the energy and water cycles. In other words, LE represents the energy needed for the ET
HDF5 1.0MB
4 files, one for each region (every 30 min)
Download
42

EUM/OPS/DOC/13/707607 v1, 3 June 2013
EUMETCast-Africa Dissemination Baseline Overview
Data Provider Product Name Coverage Product Description
Format
File Size
Other NRT Dissemination
Frequency process. Evaluating energy fluxes at the Earth surface is of great importance in many disciplines like weather forecasting, global climate monitoring, water management, agriculture and ecology. The ET product contains instantaneous values of evapotranspiration (in mm/h) plus an associated quality flag. ET output is generated in HDF5 format and relevant information for data processing is included in the HDF5 file attributes. Currently ET maps are generated every 30 minutes for the European window with the MSG spatial resolution.
LSA SAF Fire Detection and Monitoring - MSG
Europe, North Africa, South Africa, South America
FD&M is based on the algorithm FIDALGO (Fire Detection Algorithm) developed within the LSA SAF (Amraoui et al., 2010) to identify SEVIRI/Meteosat pixels potentially contaminated by fires.
HDF5 6.2KB
2 per 15 min Download
LSA SAF Fire Radiative Power Grid - MSG
Europe, North Africa, South Africa, South America
The FRPGRID product contains an hourly estimation of the FRP at one degree resolution and includes several correction factors. The Fire Radiative Power product (FRP, in MWatts) provides information on the measured radiant heat output of detected fires. It has been demonstrated in small-scale experimental fires that the amount of radiant heat energy liberated per unit time (the Fire Radiative Power) is related to the rate at which fuel is being consumed [1]. This is a direct result of the combustion process, whereby carbon-based fuel is oxidised to CO2 with the release of a certain 'heat yield'. Therefore, measuring this FRP and integrating it over the lifetime of the fire provides an estimate of the total Fire Radiative Energy (FRE), which for wildfires should be proportional to the total mass of fuel biomass combusted.
HDF5 6.0KB
24 (per day) Download
LSA SAF Fire Radiative Power Pixel - MSG
Europe, North Africa, South Africa,
The Fire Radiative Power product (FRP, in megawatts) provides information on the measured radiant heat output of detected fires. It has been demonstrated in small-scale experimental fires that the amount of radiant heat energy liberated per unit time (the Fire Radiative Power) is related to the rate at which fuel is being
HDF5 1.0MB
96 (per day) Download
43

EUM/OPS/DOC/13/707607 v1, 3 June 2013
EUMETCast-Africa Dissemination Baseline Overview
Data Provider Product Name Coverage Product Description
Format
File Size
Other NRT Dissemination
Frequency South America
consumed. This is a direct result of the combustion process, whereby carbon-based fuel is oxidised to CO2 with the release of a certain heat yield. Therefore, measuring this FRP and integrating it over the lifetime of the fire provides an estimate of the total Fire Radiative Energy (FRE), which for wildfires should be proportional to the total mass of fuel biomass combusted. Geostationary observations allow high temporal frequency FRP measurements, and thus a much-improved ability to estimate FRE via temporal integration when compared to the far less-frequent observations made from systems in low-Earth orbit. The FRP product is derived every 15 min at the native SEVIRI pixel resolution. The disseminated product includes for each processed pixel, the FRP (MW), the corresponding uncertainty in the FRP retrieval based on the variability of the background radiance estimation, and a confidence measure (representing the level of confidence that the observation is indeed a true fire). Applications: The FRP product is intended to support emerging operational atmosphere and climate-related applications, such as Air quality forecasting, Carbon cycle assessment and modelling, and Fire activity models.
LSA SAF Fraction of Absorbed Photosynthetic Active Radiation - MSG
Europe, North Africa, South Africa, South America
The Fraction of Absorbed Photosynthetically Active Radiation (faPAR, The Fraction of Absorbed Photosynthetically Active Radiation) is an indicator of the state and productivity of vegetation and has been recognized as a fundamental surface parameter for environmental studies by international organizations. This quantity represents the fraction of the solar energy which is absorbed by vegetation and therefore plays the role of a battery during the plant photosynthetic process.
HDF5 10.0MB
1 (per day) (per region)
Download
LSA SAF Fractional Vegetation Cover - MSG
Europe, North Africa, South Africa, South America
Fractional Vegetation Cover (FVC) defines an important structural property of a plant canopy, which corresponds to the complement to unity of the gap fraction at nadir direction, accounting for the amount of vegetation distributed in a horizontal perspective. FVC is related with the partition between soil and vegetation contribution for emissivity and temperature. This property is necessary for describing land surface processes and surface parameterisation
HDF5 10.0MB
1 (per day) (per region)
Download
44

EUM/OPS/DOC/13/707607 v1, 3 June 2013
EUMETCast-Africa Dissemination Baseline Overview
Data Provider Product Name Coverage Product Description
Format
File Size
Other NRT Dissemination
Frequency schemes used for climate and weather forecasting. Besides, the FVC is relevant for a wide range of Land Biosphere Applications such us agriculture and forestry, environmental management and land use, hydrology, natural hazards monitoring and management, vegetation-soil dynamics monitoring, drought conditions and fire scar extent.
LSA SAF Land Surface Temperature - MSG
Europe, North Africa, South Africa, South America
Land Surface Temperature (LST) is the radiative skin temperature over land. LST plays an important role in the physics of land surface as it is involved in the processes of energy and water exchange with the atmosphere. LST is useful for the scientific community, namely for those dealing with meteorological and climate models. Accurate values of LST are also of special interest in a wide range of areas related to land surface processes, including meteorology, hydrology, agrometeorology, climatology and environmental studies.
HDF5 218.0KB
96 (per day) Download
LSA SAF Leaf Area Index - MSG Europe, North Africa, South Africa, South America
Leaf Area Index (LAI) is defined as one half the total leaf area per unit ground area. It defines the area of green vegetation that interacts with solar radiation determining the remote sensing signal, and represents the size of the interface between the vegetation canopy and the atmosphere for energy and mass exchanges. LAI is thus a necessary input for Numerical Weather Prediction (NWP), regional and global climate modelling, weather forecasting and global change monitoring. Besides, the LAI is relevant for Land Biosphere Applications such us agriculture and forestry, environmental management and land use.
HDF5 1.0MB
1 (per day) (per region) (plus every 10 days)
Download
LSA SAF Snow Cover - MSG Europe, North Africa, South Africa, South America
Snow Cover (SC) is the presence of snow over land. SC plays an important role in the physics of land surface as it is involved in the processes of energy and water exchange with the atmosphere. SC is useful for the scientific community, namely for those dealing with meteorological and climate models. Accurate detection of snow in a pixel is also important for a wide range of areas related to land surface processes, including meteorology, hydrology, climatology and environmental studies.
HDF5 3.0MB
1 (per day) (per region)
Download
45

EUM/OPS/DOC/13/707607 v1, 3 June 2013
EUMETCast-Africa Dissemination Baseline Overview
Data Provider Product Name Coverage Product Description
Format
File Size
Other NRT Dissemination
Frequency LSA SAF Surface Albedo - MSG Europe,
North Africa, South Africa, South America
Land surface albedo is a key variable for characterising the energy balance in the coupled soil-vegetation-atmosphere system. The albedo quantifies the part of the energy that is absorbed and transformed into heat and latent fluxes. Owing to strong feedback effects the knowledge of albedo is important for determining weather conditions at the atmospheric boundary layer. Climate sensitivity studies with Global Circulation Models have confirmed the unsteady nature of the energy balance with respect to small changes in surface albedo. Other domains of applications are in hydro-meteorology, agro-meteorology and environment-related studies. Two products are pre-operational, the first is available daily and the second is a 10 day composite (See distribution for details).
HDF5 10.0MB
1 (per day) (per region)
Download
NASA Fire Product - MODIS - Multimission
Global This is the most basic fire product in which active fires and other thermal anomalies, such as volcanoes, are identified. The Level 2 product is defined in the MODIS orbit geometry covering an area of approximately 2340 by 2030 km in the across- and along-track directions, respectively. It is used to generate all of the higher-level fire products, and contains the following components: An active fire mask that flags fires and other relevant pixels (e.g. cloud); - a pixel-level quality assurance (QA) image that includes 19 bits of QA information about each pixel; - a fire-pixel table which provides 19 separate pieces of radiometric and internal-algorithm information about each fire pixel detected within a granule; - extensive mandatory and product-specific metadata; - a grid-related data layer to simplify production of the Climate Modeling Grid (CMG) fire product. Product-specific metadata within the Level 2 fire product includes the number of cloud, water, non-fire, fire, unknown, and other pixels occurring within a granule to simplify identification of granules containing fire activity.
HDF5 200.0KB
288 (per day) (per satellite)
-
RANET GEONETCast Africa Broadcast - RANET
Africa A collection of derivative products, such as forecasts, observations, bulletins, documents, and images, produced by national and regional organisations. Content is designed to support intermediaries, such as ag. extension workers, weather service field offices, and emergency managers.
ZIP 2.0MB
20 - 30 (per hour)
-
46

EUM/OPS/DOC/13/707607 v1, 3 June 2013
EUMETCast-Africa Dissemination Baseline Overview
Data Provider Product Name Coverage Product Description
Format
File Size
Other NRT Dissemination
Frequency
SAWS Seasonal Maximum Temperature Forecast (LRF02) - Model - Southern Africa
Southern Africa
Seasonal Maximum Temperature Forecast (normal, below normal and above normal). An AMESD / SADC-THEMA product.
ASCII 65.0KB
1 (per month)
-
SAWS Seasonal Minimum Temperature Forecast (LRF03) - Model - Southern Africa
Southern Africa
Seasonal Minimum Temperature Forecast (normal, below normal and above normal). An AMESD / SADC-THEMA product.
ASCII 65.0KB
1 (per month)
-
SAWS Seasonal Rainfall Forecast (LRF01) - Model - Southern Africa
Southern Africa
Seasonal Rainfall Forecast (normal, below normal and above normal). An AMESD / SADC-THEMA product.
ASCII 65.0KB
1 (per month)
-
TAMSAT Rainfall Estimate for Africa - MSG
Dekadal (every 10 days) and monthly rainfall estimates and anomalies derived from Meteosat Thermal Infra-Red (TIR) channels based on the recognition of storm clouds and calibration against ground-based rain gauge data.
Dekadal & Monthly Rainfall Estimate (netCDF-4 & PNG)
7.3MB & 80.0KB
1 & 3 (per month)
-
UMD Image data - Landsat
Central Africa
Land application products for Central Africa from OSFAC (Observatoire Satellital des Forêts d'Afrique Centrale). Landsat L1T (terrain corrected) data from the Landsat 7 satellite. The Level 1T (L1T) data product provides systematic radiometric and geometric accuracy by incorporating ground control points, while also employing a Digital Elevation Model (DEM) for topographic accuracy. Geodetic accuracy of the product depends on the accuracy of the ground control points and the resolution of the DEM used. All Landsat 7 scenes collected since May of 2003 have data gaps. Although the scenes have only 78 percent of their pixels, these data are still some of the most geometrically and radiometrically accurate of all civilian satellite data in the world.
TIF (bz2, gz) 180.0MB
1 set (per day)
-
47

EUM/OPS/DOC/13/707607 v1, 3 June 2013
EUMETCast-Africa Dissemination Baseline Overview
Data Provider Product Name Coverage Product Description
Format
File Size
Other NRT Dissemination
Frequency
VITO Albedo Products - SPOT - Africa
Africa The ALBEDO product corresponds to the amount of solar energy reflected by a surface and provides information on the radiative balance, thus on temperature and water balance. The required quantity for these models is the spectrally integrated albedo over 300-3000 nm spectral domain also called broadband albedo . The spectral albedo corresponds to hemispherical reflectance of the canopy, i.e. the bidirectional reflectance integrated over the hemisphere with regards of the view directions. The albedo is one of the most interesting variable required as a primary input for global circulation models used to forecast short term weather and long term climatic change. It is also mandatory for local to regional estimates of energy and mass exchanges between the earth surface and the atmosphere as described by soil vegetation atmosphere transfer models (SVAT).
HDF, TIFF, TXT, XML (zipped)
250.0MB
3 (per month)
-
VITO Biogeophysical Quality information - SPOT - Africa
Africa The three biogeophysical products, Leaf Area Index (LAI), Fractional Green Cover (FCOVER) and BioGeo Quality (BIOQ), produced and distributed in the framework of the VGT4AFRICA project, provide various parameters, such as leaf area index, fractional green cover, both with an error budget, land cover class and the number of valid observations that are taken into account. The land cover class (GLC2000), number of valid observations and status map for LAI and FCOVER values are included in BIOQ products. These quality indicators are therefore to be used in the analysis of the LAI and FCOVER products of the same dekad.
HDF, TIFF, TXT, XML (zipped)
22.0MB
3 (per month)
-
VITO Burnt Area - SPOT - Africa
Africa BA or Burnt Area products include information on the first date of burn area since the start of the fire season (1st April), as stored in the so-called BA-DAY dataset, and on the temporal pattern of the fire activity. The input data are daily surface reflectances of SPOT VEGETATION sensor. The burnt areas are surfaces which have been sufficiently affected by fire to display significant changes in the
HDF, TIFF, TXT, XML (zipped)
2.0MB
3 (per month)
-
48

EUM/OPS/DOC/13/707607 v1, 3 June 2013
EUMETCast-Africa Dissemination Baseline Overview
Data Provider Product Name Coverage Product Description
Format
File Size
Other NRT Dissemination
Frequency vegetation cover (destruction of dry material, reduction or loss of green material) and in the ground surface (temporarily darker because of ash). As fire can occur in any type of environmental context, the properties of the burnt surface may differ significantly from place to place. Therefore their identification is based on a combination of surface's properties and change detection, i.e. differences in spectral properties before and after the fire occurrence, following refined L3JRC/GBA2000 methods. The BA product is generated every 10 days over Africa as part of the Geoland2 BioPar core mapping service.
VITO Dry Matter Productivity (DMP) - SPOT - Africa
Africa Dry Matter Productivity or DMP products are 10-daily images representing estimates of dry matter, oriented towards agricultural crop monitoring and yield estimation.
HDF, TIFF, TXT, XML (zipped)
40.0MB
3 (per month)
-
VITO Dry Matter Productivity (DMP) - SPOT - South America
South America
Dry Matter Productivity or DMP products are 10-daily images representing estimates of dry matter, oriented towards agricultural crop monitoring and yield estimation.
HDF, TIFF, TXT, XML (zipped)
35.0MB
3 (per month)
-
VITO Fractional Green Cover - SPOT - Africa
Africa The cover fraction fCover is the fraction of green vegetation covering a unit area of horizontal soil. It corresponds to the gap fraction in the nadir direction. It is generally close to fAPAR with the advantage of being defined independently of illumination conditions, making it an intrinsic canopy attribute. For these reasons, fCover is a very good candidate for substitution of classical vegetation indices. Note that fCover is also independent on leaf and soil optical properties although it is defined with reference to green elements. FCover typically varies from 0 (bare soil) to 1 (full cover). fCover is used to decouple vegetation and soil contributions in energy balance processes with particular attention to temperature and evapo-transpiration. Its inter-annual variations makes it possible to monitor the changes in land-use.
HDF, TIFF, TXT, XML,
30.0MB
3 (per month)
-
VITO Leaf Area Index - SPOT - Africa
Africa The Leaf Area Index (LAI) is the ratio of total upper leaf surface of vegetation divided by the surface area of the land on which the vegetation grows. LAI is strongly non-linearly related to reflectance,
HDF, TIFF, TXT, XML,
33.0MB
3 (per month)
-
49

EUM/OPS/DOC/13/707607 v1, 3 June 2013
EUMETCast-Africa Dissemination Baseline Overview
Data Provider Product Name Coverage Product Description
Format
File Size
Other NRT Dissemination
Frequency and its estimation from remote sensing observations is thus strongly scale dependant. When observing a canopy made of different layers of vegetation, it is therefore mandatory to consider all the green layers. This is particularly important for forest canopies where the understory may represent a very significant contribution to the total canopy LAI. LAI represents the size of the interface between the plant and the atmosphere for energy and mass exchanges. It is thus of prime interest for energy balance, photosynthesis, transpiration and litter production.
VITO Normalised Difference Vegetation Index (NDVI) - SPOT - Africa
Africa A ratio of the intensity of light reflected off the Earth's surface in the visible and near-infrared spectral wavelengths, which quantifies the photosynthetic capacity of the vegetation in a given pixel of land surface. The maximum value for each pixel of a composite period is used as the value for that pixel. Since cloud and other atmospheric perturbations reduce NDVI values, these are eliminated from the final composite product.
HDF, TIFF, TXT, XML (zipped)
30.0MB
3 (per month)
-
VITO Normalised Difference Vegetation Index (NDVI) - SPOT - South America
South America
A ratio of the intensity of light reflected off the Earth's surface in the visible and near-infrared spectral wavelengths, which quantifies the photosynthetic capacity of the vegetation in a given pixel of land surface. The maximum value for each pixel of a composite period is used as the value for that pixel. Since cloud and other atmospheric perturbations reduce NDVI values, these are eliminated from the final composite product.
HDF, TIFF, TXT, XML (zipped)
25.0MB
3 (per month)
-
VITO Normalised Difference Water Index (NDWI) - SPOT - Africa
Africa Shortwave infrared (SWIR) is absorbed by water, be it free water bodies or the water contained in plant cells. To assess water content in a normalised way, the NDWI (normalised difference water index) was introduced. This index increases with vegetation water content or from dry soil to free water. Application of the product: drought stress detection.
HDF, TIFF, TXT, XML (zipped)
20.0MB
3 (per month)
-
VITO Normalised Difference Water Index (NDWI) - SPOT - South America
South America
Shortwave infrared (SWIR) is absorbed by water, be it free water bodies or the water contained in plant cells. To assess water content in a normalised way, the NDWI (normalised difference water index) was introduced. This index increases with vegetation water content or from dry soil to free water. Application of the product: drought
HDF, TIFF, TXT, XML (zipped)
20.0MB
3 (per month)
-
50

EUM/OPS/DOC/13/707607 v1, 3 June 2013
EUMETCast-Africa Dissemination Baseline Overview
51
Data Provider Product Name Coverage Product Description
Format
File Size Frequency
Other NRT Dissemination
stress detection.
VITO Phenology - SPOT - Africa
Africa The phenology products correspond to the assessment, from time series of NDVI, of dates at which specific curve features appear, that can be associated by empirical correlation to phenological stages. These phenological stages are: start of growing season; maximum of growing season; half senescence; end of growing season. Phenology stage dates are used to drive crop growth models, to assess deviations in the vegetation calendar, as an indicator of interannual variation of vegetation status (crop production, grass production), to forecast the development of climate driven diseases and to support long term analysis in terms of land cover change (e. g. change in vegetation type associated with permanent change in vegetation calendar)
HDF, TIFF, TXT, XML,
80.0MB
3 (per month)
-
VITO Small Water Bodies - SPOT - Africa
Africa Small Water Bodies describes the state of small ponds in dry regions. The Global Vegetation Monitoring Unit of JRC has developed a method to map and monitor small water bodies in arid regions using low resolution satellite imagery from the VEGETATION instrument. Although this instrument provides images of the Earth with a 1-km resolution, it was demonstrated that it is sufficient to accurately map and monitor the presence of water in natural and artificial ponds and swamps of about 1 sq km in size. The accuracy obtained is in the order of 90%, i. e. 90% of the water bodies detected with the method over an area of 1 million 1 sq km were found to be correct.
HDF, TIFF, TXT, XML (zipped)
12.0MB
3 (per month)
-
VITO Vegetation Productivity Indicator - SPOT - Africa
Africa The Vegetation Productivity Indicator (VPI) is used to assess the overall vegetation condition and is a categorical type of difference vegetation index, whereby the actual NDVI is referenced against the NDVI percentiles of the historical year.
HDF, TIFF, TXT, XML (zipped)
22.0MB
3 (per month)
-


EUM/OPS/DOC/09/2445 v6 Draft, 16 May 2013
EUMETCast-Africa Dissemination Baseline Overview
53
3 FUTURE PRODUCTS IN PREPARATION
3.1 Overview of Products Pending The following products are currently pending approval/under implementation and expected to be available on EUMETCast during the course of 2013/14. EUMETCast-Africa:
- Extension of Metop-B ASCAT L2 products to EUMETCast Africa; - Enhancement of Météo-France Forecast Products to Europe/Africa; - New Fire Products for the AMESD Programme to Europe/Africa; - New Products for the IGAD AMESD Thema Project to Europe/Africa; - New EPort Training data for Africa to Europe/Africa.
EUMETCast-Europe: - New MSG based Meteorological Products to Europe; - New O3M SAF Products to Europe; - New Hydrology SAF Products to Europe; - New Electro-L N1 image data from ROSHYDROMET to Europe;
3.2 Future Products from the Central Application Facility (CAF) – Meteosat, Metop, Jason-2
The ASCAT Level 2 soil moisture products based on Metop-A is currently disseminated to Europe and Africa. It is proposed to also extend the dissemination of the Metop-B based products to EUMETCast Africa.
Name / Acronym
Product format / com-pression
Coverage Distribution Dissemin. Frequency
Average Daily Data Volume (MByte)
ASCAT soil moisture at 25 km swath grid – Metop-B BUFR Global Europe,
Africa 3 min 32
ASCAT soil moisture at 12.5 km swath grid – Metop-B BUFR Global Europe,
Africa 3 min 120
Initiator and/or Initiating Document
- Request from South Africa Weather Service, recommendation from the 8th EUMETSAT User Forum in Africa.
Name / Acronym
Product format / com-pression
Coverage Distribution Dissemin. Frequency
Average Daily Data Volume (MByte)
Optimal Cloud Analysis (OCA) product
GRIB-2 internal compr.
0° Full disk Europe hourly 1 GB
Initiator and/or Initiating Document

EUM/OPS/DOC/09/2445 v6 Draft, 16 May 2013
EUMETCast-Africa Dissemination Baseline Overview
54
- Meteorological Product Medium-Term Implementation Plan,
EUM/C/76/12/DOC/16.
3.3 New O3MSAF Products
Name / Acronym
Product format / com-pression
Coverage Distribution Dissemin. Frequency
Average Daily Data Volume (MByte)
NRT High Resolution Ozone Profile (Metop-A) BUFR Global Europe ~250 / day 75
Initiator and/or Initiating Document
- Decision of O3M SAF Steering Committee.
3.4 New Hydrology SAF Products
Name / Acronym
Product format / com-pression
Coverage Distribution Dissemin. Frequency
Average Daily Data Volume (MByte)
Soil Wetness Index in the roots region by scatterometer assimilation in a NWP model / SM-ASS-2
GRIB1 / bzip2 Global Europe 1 / day 2
Initiator and/or Initiating Document
- Decision of H SAF Steering Committee.
3.5 Third-Party Products
3.5.1 Electro-L N1 image data from ROSHYDROMET
Name / Acronym
Product format / com-pression
Coverage Distribution Dissemin. Frequency
Average Daily Data Volume (MByte)
Image data (half-hourly) – subset of channels
HRIT wavelet compre
ssed
Full disk @ 76° E Europe 48 / day 600
Initiator and/or Initiating Document
- Request by Member State NMS.
3.5.2 Enhancement of Météo-France Forecast Products for Africa Météo-France is enhancing the Arpege model disseminated to the WMO-RA-I user community via EUMETCast. There is no impact on data volume.

EUM/OPS/DOC/09/2445 v6 Draft, 16 May 2013
EUMETCast-Africa Dissemination Baseline Overview
55
Name / Acronym Product format / compression Coverage Distribution Dissemin. Frequency
Average Daily Data Volume (MByte)
Enhanced Arpege model (Grib 2, 0.5° resolution) - replaces existing Arpege model
GRIB2 with internal compression
Africa and south-west of Europe
Europe and Africa
2/day (Base time 00h , up to 96 h Base time 12 h, up to 72 h +Forecast 00h for base times 06 h and 18 H)
Un-changed
3.5.3 Fire Products for the AMESD Programme
Name / Acronym Product format / compression Coverage Distribution Dissemin.
Frequency
Average Daily Data Volume (MByte)
MCD14DL Active Fires from MODIS cvs (text) Global Europe,
Africa daily 0.5
MCD45A1 (GeoTIFF) - Burned Area
GeoTIFF (gzip) Global Europe,
Africa monthly 1 average 31 peak
Initiator and/or Initiating Document
- AMESD programme support EUM/C/63/07/DOC/25, EUM/C/71/10/DOC/37.
3.5.4 Products for the IGAD AMESD Thema Project
Name / Acronym
Product format / compre
ssion
Coverage Distri-bution
Dissemin. Freq.
Average Daily Data
Volume (MByte)
Land Degradation Potential Land Degradation Index Map (Low resolution) Actual Land Degradation Change Map (Low resolution) Actual Land Degradation Index Map (Low resolution)
png
Service1 bulletin pdf
IGAD region
Europe Africa 6 month
0.1 average 20 peak
Potential Land Degradation Index Map (Low resolution) Land cover (GlobCover Legend) Actual Land Degradation Index Map (Low resolution) Actual Land Degradation Change Map (Low resolution) Land Degradation Index Map (Very High resolution)
png
Ethiopia, Uganda, Kenya, Sudan,
Eritrea, Somalia, Djibouti, Burundi,
Rwanda
Europe Africa 6 month
0.14 average 25 peak

EUM/OPS/DOC/09/2445 v6 Draft, 16 May 2013
EUMETCast-Africa Dissemination Baseline Overview
56
Natural Habitat and Conservation Ecosystems and natural habitats location and area Conservation hot spots Biodiversity richness (mammals, birds etc) Regional land cover PA location and area Category, level of protection Species irreplaceability Land cover change on PA Population pressure index
png Protected Areas in IGAD Countries
Europe Africa
one-time to annual
0.3 average 50 peak
Normalized Growth Index Standardized Normalized Difference Vegetation Index Normalized Difference Vegetation Index Normalized Difference Water IndexCover fraction Dry Matter Productivity Biomass Production Biomass Production anomalies Precipitation Temperature Evapotranspiration
png
Regional (IGAD), National,
Protected Areas and CNH
Europe Africa
annual seasonal monthly
2.7 average 500 peak
Name / Acronym
Product format / compre
ssion
Coverage Distri-bution
Dissemin. Freq.
Average Daily Data
Volume (MByte)
Natural Habitat and Conservation High resolution land cover map High resolution land cover change map and statistics Low resolution land cover map and statistics Low resolution land cover change map and statistic
png
Selected protected areas and their buffer zones in
the IGAD region
Europe Africa
seasonal annual
0.3 average 50 peak
Fire density map Fire distribution map Fire occurrence report Burnt area map Burnt area report
png User defined (IGAD countries)
Europe Africa
Monthly every 3
or 6 months
1.3 average 25 peak
Agricultural pressure Population pressure Accessibility Combined agricultural, population and accessibility pressure
png Selected protected areas in the IGAD
region
Europe Africa
3 – 5 years
0.04 average 20 peak
Service2 bulletin pdf IGAD region
Europe Africa 6 month 0.1 average
5 peak

EUM/OPS/DOC/09/2445 v6 Draft, 16 May 2013
EUMETCast-Africa Dissemination Baseline Overview
57
Initiator and/or Initiating Document
- EUMETSAT secretariat, AMESD programme EUM/C/63/07/DOC/25, EUM/C/71/10/DOC/37.
3.5.5 EPort Training data for Africa
Name / Acronym Product format / compression Coverage Distribution Dissemin.
Frequency
Average Daily Data Volume (MByte)
Provision of a local version of the EPort WEB site to users in Africa, for the purpose of training, includes satellites images, forecasts, lightning data
WEB structure, flash files
North Africa
Europe, Africa 6 hourly 100
Initiator and/or Initiating Document
- Met Office
3.5.6 New SARAL Products
Name / Acronym Product format / compression
Coverage Distribution Dissemin. Frequency
Average Daily Data
Volume (MByte)
AltiKa/SARAL OGDR products netcdf Global Global 14 / day
3.5.7 New Megha-Tropiques Products
Name / Acronym Product format / compression
Coverage Distribution Dissemin. Frequency
Average Daily Data Volume (MByte)
L1A2 products from MADRAS and SAPHIR BUFR
Global (tropics only)
Europe ~70 files/day 600

EUM/OPS/DOC/09/2445 v6 Draft, 16 May 2013
EUMETCast-Africa Dissemination Baseline Overview
58
4 PRODUCTS TO BE WITHDRAWN FROM THE EUMETCAST-AFRICA
BASELINE The following products have been withdrawn from the baseline:
- CSIR – McArthur Forest Fire Danger Index - CNES - Absolute Dynamic Topgraphy – Envisat
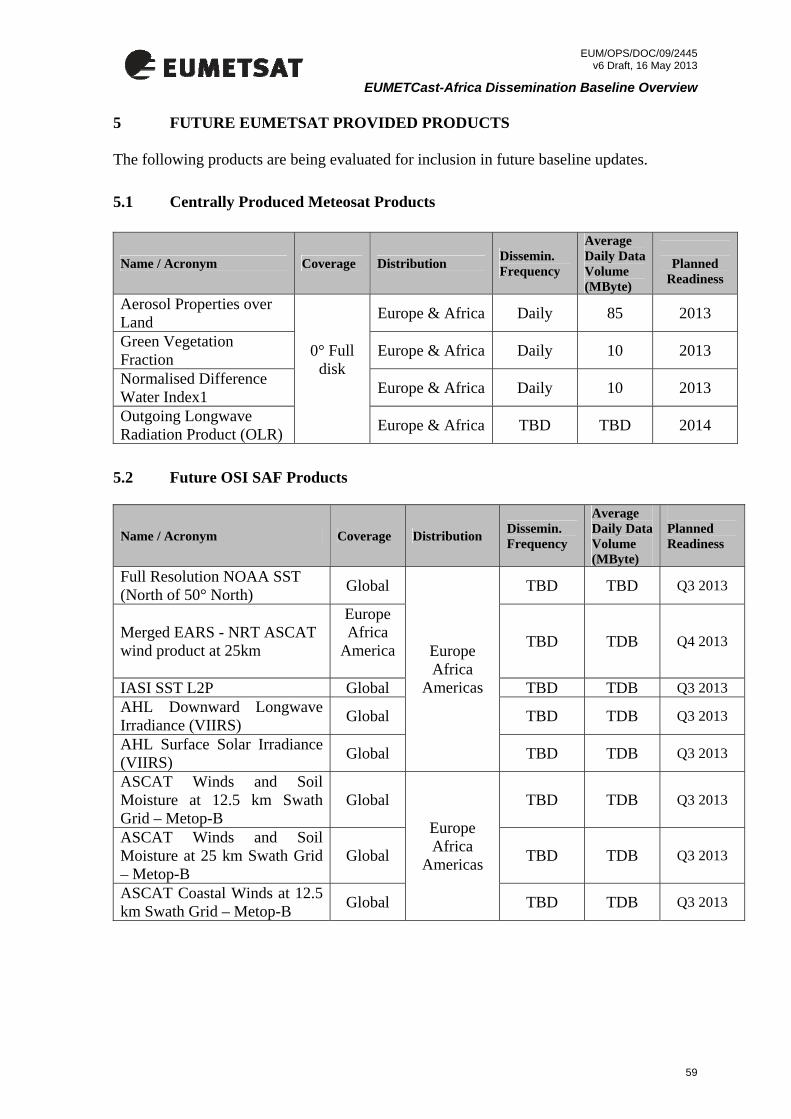
EUM/OPS/DOC/09/2445 v6 Draft, 16 May 2013
EUMETCast-Africa Dissemination Baseline Overview
59
5 FUTURE EUMETSAT PROVIDED PRODUCTS The following products are being evaluated for inclusion in future baseline updates.
5.1 Centrally Produced Meteosat Products
5.2 Future OSI SAF Products
Name / Acronym Coverage Distribution Dissemin. Frequency
Average Daily Data Volume (MByte)
Planned Readiness
Full Resolution NOAA SST (North of 50° North) Global TBD TBD Q3 2013
Merged EARS - NRT ASCAT wind product at 25km
Europe Africa
America
TBD TDB Q4 2013
IASI SST L2P Global TBD TDB Q3 2013 AHL Downward Longwave Irradiance (VIIRS) Global TBD TDB Q3 2013
AHL Surface Solar Irradiance (VIIRS) Global
Europe Africa
Americas
TBD TDB Q3 2013
ASCAT Winds and Soil Moisture at 12.5 km Swath Grid – Metop-B
Global TBD TDB Q3 2013
ASCAT Winds and Soil Moisture at 25 km Swath Grid – Metop-B
Global TBD TDB Q3 2013
ASCAT Coastal Winds at 12.5 km Swath Grid – Metop-B Global
Europe Africa
Americas
TBD TDB Q3 2013
Name / Acronym Coverage Distribution Dissemin. Frequency
Average Daily Data Volume (MByte)
Planned
Readiness
Aerosol Properties over Land Europe & Africa Daily 85 2013
Green Vegetation Fraction Europe & Africa Daily 10 2013
Normalised Difference Water Index1 Europe & Africa Daily 10 2013
Outgoing Longwave Radiation Product (OLR)
0° Full disk
Europe & Africa TBD TBD 2014

EUM/OPS/DOC/09/2445 v6 Draft, 16 May 2013
EUMETCast-Africa Dissemination Baseline Overview
60
5.3 Future LSA SAF Products
Name / Acronym Coverage Distribution Dissemin. Frequency
Average Daily Data Volume (MByte)
Planned Readiness
Vegetation Products based on EPS (LAI, FVC, FaPAR)
Europe Africa
America
Europe Africa
America 1/day 130 Q3 2013
Surface Albedo (AL) EPS based
Europe Africa
America
Europe Africa
America TBD TBD Q3 2013
5.4 Future O3M SAF Products
Name / Acronym Coverage Distribution Dissemin. Frequency
Average Daily Data Volume (MByte)
Planned Readiness
IASI NRT CO (Metop-B) Global Europe TBD TBD 2013 Metop-B based products
Near Real Time Total Column Global
Europe, BUFR also to
Africa
~250 / day / product 200 Q4 2013
Near Real Time Ozone Profiles Global
Europe, BUFR also to
Africa
~250 / day / product 770 Q4 2013
NRT High Resolution Ozone Profile Global Europe ~250 / day
/ product 75 Q4 2013
5.5 Future ROM SAF Products
Name / Acronym Coverage Distribution Dissemin. Frequency
Average Daily Data Volume (MByte)
Planned Readiness
Metop-B based products Near Real-Time Refractivity Profile Global Europe ~660 / day 8 Q4 2013
Temperature Profile Global Europe TBD TBD Q4 2013
Pressure Profile Global Europe TBD TBD Q4 2013
Specific Humidity Profile Global Europe TBD TBD Q4 2013
Surface Pressure Global Europe TBD TBD Q4 2013
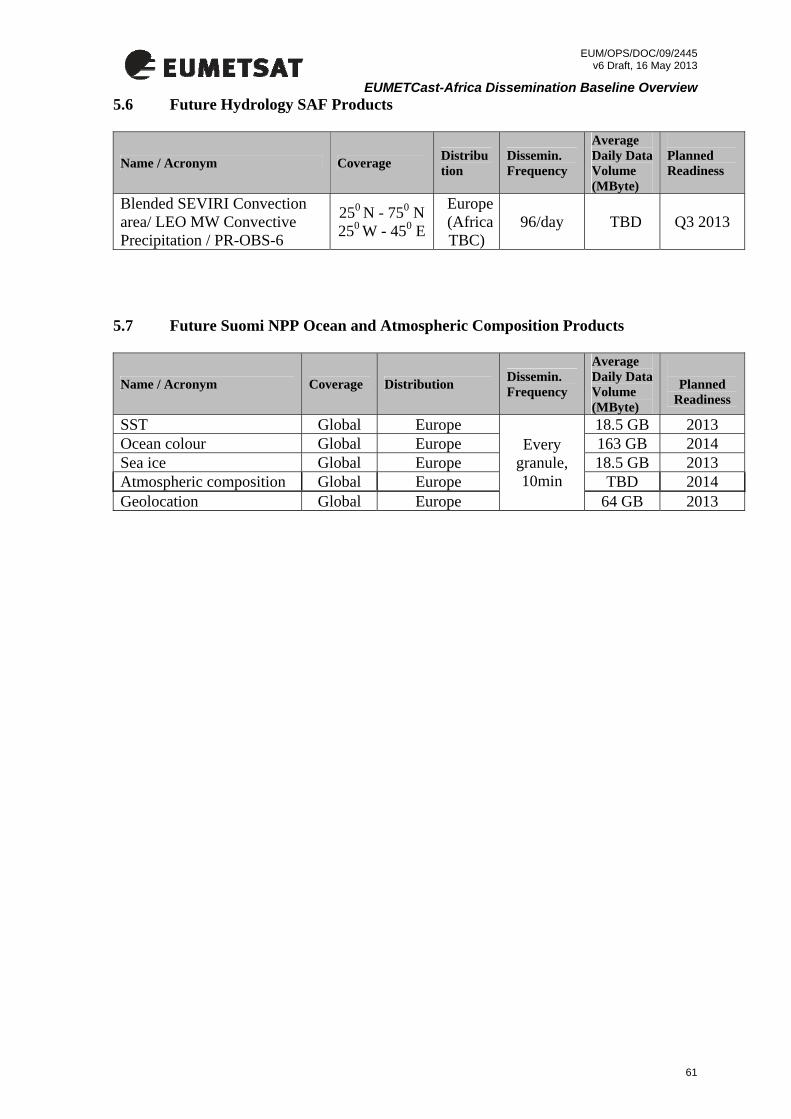
EUM/OPS/DOC/09/2445 v6 Draft, 16 May 2013
EUMETCast-Africa Dissemination Baseline Overview
61
5.6 Future Hydrology SAF Products
Name / Acronym Coverage Distribution
Dissemin. Frequency
Average Daily Data Volume (MByte)
Planned Readiness
Blended SEVIRI Convection area/ LEO MW Convective Precipitation / PR-OBS-6
250 N - 750 N 250 W - 450 E
Europe(AfricaTBC)
96/day TBD Q3 2013
5.7 Future Suomi NPP Ocean and Atmospheric Composition Products
Name / Acronym Coverage Distribution Dissemin. Frequency
Average Daily Data Volume (MByte)
Planned
Readiness
SST Global Europe 18.5 GB 2013 Ocean colour Global Europe 163 GB 2014 Sea ice Global Europe 18.5 GB 2013 Atmospheric composition Global Europe TBD 2014 Geolocation Global Europe
Every granule, 10min
64 GB 2013


EUM/OPS/DOC/09/2445 v6 Draft, 16 May 2013
EUMETCast-Africa Dissemination Baseline Overview
6 PRODUCTS EXCLUDED FROM EUMETCAST-AFRICA The following products are available on EUMETCast, but are not provided on EUMETCast-Africa. Data Provider
Product Name
Description Coverage Formats File size Frequency Other NRT Dissemination
CIMSS Polar Winds - Multimission
MODIS and AVHRR data are used to retrieve tropospheric winds (speed, direction, and height) in the polar regions by tracking cloud and water vapour features. Much of this information cannot be generated fast enough for use in early NWP model runs due to the delay in obtaining MODIS and AVHRR data (typically 1-4 hrs). To improve the timeliness of the wind data, direct broadcast (DB) sites provide real-time access to water vapour winds (wvap) bufr files from MODIS data, as well as IR cloud-drift winds (cdft) bufr files from both MODIS and AVHRR data.
Polar Caps BUFR 50.0 KB, ~108 (per day),
-
CMA Microwave Atmospheric Humidity Sounder - FengYun 3A
Atmospheric vertical humidity profile. Land surface parameters. Global HDF 15.0MB ~1 file every 102 mins
-
CMA Microwave Atmospheric Humidity Sounder - FengYun 3B
Atmospheric vertical humidity profile. Land surface parameters. Global HDF 15.0MB ~1 file every 102 mins
-
CMA Microwave Temperature Sounder - FengYun 3A
Atmospheric vertical temperature profile. Global HDF 450KB ~1 file every 102 mins
-
CMA Microwave Temperature Sounder - FengYun 3B
Atmospheric vertical temperature profile. Global HDF 450KB ~1 file every 102 mins
-
DWD DWDSAT DWDSAT is a satellite-based system (Linux-(/Windows-)PC, DVB) for the distribution of meteorological data by the use of standard DVB-technology. The DWD data are transferred via FTP to T-SYSTEMS / Usingen, converted into a DVB (DigitalVideoBroadcast)-Multicast data stream and transmitted via the satellite Hotbird 6. This is done in cooperation with EUMETSAT/EUMETCast.
Europe n/a n/a Variable -
ESA SMOS NRT The SMOS NRT BUFR Light product provides L-Band Multi-angular Brightness Global BUFR 40MB ~30 (per
63
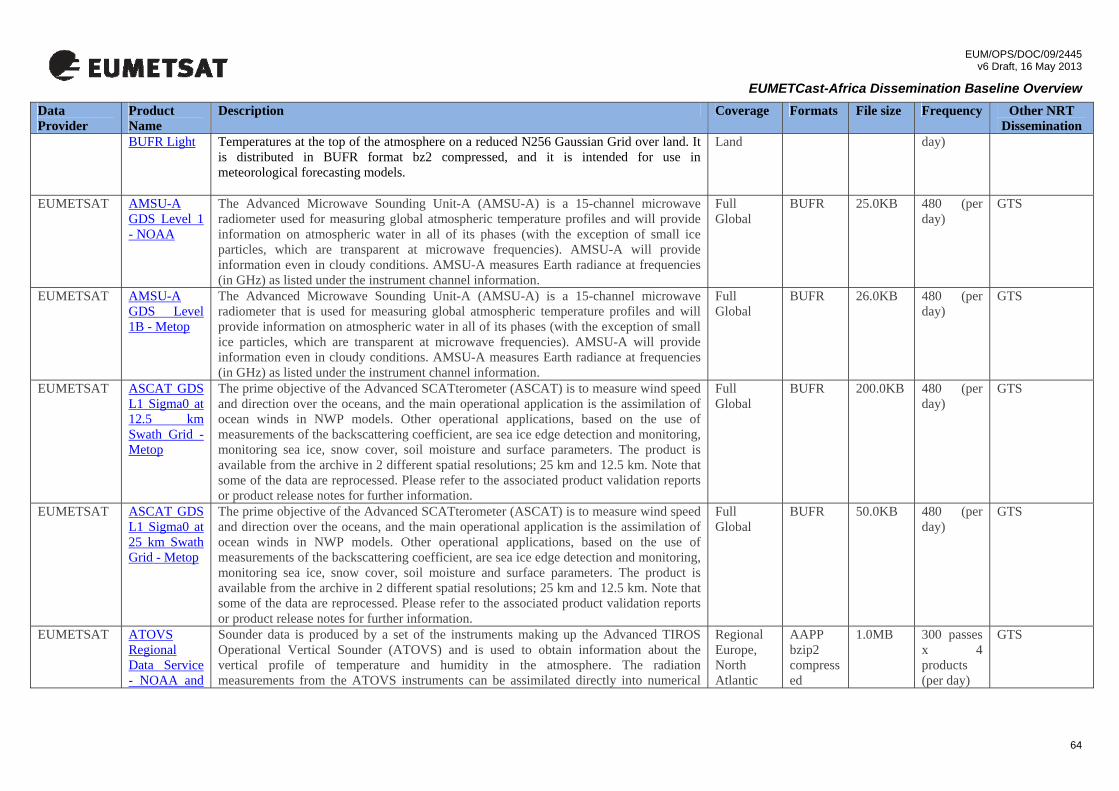
EUM/OPS/DOC/09/2445 v6 Draft, 16 May 2013
EUMETCast-Africa Dissemination Baseline Overview Data Provider
Product Name
Description Coverage Formats File size Frequency Other NRT Dissemination
BUFR Light
Temperatures at the top of the atmosphere on a reduced N256 Gaussian Grid over land. It is distributed in BUFR format bz2 compressed, and it is intended for use in meteorological forecasting models.
Land day)
EUMETSAT AMSU-A GDS Level 1 - NOAA
The Advanced Microwave Sounding Unit-A (AMSU-A) is a 15-channel microwave radiometer used for measuring global atmospheric temperature profiles and will provide information on atmospheric water in all of its phases (with the exception of small ice particles, which are transparent at microwave frequencies). AMSU-A will provide information even in cloudy conditions. AMSU-A measures Earth radiance at frequencies (in GHz) as listed under the instrument channel information.
Full Global
BUFR 25.0KB 480 (per day)
GTS
EUMETSAT AMSU-A GDS Level 1B - Metop
The Advanced Microwave Sounding Unit-A (AMSU-A) is a 15-channel microwave radiometer that is used for measuring global atmospheric temperature profiles and will provide information on atmospheric water in all of its phases (with the exception of small ice particles, which are transparent at microwave frequencies). AMSU-A will provide information even in cloudy conditions. AMSU-A measures Earth radiance at frequencies (in GHz) as listed under the instrument channel information.
Full Global
BUFR 26.0KB 480 (per day)
GTS
EUMETSAT ASCAT GDS L1 Sigma0 at 12.5 km Swath Grid - Metop
The prime objective of the Advanced SCATterometer (ASCAT) is to measure wind speed and direction over the oceans, and the main operational application is the assimilation of ocean winds in NWP models. Other operational applications, based on the use of measurements of the backscattering coefficient, are sea ice edge detection and monitoring, monitoring sea ice, snow cover, soil moisture and surface parameters. The product is available from the archive in 2 different spatial resolutions; 25 km and 12.5 km. Note that some of the data are reprocessed. Please refer to the associated product validation reports or product release notes for further information.
Full Global
BUFR 200.0KB 480 (per day)
GTS
EUMETSAT ASCAT GDS L1 Sigma0 at 25 km Swath Grid - Metop
The prime objective of the Advanced SCATterometer (ASCAT) is to measure wind speed and direction over the oceans, and the main operational application is the assimilation of ocean winds in NWP models. Other operational applications, based on the use of measurements of the backscattering coefficient, are sea ice edge detection and monitoring, monitoring sea ice, snow cover, soil moisture and surface parameters. The product is available from the archive in 2 different spatial resolutions; 25 km and 12.5 km. Note that some of the data are reprocessed. Please refer to the associated product validation reports or product release notes for further information.
Full Global
BUFR 50.0KB 480 (per day)
GTS
EUMETSAT ATOVS Regional Data Service - NOAA and
Sounder data is produced by a set of the instruments making up the Advanced TIROS Operational Vertical Sounder (ATOVS) and is used to obtain information about the vertical profile of temperature and humidity in the atmosphere. The radiation measurements from the ATOVS instruments can be assimilated directly into numerical
Regional Europe, North Atlantic
AAPP bzip2 compressed
1.0MB 300 passes x 4 products (per day)
GTS
64

EUM/OPS/DOC/09/2445 v6 Draft, 16 May 2013
EUMETCast-Africa Dissemination Baseline Overview Data Provider
Product Name
Description Coverage Formats File size Frequency Other NRT Dissemination
Metop models of the atmosphere. The EUMETSAT Advanced Retransmission Service (EARS) provides instrument data from the Metop and NOAA satellites collected via a network of HRPT stations.
EUMETSAT AVHRR GDS Level 1 - Metop
The Advanced Very High Resolution Radiometer (AVHRR) operates at 5 different channels simultaneously in the visible and infrared bands, with wavelengths specified in the instrument channels description. Channel 3 switches between 3a and 3b for daytime and nighttime. As a high-resolution imager (about 1.1 km near nadir) its main purpose is to provide cloud and surface information such as cloud coverage, cloud top temperature, surface temperature over land and sea, and vegetation or snow/ice. In addition, AVHRR products serve as input for the level 2 processing of IASI and ATOVS.
Full Global
PFS 8.8MB 480 (per day)
-
EUMETSAT AVHRR GDS Level 1 - NOAA
The Advanced Very High Resolution Radiometer (AVHRR) operates at 5 different channels simultaneously in the visible and infrared bands, with wavelengths specified in the instrument channels description. Channel 3 switches between 3a and 3b for daytime and nighttime. As a high-resolution imager (about 1.1 km near nadir) its main purpose is to provide cloud and surface information such as cloud coverage, cloud top temperature, surface temperature over land and sea, and vegetation or snow/ice. In addition, AVHRR products serve as input for the level 2 processing of IASI and ATOVS. The global products from AVHRR on NOAA satellites are only available at Global Area Coverage (GAC) spatial sampling, namely 5.4 km across track x 3.2 km along track at nadir.
Full Global
PFS 930KB 480 (per day)
-
EUMETSAT AVHRR Regional Data Service - NOAA and Metop
The Advanced Very High Resolution Radiometer (AVHRR) is a multipurpose imaging instrument used for the global monitoring of cloud cover, sea surface temperature, ice, snow and vegetation characteristics. The EUMETSAT Advanced Retransmission Service (EARS) provides AVHRR instrument data from the Metop-A and NOAA-19 satellites collected via a network of HRPT stations. Segments of one-minute duration are disseminated to users via EUMETCast. These segments can be concatenated together by users to construct a regional pass. Note that some historical NOAA-17 and NOAA-18 data are available from the Data Centre.
Regional Europe, North Atlantic
NOAA: raw HRPT bzip2 compressed
3.5MB ~300 (per day, per satellite)
-
EUMETSAT IASI Regional Data Service Level 1 Principal Component Scores and subset of channels -
The IASI principal component scores product contains IASI radiance spectra (see the IASI GDS L1C), compressed by the Principal Component Analysis method. Calibrated and geolocated IASI observations in a combined product containing both 300 Principal Component Scores and 366 original IASI Channels, cloud/scene analysis information, BUFR formatted. The main objective of the Infrared Atmospheric Sounding Interferometer (IASI) is to provide high resolution atmospheric emission spectra to derive temperature and humidity profiles with high spectral and vertical resolution and accuracy. Additionally it is used for the determination of trace gases such as ozone, nitrous oxide, carbon dioxide and methane, as well as land and sea surface temperature, emissivity and
Regional Europe, North Atlantic
BUFR 10MB 1 (per pass) (per station)
GTS
65

EUM/OPS/DOC/09/2445 v6 Draft, 16 May 2013
EUMETCast-Africa Dissemination Baseline Overview Data Provider
Product Name
Description Coverage Formats File size Frequency Other NRT Dissemination
Metop
cloud properties. The EUMETSAT Advanced Retransmission Service (EARS) provides instrument data from the Metop satellites collected via a network of Direct Readout stations.
EUMETSAT CrIS Regional Data Service - Suomi NPP
The Cross-track Infrared Sounder (CrIS), a Fourier transform spectrometer with 1305 spectral channels, produces high-resolution, three-dimensional temperature, pressure, and moisture profiles. These profiles are used to enhance weather forecasting models, and to facilitate both short- and long-term weather forecasting. Over longer timescales, they will help improve understanding of climate phenomena such as El Niño and La Niña. A subset of spectral channels only are included in order to reduce data volume. EUMETSAT Advanced Retransmission Service (EARS) provides instrument data from the Suomi NPP satellites collected via a network of Direct Readout stations. (CURRENTLY THE DATA ARE FOR EVALUATION ONLY)
Regional Europe, North Atlantic
BUFR 13MB
30 (per day)
GTS
EUMETSAT ATMS Regional Data Service - Suomi NPP
The Advanced Technology Microwave Sounder (ATMS), a cross-track scanner with 22 channels, provides sounding observations needed to retrieve profiles of atmospheric temperature and moisture for civilian operational weather forecasting as well as continuity of these measurements for climate monitoring purposes. The EUMETSAT Advanced Retransmission Service (EARS) provides instrument data from the Suomi NPP satellite collected via a network of Direct Readout stations. (CURRENTLY THE DATA ARE FOR EVALUATION ONLY)
Regional Europe, North Atlantic
BUFR 5MB 30 (per day)
GTS
EUMETSAT EARS Cloud Mask - Multimission
Cloud Mask products from the Regional NOAA and Metop services (1-minute duration). The EUMETSAT Advanced Retransmission Service (EARS) provides instrument data from the Metop and NOAA satellites collected via a network of Direct Readout stations. The product is derived from the NWC SAF Polar Platform package. Segments of one-minute duration are disseminated to users via EUMETCast and these segments can be concatenated together by users to construct a regional pass.
Regional Europe, North Atlantic
HDF5 500KB
600 (per day)
-
EUMETSAT EARS Cloud Type - Multimission
Cloud Type products from the Regional NOAA and Metop services (1-minute duration). The EUMETSAT Advanced Retransmission Service (EARS) provides instrument data from the Metop and NOAA satellites collected via a network of Direct Readout stations. The product is derived from the NWC SAF Polar Platform package. Segments of one-minute duration are disseminated to users via EUMETCast and these segments can be concatenated together by users to construct a regional pass.
Regional Europe, North Atlantic
HDF5 350KB 600 (per day)
-
66

EUM/OPS/DOC/09/2445 v6 Draft, 16 May 2013
EUMETCast-Africa Dissemination Baseline Overview Data Provider
Product Name
Description Coverage Formats File size Frequency Other NRT Dissemination
EUMETSAT EARS Cloud Top Temperature & Height - Multimission
Cloud Top Temperature & Height products from the Regional NOAA and Metop services (1-minute duration). The EUMETSAT Advanced Retransmission Service (EARS) provides instrument data from the Metop and NOAA satellites collected via a network of Direct Readout stations. The product is derived from the NWC SAF Polar Platform package. Segments of one-minute duration are disseminated to users via EUMETCast and these segments can be concatenated together by users to construct a regional pass.
Regional Europe, North Atlantic
HDF5 800KB 600 (per day)
-
EUMETSAT GOME2 GDS Level 1B - Metop
The Global Ozone Monitoring Experiment-2 (GOME2) spectrometer measures profiles and total columns of ozone and of other atmospheric constituents that are related to the depletion of ozone in the stratosphere and its production in the troposphere, as well as to natural and anthropogenic sources of pollution.
Full Global
PFS 19.2MB 480 (per day)
-
EUMETSAT GRAS GDS Level 1B - Metop
The GNSS (Global Navigation Satellite System) Receiver for Atmospheric Sounding (GRAS) probes the vertical profile of the atmosphere by observing GPS (Global Positioning Satellite) in a limb sounding geometry. GRAS observes rising and setting occultations in velocity and anti-velocity direction, providing a minimum of 500 profiles per day with high vertical resolution. The raw data can be processed further to profiles of bending angle over impact parameter at level 1B and to refractivity, temperature, and humidity over altitude at level 2, covering the stratosphere and troposphere.
Full Global
BUFR 20.0KB ~340 (per day)
GTS
EUMETSAT HIRS GDS Level 1 - Metop
The High Resolution Infrared Sounder (HIRS) operates at 20 channels (19 channels in the infrared and one in the visible). Its main purpose is to provide input for the vertical temperature and humidity profile retrievals. In addition, the HIRS pixel resolution serves as the standard grid resolution for all ATOVS level 2 products.
Full Global
BUFR 75.0KB 480 (per day)
GTS
EUMETSAT HIRS GDS Level 1 - NOAA
The High Resolution Infrared Sounder (HIRS) operates at 20 channels (19 channels in the infrared and one in the visible). Its main purpose is to provide input for the vertical temperature and humidity profile retrievals. In addition, the HIRS pixel resolution serves as the standard grid resolution for all ATOVS level 2 products.
Full Global
BUFR 1.0MB 480 (per day)
GTS
EUMETSAT IASI Atmospheric Temperature Water Vapour and Surface Skin Temperature - Metop
The main objective of the Infrared Atmospheric Sounding Interferometer (IASI) is to provide high resolution atmospheric emission spectra to derive temperature and humidity profiles with high spectral and vertical resolution and accuracy. Additionally it is used for the determination of trace gases, as well as land and sea surface temperature, emissivity and cloud properties. The Atmospheric Water Vapour and Surface Skin Temperature ( TWT) product contains the vertical profiles of atmospheric temperature and humidity, with a vertical sampling at 90 pressure levels, and surface skin temperature. The vertical profiles are retrieved from the IASI sounder measurements (of IASI L1C product), which has a spatial sampling of about 25 km at nadir. The quality of the vertical profiles is strongly related to the cloud properties available in the IASI CLP product. This product is
Full Global
BUFR 400.0KB 480 (per day)
GTS / extension to Africa under implementation
67
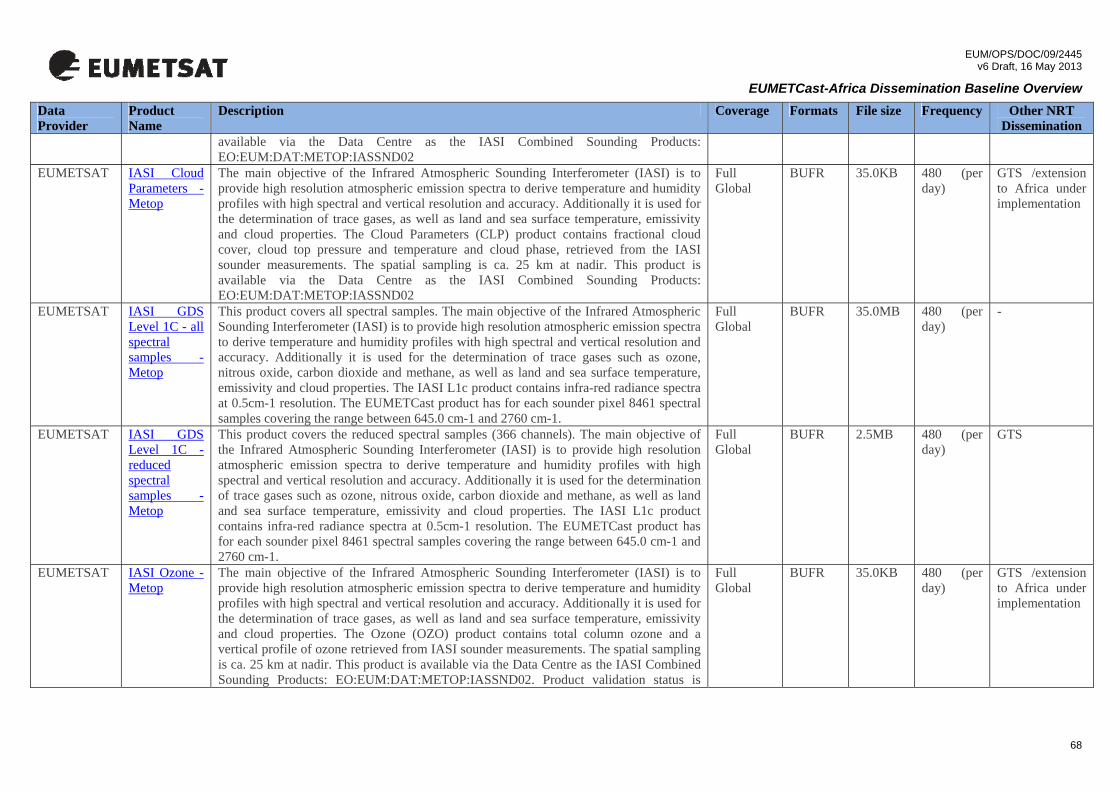
EUM/OPS/DOC/09/2445 v6 Draft, 16 May 2013
EUMETCast-Africa Dissemination Baseline Overview Data Provider
Product Name
Description Coverage Formats File size Frequency Other NRT Dissemination
available via the Data Centre as the IASI Combined Sounding Products: EO:EUM:DAT:METOP:IASSND02
EUMETSAT IASI Cloud Parameters - Metop
The main objective of the Infrared Atmospheric Sounding Interferometer (IASI) is to provide high resolution atmospheric emission spectra to derive temperature and humidity profiles with high spectral and vertical resolution and accuracy. Additionally it is used for the determination of trace gases, as well as land and sea surface temperature, emissivity and cloud properties. The Cloud Parameters (CLP) product contains fractional cloud cover, cloud top pressure and temperature and cloud phase, retrieved from the IASI sounder measurements. The spatial sampling is ca. 25 km at nadir. This product is available via the Data Centre as the IASI Combined Sounding Products: EO:EUM:DAT:METOP:IASSND02
Full Global
BUFR 35.0KB 480 (per day)
GTS /extension to Africa under implementation
EUMETSAT IASI GDS Level 1C - all spectral samples - Metop
This product covers all spectral samples. The main objective of the Infrared Atmospheric Sounding Interferometer (IASI) is to provide high resolution atmospheric emission spectra to derive temperature and humidity profiles with high spectral and vertical resolution and accuracy. Additionally it is used for the determination of trace gases such as ozone, nitrous oxide, carbon dioxide and methane, as well as land and sea surface temperature, emissivity and cloud properties. The IASI L1c product contains infra-red radiance spectra at 0.5cm-1 resolution. The EUMETCast product has for each sounder pixel 8461 spectral samples covering the range between 645.0 cm-1 and 2760 cm-1.
Full Global
BUFR 35.0MB 480 (per day)
-
EUMETSAT IASI GDS Level 1C - reduced spectral samples - Metop
This product covers the reduced spectral samples (366 channels). The main objective of the Infrared Atmospheric Sounding Interferometer (IASI) is to provide high resolution atmospheric emission spectra to derive temperature and humidity profiles with high spectral and vertical resolution and accuracy. Additionally it is used for the determination of trace gases such as ozone, nitrous oxide, carbon dioxide and methane, as well as land and sea surface temperature, emissivity and cloud properties. The IASI L1c product contains infra-red radiance spectra at 0.5cm-1 resolution. The EUMETCast product has for each sounder pixel 8461 spectral samples covering the range between 645.0 cm-1 and 2760 cm-1.
Full Global
BUFR 2.5MB 480 (per day)
GTS
EUMETSAT IASI Ozone - Metop
The main objective of the Infrared Atmospheric Sounding Interferometer (IASI) is to provide high resolution atmospheric emission spectra to derive temperature and humidity profiles with high spectral and vertical resolution and accuracy. Additionally it is used for the determination of trace gases, as well as land and sea surface temperature, emissivity and cloud properties. The Ozone (OZO) product contains total column ozone and a vertical profile of ozone retrieved from IASI sounder measurements. The spatial sampling is ca. 25 km at nadir. This product is available via the Data Centre as the IASI Combined Sounding Products: EO:EUM:DAT:METOP:IASSND02. Product validation status is
Full Global
BUFR 35.0KB 480 (per day)
GTS /extension to Africa under implementation
68
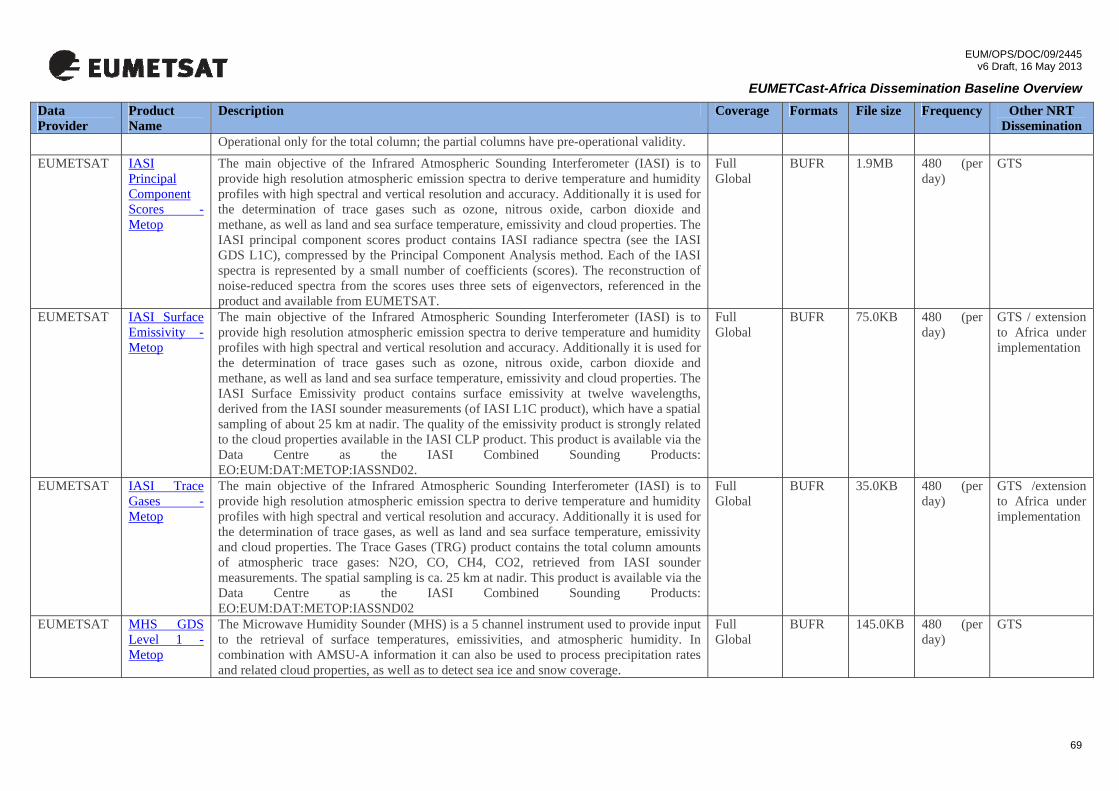
EUM/OPS/DOC/09/2445 v6 Draft, 16 May 2013
EUMETCast-Africa Dissemination Baseline Overview Data Provider
Product Name
Description Coverage Formats File size Frequency Other NRT Dissemination
Operational only for the total column; the partial columns have pre-operational validity. EUMETSAT IASI
Principal Component Scores - Metop
The main objective of the Infrared Atmospheric Sounding Interferometer (IASI) is to provide high resolution atmospheric emission spectra to derive temperature and humidity profiles with high spectral and vertical resolution and accuracy. Additionally it is used for the determination of trace gases such as ozone, nitrous oxide, carbon dioxide and methane, as well as land and sea surface temperature, emissivity and cloud properties. The IASI principal component scores product contains IASI radiance spectra (see the IASI GDS L1C), compressed by the Principal Component Analysis method. Each of the IASI spectra is represented by a small number of coefficients (scores). The reconstruction of noise-reduced spectra from the scores uses three sets of eigenvectors, referenced in the product and available from EUMETSAT.
Full Global
BUFR 1.9MB 480 (per day)
GTS
EUMETSAT IASI Surface Emissivity - Metop
The main objective of the Infrared Atmospheric Sounding Interferometer (IASI) is to provide high resolution atmospheric emission spectra to derive temperature and humidity profiles with high spectral and vertical resolution and accuracy. Additionally it is used for the determination of trace gases such as ozone, nitrous oxide, carbon dioxide and methane, as well as land and sea surface temperature, emissivity and cloud properties. The IASI Surface Emissivity product contains surface emissivity at twelve wavelengths, derived from the IASI sounder measurements (of IASI L1C product), which have a spatial sampling of about 25 km at nadir. The quality of the emissivity product is strongly related to the cloud properties available in the IASI CLP product. This product is available via the Data Centre as the IASI Combined Sounding Products: EO:EUM:DAT:METOP:IASSND02.
Full Global
BUFR 75.0KB 480 (per day)
GTS / extension to Africa under implementation
EUMETSAT IASI Trace Gases - Metop
The main objective of the Infrared Atmospheric Sounding Interferometer (IASI) is to provide high resolution atmospheric emission spectra to derive temperature and humidity profiles with high spectral and vertical resolution and accuracy. Additionally it is used for the determination of trace gases, as well as land and sea surface temperature, emissivity and cloud properties. The Trace Gases (TRG) product contains the total column amounts of atmospheric trace gases: N2O, CO, CH4, CO2, retrieved from IASI sounder measurements. The spatial sampling is ca. 25 km at nadir. This product is available via the Data Centre as the IASI Combined Sounding Products: EO:EUM:DAT:METOP:IASSND02
Full Global
BUFR 35.0KB 480 (per day)
GTS /extension to Africa under implementation
EUMETSAT MHS GDS Level 1 - Metop
The Microwave Humidity Sounder (MHS) is a 5 channel instrument used to provide input to the retrieval of surface temperatures, emissivities, and atmospheric humidity. In combination with AMSU-A information it can also be used to process precipitation rates and related cloud properties, as well as to detect sea ice and snow coverage.
Full Global
BUFR 145.0KB 480 (per day)
GTS
69

EUM/OPS/DOC/09/2445 v6 Draft, 16 May 2013
EUMETCast-Africa Dissemination Baseline Overview Data Provider
Product Name
Description Coverage Formats File size Frequency Other NRT Dissemination
EUMETSAT MHS GDS Level 1 - NOAA
The Microwave Humidity Sounder (MHS) is a 5 channel instrument used to provide input to the retrieval of surface temperatures, emissivities, and atmospheric humidity. In combination with AMSU-A information it can also be used to process precipitation rates and related cloud properties, as well as to detect sea ice and snow coverage.
Full Global
BUFR 1.0MB 480 (per day)
GTS
EUMETSAT Polar Winds - Metop
Winds at all heights below the tropopause in the polar regions (latitudes higher than 55º), derived from the METOP AVHRR instrument IR 10.8 channel.
Polar regions (latitudes higher than 55º)
BUFR 12.0KB ~150 (per day)
GTS
EUMETSAT Rapid Scan Active Fire Monitoring (CAP) - MSG
The Rapid Scanning Services (RSS) Active Fire Monitoring Product is a fire detection product indicating the presence of fire within a pixel. The underlying concept of the algorithm takes advantage of the fact that SEVIRI channel IR3.9 is very sensitive to hot spots which are caused by fires. The algorithm distinguishes between potential fire and active fire. Applications and Users: Fire detection and monitoring. This product is available in CAP (Common Alert Protocol) format. The CAP formatted product is only disseminated when a fire/potential fire is detected in any given repeat cycle.
Regional Northern Hemisphere
CAP (Common Alert Protocol)
0 maximum 288 (per day)
-
EUMETSAT Rapid Scan Active Fire Monitoring (GRIB) - MSG
The active fire monitoring product is a fire detection product indicating the presence of fire within a pixel. The underlying concept of the algorithm takes advantage of the fact that SEVIRI channel IR3.9 is very sensitive to hot spots which are caused by fires. The algorithm distinguishes between potential fire and active fire. Applications and Users: Fire detection and monitoring.
Regional Northern Hemisphere
GRIB2 20.0KB 288 (per day)
-
EUMETSAT Rapid Scan Atmospheric Motion Vectors - MSG
Atmospheric Motion Vectors at all heights below the tropopause, derived from 5 channels: Visual (0.8), Water Vapour (6.2), Water Vapour (7.3), Infrared (10.8) and the High Resolution Visual channel, combined into one product. The same algorithm as for the Full Earth Scanning AMV product is used, but the area is limited to north of 35 degrees N. As the RSS image scanning frequency is only 5 minutes, the Final vector is a 15 minutes average of three 5 minutes vector components. A RSS AMV product contain between 1000 and 1500 vectors depending of the time of the day, and uses SEVERI image data from Meteosat-8 and onwards. It's the aim to extend both the area and the amount of channels when hardware resources has been made available.
Reduced Disk Northern Hemisphere
BUFR 1.0MB 72 (per day)
GTS
EUMETSAT Rapid Scan Clear-Sky Radiances - MSG
The Clear-Sky Radiances (CSR) product is a subset of the information derived during the Scenes Analysis processing. The product provides the radiances for a subset of the MSG channels averaged over all pixels within a processing segment which have been identified as clear, except for channel WV6.2 where the CSR is also derived for areas containing low-level clouds. The final CSR product is BUFR encoded at every third quarter of the hour (e.g 00:45, 01:45 ...) and distributed to the users via EUMETCAST and GTS. It is
Reduced Disk Northern Hemisphere
BUFR 3.0MB 96 GTS
70

EUM/OPS/DOC/09/2445 v6 Draft, 16 May 2013
EUMETCast-Africa Dissemination Baseline Overview Data Provider
Product Name
Description Coverage Formats File size Frequency Other NRT Dissemination
also stored in the EUMETSAT Data Centre. Applications and Users: Numerical weather prediction
EUMETSAT Rapid Scan High Rate SEVIRI Level 1.5 Image Data - MSG
Rectified (level 1.5) Meteosat SEVIRI Rapid Scan image data. The baseline scan region is a reduced area of the top 1/3 of a nominal repeat cycle, covering a latitude range from approximately 15 degrees to 70 degrees. The service generates repeat cycles at 5-minute intervals (the same as currently used for weather radars). The dissemination of RSS data is similar to the normal dissemination, with image segments based on 464 lines and compatible with the full disk level 1.5 data scans. Epilogue and prologue (L1.5 Header and L1.5 Trailer) have the same structure. Calibration is as in Full Earth Scan. Image rectification is to 9.5 degreesE. The scans start at 00:00, 00:05, 00:10, 00:15 ... etc. (5 min scan). The differences from the nominal Full Earth scan are that for channels 1 - 11, only segments 6 - 8 are disseminated and for the High Resolution Visible Channel only segments 16 - 24 are disseminated.
Reduced Disk Northern Hemisphere
HRIT (lossless wavelet compressed)
1.0MB 288 (per day)
-
EUMETSAT Rapid Scan Multi-sensor Precipitation Estimate (GRIB) - MSG
The Multi-Sensor Precipitation Estimate (MPE) product consists of the near-real-time rain rates in mm/hr for each Meteosat image in original pixel resolution. The algorithm is based on the combination of polar orbiter microwave measurements and images in the Meteosat IR channel by a so-called blending technique. The MPE is most suitable for convective precipitation. Applications and Users: Operational weather forecasting in areas with poor or no radar coverage.
Reduced Disk Northern Hemisphere
GRIB 1.0MB 288 (per day)
-
EUMETSAT Rapid Scan Regional Instability Index - MSG
Atmospheric air mass instability. Applications and Users: Nowcasting and short term forecasting (up to 12 hours). This is the pixel-based version of the Global Instability Index (GII). It is produced for a subset of the MSG image disk over Europe.
Subset of Full Disk 0 degrees
BUFR 12.0MB 288 (per day)
-
EUMETSAT Volcanic Ash Detection (netCDF) - MSG - 0 degree
The Volcanic Ash Detection product is restricted to those National Meteorological Services that are members of EUMETSAT and the European Volcano Observatory Space Services. The ash detection is based on a reversed split window technique, supported by tests in the other IR channels and two VIS channels. The product is disseminated in netCDF classic format, that contains as main parameters the ash mass loading and the mean ash particle size. Note that the netCDF files have been compressed with bzip2 and before uncompressing them, the 103 bytes LRIT header must first be removed. The navigation data is not supplied within the netCDF product but can be found in the online resources.
Full Disk 0 degrees
netCDF 70.0KB 96 (per day)
-
EUMETSAT SSMIS - Lower Atmospheric Sounding
The LAS product, in BUFR format, is a EUMETSAT product extracted and processed from full resolution NOAA SSMIS SDR data, specifically from the Lower Atmospheric Sounding sub-instrument data.
Global BUFR 1.6MB 28 (per day) - 1 per orbit per
-
71

EUM/OPS/DOC/09/2445 v6 Draft, 16 May 2013
EUMETCast-Africa Dissemination Baseline Overview Data Provider
Product Name
Description Coverage Formats File size Frequency Other NRT Dissemination
Channels - DMSP
satellite (14 each)
EUMETSAT SSMIS - Upper Atmospheric Sounding Channels - DMSP
The UAS product, in BUFR format, is a EUMETSAT product extracted and processed from full resolution NOAA SSMIS SDR data, specifically from the Upper Atmospheric Sounding sub-instrument data.
Global BUFR 0.2MB 28 (per day) - 1 per orbit per satellite (14 each)
-
EUMETSAT SSMIS - Environmental Channels - DMSP
The ENV product, in BUFR format, is a EUMETSAT product extracted and processed from full resolution NOAA SSMIS SDR data, specifically from the ENVIRONMENT sub-instrument data.
Global BUFR 5.1MB 28 (per day) - 1 per orbit per satellite (14 each)
-
EUMETSAT SSMIS - Imaging Channels - DMSP
The IMA product, in BUFR format, is a EUMETSAT product extracted and processed from full resolution NOAA SSMIS SDR data, specifically from the IMAGER sub-instrument data.
Global BUFR 7.1MB 28 (per day) - 1 per orbit per satellite (14 each)
-
H-SAF Accumulated precipitation at ground by blended MW and IR - Multimission
Derived from precipitation maps generated by merging MW images from operational sun-synchronous satellites and IR images from geostationary satellites, and presented in polar stereographic projection.
Europe GRIB 10KB 32 (per day)
Download
H-SAF Instantaneous and accumulated precipitation at ground computed by a NWP model
Fields of precipitation rate and accumulated precipitation generated by a non-hydrostatic operational NWP model (COSMO-ME) to provide spatial-temporal continuity to the observed fields otherwise affected by temporal and spatial gaps due to insufficient and inhomogeneous satellite cover. The accumulated precipitation is integrated over 3, 6, 12 and 24 h.
Europe GRIB 110.0KB 40 (per day)
Download
H-SAF Precipitation Instantaneous precipitation maps generated by IR images from operational geostationary Europe GRIB 130.0KB 96 (per Download
72

EUM/OPS/DOC/09/2445 v6 Draft, 16 May 2013
EUMETCast-Africa Dissemination Baseline Overview Data Provider
Product Name
Description Coverage Formats File size Frequency Other NRT Dissemination
rate at ground by GEO/IR supported by LEO/MW - MSG
satellites 'calibrated' by precipitation measurements from MW images in sun-synchronous orbits, processed soon after each acquisition of a new image from GEO ('Rapid Update'). The calibrating lookup tables are updated after each new pass of a MW-equipped satellite. The algorithm is the result of a combined effort between CNR-ISAC and the Naval Research Laboratory (Monterey, California, USA). The product is mostly suitable for convective precipitation.
day)
H-SAF Precipitation rate at ground by MW conical scanners (with indication of phase) - DMSP
Instantaneous precipitation maps generated from MW images taken by conical scanners on operational satellites in sunsynchronous orbits processed soon after each satellite pass and presented in the natural projection of the image from sunsynchronous orbit.
Europe BUFR 200.0KB ~30 (per day)
Download
H-SAF Precipitation rate at ground by MW cross-track scanners (with indication of phase) - Multimission
Instantaneous precipitation maps generated from MW imagers taken by cross-track scanners on operational satellites in sun-synchronous orbits processed soon after each satellite pass and presented in the natural projection of the image from sun-synchronous orbit.
Europe BUFR 200.0KB ~40 (per day) (per satellite)
Download
H-SAF Profile index in the roots region by scatterometer data assimilation
The first global product of consistent surface and root zone soil moisture available NRT for the NWP, climate and hydrological communities, it is based on ASCAT surface soil moisture data assimilation in the ECMWF Land Data Assimilation System. In the soil moisture assimilation system, the surface observation from ASCAT is propagated towards the roots region down to 2.89 m below surface, providing estimates for 4 layers (thicknesses 0.07, 0.21, 0.72 and 1.89 m). The ECMWF model generates soil moisture profile information according to the Hydrology Tiled ECMWF Scheme for Surface Exchanges over Land (HTESSEL).
Global GRIB
2.1MB
1 (per day) Download
H-SAF Small-scale surface soil moisture by
Derived from the CAF Global ASCAT SM product limited to the H-SAF area. Maps of the soil moisture content in the surface layer (0-2 cm) generated from the Metop scatterometer (ASCAT) processed shortly after each satellite orbit completion. It is
Europe BUFR 7.5MB 14-15 (per day)
Download
73

EUM/OPS/DOC/09/2445 v6 Draft, 16 May 2013
EUMETCast-Africa Dissemination Baseline Overview Data Provider
Product Name
Description Coverage Formats File size Frequency Other NRT Dissemination
radar scatterometer - Metop
generated by disaggregating the large-scale product (25 km resolution), to 0.5-km sampling with downscaling parameters derived from ENVISAT ASAR (C-band).
H-SAF Snow detection (snow mask) by VIS/IR radiometry - MSG
Contours of snow-covered areas, presented as mask-like maps (binary image). VIS/IR images from both LEO and GEO are used. The Finish Meteorological Institute (FMI) day_FMI product is based on flat/forested areas. The FMI produced day_merged product is a blend of the day_FMI product with the Turkish State Meteorological Service (TSMS) mountainous area product.
Europe HDF5 0.0KB 1 (each per day)
Download
ISRO OSCAT L2A ISRO product - Oceansat
The OSCAT L2A product from the Indian Space Research Organisation (ISRO) contains Normalised Radar Cross Section (NRCS) measurements in 50x50km grid cells along- and across-swath. The data are provided by ISRO and obtained through the processing of scatterometer data originating from the SCAT instrument on their Oceansat-2 satellite. These are full orbit products with global coverage.
Global HDF5 3.7MB
14-15 (per day)
-
ISRO OSCAT L2B ISRO product - Oceansat
The OSCAT wind product from the Indian Space Research Organisation (ISRO) contains measurements of the wind direction and wind speed at 10 m above the sea surface. Wind vectors are provided on a swath grid with 50x50km grid spacing. The data are provided by ISRO and obtained through the processing of scatterometer data originating from the SCAT instrument on their Oceansat-2 satellite. These are full orbit products with global coverage.
Global HDF5 550.0KB
14-15 (per day)
-
JMA Image data (hourly) - MTSAT-2
Image data in the form of Low Rate transmissions, in 4 spectral channels: Visible (VIS) 0.55 - 0.90, Infrared 1 (IR1) 10.3 - 11.3, Infrared 3 (IR3) 6.5 - 7.0, Infrared 4 (IR4) 3.5 - 4.0. Note: For the VIS channel 007 there are no data between 12.00 - 19.00 UTC due to under illumination.
Full Disk from 140 degrees E
LRIT (Wavelet compressed),
1.0 MB 16 (per day),
-
LSA SAF Fire Risk Map - MSG
The FRM product from the LSA SAF combines information from Numerical Weather Prediction (NWP) models - in this case the operational forecasts from ECMWF - and vegetation state from SEVIRI to derive forecasts of the risk of fire for the European region.
Europe, North Africa, South Africa, South America
HDF5 1.5MB 3 per day (only Europe)
Download
NASA Level 1 Calibrated Radiances -
MODIS Aqua and Terra level 1 spatially thinned radiance data (MOD02), comprising a subset of channels and covering Europe, North Atlantic and the northern polar region. Note that MODIS l1b data sent over EUMETCast are valid HDF4 format data, but are not
Europe, North Atlantic
HDF4 60.0MB ~78 (per day)
-
74
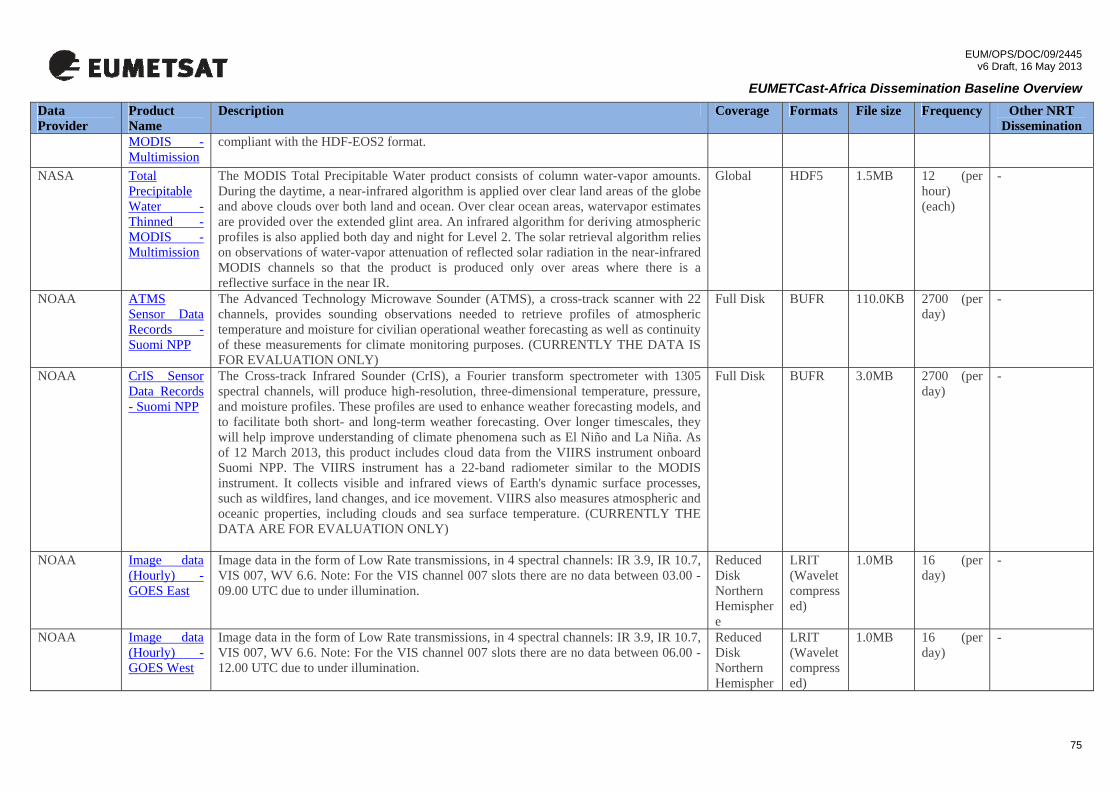
EUM/OPS/DOC/09/2445 v6 Draft, 16 May 2013
EUMETCast-Africa Dissemination Baseline Overview Data Provider
Product Name
Description Coverage Formats File size Frequency Other NRT Dissemination
MODIS - Multimission
compliant with the HDF-EOS2 format.
NASA Total Precipitable Water - Thinned - MODIS - Multimission
The MODIS Total Precipitable Water product consists of column water-vapor amounts. During the daytime, a near-infrared algorithm is applied over clear land areas of the globe and above clouds over both land and ocean. Over clear ocean areas, watervapor estimates are provided over the extended glint area. An infrared algorithm for deriving atmospheric profiles is also applied both day and night for Level 2. The solar retrieval algorithm relies on observations of water-vapor attenuation of reflected solar radiation in the near-infrared MODIS channels so that the product is produced only over areas where there is a reflective surface in the near IR.
Global HDF5 1.5MB 12 (per hour) (each)
-
NOAA ATMS Sensor Data Records - Suomi NPP
The Advanced Technology Microwave Sounder (ATMS), a cross-track scanner with 22 channels, provides sounding observations needed to retrieve profiles of atmospheric temperature and moisture for civilian operational weather forecasting as well as continuity of these measurements for climate monitoring purposes. (CURRENTLY THE DATA IS FOR EVALUATION ONLY)
Full Disk BUFR 110.0KB 2700 (per day)
-
NOAA CrIS Sensor Data Records - Suomi NPP
The Cross-track Infrared Sounder (CrIS), a Fourier transform spectrometer with 1305 spectral channels, will produce high-resolution, three-dimensional temperature, pressure, and moisture profiles. These profiles are used to enhance weather forecasting models, and to facilitate both short- and long-term weather forecasting. Over longer timescales, they will help improve understanding of climate phenomena such as El Niño and La Niña. As of 12 March 2013, this product includes cloud data from the VIIRS instrument onboard Suomi NPP. The VIIRS instrument has a 22-band radiometer similar to the MODIS instrument. It collects visible and infrared views of Earth's dynamic surface processes, such as wildfires, land changes, and ice movement. VIIRS also measures atmospheric and oceanic properties, including clouds and sea surface temperature. (CURRENTLY THE DATA ARE FOR EVALUATION ONLY)
Full Disk BUFR 3.0MB 2700 (per day)
-
NOAA Image data (Hourly) - GOES East
Image data in the form of Low Rate transmissions, in 4 spectral channels: IR 3.9, IR 10.7, VIS 007, WV 6.6. Note: For the VIS channel 007 slots there are no data between 03.00 - 09.00 UTC due to under illumination.
Reduced Disk Northern Hemisphere
LRIT (Wavelet compressed)
1.0MB 16 (per day)
-
NOAA Image data (Hourly) - GOES West
Image data in the form of Low Rate transmissions, in 4 spectral channels: IR 3.9, IR 10.7, VIS 007, WV 6.6. Note: For the VIS channel 007 slots there are no data between 06.00 - 12.00 UTC due to under illumination.
Reduced Disk Northern Hemispher
LRIT (Wavelet compressed)
1.0MB 16 (per day)
-
75

EUM/OPS/DOC/09/2445 v6 Draft, 16 May 2013
EUMETCast-Africa Dissemination Baseline Overview Data Provider
Product Name
Description Coverage Formats File size Frequency Other NRT Dissemination
e NOAA Mapped
Normalized Difference Vegetation Index - NOAA
Mapped NDVI; vegetation health: global, North America, South America. Disseminated products are from N18 and N19, consisting of two file types: WN (Weekly Normalized GVI File) and WD (Weekly GVI Documentation File).
Full Global
Native Binary
2.2MB 1 each for WD/WN for N18 and N19 (per week)
-
NOAA Ocean surface winds - DMSP
SSM/I ocean surface winds depict wind speeds (no direction) at 19.5 m over the ocean surface.
Full Global
BUFR 2.4MB ~14 each for F16 and F17 (per day)
-
NOAA Snow Cover Mapped - Multimission
AMSU-B Snow Cover Map; MHS Snow Cover Map. The Microwave Surface and Precipitation Products System (MSPPS) project is dedicated to the retrieval of near-real-time operational surface and precipitation products using antenna temperatures from the AMSU-A and AMSU-B/MHS instruments on board of NOAA's KLMNN series and the EUMETSAT Polar System's (EPS) Metop series of polar-orbiting satellites.
Full Global
HDF EOS
30.0MB 1 each for AMSU N17, MHS N18, MHS N19 (per day)
-
NOAA Snow Depth - NOAA - Southern Hemisphere
The Meteorological Satellite Applications Branch of the Air Force Weather Agency (AFWA) exploits satellite imagery worldwide, mainly focusing on data-sparse areas. Snow depth analyses are provided for many remote desert and mountain regions.
Southern Hemisphere
Native Binary
700.0KB 1 (per day) -
NOAA Total Precipitable Water Mapped - Multimission
AMSU-A Total Precipitable Water Map. The Microwave Surface and Precipitation Products System (MSPPS) project is dedicated to the retrieval of near-real-time operational surface and precipitation products using antenna temperatures from the AMSU-A and AMSU-B/MHS instruments on board of NOAA's KLMNN series and the EUMETSAT Polar System's (EPS) Metop series of polar-orbiting satellites.
Full Global
HDF EOS
10.0MB 1 each for N18 and N19 (per day)
-
O3M SAF Near Real Time Ozone Profiles - Metop
The NRT Ozone Profile (NOP) product provides ozone profiles reported as partial columns, in Dobson Units, between 41 pressure levels logarithmically spaced between and including surface pressure and 0.1 hPa. For cloudy and partially cloudy scenes, the cloud-top pressure replaces the nearest pressure level. Geographical coverage, spatial resolution and temporal frequencies of the GOME2 Ozone Profile Product are determined by the instrument. This product is not archived. For an archived version, please refer to the Offline Ozone Profile.
Full Global
HDF5 3.2MB
250 (daylight PDUs only)
Download / extension to Africa under implementation
O3M SAF Near Real Time Total
The Near Real Time Total Column (NTO) product provides information about total columns of three type of trace gases in the atmosphere: O3 (Ozone), NO2 (Nitrogen
Full Global
HDF5 650.0KB
250 (daylight
Download / extension to
76

EUM/OPS/DOC/09/2445 v6 Draft, 16 May 2013
EUMETCast-Africa Dissemination Baseline Overview Data Provider
Product Name
Description Coverage Formats File size Frequency Other NRT Dissemination
Column - Metop
Dioxide) as well as tropospheric NO2, and SO2 (Sulphur Dioxide). The product is disseminated as one file containing the total column ozone, the total column NO2, the tropospheric NO2 and the total column SO2. For an archived version, please refer to the Offline Total Column Product.
PDUs only)
Africa under implementation
O3M SAF NRT Absorbing Aerosol Index
The AAI indicates the presence of elevated absorbing aerosols in the atmosphere
Full Global
HDF5 220KB
maximum 300 (per day)
Download
OSI SAF OSCAT Winds at 50 km Swath Grid - Oceansat
The OSI SAF wind product contains surface winds over the oceans. Additionally, the backscatter values involved in the retrieval of the winds are also included, as well as several quality flags to facilitate the use of the data.
Full Global
BUFR 2.5MB
14 (per day)
Download
ROM SAF Near Real-Time Refractivity Profile - Metop
The refractive index of the atmosphere as function of height at tangent point. Given in refractivity units (N)
Full Global
BUFR 12.0KB approx 700 (one per occultation)
Download
SERVIR Daily Fire Image - MODIS - Aqua/Terra - Central America
The Daily Fire Image is a product used to monitor the location and extent of fires and their potential impact in the region. The images are based on MODIS data taken from on board the Terra and Aqua satellites. The data are processed within the SERVIR Fire Rapid Response System into fire products within 3-4 hours after acquisition. Three products are made from both Aqua and Terra at 250, 500 and 1000 meter spatial resolutions.
Central America
JPG (1 km)
140.0KB 1 (per day) -
SERVIR Short Term Precipitation Forecasting (MM5) - Central America
Short-term regional weather forecasts, produced by SERVIR, using the PSU/NCAR Mesoscale Model, known as MM5 in the atmospheric sciences community. The MM5 model generates 48 hour-forecasts once a day. Soil temperature, 2 m surface temperature, 3 hour accumulated precipitation as an early warning, wind in different heights, and other variables are forecast hourly in 9 km grids covering the Yucatan Peninsula to northwest Panama.
Central America
GIF 120.0KB 96 (per day)
-
WMO Basic Meteorological Data
The Basic Meteorological Data (BMD) Service within the WMO Regional Association VI contains a set of data specific for this region which is multicast via the EUMETCast system. The data contains data such as SYNOP, TEMP, PILOT, Warnings and Tropical
GRIB 1.0MB Daily -
77
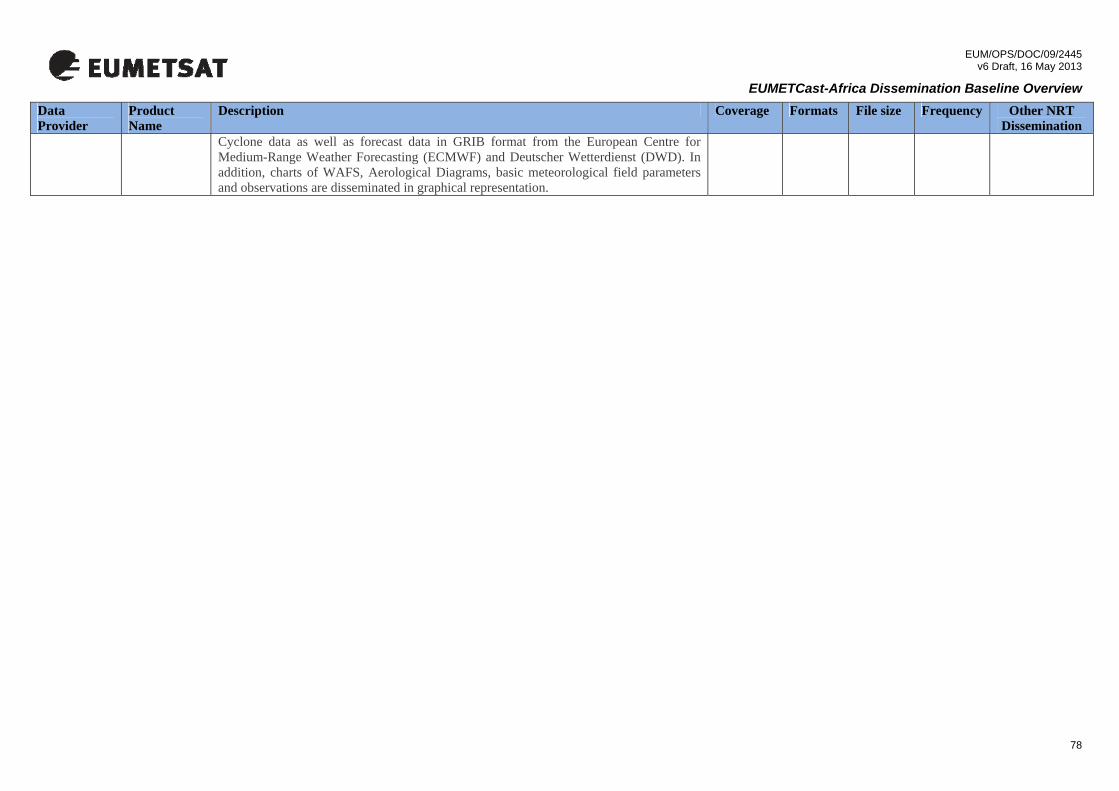
EUM/OPS/DOC/09/2445 v6 Draft, 16 May 2013
EUMETCast-Africa Dissemination Baseline Overview
78
Data Provider
Product Name
Description Coverage Formats File size Frequency Other NRT Dissemination
Cyclone data as well as forecast data in GRIB format from the European Centre for Medium-Range Weather Forecasting (ECMWF) and Deutscher Wetterdienst (DWD). In addition, charts of WAFS, Aerological Diagrams, basic meteorological field parameters and observations are disseminated in graphical representation.
EUM/OPS/DOC/09/2445 v6 Draft, 16 May 2013
EUMETCast-Africa Dissemination Baseline Overview
7 REQUEST FOR MODIFICATION TO THE BASELINE
7.1 Baseline Criteria Potential candidates for inclusion or removal from the EUMETCast-Africa Dissemination Baseline will be assessed by EUMETSAT according to the criteria laid down in the document: "Guidelines and Principles for EUMETCast Bandwidth Usage". Proposals for additional data streams to be provided as data services via EUMETCast are initiated by the potential Users of the data stream, or by the Data Providers (EUMETSAT Secretariat, SAFs and third parties). These proposals are considered in light of the following mandatory criteria:
- The data stream is meteorological, climate or environmental in nature (mandatory);
- The data stream is of benefit to the existing EUMETCast User community. A request/support letter from the data provider or one or more user communities is mandatory in cases concerning third party data streams;
- The applicability of EUMETCast as a delivery mechanism for the data stream (mandatory);
- The bandwidth requirements and cost model category applicable to the data stream. (mandatory);
- The need for timeliness of data dissemination: NRT dissemination to Users has priority;
- The status of a data stream: operational data streams have higher priority than experimental;
- The availability of specific software to enable visualisation/usage of a data stream;
- The data service is required for a longer period of time; - There is a well defined and sufficiently large User community; - Alternative data dissemination schemes shall be analysed along with an
assessment of the most cost-effective means of disseminating the data service.
In case of third party data streams the following extra criteria need to be considered: - For data providers other than EUMETSAT, the data stream is non-commercial.
The dissemination services offered by EUMETSAT only relate to projects for the common good, initiated and managed within a public or institutional framework (mandatory);
- The availability of the product for dissemination (short or long term); - The potential for a financial contribution to the relevant EUMETCast costs; - The data stream will enhance the value of EUMETSAT data streams, e.g.
offering possibilities for synergetic use. The continuation of any data stream on EUMETCast beyond an initial trial period would require the establishment of an Agreement with the partner concerned in line with the legal principles established for Third Party data services on EUMETCast.
79
EUM/OPS/DOC/09/2445 v6 Draft, 16 May 2013
EUMETCast-Africa Dissemination Baseline Overview
In cases where it is anticipated that the third-party data provider will be covering all the costs associated with the delivery of their data streams, only the mandatory criteria will be taken into consideration. Note: any request shall be assessed against the latest approved guidelines and these may differ from those printed above.
7.2 Modification Procedure It is expected that the contents of the EUMETCast-Africa broadcast as detailed in this document shall be reviewed by the WMO RA-I Expert Group on “EUMETCast Product and Dissemination”., hereby referred to as the 'Expert Group' and feedback provided to EUMETSAT (via the WMO), in accordance with the Terms of Reference of the Expert Group. The procedure to request modification to the EUMETCast-Africa baseline is as follows. Expert Group reviews the list provided and:
1. Identifies an obsolete and/or new product for removal/inclusion in the EUMETCast-Africa broadcast
2. Prepares the necessary justification statement: ⇒ In the case of a new product:
i. Identification of the user community who would benefit from the product
ii. Timeframe product is required (e.g. support to a specific project) iii. Description of the intended application /usage of the product
⇒ In the case of an obsolete product: i. Provide short statement on why the product is no longer relevant for
the EUMETCast-Africa user community. 3. Completes EUMETCast-Africa Baseline Feedback Form (see Appendix A),
incorporating the justification statement, and returns this via the WMO to the EUMETSAT User Service ([email protected]).
Upon receipt of the Feedback Form, EUMETSAT shall perform the following tasks:
4. Assess the request according to the agreed guidelines on EUMETCast bandwidth
usage. 5. Evaluate any potential EUMETCast-Africa bandwidth impact 6. For modifications to Third-party data streams and/or the addition of new third-party
data streams, EUMETSAT will contact the Third-Party Data Provider to request their approval of the modification and/or the availability of any newly requested products.
7. Request approval for the modification via the EUMETSAT Delegate Body approval process.
8. Inform the WMO of the outcome of the decision.
80
EUM/OPS/DOC/09/2445 v6 Draft, 16 May 2013
EUMETCast-Africa Dissemination Baseline Overview
In the case of successful modification requests, EUMETSAT will:
9. Implement the requested change on EUMETCast-Africa 10. Prepare relevant user announcements. 11. Update the EUMETCast-Africa Baseline document accordingly.
81

EUM/OPS/DOC/09/2445 v6 Draft, 16 May 2013
EUMETCast-Africa Dissemination Baseline Overview
APPENDIX A EUMETCAST-AFRICA BASELINE FEEDBACK FORM Requesting Organisation/Project
WMO RA-I Expert Group on “EUMETCast Product and Dissemination”.
Point of Contact
Product Name/Description
Request type New Product (Y/N)
Obsolete Product (Y/N
Justification Statement *
For new products please continue: Potential source of new product/data/service
Preferred generation frequency / timeliness requirement
Preferred geospatial coverage area
Preferred format
82

EUM/OPS/DOC/09/2445 v6 Draft, 16 May 2013
EUMETCast-Africa Dissemination Baseline Overview
83
File size, if known
Other important requirements concerning the product
* Justification Statement shall include the following information:
⇒ In the case of a new and/or modification to an existing product: i. Identification of the user community who would benefit from the
product ii. Timeframe product is required (e.g. support to a specific project)
iii. Description of the intended application /usage of the product ⇒ In the case of an obsolete product:
i. Provide short statement on why product is no longer relevant for the EUMETCast-Africa user community.


![MTG EUMETCast Africa Product User Guide [AfricaPUG]](https://static.fdocuments.in/doc/165x107/61f85f9314866253b36e1ef9/mtg-eumetcast-africa-product-user-guide-africapug.jpg)

