EU Pigmeat Market Situation · 2018-10-10 · Meat Market Observatory – Economic Board meeting...
24
Meat Market Observatory – Economic Board meeting 02 October 2018 EU Pigmeat Market Situation
-
Upload
trinhduong -
Category
Documents
-
view
215 -
download
0
Transcript of EU Pigmeat Market Situation · 2018-10-10 · Meat Market Observatory – Economic Board meeting...
Meat Market Observatory – Economic Board meeting 02 October 2018
EU Pigmeat Market Situation

DG AGRI G3 02 October 2018
EXCHANGE RATE INDEX/EURO
70
80
90
100
110
120
130
140
Index of daily exchange rates of the main trading partners compared to the Euro
US Dollar Brazilian Real Canadian Dollar
Russian Rouble Chinese Yuan UK Pound Sterling

DG AGRI G3 02 October 2018
PRODUCTION
EU E V O L U T I O N
T O T A L P I G
2016 vs. 2015 2017 vs. 2016 2018 vs. 2017Expe rts 2 0 18
vs.
Expe rts 2 0 17
GIP 2 0 18
vs.
GIP 2 0 17
Q1 + 1.0% - 1.0% + 2.6% + 0.9% + 1.1%
Q2 + 3.2% - 3.3% + 2.9% + 1.1% + 1.1%
Q3 + 1.2% - 0.8% + 1.2% + 2.0%
Q4 + 0.1% + 0.0% + 1.5% + 1.5%
Full year + 1.3% - 1.3% + 1.2% + 1.4%
Real Slaughter
- 4%
- 3%
- 2%
- 1%
+ 0%
+ 1%
+ 2%
+ 3%
+ 4%
+ 5%
2016 vs. 2015 2017 vs. 2016 2018 vs. 2017 Experts 2018 vs.
Experts 2017
GIP 2018 vs.
GIP 2017
Change in EU pigmeat slaughter (2018 forecast based on GIP and experts estimations) ('000 heads)
Q1 Q2 Q3 Q4 Full year

DG AGRI G3 02 October 2018
PRODUCTION
EU E V O L U T I O N
T O T A L P I G
0
10 000
20 000
30 000
40 000
50 000
60 000
Pigmeat Q1 Pigmeat Q2 Pigmeat Q3 Pigmeat Q4
65
36
4
63
73
5
63
23
0
66
13
2
64
72
1
61
61
0
62
73
6
66
14
7
66
39
8
63
38
4
0 0
65
38
6
64
04
7
64
69
0
68
65
0
64
43
3
62
69
2
63
97
7
66
94
2
EU pigmeat slaughter in 2016-2018, GIP and expert estimations for 2018('1000 heads)
2016 2017 2018 GIP 2018 Experts 2018f

DG AGRI G3 02 October 2018
P R O D U C T I O N
23
.2%
14
.8%
10
.8%
6.9
%
6.0
%
5.7
%
5.5
%
5.4
%
4.5
%
4.4
%
4.4
%
3.9
%
3.7
%
1.8
%
1.6
%
1.5
%
0.8
%
0.5
%
0.2
%
-0.7
%
-0.8
%
-2.1
%
-2.2
%
-2.4
%
-3.3
%
-4.8
%
-5.0
%
-9.9
%
2.7
%
-15%
-10%
-5%
0%
5%
10%
15%
20%
25%
SK RO LV BG ES PL EE LT NL BE IE UK DK PT SE FR HU HR AT CY DE SI IT CZ LU EL MT FI EU
Change in Pig Slaughter ('000 Heads)
2018/2017 (up to June)
Source: Eurostat
% E V O L U T I O N
IN HEADS

DG AGRI G3 02 October 2018
P R O D U C T I O N
23
.4%
15
.0%
9.5
%
9.1
%
8.2
%
7.8
%
6.3
%
5.9
%
5.8
%
4.5
%
4.4
%
4.1
%
3.9
%
3.8
%
2.9
%
2.3
%
2.3
%
2.2
%
2.0
%
0.6
%
0.5
%
-0.3
%
-0.7
%
-1.0
%
-2.2
%
-3.4
%
-9.5
%
-9.7
%
3.7%
-15%
-10%
-5%
0%
5%
10%
15%
20%
25%
30%
SK RO LV PL BG ES IE EE NL UK LT BE DK EL SE HR HU PT FR AT IT CZ DE SI CY LU FI MT EU
Change in Pig Slaughter ('000 tonnes)
2018/2017 (up to June)
Source: Eurostat
% E V O L U T I O N
IN TONNES

DG AGRI G3 02 October 2018
PRODUCTION
EU E V O L U T I O N
T O T A L P I G
0
500
1 000
1 500
2 000
2 500
Jan Feb Mar Apr May Jun Jul Aug Sep Oct Nov Dec
Pig Production (E28 Slaughtering) - Tonnes
2015 2016 2017 2018
Source: Eurostat

DG AGRI G3 02 October 2018
P I G P R I C E S
EU E V O L U T I O N
EU
Pric
es
EU Prices Evolution since
last week
146.1Average
(S-E)- 1.7%
- 1.6%147.7Class S
143.6Class E - 1.9%
35.3Piglet - 2.0%€/head
€/1
00
kg
ca
rca
ss w
eig
ht
Evolution since last
month
Evolution since last
year
- 4.6%
- 4.2%
- 5.1%
- 4.0%
- 10.7%
- 10.6%
- 11.0%
- 23.1%
38
DG AGRI G3 02 October 2018
P R I C E S
C A R C A S E S
E U E V O L U T I O N
AVERAGE CLASSES S & E
115
130
145
160
175
190
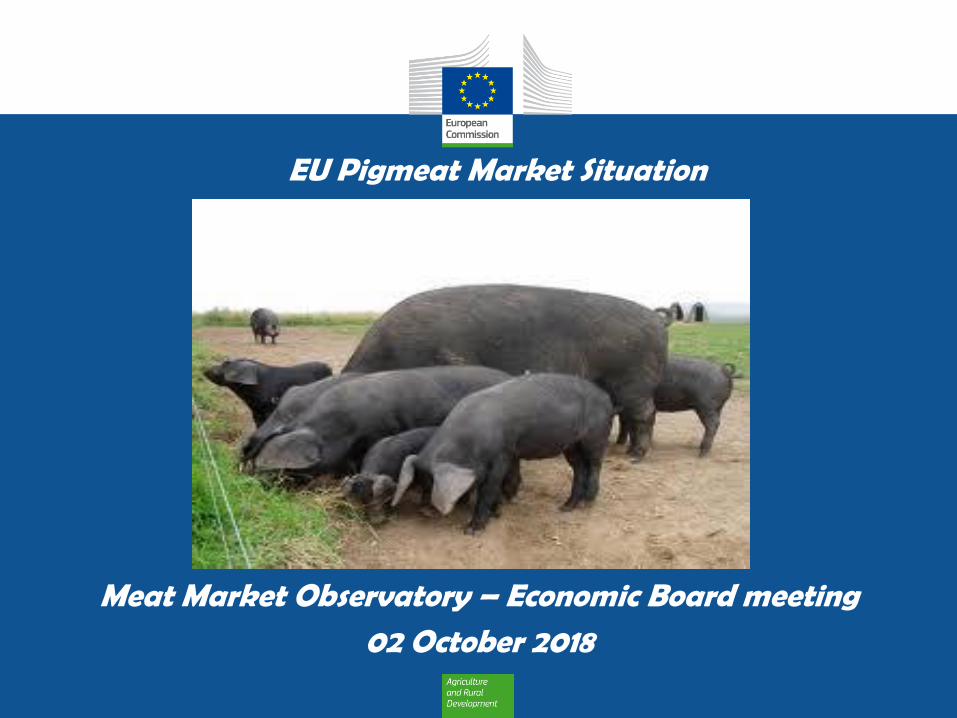
EU evolution of the EU pig carcass prices (average class E & S)(€/ 100kg/cw)
Average (13 -17) 2016 2017 2018
Week 38 latest price ==> 146.14 EUR/100 kg/cw
Evolution compared same period last year : - 10.7%

DG AGRI G3 02 October 2018
P R I C E S
C A R C A S E S
EU E V O L U T I O N
Aug-2017 Aug-2018 Aug-2017 Aug-2018 Aug-2017 Aug-2018
CY 211.67 202.32 EL 202.80 175.77 IT 222.20 196.36
EL 202.80 175.77 PT 199.74 174.00 ES 183.98 160.53
PT 198.74 174.16 SI 187.96 170.31 SK 160.72 139.76
BG 207.75 171.69 AT 190.21 169.13 LU 156.57 135.26
IT 183.06 167.99 UK 182.87 168.29 FI 126.67 132.02
UK 180.37 165.30 SE 184.20 166.15 LT 156.45 128.08
SI 177.67 162.20 FI 160.39 164.10 DE 146.14 126.64
SE 181.16 162.01 RO 189.71 160.28 UK 172.49 124.91
FI 156.16 157.78 DE 179.53 157.76 LV 110.81 123.19
AT 178.31 157.08 SK 181.51 157.75 DK 97.65
RO 186.84 155.87 LU 179.41 157.73 EE
SK 175.55 155.65 ES 181.34 157.05
DE 174.74 154.21 HU 182.08 157.01 EU 193.95 167.99HU 178.15 153.47 HR 177.59 154.19
HR 174.71 152.77 EE 166.71 151.75
ES 175.51 152.31 PL 171.92 150.85
LV 168.05 151.75 CZ 174.28 147.95
LU 172.56 150.52 LV 162.40 145.38
PL 169.62 148.50 LT 176.34 143.81
EE 157.70 146.34 FR 165.45 140.87
CZ 169.63 144.28 IE 163.99 137.77
IE 163.11 137.26 DK 160.50 135.37
LT 173.29 134.41 BE 159.19 134.77
FR 157.23 133.48 NL 153.64 133.07
NL 152.50 131.93
DK 154.58 130.01 EU 174.37 151.57BE 149.41 125.15
EU 170.17 148.68
Classe E Classe S Classe R

DG AGRI G3 02 October 2018
P R I C E S
P I G L E T S
EU E V O L U T I O N
30
35
40
45
50
55
60
65
EU evolution of the EU average piglet prices(€/head)
Average (13 - 17) Piglet - 2016 Piglet - 2017 Piglet - 2018
Week 38 latest price ==> 35.31 EUR/head
Evolution compared same period last year : - 23.1%

DG AGRI G3 02 October 2018
R E M A I N D E R
P I G
EU E V O L U T I O N
33 37 34 34 40 53 64 65 69 61 53 48 42 40 43 53 57 62 64 69 64 52 48 43 35 36 35 30 31 40 45 480
20
40
60
80
100
120
140
160
180
200
In E
uro
s
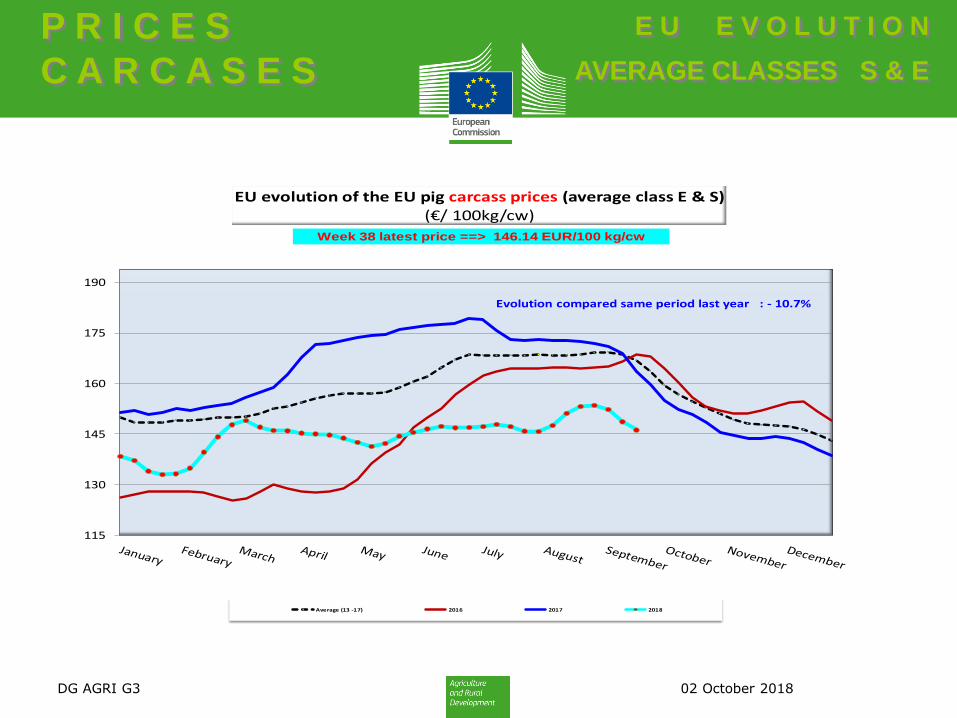
Remainder for pig fattening
Remainder Cost of piglet Feed cost Pig carcass price(€/100 kg)
Average remainder (since March 2012)
DG AGRI G3 02 October 2018
R E M A I N D E R
P I G
EU E V O L U T I O N
38 39 40 41 39 49 61 76 77 69 68 52 43 37 35 38 42 52 62 66 63 50 48 41 37 33 39 40 44 52 52 56 60 53 43 35 33 37 34 34 40 53 64 65 69 61 53 48 42 40 43 53 57 62 64 69 64 52 48 43 35 36 35 30 31 40 45 48
0
50
100
150
200
250
I 2013 I 2014 I 2015 I 2016 I 2017 I 2018
In E
uro
s
Remainder for pig fattening
Remainder Cost of piglet Feed cost Pig carcass price(€/100 kg)
Average remainder (since March 2012)

EU trade of PIG products
DG AGRI G3 02 October 2018
T R A D E
EU T R A D E B A L A N C E
46 1
35
59 7
20
71 9
37
51 6
41
63 8
00
55 9
18
56 0
77
54 4
99
72 2
76
22 6
12
21 7
30
32 3
68
43 1
79
59 8
38
51 7
89
44 1
93
37 6
55
36 9
67
34 4
87
35 2
45
33 0
66
32 7
88
36 3
51
20 5
43
881
011
943
405
1 08
3 23
0
1 23
8 13
8
1 55
6 96
1
1 54
5 90
7
1 33
1 80
8
1 52
6 56
3
1 50
9 30
2
1 78
0 56
8
1 93
8 45
5
2 08
9 36
3
1 91
0 90
8
2 56
9 08
7
2 38
6 24
5
2 62
7 63
0
3 24
6 48
6
3 24
7 95
6
3 24
2 41
4
3 03
3 83
3
3 36
8 26
0
4 15
6 49
0
3 83
3 75
4
2 24
3 35
7
0
250 000
500 000
750 000
1 000 000
1 250 000
1 500 000
1 750 000
2 000 000
2 250 000
2 500 000
2 750 000
3 000 000
3 250 000
3 500 000
3 750 000
4 000 000
4 250 000
4 500 000
1995
1996
1997
1998
1999
2000
2001
2002
2003
2004
2005
2006
2007
2008
2009
2010
2011
2012
2013
2014
2015
2016
2017
Jan-
Jul 1
8
Tonn
es c
arca
se w
eigh
t
EU Trade of PIG products
IMPORTS EXPORTS

EU imports of selected PIG products Trade figures (COMEXT – tonnes carcass weight)
DG AGRI G3 02 October 2018
T R A D E
EU I M P O R T S
P i g P r o d u c t s
IMPORT
Compared
tonnes % tonnes % tonnes % tonnes % tonnes % to Jan- Jul 17
Switzerland 18 207 52% 20 225 61% 22 257 68% 22 922 63% 12 063 59% -5%
Serbia 3 662 10% 1 819 5% 614 2% 2 694 7% 1 947 9% 33%
Norway 3 192 9% 2 315 7% 1 989 6% 2 287 6% 1 746 8% 13%
Chile 3 416 10% 2 896 9% 2 958 9% 2 434 7% 1 629 8% 14%
USA 1 498 4% 1 769 5% 1 711 5% 1 707 5% 973 5% -2%
China 917 3% 380 1% 250 1% 1 315 4% 539 3% 35%
Other 4 353 12% 3 663 11% 3 010 9% 2 994 8% 1 647 8%
Extra-EU 35 245 33 066 32 788 36 351 20 543
% change - 6% - 1% + 11% + 0.9%
2014 2015 2016 Jan-Jul 182017

EU imports of selected PIG products Trade figures (COMEXT – tonnes carcass weight)
12 273 12 747 12 063
2301 469 1 947
1 539 1 7461 9831 431 1 6292 9172 765 2 620
18 70320 352 20 543
0
5 000
10 000
15 000
20 000
25 000
Jan-Jul 16 Jan-Jul 17 Jan-Jul 18
IMPORTS of PIG Meat into EU-28 (Tonnes c. weight)
Switzerland Serbia Norway Chile China Other
9.0 11.4 9.4
0.5
4.1 5.5
6 6.66
4 5.411.7
10.7 10.232.6
38.0 38.1
0
5
10
15
20
25
30
35
40
45
Jan-Jul 16 Jan-Jul 17 Jan-Jul 18
IMPORTS of PIG Meat into EU-28 (Millions EUR)
Switzerland Serbia Norway Chile China Other
DG AGRI G3 02 October 2018
T R A D E
EU I M P O R T S
P i g P r o d u c t s

0
500
1 000
1 500
2 000
2 500
3 000
3 500
4 000
|Jan 16
2016 |Jan 17
2017 |Jan 18
2018
in Tonnes (carcase weight)
Imports of selected PIG products
FRESH FROZEN FAT OTHERS
DG AGRI G3 02 October 2018
T R A D E
EU I M P O R T S
P i g P r o d u c t s

DG AGRI G3 02 October 2018
W O R L D
P I G M A R K E T
I M P O R T S
PIG MAIN IMPORTERS Ch
ina
+ H.
Kon
g
Chin
a +
H. K
ong
Japa
n
Japa
n
Mex
ico (u
p to
Jun)
Mex
ico (u
p to
Jun)
Sout
h Ko
rea
Sout
h Ko
rea
Unite
d St
ates
Unite
d St
ates
Phili
ppin
es (u
p to
Jun)
Phili
ppin
es (u
p to
Jun)
Cana
da
Cana
da
Aust
ralia
Aust
ralia
0
200
400
600
800
1 000
1 200
1 400
2017 (up to July) 2018 (up to July)
Qty
in 1
000
Tonn
es
Main Importers of PIG Products (up to July)
Source : GTA Excl. Live animals

EU exports of selected PIG products: Trade figures (COMEXT – tonnes carcass weight)
Compared to
tonnes % tonnes % tonnes % tonnes % tonnes % Jan-Jul 17
China 717 033 23.6% 1 141 325 33.9% 1 866 355 44.9% 1 398 470 36.5% 785 231 35.0% - 2%
Japan 347 721 11.5% 364 746 10.8% 405 335 9.8% 425 910 11.1% 267 911 11.9% + 4%
South Korea 227 825 7.5% 241 569 7.2% 260 726 6.3% 274 966 7.2% 200 204 8.9% + 16%
Philippines 202 522 6.7% 191 876 5.7% 216 022 5.2% 250 213 6.5% 168 307 7.5% + 11%
Hong Kong 408 183 13.5% 292 391 8.7% 362 492 8.7% 381 013 9.9% 131 651 5.9% - 36%
USA 90 985 3.0% 105 123 3.1% 116 806 2.8% 155 527 4.1% 106 063 4.7% + 14%
Ukraine 106 780 3.5% 96 631 2.9% 75 674 1.8% 88 106 2.3% 55 910 2.5% + 34%
Australia 73 156 2.4% 102 645 3.0% 101 198 2.4% 95 308 2.5% 55 525 2.5% - 6%
Serbia 62 905 2.1% 47 488 1.4% 41 128 1.0% 55 052 1.4% 42 579 1.9% + 42%
Vietnam 16 056 0.5% 38 290 1.1% 53 483 1.3% 41 549 1.1% 40 479 1.8% + 33%
Taiw an 52 970 1.7% 53 701 1.6% 47 865 1.2% 64 392 1.7% 34 861 1.6% - 3%
Ivory Coast 39 773 1.3% 49 766 1.5% 36 385 0.9% 41 433 1.1% 25 601 1.1% + 1%
Other 687 924 22.7% 642 711 19.1% 573 021 13.8% 561 815 14.7% 329 035 14.7%
Extra-EU 3 033 833 3 368 260 4 156 490 3 833 754 2 243 357
% change + 11% + 23% - 8% + 0.9%
2014 2015 2016 Jan-Jul 182017
DG AGRI G3 02 October 2018
T R A D E
E U E X P O R T S
P i g P r o d u c t s

EU exports of selected PIG products Trade figures (COMEXT – tonnes carcass weight)
1 177 435799 267 785 231
242 008
256 864 267 911
137 052
172 253 200 204
131 862
152 021 168 307
200 528
205 171 131 651
607 567
637 841 690 052
2 496 451
2 223 417 2 243 357
0
500 000
1 000 000
1 500 000
2 000 000
2 500 000
3 000 000
Jan-Jul 16 Jan-Jul 17 Jan-Jul 18
Tons (cw) .
EU-28 EXPORTS of PIG Meat (Tonnes carc. weight)
China Japan South Korea Philippines Hong Kong Other
1 7501 207 1 035
732
827817
284
474471
123186
171
285370
221
1 253 1 468
1 456
4 426 4 532
4 171
0
500
1 000
1 500
2 000
2 500
3 000
3 500
4 000
4 500
5 000
Jan-Jul 16 Jan-Jul 17 Jan-Jul 18
in M
illi
on
s E
UR
EU-28 EXPORTS of PIG Meat (Millions EUR)
China Japan South Korea Philippines Hong Kong Other
DG AGRI G3 02 October 2018
T R A D E
EU E X P O R T S
P i g P r o d u c t s

0
50 000
100 000
150 000
200 000
250 000
300 000
350 000
400 000
450 000
|Jan 16
2016 |Jan 17
2017 |Jan 18
2018
in Tonnes (carcase weight)EU Exports of selected PIG products
FRESH FROZEN FAT LIVE ANIMALS OTHERS
DG AGRI G3 02 October 2018
T R A D E
EU E X P O R T S
P i g P r o d u c t s
DG AGRI G3 02 October 2018
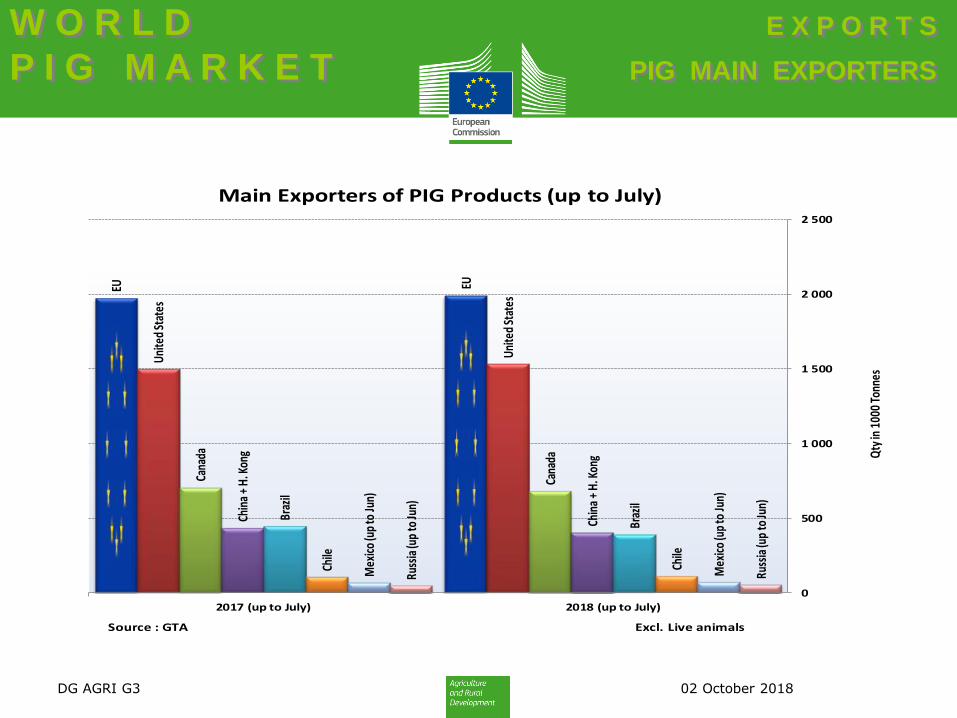
W O R L D
P I G M A R K E T
E X P O R T S
PIG MAIN EXPORTERS
EU EU
Uni
ted
Stat
es
Uni
ted
Stat
es
Cana
da
Cana
da
Chin
a +
H. K
ong
Chin
a +
H. K
ong
Braz
il
Braz
il
Chile
Chile
Mex
ico
(up
to Ju
n)
Mex
ico
(up
to Ju
n)
Russ
ia (u
p to
Jun)
Russ
ia (u
p to
Jun)
0
500
1 000
1 500
2 000
2 500
2017 (up to July) 2018 (up to July)
Qty
in 1
000
Tonn
es
Main Exporters of PIG Products (up to July)
Source : GTA Excl. Live animals

DG AGRI G3 02 October 2018
W O R L D
P I G M A R K E T
PIG PRICES
EU, BR, CAN, US
50
70
90
110
130
150
170
190
210
World weekly average Pig prices 2016 - 2018 in Euro/ 100kg carcase (EU, Brazil, Canada and USA)
EU US BR CAN
EU = weighted average of MS prices for classes S (64.12%) and E (35.88%).US = weekly USDA national weighted average carcass prices (https://mpr.datamart.ams.usda.gov/amsdashboard/swine/Swine_Dashboard_Option_1.html)BR = average of Valor Vista prices in main producing states (cepea.esalq.usp.br/br/indicador/suino.aspx)CAN = Quebec Index 100 Hogs Weighted Average prices (agr.gc.ca)
89.53 88.90 72.40148.96
Follow market updates via the Meat Market Observatory
http://ec.europa.eu/agriculture/market-observatory/meat/index_en.htm > Pigmeat
DG AGRI G3 02 October 2018