EU M arket S ituation for E ggs and P oultry Management Committee 18 October 2012
41
EU Market Situation for Eggs and Poultry Management Committee 18 October 2012 EU market situation for Eggs and Poultry Man Com 18 October 2012
-
Upload
curran-bradshaw -
Category
Documents
-
view
26 -
download
0
description
EU M arket S ituation for E ggs and P oultry Management Committee 18 October 2012. Import of Poultry meat from selected origins. EU Poultry meat Import. Export of Poultry M eat to S elected D estinations. EU Poultry meat Export. EU Poultry meat Trade Balance. - PowerPoint PPT Presentation
Transcript of EU M arket S ituation for E ggs and P oultry Management Committee 18 October 2012

EU Market Situation for Eggs and Poultry
Management Committee
18 October 2012
EU market situation for Eggs and Poultry Man Com 18 October 2012

EU market situation for Eggs and Poultry Man Com 18 October 2012
150
160
170
180
190
200
1 4 7 10 13 16 19 22 25 28 31 34 37 40 43 46 49 52
€uro
/ 100kg
Evolution of the weekly EUaverage price for Broiler
Avg 07 - 11 2009 2010 2011 2012
EU market situation for Eggs and Poultry Man Com 18 October 2012
-15,0%
-10,0%
-5,0%
0,0%
5,0%
10,0%
15,0%
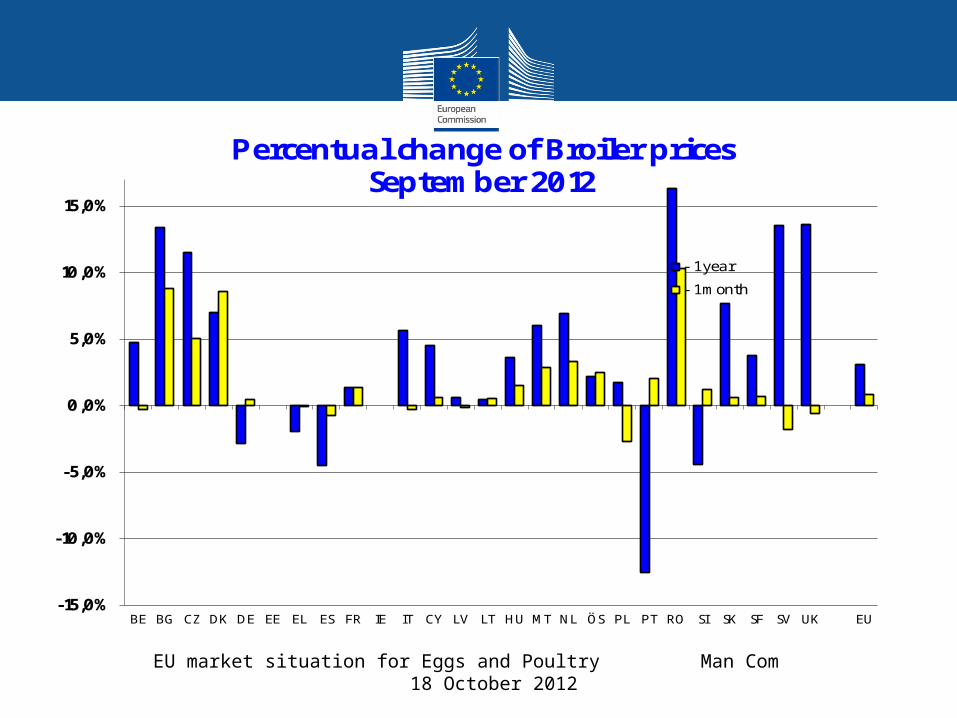
BE BG CZ DK DE EE EL ES FR IE IT CY LV LT HU MT NL ÖS PL PT RO SI SK SF SV UK EU
Percentual change of Broiler prices September 2012
- 1 year
- 1 month

EU market situation for Eggs and Poultry Man Com 18 October 2012
50
100
150
200
250
300
350
400
450
500
Jan 10 April Juil Oct Jan-11 April Juil Oct Jan-12 April Juil Oct Jan-13
Euro
/ to
nne
Price of Basic Ingredients 2010 - 2012
Soft wheat (EU)
Barley (EU)
Maïs (EU)
Soja (CAF)
Hulls (EU)
Manioc (CAF)
C.G.F. (CAF)

EU market situation for Eggs and Poultry Man Com 18 October 2012
120
150
180
210
| July | Aug | Sep | Oct | Nov | Dec |Jan 2012| Feb | Mrch | Apr | May | June | July | Aug | Sep | Oct | Nov | Dec |
€uro
/ To
nn
Futures for Feed wheat EU (Euronext) (Nearby = 2011 & 2012)
01 Nearby
2013 Jan
2013 Mar
2013 Nov
Delivery:

EU market situation for Eggs and Poultry Man Com 18 October 2012
160
180
200
220
240
260
| July | Aug | Sep | Oct | Nov | Dec |Jan 2012| Feb | Mrt | Apr | May | Jun | July | Aug | Sep | Oct | Nov | Dec |
€/T
on
n
Futures for Maize EU (Euronext) (Nearby = 2011 - 2012)
01 Nearby
2012 Nov
2013 Mar
2013 Nov
Delivery:

EU market situation for Eggs and Poultry Man Com 18 October 2012
1.100
1.200
1.300
1.400
1.500
1.600
1.700
| July | Aug. | Sept. | Oct. | Nov. | Dec. |Jan 2012| Feb | Mch | Apr | May | Jun | July | Aug. | Sept. | Oct. | Nov. | Dec. |
Futures for Soybeans in US$ct/ Bushel (nearby = 2011 & 2012)
01 Nearby
2012 Nov
2013 Mar
2013 Nov
Delivery:
EU market situation for Eggs and Poultry Man Com 18 October 2012
0
50
100
150
200
250
300
350
400
| 2009 | 2010 | 2011 | 2012 | 2013 |
Eu
ro/ T
(fe
ed
)
Eu
ro/ 1
00
kg
(B
roile
r)
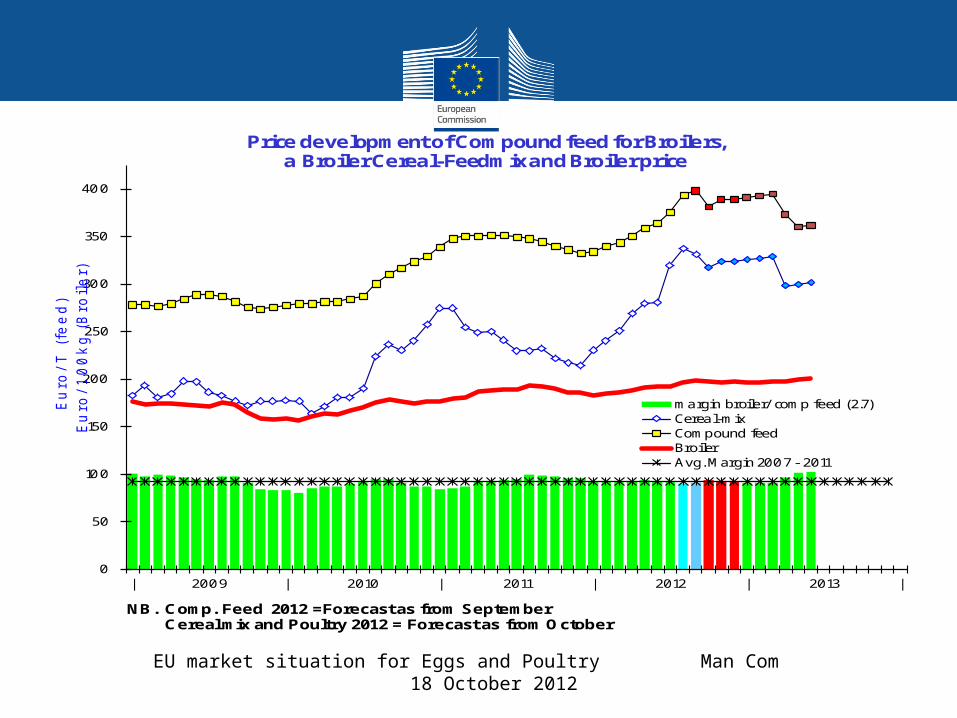
Price development of Compound feed for Broilers, a Broiler Cereal-Feedmix and Broiler price
margin broiler/ comp feed (2.7)Cereal-mixCompound feedBroilerAvg. Margin 2007 - 2011
NB. Comp. Feed 2012 =Forecast as from September Cereal mix and Poultry 2012 = Forecast as from October

EU market situation for Eggs and Poultry Man Com 18 October 2012
0
100.000
200.000
300.000
400.000
500.000
| 2006 | 2007 | 2008 | 2009 | 2010 | 2011 | 2012 |
Placings of Broiler chicks (1 000 pieces)compared to the baseline trend
(baseline = monthly avg 2006 - 2009)

EU market situation for Eggs and Poultry Man Com 18 October 2012
0
150
300
450
600
750
0
150.000
300.000
450.000
600.000
750.000
| 2006 | 2007 | 2008 | 2009 | 2010 | 2011 | 2012 |
Re
alised
slaug
hte
r in
1000 T
Forecast and Production of Broilers.In Tonn
Forecast Realised Poultry slaughter

EU market situation for Eggs and Poultry Man Com 18 October 2012
3.000
5.500
8.000
10.500
2000 2001 2002 2003 2004 2005 2006 2007 2008 2009 2010 2011 2012 2013
Th
ou
sa
nd
To
ns
Experts EU production forecast 2013
Poultry Eggs for Consumption Total Eggs
2012 2013Poultry: + 0,3% - 0,4%Eggs Cons: - 2,0% + 1,9%Eggs Hatch: + 0,9% - 1,9%Eggs Total: - 1,6% + 1,4%
EU market situation for Eggs and Poultry Man Com 18 October 2012
0
250
500
750
1000
1250
1500
1750
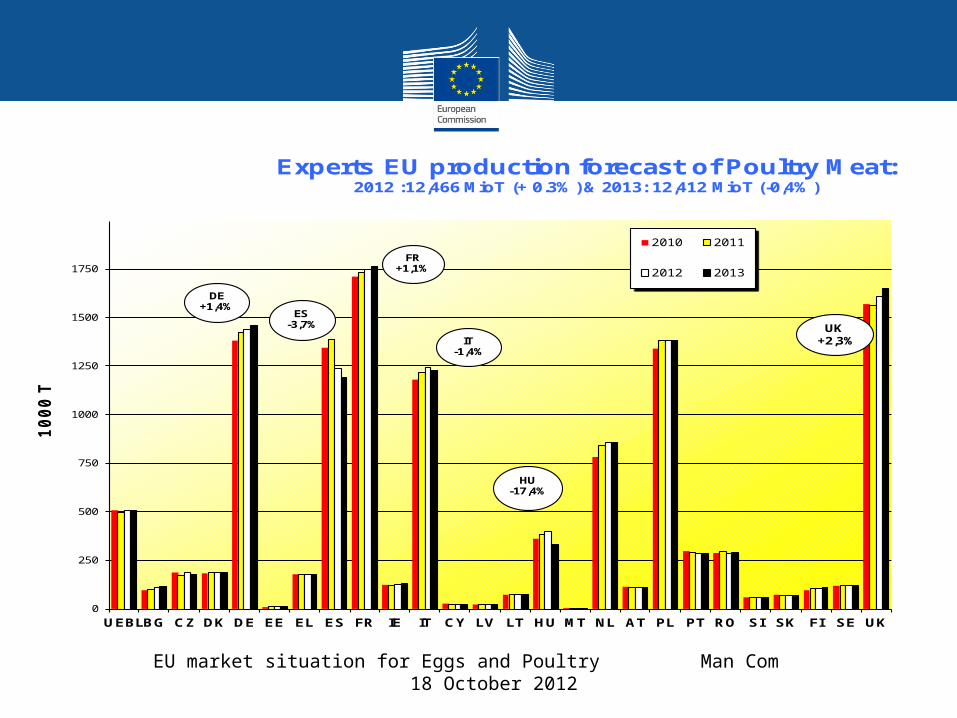
UEBLBG CZ DK DE EE EL ES FR IE IT CY LV LT HU MT NL AT PL PT RO SI SK FI SE UK
10
00
T
Experts EU production forecast of Poultry Meat: 2012 :12,466 MioT (+ 0.3%) & 2013: 12,412 MioT (-0,4%)
2010 2011
2012 2013
DE+1,4%
FR+1,1%
HU -17,4%
ES-3,7% UK
+2,3%IT-1,4%

EU market situation for Eggs and Poultry Man Com 18 October 2012
0
200
400
600
800
1.000
1.200
1.400
1.600
BE BG CZ DK DE EE EL ES FR IE IT CY LV LT HU MT NL AT PL PT RO SI SK FI SE UK
10
00
T
Experts production forecast of Broiler MeatForecast Broiler production:
2012: 9,570 MioT & 2013: 9,535MioT (-1,4%)
2010
2011
2012
2013
FR +2,0%
ES -5,7%
UK +1,9%
HU - 15,4%
DE +1,3%
EU market situation for Eggs and Poultry Man Com 18 October 2012
0,0
100,0
200,0
300,0
400,0
500,0
BE BG CZ DK DE EE EL ES FR IE IT CY LV LT HU MT NL AT PL PT RO SI SK FI SE UK
10
00
T
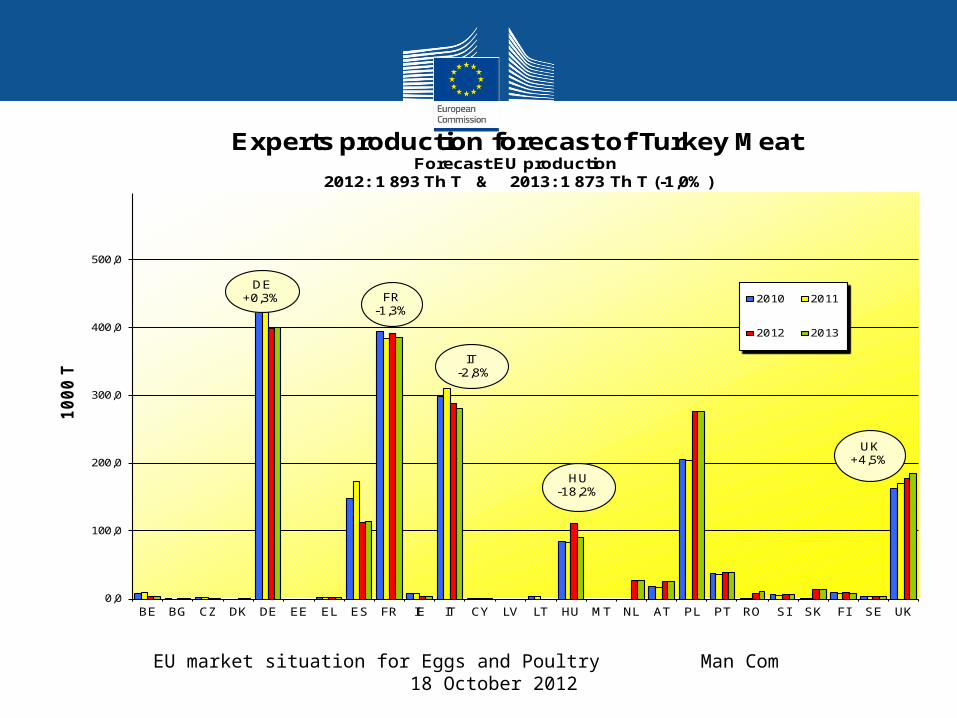
Experts production forecast of Turkey MeatForecast EU production
2012: 1 893 Th T & 2013: 1 873 Th T (-1,0%)
2010 2011
2012 2013
DE +0,3% FR
-1,3%
IT -2,8%
HU -18,2%
UK +4,5%
EU market situation for Eggs and Poultry Man Com 18 October 2012
0,0
100,0
200,0
BE BG CZ DK DE EE EL ES FR IE IT CY LV LT HU MT NL AT PL PT RO SI SK FI SE UK
10
00
T
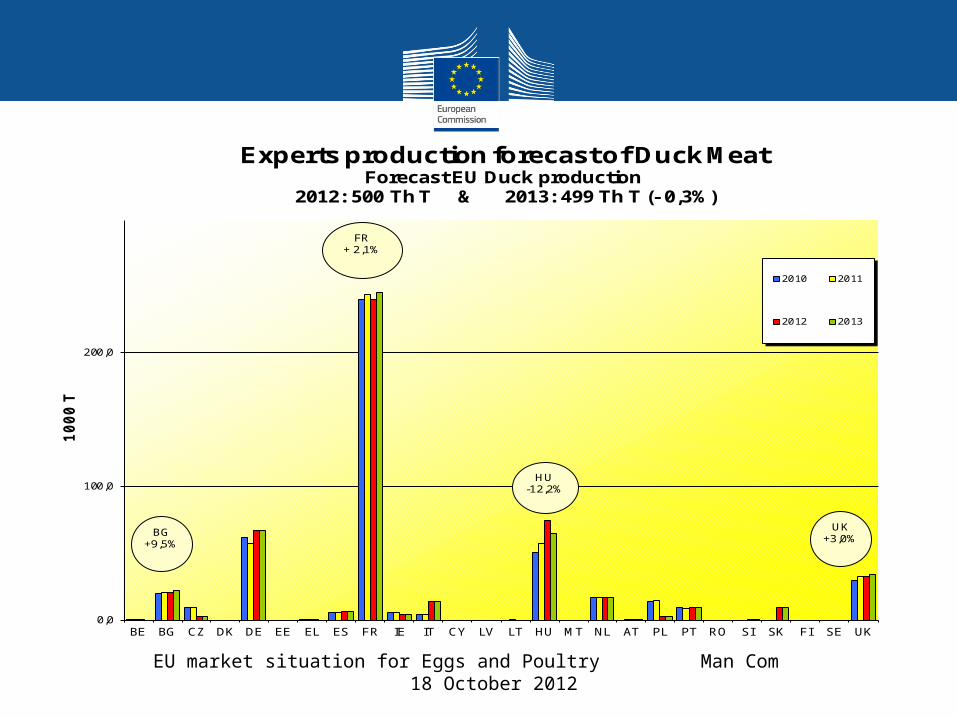
Experts production forecast of Duck MeatForecast EU Duck production
2012: 500 Th T & 2013: 499 Th T (- 0,3%)
2010 2011
2012 2013
UK+3,0%
FR+ 2,1%
HU-12,2%
BG+9,5%

EU market situation for Eggs and Poultry Man Com 18 October 2012
Import of Poultry meat from selected origins
Compared
tonnes % tonnes % tonnes % tonnes % tonnes % to Jan-Aug 11
Brazil 679.469 76,3% 659.368 75,3% 581.391 72,4% 587.404 71,0% 373.698 68,9% - 6%
Thailand 146.882 16,5% 141.524 16,2% 149.682 18,6% 154.229 18,6% 110.302 20,3% + 4%
Chile 34.718 3,9% 39.022 4,5% 34.276 4,3% 44.306 5,4% 29.801 5,5% + 5%
China 15 0,0% 5.690 0,6% 9.997 1,2% 13.735 1,7% 9.438 1,7% + 5%
Argentina 20.416 2,3% 20.576 2,3% 15.760 2,0% 15.630 1,9% 9.171 1,7% - 10%
Israel 6.252 0,7% 5.470 0,6% 7.249 0,9% 7.084 0,9% 3.558 0,7% - 15%
Croatia 1.884 0,2% 2.295 0,3% 2.650 0,3% 2.714 0,3% 1.822 0,3% + 2%
USA 393 0,0% 386 0,0% 439 0,1% 99 0,0% 203 0,0% + 246%
Uruguay 109 0,0% 98 0,0% 2 0,0% 7 0,0% 1 0,0%
EXTRA EU 25/27 891.087 875.886 803.120 827.420 542.043
% change - 2% - 8% + 3% - 3,1%
2008 2009 2010 Jan-Aug 122011

EU market situation for Eggs and Poultry Man Com 18 October 2012
0
10.000
20.000
30.000
40.000
50.000
60.000
70.000
80.000
90.000
100.000
|Jan06
2006 |Jan07
2007 |Jan08
2008 |Jan09
2009 |Jan10
2010 |Jan11
2011 |Jan12
in Tonnes cwe
Imports of selected Poultry products
FROZEN PREPARED SALTED OTHERS
EU market situation for Eggs and Poultry Man Com 18 October 2012
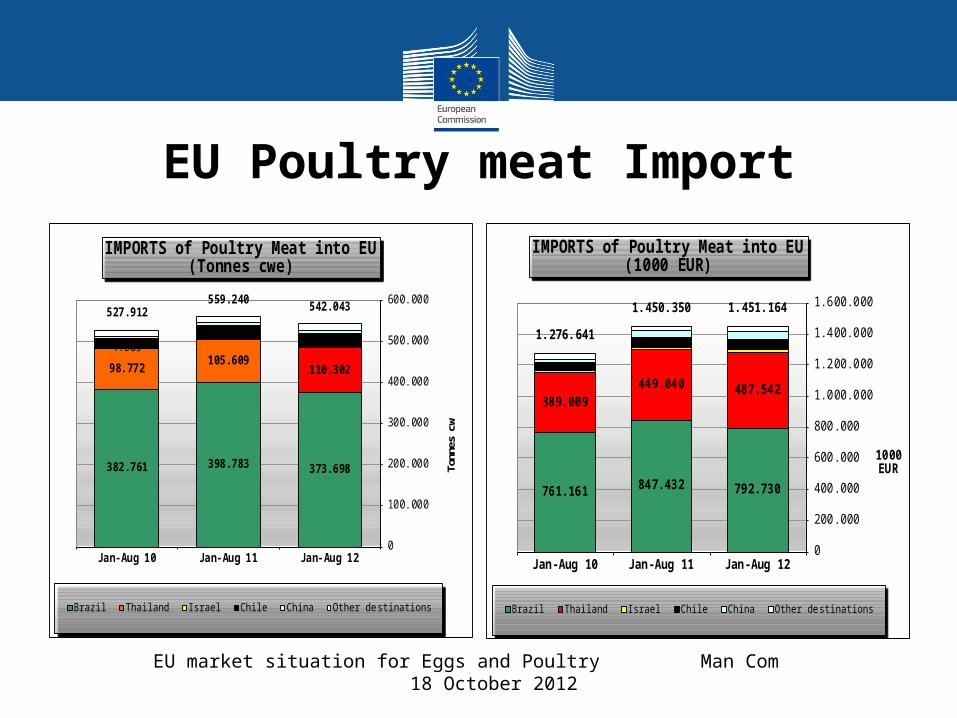
EU Poultry meat Import
382.761 398.783 373.698
98.772105.609
110.302
4.689
527.912559.240 542.043
0
100.000
200.000
300.000
400.000
500.000
600.000
Jan-Aug 10 Jan-Aug 11 Jan-Aug 12
Tonnes cw
IMPORTS of Poultry Meat into EU (Tonnes cwe)
Brazil Thailand Israel Chile China Other destinations
761.161 847.432 792.730
389.009449.040 487.542
1.276.641
1.450.350 1.451.164
0
200.000
400.000
600.000
800.000
1.000.000
1.200.000
1.400.000
1.600.000
Jan-Aug 10 Jan-Aug 11 Jan-Aug 12
1000EUR
IMPORTS of Poultry Meat into EU (1000 EUR)
Brazil Thailand Israel Chile China Other destinations

EU market situation for Eggs and Poultry Man Com 18 October 2012
Export of Poultry Meat to Selected Destinations
Compared
tonnes % tonnes % tonnes % tonnes % tonnes % to Jan-Aug 11
Saudi Arabia 95.132 9,7% 97.485 9,6% 118.020 9,3% 151.269 10,7% 97.149 10,5% - 3%
Hong Kong 58.669 6,0% 88.357 8,7% 151.559 12,0% 188.345 13,3% 86.254 9,3% - 31%
Benin 83.405 8,5% 84.912 8,4% 115.065 9,1% 126.022 8,9% 86.772 9,4% + 8%
South Africa 6.295 0,6% 7.938 0,8% 22.007 1,7% 94.163 6,7% 82.105 8,9% + 65%
Russia 230.113 23,4% 227.555 22,4% 245.478 19,4% 115.001 8,1% 69.637 7,5% - 6%
Ukraine 112.444 11,4% 89.314 8,8% 86.007 6,8% 81.736 5,8% 65.566 7,1% + 36%
Ghana 31.530 3,2% 28.694 2,8% 41.069 3,2% 68.896 4,9% 45.348 4,9% + 2%
Yemen 26.673 2,7% 36.331 3,6% 39.632 3,1% 37.970 2,7% 23.793 2,6% + 1%
Congo (Dem. Rep.) 21.386 2,2% 20.903 2,1% 27.749 2,2% 29.950 2,1% 19.667 2,1% + 9%
Switzerland 28.200 2,9% 28.111 2,8% 29.804 2,4% 29.330 2,1% 19.266 2,1% - 0%
Malaysia 17.888 1,8% 22.676 2,2% 25.899 2,0% 20.965 1,5% 17.199 1,9% + 49%
Vietnam 39.488 4,0% 39.971 3,9% 31.674 2,5% 29.086 2,1% 16.003 1,7% - 15%
Extra-EU27 982.286 1.015.784 1.265.183 1.411.142 926.523
% change + 3% + 25% + 12% + 2,6%
2008 2009 2010 Jan-Aug 122011

EU market situation for Eggs and Poultry Man Com 18 October 2012
0
20.000
40.000
60.000
80.000
100.000
120.000
140.000
|Jan06
2006 |Jan07
2007 |Jan08
2008 |Jan09
2009 |Jan10
2010 |Jan11
2011 |Jan12
inTonnescwe
Exports of selected Poultry products
FROZEN PREPARED FRESH OTHERS
EU market situation for Eggs and Poultry Man Com 18 October 2012
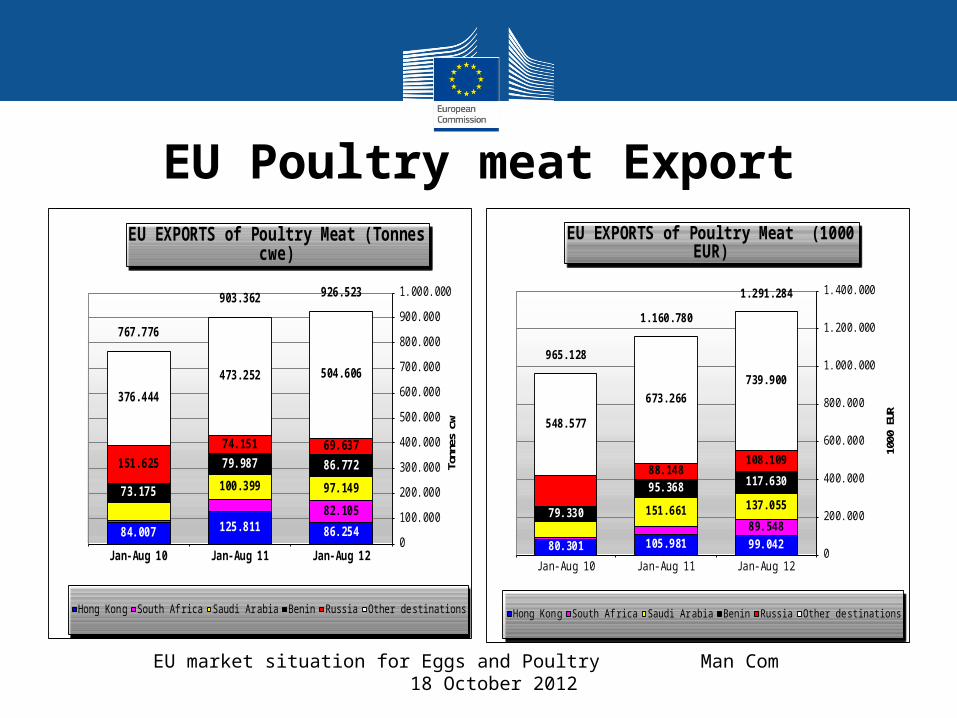
EU Poultry meat Export
84.007 125.811 86.254
82.105
100.399 97.14973.175
79.987 86.772151.625
74.151 69.637
376.444
473.252 504.606
767.776
903.362 926.523
0
100.000
200.000
300.000
400.000
500.000
600.000
700.000
800.000
900.000
1.000.000
Jan-Aug 10 Jan-Aug 11 Jan-Aug 12
Tonnes cw
EU EXPORTS of Poultry Meat (Tonnes cwe)
Hong Kong South Africa Saudi Arabia Benin Russia Other destinations
80.301 105.981 99.04289.548
151.661 137.05579.330
95.368 117.63088.148
108.109
548.577
673.266739.900
965.128
1.160.780
1.291.284
0
200.000
400.000
600.000
800.000
1.000.000
1.200.000
1.400.000
Jan-Aug 10 Jan-Aug 11 Jan-Aug 12
1000 EUR
EU EXPORTS of Poultry Meat (1000 EUR)
Hong Kong South Africa Saudi Arabia Benin Russia Other destinations

EU market situation for Eggs and Poultry Man Com 18 October 2012
EU Poultry meat Trade Balance
302277 292 310
371
676
794
480
614 616
858891 876
803827
542
1.017
1.101 1.1161.153
1.114
1.275
1.063 1.046997 997
867
9821.016
1.265
1.411
927
0
200
400
600
800
1.000
1.200
1.400
1.600
1997 1998 1999 2000 2001 2002 2003 2004 2005 2006 2007 2008 2009 2010 2011 Jan-Aug 12
in 100
0 To
nnes cwe
IMPORTS EXPORTS

EU market situation for Eggs and Poultry Man Com 18 October 2012
50,00
75,00
100,00
125,00
150,00
175,00
200,00
08 | 09 | 10 | 11 | 12 |
Broiler prices in EU, USA and Brazilin €uro/ 100kg
EU broiler US broiler €uro BR Broil €uro/ (Ave world)

2001 2002 2003 2004
20052006 2007 2008
2009 2010 2011 2012
EU Market Situation for Eggs
Management Committee 18 October 2012
EU market situation for Eggs and Poultry Man Com 18 October 2012

EU market situation for Eggs and Poultry Man Com 18 October 2012
85
105
125
145
165
185
1 4 7 10 13 16 19 22 25 28 31 34 37 40 43 46 49 52
€u
ro/
10
0k
g
Evolution of the weekly EU average price for Eggs for Consumption
Avg 07 - 11 2009 2010avg 2011 2012

EU market situation for Eggs and Poultry Man Com 18 October 2012
-15,0%
-5,0%
5,0%
15,0%
25,0%
35,0%
45,0%
55,0%
BE BG CZ DK DE EE EL ES FR IE IT CY LV LT HU MT NL ÖS PL PT RO SI SK SF SV UK EU
Percentual change of Egg prices September 2012
- 1 year
- 1 month

EU market situation for Eggs and Poultry Man Com 18 October 2012
0
40
80
120
160
200
1 4 7 10 13 16 19 22 25 28 31 34 37 40 43 46 49 52 3 6 9 12 15 18 21 24 27 30 33 36 39 42 45 48 51
€uro
/ 100kg
Prices for Eggs for consumption and Eggs for breaking 2011 - 2012
EU Low difference Eggs for Consumption US High breaking
133.3 % increase for Eggs for Breaking from week 1 2011 to week 40 201249,0% increase for Eggs for Consumption from week 1 2011 to week 40 2012

EU market situation for Eggs and Poultry Man Com 18 October 2012
0
30
60
90
120
150
180
0 01 02 03 04 05 06 07 08 09 10 11 ja fe mr ap ma jn jl au se oc no de
Euro
/ 100kg
Margin between Feed cost and Egg price in Egg production
marge
feed
egg
Avg Margin

EU market situation for Eggs and Poultry Man Com 18 October 2012
Placings of Laying chicks (1 000 pieces)compared to the baseline trend
(baseline= monthly avg 2006 - 2009)
0
7.500
15.000
22.500
30.000
37.500
| 2006 | 2007 | 2008 | 2009 | 2010 | 2011 | 2012 |
EU market situation for Eggs and Poultry Man Com 18 October 2012
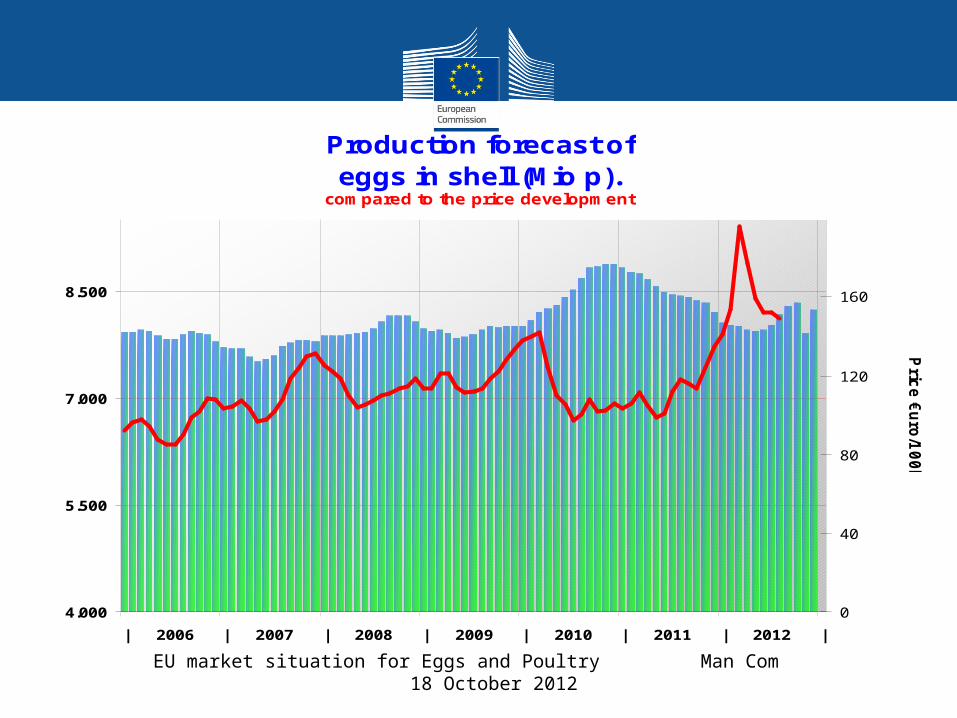
Production forecast ofeggs in shell (Mio p).
compared to the price development
4.000
5.500
7.000
8.500
| 2006 | 2007 | 2008 | 2009 | 2010 | 2011 | 2012 |
0
40
80
120
160
Pric
e €
uro
/10
0k
g

EU market situation for Eggs and Poultry Man Com 18 October 2012
Trad. Cage33 99314,0%
Enr. Cage61 95225,6%
Free Range15 3016,3%
Barn58 60424,2%Organic
6 9872,9%
Other 1)65 35327,0%
Number of Laying Hens 2011by way of keeping the total of several EU Member States
"Other" animals based on Eurofarm Structure survey 2007Methods of production communicated accordingly to Reg. 589/2008
1) Other = Difference between the total of the Eurofarm Structure survey and the total of the communications according to Reg. 589/2008
only 14 communicated dataaccording to Reg. 589/2008

EU market situation for Eggs and Poultry Man Com 18 October 2012
0
200
400
600
800
1.000
UEBLBG CZ DK DE EE EL ES FR IE IT CY LV LT HU MT NL AT PL PT RO SI SK FI SE UK
10
00
T
Experts EU production forecast of Total Eggs(Eggs in shell + Hatching Eggs)
2012: 7,931 MioT (- 1.6%) & 2013: 7,029 MioT (+1,4%)
2010 2011 2012 2013
BG +6,6%
IT -0,6%
RO +2,9%
DE +0,6%
FR +6,1%
NL +2,7%
HU+2,4%
FI+3,9%

EU market situation for Eggs and Poultry Man Com 18 October 2012
0
200
400
600
800
1.000
BE BG CZ DK DE EE EL ES FR IE IT CY LV LT HU MT NL AT PL PT RO SI SK FI SE UK
10
00
T
Experts EU production forecast of Eggs for consumption2012: 6,331 MioT (- 2.0%) & 2013: 6,433 MioT (+1,9%)
2010 2011 2012 2013
BG +9,2%
EI +2,7%
UK +1,8
HU +3,8%
CZ -10,1%
ES +9,7%
NL +3,1%
RO+3,7%

EU market situation for Eggs and Poultry Man Com 18 October 2012
Compared
tonnes % tonnes % tonnes % tonnes % tonnes % to Jan-Aug 11
USA 4.245 18,6% 11.165 36,7% 13.439 42,9% 5.417 28,4% 10.559 40,8% + 143%
Argentina 6.164 27,0% 7.899 26,0% 7.888 25,2% 7.898 41,5% 8.097 31,3% + 80%
Mexico 2.002 8,8% 1.893 6,2% 1.425 4,5% 556 2,9% 1.017 3,9% + 426%
Albania 2.209 9,7% 1.659 5,5% 3.208 10,2% 1.303 6,8% 1.377 5,3% + 322%
India 6.593 28,9% 5.776 19,0% 3.211 10,2% 1.505 7,9% 1.565 6,1% + 44%
Israel 646 2,8% 711 2,3% 941 3,0% 547 2,9% 1.045 4,0% + 118%
Canada 1 0,0% 33 0,1% 2 0,0% 0 0,0% 67 0,3%
Brazil 64 0,3% 67 0,2% 0 0,0% 0 0,0% 0 0,0%
EXTRA EU 25/27 22.850 30.409 31.356 19.045 25.855
% change + 33% + 3% - 39% + 107,6%
2008 2009 2010 Jan-Aug 122011
EU Imports of Eggs:Trade Figures (Comext – tonnes egg equiv.) not incl. Hatching eggs

EU market situation for Eggs and Poultry Man Com 18 October 2012
EU Egg Imports
11.602
4.342
10.559
5.642
4.490
8.097
3.782
2.207
4.190
25.993
12.453
25.855
0
5.000
10.000
15.000
20.000
25.000
30.000
Jan-Aug 10 Jan-Aug 11 Jan-Aug 12
Total EU Import of Eggs - not incl. Hatching eggs
(Tonnes eggs equiv)
USA ArgentinaIndia CanadaAlbania Other destinations
11.1998.484
16.580
4.449
3.415
6.6302.553
3.653
22.531
15.205
30.470
0
5.000
10.000
15.000
20.000
25.000
30.000
35.000
Jan-Aug 10 Jan-Aug 11 Jan-Aug 12
Total EU Import of Eggs - not incl. Hatching eggs
(1000 EUR)
USA ArgentinaIndia CanadaAlbania Other destinations

EU market situation for Eggs and Poultry Man Com 18 October 2012
0
1.000
2.000
3.000
4.000
5.000
6.000
7.000
8.000
|Jan06
2006 |Jan07
2007 |Jan08
2008 |Jan09
2009 |Jan10
2010 |Jan11
2011 |Jan12
in Tonnes egg equiv.
EU-27 Imports of selected EGGS products(including Hatching eggs)
FRESH Albumin Not In Shell Yolk Haching
EU market situation for Eggs and Poultry Man Com 18 October 2012
Compared
tonnes % tonnes % tonnes % tonnes % tonnes % to Jan-Aug 11
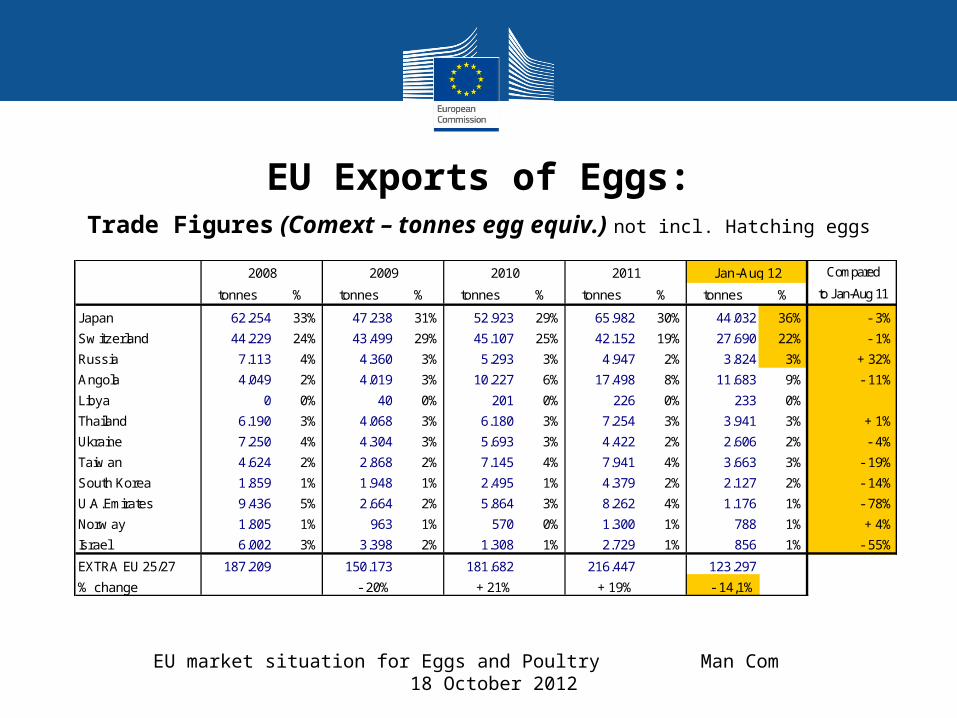
Japan 62.254 33% 47.238 31% 52.923 29% 65.982 30% 44.032 36% - 3%
Sw itzerland 44.229 24% 43.499 29% 45.107 25% 42.152 19% 27.690 22% - 1%
Russia 7.113 4% 4.360 3% 5.293 3% 4.947 2% 3.824 3% + 32%
Angola 4.049 2% 4.019 3% 10.227 6% 17.498 8% 11.683 9% - 11%
Libya 0 0% 40 0% 201 0% 226 0% 233 0%
Thailand 6.190 3% 4.068 3% 6.180 3% 7.254 3% 3.941 3% + 1%
Ukraine 7.250 4% 4.304 3% 5.693 3% 4.422 2% 2.606 2% - 4%
Taiw an 4.624 2% 2.868 2% 7.145 4% 7.941 4% 3.663 3% - 19%
South Korea 1.859 1% 1.948 1% 2.495 1% 4.379 2% 2.127 2% - 14%
U.A.Emirates 9.436 5% 2.664 2% 5.864 3% 8.262 4% 1.176 1% - 78%
Norw ay 1.805 1% 963 1% 570 0% 1.300 1% 788 1% + 4%
Israel 6.002 3% 3.398 2% 1.308 1% 2.729 1% 856 1% - 55%
EXTRA EU 25/27 187.209 150.173 181.682 216.447 123.297
% change - 20% + 21% + 19% - 14,1%
2008 2009 2010 Jan-Aug 122011
EU Exports of Eggs:Trade Figures (Comext – tonnes egg equiv.) not incl. Hatching eggs
EU market situation for Eggs and Poultry Man Com 18 October 2012
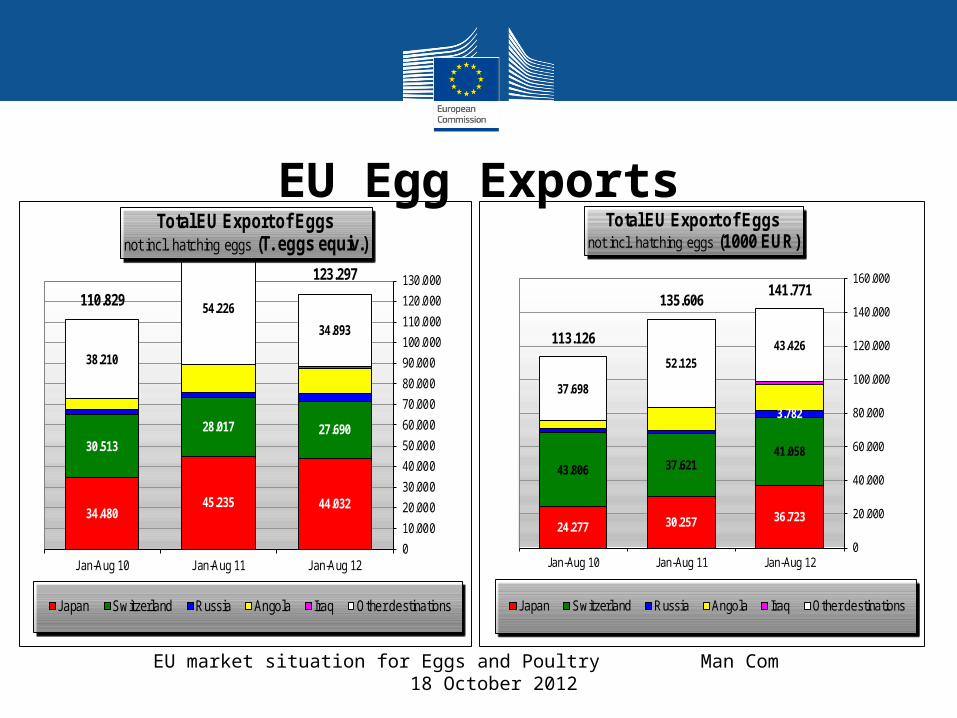
34.48045.235 44.032
30.513
28.017 27.690
38.210
54.226
34.893
110.829
123.297
0
10.000
20.000
30.000
40.000
50.000
60.000
70.000
80.000
90.000
100.000
110.000
120.000
130.000
Jan-Aug 10 Jan-Aug 11 Jan-Aug 12
Total EU Export of Eggs not incl. hatching eggs (T. eggs equiv.)
Japan Switzerland Russia Angola Iraq Other destinations
24.277 30.257 36.723
43.806 37.62141.058
3.782
37.698
52.12543.426113.126
135.606141.771
0
20.000
40.000
60.000
80.000
100.000
120.000
140.000
160.000
Jan-Aug 10 Jan-Aug 11 Jan-Aug 12
Total EU Export of Eggs not incl. hatching eggs (1000 EUR)
Japan Switzerland Russia Angola Iraq Other destinations
EU Egg Exports
EU market situation for Eggs and Poultry Man Com 18 October 2012
0
5.000
10.000
15.000
20.000
25.000
30.000
|Jan06
2006 |Jan07
2007 |Jan08
2008 |Jan09
2009 |Jan10
2010 |Jan11
2011 |Jan12
in Tonnes egg equiv.
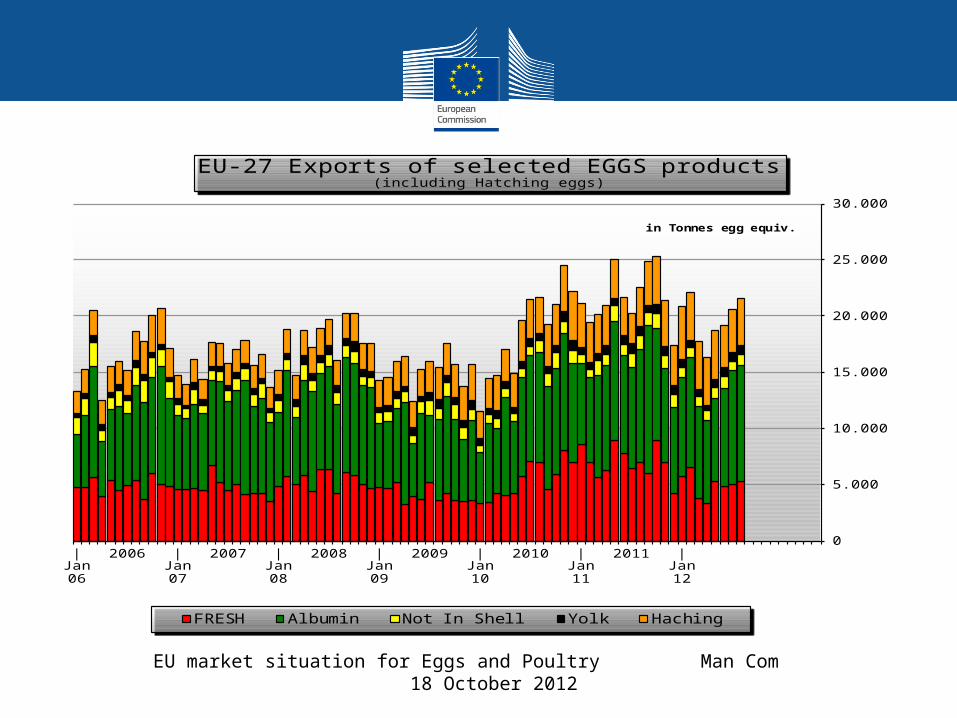
EU-27 Exports of selected EGGS products (including Hatching eggs)
FRESH Albumin Not In Shell Yolk Haching
EU market situation for Eggs and Poultry Man Com 18 October 2012
1018
2318 17
27
16
30
69
2530
3945
2330 31
1926
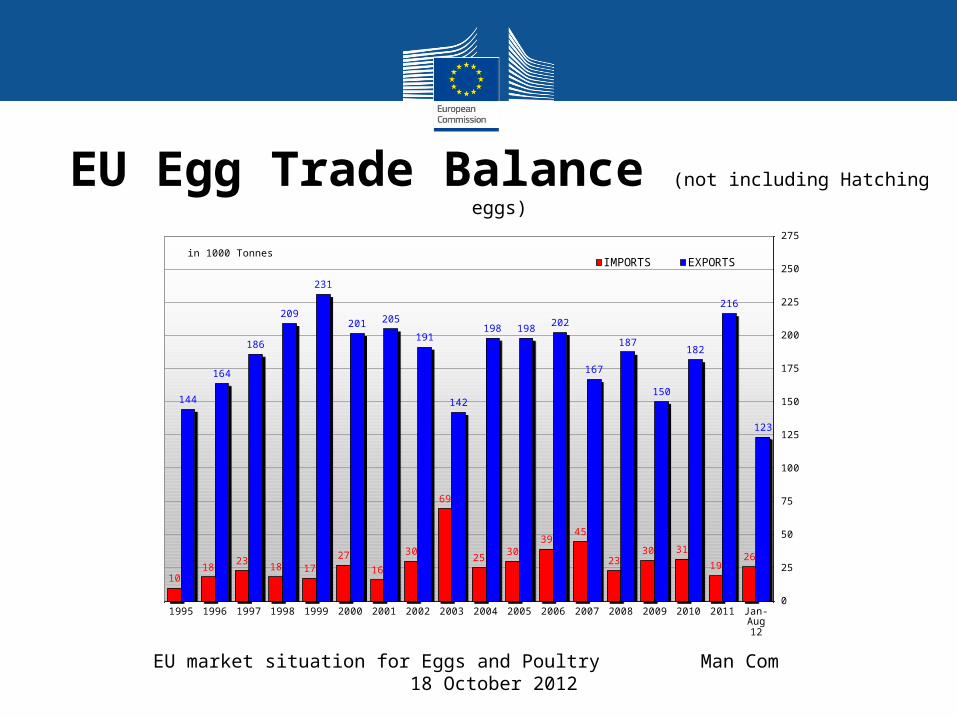
144
164
186
209
231
201 205
191
142
198 198202
167
187
150
182
216
123
0
25
50
75
100
125
150
175
200
225
250
275
1995 1996 1997 1998 1999 2000 2001 2002 2003 2004 2005 2006 2007 2008 2009 2010 2011 Jan-Aug12
in 1000 TonnesIMPORTS EXPORTS
EU Egg Trade Balance (not including Hatching eggs)

EU market situation for Eggs and Poultry Man Com 18 October 2012
Egg prices the EU, USAand Brazilin €uro/ 100kg
50,00
75,00
100,00
125,00
150,00
175,00
08 | 09 | 10 | 11 | 12 |
EU egg US egg €uro BR Egg €uro (Ave World)