EU harmonised cyclic voltammetry test method for low ... · EU harmonised cyclic voltammetry test...
36
Malkow, T., De Marco, G., Tsotridis, G. 2018 EUR 29285 EN EU harmonised cyclic voltammetry test method for low-temperature water electrolysis single cells
Transcript of EU harmonised cyclic voltammetry test method for low ... · EU harmonised cyclic voltammetry test...

Malkow, T., De Marco, G., Tsotridis, G.
2018
EUR 29285 EN
EU harmonised cyclic voltammetry test
method for low-temperature water
electrolysis single cells

2
This publication is a Validated Methods, Reference Methods and Measurements report by the Joint Research
Centre (JRC), the European Commission’s science and knowledge service. It aims to provide evidence-based
scientific support to the European policymaking process. The scientific output expressed does not imply a policy
position of the European Commission. Neither the European Commission nor any person acting on behalf of the
Commission is responsible for the use that might be made of this publication.
Contact information
Name: T. MALKOW
Address: Westerduinweg 3, 1755 LE Petten, The Netherlands
Email: [email protected]
Tel.: +31 226 56 5656
JRC Science Hub
https://ec.europa.eu/jrc
JRC111151
EUR 29285 EN
Print ISBN 978-92-79-89870-9 ISSN 1018-5593 doi: 10.2760/140687
PDF ISBN 978-92-79-89871-6 ISSN 1831-9424 doi: 10.2760/442574
Luxembourg: Publications Office of the European Union, 2018
© European Union, 2018
Reuse is authorised provided the source is acknowledged. The reuse policy of European Commission documents
is regulated by Decision 2011/833/EU (OJ L 330, 14.12.2011, p. 39).
For any use or reproduction of photos or other material that is not under the EU copyright, permission must be
sought directly from the copyright holders.
How to cite this report: T Malkow, G De Marco, G Tsotridis, EU harmonised cyclic voltammetry test method for
low-temperature water electrolysis single cells, EUR 29285 EN, Publications Office of the European Union,
Luxembourg, 2018, ISBN 978-92-79-89870-9, doi 10.2760/140687, PUBSY No. 111151
All images © European Union 2018
Printed in The Netherlands

EU harmonised cyclic voltammetry
test method for low-temperature
water electrolysis single cells
Malkow, T., De Marco, G., Tsotridis, G.

ii
THIS PAGE IS LEFT BLANK INTENTIONALLY

iii
Contents
Contents ............................................................................................................. iii
Foreword .............................................................................................................. v
Acknowledgements .............................................................................................. vii
List of contributors ................................................................................................ ix
1 Introduction ...................................................................................................... 1
2 Objective and scope ........................................................................................... 3
3 Terminology, definitions and symbols ................................................................... 5
3.1 Terminology and definitions .......................................................................... 5
3.2 Symbols ..................................................................................................... 5
4 Test equipment and setup .................................................................................. 9
5 Test inputs (TIP) and test outputs (TOP) ............................................................ 11
5.1 Static test inputs ....................................................................................... 11
5.2 Variable test inputs .................................................................................... 12
5.3 Test outputs .............................................................................................. 12
6 Test procedure ................................................................................................ 14
6.1 CV measurement for PEMWE ....................................................................... 14
6.2 CV measurement for AEMWE ....................................................................... 17
6.3 CV measurement for AWE ........................................................................... 17
7 Data post processing and representation ............................................................ 19
References ......................................................................................................... 21

iv
THIS PAGE IS LEFT BLANK INTENTIONALLY

v
Foreword
This report was carried out under the Framework Contract between the Joint Research
Centre (JRC) and the Fuel Cells and Hydrogen second Joint Undertaking (FCH2JU)
implemented by annual Rolling Plans.
According to the Rolling Plan 2018, this report was prepared under this contract as the
part on "Testing procedures" of deliverable B.2.3 "Harmonised Electrolysis Testing".

vi
THIS PAGE IS LEFT BLANK INTENTIONALLY

vii
Acknowledgements
We would like to express our sincere gratitude to all participants and their respective
organisations for their contributions in developing the EU harmonised cyclic voltammetry test
method for low-temperature water electrolysis single cells document.
We would also like to thank the “Fuel Cell and Hydrogen second Joint Undertaking”
(FCH2JU) Programme Office for the continuous support and encouragement we received
throughout the preparatory stages of this report. FCH2JU is also thanked for its financial
contribution.

viii
THIS PAGE IS LEFT BLANK INTENTIONALLY

ix
List of contributors
(in alphabetical order of their organisations and names)
AREVA H2Gen Fabien Auprêtre
Deutsches Zentrum für Luft-
und Raumfahrt e. V. Regine Reißner
Energy Research Centre of
Netherlands Frans van Berkel
Swiss Federal Laboratories for
Materials Science and
Technology
Ulrich Vogt
Institut de Chimie Moléculaire
et des Matériaux d'Orsay –
Université Paris-Sud
Pierre Millet
Istituto di Tecnologie Avanzate
per L'Energia "Nicola
Giordano"
Antonino S. Aricó

x
THIS PAGE IS LEFT BLANK INTENTIONALLY

1
1 Introduction
Cyclic voltammetry (CV) is a widely used in-situ electroanalytical characterisation
technique for studying electrochemical redox reactions in electrochemical cells as they
provide information on the steps involved in electrochemical processes (i.e. redox
transitions, adsorption/desorption, double layer charging/discharging) with modest
efforts in data acquisition and interpretation [1]. It is commonly used in the development
of electro-catalysts as a screening tool to evaluate catalytic activity.
In CV, the potential of the low temperature water electrolysis (LTWE) cell is linearly
swept at a constant scan rate 𝜈 from the start potential, Einitial to the end potential, Efinal
to be reversed to the start potential creating a symmetrical triangular potential waveform
while recording the Faradaic (i.e. by redox surface reaction) and capacitive (double layer
charging of the electrode-electrolyte interface) current response known as cyclic
voltammogram (profile of current or current response versus potential).
For repeated cycles, Einitial and Efinal are respectively replaced by the first vertex
(switching) potential, Evert1 and the second vertex (switching) potential, Evert2 when
different.
The potential sweep may be repeated as many times as needed. Where no charge
transfer takes place at the working electrode (WE), only a capacitive current is recorded.
Usually, the current is small so that the voltage loss due to ohmic resistances also known
as IR voltage drop is negligible depending on the sweep rate of the potential typically of
between 5 mV/s and 200 mV/s.
However, for LTWE cells with high currents or high resistance, correction for IR voltage
drop is advised.
This potentio-dynamic technique is usually applied in half-cell testing to eliminate
possible interference from other reactions and is conducted in a three measurement
electrode configuration comprising of WE which is the electrode of interest, counter
electrode (CE) that enables the current flow and a reference electrode (RE) against which
the WE potential is measured.
However, there is a specific interest for in–situ determination of the electrochemically
active surface area (ECSA) of the electrodes in Polymer Electrolyte Membrane Water
Electrolyser by using CV. It allows to in-situ study the catalyst utilisation and to
investigate the ionomer-catalyst interface when different ionomers are used.

2
Some procedures used in the research community are given in Sec. 6 for proton
exchange membrane water electrolysis (PEMWE) cell with Pt/C catalyst for the hydrogen
evolution reaction (HER) at the cathode (under conventional PEMWE operation) and IrO2
(respectively IrRu oxide) as oxygen evolution reaction (OER) at the anode.
The information obtained from CV measurements of a catalyst in LTWE single cells,
measured from the hydrogen adsorption/desorption onto a metal catalyst (e.g. Pt)
surface (each atom on the metal surface chemisorbs a single hydrogen atom), is the
ECSA of the electro-catalyst. The catalyst utilisation, UM (%) is the ratio of the ECSA
(from CV) to the total specific surface area of the catalyst, Atotal (m2/g). It is generally a
non-dimensional number reflecting the extension of the catalyst-electrolyte interface,
UM =ECSA
Atotal∙ 100%; (1)
Atotal is determined by physico-chemical methods. For an unsupported catalyst, Atotal is
usually determined by Brunauer–Emmett–Teller (BET) measurement [2] using nitrogen
adsorption/desorption at the liquid nitrogen temperature.
For a supported catalyst such as Pt/C or Pd/C, Atotal is determined from the mean particle
size and the mass density of the metal [3].
Generally, a spherical shape of the nano-sized metal particle is assumed. The metal
surface area (MSA) (m2/g) is
A𝑀 =6∙104
𝜌∙𝑑 (2)
where (g/cm3) is the density and d (Å) is the average size of the metal catalyst
particle.
The mean particle size is either derived from transmission electron microscopy (TEM) or
the broadening of the X-ray diffraction (XRD) peaks (Debye-Scherrer method) [4].

3
2 Objective and scope
This procedure is a general characterisation method that is used in research and
development of the LTWE single cells. It addresses to the user as an experimenter
performing on LTWE single cells measurements including data analysis of CV by
measuring the Coulomb charge (integration of current with time) associated with the
deposition or removal of a chemisorbed monolayer of electro-active species to determine
the ECSA of the electro-catalysts in the electrode.
The user should refer to the scientific literature including the references cited herein for
additional, more in-depth analysis including data post processing.

4
THIS PAGE IS LEFT BLANK INTENTIONALLY

5
3 Terminology, definitions and symbols
3.1 Terminology and definitions
Potentiostat/Galvanostat:
A potentiostat/galvanostat is the electronic hardware required to control a two, three or
four electrode (namely: WE and CE, RE/Sense 1 and RE/Sense 2) configuration in an
experiment. A potentiostat is to control the WE potential constant with respect to the RE
by adjusting the current at an auxiliary electrode. A galvanostat maintains the current
through the cell constant.
Sensor:
A sensor is a device that measures a physical quantity and converts it into a signal which
is transferred to a data acquisition system. Each sensor (including the complete
measurement chain) has a specific measurement uncertainty.
Electrolysis test stand:
An electrolysis test stand consists of a set of sensors, actuators, controls loops, piping,
data acquisition systems etc. that allows operating and testing a single cell.
Measurement electrode:
A measurement electrode is an electrical conductor used to make contact between the
LTWE cell and the potentiostat/galvanostat; those connections are done through
(shielded) cables.
More extensive terminology definitions can be found in [5].
3.2 Symbols
The symbols used in this document are defined in Table 1.
Table 1 Definition of symbols
Symbol Description (unit)
A Geometric active area of the single cell (cm2
geo)
AM Metal surface area of the catalyst (m2
real/g)
Atotal Total specific surface area of the catalyst (m2real/g)

6
Symbol Description (unit)
CE Counter or auxiliary Electrode (-)
DHE Dynamic Hydrogen Electrode (-)
ECSA Electrochemically active surface area (cm2real)
sECSA Specific ECSA (m2real/g)
E Sweep potential (V)
E1 Lower integration limit of the potential regarding QH calculation (V)
E2 Upper integration limit of the potential regarding QH calculation (V)
Einitial Start potential (V)
Efinal End potential (V)
Evert1 First vertex potential of the potential sweep (V)
Evert2 Second vertex potential of the potential sweep (V)
Had Adsorbed hydrogen species (-)
I Charging/discharging current (A)
j Charging/discharging current density (A/cm2)
M Fraction of metallic catalyst surface (-)
nSEG Number of sweep potential voltammetry cycle segments (-)
q* Voltammetric surface charge
QCS Feed flow rate through counter side of cell geometric area (ml/min/cm2
geo)
QSS Feed flow rate through studied side of cell geometric area [ml/min/cm2
geo)
QH Electric hydrogen desorption charge (-)
QHO Electric hydrogen charge per unit area for full coverage of one mono layer of
hydrogen on the metallic catalyst surface (mC/cm2
geo)
RE Reference electrode (-)

7
Symbol Description (unit)
RF Roughness factor (cm2
real/cm2geo)
RHE Reference hydrogen electrode (-)
UM Catalyst utilisation (%)
ν Potential scan rate (mV/s)
WE Working Electrode (-)

8
THIS PAGE IS LEFT BLANK INTENTIONALLY
9
4 Test equipment and setup
Generally, the most common experimental configuration for recording cyclic
voltammograms is a four measurement electrode configuration, i.e. CE, two RE and
(specifically, a reference electrode, R, and a sense electrode, S) and WE connected to a
potentiostat.
For a DHE setup, the RE is polarised but it is assumed that the recorded potential is
entirely due to WE polarisation. The two RE terminals are typically connected with CE and
WE respectively to constitute a two electrode configuration measurement.

10
THIS PAGE IS LEFT BLANK INTENTIONALLY

11
5 Test inputs (TIP) and test outputs (TOP)
Test input is a physical quantity which defines the test conditions. There are variable
input parameters which are varied during the measurement, and static input parameters
which are kept constant during the measurement.
Note, the actual value/range of the inputs depend on the type of LTWE cell and the
catalyst configuration as well as whether the anode or the cathode is probed; see Sec. 6
for recommendations.
5.1 Static test inputs
The static inputs for the CV measurement are given in Table 2.
Table 2 Static inputs for the CV measurement
Input Symbol Unit Measurement
uncertainty
Start potential Einital V ±1%
End potential Efinal V ±1%
Potential scan rate 𝜈 V/s ±1%
Flow rate per unit of electrode area on
CE
Qcs ml/min//cm
2geo ±1% (full scale)
Flow rate per unit of electrode area on
WE
Qss ml/min//cm
2geo ±1% (full scale)
Number of sweep potential
voltammetry cycle segments (*) nSEG - -
(*) A minimum of three cycles is recommended with the first cycle commonly disregarded. The second cycle
should be taken as CV measurement while the third cycle may serve to validate the measurement.
12
5.2 Variable test inputs
The variable test inputs are those physical drivers influencing the test object behaviour
and are changed in a user-programmable manner during a single experiment with the
use of suitable control equipment (potentiostat / galvanostat). The variable inputs for the
CV measurement are given in Table 3.
Table 3 Variable input for the CV measurement
Input Symbol Unit Measurement uncertainty
Potential E V ±1%
5.3 Test outputs
The primary test output parameters are the measurable physical quantities, which
constitute the response of the tested LTWE single cell. The secondary test output
parameters are calculated from the primary TOP, see Eqs. (1) to (5). Table 4 provides
the details of the output parameter.
Table 4 Test output parameter for the CV measurement
Output Symbol Unit Sampling rate
Current I A 10Hz
Current density j A/cm2
geo 10Hz
Voltammetric charge Q mC/cm2
geo -

13
Output Symbol Unit Sampling rate
Roughness factor RF cm2
real/cm2
geo -
Electrochemically active
surface area ECSA cm2
real -
Specific ECSA sECSA cm2
real/g -
Catalyst utilisation UM % -
14
6 Test procedure
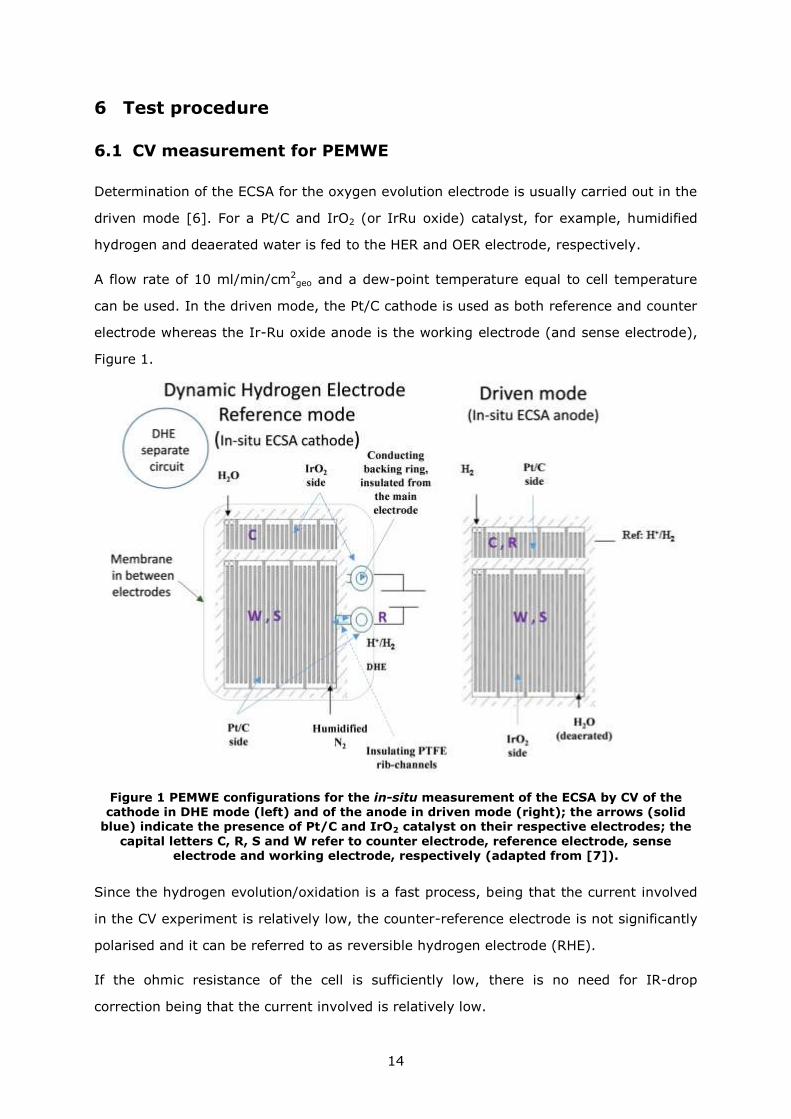
6.1 CV measurement for PEMWE
Determination of the ECSA for the oxygen evolution electrode is usually carried out in the
driven mode [6]. For a Pt/C and IrO2 (or IrRu oxide) catalyst, for example, humidified
hydrogen and deaerated water is fed to the HER and OER electrode, respectively.
A flow rate of 10 ml/min/cm2geo and a dew-point temperature equal to cell temperature
can be used. In the driven mode, the Pt/C cathode is used as both reference and counter
electrode whereas the Ir-Ru oxide anode is the working electrode (and sense electrode),
Figure 1.
Figure 1 PEMWE configurations for the in-situ measurement of the ECSA by CV of the cathode in DHE mode (left) and of the anode in driven mode (right); the arrows (solid
blue) indicate the presence of Pt/C and IrO2 catalyst on their respective electrodes; the
capital letters C, R, S and W refer to counter electrode, reference electrode, sense electrode and working electrode, respectively (adapted from [7]).
Since the hydrogen evolution/oxidation is a fast process, being that the current involved
in the CV experiment is relatively low, the counter-reference electrode is not significantly
polarised and it can be referred to as reversible hydrogen electrode (RHE).
If the ohmic resistance of the cell is sufficiently low, there is no need for IR-drop
correction being that the current involved is relatively low.
15
Recommended conditions are a sweep rate of 20 mV·s-1, between 0.4 and 1.4 V vs. RHE,
triangular sweep, reference operating temperature and ambient pressure.
Using potentials lower than 0.4 V vs. RHE may produce a significant reduction of the IrO2
(respectively IrRu oxide) and thus a change of the oxidation state and related adsorption
desorption processes.
Generally, the voltammetric charge (sum of anodic and cathodic charge densities) is
related to the electrochemical active area or the density of active sites. The coulombic
charge varies with the sweep rate; thus, the used scan rate must be reported along with
the voltammetric charge value.
Note, the linear variation of the coulombic charge with the square root of the sweep rate
allows to qualitatively evaluate the inner and outer surface of the electrode.
For the anode, the active area is obtained from integration of CV profile over the entire
potential window similar to Eq. (3), which applies to the hydrogen under-potential
deposition (H-upd) charge, with E1 and E2 replaced by Evert1 to Evert2 as lower and upper
integration limits.
If the stoichiometry of the adsorption/desorption processes is not known for the IrO2
(respectively IrRu oxide) anode, the ECSA cannot be determined precisely.
However, the voltammetric surface charge, q* is generally considered an indication of
the ECSA even in the case a conversion of the charge into surface area is difficult
because the nature of the surface reactions is not known precisely.
In this case, the determined charge may be compared to another measurement carried
out under similar conditions.
In situ determination of the ECSA for the Pt/C cathode in PEMWE requires that this
electrode (WE) is fed with humidified nitrogen (or inert gas) and alternatively, nitrogen
saturated water is present at this electrode [8,9] while the electrode with IrRu oxide (CE)
is fed with de-aerated water.
A Dynamic Hydrogen Electrode (DHE) is used as reference electrode, for example, using
a configuration similar to that reported in Figure 1.
The DHE (separate circuit) could be based on two small pieces of Pt/C and IrO2
electrodes contacting the membrane (the same membrane of the main electrodes) on
opposite sides. These small electrodes are not in electrical contact with the main

16
electrodes but they are exposed to the same gas or water flows as the main electrodes
through PTFE (polytetrafluoroethylene) rib channels (Figure 1).
The two small pieces of Pt/C and IrO2 electrodes forming the DHE are polarised with a
very small current, e.g. a few mA/cm2 to have a low hydrogen evolution on the negative
electrode that acts as reference DHE electrode (Figure 1).
The Pt/C working is preferably polarised in the range 0.02-0.4 V vs. DHE. This is to avoid
polarising significantly the counter electrode as well as hydrogen evolution. The lower
potential limit can be adjusted (e.g. 0.05 V vs. DHE) to avoid hydrogen evolution; the
higher potential limit allows the determination of the double layer current baseline that is
subtracted from the integration of the hydrogen adsorption (Pt-H) peaks.
Recommended conditions are a sweep rate of 20 mV/s, a gas flow rate of 10
ml/min/cm2geo, a water flow rate of 1 ml/min/cm, reference operating temperature and
ambient pressure.
For determining the ECSA the cathodic sweep profile (adsorption) is integrated after
correction for double layer charging, i.e. after subtraction of double layer charging at 0.4
V vs. RHE. For a cathode with a Pt catalyst, a value of 210 C/cm2 [10-12] is taken
assuming one monolayer coverage for hydrogen.
For a cathode with a Pd catalyst, the approach is similar; however, the ECSA is
preferably determined from the charge involved in the reduction of the oxide layer
(PdOPd), from the cyclic voltammograms, assuming a value of 405 µC/cm2 for
monolayer coverage [13]. In this case, the CV range is from 0.02 (0.05) V to 1.45 V.
In the case of unsupported oxide anode catalysts, the variation of the voltammetric
surface charge with the potential scan rate, ν provides information about the existence of
less accessible surface regions which become progressively excluded as the sweep rate is
increased. For example in the case of Ru-oxide electrodes, q* usually varies linearly with
the ν−1 2⁄ . It is thus possible to extrapolate the values of q* to ν = 0 and ν → ∞, respectively.
The extrapolation enables an “inner” surface to be discriminated from an “outer” surface.
The former is composed by the regions of poor accessibility for the proton-donating
species assisting the surface redox reactions [14].

17
6.2 CV measurement for AEMWE
Usually, AEMWE consist of non-PGM (platinum group metals) catalysts at both anode and
cathode. Commonly, NiCoOx catalyst is used at the anode and nano-sized Ni-based
catalyst is used at the cathode. Adsorption processes are not known precisely for the
oxide/hydroxide materials thus the suggested method is the one used for Ir-oxide
catalyst in the case of PEMWE. The coulombic charge recorded in the same way for two
catalytic systems may then allow for their comparison.
6.3 CV measurement for AWE
Given that AWE catalysts are similar to those used in AEMWE, the same procedure as
applied to the latter may also be used for AWE. Surface area measurements are thus
similar.

18
THIS PAGE IS LEFT BLANK INTENTIONALLY

19
7 Data post processing and representation
For PEMWE cell with Pt/C catalyst at the cathode, the determination of the cathode
roughness factor, RF (cm2
real/cm2
geo), ECSA (cm2real) and specific ECSA (m2
real/g) involves
integration of the Coulombic charge under the H-upd peaks associated with the
adsorption of hydrogen atoms on the Pt atoms present on the catalyst surface.
The integration of the voltammetric profile in the useful potential window of the
voltammogram (between E1 vs DHE and E2 vs DHE [8]), corrected for double-layer
charging (capacitive component) provides for
𝐸𝐶𝑆𝐴 =𝑄𝐻
𝑄𝐻𝑂 (3)
where QHO is the electric charge per unit area (C/cm2real) for full coverage of one mono
layer of hydrogen on the metallic catalyst surface; e.g. 210 C/cm2 for Pt [10-12] and
311 C/cm2 for Pd [13] and QH is the measured charge in coulombs.
The specific ECSA (sECSA) is the ECSA per unit weight of the catalyst given by
𝑠𝐸𝐶𝑆𝐴 =𝑄𝐻
𝑄𝐻𝑂∙ 𝑀 (4)
where m is the catalyst mass loading in the electrode (g). The hydrogen desorption
charge is given by
𝑄𝐻 =1
𝜈∫ 𝐼𝑑𝐸
𝐸2
𝐸1. (5)
where E1 and E2 are the potential integration limits for the potential.

20
THIS PAGE IS LEFT BLANK INTENTIONALLY

21
References
[1] N. Elgrishi, K. J. Rountree, B. D. McCarthy, E. S. Rountree, T. T. Eisenhart, J. L.
Dempsey, A Practical Beginner’s Guide to Cyclic Voltammetry, J. Chem. Edu. 95, 2
(2018) 197-206.
[2] S. Brunauer, P.-H. Emmett, E. Teller, Adsorption of gases in multimolecular layers
J. Am. Chem. Soc. 60, 2 (1938) 309–319.
[3] A. S. Aricò, P. L. Antonucci, E. Modica, V. Baglio, H. Kim, V. Antonucci, Effect of
Pt-Ru alloy composition on high-temperature methanol electro-oxidation, Electrochim.
Acta 47 (2002) 3723-3732.
[4] R. Jenkins, R.L. Snyder, Introduction to X-ray Powder Diffractometry, John Wiley
& Sons Inc., New York (1996).
[5] G. Tsotridis, A. Pilenga, EU harmonised terminology for low temperature water
electrolysis for energy storage applications, EUR 29300 EN, Publications Office of the
European Union, Luxembourg, 2018, ISBN 978-92-79-90388-5, doi:10.2760/014448,
JRC112082.
[6] S. Siracusano, V. Baglio, N. Van Dijk, L. Merlo, A. S. Aricò, Enhanced performance
and durability of low catalyst loading PEM water electrolyser based on a short-side chain
perfluorosulfonic ionomer, Appl. Energy 192 (2017) 477-489.
[7] A. S. Aricò, V. Baglio, V. Antonucci, Direct Methanol Fuel Cells, Energy Science,
Engineering and Technology, Nova Science Publishers Inc., New York (2010).
[8] E. Brightman, J. Dodwell, N. van Dijk, G. Hinds, In situ characterisation of PEM
water electrolysers using a novel reference electrode, Electrochem. Comm. 52 (2015) 1–
4.
[9] C. Rozain, E. Mayousse, N. Guilett, P. Millet, Influence of iridium oxide loadings on
the performance of PEM water electrolysis cells: Part I–Pure IrO2 -based anodes, Appl.
Catal. B 182 (2016) 153-160.
[10] S. U. B. Ramakrishna, R. D. Srinivasulu, K. S. Shiva, V. Himabindu, Nitrogen
doped CNTs supported palladium electrocatalyst for hydrogen evolution reaction in PEM
water electrolyser. Int. J. Hydrogen Energy 41 (2016) 20447–20454.

22
[11] M. K. Naga, R. Balaji, K. S. Dhathathreyan, Palladium nanoparticles as hydrogen
evolution reaction (HER) electro catalyst in electrochemical methanol reformer. Int. J.
Hydrogen Energy 41 (2016) 46–51.
[12] J. J. Burk, S. K. Buratto, Electrodeposition of Pt Nanoparticle Catalysts from
H2Pt(OH)6 and their Application in PEM Fuel Cells, J. Phys. Chem. C 117 (2013)
18957−18966.
[13] R. Pattabiraman, Electrochemical investigations on carbon supported palladium
catalysts, Appl. Catal. A 153 (1997) 9-20.
[14] S. Ardizzone, G. Fregonara, S. Trasatti, Electrochim. Acta 35, 1 (1990) 263-267.

GETTING IN TOUCH WITH THE EU
In person
All over the European Union there are hundreds of Europe Direct information centres. You can find the
address of the centre nearest you at: https://europa.eu/european-union/contact_en
On the phone or by email
Europe Direct is a service that answers your questions about the European Union. You can contact this
service:
- by freephone: 00 800 6 7 8 9 10 11 (certain operators may charge for these calls),
- at the following standard number: +32 22999696, or
- by electronic mail via: http://europa.eu/contact
FINDING INFORMATION ABOUT THE EU

2
KJ-N
A-2
9285-E
N-C
doi: 10.2760/442574
ISBN 978-92-79-89870-9


![Cyclic Voltammetry of Zirconyl Chloride (ZrOCl2) in KF ......Solutions of zirconyl chloride reach their maximum hydrolysis in three hours [7-10]. Table 3. Cyclic voltammetry parameters](https://static.fdocuments.in/doc/165x107/611a62ecf0687b2382647c1c/cyclic-voltammetry-of-zirconyl-chloride-zrocl2-in-kf-solutions-of-zirconyl.jpg)