EU FRUIT AND VEGETABLES REGIME: PRODUCER … · the supply chain, ... The topic of food security...
134
Page 1 of 134 EU FRUIT AND VEGETABLES REGIME: PRODUCER ORGANISATIONS UNITED KINGDOM’S NATIONAL STRATEGY FOR SUSTAINABLE OPERATIONAL PROGRAMMES 2008 – 2013 Published December 2008
Transcript of EU FRUIT AND VEGETABLES REGIME: PRODUCER … · the supply chain, ... The topic of food security...

Page 1 of 134
EU FRUIT AND VEGETABLES REGIME: PRODUCER ORGANISATIONS
UNITED KINGDOM’S NATIONAL STRATEGY FOR SUSTAINABLE OPERATIONAL PROGRAMMES
2008 – 2013
Published December 2008

Page 2 of 134
Index
Section No. Sub Section Subject
Section 1 Introduction to (and duration of) the National Strategy
Section 2 Analysis of the situation in terms of strengthens and weaknesses and potential for development, the strategy chosen to meet them and the justification of the priorities chosen
Section 2.1 Analysis of the situation
Section 2.1.1 Introduction/Overview
Section 2.1.2 Situation report of the field vegetable sector
Section 2.1.3 Situation report of the vining peas sector
Section 2.1.4 Situation report of the top fruit sector
Section 2.1.5 Situation report of the soft fruit sector
Section 2.1.6 Situation in the protected edibles (salads) sector
Section 2.1.7 Situation report of the mushrooms sector.
Section 2.2 The strategy chosen to meet the weaknesses
Section 2.3 Impact from previous operational programmes
Section 3 Objectives of operational programmes and instruments, performance indicators
Section 3.1 Requirements concerning all or several actions
Section 3.2 Specific action required for types of actions
Section 3.2.1 Actions aimed at planning production
Section 3.2.2 Actions aimed at improving or maintaining product quality (non exhaustive)

Page 3 of 134
Section 3.2.3 Actions aimed at improving marketing
Section 3.2.4 Research and experimental production
Section 3.2.5 Training types of action (other than in relation to crisis prevention) and actions aimed at promoting access to advisory services
Section 3.2.6 Crisis prevention and management measures
Section 3.2.7 Environmental types of action
Section 3.2.8 Other types of actions
Section 4 Designation of competent authorities and bodies responsible
Section 5 The monitoring and evaluation systems
Section 5.1 Assessment of the operational programmes and reporting obligations for producer organisations.
Section 5.2 Monitoring and evaluation of the national strategy
Section 6 Miscellaneous provisions
Annex 1 Table of Actions covering Sections 3.2.1. to 3.2.8.
Annex 2 National Framework for Environmental Actions
Page 4 of 134
SECTION 1. INTRODUCTION TO (AND DURATION OF) THE NATIONAL STRATEGY A.1. The EU Fruit and Vegetables Regime aims to increase market orientation among EU growers and to increase growers‟ competitiveness in the supply chain, particularly in response to the continuing and increasing rationalisation of the retail sector. In order to achieve this, the Regime provides financial support for Producer Organisations (POs), which benefit from EU aid in respect of multi-year operational programmes. Producer Organisations are constituted by groups of growers who come together with the aim of planning production and promoting concentration of supply and improved marketing, and to promote the use of sound cultivation and waste techniques. Their operational programmes are essentially plans which detail the actions and measures that they plan to undertake in order to meet those aims. A.2. Following the major reform of the Regime which took place in 2007, the role of POs remains a central pillar of the regime. To ensure that aid for POs is used most effectively in ways which support the sustainable long term development of the fruit and vegetables industry, a requirement was set out in the Regulations for Member States to establish a National Strategy for Sustainable Operational Programmes. These Strategies would help guide the POs as to what types of actions/measures they should be including in their programmes but also includes elements for the monitoring and evaluation of operational programmes. A.3. The duration of the UK‟s National Strategy will be six years, running until 2013. The broader policy background A.4. The publication of the National Strategy for sustainable operational programmes in the fruit and vegetable sector takes place at a time when much attention is being given to the current and future context in which the farming, food and land management sectors will have to operate. Government administrations throughout the UK are working on renewing their strategic thinking for the sector, and for farming in general. UK-wide policy issues A.5. The topic of food security has come to considerable prominence in the wake of the steep increases/volatility in world prices of many food commodities that have occurred since 2007. In July 2008 a discussion paper entitled “Ensuring the UK‟s Food Security in a Changing World” was published. Among the principal food sectors, fruit and vegetables is that for which the UK has the lowest percentage level of self-sufficiency, and so the measures aimed at boosting the output and sustainability of these industries that are set out in the National Strategy will be of particular

Page 5 of 134
significance in the context of safeguarding and enhancing the role of domestic production in meeting overall demand. A.6. The month of July 2008 also saw the publication of a report commissioned by the Prime Minister on the 21st Century challenges for food in the UK, drawing together evidence about long term trends in food production and consumption, and the impact of food safety and nutrition on the health of the UK population. This report highlighted the gains, in terms of greenhouse gas emissions, that could be obtainable through changes in practice by farmers and growers and through reduction in food wastage at home. It also laid stress on the achievable gains in terms of public health that would flow from diets that met nutritional guidelines to a fuller extent than was currently the case, and gave special mention to the need for a new push on observance of the five-a-day requirement. This National Strategy will have a substantial role to play in bringing about the production and marketing changes in the fruit and vegetable industries that can help bring about the achievement of these objectives. A.7. In April 2008 the Competition Commission published the report of its Inquiry into UK groceries retailing, to which the Government published its response in late July. The report focused on allegations that had been made about anti-competitive practices within the grocery industry and the adverse consequences for consumers of such practices, and came up with a number of recommendations (with which the Government was, for the most part, in agreement) to address the issues that it had identified. One of the aims of the National Strategy is to strengthen the competitive position, the bargaining power of fruit and vegetable growers vis-à-vis the major multiple retailers, and their sustainability, and – if successful – these changes will lead to beneficial impacts on the operation and capacity of the supply chain, offering gains both to producers and consumers. A.8. In the last three months of 2008, the developing economic downturn and the credit crunch have overshadowed all other economic issues. While the effects of these factors on fruit and vegetable producers may be less far-reaching than is likely to be the case with other sectors of the economy, the credit crunch is bound to have some impacts on POs‟ investment programmes, which will need to be monitored carefully. Policy issues in: England A.9. In November 2007 Defra held a Stakeholder Conference on the theme of Farming for the Future. The partner organisations that were involved in that conference began work with Government towards delivery of a long-term vision for farming in England, building on the foundations laid in 2002 by the introduction of the Sustainable Farming and Food Strategy. A.10. The long-term vision concerns three priority areas: climate change, securing a healthy natural environment, and bringing about a thriving

Page 6 of 134
and competitive farming and food sector. The National Strategy for sustainable operational programmes in the fruit and vegetable sector will play a significant role in contributing the achievement of the objectives set out in the long-term vision in each of these priority areas. A.11. In December 2008, the Secretary of State announced the membership of a new Council of Food Policy Advisers to advise on all aspects of food policy. The Council will advise on issues ranging from production to retail, and from regulation and distribution to consumption, as well as on ensuring the UK‟s food supply, the affordability of food and the industry‟s environmental impact. The Council will work closely with the Department of Health and the Food Standards Agency. Northern Ireland A.12. The National Strategy for Sustainable Operational Programmes reflects the current situation in Northern Ireland, specifically in relation to the apple and mushroom industries there, within which its three Producer Organisations exist. The Department of Agriculture and Rural Development has a commitment towards sustainable development, and the National Strategy directs the continued development of Producer Organisations in ways that protect and enhance the physical and natural environment, and use resources and energy as efficiently as possible. Wales A.13 In Wales, the Welsh Assembly Government is consulting on a strategy "Farming, Food & Countryside - Building a secure future." The objective of the strategy is to achieve a more profitable future for farming and its associated food processing industry, which will sustain farming families whilst safeguarding the environment, mitigating climate change and maintaining the vitality and prosperity of rural communities in Wales. Scotland A.14. The Scottish Government has five strategic objectives - to make Scotland a greener, safer and stronger, wealthier and fairer, healthier and smarter place. Scottish growers can help the Scottish Government achieve its strategic objectives through sustainable agriculture, competitive in markets and contributing to local economies. The National Strategy has a role and will help Scottish growers in Producer Organisations play their part in helping to achieve these objectives. Our detailed objectives for the future development of producer organisations A.15. Against the background of the wider policy developments mentioned above, the Agriculture Departments have drawn up the following

Page 7 of 134
detailed objectives for the future development of the PO system generally, and for the fruit and vegetables sector more generally, which it is hoped will be achieved via the implementation of the National strategy. (i) To encourage more growers to join existing producer organisations, so as to permit growers to reduce their costs of production and fixed costs on the farm by providing central services and group owned facilities, thus making the growers more cost effective in the marketplace. (ii) To encourage producer organisations to reduce supply chains, by taking on more direct marketing either singly or in collaboration with other producer organisations, thus enabling growers to take a higher price for their goods by supplying produce closer to the end customer. This is in line with the Government‟s policy of encouraging greater co-operation and collaboration among farmers and growers, expressed through the implementation of Measure 124 of the Rural Development Regulation (Co-operation for the development of new products, processes and technologies) in all parts of the UK and also via support for such bodies as English Farming and Food Partnerships. (iii) To encourage producer organisations to source non-member produce in order to be able to fulfil annual supply contracts. Encouragement for POs to trade fresh produce from all origins, whether grown in the UK, other EU Member States or southern hemisphere third countries, will strengthen their ability to be strong players in the market place and to become category managers. (iv) To promote the corporate brand of the PO, and its produce. The majority of producer organisations have up till now been reluctant to market themselves either to new members or to new customers. Branding is desirable to build robust businesses. (v) To encourage independent reassessment of the corporate governance of the organisations, and of the opportunities to increase margins for growers. Producer organisations can benefit considerably from external review of their structure, governance and financial arrangements. Independent analysis by specialist companies and implementation of appropriate measures offers the potential to improve the commercial performance and corporate capacity and sustainability of producer organisations, and the position of their members. (vi) To develop crop grading, packaging, storage and distribution facilities to meet customer requirements. As the market develops for ready-o-eat prepared products, the POs need to reinvest in additional high-care facilities. (vii) To further develop field to fork crop-racking systems. The recording and monitoring of product from planting to eating is piecemeal at present, and POs should be able to track the life of a product back from point of sale to

Page 8 of 134
point of planting and have all inputs, handling and observations followed through the whole crop life. (viii) To develop electronic monitoring of crop growing environments in order to maximise crop production. Monitoring by instrument the environment around the crop for temperature, wind, moisture, CO2 etc., and using the data thus generated to forecast pest infestation, disease risk, irrigation need, heat/cold, offers the potential to optimise production. (ix) To encourage minimum input systems, including nutrient management and near organic pest control systems. Biological pest/disease management, nutrient input and offtake monitoring, should be given high priority. (x) To assess and reduce energy consumption during production, harvesting, grading, storage and marketing. POs should be supported in assessments of fuel usage and measures to monitor and reduce fuel consumption per unit of production. (xi) To optimise water usage according to crop need, by providing irrigation scheduling services, and where appropriate crop watering systems. (xii)To extend the storage and shelf life of fresh products, by investments in stores and developments in modified atmosphere storage of both the crop and the packaged product

Page 9 of 134
SECTION 2: ANALYSIS OF THE SITUATION IN TERMS OF STRENGTHENS AND WEAKNESSES AND POTENTIAL FOR DEVELOPMENT, THE STRATEGY Section 2.1 Analysis of the situation INTRODUCTION B.1 The fruit and vegetable market in the UK has continued to evolve since the publication of EU Council Regulation 2200/96 in 1996. Many of the factors driving that change were present beforehand, but the pace of change has increased and new challenges have arisen. B.2. The soils and climate of the UK offer a spectrum of conditions highly suitable for the production of a wide range of fruit and vegetables. However, the tastes and preferences of an increasingly cosmopolitan and sophisticated population mean that there is a continuing need to bring new products to the market and to compete with imported products, including those which cannot physically or economically be produced here. Market Outlets B.3. Fruit and vegetable production is increasingly tailored to consumer demands, as the industry has sought to be more responsive to changing tastes and customer requirements, using ever more sophisticated approaches of how to meet them (e.g. market data analysis). The principal driver for this process has been the requirements of the supermarkets, whose market share has continued to prosper, now accounting for some 70-80% of virtually all fruits and vegetables marketed in the UK. The multiple retailers have achieved this through the provision of generally high quality, consistent products in a convenient format, at prices which have enabled consumers to spend an increasingly lower proportion of their disposable income on food items. B.4. It is commonly considered that the retail environment in the UK is one of the most sophisticated in the world with the major retailers representing 85% of grocery market sales. This in turn has driven acute competition between retailers, as they compete for improved market share. This concentration of retail market power has driven substantial change in the fresh produce industry as suppliers have had to adapt to reflect the requirements of their customers. The PO scheme has helped POs in this process. B.5. This concentration of buying power, coupled with the requirement for suppliers to be able to deliver large quantities of a given product to a precise specification over an extended period, has had profound effects on the structure and nature of fresh produce production in the UK, which still continue. B.6. The most notable effects for the UK include:

Page 10 of 134
Concentration of supply
Product price deflation
Development of product range and specifications
Introduction and evolution of crop protocols B.7. To facilitate ease of handling, administration and delivery of a consistent product to an agreed specification, multiple retailers have reduced the number of fresh produce suppliers they deal with. Over the years considerable numbers of middle-sized businesses have stopped production and their capacity has been, to an extent, taken up by remaining producers, which have increased in size. B.8. Accordingly suppliers to the multiple retailers are currently a mix of large independent producers/packers and Producer Organisations. Production and packing/marketing have become closely integrated operations. (These functions are, of course, a prime requisite for any recognised PO although under scheme rules there is the possibility that some of these activities and functions can be outsourced provided that the PO retains responsibility for carrying out that activity). These developments are a reflection of the market situation, in particular to ensure all year round supplies of produce from relatively few suppliers. B.9. Not all supermarket suppliers interface directly with their suppliers; the introduction of category management, whereby a supplier is appointed by a supermarket to fulfil their supply requirements for a crop or group of crops means that some suppliers act as a „second tier‟, with the category manager organising supplies – both UK and imported to their economic advantage. Existing supermarket suppliers are under significant pressure to perform well, to ensure their continued status as approved suppliers; even so competition in the market and further supplier rationalisation by supermarkets may result in „delisting‟ at relatively short notice, with the challenge of finding alternative markets a difficult one. B.10. Linked with supplier competition is the effect that supermarkets can exert on supplier prices. There has been a continuing drive to reduce these as supermarkets have competed with each other on retail price, and as they seek to increase margins. This has demanded responses from the industry in increased unit yields and greater efficiency and has required in many instances investment in machinery to help deliver lower prices, as well as meeting other supermarket requirements. The UK industry has been able to react positively to many of these challenges, with increased yields, improved techniques, value-added products and reduced costs, but an increased share of the market has become occupied by imports for many crops, particularly those of a „commodity‟ nature‟, e.g. round tomatoes; button mushrooms; and top fruit, as the lower prices at which these have been available have been preferred.

Page 11 of 134
B.11. With few exceptions, UK producers grow for the home market only; although the range of opportunities is showing some signs of expansion here, e.g. through food service and public sector procurement. Exports tend to be undertaken in relation to „one-off‟ shortages occurring elsewhere, rather than being a regular feature of the sector. Numerous UK businesses and POs have overseas activities, which are important for them to enhance their offer and strengthen their activity. The UK‟s largest trade gap, amongst food commodities, by a long way, is in fruit and vegetables. Taking figures for fresh produce only (excluding potatoes) in 2007:
The UK imported £1.5 billion in vegetables (the top three were tomatoes, sweet peppers, and mushrooms), and exported and re-exported £46 million;
The UK imported £2.1 billion in fruit (the top three were bananas, apples and grapes), and exported and re-exported £72 million. (source: Defra- Basic Hort stats 2008)
B.12. However, it should be pointed out that some of this is likely to be accounted for by winter/out of season supply. B.13. In meeting retail customers‟ needs, for example with added convenience or extended seasons, developing sales, introducing novelty and adding value, the supermarkets have needed new forms of presentation, varieties or new products. These are often trialled and introduced as a result of collaboration between grower or grower/packer and supermarket and can become very successful, e.g. bagged salads, tomatoes on the vine, asparagus, raspberries produced under polytunnels. These introductions are likely to entail the use of significant quantities of management time and subsequent capital investment on the part of producers, but can result in significant new business. B.14. The methods of production have also come under an increasing spotlight from the multiple retailers, who are in turn responding to the concerns of non government organisations (NGOs) and pressure groups. Each retailer has its own different requirements as the conditions of supply, which may comprise crop protocols (e.g. the Assured Produce Scheme or individual retailer bolt-ons) and individual business policies relating to such areas as health and safety, energy, the environment etc., as well as specifics for each crop and/or product. Businesses would normally be audited independently to demonstrate fulfilment of „due diligence‟, and aim at more rigorous levels of achievement than compliance with legal requirements or good agricultural practice alone. B.15. Individual crop sendings need to be traceable back to the „field‟, with full crop history known. B.16. These food safety protocols and audit trails are partly the result of inter-supermarket competition – how they wish to be perceived by their customers -and partly due to their wish to minimise perceived risks and respond to expressed customer concerns. Hence supermarkets have been pressing suppliers further to reduce the levels of any pesticide residues which

Page 12 of 134
can be found in crops at harvest. This requires revised strategies for pest and disease control and greater use of integrated crop management, where the appropriate tools exist. Food Standards are particularly high in the ready-to-eat sector such as salads and soft fruit. B.17. The other principal market outlets for fresh produce, occupying 15-25% of the market together are the processors; wholesale markets; direct sales (farm shops, PYO and Farmers Markets); and public procurement/food service. For a few crops, such as peas, processing is a significant part of the UK‟s requirement for the crop. For other crops, such as brassicas, the processing sector provides a useful outlet for UK producers, particularly if they can be diverted from the fresh produce market at times of oversupply. In general, however, crop specifications for processing are not significantly lower than the fresh market. B.18. The offer of many wholesale markets has diversified as they have sought to cope with the effects of the supermarket trade, who purchase direct from suppliers. Increasingly they are becoming involved in added value activity, such as supplying the food service sector. However, they still fulfil a role in providing produce to independent retailers and to market traders, though the customer profile of these outlets tends to be an ageing one (although there are signs of increased interest from a younger customer base). In addition to acting as a conduit for imports, UK wholesale markets tend to be supplied regularly by smaller producers who prefer not to deal with the supermarkets, or who have no access to them. In addition, larger producers and POs may use wholesale markets on a regular basis for a proportion of the crop they pack which does not meet their regular customer requirements or, more occasionally, where supply exceeds demand at a particular time. B.19. Direct sales are principally the province of smaller operators, who have taken advantage of their location and adjacent population catchment to offer a wide range of crops via Pick-Your-Own or farm shops for local purchase. Some medium-sized growers are also involved with Farmers Markets, where sufficient take place within their „local‟ area. Direct sales offer the potential of premium prices being returned to the producers, although a good level of management skill is required for the range of crops and activities usually offered (on modern professionally-run units at least) and adverse weather can still have a major effect on customer footfall, purchases and economic results from year to year. Direct sales are likely to benefit from current consumer interest in local sourcing, although the overall effect on market segmentation is likely to be small, at least in the short-term. B.20. As mentioned earlier, supply for food service and for public sector procurement are relatively new areas being developed which offer opportunities of customer diversification for primary producers in the fruit and vegetable sector. B.21. The changes to rules on EU marketing standards – which take effect from 1 July 2009 – could lead to new possibilities for growers and POs

Page 13 of 134
to be able to market a wider range of quality specifications of produce to their supermarket customers. For example, greater marketing of lower grade produce such as Class II or its equivalent rather than the Class I produce which is the current preference of supermarkets. The debate on the reform of the standards highlighted the fact that many consumers are not necessarily worried about the cosmetic appearance of produce and are happy to purchase lower grade produce, particularly if this may appear to be cheaper. Such marketing opportunities may also give rise to potential areas for new investment by POs, for example in new grading and packaging machinery. Consumer demand B.22. The UK market for fruit and vegetables is a vibrant one; for a number of products it has grown significantly in recent years and potential for further growth remains. In recent years the population has risen, creating an increase in demand, though its increasingly diverse background, coupled with greater experience of different foods, has also led to a demand for a wider range of fresh produce. B.23. Considerable effort by the Government and others has been put into campaigns to increase the consumption of fruit and vegetables and towards healthier diets in general and these may be anticipated to have a positive effect on future demand. Purchases of fruit and vegetables reached 4 portions/day in 2005/6; a further shift towards the Government target of 5 portions/day would have a significant effect on demand, even if some were fulfilled by imports. This may benefit fruit more than vegetables (consumption of the latter has been on a downward trend overall), as these crops are considered to be more convenient. However, reaching improved consumption targets is not guaranteed: consumption generally appears linked to income levels, so may be threatened by an economic downturn, and there is evidence that purchases and consumption are not synonymous. Household food wastage is known to be particularly high for fresh produce. Any significant reduction over purchasing/non-consumption, while environmentally beneficial, could reduce demand. B.24. Changes in consumer demand can offer opportunities for producers as well as challenges. Demand for organic produce has been growing rapidly in recent years. For some crops significant strides have been made in meeting the UK‟s requirement, but in others most remains imported. The supermarkets are the largest purveyors of organic fresh produce; but the erosion of price premia for their products does raise a question mark in the minds of some producers about economic viability when all the associated production costs are included.
UK Organic Area
Area (ha)* % of total
Fruit & nuts 1,794 5.5

Page 14 of 134
Vegetables 15,544 3.1
Source: Defra, Jan 2007 * certified organic + in conversion
B.25. The proportion of „in conversion‟ land for fruit and vegetables compared with that for fully organic is relatively low at 13% and 15% respectively, compared with 33% for cereals. There is likely to be further debate about the benefits of organic produce over conventional when measured by „carbon footprint‟ or with reference to pesticide residues when usage in conventional crops is declining. The current evidence from the market is that demand for organic fruit and vegetables is still growing.
B.26. Surveys of consumers have shown that they have an interest in local (and ethical) sourcing but the reported level of interest is often not replicated by actual buying patterns. Whilst this may mean for some, increased purchases in local farm shops and Farmers Markets, it is likely to be more significant for existing producers – and offer opportunities for new ones – as supermarkets react by increasing regional branding of products and, in some cases, by procuring additional sources of supply.
Other factors affecting the fruit and vegetable sector
B.27. Increases in legislation and regulation on horticultural businesses have affected fruit and vegetable businesses and will continue to do so. These extend to many areas including employment, operations and the environment. Generally, the larger production units are more able to cope with the requirements of these measures, which often interact with information which has to be assembled to demonstrate compliance with customer protocols. The work involved is often given to specifically appointed members of staff and it is the larger units which can spread the cost of this more easily.
B.28. The supply of labour has been a high profile issue within both the fruit and vegetable sectors in recent years and an adequate supply is necessary for businesses to function effectively. To a large extent the manual workforce has been supplied from Eastern Europe in recent years and they have provided a generally well-regarded source of labour because of their availability and work ethic. Many have progressed to supervisory and management positions, though the supply of the latter in particular is giving cause for concern in the industry, because of a lack of new entrants. Because of rising employment costs and the uncertainties surrounding future availability of labour, particularly seasonal labour, it is likely that opportunities to mechanise operations further, or to devise new production systems which use labour more effectively will be sought. B.29. Climate change in general has a long perspective in terms of describing the „current situation‟, but the increasing threat of extreme weather events is one that businesses will have to deal with over the coming years. The importance of maintaining a flow of high quality produce as close to the

Page 15 of 134
planned production as possible is paramount. This may require a range of measures to be adopted to help safeguard production and mitigate the risks caused by some of the weather events encountered in recent years. B.30. Of more immediate concern for the sector during 2008 was the volatility, including substantial increases, in the price of oil. The reaction to this - together with the impact of the current economic circumstances - is expected to be one of the dominant factors affecting the future development of the sector in the short to medium term. B.31. Further influencers and sector drivers are dealt with separately under individual sector descriptions.

Page 16 of 134
2.1.2 - Situation report of the field vegetable sector FIELD VEGETABLES
UK Area (ha) 2006
of which Ha Production ('000t) UK Area (ha) 1996
of which Ha Production ('000t)
Field vegetables
111,274 Roots 18,364 947.9 145,222 Roots 23,775 909.7
Onionso 10,389 383.3 Onionso 11,780 312.9
Brassicas 28,747 515.1 Brassicas 40,862 738.8
Legumes* 37,580 158.1 Legumes* 49,558 267.2
Others 16,194 343.5 Others 19,247 427.4
Defra Basic Horticultural Statistics Odry bulb and salad *excludes dried peas

Page 17 of 134
1. Production trends B.a.1. The production of field vegetables accounts for over 70% of the total area devoted to horticulture (Defra June Survey (2006). As a generalisation, the production area for many vegetable crops has declined in recent years, though often production levels have been maintained due to technological advances and the concentration of production in fewer but more focused and efficient businesses. B.a.2. Amongst root crops, the carrot area has remained relatively stable, with only minor changes in production areas in recent years, but with more production in Scotland and Yorkshire. The British Carrot Growers Association has been very active in promoting the crop, with new products, such as Chantenay, having been developed, and which now account for over 10% of sales. Extending the season of home production continues to be a challenging and expensive operation. The increased variation in weather conditions is making winter field storage more uncertain, with warm dry spells putting the crop under stress and very mild autumn conditions leading to field temperatures too high for overwintering the crop without appreciable re-growth and loss of quality. B.a.3. Demand for parsnips continues to increase year-on-year, with the season being extended from a traditional Christmas crop to one from August through to the following May. B.a.4. Brassicas have shown a steady decline in area in the last 10 years, as their overall popularity has faded, though the reduction in cabbage has stabilised, and that for cauliflowers can be attributed in part to two difficult production years, where poor returns discouraged production of the crop. In England Brussels sprouts have also declined, by nearly half over the last 10 years though there are signs of stability, partly due to very active marketing by the crop association. In Scotland, there is a different situation as in the same ten years period the area under production has more or less doubled (341 ha in 1997 to 677 ha in 2006). However, the crop is now thought by many consumers to be only available for the Christmas period. In England, Calabrese (green broccoli) is a success story, with positive attributes, such as a healthy image and ease of preparation. Again in Scotland there is a different story where the area has reduced by a third in the past ten years. There are also opportunities for niche members of the broccoli family such as purple sprouting and Tenderstem. There is increasing consumer demand for prepared and semi-prepared convenience packs of cauliflower and calabrese.

Page 18 of 134
B.a.5. The challenge for onion producers is reliable production of good quality crops at a competitive price. As production has become more concentrated on fewer holdings, the facilities for harvesting, storage and packing have improved, but bulb size and quality is still influenced each year by the weather leading up to harvest. Production area does fluctuate, depending on the profitability of the preceding season. Processing occupies a significant part of the market and lower-priced imports offer significant competition here. UK red onion production however is increasing by 5% per year. B.a.6. The leek area remains stable, with production, which is in relatively few hands, now being almost year round. B.a.7. Though the area of salads remains static, there has been growth in volumes of 25-30% over the last years as a result of greater production efficiency through innovation and R&D. The emphasis on type of crop being grown continues to evolve, with the dominance of Iceberg challenged by Romaine cos types and „novelty‟ types of lettuce. The campaign for a healthy diet is one of the factors helping sales and volume of bagged/ prepared salad mixes to increase. B.a.8. Minor or niche crops continue to show expansion with notable success for asparagus and herb crops, both actively promoted by publicity campaigns by the crop associations and other groupings. 2. Structure B.a.9. Even though there is a recent trend and much publicity for more local or regional sourcing, the vegetable industry continues to be very much based in the Eastern (33,394 ha) and East Midlands (37,005 ha) regions as together they account for 63% of field vegetable production in England. Production in Scotland is 11,778.4 ha.

Page 19 of 134
Area (as a %) of vegetable production in
England by region
North West
North East
Yorkshire And
The Humber
East MidlandsWest Midlands
Eastern
London
South East
South West

Page 20 of 134
B.a.10. The vegetable industry is increasingly dominated by a relatively small number of large scale players, often family-owned businesses, which are seeking to achieve economies of scale by amalgamating and merging. The major multiples are encouraging and in part driving the reduction in supplier numbers. This consolidation is becoming particularly marked in some crops, such as carrots and onions, where there is continuing reduction in the number of suppliers to the multiples. B.a.11. The rationalisation of numbers of suppliers to the multiples and the adoption of category management has meant that many individual growers no longer have direct contact with the retailer and are reliant on the Producer Organisation, packer or marketing agent – or a combination of these – for communication with the market and its buyers. A number of traditional style co-operatives have disappeared due to rationalisation and their perceived slowness to make commercial decisions compared to private companies. B.a.12. There is increased demand for „local sourcing‟, met in part through acquisition of new suppliers and the adoption of regional branding by the multiples, by „food hubs‟ such as „Taste of Anglia‟ supplying independent outlets, and by direct sales through Farmers Markets, Farm Shops and PYO. Direct sales account for only a very small proportion of the population and of production. B.a.13. In other sectors of horticulture, the major field vegetable suppliers are predominantly a mix of large independent growers and Producer Organisations. The proportion of crop handled by POs varies significantly, depending on the vegetable group concerned. A detailed breakdown of the proportion of each crop group handled by POs is not available, but in most cases the majority of supply would appear to be handled by independents, at least compared with POs with active operational programmes. B.a.14. Most factors point to a continuing shift towards fewer, larger production units. Examples of these pressures are:
the need to control internal and external costs by spreading them over an increased production base (i.e. economies of scale)
the ability to keep abreast of and comply with changing legislation and the compliance requirements of major buyers
access to capital for investment B.a.15. However, the challenges of staff recruitment (and retention) and consumer preferences expressed through new buying patterns may modify this trend. 3. Markets & supply chain

Page 21 of 134
B.a.16. The main and, in some cases, the only outlet for vegetable produce is through the supermarkets. Depending on the crop grown, it is estimated that between 65% and 95% may be marketed in this way. For many producers, the wholesale market is now of little importance, although there are growers who have developed this relationship and who still find this outlet to be worthwhile, perhaps due to a lack of adequate volume for supermarket sales, or by growing a specialist range of niche crops. B.a.17. Meeting supermarket requirements is a major challenge. Cosmetic appearance remains important, and this can lead, in extreme cases, to as much as one third of edible produce being thrown away. Crop specifications and volumes required can change at short notice and great flexibility to respond to these demands is required. Customer service is of the highest importance, as „de-listing‟ by a supermarket can seriously affect the viability of a business. In response to their buying position and need for high volumes, independent growers and grower groups are getting larger (by acquisition etc.) to offer the service required, and seek further reductions in unit costs. These are necessary as it is generally agreed returns to the producer sector are not keeping pace with increases in input costs. B.a.18. The food service industry („out of home eating‟ and contract catering to schools, hospitals, prisons and other public bodies) is attracting more attention from UK suppliers, but can also be a challenging market due to its size, diversity and the wide range of potential customers looking for fresh produce. Volumes may be small and have to be sourced from a number of producers, but opportunities for co-operation exist and are potentially a natural activity for a Producer Organisation. However, some producers consider it easier to do business with one supermarket, either directly or through a category manager, rather than attempt to understand the complexities of serving the food service industry, despite apparent attractions such as less volatility and a more guaranteed market at a stable price. B.a.19. Direct sales have been mentioned already; volumes sold are very modest in comparison with those moved through supermarket chains. Vegetables are very much „second fiddle‟ to fruit on PYO farms. B.a.20. Defra figures show that organic and „in conversion‟ land for vegetable production stands at just over 3% of the total vegetable area for the UK (January 2007). Mixed enterprise holdings were traditionally associated with organic production, but there have been significant attempts to meet increased demand both by established and new organic producers and by entry of existing large- scale conventional growers into the market. There have been substantial increases in the volume of box schemes offered to consumers, and also in the amount of UK organic product on supermarket shelves. While demand for organic produce has undoubtedly been growing further in recent years, there have been a number of conventional growers who have entered the market and then left it again, finding that it was not economically sustainable, particularly as price premia for organic produce are tending to erode. The experience of some UK supermarkets last year has led

Page 22 of 134
them to try to move towards 100% domestic supply for their frozen organic vegetables requirement. B.a.21. The proportion of market supply fulfilled by home production varies widely between crops. For example, UK production meets over 90% of the demand for carrots and cabbage, but just over half of the demand for cauliflower. With its substantial levels of imports from Spain in particular, home production of lettuce is at 44% market share. Onions, Calabrese (broccoli) and beans are also major import categories. This mixed picture is partly due to seasonal availability and partly product characteristics (e.g. mild onions from Spain). 4. Market drivers B.a.21. Numerous factors are influencing - or have the potential to influence - the UK vegetable industry, including:
CAP reforms and applicability of agri-environment schemes
Greater public & industry awareness of environmental issues including carbon footprinting
Imports and food miles
Labour availability, retention and succession
Energy costs
Requirement for high investment especially in processing vegetables such as vining peas
Trend to local/regional sourcing
Healthy eating initiatives
Niche marketing opportunities including organic production
More frequent weather extremes
Legislative issues such as waste regulations. B.a.22. Consumers in supermarkets have often of late been described as making complex purchasing decisions, taking into account price, quality, environmental and ethical considerations. The multiple retailers compete with each other on many issues, but price remains a cornerstone, hence the continued drive for cost reduction and lower supply prices is a continuing fact of life for those supplying these retailers in the UK. This is being tackled in part by consolidation, as mentioned above, as a way of offering improved economies of scale. B.a.23. Quality is of great importance and so is customer assurance. All multiples have schemes in place to demonstrate their commitment to this process and to product traceability, though a close dialogue is still required with primary producers.

Page 23 of 134
Interface with customers is important and this is being driven by multiples who all want to enhance their green credentials. This will increasingly impact on growers for example the reduced use of or even restriction on pesticides that can be used and a requirement for organic production. B.a.24. An important driver for the vegetable sector is encouraging consumption of fresh vegetables. Many of the individual crop associations have promotional activities in place, often linked to healthy eating. Government policy is also to encourage increased consumption. B.a.25. Labour is an essential aspect of vegetable production and can be the biggest single input. Potential lack of labour, both skilled and unskilled, and the need for staff retention are important drivers to plans for business development and cropping intentions. Succession planning for management and the supply of high calibre technologists is also necessary and important. B.a.26. More challenging weather patterns, assumed to be associated with global warming, are leading to some production difficulties. The prolonged periods of wet weather (2007) or hot dry conditions (2006) seriously disrupted production schedules, yield and quality for many vegetable crops. Shortages of product are not the only consequence; often, as for brassicas in 2007 and 2008, gluts can result as continuity programmes collide, and prices can be adversely affected or poor quality can mean that supermarket specifications are not reached and the crop has to be dumped. Alternative sources of supply from a global market are usually available; supermarkets and marketing companies have become adept at sourcing from around the world to maintain supplies in their stores. The challenge for UK growers is to develop production systems which mitigate the effects of these weather occurrences. The industry feels that the need for science and R&D at the applied level is paramount. B.a.27. Adequate availability of water is an essential requirement for many crops and situations, as insurance against periods without adequate rainfall and to provide the wherewithal for sufficient plant growth and crop yield and quality to meet the market specifications. The application of the Water Framework Directive may have implications on the area of land which can be devoted to field vegetables in certain catchments - see Environmental impacts section (section 5). B.a.28. The field vegetables sector is very dependent on an adequate supply of rented land. Estimates indicate that one third or more of cropping is carried out on rented land and for some crops the proportion is significantly higher. The availability of rented land and the price at which it is available will have a linkage with potential revenues that can be obtained from alternative crops by landlords. The recent rise in cereal prices is a reminder that the supply of this essential input – land - is finite and, with the need for adequate water outlined above may affect the location of production and the ability to cultivate land in large blocks. As a consequence additional infrastructure and facilities may be required to support changing cropping patterns.
Page 24 of 134
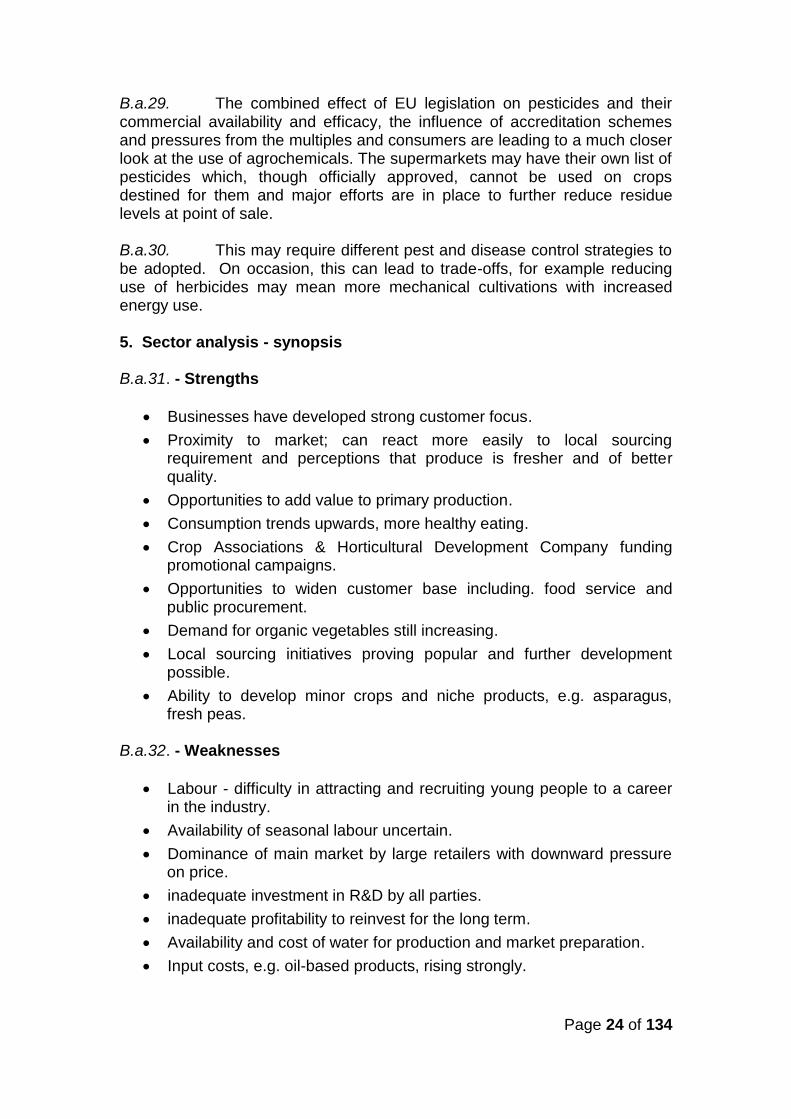
B.a.29. The combined effect of EU legislation on pesticides and their commercial availability and efficacy, the influence of accreditation schemes and pressures from the multiples and consumers are leading to a much closer look at the use of agrochemicals. The supermarkets may have their own list of pesticides which, though officially approved, cannot be used on crops destined for them and major efforts are in place to further reduce residue levels at point of sale. B.a.30. This may require different pest and disease control strategies to be adopted. On occasion, this can lead to trade-offs, for example reducing use of herbicides may mean more mechanical cultivations with increased energy use. 5. Sector analysis - synopsis B.a.31. - Strengths
Businesses have developed strong customer focus.
Proximity to market; can react more easily to local sourcing requirement and perceptions that produce is fresher and of better quality.
Opportunities to add value to primary production.
Consumption trends upwards, more healthy eating.
Crop Associations & Horticultural Development Company funding promotional campaigns.
Opportunities to widen customer base including. food service and public procurement.
Demand for organic vegetables still increasing.
Local sourcing initiatives proving popular and further development possible.
Ability to develop minor crops and niche products, e.g. asparagus, fresh peas.
B.a.32. - Weaknesses
Labour - difficulty in attracting and recruiting young people to a career in the industry.
Availability of seasonal labour uncertain.
Dominance of main market by large retailers with downward pressure on price.
inadequate investment in R&D by all parties.
inadequate profitability to reinvest for the long term.
Availability and cost of water for production and market preparation.
Input costs, e.g. oil-based products, rising strongly.

Page 25 of 134
More challenging weather patterns with implications not fully understood.
Vulnerable to loss of crop protection products. 6. Environmental impacts B.a.33. Research recently commissioned by Defra1 comparing the „environmental footprint‟ of certain field vegetables with other horticultural crops, wheat, lamb and milk has showed that in terms of:
- ecological footprint;
- pesticide use;
- „global warming potential‟;
- eutrophication/acidification potential ;and
- water and labour use those studied (carrot, cauliflower and onion) rated quite low for impact. This in part due to the attributes of the production systems employed, but also reflects the part played by Good Agricultural Practice codes, accreditation schemes and the demands of the market. Nevertheless the demands to improve environmental performance continue to increase both as a result of legislation and of consumer preferences. B.a.34. The majority of vegetable businesses are accredited to at least one crop assurance scheme, such as Assured Produce, and often several such schemes. In general these require the adoption of practices which go beyond compliance with legislation and require businesses to demonstrate that this has been done through self- and independent audits. Accredited businesses should have policies in place covering environmental aspects of production, which will be subject to regular review. Indeed many leading producer groups actively promote their environmental credentials and take an active part in schemes such as LEAF or „Operation Bumble Bee‟. B.a.35. Major environmental concerns for vegetable producers are the use of water and energy, including transport. B.a.36. As discussed above, water plays a crucial role in the sustainable cropping of many vegetable growing enterprises; often associated with this are habitat areas for example around reservoirs. The Water Framework Directive and climate change are major drivers likely to affect future investment. Water abstraction and its management in terms of efficacy of application represent a major challenge for the vegetable growers as the majority of water use in vegetable crops is during the summer, when there may potentially be a shortage in supply. If, as a result of climate change, summers are to be longer and drier, then water shortages and/or the increasing cost of water may have an environmental impact. Longer and drier
1 Environmental Footprint and Sustainability of Horticulture (including Potatoes) – A
Comparison with other Agricultural Sectors (W-HRI, Dec 2007)

Page 26 of 134
growing seasons could result in greater amounts of water being required, for example irrigation is now sometimes required in March and October which would have been unheard of even 5 years ago. Efforts are being made to encourage greater water resource efficiency by considering practical measures to reduce usage, adopting best practice and benchmarking irrigation systems, as well as investing in improved delivery systems. Where feasible, growers will be looking to ensure greater security of this resource. Greater attention may also need to be given to preventing soil erosion as irrigation or intense rainfall events increase. B.a.37. Likewise energy use, including its use in transport, can have a major environmental impact from primary production though to market preparation. Energy audits are becoming a more regular feature on farms, with energy consumption an important feature for product choice or investment decisions. B.a.38. Many vegetable growers have been keen to subscribe to environmental improvement schemes, not only with tree and hedge planting, but with other measures to increase bio-diversity. B.a.39. An increasing number of businesses are looking for ways to reduce their impact on the environment, by auditing all parts of the supply chain. Retailer influence on the supply chain could lead to more environmentally benign and effective policies for combating climate change. This will impact on primary producers‟ policies for energy use, water and waste. B.a.40. Carbon footprint labelling could become a standard requirement so that products can be labelled for consumers to see their environmental impact. (However, carbon labelling is one aspect of the environmental impact but it is not the complete picture). Schemes are being developed by the Carbon Trust in partnership with Defra and BSI. Tesco has already introduced carbon footprint labelling on 30 of its products and this can only increase and spread to more retailers and agri-businesses. (It should be noted that the industry‟s contention here is that the lack of a common scientifically agreed formula for the calculation of footprints could disadvantage growers. For example, internationally agreed methods disadvantage agriculture as they do not take account of carbon content of food sold by the farmer. Another issues is that it could lead to retailers claiming their method is best, without any benefit derived for growers or consumers)

Page 27 of 134
2.1.3 - Situation report of the vining peas sector VINING PEAS
2006* 1996**
Peas
UK Production area (Ha) 36,494 42,781
Home production „000 tonnes
140,169 215,500
*PVGA data **Basic Horticultural Statistics 1. Production Trends B.b.1. Vining peas are the UK‟s most important legume crop, in both area and volume. The drop in production over the 1996 – 2006 period is greater than the downward area trend would suggest because of short-term climatic factors. The crop is significant in Scotland; the 2007 area was estimated to be 3,800 ha, with an output of 21,500 t. Contracted home production in a „normal year‟ should be approximately 150,000 tonnes but in the last few years that achieved has fallen short of this. Any shortfall is made up with imports from other European counties, primarily Belgium and France, and occasionally from New Zealand. The vining pea share of sales value of all frozen vegetables (including chips) is constant at about 13%, though in some years UK tonnage has decreased due to poor harvests. The industry‟s promotional campaign „Yes Peas‟ has helped maintain sales volume. B.b.2. Over many years, the crop has had a chequered history in terms of tonnage produced and profitability; the last 3 years have been particularly challenging for some harvest groups, with tonnages produced being low throughout. The weather has played a major part in the fortunes of the crop in the last 2 years, with extremes of drought and wet impacting severely on the yield and quality of the crop. However, when grown successfully, peas are a fertility-building crop with an early harvest date, making them an important part of arable-based rotations. B.b.3. In 2006 many English crop yields were down by 15-20% after the combination of a cold wet May followed by hot and dry conditions, although Scottish crops did not suffer in the same way. Overall only 85% of the expected crop was achieved, with many growers losing money. B.b.4. A warm dry start to 2007 hampered the drilling programme and torrential rain at harvest time, particularly in Lincolnshire and South Yorkshire, disrupted operations severely with some crops not harvested. At best 65-75% of budgeted yield was achieved with some producer groups achieving far less. As in 2006, Scottish crops tended to fare better. Prices for 2007 had increased by some 12% over 2006, but this was insufficient to offset increased production and harvesting costs and low yields for many groups.

Page 28 of 134
B.b.5. The risks exposed in the production of this crop, as recently experienced, set against the increased returns currently on offer from cereals and oilseed rape, will challenge the commitment of vining pea growers, despite its useful role in the rotation. B.b.6. Despite the ups and downs in area and yield caused by the market supply situation and the weather conditions, the last 10 years or so have seen a gradual decline in area, due partly to low prices and poor yields, and partly to wider rotations to minimise fungal disease.
UK Pea Yields
0.00
0.50
1.00
1.50
2.00
2.50
3.00
1 2 3 4 5 6 7 8 9 10 11
Calendar years 1996-2006
T/h
a
Source: Basic Hort. Stats
UK Pea Area
0
10000
20000
30000
40000
50000
1 2 3 4 5 6 7 8 9 10 11
Calendar Years 1996 - 2006
Hecta
tres
2. Structure B.b.7. Pea production areas are mainly situated along the east coast of both England and Scotland. The normally drier climate is favourable for crop development and minimises the risk of wet weather at harvest. The highly perishable nature of the crop and the appreciable transport costs also dictate that production should be close to processing factories. Most (for both canning and freezing) are in the Eastern counties, for this reason and also for close proximity to major fishing ports and vegetable and fruit growing areas. There continues to be rationalisation in the number of processing sites, with one freezing factory ceasing in Lincolnshire in 2008. This has implications for individual pea groups, which could find themselves too distant from a processing factory to maintain viability. B.b.8. The major freezing processors in 2007 were Birds Eye at Hull, Yorkshire and Lowestoft, Suffolk and Pinguin Foods UK Ltd at King‟s Lynn, Norfolk; and Bourne; Boston; and North Thoresby, Lincolnshire. B.b.9. POs dominate in the legume sector of vegetables, though there has been rationalisation and amalgamations over the years. Some groups have stopped growing the crop altogether – one group in Lincolnshire, one group in Norfolk and one group in Suffolk have stopped growing the crop in the last year. Some 11 or 12 groups are still active now. There are still a few farmer owned groups which are not registered as POs, but the general

Page 29 of 134
industry consensus is that the need to invest in new viners and the price being paid for rented land may force them out of the crop, leading to opportunities for progressive POs to expand. 3. Markets and Supply Chains B.b.10. The bulk of the crop is of course grown for freezing as „garden‟ peas. Payment is based on maturity („tenderometer‟ reading). The market is principally divided into those growing for the leading brand and others, supplying „own brand‟ labels. B.b.11. There is a growing market for organic vining peas (and dried peas) but the market is still small and currently being met by imports. The price that processors are currently prepared to offer is constraining growth. A key benefit of peas in an organic rotation would be to provide an additional cash crop, without depleting fertility levels, thus enabling the rotation to be extended and the average gross margin over the whole rotation to be increased.
UK trade in frozen peas, 1996 - 2006
1996 2006
Trade Flow £000s Tonnes £000s Tonnes
Total Imports
EU 7,091 12,565 18,523 35,933
non EU 2,711 4,120 1,251 2,222
538 882 350 619
Total Exports
EU 23,332 33,585 13,766 20,567
non EU 538 882 350 619
HM Revenue & Customs Notes: EU imports mainly from France and Belgium, non EU mainly from New Zealand Notes: The requirement for peas for canning is only some 14,000 tonnes.
4. Market Drivers B.b.12. The challenges facing this sector are very much as for other vegetable crops, with the additional concern of the need to replace specialist harvesting equipment which is costly and only in use for a few weeks per year. The most recent models benefit from lower ground pressure, are quieter, and have low engine emissions. The latter is important in reducing the carbon footprint which is now being taken onboard by the production groups. B.b.13. When pea harvesters (viners) need replacing, the capital cost of some £250,000 -£300,000 could be the chief factor for vining groups in deciding not to continue cropping peas. Indeed this has already happened with dwarf beans for processing, where the returns were not sufficient for

Page 30 of 134
investment in replacement harvesters and consequently some groups ceased production. B.b.14. However, even though the last 3 years have been challenging for peas, there is still an intention to invest in new harvesting machinery as technology improves. Through the 1990s sales of harvesters were ˃10 per year, but in 2007 only 4 were commissioned, with a similar number for 2008. In comparison, exports of UK manufactured harvesters have increased; 2008 will see 16 machines delivered to competitors in mainland Europe. 5. Sector analysis - synopsis B.b.15. – Strengths
Healthy image.
Valuable break crop in fertility terms (returning N to the field); climate has been well suited to the crop.
Ahead of other vegetable sectors in developing action plans for energy, carbon footprint, soil management, diffuse pollution and biodiversity.
Low water usage, only a few crops irrigated.
B.b.16. - Weaknesses
High capital costs of replacement harvesters.
Wide variation in profitability between years.
Increasing concern of extreme weather in both 2006 and 2007 that could limit production in some parts of the country.
Alternatives arable crops at present more profitable with less risk and uncertainty.
soil health and structure are important factors in crop performance with pea yields depressed where crop is grown in compacted and poorly drained soils. (An allied problem is that due to the requirement for growers to be within a certain range of processing factory this can lead to a limited availability of suitable soils).
Lack of awareness by those further up supply chain of the challenges in growing the crop.
Lack of processing capacity in some areas could limit potential. An example is Scotland where the crop has not suffered the same extremes in weather as parts of England but processing capacity will limit the area that can be grown.
6. Environmental Impacts

Page 31 of 134
B.b.17. All crops are produced to Assured Food Standards, and/or additional requirements of the processor or end customer. B.b.18. Vining pea crops require little in the way of soil applied fertiliser and research and development has enabled thresholds to be established for major pests, limiting the application of pesticides. Peas are a nitrogen-fixing crop and contribute up to 50 kg/ha N back to the field they are grown in – which of course needs to be captured by a following crop. B.b.19. Harvesting of the crop can however lead to significant damage to soils if it has to proceed in unfavourable weather conditions, though the latest designs of harvester aim to minimise this. As the crop matures rapidly, delaying harvest until field conditions improve is not a practical option. B.b.20. Organic production, referred to earlier, is being used as an opportunity to learn about growing the crop without pesticides, particularly herbicides. Techniques such as increasing seed rate and sowing deeper in conjunction with finger weeders are proving successful in controlling weeds, though volunteer potatoes are a still a problem. Volunteer potatoes are a major contaminant in the harvested crop with no herbicides available. An alternative of widening the rotation to 10 years with the potato crop immediately after peas could provide an answer. B.b.21. The crop has minimal water use in growing as most groups do not use irrigation. B.b.22. Training of staff and members is important in relation to environmental issues and for co-operation between members. However, though POs can encourage good practice for the environment the responsibility is with the individual farmer in terms of cross compliance.
B.b.23. There is an awareness of the need to promote the environmental credentials of the crop such as carbon and nitrogen fixing. Carbon measurement is likely to feature in future plans as the crop is thought to have a low carbon footprint and this should be promoted. One of the major processors has successfully engaged its contracted growers in initiatives to audit and put in place energy plans, minimisation of carbon footprints, encourage biodiversity and tackle soil management and diffuse pollution. Generally vining peas have been in the vanguard on environmental and sustainability issues, with individual members taking responsibility and being encouraged to do so by both the PO and the customer. It is usual for crop sprays to be minimised, and fields will generally have margins left uncultivated to encourage habitats and wildlife, notably providing the ideal habitat for ground nesting birds such as lapwings, yellow wagtails and skylarks.

Page 32 of 134
Section 2.1.4: Situation report of the top fruit sector TREE FRUIT
UK Area (ha) 2006
of which Ha Production (‘000t)
UK Area (ha) 1996
of which Ha Production (‘000t)
Apples: Dessert
5,203 Cox 2,380 64,000 8,252 Cox 5,035 69,800
Early 543 7,600 Early 1,132 12,000
Middle 412 7,700 Middle 512 6,100
Late 1,868 50,000 Late 1,573 18,600
Apples: Culinary
3,827 Bramley 3,647 109,900 5,384 Bramley 5,094 115,000
Other 180 1,600 Other 290 3,400
Pears 1,580 Conference 1,290 24,600 2,739 Conference 2,010 30,000
Other 290 3,900 Other 729 5,900
Plum 950 Victoria 450 6,900 1,444 Victoria 716 8,800
Other 500 7,200 Other 728 10,900
Cherries 429 All vars. 420 1,100 592 All vars. 592 3,600
[Cider & Perry
6,530 3,896]

Page 33 of 134
1. Production Trends B.c.1. The tree fruit sector of horticulture has struggled during the last 10 years against strong competition from imports and downward pressure on prices. The competition has forced the sector to change significantly, in an effort to meet the challenges of consumer demand and market requirements. UK production is mainly centred in the south of England, although in Scotland there is a small top fruit sector of around 40ha. B.c.2. In this 10 year period, the industry has seen a major restructuring, resulting in fewer but larger producers, many with new, more intensive, labour efficient systems of production and new varieties in an effort to achieve higher and more consistent yields of quality fruit. B.c.3. The restructuring has resulted in the sector concentrating more on apples, particularly late dessert varieties, and a reduction in pears and plums, with a decline in the cherry area. As a result of these changes, the industry is now in a favourable situation to take advantage of the current market requirements for quality fruit with reduced food miles. A major advantage for the fruit grower is that the product is seen as very healthy, at a time when the nation is scrutinising the commonly consumed diet. B.c.4. The apple sector has made a significant move away from the mainstay variety Cox, which over the years has shown to be inconsistent in production, variable in quality and with a declining customer base. The trend away from reliance on Cox will continue, with few new plantings of that variety currently undertaken. The sector has embraced newer and consistently higher yielding varieties such as Gala, Braeburn, Jazz, Cameo and Kanzi, all of which have good storage capability, with Gala and Braeburn able to complement imported fruit of the same variety during the home season. B.c.5. Average yields of Cox have increased due to improved production methods and are now in the region of 20-25 tonnes/ha, but do not match those of varieties like Gala and Braeburn, which consistently yield 35-45 tonnes/ha. B.c.6. The production area of Bramley has declined, but yields have increased from 18-20 tonnes/ha to a more consistent 25-30 tonnes/ha, due to better growing techniques, helping to maintain production. In the last 2-3 years the Bramley area has increased in Northern Ireland where there has been a significant area for many years. The renewed interest is due to local juicing and cider manufacturers requiring additional supplies. The overall market remains sizeable for this unique culinary variety, being preferred by specialist outlets (e.g. by the baking and juicing industries) for its distinctive quality as a processing apple. However, the variety remains under pressure from imported alternatives which are available at a lower cost and used in volume products where price is all important. In the last 2-3 years, Bramley has benefited from a strong demand from the juicing market; Bramley is a preferred variety because of its high level of acidity.

Page 34 of 134
B.c.7. Pear production continues to decline due to the general poor profitability of the crop, not helped by the long establishment period before full cropping is achieved. Imported pears from the near continent sold during our home season are generally of a higher, more consistent quality than UK production in many years. Consistency is particularly important for the consumer who is reluctant to purchase fruit that does not look attractive. B.c.8. Plum production has declined as a result of poor returns in many years. There has been little change in varieties grown, allowing the industry to compete with imports. The main variety continues to be Victoria, which although giving good yields and liked by the consumer, has a limited, short season. B.c.9. Cherry production declined to an all time low in 2003/04. In the last 5 years the area has increased as growers move to intensive systems using new late season varieties on dwarf rootstocks, which yield more consistently. The quality of the new late varieties is superior to those previously grown and the industry now sees an opportunity to supply cherries to the market once imports start to decline in late May. In the next 3-4 years cherry production will start to increase as new plantings using the newer high quality and high yielding varieties become productive. B.c.10. In 2006 imports of apples and cherries reached a 10 year high in both volume and value. This supports the industry view that there are opportunities for supply during the UK‟s own season, provided that domestic products can compete on price and quality. B.c.11. Cider producers saw an oversupply situation in the 2000-2005 after several years of strong growth. The introduction of new products and intensive marketing coupled with good summers saw a revival of fortunes, though it appears that now (2008) demand has reached a plateau again. 2. Structure B.c.12. The industry had seen a decline in producer numbers, with many small and medium producers leaving due to low profitability and a reluctance of family members to continue in the business while existing growers near retirement. The decline in numbers has allowed other producers to either purchase or rent production area and expand their business. This enlargement of individual businesses has been encouraged by the main customers, the supermarkets, who prefer to deal with fewer but larger suppliers. In the mid 1990s there were 450-500 apple and pear growers, but this has reduced to approximately 200. B.c.13. Some small and medium producers continue in business, finding niche outlets through specialist wholesalers, farmers markets and farm shops. And with continued consumer interest in buying local produce, such businesses will continue to survive if efficient. Sales of fresh pressed apple

Page 35 of 134
juice have helped the fortunes of several small apple producers, providing a sale for fruit which would otherwise be rejected. B.c.14. Most top fruit growers are now within a PO, though there are one or two larger units which have decided not to take membership. Despite their PO membership, many growers prefer to grade and pack their own fruit, whilst offering a contract service to other growers. Within the apple and pear industry, the belief persists that a grower can handle and grade his own fruit better and more efficiently than central packhouses can. B.c.15. The move to larger production units is considered desirable and a major strength for the industry, giving more efficient use of equipment, labour and transport to both packers and market outlets. The larger units have the advantage that they are able to justify the administrative staff to undertake all the records that assurance schemes and buyers now require as part of due diligence requirements. B.c.16. The larger units are more able to reward their regular staff and provide a management structure. The seasonal labour has access to better facilities in the form of accommodation, available work and leisure activities. This is very important when most of the seasonal labour is now from overseas, as local labour is unobtainable for many orchard operations including harvesting. However, there are concerns that the availability of overseas labour is limited because of economic and political considerations. This poses a major threat to the industry, hence investment in efficient systems of production and mechanisation, wherever possible, remains important. B.c.17. The situation in Northern Ireland. The Northern Ireland apple growing sector produces apples worth around £5m per year, and represents 0.5% of total agricultural output. The value of the crop has increased over the past few years, although, the last NI Orchard Fruit Survey showed that in 2004 there were around 200 apple growers, down from around 270 in 1987. NI has currently one Apple Producer Organisation, consisting of 11 growers. The majority of apple growers are located in one county – County Armagh. Over 95% of apples produced are the culinary variety “Bramley Seedlings”.

Page 36 of 134
3. Markets and Supply Chain B.c.18. Over 75% of UK tree fruits are sold through supermarkets. The wholesale market is much less significant to the industry as a whole, though still a valuable outlet for some producers. B.c.19. The supermarkets have the ability to sell large volumes of product to a pre-determined plan. However, their dominant position does enable them to dictate the price structure; they are also able to change their requirements at short notice, leaving the supplier little option but to meet them or lose the business for the future. B.c.20. As a result of this situation, prices paid to growers have been static for many years, resulting in producers having to absorb significant cost rises, reducing profitability. The last few years have seen increased consumer interest in the issue of food miles, encouraging the supermarkets to see the advantage of buying home production and the need for it to be economically sustainable. As a result there has been a slight increase in prices, allowing increased investment. The industry hopes that such price increase can be maintained, allowing growers to compete more effectively on the market. Whilst closeness to market is seen as an advantage for UK producers, the fact that exporting countries often have better climates for production and can produce more volume could be considered a weakness for our industry. 4. Market Drivers B.c.21. Consumer requirements for quality produce at competitive prices for a wide range of tree fruits has resulted in the supermarkets being the main market driver for the tree fruit sector. Additionally, the multiples require the industry to demonstrate due diligence throughout the supply chain, by complying with stringent assurance schemes, which come at a significant cost. Whilst such assurance schemes are considered a major strength for the industry, there is a driver towards reducing duplication and stripping out unnecessary requirements. B.c.22. As mentioned, the tree fruit sector has benefited from consumer concern for food miles and interest in „local‟ production. This has helped the marketing process, together with a more planned marketing approach for UK tree fruits, encouraged by English Apples and Pears, together with the main marketing desks. However, many in the sector consider that there are still too many marketing desks, which allow the supermarket buyers to move between suppliers to help keep prices down, whilst maintaining a high mark up for the buyer. B.c.23. The consumer interest in organic produce has been of limited value to UK producers. The climate and established varieties have made it difficult to produce quality product to compete with imports. Therefore only a very small area of organic top fruit production is currently being undertaken.
Page 37 of 134
B.c.24. Consumer concern at pesticide residues in food has been very high (although there is some evidence that this has decreased), but it has promoted a strong move in the direction of producing fruit free of pesticide residues. Whilst allowing pesticides to be used for the range of important pest and diseases, the choice of pesticide and timing is managed so that at the point of sale the fruit will not have any pesticide residue. More development of the technique is required. B.c.25. This approach is compatible with the current practice of using integrated crop management measures (ICM), spraying only where essential and allowing natural predators to increase in orchards, thereby reducing the need for insecticides. There remains considerable scope for further development of ICM. B.c.26. The demand for quality at competitive prices is driving businesses to improve levels of staff training, both of permanent and seasonal labour, in an effort to improve efficiency and therefore profit margins. Efficient use of labour through improved management and growing systems is a major area of development for the industry, helping to improve competitiveness by containing costs. The use of technical services provided by spray companies and the individual PO groups is increasing, again to help improve efficiency and reduce production costs. B.c.27. Given the proximity to the market and the high quality of product now being produced by the industry, it is able to consider the future with some confidence. Although, there is the continued challenge of the level of prices being paid by the main retailers, the industry has the potential to capitalise on the opportunities that the new varieties and systems offer together with increasing efficiency of labour.
Page 38 of 134
5. Sector analysis - synopsis B.c.28. - Strengths:
Healthy attributes, convenient for consumers.
Production local to the market, low food miles.
High level of crop assurance and due diligence.
Market advantage with residue free product.
Focus on supply and service through training etc.
Direct supplies to farm shops, farmers markets and PYO.
Improved industry structure. B.c.29. - Weaknesses:
Largely reliant on supermarkets – price-takers.
Inflation of input costs, e.g. fuel.
Seasonal outcome still climate-dependant.
Competition from well-organised imports.
Long term crops.
Difficult to predict market and consumer behaviour.
Availability of future labour supply uncertain. 6. Environmental Impacts B.c.30. Much of the UK fruit production is of relatively low environmental impact. Integrated pest and disease control, the use of grass in the orchards to reduce soil erosion, band application of fertilisers to meet crop needs and the encouragement of bio-diversity around orchards in the windbreaks and hedges are all measures which take into account the needs of the environment. B.c.31. Reference has been made to the modification of spray programmes to reduce crop residues. Increasingly, pesticides are applied only when problems reach a threshold and many of those now available are, to a great extent, much more specific for controlling their target. An increasing number of sprays used are derived from natural products, having very low toxicity levels or residues. Post-harvest treatments are usually only applied on the basis of a risk-assessment. B.c.32. Whilst new orchards are now fitted with irrigation, much of the water is from “on farm sources”, stored in reservoirs from winter rain, utilising water which would otherwise be discharged through streams and rivers to the sea. Reservoirs provide an environment for wildlife and, in some cases, leisure facilities in the form of fishing giving additional farm income.

Page 39 of 134
B.c.33. Most orchards use mulches to help conserve moisture, particularly for young trees to aid establishment and also to help reduce the amount of irrigation required. The mulch, which is often straw, or increasingly composted green waste, help to reduce soil erosion. B.c.34. Increasingly fruit farms are planting native trees in small areas around farms, installing bird boxes and undertaking other measures, all aimed at enhancing bio-diversity on the farm. B.c.35. The use of mow and spray orchard systems is helping to reduce fuel usage, and the trend to larger production units helps to improve efficiency of transportation of fruit to the various markets. Larger units are able to supply larger quantities of fruit to a single buyer requiring less transport movements. B.c.36. Fruit has been stored in facilities of variable age and performance. Modern storage facilities reduce energy requirements from improved insulation, and investment has been proceeding to upgrade or replace many of the older stores and there is scope for this to continue to maintain as high a proportion of fruit as possible in optimum condition.

Page 40 of 134
Section 2.1.5: Situation report of the soft fruit sector. SOFT FRUIT
UK Area (ha) 2006
of which Ha Production (‘000t)
UK Area (ha) 1996
of which Ha Production (‘000t)
Soft fruit
9,323 Strawberries 4,465 73,900 10,437 Strawberries 4,495 40,100
Raspberries 1,466 12,200 Raspberries 2,669 13,200
Blackcurrants 2,596 15,600 Blackcurrants 2,380 22,100
Others 795 6,000 Others 894 8,100
G‟house 52 138

Page 41 of 134
1. Production Trends B.d.1. The soft fruit sector has developed during the last decade with a significant restructuring of the industry. For the most part, it has seen a period of prosperity against a background of rising demand for its products, although rising costs and concerns about seasonal labour availability have clouded the picture more recently. B.d.2. To meet the market‟s requirement for continuity and high quality fruit, the industry has moved from mostly open field production to the current situation where 80% of strawberry, raspberry and other cane fruit cropping is carried out under temporary polythene covers. This development has improved quality, yields and efficiency of harvesting. B.d.3. Yields of strawberries have increased from 8-10 tonnes/ha to 15-20 tonnes/ha, and raspberries from 4-6 tonnes/ha to 8-10 tonnes/ha. These improvements are in no small part due to the use of temporary polythene covers, together with new varieties and production systems. B.d.4. The strawberry crop is now grown more intensively from better quality plant material, using an increased proportion of „everbearer‟ varieties, which are higher yielding. Everbearers have the advantage that they crop over a longer period and in most years produce a higher total yield than June-cropping varieties - such as Elsanta, which has been the industry mainstay for a long period. Elsanta remains the main variety grown for early and mainseason production, though everbearers now account for over 55% of the total cropped area and will increase further. The season has been further extended by development of production in glasshouses. B.d.5. Raspberries have increased in importance and in the quantity available to the market. Although this is not immediately apparent from the crop area, yields have increased dramatically and the bulk of the production is now to high- value supermarket outlets, which is reflected in the total value of production, having increased from a farmgate value of £37.5m in 1996 to over £70m in 2006. B.d.6. There has also been a major change in the supply period for this fruit, with an increased proportion now produced in the late summer and autumn, complementing imports which are dominant early in the year. B.d.7. Blackcurrants continue to be grown almost entirely for processing into juice, which accounts for 98% of production. Cropping is concentrated in fewer large economic units which can offer continuity of supply through the harvesting season with a range of varieties, and consistent cropping from year to year. Over the last decade yields have also increased, though this is not obvious from the introductory data, as 1996 was an exceptionally high yielding year.

Page 42 of 134
B.d.8. The home market for soft fruit has continued to grow significantly in size, mostly as a result of promotion by the industry itself and by the multiples and a responsive consumer. In addition to home production, imports of strawberries reached a 10 year high in 2006 at 47,000 tonnes, with other soft fruits at an 8 year high at 19,100 tonnes. In terms of value, this represented £92.3m for strawberries and £101.8m for other soft fruit. B.d.9. The market is now showing increased interest in other soft fruits such as blackberries, blueberries and, to a lesser extent, red currants and goose-berries. – to which growers are endeavouring to respond. With the exception of gooseberries, the other crops will also be cropped under polythene to maintain quality and continuity of supply. Such crops have always been of interest to growers supplying direct sales outlets such as farm shops, farmers markets, pick your own and wholesale markets, but supermarkets are increasingly interested, with a view to extending the range of fruits available. 2. Structure B.d.10. As is the case in many sectors of horticulture, the number of producers has declined significantly over the last decade, with the average size of production unit increasing. The move to larger production units has been stimulated by the need to provide continuity and economies of scale against a backdrop of downward price pressure from the multiples, though the interface between production and buyer has normally been the marketing company or PO. Raspberry prices to supermarkets have fallen over the decade, though the volume sold has increased greatly, with further increases possible. B.d.11. Increasingly, small soft fruit producers are directed towards PYO, farm shops, farmers markets and specialist wholesalers, where margins are often very good, though the volume of product sold is modest. B.d.12. The production of soft fruit is now more dispersed, rather than simply concentrated in South-east England. Significant areas of production elsewhere in the southern counties of England, in East Anglia, the West Midlands and in Scotland offer a range of climatic conditions, helping to spread the harvest period for all crops. This spread of harvest and risk is important for the market, where continuity of supply is all important. B.d.13. The majority of producers are now within a PO (with a few large exceptions) encouraged in particular by the support available for the purchase of polythene tunnels and environmental improvements. The availability of funds and the wide scale use of polythene tunnels has safeguarded the soft fruit industry, which otherwise would have been swamped by quality imports during the home season. B.d.14. The number of POs operating in the sector is sometimes questioned, but there is a level of mistrust between the groups and concern

Page 43 of 134
about the levels of efficacy and charges. They compete in a number of ways, including making business alliances and trading agreements which enable them to offer exclusive soft fruit varieties to the supermarkets. B.d.15. Larger units are considered desirable and a major strength for the industry, giving more efficient use of equipment, labour and transport to both packers and market outlets. The requirement to ensure compliance with the increasing amount of legislation impacting on horticultural businesses, and adherence to the requirements of assurance schemes are easier to incorporate on larger holdings, which can justify employing additional staff for these tasks. B.d.16. In addition, as described for top fruit, larger units can provide a career structure for permanent staff and reward then accordingly. Seasonal labour, usually from overseas, and for which farms have increasingly to compete with other industries, has access to better accommodation and other facilities on large-scale farms. In recent years, sufficient seasonal labour has been available from both Eastern Europe and elsewhere through the Seasonal Agriculture Workers Scheme (SAWS). However, in 2007 and 2008 shortages have been reported, linked to falls in Eastern European workers coming to the UK, and due to competition from other industries. There are concerns that the supply of seasonal labour is limited with many growers expressing difficulties in acquiring sufficient staff. A problem that has been exacerbated by a cut in the size of the SAWS quota and its closure to all but Romanian and Bulgarian workers. For the foreseeable future, a continued supply of seasonal labour is essential; shortages would affect the ability of the industry to realise its full potential in the market and for individual producers could potentially act as a break on expansion. The industry is taking steps to increase the efficiency of pickers and the harvesting system with the mechanisation of some aspects of harvest and handling likely to be a necessary part of a strategy to mitigate possible labour shortages. Local workers are not available in anything like the quantity or quality needed to undertake these tasks within today‟s soft fruit sector. B.d.17. Scottish soft fruit. The main types of berries grown in Scotland are strawberries, raspberries and blackcurrants. In 2007 the total land area on which berries were grown was 1,787 hectares (0.03% of the total agricultural land area in Scotland), with strawberries accounting for 45% of the total soft fruit area and raspberries 27%. B.d.18. The volume of production of berries in Scotland has fluctuated since the 1980s. In the mid-1980s, production stood at around 20,000 tonnes, falling back to around 10,000 tonnes in the 1990s and returning to its 1980 levels in the last 3 years with production standing at 21,518 tonnes in 2007. The volume of raspberry production has declined by 77% since 1984 whereas the volume of strawberry production has increased by 61% over the same period. B.d.19. The value of berry production has been on the increase over the last 10 years from around £18.1 million in 1997 to £48 million in 2007. The

Page 44 of 134
increase has been driven by a combination of factors including higher yields and prices for raspberries and higher production of strawberries. The soft fruit sector accounts for around 2.2% of the total value of agricultural produce in Scotland. 3. Markets and Supply Chain B.d.20. The soft fruit industry is now dominated by supply to the supermarkets, with over 70% - perhaps nearer to 80% - of production sold through them. Wholesale markets still have their adherents; overall they are of relatively little significance to the industry, though they can act as a safety valve for supplies diverted from other outlets. Strawberries and raspberries, together with other soft fruit, remain popular crops for PYO and Farm shops, accounting for perhaps up to 5% of the market. B.d.21. PYO enterprises have seen something of a renaissance after a number of years in the doldrums, though individual purchases are rarely on the scale that they used to be when some farms were a new phenomenon. The supermarkets have increasingly dominated the sale of soft fruit during the last decade, at the expense of sales through the wholesale market and PYO. B.d.22. The multiple retailers offer the opportunity to sell large volumes of product through an extended season in a planned way and there is little doubt that their promotion of soft fruit (together with the industry‟s) has helped expand the market significantly. However, they apply a consistent downward pressure on prices and their plans can change at short notice (e.g. delisting of accepted varieties), which can have difficult consequences for producers. B.d.23. The supermarkets have made all types of soft fruit available throughout the year at very affordable prices. Moreover, UK consumers remain loyal to home produced strawberries (in particular) and their closeness to the market give UK producers an advantage during the home season, a major factor in the increased volumes of UK soft fruit that have been sold over the past 10 years or so. B.d.24. The market for processing has declined almost totally, except for a few high quality jam makers and independent freezers, who require quality home produced fruit, and GlaxoSmithKline who buy all their blackcurrants from the UK for their fruit drink Ribena. Fruit for the large jam manufacturers is all obtained from imported sources, as UK producers can no longer compete on price. 4. Market Drivers B.d.25. As with other fresh produce sectors, the multiples are the main drivers for the soft fruit market because of their market share. Their ability to offer a combination of quality and price attractive to large numbers of consumers has resulted in their importance in the sector, which they have

Page 45 of 134
used to define prices paid to suppliers, crop specifications and conditions of supply. B.d.26. The supermarkets identified an opportunity to promote and supply strawberries and now other soft fruits throughout the year for the majority of their customers. UK growers have responded by working to order production to gain as much of the home season as possible. B.d.27. The industry has capitalised on its advantage of closeness to the market and ability to offer very fresh produce with high levels of service. However, at times, multiples and category managers can regulate use of home production, to meet immediate needs, with commitments to imported product placed first. B.d.28. Accreditation schemes, such as Assured Produce, coupled with each supermarket chain‟s individual requirements, have become a requirement for all those businesses wishing to supply those outlets. B.d.29. Businesses have to demonstrate due diligence in their practices and traceability for all products supplied, so that any queries raised along the supply chain can be immediately traced to a specific crop with a known history. Whilst such assurance schemes have helped the industry claim a marketing edge, the associated costs are significant and some of the detailed requirements are being questioned. B.d.30. The industry is now emphasising the advantages of being close to the market in an attempt to capitalise on the food miles argument and to gain publicity for the product being fresh and healthy. Scientific evidence has now shown that blueberries and blackberries have significant health benefits and labelling is designed to highlight this fact. Strawberries and raspberries have also been shown to have health benefits when eaten regularly. B.d.31. Rising costs of production associated with the use of tunnels, irrigation systems, increased density plantings and other inputs is motivating the search for improved varieties and systems which together can produce higher yields still. The need for higher yields has also been driven by increasing labour costs and the increasing difficulty of obtaining labour. The rising cost base is forcing growers to reduce unit costs by improving efficiency, e.g. the use of harvesting rigs and picking techniques to help pickers increase harvested volumes with less strain. B.d.32. The need for reduced unit costs and a longer season is encouraging the move to everbearer varieties which crop over a longer season. The quantity of fruit to be harvested in a single pass is therefore less, reducing spot labour peaks, with labour needed over a longer period. B.d.33. The consumer‟s interest in organic produce has motivated some growers to move into organic production. Defra figures (Jan 2007) give the proportion of fruit in conversion or fully organic as 5.5% of the total fruit area grown (data not split between top and soft, but with the majority soft fruit). To

Page 46 of 134
date, those growers involved have not found the venture profitable or the demand consistent. The additional costs of producing to organic standards have indicated that the returns are only 50-80% of those achieved by conventional crops, when reduced yields, increased losses from pest and disease and the delay in reaching organic status is taken into account. There is a significant added investment risk which the return does not at present justify on economic grounds. B.d.34. However, as with top fruit, the industry is now moving towards producing pesticide residue-free products through the careful selection of chemicals and harvest intervals to help reduce consumer concerns. For the producer, this option is much more viable, particularly for crops grown under protection which require a much reduced pesticide regime, together with the use of natural predators and naturally derived agents for controlling specific pests and diseases. B.d.35. The drive to reduce costs and changes to the requirements for local authority planning permission is encouraging the use of container-grown crops, reducing the risk of soil pest and disease problems and the need to sterilise land for crops. These are likely to be increasingly sited on a permanent basis, rather than rotated round the farm, as with field-grown crops. Though such systems require full irrigation, improving technology is starting to reduce the quantities of water wasted, with the feeding system supplying close to what the crop requires. B.d.36. The use of technical services provided by agrochemical companies and by in-house and external consultants is increasing, again to help improve efficiency and reduce production costs. 5. Sector analysis: synopsis B.d.37. - Strengths
Popular products, in demand, with significant health benefits.
Local to the home market.
Prime candidates for local supply and direct sales.
Close relationship with multiples, able to respond quickly to market changes.
Products have a high level of assurance.
Scope for further increases in production and harvest efficiency – willingness to adopt new technology.
Short supply chain with limited number of Producer Organisations
Investment in new varieties. B.d.38. - Weaknesses
A seasonal business not able to supply all year round.

Page 47 of 134
Large seasonal labour requirement for harvesting; future supply uncertain.
Most products have a short shelf life.
Cost inflation of inputs against background of downward pressure on product prices.
Loss of crop protection products.
Lack of sufficient marketing of health benefits. 6. Environmental Impact B.d.39. To help reduce the environmental impact of soft fruit production, more farms are moving away from production in the soil to reduce the need for soil sterilisation, particularly in the South-east. [Although, this sometimes involves the use of peat bags – which has its own environmental concerns]. An increased proportion of the production of both strawberries and raspberries is being undertaken in substrate, using trickle irrigation and fertigation to provide the crops nutrient requirements. Modern systems are able to closely match the supply to the crop requirements, thereby reducing waste and excessive leaching of nutrients. Such systems can be undertaken on the same site year after year, helping to reduce costs and environmental impact. B.d.40. The use of polythene tunnels has facilitated a reduction in the amount of sprays applied, particularly for disease control, and spraying for pests is only undertaken when a threshold is reached. An increasing number of sprays used are derived from natural products with very low toxicity levels and minimal residual effects. B.d.41. Adequate water supplies are an essential requirement for crops grown under temporary covers and although they may be drawn from a number of sources, volumes can be marginal at times of shortage e.g. when river, borehole or mains supplies can be restricted. The industry, at least in part, has taken steps to reduce its reliance on these sources and some reservoirs have been installed, relying on winter rainfall to charge. Although timing of investment in water storage needs to be carefully considered, the need for security of supply will dictate that more fruit farms become equipped in this way. Reservoirs also provide scope for wildlife habitats and an increase in biodiversity. B.d.42. Increasingly, mulches used over beds to help suppress weeds and conserve moisture are of woven construction, allowing rain water to pass through and into the soil, helping to reduce erosion. Polythene mulches tend to direct rain water between the beds, increasing the risk of soil erosion. Straw applied between the beds during the summer does help prevent erosion and ultimately the structure of the soil. Whilst polythene covers are in place over tunnel hoops, high rainfall can cause soil erosion as water is channelled between structures. Various guttering systems to collect water (and ideally recycle it) are available, but to date their cost has been high.

Page 48 of 134
B.d.43. Increasingly fruit farms are planting up native small areas around farms with trees and encouraging hedges etc., all aimed at enhancing the bio-diversity in the countryside. Such plantings are recognised as having the potential to encourage natural pest predators, helping to reduce the need for spraying and encouraging bees for crop pollination. B.d.44. Short-term storage facilities are essential for today‟s soft fruit unit, enabling harvesting to continue through the week whilst demand fluctuates and for fruit to be supplied to customers in quantity for the end of the week, when demand is greatest. Modern storage facilities have reduced energy requirements from improved insulation specifications and many of the older stores are now being upgraded with improved insulation being specified to save energy. To maintain fruit quality in the face of increasing episodes of high temperatures, there may a need for more investment in field-based cooling units to hold fruit after picking, before it is transferred to the packhouse.

Page 49 of 134
Sector 2.1.6. Situation report of the protected edible crops. PROTECTED EDIBLE CROPS
UK Area (ha) 2006 of which Ha Production (‘000t)
UK Area (ha) 1996
of which Ha Production (‘000t)
Protected
Edibles
703 Tomatoes 204 84.1 1,554 Tomatoes 340 115.5
Cucumbers 113 56.5 Cucumbers 190 85.6
Lettuce 250 8.2 Lettuce 723 26.5
Mushrooms - 68.0 Mushrooms - 106.6
Sw Peppers 62 16.0 Sw Peppers
49 5.9
Others 74 18.2 Others 251 19.1

Page 50 of 134
1. Production Trends B.e.1. The protected edibles sector has faced high production costs and significant levels of overseas competition for many years. These factors, coupled with the concentration of UK purchasing power into the hands of a few, have driven a high level of technical innovation, which has produced, for the most part, nurseries specialising in long-season mono-cropping. Inevitably, there has been a marked decline in the cropped area, as those businesses lacking the capital, the market outlets or the necessary management skills have stopped production. B.e.2. The protected area cropped with edibles declined by some 55% between 1996 and 2006. The most marked reductions have been in lettuce (-65%) and „other crops‟ (includes celery) etc., (-70%); the areas of cucumber and tomato production have each fallen by 40% in that period (33% for heated tomatoes). By contrast, the area devoted to sweet pepper production has risen by 25%. B.e.3. In production terms, crops requiring relatively unsophisticated production facilities have declined in proportion to the fall in area, e.g. soil-grown lettuce and many of the smaller area crops, such as celery, courgettes and beans. Many of these businesses switched to the production of ornamental plants, such as bedding. Where it has been possible to introduce new technology to counteract increasing competition and the pressure to reduce costs, production has declined less steeply than the drop in area might suggest. For example, tomato production has declined by only 27% overall, and this despite a major swing to towards lower-yielding varieties (the virtual cessation of coldhouse tomato growing has been a contributory factor); cucumber production has declined by 34%, as increased replanting has kept crops more productive for longer, as well as improving fruit quality. Production of sweet peppers has increased dramatically over the 10-year period 1996-2006; in addition to the larger area, production is now based almost exclusively on long-season mono-cropping, in contrast to the shorter summer cropping previously practised. B.e.4. The few new crops that have been introduced occupy market niches. Examples include chilli peppers, oriental vegetables, the so-called „living lettuce‟ and herbs. The market for herbs is split between soil and pot-grown crops. Both have expanded significantly in response to consumer demand; pot-grown production is limited to a small number of enterprises due not least to the high levels of investment required for their production. B.e.5. The UK market for the major glasshouse grown food crops has increased significantly in the last 10 years or so, with increases in consumption (by weight) of 30% for tomatoes, nearly 40% for cucumbers and over 120% for sweet peppers. Increasing affluence and stable product prices, the continued move from processed to fresh produce and, latterly, the health benefits associated with fresh fruit and vegetable consumption have all played a part.

Page 51 of 134
B.e.6. The UK market share for tomatoes and cucumbers has shrunk against a backdrop of the decline in production and increased imports, the vast majority of which are from other EU member states. Based on 2006 figures, UK tomatoes now supply some 16% of the home market (but 36% during the peak production period of May to September), around 30% of the cucumber market and (an increase) 12% of the sweet pepper market. For all these crops imports now continue at a relatively high level through the year, rather than being primarily confined to the winter months and „shoulders‟ of the UK season, as was historically more the case. 2. Structure B.e.7. The relative importance of the major supermarket chains, dealing with the retailing of close to 80% of fresh produce, has required a concentration of supply to fulfil their needs. This has, as with other sectors of horticulture, been a major factor in the restructuring of production towards fewer larger units, with a reduced number of small and family-sized enterprises. Although some of the latter may have a role in supplying local markets, they can rarely achieve the scale of production or economies of scale needed to supply the multiples. Supermarkets require continuity of supply over a long season and this demands high levels of capital investment in the facilities necessary to produce crops over this period. B.e.8. On paper, there are still significant numbers of producers of the main protected salad crops – in England and Wales over 500 holdings growing tomatoes, nearly 300 producing lettuce and cucumbers, and just under 200 growing peppers (2004 Defra data, measured as numbers of holdings). In reality there are fewer businesses of commercial significance, e.g. in the tomatoes sector there are only 20 producers with a gross output of more than £1m, with these producers covering over 90% of the production area (source British Tomato Growers Association - Members 2008). B.e.9. The protected crops sector is geographically spread although, with a very limited number of exceptions, large-scale units are confined to England. B.e.10. About 40% of tomato production may be found in the South-east and Southern counties, positioned for good light interception, with other concentrations in Yorkshire and Humberside, the North-west and Eastern counties. There is a large production unit in South Wales. B.e.11. Cucumber production is split almost evenly between Yorkshire and Humberside and the Lea valley (Essex/Hertfordshire), with relatively little production elsewhere. (Figures from the Cucumber Growers Association state that a total of 368,456 sq metres are grown in the North East and some 210,560 sq metres are grown in the Lea Valley, with 40,200 sq metres being grown elsewhere in the country). Half of the sweet pepper crops nationally are grown in large units on the South coast, with a further 30% in the Lea

Page 52 of 134
valley. Lettuce production is more diverse, with about one-third of the cropped area in the North-west and 25% each in Yorks. & Humberside and Eastern counties. B.e.12. Distribution of Protected Crops – England, by Government Office area (2004) Tomatoes Cucumbers
Sweet Peppers Lettuce (protected)
0 100000 200000 300000 400000 500000 600000
North East
Yorks & Humber
East Mids
Eastern
South East
South West
West Mids
North West
London
Sq metres
0 200000 400000 600000 800000 1000000
North East
Yorks & Humber
East Mids
Eastern
South East
South West
West Mids
North West
London
Sq metres
0 200000 400000 600000 800000 1000000
North East
Yorks & Humber
East Mids
Eastern
South East
South West
West Mids
North West
London
Sq metres
0 50000 100000 150000 200000 250000
North East
Yorks & Humber
East Mids
Eastern
South East
South West
West Mids
North West
London
Sq Metres

3. Markets & supply chains B.e.13. The bulk of UK protected salads are grown for the multiple retailers, with some estimates putting the proportion of product supplied to this segment of the market as high as 90% of production. Wholesale markets, for onward supply to small chain and independent retailers and market traders, remain the principal outlet for only some of the more traditional or smaller-sized nurseries, and are used by larger businesses to help balance supply and demand from the multiples. Direct sales are very small in volume terms for these crops. Although there is increased interest in „local‟ production, protected salads are not generally big sellers through farm shops and farmers markets – more significant is the rebranding of crops sold through the multiples to emphasise provenance. B.e.14. Recent years have seen the market for tomatoes revolutionised. A crop that was available a few years ago just as a standard round or cherry tomato has seen an explosion of varietal types and forms of presentation. This has resulted in technical and logistical challenges for the industry, but has also offered the opportunity of a move away from commodity products. About 7% (Source: TGA) of the crop is currently produced to organic standards, and while there is scope for this to increase, it does not currently appear to be a high priority for the UK crop, possibly because of the producers‟ track record in reducing pesticide use on the crop (see market drivers). B.e.15. Various attempts have been made to diversify from standard cucumber / half cucumber production, but these have been largely thwarted to date by the lower yields or higher labour requirements for alternative types, which have not been reflected in the returns received. However, this situation may change given the sophisticated consumer market the crop is being sold into. B.e.16. Whilst most producers for these two crops aim to market their produce over the spring/summer/autumn, adjusting their cropping programmes in the light of factors such as fuel prices, crop condition and market demand, a small number of enterprises have moved, by the addition of supplementary lighting, to all year round or near-all year round production of tomatoes and cucumbers. In terms of economic sustainability it is early days, but the techniques are most suited to those businesses with access to energy sources at advantageous prices and with glass of adequate specification, particularly height. B.e.17. Mention has been made of the extended season over which sweet peppers are now grown and the UK has grown its market share as a consequence. Market segmentation is well-established with various fruit colours, and with „traffic light‟ and value packs providing outlets for the majority of the fruit grown.

Page 54 of 134
54
B.e.18. For the other important protected crop, lettuce, production is now in the hands of specialist producers. With some exceptions all year round cropping is less practised than a few years ago as growers have found it difficult to compete with outdoor supplies. However, growers are responding to the demand for a variety of lettuce types by moving away from the traditional butterhead types to frilly-leaved varieties, Little Gem etc. Opportunities for growing business are likely to be constrained by the availability of imported outdoor lettuce and the development of bagged salads as a market segment. B.e.19. The bulk of the crop is still grown in soil, with production from soilless systems limited. Although these offer some advantages, for example better nutritional control and a move away from the use of soil sterilants, their high cost is a major impediment to further uptake. B.e.20. Overall, the protected crop segment is supplied by a combination of POs and a number of large independent producers. Throughput figures from POs with operational programmes are no longer collected. At one stage rather more than half of the UK tomato supplies were marketed through POs, though recent changes have meant that this figure is likely to have dropped. It is thought that the proportion of cucumbers and peppers marketed through POs is now under 50%. B.e.21. The development in the South-East of a major new glasshouse enterprise supplying salad crops may have an influence on the home market for these crops in the UK in the near future. 4. Market drivers B.e.22. As with other fresh produce segments in UK horticulture, the high proportion of product supplied through the major multiple chains means that they have a significant, indeed the dominant, influence on the development of the market for each crop, its size, the methods of production and to a degree the conduct of the producer‟s businesses. Producers in turn work with supermarket buyers and technologists to meet product specifications, introduce new products and deliver quality and value as they compete to retain their position as suppliers. B.e.23. This influence on the protected crops sector includes:
Pressures to offer improved value through cost reduction
Reduction of the supplier base through rationalisation and the introduction of category management
Pressure to reduce pesticide residues
Need to provide full traceability for products and comply with requirements of accreditation schemes

Page 55 of 134
55
B.e.24. Energy costs are a major factor governing the producer‟s profitability, and hence potential to re-invest for the future. The last two years have seen widely varying supply prices, particularly of gas, with oil prices continuing to climb, which has made strategic planning difficult. A more stable outlook would be highly desirable. The industry has made significant strides in reducing its fuel use and improving fuel use efficiency in recent years through investment in replacement boilers, permanent thermal screens, temporary insulation and more sophisticated temperature regimes delivered by climate control computers. This area however is likely to offer continuing scope for improvement. B.e.25. Part of the solution to increasing energy costs is likely to lie with alternative energy sources, where available. Some nurseries have been established based on access to waste heat from adjoining industrial sites, which offer useful synergies. Starting from scratch in this way does offer the opportunity to invest in the best production facilities, though the capital demands are considerable – and suitable sites have to be found. A proportion of the sector uses CHP for heating, CO2 and electricity production, though purely in economic terms the worthwhileness of this has been something of a roller-coaster ride to date. Heating with biomass is a future option which is likely to find a role on some sites, despite the high initial cost. B.e.26. There is unlikely to be a „one size fits all‟ solution to energy provision, but all producers and POs will be seeking where possible stable energy costs and flexible means of providing it for their business. B.e.27. The availability of a suitable workforce remains an important consideration in the sector. Eastern European labour has been a valuable resource and its continued availability is important for many nurseries. Some businesses are under pressure, particularly in the south, as workers are attracted to other, higher-paying industries. For this reason, there is likely to be a continued incentive to invest in machinery and systems which reduce labour requirements on nurseries and in packhouses. 5. Sector analysis: synopsis B.e.28. - Strengths
Improved energy usage achieved and further improvements possible.
Close relationship with major customers – easier to react quickly to changes in demand.
Close to markets - fresh produce and ability to meet demand for „local‟ production and help address Food Miles issue.
Minimal pesticide use in some crops and reducing on others.
Extensive use of accreditation schemes.
Market size increasing; interest in healthy eating and premium products.

Page 56 of 134
56
B.e.29 - Weaknesses
Shortage of new products in some crops (e.g. lettuce, cucumbers) to meet competition.
Energy costs very significant for some crops and subject to large fluctuations.
Future labour availability uncertain.
Major customers looking to reduce costs.
Continued pressure on margins affecting ability to re-invest.
Capital intensive.
Uncertainty over future water availability – especially if competing demands.
6. Environmental impacts B.e.30. The most evident environmental impact in the sector is the use of energy. In addition to its use for heating, this covers lighting, pumps etc. To mitigate costs and to qualify for the rebate from the Climate Change Levy / Climate Change Agreement, growers have been seeking to reduce their energy use (as described above) and improve the effectiveness of the fuel that they use. B.e.31. Across all crops in the sector, growers are seeking to reduce the amount of pesticide use. Although the number of available pesticides is reducing, the main drivers have been the desire to adopt Integrated Pest Management (IPM), to help differentiate UK producers from other suppliers to the market and to meet consumer‟s expressed preference. B.e.32. The introduction of accreditation schemes, such as Assured Produce, is also having an impact on use of pesticides. The degree of challenge posed in reducing agrochemical use varies between crops; it is likely that the future will also see new pest and disease threats arising which will need appropriate (biological or other) counter-measures. B.e.33. The protected crops sector is a significant user of water. Most long-season crops are grown in systems such as rockwool, isolated from the soil. Water supply and irrigation systems are generally viewed as efficient, though there is a degree of over-watering to allow for imperfections in the circulation of the nutrient solutions. Recirculation of water and nutrients is practised by some and there may be opportunities for further investment by the industry in recycling and purification systems to limit water and fertilizer discharges from the nursery, with their potential for pollution. Water collection from, for example, glasshouse roofs is becoming more widespread and has the potential to contribute significantly to a nursery‟s water requirement. Additional water storage facilities may be necessary to facilitate this.

Page 57 of 134
57
Section 2.1.7 – Situation report of the mushroom sector MUSHROOMS
2006 1996
Mushrooms
Home production „000 tonnes 68 107
Imports „000 tonnes 105 51
Farmgate Value of Home Prod. Mktd £/tonne
1465 1608
1. Production Trends B.f.1. The bald statistics starkly illustrate the dramatic decline in production during the last ten years. Estimates indicate that there was a further slight decline in 2007. However, although losses have been most dramatic in the last decade, the decline of mushroom production has been taking place for longer. The use of combined statistics for Northern Ireland and Great Britain mask the fact that the production losses in GB have been proportionately far greater. B.f.2. The NI industry has many similarities to that in Ireland. Here the main trends have been a reduction in farm number, an increase in farm size and a continuing process of modernisation. 2. Current GB Structure B.f.3. Situation in Northern Ireland. Northern Ireland currently has two Mushroom Producer Organisations. B.f.4. The structure of the mushroom industry in Northern Ireland (NI) has changed in recent years with the grower numbers falling from around 360 five years ago to approximately 60 growers currently. The total production however has not declined accordingly as it has been mainly the smaller growers who have ceased production with the medium growers expanding their scale of production. Of the remaining 60 growers, more than 50% now have more than 5 mushroom houses and most if not all of these growers are members of a PO either in NI or Ireland, although one is a member of a PO based in England. B.f.5. It is estimated that around 25% of NI growers have already invested in Dutch shelving, although a shortage of Phase III compost on the island of Ireland has meant that the advantage of using Dutch shelving has not been fully realised.

Page 58 of 134
58
B.f.6. NI mushroom growers export a high percentage of their produce to the GB market. Increasing competition from mushroom growers in Holland and Polish industries has grown in recent years and pushed down mushroom prices, though the NI industry has reported a reverse of this trend in 2008 with a marked price increase for good quality mushrooms. B.f.7. Situation in Great Britain. In contrast to the situation in NI, farms in GB that have closed have not, on the whole, been balanced with expansion elsewhere, nor have many of the remaining businesses invested in modern production facilities. Production losses have been experienced in large, medium and small farms alike. From a level of several hundred growers in the 1980s, the number of producers has fallen to less than 20 significant units and a similar number of smaller units. The majority of the industry is now included in Producer Organisations. 3. Markets and Supply Chain B.f.8. The market for mushrooms in Europe has been over supplied for many years. The main factor that has established this situation has been the large expansion of facilities in Poland. B.f.9. Using modern Dutch technology and employing low cost labour, the increasing flow of high quality, low cost mushrooms sent westwards has intensified competition in Western Europe. The incursion of Dutch produce into Britain has until now been possible due to their greater production efficiency. B.f.10. For the most part multiple retailers are supplied with the bulk of the crop from the larger businesses. Smaller units have more local and diverse markets, including wholesale markets and local shops and market traders. 4. Marker drivers B.f.11. Multiple retailers have exploited the general oversupply situation and returns to producers have fallen steadily over the last ten years, although there are some signs that this trend has begun to reverse. While the Dutch industry has successfully won a significant proportion of the GB market, if has suffered similar problems of sustainability and decline due to the huge increase in low cost production in Poland. B.f.12. Mushrooms are a generic commodity varying in maturity and size, packaging and colour. B.f.13. The industry in Britain at the moment is not in a position to exploit this demand. B.f.14. Exchange rate. The viability of mushroom production in the UK is largely a function of its competitive position vis a vis Holland, Poland and Ireland. All production centres now operate on very similar systems and with

Page 59 of 134
59
comparable labour costs. Given the commodity nature of the product, the current competitive position relates down to the exchange rate. Up to August 2007, UK production was largely uncompetitive with imports. Since then the position has changed and now imports are “technically” more expensive. Unfortunately, UK producers are currently not in a good position to take much advantage of this because all are producing at full capacity and cautious about investing in new facilities given the economics of UK and the approach of UK supermarket customers B.f.15. Lack of compost capacity. As the UK mushroom industry contracted in the face of dire economic circumstances, a commensurate contraction of the composting industry occurred at the same time. Today, production matches demand. So even if there was an appetite for UK growers to expand, their ambition would be constrained by the appetite of the composting industry to expand B.f.16. Availability of labour. In recent years, UK labour shortages for the unpopular task of mushroom picking has been filled by a major influx of East European labour from the accession states of the EU. As these states have evolved and developed there has been a reduction in such labour inflows and indeed many who came to the country have started to return to their homeland. The UK mushroom industry will find labour availability, cost and efficiency a renewed challenge for the future B.f.17. Ageing directorate of industry. As with so many horticultural and agricultural businesses, the evolution of the UK mushroom industry has been a function of the drive of the founders. Many of these are now reaching retirement age. Because of the various pressures associated with mushroom farming and its “treadmill” nature of continuous all year round production, the next generation of growers is less enthusiastic about carrying on their family business. This could be a key influence in forming the nature and structure of the UK mushroom industry B.f.18. Price pressure. Mushrooms are referred to as a Known Value Item by supermarkets and as such represent one of a limited number of lines which are used to compare one supermarket‟s competitiveness with another. As long as this remains the case and as long as the product cannot be differentiated in any material way, mushrooms prices to suppliers will always be subject to close scrutiny and pressure

Page 60 of 134
60
5. Sector analysis: synopsis B.f.19. - Strengths
Large parts of the industry that remain have increased production efficiency to a competitive level.
Healthy product.
No seasonality or major climatic difficulties; UK climate is more favourable than in continental Europe.
Preference for „local‟ supply. B.f.20. - Weaknesses
Major investment required to replace lost facilities and to modernise existing ones, if production levels are to be raised to reclaim any of its own market.
Major investment also required for compost production. There is currently a shortfall in compost supply, which itself would limit any possible expansion.
Labour supply for harvesting, currently mostly supplied by immigrant workers, is a weakness (one shared by the Dutch).
6. Environmental issues B.f.21. As a protected crop, mushroom production is a significant user of energy, albeit moderate user compared with many glasshouse crops. B.f.22. Compost production results in potentially serious liquid and gaseous emissions. The environmental impact of compost run-off is, however, negligible, as it has been recycled on site for many years. B.f.23. Gaseous emissions have also been largely overcome by aeration of the compost at all stages of production. B.f.24. Spent mushroom compost is considered to be a waste material; on the whole it is adequately disposed of but its handling would be aided if it were better recognised as valuable manure and dealt with in the same manner as FYM. B.f.25. Pesticide usage is very low, many farms being semi-organic relying most heavily on specific hygiene and exclusion measures and biological control agents.

Page 61 of 134
61
2.2 STRATEGY CHOSEN TO MEET STRENGTHS AND WEAKNESSES C.1. The objectives of operational programmes listed in Article 103c of Council Regulation (EC) No 1234/2007 are relevant to POs in the United Kingdom. The actions set out in Section 3.2 (below) and the expected results and targets associated with them have been designed to meet the priority needs extrapolated from the preceding analysis of the current situation (Section 2.1). The competent authorities in the United Kingdom are confident that these results and targets can be realistically achieved. C.2. The United Kingdom believes that the various elements of the strategy which has been chosen represent, in total, a coherent approach that will meet the needs of producers, consumers and others in the food chain, as well as contributing to the European Union‟s wider environmental objectives. It also believes that the approach it has adopted does not present risk of conflict or contradiction between the various different objectives or actions that comprise the strategy. Nor is there any lack of consistency or complementarity with national or regional actions, or with other activities supported through European Community funds, notably those specified under Regulation (EC) No 1782/2003 or Regulation (EC) No 1698/2005. C.3. The results of the strategy, and the impact which it has against the baseline situation described in Section 2.1, will be monitored and analysed in the manner described in Regulation (EC) No 1580/2007.

Page 62 of 134
62
2.3 IMPACT FROM THE PREVIOUS OPERATIONAL PROGRAMMES D.1. Since the scheme was introduced in 1996 some eighty five producer organisations have been recognised by the UK authorities. At present there are fifty one grower controlled businesses that meet current recognition criteria and forty nine of these have active operational programmes. D.2. Of those POs initially recognised, three ceased trading because of changes in the market, three dropped out of the scheme with the demise of intervention, five voluntarily removed themselves from the scheme in 2008 where they had no active operational programme. Seven companies have merged into new POs‟ and sixteen have been removed from the scheme because of failure to meet full recognition requirements on close scrutiny. D.3. In the autumn of 2008, seven applicants were received from organisations seeking recognition. Of these one application was successful, one was rejected and the remaining five were initially rejected but are currently subject to appeal by the applicants. D.5. Some 1450 UK growers were members of producer organisations in the spring of 2008. This is out of a population of some 4000 growers with a full time living in horticulture (Source DEFRA Agriculture in the UK 2006 – 4100 holdings over 40 ESU‟s) D.6. The largest PO has two hundred and fifteen members and the second largest has 191, while there are ten groups having the minimum number of five members. Within this range, the third largest PO has a membership of ninety. Overall, the average size of PO membership is twenty three members. D.7. The number of producer organisations recognised at any one time is illustrated below.

Page 63 of 134
63
¹Source DEFRA Agriculture in the UK 2006 – 4100 holdings over 40 ESU‟s D.8. There was a rapid uptake from existing farmer controlled businesses in the first three years of the scheme, subsequently a steady increase occurring until 2002, and then a pick up of interest in the scheme as new businesses were created in an attempt to comply with scheme rules, and thus avail themselves of the opportunity and support provided by scheme funding. D.9. An indication of the types of PO in the UK at present is given below.
Types of recognised POs with active
programsfield veg 13
peas 9
top fruit 8
soft fruit 6
mushrooms 6
protected crops 4
organics 1
D.10. The majority of producer organisations are in England, but of the data illustrated in the chart above, two vegetable POs, one soft fruit PO and one pea producer organisation are based in Scotland. Two mushroom POs and one top fruit PO are based in Northern Ireland. There are currently no producer organisations in Wales
Number of producer organizations
0
10
20
30
40
50
60
70
80
Aug-98 Aug-00 Aug-02 Aug-04 Aug-06

Page 64 of 134
64
D.11. Historic data on the amount of money paid out in the scheme year by year are shown below. A rapid growth in the expansion of funding under the scheme can be detected from 2002 onwards.
amount paid out under scheme £m,
0
10
20
30
40
1997 1999 2001 2003 2005 2007
year
For the 2007 year the payments are a best estimate. The 2008 figure is an estimated based on approved programme expenditure.
Overall successes D.12. An area of major success across all producer organisations has been the funding of corporate agronomy services. This has allowed all producer organisations to influence and control inputs into crops, and in turn this has reduced the fixed costs in the relevant enterprises. D.13. This has been supported by measures to ensure that nutrient recommendations are backed up by soil analysis; plant clinic diagnostics; random checks to confirm that crops do not exceed maximum residue levels, and the adoption of safe harvest intervals. D.14. Also common across almost all programmes are subscriptions to crop assurance schemes, including independent audits of processing facilities and product history records. A number of the POs, particularly in the pea sector, have also included subscriptions to conservation bodies like LEAF, FWAG, and the Game Conservancy trust. Membership and endorsement of product by these bodies has enhanced the environmental credentials of the PO – in many cases a necessity for the market.

Page 65 of 134
65
Field vegetables D.15 Innovation and investments in field harvest rigs for rapid harvesting of field produce has occurred particularly in the brassica, field celery, leeks and lettuce areas. Wherever possible product is fully prepared and packaged in the field and therefore quite logically may never need to go to a PO packhouse or depot. Additionally, specialist drills for fine seeds and/or module planters have featured in programmes. D.16. Investments in automatic recording of weather data, and its interpretation by computer software to predict pest and disease risks, and irrigation needs have been commonplace. Season-long supply arrangements have driven the need for investment in irrigation equipment. Once a crop has been planted to a drilling programme, crop failure, or quality issues because of drought, are not accepted by the customers. D.17. Two producer organisations have invested in both root crop harvesting equipment, and washing plants for root crops. In the onions sector, the technology of onion storage has just begun to mirror the high technology of the top fruit industry, and box storage with controlled atmosphere has just begun to feature in programmes. Peas D.18. Of the individual sectors, the vining pea industry has done most to rationalise itself over the last decade. Instead of grower groups working in isolation, the move has been to keep a freezing plant just supplied during the freezing period. This has reduced competition between grower groups, and helped to ensure that as many contracted peas as possible meet the freezer‟s specification. During the life of the scheme there have been two major mergers of a number of pea growing groups. These new POs were formed from existing grower groups to supply all the needs of freezing lines at Hull and Lowestoft. This resulted in 10 grower groups disappearing from the scheme. D.19. Major successes within the scheme include the rationalisation of the number of viners being used by growers, increasing the areas used by each machine by efficient use of planting schedules to plant to a theoretical vining programme, and detailed monitoring of the crops as they approach maturity. Across all pea groups programmes have included subscriptions to the research and market intelligence available from the Processed Growers Research Organisation (PGRO) and Processed Vegetables Growers Association (PVGA). Top fruit D.20. The UK top fruit growers have invested heavily in storage boxes, monitoring of fruit in store, and replacement of orchards. There has been

Page 66 of 134
66
some polarisation of varieties grown into merchant-controlled varieties, and on-going research to find a reliable replacement to the English Cox. Overall, the industry is generally replanting old orchards with dwarf trees at high planting densities, which ensures a more rapid return to economic production. D.21. Pheromone trapping for pests has also occurred throughout the programme. D.22. The POs have invested in upgrading members‟ stores, changing refrigerant gases to non-CFCs, and improving doors and sealing within stores. Investments in modifying in-store atmospheres are now well under way. Along with store monitoring these investments have allowed the POs to have greater planning control over which fruit is released from which store at what time, thus balancing out and extending the marketing season. D.23. The industry has supported promotions via the Bramley Apple Campaign and the trade body English Apples and Pears Ltd. D.24. Limited investments in grading lines have occurred, as has hire of storage, but generally the POs failed to invest in centralised stores and grading equipment during the last decade, instead relying on third-party service providers to supply the bulk of the services. Soft fruit D.25. Operational programmes have facilitated the extension of the UK cropping season and to help meet and encourage the development of an increasing consumer demand for berries. D.26. Much of the strawberry crop has moved from open-field production to polytunnels or to a limited amount of glasshouse production. The result is a season that now extends from March to December in England. In order to facilitate this, along with polytunnels, the industry has invested in table top production, irrigation systems, plants, and natural pollinators. D.27. The demand for super-fresh soft fruit has encouraged grading and packing to be done on members‟ holdings or nuclei of holdings. As customer specifications have increased, white walling of grading areas, lorry docking bays, coolstores, vacuum coolers, and check-weighing grading equipment have featured strongly in programmes. D.28. With a fast moving product requiring accurate labelling and distribution high levels of quality control (QC) staff involvement has also been funded in the programmes.

Page 67 of 134
67
Protected cropping D.29. Over the last decade there has been a rapid expansion in the commercial availability of biological parasites and predators. POs have invested heavily in both the monitoring of glasshouse problems, and control by biological methods. D.30. Investments have also been made in purchasing grafted plants so that the rootstock conveys vigour or disease resistance to a F1 scion. D.31. Other investments have been in heat storage units (dump tanks), CO2 cleaning and distribution systems, computerised controls of glasshouse growing atmospheres, and linkage to peripheral Combined Heat and Power (CHP) units. D.32. Much of the UK produce has moved away from loose packs (which are copiously supplied by businesses in Spain) to punnets and packaged varieties of tomatoes on the vine, cherry tomatoes, traffic lights of peppers, and shrunk wrapped cucumbers. In making these moves POs have been assisted with funding the packaging and grading equipment. Additionally producer organisations have invested in produce racking systems and labellers. Mushrooms D.33. Despite support for the mushroom industry, intense competition from abroad is shrinking producer numbers. Two producer organisations lost members and fell below the minimum number for recognition. D.34. With so much of the cost of mushroom production being in picking labour, programmes invested heavily in staff for QC functions, and in efficiency training for pickers. D.35. Other investments have been piecemeal, with one PO developing composting facilities, another developing the organic market, yet another developing links/members across Europe in order to supply supermarkets with economy packs of mushrooms. Elsewhere, investments in mushroom growing beds, growing house sterilisers, insulation of growing tunnels, and improved summer refrigeration in the growing houses have all featured in various programmes as ways to increase productivity. Organics D.36. Many POs have dabbled in the organic market, and have small areas of crops certified by organic bodies. At present one vegetable PO is entirely organic, producing a wide range of field vegetables for an agent‟s box scheme. One mushroom group is in the process of becoming entirely organic.

Page 68 of 134
68
Overall D.37. Over the last decade the scheme has been used to modernise production, storage and packing methods for the growers, and has been successful in this. D.38. Partly because of the appointment of category managers by the major multiples around the turn of the century, which cut off many direct routes to market, producer organisations have largely refrained from directly marketing their produce. A return to regional buying desks during the last two years has failed to stimulate producer organisations actively to seek new markets. D.39. As an indication of the size of the scheme in relation to UK horticulture as a whole, in 2006 scheme payments were £21.5m. The indicative value of marketed production to which that level of aid corresponds is £523m of sales. A small amount of these sales were derived from members outside the UK. D40. Defra statistics for 2007 indicate the value of field vegetables as £799m, protected crops as £265m, top fruit as £136m, soft fruit £270m, and mushrooms £106m. This brings the total value of UK horticulture (excluding plants and flowers) to £1576m. Therefore, approximately one-third of the value of relevant produce currently passes through producer organisations.

Page 69 of 134
69
SECTION 3: OBJECTIVES OF OPERATIONAL PROGRAMMES AND INSTRUMENTS, PERFORMANCE INDICATORS
Section 3.1. Requirements concerning all or several types of actions
E.1. The Rural Payments Agency (RPA), in conjunction with the devolved administrations in Scotland, Northern Ireland and Wales will be responsible for the management, monitoring and evaluation of operational programmes in line with the National Strategy and as required by EU legislation. (The Department for Environment, Food and Rural Affairs, in conjunction with the previously mentioned Agency and with devolved administrations, will have overall responsibility for the management, monitoring and evaluation of the Strategy itself and any review).
E.2. In order to meet the requirements for arrangements to be put in place concerning demarcation with rural development (RD) aid under Regulation (EC) No 1698/2005, and avoidance of dual funding, it will be necessary to make a modification to the Rural Development Programmes and Plans for England, Wales, Scotland and Northern Ireland. The UK has proposed to the Commission that such amendments might specify that potential beneficiaries will not be eligible for RD funding where support is sought for actions is eligible under a Producers Organisation‟s Operational Programme (established under Articles 14 and 15 of Council Regulation (EC) 2200/1996 or Council Regulation (EC) No 1182/2007). The exception to this would be types of environmental actions identical to the agri-environmental commitments that are eligible for funding under the RDPE agri-environmental schemes, Entry Level Stewardship (ELS), Organic Entry ELS and Higher Level Stewardship. These actions would be ineligible for support, in England, under Producer Organisations‟ Operational Programmes. Corresponding arrangements would be made for Scotland, Wales and Northern Ireland. It is hoped that agreement will be reached on these amended plans and programmes in the course of 2009. It should be noted that the Rural Payments Agency already has robust administrative arrangements in place which ensures the risk of dual funding of the same activity is minimised.
E.3. To address the priority needs of the sector, all operational programmes must have two or more of the objectives set out in the following sections of the Strategy. (Article 103c (3) of Council Regulation 1234/2007 refers).

Page 70 of 134
70
Section 3.1.1. Planning of production
E.a.1. A key task for POs is to undertake effective planning of crop production to ensure reliability of supply and underpin supply contracts, thus strengthening the relationship between supplier and buyer. Strong production planning (including estimate and/or understanding of demand) is also essential to avail of opportunities arising to increase market share, minimise waste and optimise production costs. Some element of contingency planning may also be appropriate.
What is it that the PO is aiming to achieve? Developing performance in relation to planning of production in order to
match supply with demand and to take account of seasonal trends.
What will happen or change as a result of the planned action? Facilitating the placing on the market of members' products. Ensuring that production is adjusted to demand in terms of quantity and
quality. Boosting products' commercial value and helping to maintain customer
loyalty. Production shortfalls or surpluses will be reduced. Customer satisfaction will be increased. Production costs will be optimised.
What will be the impact of change? Improving competitiveness. Undertaking such actions successfully will help improve the
attractiveness of membership of POs. 3.1.2 Improvement of product quality E.b.1. Maintenance (and/or where possible the improvement) of quality in line with customer demands through stringent controls at PO level will enhance the image and reputation of the PO produce with both market outlets and consumers. E.b.2. Concentration on the application of consistent quality controls by the PO will enable the producers to meet the quality demanded by customers. It will also allow for improved hygiene standards and environment of packhouses above the minimum legal requirements. E.b.3. Feeding back information from the quality control process to members will contribute to reducing percentages of rejected produce and thereby have the potential to increase their market returns.

Page 71 of 134
71
E.b.4. Utilising appropriate testing regimes to ensure that customer requirements on pesticide residues and contaminants are met.
What is it that the PO is aiming to achieve? Maintain or improve upon their performance in relation to product
quality.
What will happen or change as a result of the planned action? Facilitating the placing on the market of members' products,
maintenance of market share and potentially develop new opportunities Ensuring that production is adjusted to demand in terms of quality,
thereby maintaining customer loyalty. Boosting products' commercial value. Reduction in outgrade or substandard produce and associated
reduction in customer rejections/returns. Optimising production costs which contributes to maintaining and
potentially boosting grower returns. Customer satisfaction will be improved. Rejections by buyers will be reduced. Handling costs will be reduced.
What will be the impact of change? Improving competitiveness of the PO. Undertaking such actions will help Improve the attractiveness of
membership of the PO. 3.1.3 Boosting the commercial value of products E.c.1. Enhanced commercial value of their produce will improve the viability of the PO, and therefore grower returns. Market research and analysis of customer demands will lead to the development of new product lines to expand the market for growers produce. Liaison with buyers, who will have a good knowledge of customer needs, will also be beneficial. E.c.2. Higher value markets should be sought, where possible, for all grades of produce but the development or exploration of markets for second grade produce or product that does not meet main suppliers‟ specifications should also be considered.
What is it that the PO is aiming to achieve? Develop performance in relation to product marketing. Price stability for grower returns. Improve returns for growers.
What will happen or change as a result of the planned action? Facilitate the placing on the market of members' products – with a view
to increasing the percentage that is done so.

Page 72 of 134
72
Ensuring that production is adjusted to demand in terms of quantity and quality.
Average value of PO produce will be increased. Grower returns can be maintained in face of increasing cost pressures New or alternative markets found for produce or produce that
previously had no or little market will be marketed. Product line will better meet market demands.
What will be the impact of change? Improving competitiveness of PO. Undertaking such actions successfully will help improve the
attractiveness of membership of POs. Whole crop utilisation minimises waste and contributes to
sustainability. 3.1.4 Promotion of the products, whether in a fresh or processed form E.d.1. Increasing consumers‟ awareness of the benefits of increased fruit and vegetable consumption and related health benefits will stimulate consumption and increase demand for the PO‟s produce both on a national and local level. Establishing a PO brand identity can increase consumer demand for PO product in the supermarkets – particularly at a local or regional level.
What is it that the PO is aiming to achieve? To help stimulate increased sales of fruit and vegetables – possibly as
part of wider industry and Government initiatives. To stimulate market opportunities and to increase consumer
awareness and demand for products of the PO or its sector.
What will happen or change as a result of the planned action? Promotion of produce and of the PO; and a resultant increase in sales
of PO product – for example via in-store promotions, food fairs. Increased promotion/awareness of the benefits of eating fruit and
vegetables, and that eating such produce can contribute to a healthy diet and count towards their 5-a-day.
The balance of demand for different PO products could change.
What will be the impact of change? Increased sales – and increased returns to growers. The influencing of future customers.

Page 73 of 134
73
3.1.5 Environmental measures and methods of production respecting the environment, including organic farming (NOTE: POs must include at least two environmental actions in their operational programme or alternatively, such actions must account for at least 10% of the operational funds for a PO. (See Environmental Framework and Section 3.2.7 for further details) E.e.1. This will build public trust in quality, safe production that does not damage the environment. Increased production will be decoupled from increased waste production and the environmental impact will be minimised. POs can encourage growers to produce fruit and vegetables as efficiently as possible whilst minimising their impact on the environment.
What is it that the PO is aiming to achieve? A reduction in the negative impacts on the environment.
What will happen or change as a result of the planned action? Contributing to maintenance and protection of the environment,
particularly the local one, emphasising the following: - Soil protection. - Maintenance or improvement of water quality. - Sustainable use of water resources. - Protection of habitats & biodiversity. - Conservation of landscape. - Climate change mitigation. - Waste reduction. - Energy use. - Food miles.
What will be the impact of change? Maintaining and protecting the environment in relation to the following
elements: - Soil. - Water. - Habitats & biodiversity. - Landscapes. - Climate change mitigation. - Air quality. - Waste reduction.
3.1.6 Crisis prevention and management. E.f.1. Actions to address crises or prevention of crises occurring within the sector may be necessary, by the PO insuring the crops against loss through extreme weather or insurance of a crop for the growers to be guaranteed a minimum price, and/or creation of mutual funds within the PO. Also training and/or short term promotional activity to deal with expected

Page 74 of 134
74
natural crop surpluses. (However, this does not cover surpluses caused by supplier withdrawal).
What is it that the PO is aiming to achieve? Crisis prevention or management. Avoidance or minimisation of negative impacts on the incomes of its
members. Continued ability of the PO to meet its customer demands. Maintenance of the PO‟s viability.
What will happen or change as a result of the planned action? Stabilising producer prices. Reducing fluctuations in producers' income. Staff will be trained in actions to manage crises. Harvest insurance policies will be taken out. Mutual funds will set up to
protect member incomes. Measures will be adopted to predict fluctuations in demand or price.
What will be the impact of change? Improving competitiveness. Measures adopted will help improve attractiveness of membership of
PO.

Page 75 of 134
75
Section 3.2: Specific information required for types of action F.1 Please see Annex 1 for the details of the following sections:
Section 3.2.1: Actions aimed at planning production (including Sections “3.2.1.1: Acquisition of fixed assets” and “3.2.1.2: Other actions”).
Section 3.2.2: Actions aimed at improving or maintaining product quality (non exhaustive) (including Sections “3.2.2.1: Acquisition of fixed assets” and “3.2.2.2: Other actions”).
Section 3.2.3: Actions aimed at improving marketing (non exhaustive list) (including Sections “3.2.3.1: Acquisition of fixed assets” and “3.2.3.2: Other actions”).
Section 3.2.4: Research and experimental production (Non exhaustive list) (including Sections “3.2.4.1: Acquisition of fixed assets” and “3.2.4.2: Other actions”)
Section 3.2.5: Training types of action (other than in relation to crisis prevention) and actions aimed at promoting access to advisory services (non exhaustive).
Section 3.2.6 Crisis prevention and management measures.
Sections 3.2.8: Other types of actions (non exhaustive list) (including Sections “3.2.8.1: Acquisition of fixed assets” and “3.2.8.2: Other actions”).
F.2 Please see the National Environmental Framework (Annex 2) for details of the following section:
Section 3.2.7: Environmental types of action (non exhaustive list) (including Sections “3.2.7.1: Acquisition of fixed assets” and “3.2.7.2. Other types of action”)

Page 76 of 134
76
SECTION 4: DESIGNATION OF COMPETENT AUTHORITIES AND BODIES RESPONSIBLE G.1. The Department for Environment, Food and Rural Affairs (Defra) will have overall responsibility for the management, monitoring and evaluation of the National Strategy itself and any review. This will be undertaken in conjunction with the Rural Payments Agency (RPA); the Scottish Government; Northern Ireland‟s Department for Agriculture and Rural Development; and the Welsh Assembly Government.
G.2. Separate to the above, the RPA, in conjunction with Defra and the above mentioned devolved administrations will be responsible for the management, monitoring and evaluation of operational programmes as required by the National Strategy.

Page 77 of 134
77
SECTION 5: DESCRIPTION OF THE MONITORING AND EVALUATION SYSTEMS H.1 General. Operational programmes will be considered from recognised producer organisations fulfilling national recognition criteria. H.2. Programmes will be approved only on condition that the Producer Organisation provides a statement of the initial situation, the objectives of their programme, and the performance indicators for each action implemented as listed in Section 3/Annex 1 of this Strategy; and undertakes to provide a measurement of the results realised to date each year in its Annual Report. H.3 Each PO must report annually on the implementation of its operational programme. The report on each action must include a measurement of the progress achieved to date for the prescribed indicators for each action. The circumstances responsible for failure to achieve the target set or for exceeding the target should also be provided. H.4. The overall performance of the PO will also be assessed by analysis of the annual accounts. Section: 5.1: Assessment of the operational programmes and reporting obligations for producer organisations H.a.1. The effectiveness of operational programmes will be monitored through the information provided in the Annual reports, having regard to:
the changes in total value of production marketed
the overall unit value changes (for each crop with 5% or more of the total UK value of marketed production (VMP).
the % of value added to produce passing through POs
the percentages of programmes that achieve their stated objectives
the changes in recognition and membership patterns
the changes in PO market share
the effects on the environment H.a.2. In addition to the annual reporting requirements there is an on-going requirement that each PO monitors and evaluates its own operational programme. Part of this regulatory process requires that POs must carry out a mid term evaluation report - for example after year three of a five year programme. (Article 127 of Commission Regulation 1580/2007 refers). H.a.3. Where relevant, the mid-term evaluation shall include a qualitative assessment of the results and the impact of the environmental actions aimed at:
the prevention of soil erosion.

Page 78 of 134
78
a reduction in the use of and/or better management of plant protection products.
the protection of habitats and biodiversity.
landscape conservation. H.a.4. The objectives of this evaluation are four-fold:
to improve the quality of the existing programme.
to identify any need for substantive change of the programme.
to contribute to ongoing reporting requirements concerning implementation of the programme.
to draw lessons from the current programme to help plan ahead for any subsequent programme and to help justify the measures and actions that may be incorporated into that programme. (This report will used by the RPA when considering applications for any subsequent programmes submitted by that PO).
SECTION 5.2: MONITORING AND EVALUATION OF THE NATIONAL STRATEGY H.b.1. Monitoring and evaluation of the National Strategy itself will be carried out by Defra in conjunction with the Rural Payments Agency and the devolved administrations. H.b.2. Any formal amendment of this Strategy (other than that relating to the Environmental Framework) will be taken in the form of written correspondence between Defra and the RPA & the Devolved Administrations mentioned in Section 4. Stakeholders and the European Commission will be informed of the amendment at the same time. However, in line with Article 58 (1) of Commission Regulation 1580/2007 any formal amendment of the Environmental Framework will be taken in the form of a written communication to the European Commission and in line with the conditions set out in second subparagraph of Article 103f (1) of Regulation 1234/2007. Correspondence will be copied to RPA and the Devolved administrations. Stakeholders will be informed at the same time. H.b.3. A report on the effectiveness of the first three years of this strategy will be compiled in summer 2012 for submission to the EU Commission not later than 15 November 2012.

Page 79 of 134
79
SECTION 6: MISCELLANEOUS PROVISIONS
CONDITIONS APPLYING TO PROGRAMME MEASURES AND ACTIONS
Environmental Impact Assessment:
J.1. In accordance with Article 103c (5) of Regulation (EC) No 1234/2007, proposed investments which might possibly increase environmental pressure must be presented with an environmental impact assessment or information about effective safeguards that will be put in place to protect the environment from such pressures. Investments with the potential to increase pressures on the environment will not be approved unless the Agency is satisfied that the investments respect the objectives set out in Article 174 of the Treaty establishing the European Communities and Decision 1600/2002/EC of the European Parliament and of the Council laying down the Sixth Community Environment Action Programme.
Maximum percentage levels of the fund which may be spent on any individual measures and/or type of action and/or expenditure.
J.2. Article 57 of Commission Regulation 1580/2007 requires each Member State to set out, in its National Strategy maximum percentages in order to ensure an appropriate balance between different measures in any individual programme. In this regard, no more 50% of the fund can be spent on a measure per year of the programme and no more than 30% of the fund can be spent on any individual action per year of the programme. However, there are exemptions to these two limits:
In certain cases, a specific limit has been set out against individual measures set out above in Section 3.
No more than one third of the programme fund can be spent on actions relating to crisis prevention and management.
These limits may be extended for major capital investments where there is clear evidence of collaborative or collective value to the PO and its members (for example, pea viners, packhouses, storage facilities), and for significant environmental actions.
Crisis prevention and management J.3. Article 103c (2) of Council Regulation 1234/2007, lays down various actions that can be covered by crisis prevention and management measures. Furthermore, Article 74 of Commission regulation 1580/07 allows for Member States to decide which measures apply in its own country. In the UK, we have decided to allow POs to include actions relating to:
promotion and communication.
training measures;
harvest insurance;

Page 80 of 134
80
administrative support for the setting up of mutual funds. (Note – this does not include contributions to the fund itself).
However, we will not allow actions related to market withdrawal, green- or non- harvesting of fruit and vegetables. Decisions and provisions adopted. J.4. Article 57 (1) (first subparagraph) of Commission Regulation 1580/2007 requires that all the decisions taken and provisions adopted by the Member States in application of the appropriate aspects of Council Regulation 1234/2007 and Title III of Commission Regulation 1580/2007 itself are integrated into the National Strategy. For administrative reasons, where these are not already covered above these are annexed and set out in the Rural Payments Agency’s Scheme leaflet.

Annex 1
3.2 Actions that may be included in operational programmes
The following section identifies specific actions and a non-exhaustive list of actions.
This list of actions is non-exhaustive. Detailed proposals from POs for other actions to further their programme objectives will be considered favourably by the Rural Payments Agency. See Section 9 for general conditions applicable to programme actions.
3.2.1 Planning of production in relation to demand in terms of product quantity
Planning, both long term and ongoing, to ensure that all production of all members is marketed and that the market outlets can be serviced with the quantities and qualities required. Progress will be measured by comparing the quantity and value of product that gets placed on the market at the end of the programme with the situation at the start of the programme.
Action Eligibility conditions including
Exclusions/Restrictions Output indicator Result Indicator Impact Indicator
3.2.1.1. – Acquisition of fixed assets
Investments in computers, data loggers and specific computer software, centrally and/or on individual holdings; aimed at controlling or recording the crop production environment.
Investments in new areas of trees, bushes and canes to meet increased product demand,
The UK will not fund investments in strawberry planting. However consideration may be given to actions for a research & development with a view to introduce changes in variety profile or increased cropping The PO must be able to demonstrate this enhances the market position.
–
Number of holdings participating in the actions Number of actions undertaken Total value of investments (£)
Change in volume of marketed production (Tonnes)
Estimated change in value of marketed production (£) Change in the total number of F&V producers who are active members (4) of the PO/APO concerned (number) Change in the total area under F&V production cropped by members of the PO/APO concerned (Ha)

Page 82 of 134
82
Action Eligibility conditions including Exclusions/Restrictions
Output indicator Result Indicator Impact Indicator
including new varieties or new rootstocks.
Machines for specialist production/harvesting/packaging etc activities and increased labour efficiencies (for example – planting and harvesting/vining rigs, pea tanks, irrigation equipment, grading weighing and packaging equipment for especially where this will help reduce labour requirements). Equipment for soil remediation (e.g. subsoilers) Modern growing systems and associated equipment such as polytunnels, table tops, hydroponic systems. Crop covers and associated winding gear. Use of mechanical methods of weed control. Crop specific sprayers, improved nozzles, and computerised application mapping systems.
Crop specific fertiliser application systems to allow precision placement of nutrients.

Page 83 of 134
83
Action Eligibility conditions including Exclusions/Restrictions
Output indicator Result Indicator Impact Indicator
Glasshouse technologies to extend the UK cropping season for example measures such as thermal screens; heating system improvements; new energy sources and CO2 technology, and associated electronic controls. Investments in hail and frost protection systems. Investments in new planting techniques e.g. rootstocks, bedmaking equipment. Investments in ancillary crop specific machinery to maintain the freshness and quality of the crop.
3.2.1.2. – other actions
Pre-harvest crop analysis to ensure the member‟s crops are harvested correctly to meet customer specifications.
Checks on the release of crops
Number of holdings participating in the actions Number of actions undertaken
Change in value of total marketed production (£/Kg)
Estimated change in value of marketed production (£) Change in the total number of F&V producers who are active members (4) of the PO/APO concerned (number)

Page 84 of 134
84
Action Eligibility conditions including Exclusions/Restrictions
Output indicator Result Indicator Impact Indicator
from storage to ensure the controlled release of produce according to the best keeping qualities.
Balancing supply to demand to maximise gains from seasonal variations in price. (For example use of ERP computerised systems)
Development of complete computer database systems from production through to sale, for tracking produce and recording inputs on the crops. Staff costs for the management and coordination of planting schedules, pre harvest crop assessments, and supervising the harvest process to meet customer requirements.
Specific computer programming costs and initial licence fees.
Cost of training in the use of computerised systems for PO employees or members and their staff.
Direct staff costs for staff to co-ordinate production planning,
Change in the total area under F&V production cropped by members of the PO/APO concerned (Ha)

Page 85 of 134
85
Action Eligibility conditions including Exclusions/Restrictions
Output indicator Result Indicator Impact Indicator
pre harvest monitoring, and post harvest storage and demand.
Direct staff costs to monitor the quality of produce entering the PO domain, and to monitor the quality of produce leaving the PO domain.
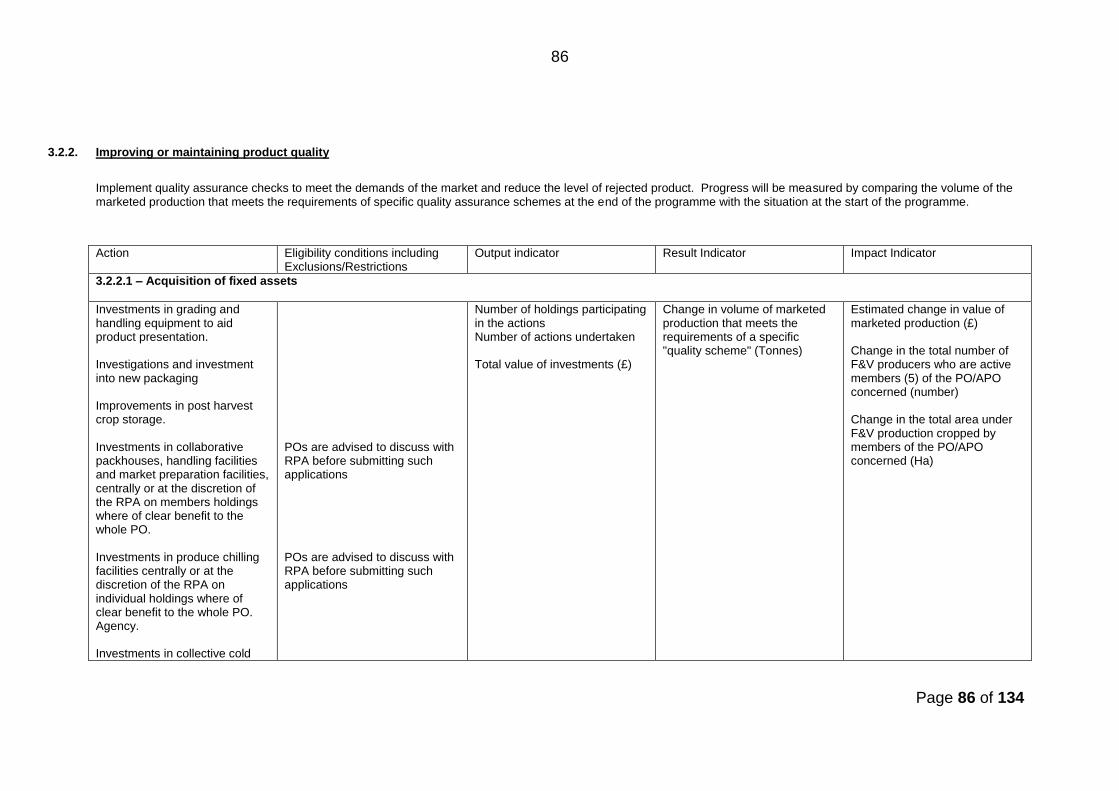
Page 86 of 134
86
3.2.2. Improving or maintaining product quality
Implement quality assurance checks to meet the demands of the market and reduce the level of rejected product. Progress will be measured by comparing the volume of the marketed production that meets the requirements of specific quality assurance schemes at the end of the programme with the situation at the start of the programme.
Action Eligibility conditions including
Exclusions/Restrictions Output indicator Result Indicator Impact Indicator
3.2.2.1 – Acquisition of fixed assets
Investments in grading and handling equipment to aid product presentation. Investigations and investment into new packaging Improvements in post harvest crop storage. Investments in collaborative packhouses, handling facilities and market preparation facilities, centrally or at the discretion of the RPA on members holdings where of clear benefit to the whole PO. Investments in produce chilling facilities centrally or at the discretion of the RPA on individual holdings where of clear benefit to the whole PO. Agency. Investments in collective cold
POs are advised to discuss with RPA before submitting such applications POs are advised to discuss with RPA before submitting such applications
Number of holdings participating in the actions Number of actions undertaken Total value of investments (£)
Change in volume of marketed production that meets the requirements of a specific "quality scheme" (Tonnes)
Estimated change in value of marketed production (£) Change in the total number of F&V producers who are active members (5) of the PO/APO concerned (number) Change in the total area under F&V production cropped by members of the PO/APO concerned (Ha)

Page 87 of 134
87
Action Eligibility conditions including Exclusions/Restrictions
Output indicator Result Indicator Impact Indicator
stores and controlled atmosphere facilities.
Investments in improved storage boxes and transport boxes. Investments in in-house laboratory facilities & equipment. Investments in field packing Investments in field cooling On the lorry investments in improving shelf life. Development in new crop stores, to improve shelf life and quality of crops and minimise crop residues. Also to buffer peaks and troughs of production. Investments in improving the insulation of existing cold stores. Investments in improving refrigeration units and running programs Improvements in grading equipment and facilities.
Hail and frost protection measures and other crop protection structures (e.g. cherry covers)

Page 88 of 134
88
Action Eligibility conditions including Exclusions/Restrictions
Output indicator Result Indicator Impact Indicator
3.2.2.2 – other actions
Independent audits of the PO control systems will help validate the QA process.
Shelf life testing of the products.
Sampling and analysis of produce for residues of plant protection products, heavy metals, bacterial and other contaminants. Sampling and analysis of water quality; either during production or cleaning of the crop. Expenditure on microbiology and residue testing Developing low input/organic product lines Use of natural pollinators Biological control techniques to replace/reduce pesticide usage. Pheromone trapping to predict pest risk. Pre planting soil tests to determine nutrients and disease levels
Number of holdings participating in the actions Number of actions undertaken
Change in value of total marketed production (£/Kg) Estimated impact on production costs (£/Kg)
Estimated change in value of marketed production (£) Change in the total number of F&V producers who are active members (5) of the PO/APO concerned (number) Change in the total area under F&V production cropped by members of the PO/APO concerned (Ha)

Page 89 of 134
89
Action Eligibility conditions including Exclusions/Restrictions
Output indicator Result Indicator Impact Indicator
staff costs to monitor crop growth and advise on treatment thresholds in line with crop management protocols. staff costs to monitor and advise on the quality and specification of produce being delivered to the PO. Personnel costs to check the quality and specification of prepared produce being delivered by the PO

Page 90 of 134
90
3.2.3 Improving marketing
Specific marketing of the PO product to increase market share, promote new product lines, negotiate best prices, maximise producer returns, promote PO brands. Progress will be measured by comparing volume of production marketed and average unit value at the end of the programme with the situation at the start of the programme
Action Eligibility conditions including
Exclusions/Restrictions Output indicator Result Indicator Impact Indicator
3.2.3.1. – acquisition of fixed assets
Machines for cutting, trimming, slicing, and multipacking produce to improve its appearance. Investments in pack presentation/ pack size equipment. Investments to improve the uniformity of produce. (for example, optical graders). Investments in improved produce weighing systems to reduce product “give away”. Investments in building facilities which enhance the PO‟s position in the market place. market research, including production patterns, market dynamics and consumption trends.
Number of holdings participating in the actions Number of actions undertaken Total value of investments (£)
Change in volume of marketed production (Tonnes)
Estimated change in value of marketed production (£) Change in the total number of F&V producers who are active members (5) of the PO/APO concerned (number) Change in the total area under F&V production cropped by members of the PO/APO concerned (Ha)

Page 91 of 134
91
Action Eligibility conditions including Exclusions/Restrictions
Output indicator Result Indicator Impact Indicator
Investment in grading and packing equipment concentrating on innovative and value added products to meet consumer demands. Development and maintenance of PO websites. New trees and bushes to supply customer preferred varieties.
3.2.3.2 – other types of action including promotion and communication activities other than in relation to crisis prevention and management
Promotion and communication including in store promotions where this actively promotes the interest of the PO. Promotion and communication in conjunction with supermarkets but limited in number, providing the product is identified as PO produce. Investment specifically aimed at
Excluded items are costs for alcoholic beverages, bar bills, and event sponsorship. Excluded are supermarket promotions such as “Buy one get one free”
Number of holdings participating in the actions Number of actions undertaken
Change in value of total marketed production (£/Kg)
Estimated change in value of marketed production (£) Change in the total number of F&V producers who are active members (5) of the PO/APO concerned (number) Change in the total area under

Page 92 of 134
92
Action Eligibility conditions including Exclusions/Restrictions
Output indicator Result Indicator Impact Indicator
improved marketing of organically grown fruit and vegetables Development of PO brands:- -Membership of crop societies (e.g. PVGA) -Cost of branding consultants -Cost of registering trademarks -Media campaigns -Promotional literature -In-store tasting Advertorial and recipes Expenses incurred in PO activities at farmers markets, food fairs and trade shows (market fees, stalls, key staff costs, stall signs and promotional literature, tasting). Product differentiation and development of premium/discount lines to exploit market niches Development of integrated database systems to coordinate supply, marketing, and sales. Procuring new suppliers for the PO in order to extend the PO supply season to customers from seasonal to all year round, in order to take advantage of category management.
F&V production cropped by members of the PO/APO concerned (Ha)

Page 93 of 134
93
Action Eligibility conditions including Exclusions/Restrictions
Output indicator Result Indicator Impact Indicator
Employing key marketing staff to develop direct sales Development of sales for out of spec products to the processing sector for juicing, peeling, processing Rebranding and promotion of the PO to build up customer awareness.
Promotion of PO brand on PO sites and facilities Assurance of crop production protocols, grading facilities, traceability, ethical staff treatment, as necessary to exceed the customer‟s requirements. Fees for market information, and consumer buying habits. Generic crop promotions Benchmarking growers operational performance via environmental assessments.

Page 94 of 134
94
3.2.4 Research and experimental production
Clearly defined research or experimental projects with time limited objectives, such as an appraisal of diversification into new product lines, or the introduction of new crops or new varieties of crop or method of cropping.
Action Eligibility conditions including
Exclusions/Restrictions Output indicator Result Indicator Impact Indicator
3.2.4.1. – Acquisition of fixed assets
The duly justified cost of input where a trial is clearly being undertaken. Equipment to grow and record at a plot level
Excluded items: (a) Levies to statutory bodies that undertake R&D (b) Support to plant breeding operations – see Scheme guidance leaflet (c) Subsidising production costs. Expenditure on R&D will be limited to 30% of the programme
Number of holdings participating in the actions Number of actions undertaken Total value of investments (£)
Number of new techniques, processes and/or products adopted since the beginning of the operational programme
Estimated change in value of marketed production (£) Change in the total number of F&V producers who are active members (6) of the PO/APO concerned (number) Change in the total area under F&V production cropped by members of the PO/APO concerned (Ha)
3.2.4.2. – other types of action
Additional staff costs to make crop observations, analyse and present results to the members. Market research for the new product. Cost of membership of non statutory research bodies producing near market research
Number of holdings participating in the actions Number of actions undertaken Number of hectares concerned
Number of new techniques, processes and/or products adopted since the beginning of the operational programme
Estimated change in value of marketed production (£) Change in the total number of F&V producers who are active members (6) of the PO/APO concerned (number) Change in the total area under F&V production cropped by

Page 95 of 134
95
Action Eligibility conditions including Exclusions/Restrictions
Output indicator Result Indicator Impact Indicator
and development results. Taste panels and analysis of consumer reactions. PO in house trials. Support to non-statutory, near market industry R&D projects sponsored by the PO. Levies for crop groups (e.g. PGRO) to support industry led R&D
members of the PO/APO concerned (Ha)

Page 96 of 134
96
3.2.5 Training and provision of advisory services Progress will be measured by the number of people who completed a training activity and the number of holdings using the advisory service Action Eligibility conditions including
Exclusions/Restrictions Output indicator Result Indicator Impact Indicator
Actions related to training (other than in relation to crisis prevention and management) and actions aimed at promoting access to advisory services
Equipping of dedicated training facilities for PO members (furnishings, audio-visual presentation equipment, demonstration units). Training courses for members and their production staff on quality assurance, management of plant protection products, harvesting methods, production planning and risk management, IT skills needed for the implementation of operational programme actions or for administration of the operational programme. Provision of advisory and consultancy services and technical advice to members and the PO on -Optimising inputs -Plant health issues -Food safety and hygiene issues -Preparing for certification under quality assurance schemes
Restrictions may be placed on non member usage of equipment.
Training for staff of third party marketing companies is not eligible for inclusion in the programme.
Individual growers providing a service only for their own business will be ineligible Statutory requirements – e.g. Health & Safety will be ineligible.
Number of actions undertaken Number of days of training received by participants
Number of people who completed the full training activity/programme Number of holdings that use advisory services
Estimated change in value of marketed production (£) Change in the total number of F&V producers who are active members (4) of the PO/APO concerned (number) Change in the total area under F&V production cropped by members of the PO/APO concerned (Ha)

Page 97 of 134
97
Action Eligibility conditions including Exclusions/Restrictions
Output indicator Result Indicator Impact Indicator
-Harvesting -Environmental issues such as irrigation, heating, use of fertilisers and plant protection products -Labour profiling and harvest/packhouse management. -Services to advise on transport logistics, energy use, staff management. -Integrated crop production methods and organic production systems -Gross margin analysis, benchmarking, enterprise fixed cost analysis Training in issues relevant to the development of the PO
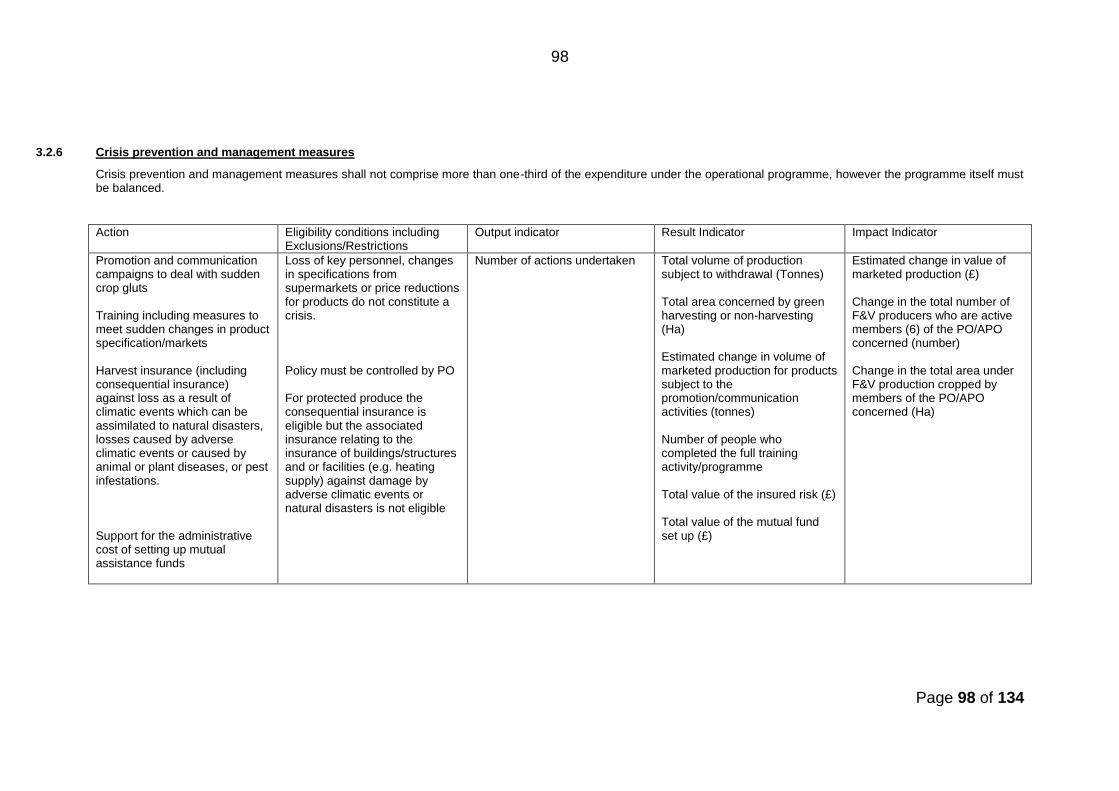
Page 98 of 134
98
3.2.6 Crisis prevention and management measures
Crisis prevention and management measures shall not comprise more than one-third of the expenditure under the operational programme, however the programme itself must be balanced.
Action Eligibility conditions including Exclusions/Restrictions
Output indicator Result Indicator Impact Indicator
Promotion and communication campaigns to deal with sudden crop gluts Training including measures to meet sudden changes in product specification/markets Harvest insurance (including consequential insurance) against loss as a result of climatic events which can be assimilated to natural disasters, losses caused by adverse climatic events or caused by animal or plant diseases, or pest infestations. Support for the administrative cost of setting up mutual assistance funds
Loss of key personnel, changes in specifications from supermarkets or price reductions for products do not constitute a crisis. Policy must be controlled by PO For protected produce the consequential insurance is eligible but the associated insurance relating to the insurance of buildings/structures and or facilities (e.g. heating supply) against damage by adverse climatic events or natural disasters is not eligible
Number of actions undertaken Total volume of production subject to withdrawal (Tonnes) Total area concerned by green harvesting or non-harvesting (Ha) Estimated change in volume of marketed production for products subject to the promotion/communication activities (tonnes) Number of people who completed the full training activity/programme Total value of the insured risk (£) Total value of the mutual fund set up (£)
Estimated change in value of marketed production (£) Change in the total number of F&V producers who are active members (6) of the PO/APO concerned (number) Change in the total area under F&V production cropped by members of the PO/APO concerned (Ha)

Page 99 of 134
99
3.2.7 Environmental actions
Actions by producer organisations should complement and be consistent with the community‟s environmental priorities in the following areas: Operational programmes must include two or more environmental actions.
A programme with just one action will be accepted if the measure uses at least 10% of the expenditure of the programme. Where at least 80% of the members are subject to one or more identical agri-environment commitments (see Environmental Framework) then each action will count. Exceptionally, consideration will be given to the eligibility of certain components of major capital investments where that component has a clear, identifiable and measurable environmental impact or benefit.
Action Eligibility conditions including
Exclusions/Restrictions Output indicator Result Indicator Impact Indicator
3.2.7.1 – Acquisition of fixed assets
SEE ENVIRONMENTAL FRAMEWORK

Page 100 of 134
100
3.2.8 Other actions
Actions that will clearly enhance the status or governance of the producer organisation will be considered where a clear business case is presented which budgets for and is able to monitor the long term economic benefit of the proposed action.
3.2.9 Administration of the operational programme
50% of the actual administration costs of the operational programme will be allowed, subject to a limit of €90,000 on the aid payable in any year. POs may opt instead for payment of a lump sum for administration on the basis of 2% of the expenditure accepted for payment. The limit of €90,000 aid will apply.

Annex 2
NATIONAL FRAMEWORK FOR ENVIRONMENTAL ACTIONS National Strategy for Operational Programmes of Producer Organisations in the United Kingdom National Framework for Environmental Actions INTRODUCTION EF1. Council Regulation (EC) No 1234/2007 provides for EC financial assistance to be given to registered Producer Organisations (POs) which have approved operational programmes. Article 103c(3) of that Regulation requires – subject to certain conditions - POs to include in such programmes two or more environmental actions, or alternatively at least 10% of the expenditure under operational programmes covering environmental actions. This National Framework draws up the general conditions relating to such environmental actions, explaining in more detail what the legislative background is, what the links with the Rural Development Regulation (Regulation (EC) NO 1698/2005) are, and intended to give guidance to POs on the broad categories of environmental actions that comprise the framework so far as the United Kingdom are concerned, as well as a non-exhaustive list of detailed actions that might be included in operational programmes. EF2. The National Framework applies to the United Kingdom as a whole, but reference is made in paragraphs 4 and 5 to differing considerations which apply in England, Scotland, Wales and Northern Ireland respectively as a result of differences in relevant legislative provisions, notably as regards rural development programmes. Duration of the environmental framework EF3. The period of application of the United Kingdom‟s environmental framework will be six years, from 2008 to 2013. The framework may be amended (if circumstances make it appropriate to do so) at annual intervals during that five year period, with any amendment to the framework being submitted to the Commission. The timetable applying to any such proposed amendment will be such as to allow any further modification that the Commission might require to be incorporated into the framework in advance of the deadline for the submission each year of applications for new operational programmes or amendments to existing programmes. Linkage with rural development EF4. Actions under this framework shall be complementary, consistent and in conformity with the following programmes approved under Regulation (EC) No 1698/2005:

Page 102 of 134
102
Rural Development Programme for England 2007-2013 (approved by the European Commission on 7 December 2007) Rural Development Plan for Wales 2007-2013 (approved by the European Commission on 20 February 2008) Scotland Rural Development Programme 2007-2013 (approved by the European Commission on 23 January 2008) Northern Ireland Rural Development Programme 2007-2013 (approved by the European Commission on 24 July 2007) EF5. So far as the interpretation of the second sub-paragraph of Article 103c (3) of Regulation (EC) No 1234/2007 is concerned, “requirements for agri-environment payments” shall have the following meaning: In England: The requirements set out in Appendix VIII of Annex 2 to Chapter 5 of the RDPE Programme Document (“The Agri-Environment Baseline”). In Scotland: The requirements set out in Annex 8 of the Scotland Rural Development Programme. In Wales: The requirements set out in Appendix 1 to the Rural Development Plan for Wales 2007-2013. In Northern Ireland: The requirements set out in Annex 4 Measure 2.2 (“Agri-Environment Programme”) and Annex 4 Appendix A of the Northern Ireland Rural Development Programme 2007-2013 (“Management Prescriptions and Capital Works eligible for support under Measure 2.2: The Agri-Environment Programme (Northern Ireland Countryside Management Scheme”).

Page 103 of 134
103
EF6. So far as the interpretation of the penultimate sub-paragraph of Article 103c (3) of Regulation (EC) No 1234/2007 is concerned, “agri-environment commitments” shall have the following meaning: In England: Membership of the Entry Level Stewardship scheme or Organic Entry Level Stewardship scheme (but not the Higher Level Stewardship) under Axis 2 of the RDPE, together with membership of two equivalent schemes that are no longer open to new applicants (the Countryside Stewardship and Environmentally Sensitive Areas schemes). However, in the case of applications for in-year amendments to operational programmes in 2008 only, “agri-environmental commitment” may additionally be interpreted as referring to commitments to carry out individual options within Entry Level Stewardship, or individual options within the corresponding agri-environment schemes which operate in Scotland, Wales and Northern Ireland. In Scotland: Membership of the Land Management Contract Menu Scheme, Organic Aid Scheme, Countryside Premium Scheme, Environmentally Sensitive Area Schemes, Habitats Scheme and the Rural Stewardship Scheme, which are no longer open to new applicants; and Rural Development Contracts Land Managers‟ Options and Rural Development Contracts Rural Priorities under Axis 2 of the Scotland RDP. In Wales: Membership of the Tir Cynnal, Tir Gofal or Organic Farming and Maintenance Schemes under Axis 2 of the RDP Wales. In Northern Ireland: Membership of the Northern Ireland Countryside Management Scheme or the Organic Farming Scheme in Measure 2.2 of the Northern Ireland Rural Development Programme. Relevant legislation and other provisions (non-exhaustive list) EF7. Cross compliance conditions, comprising
Statutory Management Requirements in the areas of environmental, public and plant health legislation, as set out in Articles 3 and 4 of Regulation (EC) No 1782/2003
Requirements under domestic (E,W,S,NI,UK) legislation requiring land to be held in Good Agricultural and Environmental Condition (GAEC)

Page 104 of 134
104
EF8. Codes of Good Agricultural Practice in regard to Air, Water and Soil (currently under revision) ENVIRONMENTAL NEEDS AND PRIORITIES EF9. As part of the initial analysis of the United Kingdom‟s fruit and vegetable industry carried out as part of the preparation of its National Strategy, as required by Article 103f (2) of Regulation (EC) No 1234/2007, a review was carried out of the environmental needs and priorities of each of the principal sectors of the industry. The following paragraphs accordingly give a sector-by-sector picture of the current environmental status of the fruit and vegetable industry and ways in which that status might be improved. The various separate headings under which it has been shown that the industry‟s status shows room for improvement are summarised in paragraph 36 (“broad categories of measure for environmental action”). Each of these categories features prominently in the United Kingdom government‟s list of overall national strategic environmental objectives, and contributes to the fulfilment of the United Kingdom‟s commitments under Article 174 of the Treaty and under the Sixth Community Environmental Action Programme. Vining peas: environmental needs and priorities EF10. Vining pea crops require little in the way of soil-applied fertiliser and research and development is enabling thresholds to be established for major pests, limiting the application of pesticides. Organic production is being used as an opportunity to learn about growing the crop without pesticides at all, particularly herbicides. Techniques such as increasing seed rate and sowing deeper in conjunction with finger weeders are proving successful in controlling weeds, though volunteer potatoes are a still a problem which needs to be tackled. Volunteer potatoes are a major contaminant in the harvested crop if no herbicides are available. EF11. Harvesting of the crop can lead to significant damage to soils if it has to proceed in unfavourable weather conditions, though efforts are being made through the latest designs of harvester aim reduce or minimise this. As the crop matures rapidly, delaying harvest until field conditions improve is not a practical option.
EF12. There is an awareness of the need to promote the environmental credentials of the crop such as its carbon footprint and nitrogen-fixing ability. Carbon measurement is likely to feature in future plans as the crop has a lower-than-average carbon footprint and this should be further reduced by making pea harvesters more fuel efficient. One of the major processors has successfully engaged its contracted growers in initiatives to audit and put in place energy plans, minimisation of carbon footprints, encourage biodiversity and tackle soil management and diffuse

Page 105 of 134
105
pollution. Generally the vining peas sector have been in the vanguard on environmental and sustainability issues, with individual members taking responsibility encouraged by both the PO and the customer. It is usual for crop sprays to be minimised, and efforts continue to persuade growers to leave fields margins uncultivated to encourage habitats and wildlife, notably providing the ideal habitat for ground nesting birds such as lapwings, yellow wagtails and skylarks. Field vegetables: environmental needs and priorities EF13. Research recently commissioned by Defra comparing the „environmental footprint‟ of certain field vegetables with other horticultural crops, and with other forms of agricultural production (wheat, lamb and milk) has showed that in terms of:
- ecological footprint
- pesticide use
- „global warming potential‟
- eutrophication/acidification potential
- water and labour use that those studied (carrot, cauliflower and onion) rated quite low for impact. This in part due to the attributes of the production systems employed, but also reflects the part played by Good Agricultural Practice codes, accreditation schemes and the demands of the market. Nevertheless the demands to improve environmental performance continue to increase both as a result of legislation and consumer preferences. EF14. The majority of field vegetable businesses are accredited to at least one quality scheme, such as Assured Produce, and often several such schemes. In general these require the adoption of practices which go beyond compliance with legislation and require businesses to demonstrate that this has been done through self- and independent audits. Accredited businesses should have policies in place covering environmental aspects of production, which will be subject to regular review. Indeed many leading producer groups actively promote their environmental credentials and take an active part in schemes such as LEAF or „Operation Bumble Bee‟. The major environmental concerns for field vegetable producers are the use of water and energy, including transport. EF15. Water plays a crucial role in the sustainable cropping of many vegetable growing enterprises; often associated with this are enhanced natural habitat areas for example around reservoirs. The Water Framework Directive and climate change are major drivers likely to affect future investment. Water abstraction and its management in terms of efficacy of application represent a major challenge for the vegetable growers as the majority of water use in vegetable crops is during the summer, when there may potentially be a shortage in supply. If, as a result of climate change, summers are to be longer and drier, then water shortages and/or the increasing cost of water may start having a significant environmental impact.

Page 106 of 134
106
EF16. Longer and drier growing seasons could result in greater amounts of water being required (for example, irrigation is now sometimes required in March and October, which would have been unheard of even 5 years ago). Efforts are being made to encourage greater water resource efficiency by considering practical measures to reduce usage, adopting best practice and benchmarking irrigation systems, as well as investing in improved delivery systems. Where feasible, growers will be looking to ensure greater security of this resource. Greater attention may also need to be given to preventing soil erosion as irrigation or intense rainfall events increase. EF17. Likewise energy use, including its use in transport, can have a major environmental impact from primary production though to market preparation. Energy audits are becoming a more regular feature on farms, with energy consumption an important feature for product choice or investment decisions. EF18. The combined effect of EC legislation on pesticides and their commercial availability and efficacy, the influence of accreditation schemes and pressures from the multiples and consumers are leading to a much closer look at the use of agrochemicals. The supermarkets may have their own list of pesticides which, though officially approved, cannot be used on crops destined for them and major efforts are in place to further residue levels at point of sale. This may require different pest and disease control strategies to be adopted. On occasion, this can lead to trade-offs, for example reducing use of herbicides may mean more mechanical cultivations with increased energy use. EF19. Many vegetable growers have been keen to subscribe to environmental improvement schemes, not only with tree and hedge planting, but with other measures to increase bio-diversity. Moreover, an increasing number of businesses are looking for ways to reduce their overall impact on the environment, by auditing all parts of the supply chain. This will impact on primary producer‟s policies for energy use, water and waste. The industry is aware that carbon footprint labelling could become a standard requirement with products being labelled for consumers to see their environmental impact. Tesco has already introduced carbon footprint labelling on 30 of its products and this is expected to increase and spread to more retailers and agri-businesses. Soft fruit: environmental needs and priorities EF20. As part of efforts to reduce the environmental impact of soft fruit production, more farms are moving away from production in the soil to reduce the need for soil sterilisation, particularly in the South-east. An increased proportion of the production of both strawberries and raspberries is being undertaken in substrate, using trickle irrigation and fertigation to provide the crops nutrient requirements. Modern systems are able to closely match the supply to the crop requirements, thereby reducing waste and excessive

Page 107 of 134
107
leaching of nutrients. Such systems can be undertaken on the same site year after year, helping to reduce environmental impact. EF21. The growing use of polythene tunnels has facilitated a reduction in the amount of sprays applied, particularly for disease control, and spraying for pests is only undertaken when a threshold in pest numbers is reached. An increasing number of sprays used are derived from natural products with very low toxicity levels and minimal residual effects. EF22. Adequate water supplies are an essential requirement for crops grown under temporary covers and although they may be drawn from a number of sources, volumes can be marginal at times of shortage e.g. when river, borehole or mains supplies can be restricted. The industry, at least in part, has taken steps to reduce its reliance on these sources and some reservoirs have been installed, relying on winter rainfall to charge. As well as reducing the need for abstraction from rivers, streams and other natural sources, installation of reservoirs can also provide scope for wildlife habitats and an increase in biodiversity. EF23. Increasingly, mulches used over beds to help suppress weeds and conserve moisture are of woven construction, allowing rain water to pass through and into the soil, helping to reduce erosion. Polythene mulches tend to direct rain water between the beds, increasing the risk of soil erosion. Straw applied between the beds during the summer does help prevent erosion and ultimately conserve the structure of the soil. Whilst polythene covers are in place over tunnel hoops, high rainfall can cause soil erosion as water is channelled between structures. Various guttering systems to collect water (and ideally recycle it) are available, but to date their cost has been high. Nuisance as a result of noise pollution has been a problem with a number of types of irrigation systems, and also with electrical generators, in the soft fruit sector and in other sectors of the industry. EF24. Increasingly fruit farms are planting up small areas around farms with native trees and encouraging hedges etc., all aimed at enhancing the bio-diversity in the countryside. Such plantings are recognised as having the potential to encourage natural pest predators, helping to reduce the need for spraying and encouraging bees for crop pollination. EF25. Short-term storage facilities are essential for today‟s soft fruit unit, enabling harvesting to continue through the week whilst demand fluctuates and for fruit to be supplied to customers in quantity for the end of the week, when demand is greatest. Modern storage facilities have reduced energy requirements as a result of improved insulation specifications and many of the older stores are now being upgraded with improved insulation being specified to save energy. Top fruit: environmental needs and priorities EF26. Much of the United Kingdom‟s tree fruit production is of relatively low environmental impact. Integrated pest and disease control, the use of

Page 108 of 134
108
grass in the orchards to reduce soil erosion, band application of fertilisers to meet crop needs and the encouragement of bio-diversity around orchards in the windbreaks and hedges are all measures which take into account the needs of the environment. EF27. Much effort has been put into the modification of spray programmes to reduce crop residues. Increasingly, pesticides are only applied when problems reach a threshold and many of those now available are, to a great extent, much more specific for controlling their target. An increasing number of sprays used are derived from natural products, with having very low toxicity levels or residues. Post-harvest treatments are usually only applied on the basis of a risk-assessment. EF28. Whilst new orchards are now fitted with irrigation, much of the water is from “on farm sources”, being stored in reservoirs from winter rain, utilising water which would otherwise be discharged through streams and rivers to the sea. Reservoirs provide an environment for wildlife and, in some cases, leisure facilities in the form of fishing giving additional farm income. Moreover, most orchards use mulches to help conserve moisture, particularly for young trees to aid establishment and also to help reduce the amount of irrigation required. The mulch which is often straw or increasingly composted green waste, both helping to reduce soil erosion. EF29. Increasingly fruit farms are planting native trees in small areas around farms, installing bird boxes and undertaking other measures, all aimed at enhancing biodiversity on the farm. EF30. The use of mow and spray orchard systems is helping to reduce fuel usage and the increasing average size of production units helps to improve efficiency of transportation of fruit to the various markets. Larger units are able to supply larger quantities of fruit to a single buyer requiring less transport movements. Moreover, fruit has in the past been stored in facilities of variable age and performance, whereas modern storage facilities have reduced energy requirements from improved insulation. Efforts have been proceeding to upgrade or replace many of the older stores and there is scope for this to continue. Protected crops: environmental needs and priorities EF31. The most evident environmental impact in the protected crops sector is the use of energy. In addition to its use for heating, energy consumption by lighting, pumps etc is also very important. To mitigate costs and to qualify for rebate from the Climate Change Levy / Climate Change Agreement, growers have been seeking to reduce their energy use by a variety of methods, and improve the effectiveness of that which is used. Measures to reduce heat and energy loss, such as thermal screens, will also reduce nuisance caused by light pollution in cases of extension of winter day-length by artificial lighting.

Page 109 of 134
109
EF32. Across all crops in the sector, growers are seeking to reduce the amount of pesticide use. Although the number of available pesticides is reducing, the main drivers have been the desire to adopt Integrated Pest Management, to help differentiate United Kingdom producers from other suppliers to the market and to meet consumer‟s expressed preference. The introduction of accreditation schemes, such as Assured Produce, is also having an impact on use of pesticides. The degree of challenge posed in reducing agrochemical use varies between crops; it is likely that the future will also see new pest and disease threats arising which will need appropriate (biological or other) counter-measures. EF33. The protected crops sector is a significant user of water. Most long-season crops are grown in systems such as rockwool, isolated from the soil. Water supply and irrigation systems are generally viewed as efficient, though there is a degree of over-watering to allow for imperfections in the circulation of the nutrient solutions. Recirculation of water and nutrients is practised by some and there may be a need for further investment by the industry in recycling and purification systems to limit water and fertilizer discharges from the nursery, with their potential for pollution. Water collection from, for example, glasshouse roofs is becoming more widespread and has the potential to contribute significantly to a nursery‟s water requirement. Additional water storage facilities may be necessary to facilitate this. Mushrooms: environmental need and priorities EF34. As a protected crop, mushroom production is a significant user of energy, but a moderate user only compared with many glasshouse crops. Compost production, however, results in potentially serious liquid and gaseous emissions, and efforts are accordingly being made to limit the environmental impact of compost run off by recycling it on site. Similarly, gaseous emissions which may give rise to pollution by noxious odours are also being tackled by aeration of the compost at all stages of production. EF35. Spent mushroom compost is generally considered to be a waste material, and a priority need of the mushroom industry is to recognise it as a potentially valuable resource, as with farmyard manure. Pesticide usage by mushroom growers is, for a number of reasons, very low, many farms being semi-organic, with efforts being directed towards specific hygiene and exclusion measures and biological control agents. BROAD AREAS FOR ENVIRONMENTAL ACTION EF36. The following broad categories of measure will constitute the framework for the United Kingdom: (1) Measures aimed at reducing fuel and energy usage (2) Measures aimed at reducing the environmental impact of water usage (3) Measures aimed at preventing emissions into air, water or soil (4) Measures aimed at the re-use of crop remains and other organic
residues, or at contributing to recovery of agricultural waste

Page 110 of 134
110
(5) The environmental management of packaging. (6) Measures aimed at protecting the landscape, natural habitats and
biodiversity (7) Measures aimed at preventing soil erosion and promoting conservation
of soils EF37. In the case of environmental actions falling within Measures (1), (2) and (3) listed in paragraph 36 and which essentially entail making investments contributing to the general aim of the measure, a special provision will apply concerning the verification of the expected reductions in fuel/energy usage, water usage or emissions into air, water or soil. A PO opting to carry out environmental actions in these categories must provide, at the time of submitting its proposal for an operational programme or an amendment to such a programme, an independently attested statement of the reductions expected to be made in energy/fuel or water usage or in emissions into air, water or soil as a result of the investment(s) made in the course of the action concerned. An attestation may be made under either one of two different categories, depending on which of the two sets of circumstances referred to in paragraph 38 is applicable. When such an attestation falling under either category is provided, a PO will be exempt (in relation to such environmental actions) from administrative and on-the-spot checks by the competent authorities on the actual attainment of the expected reduction in fuel/energy usage, water usage or emissions into air, water and soil resulting from the investment(s) made. EF38. The attestation referred to in paragraph 37 may be made under either one of two different categories:
The first category of attestation is applicable, firstly, to the actions referred to in 2.4, 2.5 and 2.6 in the Tables following paragraph 40, and secondly in circumstances where the environmental benefits resulting from the investment(s) made in the course of the environmental action in question are confined solely to the reduction in either fuel/energy usage, or in water usage under the actions referred to in 2.2 and 2.3 in the Tables following paragraph 40, or in emissions into air, water or soil. In those cases the special provision referred to in paragraph 37 will only be applicable if the attestation shows that the expected reductions in the annual rate of fuel/energy usage, or in the annual rate of water usage, or in annual emissions into air, water or soil, will be at least 25% over the depreciation period of the investment. Alternatively:
The second category of attestation is applicable in instances where the independent assessment indicates that the environmental action will lead to at least one additional environmental benefit under the categories of measures given in paragraph 36, as well as a reduction in fuel/energy usage, or in water usage under the actions referred to in 2.2 and 2.3 in the Tables following paragraph 40, or in emissions into air, water or soil. In those cases the special provision referred to in paragraph 37 may be applicable if the attestation shows that the expected reductions in the annual rate of fuel/energy usage, or in the annual rate of water usage, or in annual emissions into air, water or

Page 111 of 134
111
soil, will be at least 10% over the depreciation period of the investment.
EF39. The competent authorities in the different parts of the United Kingdom will determine the categories of suitably qualified individuals, or professional bodies, that are acceptable in connection with the provision of an independently attested statement as referred to in paragraph 37. Detailed list of actions EF40. Under each of the measures referred to in paragraph 36, the following non-exhaustive list of environmental actions could be considered. Producer Organisations must include at least two of these actions in the operational programme or these actions must account for at least 10% of the operational funds of a Producer Organisation. These actions may be considered eligible for financing only if they go beyond the relevant baseline/reference level applicable (see paragraph 41, first indent). In connection with each proposed environmental action, a PO must indicate whether the expenditure under each detailed commitment that it undertakes to fulfil falls into the category of purchasing a fixed asset, renting/leasing a fixed asset, or other forms of expenditure. In cases where a PO makes commitments concerned with training, advice or technical assistance in support of environmental actions, it may choose to group these commitments together under a single heading when it draws up its operational programme.

1. Measures aimed at reducing fuel and energy usage
Justification: Reduce emissions of CO2 and other greenhouse gases
Environmental actions Commitments Eligible expenditure Indicator Definition and measurement
1.1. Review the logistics of product collection and distribution to minimise total carbon usage, where complementary to other environmental actions under the category of measures 1;
- Use of additional (internal or external) qualified personnel for an energy audit of the logistics of product collection and distribution, with the view to identifying possible areas for improvement and defining relevant environmental actions to be undertaken (*)
(*) For eligibility for support, the
requirements indicated in paragraph 49 are applicable
Personnel costs related to additional (internal or external) qualified personnel used for the review
Energy usage Change in Litres fuel/tonne produce
1.2. Acquisition of equipment for the monitoring and control of energy consumption, where complementary to other environmental actions under the category of measures 1;
- Purchase of the equipment for the monitoring and control of energy consumption
- Use of the equipment as intended
Expenditure related to the investment made on the equipment
1.3. Replacement of existing heating installations
- Purchase of a new heating installation in replacement of an existing one;
- Use of the new heating installation as
intended;
Expenditure related to the investment made on the new installation
1.4. Monitor and control energy consumption in intensive production areas (heated glass), where complementary to other
- Purchase of equipment for the monitoring and control of energy consumption;
Expenditure related to the investment made on the equipment
Energy usage; installation of computer controls;
Kwh/tonne produce

Page 113 of 134
113
1. Measures aimed at reducing fuel and energy usage
Justification: Reduce emissions of CO2 and other greenhouse gases
Environmental actions Commitments Eligible expenditure Indicator Definition and measurement
environmental actions under the category of measures 1
- Use of the equipment as intended. installation of thermal screens
1.5. Improve thermal insulation in stores; - Improvement of the thermal insulation in stores;
Expenditure related to the investment made on the improvement of thermal insulation
Fuel usage Improvement in running costs per tonne produce harvested, stored or chilled 1.6. Improve refrigeration plants; - Undertaking the improvement of the
existing refrigeration plants;
Expenditure related to the investment made on the improvement
1.7. Investments in more fuel-efficient harvesters and similar equipment;
- Purchase of a new harvester and/or similar equipment;
- Use of the new harvester and/or similar
equipment as intended;
Expenditure related to the investment made on the new harvester and/or similar equipment
1.8. Use of lighter packaging in transportation;
- Purchase and use of lighter packaging in transportation
Eligibility for support is limited to packaging compliant with the essential requirements defined by the Directive 94/62/EC
Additional costs of the lighter packaging compared with the cost of standard packaging compliant with the essential requirements defined by the Directive 94/62/EC
1.9. Purchase (but not leasing) of CHP unit
- Purchase of a CHP unit; - Use of the CHP unit as intended.
Expenditure related to the investment made on the CHP unit

Page 114 of 134
114
1. Measures aimed at reducing fuel and energy usage
Justification: Reduce emissions of CO2 and other greenhouse gases
Environmental actions Commitments Eligible expenditure Indicator Definition and measurement
1.10. Conversion of existing heating installations to run on renewable sources of energy
- Conversion of an existing heating installation to run on bio fuels
- Use of the heating installation
converted as intended
Expenditure related to the investment made on the conversion of existing heating installation
Conversion of heating equipment and transport to run on bio fuels
Actual reduction in fossil fuel usage/ tonne
1.11. Conversion of existing transport equipment to run on renewable sources of energy
- Conversion of existing transport equipment to run on bio fuels
- Use of the transport equipment
converted as intended
Costs related to the conversion of existing transport equipment
1.12. Replacement of existing heating installations with new installations able to run on renewable sources of energy
- Purchase of a new heating installation able to run on bio fuels in replacement of an existing one
- Use of the new heating installation as
intended.
Expenditure related to the investment made on the new heating installation
1.13. Promoting the use of more sustainable transportation methods (rail, sea) rather than road transport for finished products and raw materials
Use of rail or sea transport in replacement of road transport
Additional specific costs for rail or sea transport
Volume of products and other goods transported more sustainably
Reduction in fuel usage

Page 115 of 134
115
2. Measures aimed at reducing the environmental impact of water usage
Justification: contribute to water saving, or (in the case of 2.1) changing the seasonality of water abstraction in an environmentally beneficial way
Environmental actions Commitments Eligible expenditure Indicator Definition and measurement
2.1. High flow storage reservoirs - Installation of a high flow storage reservoir;
- Use of the reservoir installed as
intended; Eligibility for support is limited to storage reservoirs offering environmental benefits in terms of winter abstraction, in particular where winter abstraction is carried out under approval/licence by such bodies as the Environment Agency and is encouraged in preference to summer abstraction (and where assessments are made, and explanations are given, of what systems will be put in place to avoid upsetting the ecological balance of streams, rivers and ponds, and to avoid adverse effects on the wild flora and fauna associated therewith). Sites impacting on SSSIs and Natura 2000 sites are excluded. Major reservoir construction projects on individual holdings are ineligible unless they are of collective benefit to the PO
Expenditure related to the investment made on the installation of a high flow storage reservoir
Volume of high flow water stored Usage by members Reduction in licensed summer abstraction
Increase in high flow storage capacity No of grower members utilising stored water Licensed summer abstraction

Page 116 of 134
116
2. Measures aimed at reducing the environmental impact of water usage
Justification: contribute to water saving, or (in the case of 2.1) changing the seasonality of water abstraction in an environmentally beneficial way
Environmental actions Commitments Eligible expenditure Indicator Definition and measurement
and unless they are subject to appropriate depreciation and lease agreements being in place.
2.2. Rooftop water collection and recycling
- Purchase and installation of the equipment necessary for rooftop water collection and recycling;
- Use of the equipment installed as
intended.
Expenditure related to the investment made on the equipment necessary for rooftop water collection and recycling
Volume in cubic metres collected/reused
Increase in cubic metres collected/reused
2.3. Re-use of water at the level of product preparation installations
- Purchase and installation of the equipment necessary for the re use of water at the level of product preparation installations;
- Use of the equipment installed as
intended.
Expenditure related to the investment made on the equipment necessary for the re use of water at the level of product preparation installations
2.4. Preparation and implementation of irrigation plans aimed at water savings or reductions in run-off;
- Preparation of an irrigation plan aimed at water savings or reductions in run-off;
- Implementation of the irrigation plan
prepared for at least five years.
- Costs related to the preparation of the irrigation plan. Eligible costs include, where appropriate, those related to soil analyses and the purchase/lease of the
No of members using, and area of crops covered
Reduction in water usage per tonne of produce

Page 117 of 134
117
2. Measures aimed at reducing the environmental impact of water usage
Justification: contribute to water saving, or (in the case of 2.1) changing the seasonality of water abstraction in an environmentally beneficial way
Environmental actions Commitments Eligible expenditure Indicator Definition and measurement
equipment necessary to the preparation and implementation of the plan.
2.5. Transition from spray gun to drip irrigation;
- Installation of a drip irrigation system in replacement of spray gun irrigation system;
- Use of the new irrigation system as
intended.
Expenditure related to the investment made for the installation of the drip irrigation system in replacement of spray gun irrigation system
2.6. Improved irrigation systems, including purchase/lease of pumps, pipes and other equipment (irrigation installations resulting in net increases of water consumption are excluded)
- Installation of the improvements to the existing irrigation system;
- Use of the improved irrigation system
as intended;
Expenditure related to the investment or to the lease of the improvements installed to the existing irrigation system.

Page 118 of 134
118
3. Measures aimed at preventing emissions into air, water or soil
Justification: Contributing to maintain air, water and soil quality
Environmental actions Commitments Eligible expenditure Indicator Definition and measurement
3.1. Conversion to integrated production - Application of integrated production methods compliant with the requirements of the LEAF Marque, and the Gold Standard of Nature‟s Choice (Tesco‟s)
- Certification by a recognised
certification body (obligatory requirement not eligible for support) (*).
Requirements related to the duration of the action, as indicated in paragraphs 45 and 46, are applicable. (*) Integrated production certification
could be eligible for support under actions aimed at improving or maintaining product quality.
Additional costs and income foregone related to the conversion from the conventional production methods (compliant with the baseline/reference level requirements) to integrated production methods (compliant with the requirements of the LEAF scheme and/or other schemes to be specified) determined on a real cost basis. The calculation of the additional costs will take account of possible cost savings resulting from the action (e.g. reduced use of plant protection products, fertilisers and water) and, possible higher prices for products.
Reduction in liquid or gaseous emissions or in spray drift
Reduction in volume or environmental impact of liquid or gaseous emissions

Page 119 of 134
119
3. Measures aimed at preventing emissions into air, water or soil
Justification: Contributing to maintain air, water and soil quality
Environmental actions Commitments Eligible expenditure Indicator Definition and measurement
3.2. Conversion to organic production - Application of organic production methods compliant with the provisions of Council Regulation (EC) 2092/91 (of Council Regulation (EC) 834/2007 from 01/01/2009);
- Inscription to the national organic
production system, in accordance to Reg.(EC) 2092/91 and, from 01/01/08 2009, with of Reg. (EC) 834/2007 (obligatory requirement not eligible for support);
- Certification by a recognised organic
certification body (obligatory requirement not eligible for support) (*).
Requirements related to the duration of the action, as indicated in paragraphs 45 and 46, are applicable. (*) Organic certification could be eligible
for support under actions aimed at improving or maintaining product quality.
Additional costs and income foregone related to the conversion from the conventional production methods (compliant with the baseline/reference level requirements) to organic production methods (compliant with the provisions of Council Regulation (EC) 2092/91 or, from 01/01/2009, the provisions of Council Regulation (EC) 834/2007) determined on a real cost basis. The calculation of the additional costs will take account of possible cost savings resulting from the action (e.g. reduced use of plant protection products, fertilisers and water) and possible higher price for products.

Page 120 of 134
120
3. Measures aimed at preventing emissions into air, water or soil
Justification: Contributing to maintain air, water and soil quality
Environmental actions Commitments Eligible expenditure Indicator Definition and measurement
3.3 Reduction in use of fertilisers - Reduce the use of fertilisers so as to achieve the pre-defined minimum reduction target (*).
(*) As for agro-environmental measures
a minimum reduction target of 30% is applicable. National/regional authorities may define higher minimum target.
The reference level for the reduction is compliance with the minimum requirements for fertiliser use and other obligatory requirements concerning the use of fertilisers established by the national legislation, including the legislation transposing the Nitrate Directive (Dir. 91/676/EEC) and the Water Framework Directive (Directive 2000/60/EC). Requirements related to the duration of the action, as indicated in paragraphs 45 and 46, are applicable.
Additional costs and income foregone resulting from the action determined on a real cost basis. The calculation of the additional costs will take account of possible cost savings resulting from the action (e.g. reduced volume of fertilisers used, possible reduced costs for fertiliser distribution).
3.4. Reduction in use of plant protection products, including reductions in the use of fungicides, late harvest sprays and dipping agents via the
The reference level for the reduction is compliance with the minimum requirements for plant protection product use and other relevant obligatory
Additional costs and income foregone resulting from the action, determined on a real cost basis.

Page 121 of 134
121
3. Measures aimed at preventing emissions into air, water or soil
Justification: Contributing to maintain air, water and soil quality
Environmental actions Commitments Eligible expenditure Indicator Definition and measurement
use of storage processes and ripening regulators;
requirements concerning the use of plant protection products established by the national legislation, including the legislation transposing the Dir. 91/414/EEC). Requirements related to the duration of the action, as indicated in paragraphs 44 and 45, are applicable. Where a producer organisation wishes to use natural gases to control post harvest storage and shelf life of crops instead of recognised chemical treatments, the marginal extra costs of crop treatment can be claimed over and above drenching costs. The PO should indicate the active ingredients it wishes to remove from its crops and the PO should subsequently demonstrate via baseline and future crop residue tests a reduction in crop residues at the point of sale.
The calculation of the additional costs will take account of possible cost savings (e.g. reduced volume of plant protection products used, possible reduced costs for their distribution).and possible additional income (sale of products complying with marketing standards) resulting from the action.

Page 122 of 134
122
3. Measures aimed at preventing emissions into air, water or soil
Justification: Contributing to maintain air, water and soil quality
Environmental actions Commitments Eligible expenditure Indicator Definition and measurement
3.5. Reduction in use of plant protection products via new biological control methods
- Purchase and use of organic plant protection materials, such as pheromones and predators - Purchase and use of grafted-plants (on
tolerant/resistant varieties), where it can be reasonably be expected to result in a reduction in the use of plant protection products or soil disinfectants (*)
- Planting and cultivation of biocidal
crops, as well as companion planting, where it can be reasonably be expected to result in a reduction in the use of plant protection products (*)
Requirements related to the duration of the action, as indicated in paragraphs 45 and 46, are applicable. (*) Eligible crops and, where
appropriate, tolerant/resistant varieties concerned must be defined by reference to reputable, published scientific data. These data must also include clear indications of the types of plant protection products and soil disinfectant the use of which could be
Additional costs and income foregone resulting from the action, determined on a real cost basis. The calculation of the additional costs will take account of possible cost savings resulting from the action (e.g. reduced volume of plant protection products used, possible reduced costs for their distribution).

Page 123 of 134
123
3. Measures aimed at preventing emissions into air, water or soil
Justification: Contributing to maintain air, water and soil quality
Environmental actions Commitments Eligible expenditure Indicator Definition and measurement
reduced.
3.6. Reduction in use of plant protection products via the installation of fine-mesh crop protection netting;
- Purchase and installation of fine-mesh crop protection netting.
Expenditure related to the purchase and installation of fine-mesh crop protection netting.
3.7. Installations of waste water treatment systems, beyond compliance with legal mandatory requirements
- Installation of a waste water treatment system;
- Use of the installation as intended.
Expenditure related to the investment made on the waste water treatment system
3.8. Purchase/lease of equipment for control of the quality of waste water produced, where complementary to action 3.7.
- Purchase/lease of equipment for control of the quality of waste water produced;
- Use of the equipment as intended.
Expenditure related to the investment made or to the lease of the equipment.

Page 124 of 134
124
4. Measures aimed at the re-use of crop remains and/or other organic residues or at contributing to recovery of agricultural waste
Justification: Reduce waste and landfill
Environmental actions Commitments Eligible expenditure Indicator Definition and measurement
4.1. Composting - Putting in place of a composting installation proportionate to the volume of organic residues produced by the farmer or by the PO, and
- use and/or sale of the compost
produced
Expenditure related to the investment made on the composting installation
No of members benefiting;
Tonnes removed from landfill and, for anaerobic digestion, reduction in greenhouse gases (particularly methane) plus energy production
4.2. Actions in support to use and sale of the compost produced, where complementary to composting
- Purchase, or renting/leasing, of mushroom compost bagging machines;
- Use of the machines as intended. Only eligible where it contributes to wider objectives of producing re-usable compost for sale or for other use
Expenditure related to the investment made or to the renting/lease of the machines
4.3. Anaerobic digestion of PO crop residues which are not compostable
- Putting in place an anaerobic digestion installation;
- Use of the installation as intended. For eligibility for support, the installation must be linked to a PO facility and must be related to reduction and management of a PO‟s waste
Expenditure related to the investment made on the anaerobic digestion installation Eligible expenditure limited at 40% of costs

Page 125 of 134
125
4. Measures aimed at the re-use of crop remains and/or other organic residues or at contributing to recovery of agricultural waste
Justification: Reduce waste and landfill
Environmental actions Commitments Eligible expenditure Indicator Definition and measurement
4.4. Actions to help PO members to reuse spent growing mediums, and plant/crop remains
(a) Use of spent growing mediums as
soil improvers. (b) Use of plant/crop remains for
mulching
Additional costs and income foregone resulting from the action determined on a real cost basis. The calculation of the additional costs will take account of possible cost savings resulting from the action (e.g. reduced volume of fertilisers used, possible reduced costs for fertiliser distribution).
No of members benefiting
4.5. Actions to help PO members to dispose of spent growing mediums and/or plant/crop remains more sustainably
Spent mushroom compost bagged and marketed as peat replacement Separation of waste plastic material Use of glasshouse waste as a soil conditioner, or as biomass Eligibility is limited to commitments going beyond the mandatory requirements established by the national legislation waste.
Additional costs and income foregone resulting from the action determined on a real cost basis.

Page 126 of 134
126
4. Measures aimed at the re-use of crop remains and/or other organic residues or at contributing to recovery of agricultural waste
Justification: Reduce waste and landfill
Environmental actions Commitments Eligible expenditure Indicator Definition and measurement
4.6. Actions to contribute to recycling of agricultural plastics
- Plastic waste collection, sorting and transport to an authorised recycling institution
- Having a contract with an authorised
recycling institution (requirement not eligible for support)
Eligibility is limited to commitments going beyond the mandatory requirements established by the national legislation waste.
Additional costs resulting from the action determined on a real cost basis.
No of members benefiting
4.7. Other actions to help PO and/or its members to return incidental waste to a reuse or recycling stream, where complementary to environmental actions 4.4., 4.5 or 4.6.
- Establishing of a suitable place for the disposal of incidental waste;
- Purchase and use of equipment and
machinery for the storage and preliminary treatment of waste;
Eligibility is limited to commitments going beyond the mandatory requirements established by the national legislation waste.
Expenditure related to the investments made.

Page 127 of 134
127
5. Environmental management of packaging
Justification: Reduce waste and landfill
Environmental actions Commitments Eligible expenditure Indicator Definition and measurement
5.1. Introduction and use of new, lower environmental impact, packing materials );
- Purchase and use of new, lower environmental impact, packing materials (e.g. biodegradable plastics; certified wooden crates) (*)
- Introducing the infrastructure/
machinery to facilitate such change (*) Eligibility for support is limited to
packaging compliant with the essential requirements defined by the Directive 94/62/EC
Additional costs of the new packing material (*) Expenditure related to investments made on infrastructure/machinery (*) compared with the cost of
standard packaging compliant with the essential requirements defined by the Directive 94/62/EC
No of members using; times of use, no of journeys; cost savings in collection of packaging waste, and in costs of sorting and transportation to an authorised recycling institution
Tonnes and type of packaging used, increase in lifespan, tonnes of waste saved
5.2. Actions to contribute to recycling of recyclable packaging
- Use of recyclable packaging compliant with the essential requirements defined by the Directive 94/62/EC (requirement non eligible for support);
- Taking directly or indirectly charge of
activities contributing to recycling of recyclable packaging (such as collection, sorting and transport of the recyclable packaging waste to an authorised recycling installation).
Costs related to the collection, sorting and transport of the packaging waste to an authorised recycling installation, determined on a real cost basis.
5.3. Actions to contribute to improved re use of reusable packaging
- Use of reusable packaging compliant with the essential requirements defined by the Directive 94/62/EC (requirement non eligible for support);
Costs related to the collection, sorting, cleaning and transport of the reusable packaging for its further reuse determined

Page 128 of 134
128
5. Environmental management of packaging
Justification: Reduce waste and landfill
Environmental actions Commitments Eligible expenditure Indicator Definition and measurement
- Taking directly or indirectly charge of
activities contributing to reuse of reusable packaging (such as collection, sorting, cleaning and transport of the reusable packaging for its further reuse).
on a real cost basis.
5.4. Actions to reduce the volume of plastic packaging material used by means of heat-sealer machines
- Purchase of heat-sealer machines; - Use of the machines as intended.
- Expenditure related to the investment made.

Page 129 of 134
129
6. Measures aimed at protecting the landscape, natural habitats and biodiversity
Justification: Maintenance and/or improvement in biodiversity
Environmental actions Commitments Eligible expenditure Indicator Definition and measurement
6.1. Maintenance of uncultivated field margins, uncultivated areas for the encouragement of bumble bees, or beetle banks
- Maintenance of the uncultivated field margins, uncultivated areas for the encouragement of bumble bees, or beetle banks.
Requirements related to the duration of the action, as indicated in paragraphs 45 and 46, are applicable. Eligibility is limited to commitments going beyond the GAEC standards and other relevant mandatory requirements established by the national legislation.
Additional costs and income foregone resulting from the action determined on a real cost basis.
Species benefiting
Maintenance or increase of numbers of plant and animal species
6.2. Conversion of arable land into permanent pasture
- Converting arable land into permanent pasture.
Requirements related to the duration of the action, as indicated in paragraphs 44 and 45, are applicable. Eligibility is limited to commitments going beyond the GAEC standards and other relevant mandatory requirements established by the Community or national legislation.
Additional costs and income foregone resulting from the action determined on a real cost basis.

Page 130 of 134
130
7. Measures aimed at preventing soil erosion and promoting conservation of soils
Justification: Prevent soil blows and erosion
Environmental actions Commitments Eligible expenditure Indicator Definition and measurement
7.1. Actions to prevent soil erosion and promote conservation of soils
- Undertaking activities that contribute to preventing soil erosion and to soil conservation (e.g. mulching; maintenance of permanently vegetated areas, uncultivated contour belts; terrace building; adoption of specific conservation tillage practices; use of renewable products such as coir as an alternative to peat, as a measure to reduce pressure on endangered peatlands).
Requirements related to the duration of the action, as indicated in paragraphs 44 and 45, are applicable. Eligibility is limited to commitments going beyond the GAEC standards and other relevant mandatory requirements established by the national legislation. (Note: the eligibility of any of the actions selected under Measures No 6 and 7 may be affected by modifications to cross-compliance requirements resulting from the CAP Health Check)
Additional costs and income foregone resulting from the action, a “real costs” approach being applicable.
Areas and members benefiting

Page 131 of 134
131
7. Measures aimed at preventing soil erosion and promoting conservation of soils
Justification: Prevent soil blows and erosion
Environmental actions Commitments Eligible expenditure Indicator Definition and measurement
7.2. Acquisition of special equipment/machinery, where complementary and necessary to actions to prevent soil erosion and promote conservation of soils (8.1.)
- Purchase/lease of special equipment necessary to implementing actions aimed at preventing soil erosion and contributing to soil conservation (e.g. ridge tying equipment, bedforming and clod separation equipment to manage land on an annual basis, and equipment to flood fields pre-cropping)
- Use of that equipment as intended.
Expenditure related to the investments made or to the renting/lease of the equipment/machinery concerned

Page 132 of 134
132
General requirements for an environmental action selected under an operational programme EF41. The environmental actions selected under an operational programme must: – respect the requirements for agri-environmental payments set out in the first subparagraph of Article 39(3) of Regulation (EC) No 1698/2005, i.e. entail commitments going beyond the relevant baseline/reference level applicable, which includes:
(a) the relevant mandatory standards established pursuant to Articles 4 and 5 of and Annexes III and IV to Regulation (EC) No 1782/2003,
(b) the minimum requirements for fertiliser and plant protection product use established by national legislation, and
(c) other relevant mandatory requirements established by national legislation; – conform to this National Framework; – be compatible and complementary with the other environmental actions implemented under the operational programme and, where appropriate, with the agri-environmental commitments, supported under the relevant Rural Development programme, implemented by the members of the Producer Organisation. EF42. Where an operational programme entails the possibility of combining different environmental actions and/or where the environmental actions selected under the operational programme may be combined with agri-environmental measures supported under the Rural Development Programme(s) or Plan for the part(s) of the United Kingdom concerned, the level of support must take account of the specific income foregone and additional costs resulting from the combination. EF43. Support for the environmental actions selected under an operational programme, being intended to cover additional costs and income foregone resulting from the actions, will be subject to modification in cases where amendments are made to the relevant reference level (i.e., the set of standards beyond which an environmental commitment must go). Duration of environmental actions EF44. Normally the duration of an environmental action will be the same as the duration of the operational programme of which it forms part. However, in cases where an environmental action (other than involving investments) is similar to an agri-environmental measure included under the Rural Development Programmes in the different parts of the United Kingdom (e.g. landscape and habitat protection or soil protection) and where the duration is critical for the attainment of the expected environmental benefits, the duration which should apply will be the same as it applies to the similar agri-environmental measure concerned. EF45. Where the duration of the operational programme is shorter (2 or 3 years) than the duration referred to above, the PO will be required to continue the environmental action concerned in its subsequent operational programme, if this is necessary for attaining the duration applying for similar agri-environmental measures under the Rural Development Programmes, except for duly justified reasons, and in particular based on the results of the mid-term evaluation of the

Page 133 of 134
133
operational programme provided for in Article 127(3) of Commission Regulation (EC) No 1580/2007. EF46. Where appropriate, this requirement will also apply to other environmental actions included in the texts of the United Kingdom‟s framework for years subsequent to 2008. Several options for the same type of action EF47. For each of the measures indicated in paragraph 36, the Table following paragraph 40 indicates several possible options for environmental actions. In most cases any of these options may be combined under the same operational programme and jointly implemented by a PO‟s members. However, in some instances, two of the alternative options given for the same measure are likely to be sufficiently closely related to one another that they are regarded as incompatible, and hence would not both be eligible to be included in the same operational programme. EF48. Whether that situation will arise in practice will depend on the precise combination of specific commitments chosen by a PO to implement the actions in question in its proposal for an operational programme. The competent authority will indicate to the PO whether it has chosen mutually incompatible environmental actions. Complementary commitments in support to environmental actions EF49. Training, advice and/or technical assistance, if implemented alone, cannot generate direct environmental benefits. However, they can be essential for feasibility and effectiveness of certain environmental actions. The same may be said for other types of measures, such as energy/fuel review or audit, which can contribute to identification of needs, definition of priorities and design of relevant environmental actions to be implemented at the level of a PO or its members. A basic requirement for eligibility for support of these types of actions is, therefore, that they are implemented in connection with environmental actions that can be expected to generate direct environmental benefits. For eligibility for support, the following set of requirements must be met: a) The action is intended to complement (i.e. accompany and be associated with)
other environmental actions included in the National Framework, which must therefore be included in the operational programme of the PO, and is specifically targeted to reinforce the effects of these actions. The actions concerned must be specified in the operational programme of the PO.
b) The (technical assistance, advice, training, audit) activities must be entrusted to additional (internal or external) qualified personnel.
c) The operational programme must indicate the specific tasks that the additional qualified personnel are required to perform.

Page 134 of 134
134
Avoidance of double funding EF51. As regards the possible overlapping of environmental actions covered by this Framework with certain measures included in the United Kingdom's Rural Development Programmes, the criteria and administrative rules applied in the United Kingdom's Rural Development Programmes, aimed at ensuring that a beneficiary may receive support for a given operation only under one scheme, are covered in detail in other parts of the United Kingdom‟s National Strategy for sustainable operational programmes. (Section 3 refers).