EU dairy farms report 2012 - European...
188
EU dairy farms EU dairy farms report 2012 report 2012 based on FADN data based on FADN data
Transcript of EU dairy farms report 2012 - European...

EU dairy farms EU dairy farms report 2012 report 2012 based on FADN databased on FADN data
Europe Direct is a service to help you find answers to your questions about the European Union.Freephone number (*): 00 800 6 7 8 9 10 11(*) Certain mobile phone operators do not allow access to 00 800 numbers or these calls may be billed. More information on the European Union is available on the Internet (http://europa.eu).Cataloguing data can be found at the end of this publication.
© European Union, 2013. Reproduction is authorised, provided the source is acknowledged as ‘European Commission — EU FADN’, save where otherwise stated. Where prior permission must be obtained for reproduction, such permission shall cancel the above-mentioned general permission and shall clearly indicate any restrictions on use. When data/information are adapted or modified by the user, this shall be explicitly stated at a suitably prominent place in the work.
© cover photo: Alexander Bartovič
The text of this publication is for information purposes only and is not legally binding.

Commission européenne/EuropeseCommissie, 1049 Bruxelles/Brussel, BELGIQUE/BELGIË — Tel. +3222991111
EUROPEAN COMMISSION DIRECTORATE-GENERAL FOR AGRICULTURE AND RURAL DEVELOPMENT Directorate L. Economic analysis, perspectives and evaluations L.3. Microeconomic analysis of EU agricultural holdings
Brussels, April 2013
EU DAIRY FARMS REPORT 2012
Executive summary
This annual report provides an overview of EU dairy farms based on the latest available data from the
Farm Accountancy Data Network (FADN) for 2009.1 It provides trends in milk margin per tonne and in
income per work unit from 2001 to 2009, as well as estimates of milk gross margins for 2010 and 2011.
Since 2009 was the year of the milk crisis, its main focus is the analysis of the effects of the crisis.
The sample of milk specialised farms for 2009 represented 73 % of dairy cows and 78 % of milk
production in the 27 EU Member States (EU-27).
The price in 2009 was 17 % less than the average milk price in 2007 — a very good year. This, together
with only a small decline in cost of production, prompted the ‘milk crisis’. At EU-27 level, gross margin2
fell by 37 % from a peak in 2007 to 94 EUR/t (euros per tonne). It is estimated that gross margin should
return to its 2007 level by 2011. The impact of the crisis was felt differently in the respective EU groups
(see the graph below) due to variations in the fall in milk prices and in the way the groups adapted to the
situation.
Source: EU FADN — DG AGRI, Model of the allocation of milk costs.
The 10 countries that joined the EU in 2004 (EU-10) experienced the sharpest decline in gross margin (to
69 EUR/t — 43 % less than in 2007) due to a more severe cut in milk prices (-24 %), which could not be
fully offset by the decrease in operating costs (-10 %). In the 15 Member States that belonged to the EU
1 Report based on 2010 data will be available soon.
2 Gross margin = (milk price + coupled payments) — (feed, veterinary, energy costs and other operating costs). Decoupled payments,
progressively introduced from 2005, are not included in margins, but they are part of income.
0
50
100
150
200
250
2001 2002 2003 2004 2005 2006 2007 2008 2009 2010e 2011e
EUR/t
Trend in milk gross margin
EU-15 EU-10 EU-2 EU-27

EU Dairy farms report 2012
2
before 2004 (EU-15), the decrease in prices was less pronounced (-17 %), but the milk gross margin,
which was 36 % less than in 2007, fell below 100 EUR/t, its lowest level in the decade. In Bulgaria and
Romania (EU-2), the impact of the crisis seems to have been less severe, due largely to a more
proportional decrease in milk prices and feed costs. All in all, the proportion of specialised farms in the
EU-27 with a positive gross margin fell from 98 % in 2007 to 92 % in 2009.
This situation naturally had an impact on the income of milk specialised farms. After years of continuous
increase, average Farm Net Value Added per Annual Work Unit (FNVA/AWU) in the EU-27 decreased
to 16 333 EUR/AWU on average, 25 % lower than in 2007. Dairy specialised farms generally provide
higher incomes per AWU than other types of farming, but this was no longer the case in 2009 — for the
first time in years, their average income did not rank in the top three types of farming, although it
remained above the total average. As with gross margins, the income level varied among the EU groups,
with income being three to seven times higher in the EU-15 than in the EU-10 or EU-2, mainly due to
huge differences in farms size (see charts below).
Source: EU FADN — DG AGRI, ESTAT (HICP index EUR 2001).
The evolution of income also differed in the respective EU groups. After years of continuous increase in
the EU-10 and EU-15, income fell between 2007 and 2009 following the fall in margins (see graphs
below). The decrease was more marked in the EU-10 (43 % less than in 2007), owing to the drop in
margins and a decrease in average milk production on specialised farms, which was not offset by the
increase in direct payments and subsidies. However, these payments, even though they represented only
20 % of the total receipts in EU-10 in 2009, made up 73 % of the FNWA/AWU (at 5 558 EUR/AWU). In
the EU-15, direct payments and subsidies (of which 70 % were decoupled payments) were also a
crucial part of support income, as they represented 56 % of the FNVA/AWU, which in 2009 fell back to
its 2001 level in nominal terms (26 591 EUR/AWU). The situation was quite different in the EU-2 where,
in spite of the drop in prices, income increased in 2009, thanks to an increase in apparent labour
productivity (the average number of cows per farm increased in parallel with a decrease in the average
labour force per farm).
However, better prices are likely to lead to a recovery in the margins in 2010 and 2011 (to 2007 levels in
the EU-15, and above them in the EU-10 and EU-2), and therefore an increase in income.
0
20
40
60
80
100
120
140
160
2001 2002 2003 2004 2005 2006 2007 2008 2009
Index 2001 = 100
Income trend in nominal and real terms - EU milk specialised farms
EU 15 FNVA/AWU nominal EU 15 FNVA/AWU real EU 10 FNVA/AWU nominal
EU 10 FNVA/AWU real EU 2 FNVA/AWU nominal EU 2 FNVA/AWU real

EU Dairy farms report 2012
3
Source:
EU FADN — DG AGRI, Model of the allocation of milk costs.
EU average results conceal a wide range of situations at national and regional levels, as illustrated in the
report.
EU Dairy farms report 2012
4
Table of contents
1. INTRODUCTION ....................................................................................................... 6
2. MILK SPECIALISED FARMS IN THE EU .............................................................. 6
3. ANALYSIS OF MILK MARGINS ............................................................................ 9
3.1. Breakdown by EU group ................................................................................. 10
3.1.1. EU-27 ................................................................................................ 10
3.1.2. EU-15 ................................................................................................ 12
3.1.3. EU-10 ................................................................................................ 14
3.1.4. EU-2 .................................................................................................. 16
3.2. National level .................................................................................................. 17
3.2.1. EU-15 Member States ....................................................................... 17
3.2.2. EU-10 Member States ....................................................................... 19
3.2.3. EU-2 Member States ......................................................................... 22
4. INCOME ANALYSIS .............................................................................................. 24
4.1. Breakdown by EU groups ............................................................................... 24
4.1.1. EU-27 ................................................................................................ 24
4.1.2. EU-15 ................................................................................................ 28
4.1.3. EU-10 ................................................................................................ 29
4.1.4. EU-2 .................................................................................................. 31
4.2. National level .................................................................................................. 32
4.2.1. EU-15 Member States ....................................................................... 32
4.2.2. EU-10 Member States ....................................................................... 35
4.2.3. EU-2 Member States ......................................................................... 35

EU Dairy farms report 2012
5
Box 1: The Farm Accountancy Data Network (FADN)
The FADN3 is a European system of sample surveys that take place each year and collect
structural and accountancy data relating to farms; the aim is to monitor the income and
business activities of agricultural holdings and to evaluate the impacts of the Common
Agricultural Policy (CAP).
The FADN survey covers only those farms exceeding a minimum economic size (threshold)
so as to cover the most relevant part of the agricultural activity of each EU Member State, i.e.
at least 90 % of the Standard Gross Margin and 90 % of Utilised Agricultural Area covered in
the Farm Structure Survey (FSS, Eurostat). For 2009, the sample consists of approximately
78 000 holdings in the EU-27, which represent 5.4 million farms (39 %) out of a total of some
14 million farms included in the FSS.
The survey is intended to provide representative data in three dimensions: by region,
economic size and type of farming. The FADN is the only harmonised source of micro-
economic data, which means that the accounting principles are the same in all EU Member
States.
The most recent FADN data available for this report are for the 2009 accounting year; this is
because of the time needed to collect, check and correct the data of all the EU Member States.
The next edition of this report, using FADN data till 2010, is scheduled for later this year.
3For more information on FADN: http://ec.europa.eu/agriculture/rica/index.cfm .

EU Dairy farms report 2012
6
1. INTRODUCTION
This report provides an overview of EU dairy farms based on the latest available FADN
data, i.e. for 2009. Cost of production and gross margins for 2010 and 2011 are also
estimated. The main feature of the five-year period 2007-2011 has been the high level of
volatility in agriculture in general, and in the milk sector in particular. In 2007, producers
experienced a sharp increase in milk prices alongside a general boom in agricultural prices.
Input prices followed suit, albeit with a time lag and to a different extent. Producer prices then
fell dramatically in mid-2008 while input prices remained quite high, prompting the 2009
milk crisis. Milk prices recovered in 2010 and 2011.
This report provides an analysis of the economic situation of EU dairy farms, focusing on the
impact of the 2009 milk crisis. Chapter 2 describes the sample of milk specialised farms on
which the results presented in this report are based. The third section provides an analysis of
milk margin by EU group and Member State. The fourth section is dedicated to income
analysis at EU and national level. Detailed data by EU group, Member State and region are
provided in the Annex, together with explanations on the methodology.
2. MILK SPECIALISED FARMS IN THE EU
This study is based on farms mainly oriented towards milk production.4
In the FADN 2009, the sample is made up of 12 890 farms, representing 508 611 farms in the
EU-27; 55 % are in the EU-15, 22 % in the EU-10 and 24 % in the EU-2.
While the coverage of the sector is very high in most EU-15 Member States, it is generally
lower in other Member States. Farms in these Member States, particularly large farms in
Slovakia and the Czech Republic, diversify their activities a lot, so the proportion of
specialised farms is not high. The share of the sector covered by specialised farms in the
FADN is more than 80 % in the EU-15 and around 50 % in the EU-2 and EU-10. There are
big differences in coverage among Member States: only 17 % of milk production in Slovakia
and 19 % in the Czech Republic, but full production in Ireland and Finland.5 Globally, the
FADN sample covers 73 % of the dairy cows, and the margin and production costs are
valid for 78 % of EU-27 milk production.6
There are large differences among milk farms across the EU (Table 1). Farms in the EU-15
are in general much larger and have higher yields than in the EU-10 and EU-2. Milk
specialised farms in the EU-15 have 52 dairy cows on average, with a milk yield of
6 991 kg/cow, producing 364 t of milk per year, whereas in the EU-10 they have 17 dairy
cows, with a yield of 5 577 kg/cow, and produce 97 t of milk per year. Farm size is even lower
in the EU-2 where farms have 7 dairy cows on average, with a yield of 3 877 kg/cow, and
produce 27 t of milk per year. These data reflect the diversity of milk farm structures in the
EU-27, which are linked to the differences in natural potential and also in the social,
economic and regulatory context. In particular, the different national policies on milk quota
4 The main criteria used to define specialised milk farms is a share of milk sector higher than 50 % of the total output and coupled
subsidies (see methodology in Annex I). It enables reliable estimates of cost of production and margins to be obtained.
5 There is an overrepresentation in some Member States mainly because the representation was based on the last information available
when preparing the report — the Eurostat Farm Structure Survey 2007.
6 See also Table 2 and 3 in Annex I. The results for Cyprus are not displayed because the sample is too small.

EU Dairy farms report 2012
7
management are very likely to have had an impact on the level of restructuring within each
Member State.
Table 1: Structural information on milk specialised farms by Member State (2009)
Average specialised milk farms
FADN 2009 Forage area —
ha
Dairy cows —
LU
Total labour —
AWU
Share of family
labour — %
Milk yield — kg/cow
Milk production
/farm — tonnes
Milk output- €/tonne
Share of milk
production – as % of
sector
Belgium 41 54 1.64 98 % 6910 371 254 67 %
Denmark 95 123 2.23 53 % 8278 1020 302 91 %
Germany 49 51 1.92 77 % 7387 380 273 78 %
Greece 8 59 2.37 73 % 5713 336 387 58 %
Spain 19 38 1.56 94 % 6886 264 297 96 %
France 61 47 1.75 93 % 6501 308 297 78 %
Ireland 54 58 1.60 88 % 5126 297 229 106 %
Italy 24 44 1.87 81 % 6548 286 382 81 %
Luxembourg 67 45 1.64 92 % 7290 330 265 64 %
The Netherlands 45 76 1.66 92 % 7881 603 282 95 %
Austria 28 20 1.68 98 % 6616 133 299 63 %
Portugal 15 25 1.65 86 % 7052 179 281 64 %
Finland 31 25 2.01 91 % 8447 210 391 115 %
Sweden 75 57 2.08 76 % 8048 462 274 99 %
The United Kingdom 100 117 2.56 63 % 7116 836 263 95 %
EU 15 47 52 1.84 84 % 6991 364 291 85 %
Cyprus . . . . . . . .
The Czech Republic 149 81 8.39 20 % 6532 528 244 19 %
Estonia 146 63 5.32 26 % 7199 451 206 89 %
Hungary 42 37 3.16 34 % 6645 248 235 50 %
Lithuania 31 18 2.02 80 % 5344 96 191 44 %
Latvia 43 16 2.07 69 % 5435 89 184 64 %
Malta 6 68 2.56 86 % 5457 369 435 88 %
Poland 13 15 1.87 95 % 5340 80 207 54 %
Slovakia 618 207 28.71 4 % 5877 1215 233 17 %
Slovenia 14 15 2.03 99 % 5245 77 262 66 %
EU 10 20 17 2.08 83 % 5577 97 214 48 %
Bulgaria 8 12 2.12 64 % 3696 45 234 52 %
Romania 3 6 1.76 89 % 3917 25 282 57 %
EU2 4 7 1.79 87 % 3877 27 274 56 %
EU27 31 34 1.88 85 % 6686 227 284 78 %
Source: EU FADN, Eurostat production statistics — treatment DG AGRI.: data are not displayed, fewer than 15 farms in the
sample.

EU Dairy farms report 2012
8
Box 2: Impact of the volatility of milk prices on the results: the case of Spain
When comparing results from one year to another, the sample, or ‘population’ of milk
specialised farms for which results are provided, may vary.
The main factor of change in the observed population is the specialisation rate, i.e. the share
of milk output and subsidies in total output and coupled subsidies. The milk output (quantity
of milk x price of milk) is sensitive to the relative price of milk and other products of the
farm. When agricultural prices are stable, so is the specialisation rate. But in the last few
years, the volatility of milk and other agricultural prices has meant that a farm which was
considered specialised in a given year could not belong to the ‘population’ of observed farms
the next year, and vice versa. For example, in 2007, milk prices were very high, and the share
of milk output and subsidies of total output and coupled subsidies may have increased if the
output of the other activities of the farms remained stable or decreased. This in turn means
that many more farms would qualify as ‘specialised dairy farms’.
This happened in Spain for example. In 2007, farms smaller than 8 ESU7 (small farms)
represented 25 % of all milk specialised farms, whereas their share was around 10 % in a
‘normal year’ and 0 % in 2009, while the share of farms of other size classes remained more
or less stable. This naturally had an impact on the average results: for example, the average
number of dairy cows per farm decreased from around 37 in previous years to 31 in 2007. As
these small farms represent a very small proportion of the total production of milk by
specialised farms (3 % in 2007, around 2 % in a ‘normal’ year), this had an impact on the
average milk production per farm — average milk production on specialised farms in Spain
was 217 t in 2007, against 264 t in 2009. If small farms had been excluded from the sample,
the average milk production per farm would have been 280 t per farm in 2007, and the trend
between 2007 and 2009 more in line with that at macro level. Consequently, a direct
comparison of the 2007 and 2009 results for Spain is not fully suitable. It should be noted that
due to different agricultural situations, volatility has greater consequences for the EU-10,
making comparisons over time more difficult for this EU group and for some of its Member
States.
Solutions to mitigate such effects will be explored in the next editions of this report.
Besides, it should be noted that technical changes in selection plans (e.g. clustering rules) can
sometimes also have an impact on the global picture. That was the case in Hungary, for
example.
7 ESU: Economic size unit. See FADN website.

EU Dairy farms report 2012
9
3. ANALYSIS OF MILK MARGINS
This chapter highlights the main results for revenues, costs and margins of dairy activity,
which are presented in terms of current euros per tonne (EUR/t) of milk produced. It focuses
on the impact of the crisis on dairy activity, by comparing, where possible (see Box 3), the
results for 2007 with those for 2009.8 The tables in Annex II show the detailed results by EU
group, Member State and region.
Three different margin indicators are studied.9 The gross margin (over operating costs) is
generally used when making comparisons with alternative types of production (labour, land
and capital costs still have to be paid, whichever type of production is chosen). The net
margin (before own factors) is calculated as the gross margin minus depreciation and external
factors (wages, rent, interest paid). The net economic margin allows assessment of the
residual revenue (profit or loss) obtained from production, after remuneration of all
production factors including imputed family factors (opportunity costs for family factors).
The method is summarised in Box 3 and detailed in Annex I.
Box 3: Summary of the method
The FADN database contains information about output and subsidies per product, but as far
as costs are concerned it only provides information relating to the farm as a whole. Hence, the
direct contribution of each enterprise to the farm income is not available, which means that
the cost of production by product have to be estimated. The EU FADN unit has built several
models to estimate costs and margins for the different products: arable crops, milk and beef,
and permanent crops. These models allocate farm costs to a particular product using different
ratios. Annex I gives details of the model for estimating milk cost of production and margins
which is used in this analysis (see Methodology 1).
Since 2008, imputed costs for unpaid family factors have been estimated (family labour costs
and own capital costs). The aim is to enable a comparison to be made between Member States
with different structures in terms of labour (share of family and paid labour), land
(rented/owned) and capital. The methodology for estimating the opportunity costs of family
labour, land and capital is explained in Annex I (see Methodology 2).
The output, operating costs and gross margin (over operating costs) for 2010 and 2011 are
estimated on the basis of milk prices, milk yield indices and input price indices. It is assumed
that structures remain unchanged (e.g. the number of cows remains the same), but a change in
milk production resulting from a change in average yield per cow is taken into consideration.
The sources of the indices used are the following:
- for the milk price: the Commission’s Directorate-General for Agriculture (DG AGRI)
- for milk yield and input prices: Eurostat databases (agricultural production, agricultural
prices and price indices).
8 Due to very good prices for milk, 2007 may not be the most reliable base year for comparison; however, it is the first one for which we
have data at EU-27 level, thus allowing comparisons to be made between EU groups.
9 For a detailed definition of the margins and costs presented, please refer to the description of the milk model in Annex I.

EU Dairy farms report 2012
10
3.1. Breakdown by EU group
3.1.1. EU-27
The milk gross margin fell by 37 % between 2007 and 2009 due to a 17 % decrease in milk
prices, but the margin is expected to recover by 2011 thanks to higher milk prices
compensating for an increase in operating costs.
At EU-27 level, the operating costs for milk production consist mainly of feed costs (around
50 % of operating costs, two-thirds of which are for purchased feed and 1/3 for home-grown
feed) together with energy, machinery and building upkeep and contract work, each
representing a little less than 10 % of operating costs. Since the decoupling of direct support,
revenues from milk have depended mostly on the price and the quantity produced. In the short
term, gross margin is therefore mainly influenced by the milk price and feed costs.
Between 2007 and 2009, the average price for milk fell by 17 % owing to an increase in
production while operating costs per tonne remained stable.10
As a consequence, the average
milk gross margin fell by 37 % to 94 EUR/t (Figure 1). However, thanks to higher milk
prices, which more than compensated for the increase in operating costs, 2010 and 2011 saw a
recovery in gross margin, which is expected to return to its 2007 level in 2011. In 2007, 98 %
of milk specialised farms had a positive gross margin. By 2009, this figure has fallen by 6
percentage points, but should have almost recovered by 2011 (97 % of specialised dairy
farms).
Following the fall in gross margin, the average net margin (gross margin minus depreciation
and external factors, both of which remained mostly unchanged) fell sevenfold between 2007
and 2009 to 9 EUR/t. After deducting opportunity costs for family labour and capital, we
obtain the net economic margin, which plunged from -23 EUR/t to -85 EUR/t between these
two years. As long as imputed family labour costs remained stable, the opportunity costs for
own capital doubled, mostly due to a steep increase in the real interest rate.11
Yet the main
driver here too is the decrease in milk price. The negative net economic margin means that
on average farmers do not obtain what could be considered an adequate remuneration
for their own labour and capital. In 2009, only 13 % of EU-27 specialised dairy farms
had a positive net economic margin (29 % in a good year such as 2007). Given the trend in
gross margin, net economic margin should improve in 2010 and 2011.
10 Operating costs were lower than in 2008, thanks to lower feed costs, but not low enough to compensate for the fall in the milk price.
11 See Methodology 2 for further explanation. The ‘real interest rate’ used to calculate own capital unpaid costs corresponds roughly to
the difference between the long-term interest rate and inflation. In contrast to previous years, inflation in most Members States,
especially in the EU-10, fell considerably, even approaching zero in 2009. As a consequence, the real interest rate rose considerably
that year, causing own capital unpaid costs to rise abruptly. These costs are only estimates, however, and should be interpreted with
caution.

EU Dairy farms report 2012
11
Figure 1: Trend in milk cost of production and margins, EU-27
Source: EU FADN — DG AGRI, Model of the allocation of costs for milk.

EU Dairy farms report 2012
12
3.1.2. EU-15
Trends in the EU-15 were similar to those in the EU-27.
In 2009, the average gross margin in the EU-15 fell below 100 EUR/t to 95 EUR/t, its
lowest level in a decade (see Figure 5), and 36 % lower than in 2007. In the EU-27, the
decrease in milk prices between these two years (-17 % to 291 EUR/t) was the main driver of
this drop, since operating costs per tonne remained fairly stable. The impact on specialised
farms was noticeable, with the percentage of farms with a positive gross margin falling from
98 % to 93 %. Here again, thanks to an increase in milk prices, the average milk gross margin
in the EU-15 is expected to recover to its level of 2007 by 2011.
Given that depreciation and external factor costs per tonne remained stable, net margin also
fell abruptly in 2009 (following the fall in gross margin) to 7 EUR/t with coupled payments.
This was by far the lowest level in the decade. Due to the rise in the real interest rate,
opportunity costs for own capital increased abruptly in 2009 (Figure 4) whereas opportunity
costs for family labour per tonne remained nearly unchanged. Indeed, apparent labour
productivity (milk production per AWU) kept on increasing in 2009 (Figure 2), which offset
the limited gain in imputed wage for family labour (Figure 3). As a result, net economic
margin fell too, and in 2009 only 10 % of EU-15 specialised dairy farms had a positive net
economic margin (28 % in a good year such as 2007).
Figure 2: Apparent labour productivity
Figure 3: Imputed wage for family labour
Source: EU FADN — DG AGRI, Model of the allocation of costs for milk.
Figure 4: Opportunity costs for own capital and real interest rate
Source: EU FADN — DG AGRI.

EU Dairy farms report 2012
13
Figure 5: Trend in milk cost of production and margins, EU-15
Source: EU FADN — DG AGRI, Model of the allocation of costs for milk.

EU Dairy farms report 2012
14
3.1.3. EU-10
The EU-10 were more severely hit by the milk crisis despite a cut in their operating costs,
but the increase in prices is expected to bring the gross margin in 2011 to its highest level
since 2004.
The EU-10 were more severely hit by the milk crisis than the EU-15. Milk prices (214 €/t
in 2009) decreased on average by 24 % compared to 2007, causing gross margin per tonne to
fall to 69 EUR/t (Figure 6), despite a genuine cut in the operating costs per tonne (mainly
feed costs), as the average milk production per farm decreased on specialised farms (from 102
to 97 t/farm). In 2009, 87 % of EU-10 specialised dairy farms had a positive gross margin.12
However, thanks to improving milk prices, gross margin is expected to recover as from 2010,
to reach its highest level since 2004 in 2011 of 133 EUR/t on average.
Figure 6: Trend in milk cost of production and margins, EU-10
Source: EU FADN — DG AGRI, Model of the allocation of costs for milk.
12 Because of the milk price volatility between 2007 and 2009, and due to the farm structure in the EU-10, a direct comparison of 2007
and 2009 may not be fully possible, as in some EU-10 Member States, the population of ‘specialised dairy farms’ has changed (see
Box 2). For example, the average production per farm increased (from 59 to 62 t/farm) when all the farms (specialised and non-
specialised) are taken into consideration.
EU Dairy farms report 2012
15
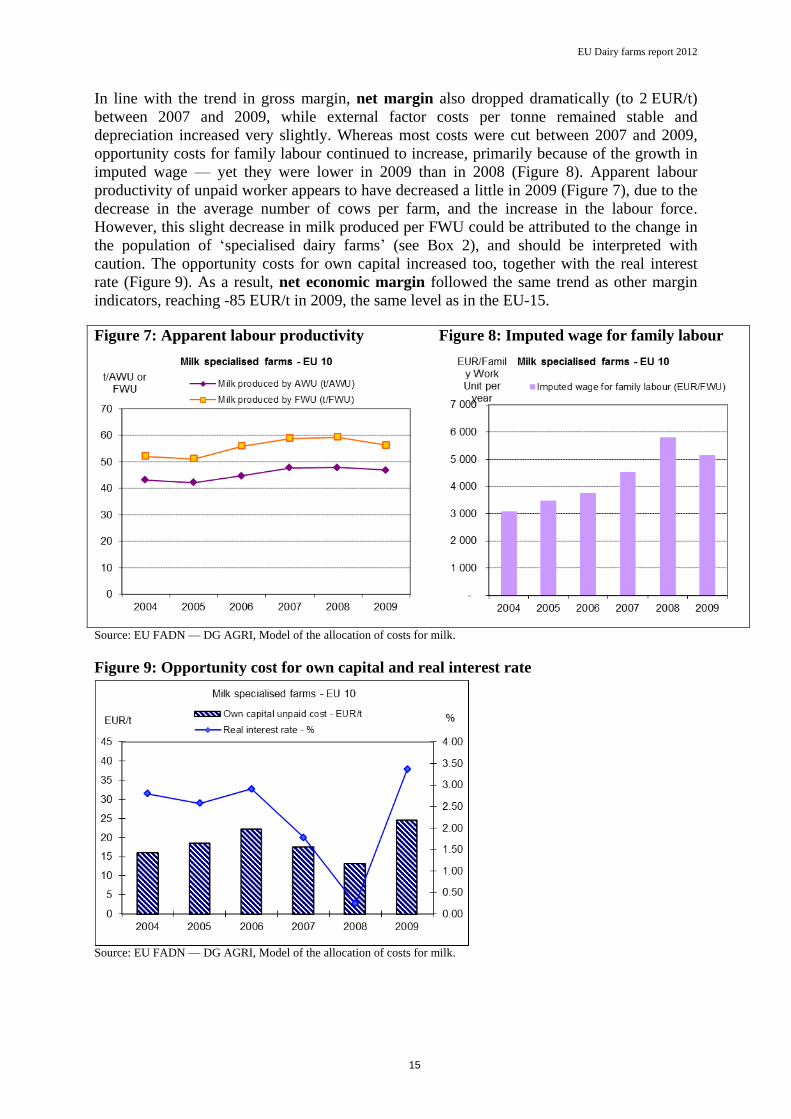
In line with the trend in gross margin, net margin also dropped dramatically (to 2 EUR/t)
between 2007 and 2009, while external factor costs per tonne remained stable and
depreciation increased very slightly. Whereas most costs were cut between 2007 and 2009,
opportunity costs for family labour continued to increase, primarily because of the growth in
imputed wage — yet they were lower in 2009 than in 2008 (Figure 8). Apparent labour
productivity of unpaid worker appears to have decreased a little in 2009 (Figure 7), due to the
decrease in the average number of cows per farm, and the increase in the labour force.
However, this slight decrease in milk produced per FWU could be attributed to the change in
the population of ‘specialised dairy farms’ (see Box 2), and should be interpreted with
caution. The opportunity costs for own capital increased too, together with the real interest
rate (Figure 9). As a result, net economic margin followed the same trend as other margin
indicators, reaching -85 EUR/t in 2009, the same level as in the EU-15.
Figure 7: Apparent labour productivity
Figure 8: Imputed wage for family labour
Source: EU FADN — DG AGRI, Model of the allocation of costs for milk.
Figure 9: Opportunity cost for own capital and real interest rate
Source: EU FADN — DG AGRI, Model of the allocation of costs for milk.

EU Dairy farms report 2012
16
3.1.4. EU-2
The EU-2 was also affected by the crisis but to a lesser extent thanks to a significant
increase in production.
Milk prices, despite a fall, remained high, while operating costs per tonne, which were already
low, decreased. As a result, the average gross margin in the EU-2 for 2009 was 147 EUR/t
(Figure 10), which is significantly higher than in the other EU groups, and 94 % of EU-2
specialised dairy farms had a positive gross margin. Depreciation increased slightly but
remained quite low compared to the other EU groups, and external factor costs per tonne
remained stable. This meant that the net margin, despite narrowing following the fall in gross
margin, remained very high, at 91 EUR/t. The net economic margin, however, fell steeply in
2009, even though family labour costs fell quite considerably due to an increase in apparent
labour productivity. Indeed milk production per FWU may have increased steeply between
2007 and 2009, thanks to a parallel rise in the average number of dairy cows and decline in
the number of FWU. This increase in productivity more than compensated for the increase in
imputed wage (+13 %). Yet these family labour costs remain extremely high compared to
the other EU groups, due to the small average size of the herd.
Figure 10: Trend in milk cost of production and margins, EU-213
Source: EU FADN — DG AGRI, Model of the allocation of costs for milk.
13 In view of the problems recording the labour force in Romania for 2008, and its weight in the EU-2 aggregate, results for this year are
(temporarily) not displayed. Generally speaking, as Bulgaria and Romania are still in the process of implementing their sample,
comparisons over time may not be fully reliable. However, results are becoming increasingly representative.

EU Dairy farms report 2012
17
3.2. National level
The 2009 milk crisis was felt differently across the EU. This section analyses the effects of
the crisis, based on trends in costs and margins in the Member States provided in Annex II.
3.2.1. EU-15 Member States
Ireland was the EU-15 Member State most affected by the crisis, with a fall of 63 % in the
gross margin and 16 % in the number of specialised dairy farms with a positive gross margin
compared to 2007. Following a 29 % fall in milk price (the biggest in the EU-15, and the
lowest milk price), and stable operating costs, the Irish average gross margin fell to 58 EUR/t.
The situation was worse only in Sweden, where the average gross margin was 53 EUR/t and
where only 80 % of the specialised dairy farms had a positive gross margin in 2009, despite a
less dramatic decrease in prices (-15 %). However, because of high feed costs, Sweden
generally has quite a low gross margin compared to the EU-15 average. By contrast, the gross
margin in Italy remained the highest of the EU-15 (196 EUR/t), thanks to high value added
products with high prices and limited costs. The average gross margin remained high in
Finland (162 EUR/t), despite having the highest costs in the EU-15, owing to the very high
milk price, which increased, and significant coupled national aid.
Between these two extremes, Member States can be split into three groups with respect to the
impact of the crisis on their gross margins. In Denmark, Luxembourg, the Netherlands,
Germany and Belgium, the fall in gross margin between 2007 and 2009 was around 50 %. In
Sweden, Spain, France, the United Kingdom and Austria, the decrease was between 25 % and
40 %, while Portugal fared rather well with a decrease of 11 %. This was mostly driven by the
fall in milk prices, except in the case of Denmark, where the fall in price was fairly limited (-
10 %), but where there was a huge increase in operating costs (+19 %), possibly due to the
increase in forage area (+18 %). Germany and France, the two major EU producers
(combined production of 37 % of EU-27), had an average gross margin of 81 EUR/t, which
was below the EU-27 average of 95 EUR/t. It is worth noting, however, that German data
correspond to the campaign year (July 2009 to June 2010) whereas the data for the other
Member States is for the calendar year (January to December 2009). Therefore, the effects of
the fall in prices in 2009 have already been incorporated in the German results for the
accounting year 2008, while the 2009 results already take into account the recovery in milk
prices that took place in 2010.
Not surprisingly, the average net margin also fell. It was particularly low (-114 EUR/t) in
Denmark, due to very high financial charges14
and high wages — family labour force
represents only 53 % of the total labour force in Denmark. Net margin was positive in only
seven Member States in 2009 due to the fall in prices (see Figure 11).
14 Substantial investment has taken place in Denmark over the last decade, and the average debt per farm is high. Together with the
Netherlands, it usually has the highest average interest costs. In Denmark, however, the financial charges are also very high due to the
choice of instruments for financing the modernisation, which proved to be ‘toxic’ in light of the financial crisis: they increased steeply
in 2008, reaching 86 EUR/t in 2009. (For more information see, for example, ‘Les modèles laitiers du nord de l’Union européenne à
l’épreuve de la volatilité’, Institut de l’élevage, 2012).

EU Dairy farms report 2012
18
Figure 11: Milk cost of production and margins in the EU-15 Member States, 2009

EU Dairy farms report 2012
19
Source: EU FADN — DG AGRI, Model of the allocation of costs for milk.
After deduction of all costs (imputed own factors), the resulting average net economic
margin was positive only in Italy (8 EUR/t). Net economic margin was particularly negative
in Finland (-229 EUR/t), due to very high family labour costs of 214 EUR/t (high level of
wages). Opportunity costs for own capital15
were high in Austria (74 EUR/t) and Ireland
(71 EUR/t), however they pay relatively little in interest charges. By contrast, they were very
low in Belgium (13 EUR/t), France (13 EUR/t), Denmark (8 EUR/t), Sweden (6 EUR/t), and
the United Kingdom (10 EUR/t). In the United Kingdom, interest charges are also quite low,
which could indicate a reduced level of investment in the dairy activity.
According to the estimates, the situation in terms of gross margins should have greatly
improved in most EU-15 Member States by 2011, with the exception of Portugal and Sweden
where the improvement in milk prices may not fully offset higher feed and energy costs.
3.2.2. EU-10 Member States
The situation in the EU-10 Member States was different. In Malta, there was virtually no
crisis as, on average, the gross margin increased by 13 % between 2007 and 2009 to reach
96 EUR/t, just above the EU-27 average. Indeed, the price paid to milk producers increased
steeply in 2008, and despite a slight decrease in 2009, it remained very high (435 EUR/t),
which more than offset the increase in operating costs. In other EU-10 Member States, where
it is more difficult to make comparisons between 2007 and 2009, the situation was less
favourable. It was particularly bad in Slovakia, where the average gross margin was negative
(-81 EUR/t), due in part to very high other direct input costs.16
In Latvia and Slovenia, where
falls in milk prices were respectively the greatest (-31 %) and least (-5 %), the decrease in
15 The opportunity cost for own capital corresponds to the interest the farmer would get from putting the money in the bank instead of
investing in agriculture.
16 Slovakian milk specialised farms are few and very big (on average 207 dairy cows and 618 ha of fodder area); they rely heavily on paid
labour and very little on unpaid labour (they are cooperatives or companies), and may produce a significant amount of other products
(they are not very specialised). Therefore it is difficult to allocate non-specific costs properly and the Slovakian estimates should be
interpreted with caution. Besides, it seems that there was a break in the time series (from 2008) with regards to the registration of other
farming overheads, which may account for a significant part of the change.

EU Dairy farms report 2012
20
gross margin with coupled payments was almost the same (-36 % and -32 % respectively). In
Latvia (-68 %), the situation would have been much worse without the grant of national
coupled aid. It seems that in most EU-10 Member States, specialised farms decreased
their milk production and cut their operating costs per tonne, but this was not enough to
compensate for the marked drop in the milk price. As a result, the gross margin was
halved in the Czech Republic and Hungary, which also had low gross margins (34 and 28
EUR/t). The decrease was slightly less in Poland (the main EU-10 producer), Lithuania (both
80 EUR/t) and Estonia (56 EUR/t). In Lithuania, the percentage of farms with a positive gross
margin remained very high (95 %), which was not the case in the other Member States.
However, according to estimates, all EU-10 Member States should have more than
recovered to their 2007 levels by 2011 in terms of gross margin (except Poland, where only
gross margin is expected to recover).
In line with the trend in gross margin, net margins decreased in all EU-10 countries with the
exception of Malta. In 2009, net margins (without coupled payments) were positive in only
three EU-10 countries: Lithuania, Malta and Poland. They ranged between 40 EUR/t (Malta)
and -318 EUR/t (Slovakia), where depreciation and wages constituted very high costs.
Generally speaking, depreciation in the EU-10 Member States stands at around the EU-27
average (46 EUR/t), but is highest in the very large farms of Slovakia (84 EUR/t) and the very
small farms of Slovenia (86 EUR/t). Such a high level in Slovenia may be surprising, but it is
nearly the same level as in neighbouring Austria.
Slovenia’s ranking dropped in terms of net economic margin (-219 EUR/t), due to significant
imputed family labour costs. Family labour represents 99 % of the labour force in Slovenia,
which is quite unusual in the EU-10 Member States. In 2009, the average net economic
margin was negative in all EU-10 Member States.
Figure 12: Milk cost of production and margins in the EU-10 Member States, 2009

EU Dairy farms report 2012
21
Source: EU FADN — DG AGRI, Model of the allocation of costs for milk.

EU Dairy farms report 2012
22
3.2.3. EU-2 Member States
Bulgaria and Romania fared quite differently, due to different structures in terms of cost of
production. Romanian milk specialised farms receive a fairly high price for milk
(282 EUR/t),17
supplemented by coupled national aid (9 EUR/t), which brings their milk
revenues up to the EU-15 average. At the same time, their average operating costs are among
the lowest in the EU-27 (on the same level as Poland, with feed, in particular, being cheaper
in Romania). Due to these factors, Romanian milk specialised farms had an excellent gross
margin (165 EUR/t in 2009, second only to Italy in the EU-27), despite the decrease in the
milk price. The percentage of specialised farms with a positive gross margin remained at
97 %, probably thanks to a 9 % cut in operating costs. By contrast, in Bulgaria, operating costs
(mainly other direct inputs) increased, which caused the gross margin to go down to
60 EUR/t, while the percentage of farms with a positive gross margin fell by 23 percentage
points (to 74 %).
The gap between Bulgarian and Romanian net margins is similar to that between gross
margins (the difference between the two is around 100 EUR/t). Bulgarian net margins are
only positive thanks to national coupled payments (8 EUR/t).
However, due to the presence of many very small farms in the sample, the opportunity costs
for family labour and own capital are much higher in Romania (155 EUR/t) than in Bulgaria
(66 EUR/t), and therefore the difference in net economic margin between these two
countries is much lower (13 EUR/t). As in most of the other Member States, net economic
margin was negative in these two countries.
17 For various reasons, milk prices in Romania are currently under further review. Producers around Bucharest appear to get extremely
high prices (around 600 EUR/t), and there also seem to be two prices for milk, which is possibly linked to the production of high
quality (buffalo?) milk in some regions. Besides, Romanian non-specialised milk farms receive a much lower price for their milk. One
explanation could be the considerable difference in the quality of the milk provided by specialised and non-specialised farms in this
country.

EU Dairy farms report 2012
23
Figure 13: Milk cost of production and margins in the EU-2 Member States, 2009
Source: EU FADN — DG AGRI, Model of the allocation of costs for milk.

EU Dairy farms report 2012
24
4. INCOME ANALYSIS
As shown above, on average, the margins of the dairy activity on dairy specialised farms
dropped in 2009. This chapter focuses on the effects on the income of dairy specialised farms
at the level of the whole farm, therefore also incorporating the results of other activities that
may be carried on the farm. The following income indicators are studied:
– Farm Net Value Added (FNVA) equals total output (total production value), plus direct
payments minus intermediate consumption and depreciation. It represents the amount
available to remunerate all fixed production factors (land, labour and capital), either owned
by the farm or external.
– Farm Net Income (FNI) equals FNVA minus external factors, plus balance on subsidies
and taxes on investments. It is the amount available to remunerate family factors (labour,
land and capital).
– Remuneration of Family Labour (RFL) is calculated only for family farms.18
It equals FNI
minus the opportunity cost for own capital. It represents the amount available to
remunerate family labour.
These indicators are expressed per Annual Work Unit (AWU), for FNVA and FNI, or per
Family Work Unit (FWU) for RFL, to take account of the differences in the labour force
remunerated on the holding. All income indicators are calculated before deduction of income
taxes and expressed in current euros unless otherwise stated. Detailed tables are presented in
Annex II.
4.1. Breakdown by EU groups
4.1.1. EU-27
In 2009, contrary to previous years, the average income of dairy specialised farms did not
rank in the top three types of farming.
In line with the negative trend in the margin indicators (Figure 14), income indicators for milk
specialised farms in the EU-27 fell between 2007 and 2009. Farm net value added decreased
by 25 % to 16 333 EUR/AWU, farm net income decreased by 38 %, while the remuneration of
family labour was halved (7 389 EUR/FWU on average).
18 For the purpose of this report, ‘family farms’ are defined as farms employing an unpaid labour force, which usually corresponds to a
family labour force.

EU Dairy farms report 2012
25
Figure 14: Trend in income of milk specialised farms, EU-27
Source: EU FADN — DG AGRI, Model of the allocation of costs for milk.
Figure 15 shows the great differences in income between the EU groups. Compared to 2008,
the gap in the FNVA/AWU widened between the EU-15 and EU-10, whereas it narrowed
between the EU-12 and the EU-2, where the FNVA/AWU remains eight times lower than in
the EU-15.
Figure 15: Income of milk specialised farms by EU group, 2009
Source: EU FADN — DG AGRI, Model of the allocation of costs for milk.
As illustrated by Figure 16, the differences in income between the EU groups have more to do
with differences in farm size than in margin per tonne. Since the decoupling of direct

EU Dairy farms report 2012
26
payments, these are no longer included in the gross margin but are part of income. Due to the
drop in milk revenues, the share of direct payments and subsidies (first and second pillars, EU
and national) in the FNVA/AWU increased. The proportion of direct payments in 2009 was,
on average, 56 % in the EU-15, 72 % in the EU-10 and 25 % in the EU-2, where direct support
is still being phased in.
Figure 16: FNVA/AWU and some variables by EU group, 2009
Source: EU FADN — DG AGRI, Model of the allocation of costs for milk.
In 2009, milk specialised farms still showed results above the EU-27 total average across all
types of farming, despite the drop in their income. Yet, contrary to the previous years, they
were no longer in the top three of types of farming for income (Figure 17). They ranked
fourth after Granivores, Wine and Horticulture farms for FNVA/AWU, and fourth also for
FNI/AWU after Granivores, Wine and Other grazing livestock farms. However, they plunged
to sixth position for RFL/FWU, putting them just above the EU-27 average at 7 389
EUR/FWU. Therefore on average for the EU-27, in 2009, milk specialised farms were worse
off in terms of income than other types of farming.

EU Dairy farms report 2012
27
Figure 17: Comparison of the income of milk farms with other farms, EU-27, 2009
Source: EU FADN — DG AGRI, Model of the allocation of costs for milk.

EU Dairy farms report 2012
28
4.1.2. EU-15
In real terms, in 2009, the income of milk specialised farms of EU-15 fell below its 2001
level.
In the EU-15, the income of milk specialised farms increased significantly between 2001 and
2007 in both nominal and real terms (Figure 19). In 2008 income was still above the 2006
figure (in both in nominal and real terms), but in 2009 it plunged to its 2001 level in nominal
terms (26 591 EUR/AWU) and 14 points below it in real terms.
Figure 18: Income trends in nominal and real terms, EU-15
Source: EU FADN — DG AGRI, ESTAT (HICP index EUR 2001).
This steep drop had a more pronounced effect on the remuneration of family labour than on
other income indicators (Figure 19), partly due to the increase in the imputed remuneration of
own capital (see footnote 11). The percentage of farms with a positive remuneration of family
labour fell from 93 % in 2007 to 73 % in 2009. Following the decoupling of direct payments
and subsidies, the trend in margin has mirrored the trend in income.

EU Dairy farms report 2012
29
Figure 19: Trend in income of milk specialised farms, EU-15
Source: EU FADN — DG AGRI, Model of the allocation of costs for milk.
4.1.3. EU-10
In the EU-10, the income of milk specialised farms in 2009 fell below the 2004 level, even
in nominal terms.
The income of milk specialised farms in the EU-10 similarly experienced a steep drop from
2007 onwards (Figure 21), falling back to its 2004 level in nominal terms and to 80 % of its
2004 level in real terms.

EU Dairy farms report 2012
30
Figure 20: Income trends in nominal and real terms, EU-10
Source: EU FADN — DG AGRI, ESTAT (HICP index EUR 2001).
In the EU-10, the decrease in total output was the same as the decrease in milk revenues due
to a decline in production. The fall in the FNVA/AWU (-43 %) between 2007 and 2009
mirrored the drop in the gross margin per tonne, despite an increase in decoupled payments,
which were essential to support income (Figure 21). Farm net income and remuneration of
family labour were also halved between 2007 and 2009, while remuneration of family labour
was positive in 76 % of farms.
Figure 21: Trends in income of milk specialised farms, EU-10
EU Dairy farms report 2012
31
Source: EU FADN — DG AGRI, Model of the allocation of costs for milk.
4.1.4. EU-2
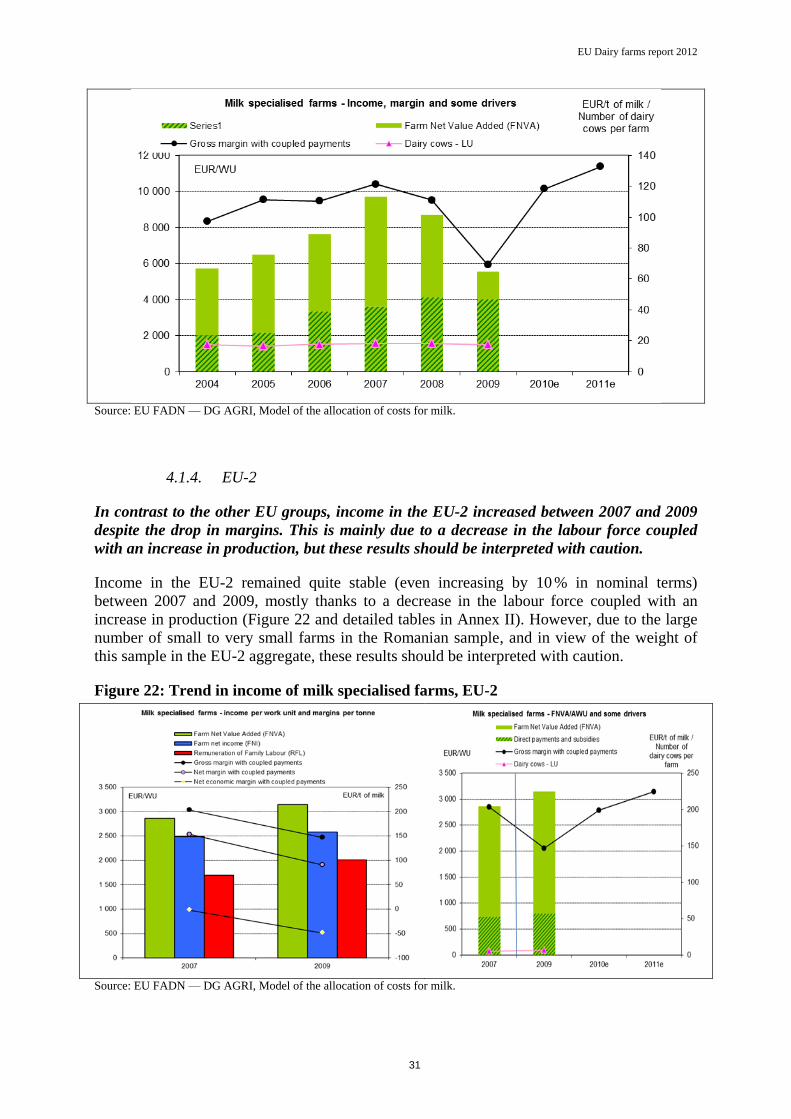
In contrast to the other EU groups, income in the EU-2 increased between 2007 and 2009
despite the drop in margins. This is mainly due to a decrease in the labour force coupled
with an increase in production, but these results should be interpreted with caution.
Income in the EU-2 remained quite stable (even increasing by 10 % in nominal terms)
between 2007 and 2009, mostly thanks to a decrease in the labour force coupled with an
increase in production (Figure 22 and detailed tables in Annex II). However, due to the large
number of small to very small farms in the Romanian sample, and in view of the weight of
this sample in the EU-2 aggregate, these results should be interpreted with caution.
Figure 22: Trend in income of milk specialised farms, EU-2
Source: EU FADN — DG AGRI, Model of the allocation of costs for milk.

EU Dairy farms report 2012
32
4.2. National level
4.2.1. EU-15 Member States
Figure 23 shows the average income indicators of milk specialised farms by Member State in
the EU-15 in 2009. Farm net value added per AWU ranged from 14 123 EUR/AWU in
Portugal to 40 258 EUR/AWU in Italy. If, in most cases, the fall in gross margin was
transmitted directly to the FNVA/AWU, the ranking in terms of the FNVA/AWU did not
necessarily match the ranking in terms of gross margin. For example, in the United Kingdom,
the gross margin was among the lowest in the EU-15, but the FNVA/AWU was among the
highest, thanks to the large herd size (117 cows on average). Yet herd size is not always the
explanation: Belgian farms fare better than German ones with a similar average number of
dairy cows, thanks to lower costs.
Farmers in all countries adapted to the low milk prices by maintaining the milk yield nearly
unchanged between 2007 and 2009. However, this did not prevent a continuous structural
adjustment as the quantity of milk produced per AWU increased in all Member States (except
in Italy, Ireland and United-Kingdom) due to the increase in the average numbers of dairy
cows or of labour force per farm. Nearly everywhere, intermediate costs and depreciation
increased while market receipts decreased due to the fall in milk prices. As a consequence the
FNVA/AWU went down in all Member States except Finland, the only country where milk
prices increased. Direct payments and subsidies helped to support income in this situation.
They represented between 8 % and 36 % of the total receipts of milk farms in Member States
in 2009, compensating for the huge drop in market income, which was negative even in
Luxemburg and in Finland.
As regards farm net income, Italy retained its first place with 34 928 EUR/AWU, while
Denmark, which had almost the same FNVA/AWU, fell to last place (-36 653 EUR/AWU),
due to high wages (47 % of the labour force is paid labour force) and high financial costs. As
these two elements increased significantly between 2007 and 2009 (+19 % and +27 %
respectively), Denmark was also the country that suffered most between these two years, with
a drop in FNI/AWU of 254 %. Given the margin results above, Ireland, on the other hand,
fared better in terms of FNI/AWU, thanks to a very positive balance on investments, subsidies
and taxes due to it fulfilling cross-compliance obligations for farm waste management
facilities.
However, in terms of the remuneration of family labour, this was positive for only 49 % of
Irish family farms in 2009 and, on average, it was very low: 3 022 EUR/FWU. It was also
much lower than the EU-15 average in France and Germany (5 832 EUR/FWU and
8 597 EUR/AWU respectively), even though the German results took into account the 2010
recovery in milk prices, due to the difference between the German accounting year and that of
the other Member States,19
resulting in a ‘delay’ in the trend (see 3.2.1). For the first time
since 2001, Denmark was not the only EU-15 country with a negative average remuneration
of family labour. This was also the case in Luxembourg and the Netherlands. Both these
countries had very high opportunity costs for own capital, something which is normal for the
Netherlands and due to the real interest rate trend in Luxembourg.
19 The accounting year 2009 coincides with the calendar year in most Member States but in Germany it started on 1 July 2009 and ended
on 30 June 2010. This period incorporates the beginning of the recovery from the milk crisis.

EU Dairy farms report 2012
33
Figure 23: Income indicators for milk farms in the EU-15 Member States, 200920
Source: EU FADN — DG AGRI, Model of the allocation of costs for milk.
20 On the green graph showing gross margin and FNVA/AWU, only the total level (FNVA/AWU) is comparable between countries, as in
some Member States (LU, FI), the total amount of direct payments and subsidies per AWU is actually higher than the FNVA/AWU.

EU Dairy farms report 2012
34
Figure 24: Income indicators for milk farms in the EU-10 Member States, 200921
Source: EU FADN — DG AGRI, Model of the allocation of costs for milk.
21 On the green graph showing gross margin and FNVA/AWU, only the total level (FNVA/AWU) is comparable between countries, as in
some Member States (CZ, LV, SK, SI), the total amount of direct payments and subsidies per AWU is actually higher than the
FNVA/AWU.

EU Dairy farms report 2012
35
4.2.2. EU-10 Member States
Figure 24 shows the average income indicators of milk specialised farms by Member State in
the EU-10 in 2009. In most of them, the decrease in the FNVA/AWU between 2007 and 2009
has been less pronounced than the decrease in dairy gross margin, thanks to an increase in
decoupled payments, and to the fact that, on average, the drop in milk revenues did not
translate to a corresponding drop in the farm total output. Nevertheless, this was not the case
in Malta, which faced an increase in intermediate consumption, already very high, or in
Poland, where the fall in milk revenues was reflected in total output, or in Slovenia. In all of
the EU-10 Member States, direct payments and subsidies represented more than 50 % of the
FNVA/AWU, and even accounted for more than 100 % of it in four of them (the Czech
Republic, Latvia, Slovakia and Slovenia). In Poland, the main EU-10 producer, the ratio of
direct payments to FNVA stood at 59 %, around the EU-15 average.
In 2009, the external factors increased in almost all EU-10 Member States. Once deducted
from the FNVA/AWU, the resulting FNI/AWU ranged from -12 674 EUR/AWU in Slovakia
(wages paid) to +13 859 EUR/AWU in Malta. Lithuania, with 7 671 EUR/AWU, fared rather
well, due to its fairly low reliance on an external labour force, and the substantial balance on
investment subsidies and taxes.
The remuneration of family labour was quite low, although it remained positive, in all EU-
10 Member States except for Slovenia, due to the low FNI/AWU and the rise in opportunity
costs for capital (real interest rate).
4.2.3. EU-2 Member States
In 2009, the situation of Bulgaria and Romania was quite different (Figure 25). Indeed, in
Bulgaria, the value of income indicators for specialised dairy farms decreased between 2007
and 2009, whereas they increased in Romania, due to the decrease in the labour force and the
increase in standard output. Despite higher direct payments and subsidies in Bulgaria, all the
income indicators were better in Romania than in Bulgaria, because of lower intermediate
consumption and external factors. However, they remained below those of the EU-10
Member States. This may be related to differences in farm size (averaging 7 dairy cows in the
EU-2 compared with 52 in the EU-15 and 17 in the EU-10) and in direct payments and
subsidies (the EU part of direct payments has not yet been fully phased in).

EU Dairy farms report 2012
36
Figure 25: Income indicators for milk farms in the EU-2 Member States, 2009
Source: EU FADN — DG AGRI, Model of the allocation of costs for milk.
EU Dairy farms report 2012
37
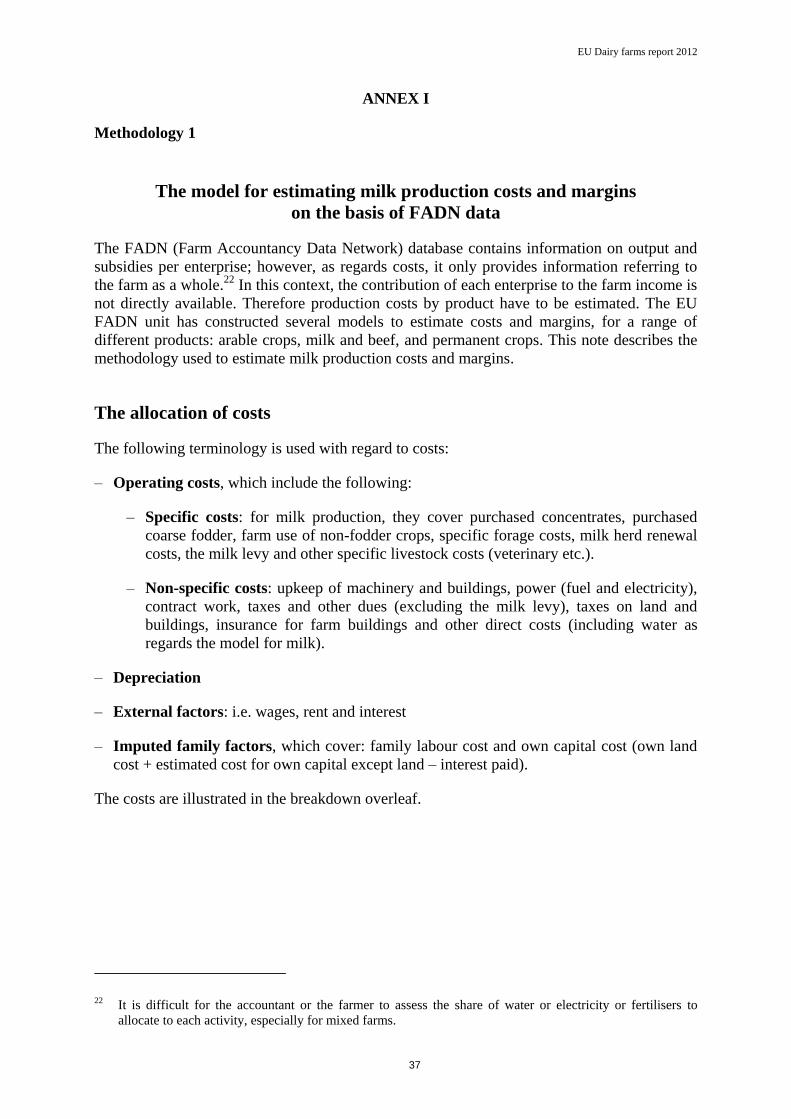
ANNEX I
Methodology 1
The model for estimating milk production costs and margins
on the basis of FADN data
The FADN (Farm Accountancy Data Network) database contains information on output and
subsidies per enterprise; however, as regards costs, it only provides information referring to
the farm as a whole.22
In this context, the contribution of each enterprise to the farm income is
not directly available. Therefore production costs by product have to be estimated. The EU
FADN unit has constructed several models to estimate costs and margins, for a range of
different products: arable crops, milk and beef, and permanent crops. This note describes the
methodology used to estimate milk production costs and margins.
The allocation of costs
The following terminology is used with regard to costs:
– Operating costs, which include the following:
– Specific costs: for milk production, they cover purchased concentrates, purchased
coarse fodder, farm use of non-fodder crops, specific forage costs, milk herd renewal
costs, the milk levy and other specific livestock costs (veterinary etc.).
– Non-specific costs: upkeep of machinery and buildings, power (fuel and electricity),
contract work, taxes and other dues (excluding the milk levy), taxes on land and
buildings, insurance for farm buildings and other direct costs (including water as
regards the model for milk).
– Depreciation
– External factors: i.e. wages, rent and interest
– Imputed family factors, which cover: family labour cost and own capital cost (own land
cost + estimated cost for own capital except land – interest paid).
The costs are illustrated in the breakdown overleaf.
22 It is difficult for the accountant or the farmer to assess the share of water or electricity or fertilisers to
allocate to each activity, especially for mixed farms.

EU Dairy farms report 2012
38
Purchased concentrates for
grazing livestockX DLU/GLU +
Purchased coarse fodder for
grazing livestock X DLU/GLU +
Farm use of non-fodder crops X DLU/GLU +
Specific forage costs X DLU/GLU + +
seeds and plants
fertilisers
crop protection +
Milk herd renewal costs +
Milk levy +
Other specific livestock costs
(veterinary costs…)X DLU/TLU +
Machine and building upkeep X MO/TO +
Energy (fuels, electricity) X MO/TO + +
Contract work X MO/TO +
Taxes and other dues (exc. Milk
levy)X MO/TO +
Other direct costs (inc. water) X MO/TO +
Taxes on land and buildings X MO/TO +
Insurance for farm buildings X MO/TO +
Depreciation X MO/TO +
Wages paid X MO/TO +
Rent paid X MO/TO + +
Interest paid X MO/TO +
Family labour costs (imputed) X MO/TO + +
Own capital cost X MO/TO +
DLU/GLU: Dairy livestock units / Grazing livestock units
DLU/TLU: Dairy livestock units / Total livestock units
MO/TO: % of milk output & subsidies in the total output & coupled subsidies
EU dairy
payments and
article 69
national dairy
payments
Net margin
(before own
factors) with
coupled
subsidies
Gross
margin
(over
operating
costs) with
coupled
subsidies
Net economic
margin (after
own factors)
with coupled
subsidies
(minus forage farm use plus the milk herd renewal purchases to avoid to double
count these costs, cause the pruchases are already deducted in the output meat)
Total
operating
costs
External
factors
Imputed
family factor
costs Net margin
(before own
factors)
Total
inputs
Net economic
margin (after
own factors)
MILK MODEL
MarginsProduction costs
Total
revenues
from milk
Revenues
Milk price
Specific
costs
Gross
margin
(over
operating
costs)
Non
specific
costs

EU Dairy farms report 2012
39
The basis of the methodology is to allocate a share of the farm costs to milk production.
Different ratios are used:
– Dairy livestock units23
as a proportion of grazing livestock units (DLU/GLU on the
flow chart) is used to allocate grazing livestock feed costs;
– Dairy livestock units as a proportion of total livestock units (DLU/TLU) is used to
allocate other livestock specific costs;
– Milk output and subsidies as a proportion of total output24
plus linked subsidies
(MO/TO) is used to allocate non-specific inputs and fixed costs. Subsidies are taken
into account to enable the results to be compared over time since, from 2004 onwards,
part of the milk support that was previously included in the price has been allocated
via a direct payment. Moreover, this makes it possible to distinguish and to take better
account of the co-existence of beef production on farms where costs of milk
production are estimated (increasing the importance of direct aid support compared to
market price support in beef production). The total output (TO, denominator) is also
adjusted by deducting the value of home-grown fodder recorded in FADN and adding
the purchase costs for milk herd renewal (see below).
As the milk levy25
is directly linked to milk production only, it is fully allocated to the
costs of milk production.
Some disparities in FADN recording among Member States also have to be taken into
account in order to be able to make comparisons. Some Member States (generally from
the north of the EU) do not put a value on fodder in FADN, mainly because of the
difficulty of estimating production and the value of forage. Based on the principle that
forage production is simply an input for animal production, and that failure to record it
— either on the crop output side, or on the animal costs side — does not affect income,
no effort is made to estimate it. In other countries — generally those where fodder
production is more expensive — a value is assigned to the production of fodder. Even if
this difference is unlikely to affect margins, it can lead to biases when comparing costs
between Member States. To take account of the differences in records, fodder production
used on the farm is treated as follows for the purpose of the model:
– The value of the farm use of non-fodder plants (e.g. barley, rye, etc.) is maintained
in the item ‘Crops used for feed’, but the farm use value of all crops used as forage
(fodder roots, other fodder plants — e.g. silage of cereals, temporary grass, meadows
and pastures and rough grazing) is excluded.
– The value of fodder plants produced on the farm is estimated on the basis of the
specific costs of the crops (e.g. seeds, fertilisers, crop protection). Specific costs are
allocated to fodder production according to a ratio (fodder on total area). However,
some forage crops do not benefit from all inputs (e.g. there is no crop protection for
23 Dairy livestock units are defined as dairy cows and a share of total breeding heifers and young females.
This share is equal to dairy cows as a proportion of the total number of cows (dairy cows, cull dairy cows
and other cows).
24 Output after deduction of forage crops farm use.
25 In the previous model design, the milk levy was deducted from subsidies on the revenues side.

EU Dairy farms report 2012
40
temporary grass). Therefore, the area taken into account in the ratio varies according
to the input. The following table details the calculation. This item is called ‘Specific
forage costs’.
Estimation of ‘Specific forage costs’
Cost item Allocation key26
Seed costs
% area of fodder crops (144), other forage crops (145) and
temporary grass (147)
in the total Utilised Agricultural Area (UAA)
- after exclusion of fallow lands (146), areas leased to others (149),
meadows (150) and rough grazing (151)
Fertiliser costs
% area of fodder crops (144), other forage crops (145), temporary
grass (147) and meadows (150)
in the total UAA
- after exclusion of fallow lands (146), areas leased to others (149)
and rough grazing (151)
Crop protection costs
% area of fodder crops (144) and other forage crops (145)
in the total UAA
- after exclusion of fallow lands (146), temporary grass (147), areas
leased to others (149), meadows (150) and rough grazing (151)
– The home-grown fodder value is deducted from total output (the denominator in
the allocation ratio MO/TO) because it is included in the farm total output and it has to
be deducted to obtain a comparable ratio between the Member States that value fodder
and those that do not.
The milk herd renewal purchases cost was introduced when the model was revised in
2008. Although the cost of rearing the farm’s own milk heifers was already included in
the model, the cost of the purchase of new heifers (for example, to renew the genetic
potential of the herd) was not included. It was indirectly taken into account in part by the
MO/TO ratio, because the total output of the farm includes the meat output, which is
calculated by deducting the purchases. Therefore, for farms that rely heavily on
purchases rather than on rearing their own animals, total output (the denominator) was
lower and therefore the ratio used for the allocation of costs to milk was higher, with the
result that all of their costs calculated using this ratio were higher. However, it was done
regardless of whether these purchases were linked to the milk enterprise or to the meat
enterprise. With the new method, an attempt has been made to take direct account of the
share of purchases that can be related to milk.
The aim is therefore to take direct account of the cost of purchases of young female
bovines to be used for milk production.27
This cost is calculated by multiplying the farm
purchases of female cattle from 12 to 24 months and of breeding heifers by the ratio of
dairy cows over the total dairy cows plus suckler cows. This makes it possible to allocate
a share of young female cattle purchases to milk production. Information on details of
26 Codes refer to product or cost codes in the farm return (Commission Regulations Nos 2237/77 and
868/2008).
27 The value of sales of cull dairy cows cannot be deducted because of the scarcity of information about
this item in the FADN database. Moreover, it can be considered as a meat by-product, which anyway
has not been included in the model design until now. The value of calves is not taken into account in
revenues, despite the fact that it is an obligatory by-product of milk production.

EU Dairy farms report 2012
41
purchases of animals is available in FADN only from 2000 onwards; therefore this
estimate can only be made from 2000 onwards. Moreover, it is not obligatory and, in
practice, some Member States did not record it in the initial years after its introduction.28
This has to be taken into account when interpreting the results.
However, a correction should be made for total output (the denominator in the
allocation ratio MO/TO) to avoid double counting of these costs. The total output already
deducts all purchases of animals, so the calculated milk herd renewal costs should be
added back into the total output used in the allocation ratio MO/TO.
Another disparity in recording by Member States concerns depreciation of the milk
quota, which is applied in some Member States and not in others (in part because of
differences in milk quota management). Moreover, for the most recent accounting years,
specific instructions were given to Member States that depreciation of quotas should not be
entered in the FADN table related to capital.29
This means that depreciation is not taken into
account in the calculation of income. In order to be consistent with this principle and to
allow comparability over time and among Member States, our estimates apply a rule of non-
depreciation of milk quota. Note that the cost of buying or renting milk quota is covered
(where it is not self-financed) by interest and rent paid.
The following FADN cost items have been included in the 2008 revision of the model:
– taxes and other dues (excluding the milk levy) (part of farming overheads, non-
specific costs),
– insurance on farm buildings (part of farming overheads, non-specific costs),
– taxes on land and buildings (part of farming overheads, non-specific costs).
The estimation of imputed unpaid family factors has also been included in the margin
and income calculation. The methodology used is explained in another annex.
Revenues from milk
Revenues from milk take into account:
– the value of sales of milk and milk products;
– EU dairy payments (11.81EUR/t of quota in 2004, 23.65EUR/t in 2005, 35.50EUR/t
in 2006 before decoupling; the actual implementation date of the payments depends
on the Member State) and Article 69 payments for dairy (used in Spain);
– Any national dairy payments.
28 Milk herd renewal purchases cannot be estimated for Greece, Italy (2000-2005), Ireland (2000),
Finland (2000), Sweden (2000).
29 Document RI/CC 1256: Deprecation of quota should NOT be entered in Table G (Land and buildings,
deadstock, circulating capital), but may be entered in Table L.

EU Dairy farms report 2012
42
This means that the value of calves and of sales of cull dairy cows is not taken into account,
because no satisfactory method has been found to estimate this value on the basis of the current
data.
The margins
The following terminology is used in relation to margins:
– Gross margin (over operating costs): sales of milk and milk products minus
operating costs;
– Net margin (before own factors): sales of milk and milk products minus operating
costs, depreciation and external factors;
– Net economic margin (after own factors): sales of milk and milk products minus
operating costs, depreciation, external factors, and imputed unpaid family factors.
All the margins are displayed with and without coupled payments for milk (EU and
national). This makes it possible to simulate the removal of coupled payments.
The sample of farms
Given the estimation methodology, i.e. the need to allocate costs, to obtain reliable
estimations of production costs and margins it is necessary to focus on milk specialised
farms. Depending on the specific objectives of the analysis, different specialisation
criteria might be chosen. In general, the following criteria have been used:
– Farms covered by the following types of farming (TF): 41 Specialist dairying, 43
Cattle dairying, rearing and fattening combined, 71 Mixed livestock, mainly dairying,
81 Field crops — grazing livestock combined. The decision was made to include
farming types 43, 71 and 81 (and not only 41) in the sample so as to cover a larger
share of dairy cows, particularly in the new Member States.
– A specialisation rate30
greater than 50 %.
– An average milk price at farm level of less than 900EUR/t of milk, in order to exclude
farms producing buffaloes’ milk. These farms are mainly located in the two Italian
regions Lazio and Campania, essentially for the production of ‘Mozzarella di buffala’.
It was decided to exclude them because of their major differences in terms of milk
yield, price, costs and margins.
Moreover, given the use of different ratios for the allocation keys,31
some precautions are
necessary in order to prevent problems with estimates:
30 Specialisation rate: the share of milk output and subsidies in total output and coupled subsidies (forage
farm use deducted).

EU Dairy farms report 2012
43
– Total output and total output plus subsidies should be strictly positive.
– Total output plus subsidies should be greater than milk output plus subsidies.
– Total output should be greater than milk output.32
Farms that do not meet these conditions are excluded from the sample used to estimate costs
and margins.
The results are presented in EUR/t of milk. They are the so-called ‘global ratio’, i.e. they
are obtained by dividing the average revenues, costs or margin in the Member State (or
region) by the average quantity of milk produced in that Member State (or region) (and
not by the average of the individual ratio by farm).
31 Allocation keys: dairy livestock units as a proportion of grazing livestock units, dairy livestock units as
a proportion of total livestock units, milk output and subsidies as a proportion of total output and
coupled subsidies, milk output as a proportion of total output.
32 The number of dairy cows and of grazing livestock units must also be greater than 0.

EU Dairy farms report 2012
44
Methodology 2
Estimation of imputed unpaid family factor costs — Method
Family labour cost: this is estimated on the basis of the wages which the owner
of the farm would have to pay to hire employees to do the work carried out by family
members.
It is estimated as the average regional wage per hour obtained in the FADN database33
multiplied by the number of hours worked by family workers on the farm.
It is commonly acknowledged that the number of hours of family workers is sometimes
overestimated. Thus the method uses a maximum of 3 000 hours per Annual Work Unit
(this is the equivalent of 8.2 hours a day, 365 days a year, and corresponds more or less
to the time that can be spent on a farm by dairy farmers).34
Using hours makes it possible to remunerate a manager more than an employee for
working more hours.
It is challenging to calculate a reliable estimate because records of hours worked on the
farm might be overestimated and it is not easy to determine what an appropriate
remuneration for family labour is. Farmers may indeed agree to be remunerated less than
they would be according to the average agricultural wage. They may consider farming a
way of life or benefit from other sources of income for their household (other gainful
activities directly related to the holding, spouse working outside the farm, etc.).
Own capital cost
– Own land cost: this is estimated on the basis of the rent that the owner of the
farm would have to pay if the land were rented instead of owned.
It is estimated as the owned area multiplied by the rent paid per ha on the same
farm or, if there is no rented land on the farm, by the average rent paid per ha in the
same region and for the same type of farming.35
– Cost of own capital (other than land): the cost of own capital (permanent
crops, buildings, machinery and equipment, forest land, livestock and crop
stocks) is estimated at its opportunity cost. That is how much money the farmer
could gain from investing the equivalent of its capital value in a bank.
The interest paid on the capital is not known, as this information is optional in the FADN
farm return. Nevertheless, to take into account the actual interest rate paid on the farm, a
‘weighted’ interest rate is calculated as the weighted average of this interest rate for debts
33 If there are not enough farms (fewer than 20) with paid labour at regional level, the national average is
taken into account.
34 A constraining factor of the estimation method is that if a farmer receiving a salary would probably
work less.
35 If there are not enough farms (fewer than 20) in a given region for a type of farming, the national rent
per hectare for the given type of farming is used (the TF8 classification is used).

EU Dairy farms report 2012
45
and the long term interest rate taken from the Global Insight database for the net worth. It
should be noted that if the ‘weighted’ interest rate is lower than the LT interest rate
(which means that the calculated rate of interest paid is lower than the LT interest rate),
the LT interest rate is used instead of the ‘weighted’ interest rate.
In the end, the own capital value (excluding land and land improvement) is estimated as
the average value of the assets (closing plus opening valuation divided by 2) multiplied
by the real interest rate.36
The correction is made by subtracting the inflation rate37
from
the nominal interest rate. A condition is applied to avoid negative real interest rates.
The total circulating capital is not valued because of the unreliability of this variable in
some Member States. Nevertheless, the crop stock value is taken into account.
To calculate the unpaid capital costs, in order to avoid double counting, we have to
deduct the interest paid from the sum of the own land cost and the cost of own capital
except land:
Imputed unpaid capital costs = own land cost + estimated cost for own capital except
land — interest paid (when interest paid is lower than the sum of own land and own
capital costs).
The total cost of imputed unpaid family factors is then the sum of family labour costs
and unpaid capital costs:
Imputed unpaid family factors = family labour cost + unpaid capital costs
Or
Imputed unpaid family factors = family labour cost + (own land cost + estimated cost for
own capital other than land – interest paid)
36 The increase in the value of assets is excluded from income calculations. For example, land
appreciates in value over time, which is one of the reasons why investors invest in land. This gain is
not included in income; therefore it would not be consistent to include it in the cost of capital. In
addition, in the FADN, assets are valued at replacement value. Depreciation is based on this
replacement value and therefore already takes into account the increase in prices (inflation).
Consequently, it would be double counting to include the inflation part of interest in the cost of
capital.
37 The inflation rate is based on the Eurostat annual average rate of change in Harmonised Indices of
Consumer Prices (HICPs) — available from 1997. Inflation rates based on price indexes of GDP and
gross fixed capital consumption have been tested, but they are very high and were leading to very high
negative cost of capital, mainly in the EU-10. An inflation rate calculated on the basis of price indexes
for gross fixed capital consumption has been tested, as it seemed to be more closely related to assets.
However, this rate has fluctuated widely over the years for certain Member States. In addition, land is
one of the most important assets which does not depreciate. Therefore the inflation rate of gross fixed
capital consumption must not have a closer relationship with the change in the price of agricultural
assets than with the consumer price indices.

EU Dairy farms report 2012
46
Table 2: Share of dairy cows covered by the FADN by Member State
FADN 2009 Eurostat cattle
survey 2009
Coverage FADN/FSS
Number of dairy cows
Non-specialised milk farms
Specialised milk farms
Total Non-
specialised milk farms
Specialised milk farms
Total
Belgium 194 010 289 481 483 490 517 700 37% 56% 93%
Denmark 20 103 527 166 547 269 574 000 4% 92% 95%
Germany 782 527 3 097 026 3 879 552 4 169 300 19% 74% 93%
Greece . 76 486 77 173 128 000 . 60% 60%
Spain 34 581 873 740 908 321 828 300 4% 105% 110%
France 924 823 2 812 819 3 737 643 3 748 000 25% 75% 100%
Ireland 89 516 1 030 101 1 119 617 1 022 400 9% 101% 110%
Italy 170 412 1 413 162 1 583 575 1 878 400 9% 75% 84%
Luxembourg 12 958 24 951 37 909 45 900 28% 54% 83%
The Netherlands 72 963 1 423 050 1 496 013 1 562 000 5% 91% 96%
Austria 213 852 308 232 522 084 533 000 40% 58% 98%
Portugal 6 933 182 479 189 412 255 400 3% 71% 74%
Finland . 316 859 318 680 285 800 . 111% 112%
Sweden 16 795 359 285 376 080 354 200 5% 101% 106%
The United Kingdom 77 901 1 823 115 1 901 016 1 864 000 4% 98% 102%
EU 15 2 619 882 14 557 953 17 177 835 17 766 500 15% 82% 97%
Cyprus . . . 23 200 . . .
The Czech Republic 268 425 79 649 348 074 383 800 70% 21% 91%
Estonia 11 961 82 675 94 636 96 700 12% 85% 98%
Hungary 141 558 132 233 273 791 248 000 57% 53% 110%
Lithuania 95 076 145 838 240 913 374 600 25% 39% 64%
Latvia 38 406 96 790 135 196 165 500 23% 58% 82%
Malta . 6 410 6 410 6 900 . 93% 93%
Poland 764 875 1 255 264 2 020 138 2 584 700 30% 49% 78%
Slovakia 97 369 27 135 124 504 162 500 60% 17% 77%
Slovenia 36 609 79 172 115 781 113 100 32% 70% 102%
EU 10 1 457 449 1 912 105 3 369 554 4 159 000 35% 46% 81%
Bulgaria 22 527 150 107 172 633 296 800 8% 51% 58%
Romania 528 778 678 892 1 207 670 1 419 000 37% 48% 85%
EU 2 551 304 828 999 1 380 303 1 715 800 32% 48% 80%
EU 27 4 628 635 17 299 056 21 927 691 23 641 400 20% 73% 93%
Source: EU FADN 2009, Eurostat cattle survey 2009, treatment DG AGRI.

EU Dairy farms report 2012
47
Table 3: Share of milk production covered by the FADN by Member State
FADN 2009 Eurostat
2009 Coverage FADN/FSS
Milk production (in 1000 tonnes)
Non-specialised milk farms
Specialised milk farms
Total Non-
specialised milk farms
Specialised milk farms
Total
Belgium 1 209 2 000 3 209 2 996 40% 67% 107%
Denmark 151 4 364 4 514 4 814 3% 91% 94%
Germany 5 588 22 877 28 465 29 199 19% 78% 97%
Greece . 437 438 753 . 58% 58%
Spain 185 6 017 6 202 6 251 3% 96% 99%
France 5 974 18 287 24 261 23 333 26% 78% 104%
Ireland 389 5 280 5 669 4 967 8% 106% 114%
Italy 760 9 253 10 013 11 364 7% 81% 88%
Luxembourg 88 182 270 284 31% 64% 95%
The Netherlands 540 11 215 11 755 11 791 5% 95% 100%
Austria 1 208 2 039 3 248 3 230 37% 63% 101%
Portugal 22 1 287 1 308 1 999 1% 64% 65%
Finland . 2 677 2 692 2 332 . 115% 115%
Sweden 111 2 892 3 003 2 933 4% 99% 102%
The United Kingdom 465 12 974 13 438 13 596 3% 95% 99%
EU 15 16 690 101 780 118 487 119 841 14% 85% 99%
Cyprus . . . 152 . . .
The Czech Republic 1 780 520 2 301 2 781 64% 19% 83%
Estonia 76 595 672 671 11% 89% 100%
Hungary 930 879 1 808 1 758 53% 50% 103%
Lithuania 457 779 1 236 1 787 26% 44% 69%
Latvia 183 526 709 828 22% 64% 86%
Malta . 35 35 40 . 88% 88%
Poland 3 183 6 703 9 886 12 447 26% 54% 79%
Slovakia 562 159 721 957 59% 17% 75%
Slovenia 135 415 550 626 22% 66% 88%
EU 10 7 307 10 612 17 919 22 046 33% 48% 81%
Bulgaria 59 555 614 1 073 6% 52% 57%
Romania 1 720 2 659 4 379 4 654 37% 57% 94%
EU 2 1 779 3 214 4 993 5 727 31% 56% 87%
EU 27 25 776 115 605 141 398 147 614 17% 78% 96%
Source: EU FADN 2009, Eurostat production statistics 2009, treatment DG AGRI.

EU Dairy farms report 2012
48
Table 4: Share of milk production by Member State in the FADN 2009
Member State Share of milk production 2009
Belgium 2%
Denmark 3%
Germany 20%
Greece 0%
Spain 4%
France 17%
Ireland 4%
Italy 7%
Luxembourg 0%
The Netherlands 8%
Austria 2%
Portugal 1%
Finland 2%
Sweden 2%
The United Kingdom 9%
EU 15 84%
Cyprus 0%
The Czech Republic 2%
Estonia 0%
Hungary 1%
Lithuania 1%
Latvia 1%
Malta 0%
Poland 7%
Slovakia 1%
Slovenia 0%
EU 10 13%
Bulgaria 0%
Romania 3%
EU 2 4%
EU 27 100%
Source: EU FADN — DG AGRI.

EU Dairy farms report 2012
49
ANNEX II
Results by EU-group, Member State and region.

EU Dairy farms report 2012 Annex II EU 27
EU 27 Milk specialised farms
e: estimate*: trend between the average of the first three available years and the average of the last available three yearsSTRUCTURAL INFORMATION
2007 2008 2009 2010e 2011e Trend 2009/2007
Trend 2011 /2007
Sample farms 12 744 12 791 12 890 1%Farms represented 559 265 534 925 508 611 -9%% production from specialised farms 82% 83% 82% -1%Forage area - ha 29 31 31 8%Dairy cows - LU 31 33 34 10%Rented UAA - % 58% 58% 57% 0%Total labour - AWU 1,96 1,84 1,88 -4%Family labour - % 85% 83% 85% -1%Milk per ha fodder area - t/ha 7,1 7,1 7,2 1%Milk yield - kg/cow 6 699 6 671 6 686 6 896 7 068 6%Milk production - t 207 223 227 235 240 16%
MILK MARGINS in EUR/t of milk (nominal)
2007 2008 2009 2010e 2011e Trend 2009/2007
Trend 2011 /2007
RevenuesPrice 343 342 284 325 354 3%EU coupled payments (incl. Art.69) 0 0 0 0 0 -20%National aids 2 2 2 2 2 -5%Total revenues from milk 344 344 286 327 356 3%Production costs Feed 93 104 90 89 101 9%
homegrown feed 27 30 26 25 28 2%puchased feed 66 74 64 64 74 12%
Herd renewal purchases 3 3 3 3 3 -7%Milk levy 1 1 0 0 0 -53%Other specific costs 21 22 21 21 21 3%Specific costs 118 130 115 113 126 7%Machinery and building upkeep 20 20 18 18 18 -7%Energy (fuel, electricity) 18 20 18 19 21 18%Contract work 17 18 17 17 17 1%Taxes 1 1 1 1 1 17%Other direct inputs 22 22 22 22 22 -2%Non specific costs 78 82 77 77 80 2%Total operating costs 196 212 192 191 206 5%Gross margin 147 131 92 135 148 1%Gross margin with coupled payments 149 133 94 137 150 1%%spe.farms with positive gross margin 98% 96% 92% 96% 97%
-1%%milk production with positive gross margin 99% 98% 96% 98% 99%
0%
Depreciation 44 47 46 3%Wages 13 14 13 -1%Rent 13 12 12 -7%Interest 14 16 14 1%External factors 40 42 39 -2%Net margin 62 42 7 -89%Net margin with coupled payments 64 43 9 -86%
Family labour costs 70 71 69 -1%Own capital unpaid cost 17 13 25 47%Imputed family factors 87 84 94 9%Net economic margin -24 -42 -87 -258%Net economic margin with coupled payments -23 -40 -85 -275%%spe.farms with positive net economic margin 29% 26% 13%
-16%%milk production with positive net economic margin 44% 33% 18%
-26%
Source: EU FADN DG AGRI, model of the allocation of costs for milk. 50

EU Dairy farms report 2012 Annex II EU 27
EU 27 Milk specialised farmsINCOME in EUR/AWU (nominal)
2007 2008 2009 Trend 2009/2007
Total output 50 479 57 709 48 693 -4%Intermediate consumptions 29 761 36 902 33 767 13%Balance subsidies and taxes 8 206 9 294 9 110 11%
Decoupled payments 5 431 6 107 6 027 11%Depreciation 6 497 7 761 7 703 19%Farm Net Value Added (FNVA) 22 427 22 339 16 333 -25%
External factors 5 827 6 967 6 509 12%Wages 1 990 2 347 2 249 13%
Rent 1 919 2 064 2 061 7%Interest 1 919 2 556 2 199 15%
Balance invest. subs. and taxes -76 1 396 619%Farm net income (FNI) 16 524 15 373 10 220 -38%
Family farms only in EUR/FWU (nominal)Own capital unpaid cost 2 873 2 554 4 966 73%Remuneration of Family Labour (RFL) 15 968 15 715 7 389 -54%
%spe.farms with positive RFL 92% 89% 74% -17%
Milk specialised farms - gross margin
149133
94
137150
0
50
100
150
200
250
300
350
400
Revenues Operatingcosts
Revenues Operatingcosts
Revenues Operatingcosts
Revenues Operatingcosts
Revenues Operatingcosts
2007 2008 2009 2010e 2011e
EUR/t
Price EU coupled payments (incl. Art.69)National aids FeedOther specific costs Non specific costsGross margin with coupled payments
Milk specialised farms - net margin
344 344
286
280 301 277
64
43
9
0
50
100
150
200
250
300
350
400
2007 2008 2009
EUR/t
0
10
20
30
40
50
60
70
Total revenues from milk
Operating costs + depreciation + external factors
Net margin with coupled payments
Source: EU FADN DG AGRI, model of the allocation of costs for milk. 51
EU Dairy farms report 2012 Annex II EU 27
EU 27 Milk specialised farms
Milk specialised farms - net economic margin
344 344
286
367385 371
-23
-40
-850
50
100
150
200
250
300
350
400
450
2007 2008 2009
EUR/t
-90
-80
-70
-60
-50
-40
-30
-20
-10
0
Total revenues from milkTotal costsNet economic margin with coupled payments
Milk specialised farms - non-operating costs
44 47 46
70 71 69
17 13 25
0
20
40
60
80
100
120
140
160
180
200
2007 2008 2009
EUR/t
Depreciation WagesRent InterestFamily labour costs Own capital unpaid cost
Milk specialised farms - income per work unit and margins per tonne
0
5 000
10 000
15 000
20 000
25 000
2007 2008 2009
EUR/WU
-100
-50
0
50
100
150
200EUR/t of milk
Farm Net Value Added (FNVA)Farm net income (FNI)Remuneration of Family Labour (RFL)Gross margin with coupled paymentsNet margin with coupled paymentsNet economic margin with coupled payments
Source: EU FADN DG AGRI, model of the allocation of costs for milk. 52

EU Dairy farms report 2012 Annex II EU 15
EU 15 Milk specialised farms
e: estimate*: trend between the average of the first three available years and the average of the last available three yearsSTRUCTURAL INFORMATION
2001 2002 2003 2004 2005 2006 2007 2008 2009 2010e 2011e
Three years
average trend*
Trend 2011 /2007
Sample farms 10 465 9 975 9 119 8 890 9 352 9 161 9 432 9 019 8 983 -7%Farms represented 385 248 326 514 321 271 295 763 307 595 280 004 288 424 287 941 279 568 -17%% production from specialised farms 86% 83% 83% 83% 86% 86% 87% 87% 86% 3%Forage area - ha 38 40 41 43 44 46 46 46 47 17%Dairy cows - LU 41 44 46 47 48 51 51 52 52 17%Rented UAA - % 56% 57% 57% 58% 58% 60% 60% 61% 61% 4%Total labour - AWU 1,77 1,78 1,80 1,81 1,84 1,89 1,87 1,85 1,84 4%Family labour - % 89% 88% 87% 87% 86% 85% 84% 85% 84% -4%Milk per ha fodder area - t/ha 7,0 7,2 7,3 7,3 7,4 7,6 7,7 7,7 7,7 8%Milk yield - kg/cow 6 407 6 527 6 629 6 715 6 814 6 978 7 009 7 009 6 991 7 206 7 390 10% 5%Milk production - t 265 289 305 318 325 353 355 362 364 375 385 31% 9%
MILK MARGINS in EUR/t of milk (nominal)
2001 2002 2003 2004 2005 2006 2007 2008 2009 2010e 2011e
Three years
average trend*
Trend 2011 /2007
RevenuesPrice 336 318 311 308 301 296 349 348 291 332 360 2% 3%EU coupled payments (incl. Art.69) 0 0 0 11 12 5 0 0 0 0 0 - -20%National aids 3 3 3 3 2 2 2 2 2 2 2 -23% 3%Total revenues from milk 338 320 313 321 314 304 350 349 293 334 361 2% 3%Production costs Feed 85 83 86 84 81 82 94 105 93 91 104 13% 10%
homegrown feed 24 23 23 23 23 23 26 27 25 23 26 5% 1%puchased feed 61 60 63 61 58 59 69 78 68 68 78 16% 13%
Herd renewal purchases 2 2 2 2 2 3 3 3 3 3 3 42% -6%Milk levy 0 0 1 1 1 0 1 1 0 0 0 -40% -53%Other specific costs 21 19 19 19 20 20 21 23 23 23 22 15% 4%Specific costs 109 105 108 107 104 106 120 132 119 117 129 14% 8%Machinery and building upkeep 19 19 17 18 19 19 20 21 19 19 19 2% -7%Energy (fuel, electricity) 14 13 13 14 16 17 18 19 17 19 21 42% 18%Contract work 16 16 15 16 16 17 18 19 18 18 18 16% 1%Taxes 2 2 2 1 1 1 1 2 2 2 2 -8% 19%Other direct inputs 21 22 22 23 23 23 24 24 24 23 23 7% -3%Non specific costs 72 71 69 72 75 77 81 85 80 80 83 14% 2%Total operating costs 181 176 177 179 179 182 201 217 198 197 212 14% 5%Gross margin 155 142 135 129 122 114 148 131 93 134 148 -13% 0%Gross margin with coupled payments 157 144 136 142 135 121 149 132 95 136 149 -13% 0%
%spe.farms with positive gross margin 99% 99% 98% 99% 98% 98% 98% 97% 93% 97% 97% -3%
-1%%milk production with positive gross margin 99% 100% 99% 99% 99% 99% 99% 98% 97% 99% 99% -1% 0%
Depreciation 43 42 41 43 43 45 46 48 47 12%Wages 12 11 11 10 12 12 13 13 13 15%Rent 15 15 15 14 14 14 14 13 13 -7%Interest 15 15 14 13 13 13 15 18 15 9%External factors 41 41 39 38 39 40 42 44 41 5%Net margin 71 60 54 49 40 29 60 39 5 -44%
Net margin with coupled payments 73 62 56 62 53 36 61 41 7 -43%
Family labour costs 84 76 73 73 71 68 69 70 68 -11%Own capital unpaid cost 26 25 21 21 16 17 17 13 25 -24%Imputed family factors 110 101 94 94 87 85 86 84 93 -14%Net economic margin -39 -42 -40 -45 -47 -56 -26 -44 -88 -31%Net economic margin with coupled payments -37 -39 -38 -32 -33 -49 -25 -43 -86 -34%
%spe.farms with positive net economic margin 25% 24% 21% 21% 20% 15% 28% 22% 10% -4%
%milk production with positive net economic margin 37% 34% 33% 32% 28% 24% 42% 31% 17% -5%
Source: EU FADN DG AGRI, model of the allocation of costs for milk. 53

EU Dairy farms report 2012 Annex II EU 15
EU 15 Milk specialised farmsINCOME in EUR/AWU (nominal)
2001 2002 2003 2004 2005 2006 2007 2008 2009
Three years
average trend*
Total output 66 445 68 455 69 886 72 408 72 927 77 562 91 072 93 349 80 646 29%Intermediate consumptions 38 053 40 059 41 809 43 750 44 419 48 639 53 970 60 027 56 061 42%Balance subsidies and taxes 7 113 7 925 8 339 10 492 13 144 15 147 14 820 14 838 14 817 90%
Decoupled payments 0 0 0 0 5 005 9 825 10 467 10 496 10 310 -Depreciation 9 005 9 556 9 826 10 565 10 710 11 723 11 939 12 776 12 811 32%Farm Net Value Added (FNVA) 26 499 26 766 26 589 28 584 30 942 32 346 39 983 35 384 26 591 46%
External factors 8 556 9 204 9 252 9 213 9 408 10 254 10 867 11 538 11 033 24%Wages 2 431 2 461 2 600 2 531 2 958 3 227 3 379 3 393 3 442 36%
Rent 3 059 3 477 3 490 3 516 3 418 3 713 3 747 3 638 3 682 10%Interest 3 067 3 267 3 162 3 166 3 032 3 314 3 741 4 507 3 908 28%
Balance invest. subs. and taxes 81 -93 -155 -126 -29 30 -198 -127 587 257%Farm net income (FNI) 18 024 17 469 17 183 19 246 21 504 22 122 28 918 23 720 16 145 31%
Family farms only in EUR/FWU (nominal)Own capital unpaid cost 6 044 6 458 5 757 5 848 4 482 5 071 5 134 4 088 8 086 -5%Remuneration of Family Labour (RFL) 14 275 13 405 14 087 16 080 20 614 20 994 28 682 24 000 11 418 53%
%spe.farms with positive RFL 85% 83% 83% 86% 90% 88% 93% 87% 73% 0%
Milk specialised farms - gross margin
149
157144 136 142 135 121
149 13295
136
0
50
100
150
200
250
300
350
400
Rev
enue
s
Ope
ratin
g
Rev
enue
s
Ope
ratin
g
Rev
enue
s
Ope
ratin
g
Rev
enue
s
Ope
ratin
g
Rev
enue
s
Ope
ratin
g
Rev
enue
s
Ope
ratin
g
Rev
enue
s
Ope
ratin
g
Rev
enue
s
Ope
ratin
g
Rev
enue
s
Ope
ratin
g
Rev
enue
s
Ope
ratin
g
Rev
enue
s
Ope
ratin
g
2001 2002 2003 2004 2005 2006 2007 2008 2009 2010e 2011e
EUR/t
Price EU coupled payments (incl. Art.69) National aids
Feed Other specific costs Non specific costs
Gross margin with coupled payments
Milk specialised farms - net margin
338320 313 321 314 304
350 349
293
265 258 257 259 261 267 289 309 286
73
6256
62
53
36
61
41
7
0
50
100
150
200
250
300
350
400
2001 2002 2003 2004 2005 2006 2007 2008 2009
EUR/t
0
10
20
30
40
50
60
70
80
Total revenues from milk Operating costs + depreciation + external factors
Net margin with coupled payments
Source: EU FADN DG AGRI, model of the allocation of costs for milk. 54
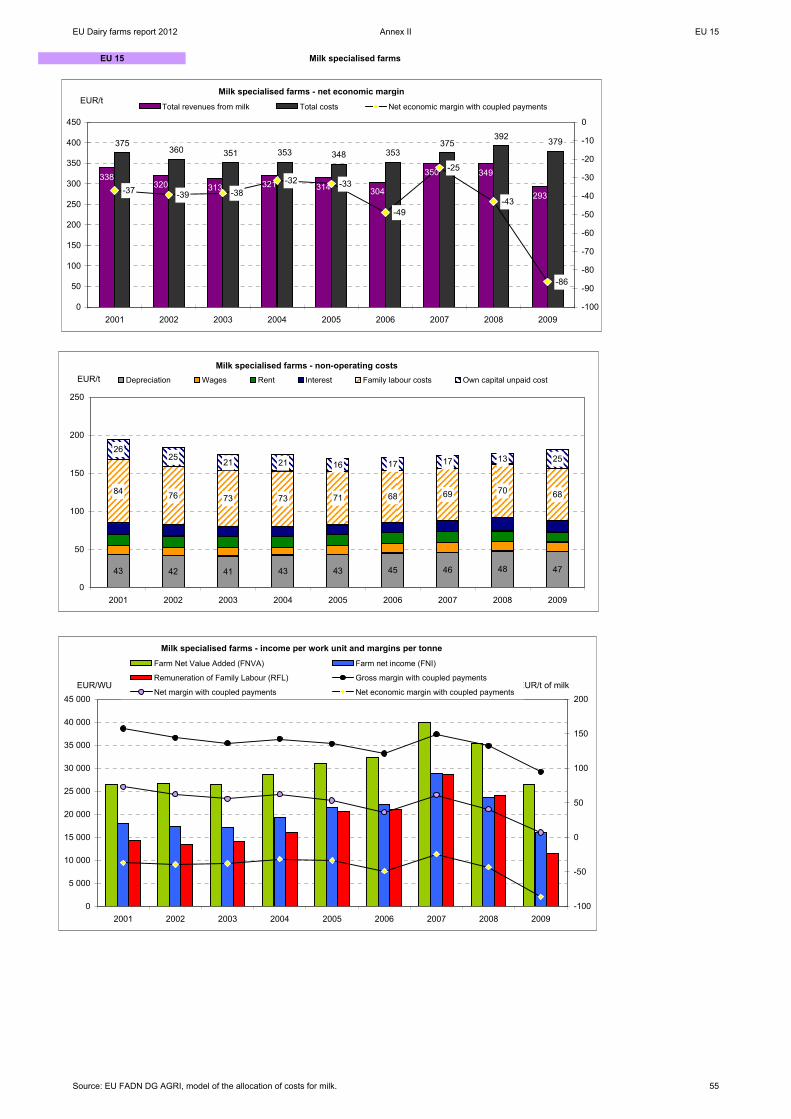
EU Dairy farms report 2012 Annex II EU 15
EU 15 Milk specialised farms
Milk specialised farms - net economic margin
338320 313 321 314 304
350 349
293
375360 351 353 348 353
375392 379
-37 -39 -38-32 -33
-49
-25
-43
-86
0
50
100
150
200
250
300
350
400
450
2001 2002 2003 2004 2005 2006 2007 2008 2009
EUR/t
-100
-90
-80
-70
-60
-50
-40
-30
-20
-10
0
Total revenues from milk Total costs Net economic margin with coupled payments
Milk specialised farms - non-operating costs
43 42 41 43 43 45 46 48 47
84 76 73 73 71 68 69 70 68
2625 21 21 16 17 17 13 25
0
50
100
150
200
250
2001 2002 2003 2004 2005 2006 2007 2008 2009
EUR/t Depreciation Wages Rent Interest Family labour costs Own capital unpaid cost
Milk specialised farms - income per work unit and margins per tonne
0
5 000
10 000
15 000
20 000
25 000
30 000
35 000
40 000
45 000
2001 2002 2003 2004 2005 2006 2007 2008 2009
EUR/WU
-100
-50
0
50
100
150
200EUR/t of milk
Farm Net Value Added (FNVA) Farm net income (FNI)
Remuneration of Family Labour (RFL) Gross margin with coupled payments
Net margin with coupled payments Net economic margin with coupled payments
Source: EU FADN DG AGRI, model of the allocation of costs for milk. 55

EU Dairy farms report 2012 Annex II EU 10
EU 10 Milk specialised farms
e: estimate*: trend between the average of the first three available years and the average of the last available three yearsSTRUCTURAL INFORMATION
2004 2005 2006 2007 2008 2009 2010e 2011e
Three years
average trend*
Trend 2011 /2007
Sample farms 2 569 3 158 3 152 2 955 3 349 3 394 9%Farms represented 91 995 111 446 111 586 97 516 108 232 109 467 0%% production from specialised farms 54% 61% 63% 56% 60% 59% -1%Forage area - ha 18 19 22 22 22 20 10%Dairy cows - LU 18 17 18 18 18 17 4%Rented UAA - % 50% 46% 49% 46% 47% 45% -2%Total labour - AWU 2,11 2,11 2,19 2,14 2,13 2,08 -1%Family labour - % 83% 82% 80% 81% 81% 83% 0%Milk per ha fodder area - t/ha 5,0 4,6 4,4 4,5 4,6 4,8 -1%Milk yield - kg/cow 5 193 5 366 5 530 5 566 5 588 5 577 5 618 5 892 6% 6%Milk production - t 91 89 98 102 102 97 98 103 7% 1%
MILK MARGINS in EUR/t of milk (nominal)
2004 2005 2006 2007 2008 2009 2010e 2011e
Three years
average trend*
Trend 2011 /2007
RevenuesPrice 219 242 246 283 296 214 265 293 9% 4%EU coupled payments (incl. Art.69) 0 0 1 0 0 0 0 0 - -National aids 3 3 7 1 1 2 2 2 -62% 143%Total revenues from milk 222 245 253 283 297 215 266 295 8% 4%Production costs Feed 68 69 73 89 101 75 75 86 13% -3%
homegrown feed 32 38 38 44 51 39 38 44 12% 0%puchased feed 35 32 35 45 50 36 37 43 14% -6%
Herd renewal purchases 3 3 3 3 3 2 2 2 -40% -39%Milk levy 0 0 0 0 0 0 0 0 - -Other specific costs 12 11 14 14 14 13 13 12 3% -9%Specific costs 82 84 89 106 118 90 89 101 9% -5%Machinery and building upkeep 11 13 14 16 17 14 14 15 12% -8%Energy (fuel, electricity) 17 20 22 22 28 23 25 26 25% 22%Contract work 6 6 6 7 8 7 7 7 23% 11%Taxes 0 0 0 0 0 0 0 0 -3% 2%Other direct inputs 9 10 11 11 14 12 12 13 23% 11%Non specific costs 43 50 54 56 67 57 59 61 21% 10%Total operating costs 125 134 143 162 185 146 148 162 14% 0%Gross margin 94 108 103 121 110 67 117 131 4% 9%Gross margin with coupled payments 97 111 111 122 111 69 118 133 0% 9%
%spe.farms with positive gross margin 98% 97% 98% 97% 92% 87% 94% 94% -6% -3%
%milk production with positive gross margin 98% 99% 98% 98% 95% 92% 97% 97% -3% -1%
Depreciation 30 33 36 37 43 41 23%Wages 12 15 18 18 22 17 28%Rent 2 3 3 4 4 4 41%Interest 3 3 4 4 5 5 45%External factors 18 21 25 26 32 26 32%Net margin 46 54 43 58 36 1 -34%
Net margin with coupled payments 49 58 50 59 36 2 -38%
Family labour costs 39 46 45 51 66 62 38%Own capital unpaid cost 16 19 22 18 13 25 -3%Imputed family factors 55 64 67 69 79 87 26%Net economic margin -9 -10 -24 -11 -43 -86 -225%Net economic margin with coupled payments -5 -7 -17 -10 -42 -85 -376%
%spe.farms with positive net economic margin 34% 32% 27% 34% 20% 8% -10%
%milk production with positive net economic margin 52% 51% 45% 53% 39% 19% -12%
Source: EU FADN DG AGRI, model of the allocation of costs for milk. 56

EU Dairy farms report 2012 Annex II EU 10
EU 10 Milk specialised farmsINCOME in EUR/AWU (nominal)
2004 2005 2006 2007 2008 2009
Three years
average trend*
Total output 14 070 15 166 16 752 20 906 21 881 16 060 28%Intermediate consumptions 8 419 8 769 10 134 12 151 14 293 11 753 40%Balance subsidies and taxes 1 989 2 133 3 366 3 584 4 124 4 034 57%
Decoupled payments 522 720 969 1 229 1 518 1 765 104%Depreciation 1 917 2 033 2 357 2 620 2 998 2 783 33%Farm Net Value Added (FNVA) 5 722 6 497 7 626 9 720 8 715 5 558 12%
External factors 1 199 1 339 1 687 1 901 2 304 1 870 44%Wages 829 985 1 244 1 339 1 628 1 256 38%
Rent 151 165 208 258 298 260 56%Interest 219 188 234 303 378 355 61%
Balance invest. subs. and taxes 100 -8 47 108 292 330 428%Farm net income (FNI) 4 622 5 150 5 986 7 927 6 702 4 018 18%
Family farms only in EUR/FWU (nominal)Own capital unpaid cost 1 247 1 380 1 846 1 537 1 147 2 020 5%Remuneration of Family Labour (RFL) 4 286 4 661 5 736 7 896 6 949 3 466 25%
%spe.farms with positive RFL 86% 87% 90% 93% 89% 76% -1%
Milk specialised farms - gross margin
97 111 111122
111
69
118
133
0
50
100
150
200
250
300
350
Rev
enue
s
Ope
ratin
g
Rev
enue
s
Ope
ratin
g
Rev
enue
s
Ope
ratin
g
Rev
enue
s
Ope
ratin
g
Rev
enue
s
Ope
ratin
g
Rev
enue
s
Ope
ratin
g
Rev
enue
s
Ope
ratin
g
Rev
enue
s
Ope
ratin
g
2004 2005 2006 2007 2008 2009 2010e 2011e
EUR/t
Price EU coupled payments (incl. Art.69)
National aids Feed
Other specific costs Non specific costs
Gross margin with coupled payments
Milk specialised farms - net margin
222245 253
283297
215
173 188 203225 213
148
49
58
50
59
36
20
50
100
150
200
250
300
350
2004 2005 2006 2007 2008 2009
EUR/t
0
10
20
30
40
50
60
70
Total revenues from milkOperating costs + depreciation + external factorsNet margin with coupled payments
Source: EU FADN DG AGRI, model of the allocation of costs for milk. 57

EU Dairy farms report 2012 Annex II EU 10
EU 10 Milk specialised farms
Milk specialised farms - net economic margin
222245 253
283297
215
228252
270293
339
300
-5 -7
-17
-10
-42
-850
50
100
150
200
250
300
350
400
2004 2005 2006 2007 2008 2009
EUR/t
-90
-80
-70
-60
-50
-40
-30
-20
-10
0
Total revenues from milkTotal costsNet economic margin with coupled payments
Milk specialised farms - non-operating costs
30 33 36 37 43 41
3946
45 51
666216
1922
18
13 25
0
20
40
60
80
100
120
140
160
180
2004 2005 2006 2007 2008 2009
EUR/t Depreciation Wages Rent Interest Family labour costs Own capital unpaid cost
Milk specialised farms - income per work unit and margins per tonne
0
2 000
4 000
6 000
8 000
10 000
12 000
2004 2005 2006 2007 2008 2009
EUR/WU
-100
-50
0
50
100
150EUR/t of milk
Farm Net Value Added (FNVA) Farm net income (FNI)
Remuneration of Family Labour (RFL) Gross margin with coupled payments
Net margin with coupled payments Net economic margin with coupled payments
Source: EU FADN DG AGRI, model of the allocation of costs for milk. 58

EU Dairy farms report 2012 Annex II EU 2
EU 2 Milk specialised farms
e: estimate*: trend between the average of the first three available years and the average of the last available three yearsSTRUCTURAL INFORMATION
2007 2009 2010e 2011e Trend 2009/2007
Trend 2011 /2007
Sample farms 357 513 44%Farms represented 173 325 119 575 -31%% production from specialised farms 75% 64% -10%Forage area - ha 4 4 -3%Dairy cows - LU 5 7 29%Rented UAA - % 49% 41% -8%Total labour - AWU 2,00 1,79 -11%Family labour - % 90% 87% -3%Milk per ha fodder area - t/ha 4,1 4,7 16%Milk yield - kg/cow 4 030 3 877 4 404 4 130 2%Milk production - t 22 27 31 29 32%
MILK MARGINS in EUR/t of milk (nominal)
2007 2009 2010e 2011e Trend 2009/2007
Trend 2011 /2007
RevenuesPrice 332 274 320 376 13%EU coupled payments (incl. Art.69) 0 0 0 0 -National aids 15 9 8 9 -44%Total revenues from milk 347 283 328 385 11%Production costs Feed 75 66 63 84 12%
homegrown feed 25 25 23 31 26%puchased feed 51 42 39 53 5%
Herd renewal purchases 1 3 3 3 292%Milk levy 0 0 0 0 -Other specific costs 19 18 17 18 -4%Specific costs 95 87 82 106 11%Machinery and building upkeep 9 10 9 11 15%Energy (fuel, electricity) 21 19 20 25 19%Contract work 12 10 9 10 -18%Taxes 1 1 1 1 -30%Other direct inputs 6 9 8 9 58%Non specific costs 49 49 47 55 12%Total operating costs 144 136 129 160 12%Gross margin 188 138 191 216 15%Gross margin with coupled payments 203 147 199 225 10%
%spe.farms with positive gross margin 97% 94% 97% 96% -1%
%milk production with positive gross margin 96% 92% 95% 95% -1%
Depreciation 24 29 22%Wages 16 21 29%Rent 5 4 -34%Interest 5 3 -39%External factors 26 27 4%Net margin 138 82 -41%Net margin with coupled payments 153 91 -41%
Family labour costs 141 108 -23%Own capital unpaid cost 15 31 113%Imputed family factors 155 140 -10%Net economic margin -17 -58 -234%Net economic margin with coupled payments -2 -49 -2335%
%spe.farms with positive net economic margin 28% 25% -3%
%milk production with positive net economic margin 53% 42% -11%
Source: EU FADN DG AGRI, model of the allocation of costs for milk. 59

EU Dairy farms report 2012 Annex II EU 2
EU 2 Milk specialised farmsINCOME in EUR/AWU (nominal)
2007 2009 Trend 2009/2007
Total output 5 339 6 628 24%Intermediate consumptions 2 821 3 614 28%Balance subsidies and taxes 733 797 9%
Decoupled payments 147 271 84%Depreciation 392 665 70%Farm Net Value Added (FNVA) 2 858 3 145 -65%
External factors 375 574 53%Wages 229 440 92%
Rent 83 79 -4%Interest 64 55 -14%
Balance invest. subs. and taxes 2 7 330%Farm net income (FNI) 2 484 2 578 4%
Family farms only in EUR/FWU (nominal)Own capital unpaid cost 268 823 207%Remuneration of Family Labour (RFL) 1 695 2 011 19%
%spe.farms with positive RFL 89% 77% -12%
Milk specialised farms - gross margin
203
147
199225
0
50
100
150
200
250
300
350
400
450
Revenues Operatingcosts
Revenues Operatingcosts
Revenues Operatingcosts
Revenues Operatingcosts
2007 2009 2010e 2011e
EUR/t
Price EU coupled payments (incl. Art.69)National aids FeedOther specific costs Non specific costsGross margin with coupled payments
Milk specialised farms - net margin
347
283
194
0
153
91
0
50
100
150
200
250
300
350
400
2007 2009
EUR/t
0
20
40
60
80
100
120
140
160
180
Total revenues from milk
Operating costs + depreciation + external factors
Net margin with coupled payments
Source: EU FADN DG AGRI, model of the allocation of costs for milk. 60

EU Dairy farms report 2012 Annex II EU 2
EU 2 Milk specialised farms
Milk specialised farms - net economic margin
347
283
349
0
-2
-49
0
50
100
150
200
250
300
350
400
2007 2009
EUR/t
-60
-50
-40
-30
-20
-10
0
Total revenues from milkTotal costsNet economic margin with coupled payments
Milk specialised farms - non-operating costs
24 29
141108
1531
0
50
100
150
200
250
2007 2009
EUR/t
Depreciation WagesRent InterestFamily labour costs Own capital unpaid cost
Milk specialised farms - income per work unit and margins per tonne
0
500
1 000
1 500
2 000
2 500
3 000
3 500
2007 2009
EUR/WU
-100
-50
0
50
100
150
200
250EUR/t of milk
Farm Net Value Added (FNVA)Farm net income (FNI)Remuneration of Family Labour (RFL)Gross margin with coupled paymentsNet margin with coupled paymentsNet economic margin with coupled payments
Source: EU FADN DG AGRI, model of the allocation of costs for milk. 61

EU Dairy farms report 2012 Annex II BE
Belgium Milk specialised farms
e: estimate*: trend between the average of the first three available years and the average of the last available three yearsSTRUCTURAL INFORMATION
2001 2002 2003 2004 2005 2006 2007 2008 2009 2010e 2011e
Three years
average trend*
Trend 2011 /2007
Sample farms 298 276 251 241 247 219 251 238 214 -15%Farms represented 7 765 7 374 7 050 6 207 6 528 5 613 6 685 6 103 5 397 -18%% production from specialised farms 68% 68% 65% 63% 67% 64% 72% 69% 62% 1%Forage area - ha 36 38 39 36 38 39 39 42 41 7%Dairy cows - LU 48 49 50 47 48 51 50 53 54 7%Rented UAA - % 75% 75% 76% 74% 75% 75% 74% 74% 74% -1%Total labour - AWU 1,53 1,55 1,55 1,58 1,59 1,57 1,57 1,66 1,64 5%Family labour - % 99% 99% 98% 98% 99% 99% 99% 99% 98% 0%Milk per ha fodder area - t/ha 7,7 7,9 8,0 8,2 8,0 8,2 8,6 8,4 9,1 11%Milk yield - kg/cow 5 873 6 123 6 240 6 297 6 366 6 323 6 756 6 680 6 910 7 175 7 368 18% 9%Milk production - t 279 301 314 298 308 322 340 352 371 385 395 29% 16%
MILK MARGINS in EUR/t of milk (nominal)
2001 2002 2003 2004 2005 2006 2007 2008 2009 2010e 2011e
Three years
average trend*
Trend 2011 /2007
RevenuesPrice 328 304 303 309 294 293 349 333 254 327 356 0% 2%EU coupled payments (incl. Art.69) 0 0 0 12 24 0 0 0 0 0 0 - -National aids 0 0 0 0 0 0 0 0 0 0 0 - #DIV/0!Total revenues from milk 328 303 299 320 316 293 349 333 254 327 356 1% 2%Production costs Feed 72 72 69 71 65 69 77 92 74 58 66 -7% -15%
homegrown feed 26 27 25 27 26 26 28 32 26 24 27 -1% -6%puchased feed 46 45 44 44 39 43 49 60 47 34 39 -11% -21%
Herd renewal purchases 2 2 2 2 2 3 4 3 3 3 3 96% -15%Milk levy 0 1 3 0 3 0 0 0 0 0 0 - -Other specific costs 16 17 17 21 21 21 21 22 20 20 20 21% -4%Specific costs 89 91 92 95 91 93 102 118 97 82 89 -1% -13%Machinery and building upkeep 15 15 14 14 15 14 15 15 14 15 15 0% 5%Energy (fuel, electricity) 10 9 9 10 12 13 13 16 13 15 18 63% 38%Contract work 15 16 15 17 18 18 19 22 19 19 19 23% -3%Taxes 1 1 1 1 1 1 1 1 1 1 1 -1% -7%Other direct inputs 9 9 9 11 10 11 11 12 11 11 11 23% -2%Non specific costs 50 50 48 54 56 56 59 65 58 61 64 23% 8%Total operating costs 139 141 140 149 147 149 161 183 155 143 153 7% -5%Gross margin 189 163 163 160 148 144 188 150 99 185 203 -5% 8%Gross margin with coupled payments 189 162 160 171 169 144 188 150 99 185 203 -5% 8%
%spe.farms with positive gross margin 100% 100% 100% 100% 100% 99% 100% 98% 97% 100% 100% -1% 0%
%milk production with positive gross margin 100% 100% 100% 100% 100% 100% 100% 100% 98% 100% 100% -1% 0%
Depreciation 34 34 34 38 39 40 44 49 47 38%Wages 1 1 1 1 1 1 1 1 1 -21%Rent 14 14 14 16 17 16 15 15 14 3%Interest 22 20 19 19 17 16 16 17 16 -19%External factors 37 35 35 36 35 33 32 33 31 -10%Net margin 118 94 94 86 73 71 111 68 21 -35%
Net margin with coupled payments 118 94 91 98 94 71 111 68 21 -34%
Family labour costs 88 86 84 92 88 84 82 87 77 -5%Own capital unpaid cost 6 8 6 6 3 4 7 1 13 1%Imputed family factors 94 94 90 98 91 88 89 88 90 -4%Net economic margin 24 0 4 -12 -18 -17 22 -20 -70 -339%Net economic margin with coupled payments 24 0 0 0 3 -17 22 -20 -69 -382%
%spe.farms with positive net economic margin 57% 48% 49% 36% 34% 32% 55% 35% 11% -18%
%milk production with positive net economic margin 71% 59% 61% 47% 45% 43% 69% 45% 15% -21%
Source: EU FADN DG AGRI, model of the allocation of costs for milk. 62

EU Dairy farms report 2012 Annex II BE
Belgium Milk specialised farmsINCOME in EUR/AWU (nominal)
2001 2002 2003 2004 2005 2006 2007 2008 2009
Three years
average trend*
Total output 76 770 75 474 80 057 77 573 78 936 81 741 101 495 92 654 77 339 17%Intermediate consumptions 33 806 35 562 36 039 37 705 38 218 40 984 48 848 51 802 45 926 39%Balance subsidies and taxes 7 666 7 168 6 611 8 756 11 351 15 213 16 007 15 932 14 492 117%
Decoupled payments 0 0 0 0 3 996 11 449 11 573 11 459 11 046 -Depreciation 8 384 8 824 9 453 9 888 10 429 11 181 13 087 13 802 14 390 55%Farm Net Value Added (FNVA) 42 245 38 256 41 177 38 736 41 640 44 788 55 567 42 982 31 516 40%
External factors 9 098 9 266 9 753 9 496 9 384 9 263 9 392 9 282 9 484 0%Wages 245 255 360 339 240 232 156 212 306 -21%
Rent 3 576 3 740 4 055 4 152 4 608 4 529 4 484 4 401 4 262 16%Interest 5 278 5 272 5 338 5 004 4 536 4 501 4 752 4 670 4 916 -10%
Balance invest. subs. and taxes -876 -802 -373 -970 -1 026 -1 189 -1 141 -1 453 -267 -39%Farm net income (FNI) 32 270 28 188 31 051 28 270 31 230 34 337 45 033 32 247 21 765 8%
Family farms only in EUR/FWU (nominal)Own capital unpaid cost 1 563 2 182 1 713 1 629 783 1 157 2 086 307 4 007 17%Remuneration of Family Labour (RFL) 31 148 26 424 29 941 27 208 30 848 33 661 43 266 32 283 18 152 7%
%spe.farms with positive RFL 99% 96% 99% 95% 99% 99% 100% 95% 88% -3%
Milk specialised farms - gross margin
203189
162 160171 169
144
188150
99
185
0
50
100
150
200
250
300
350
400
Rev
enue
s
Ope
ratin
g
Rev
enue
s
Ope
ratin
g
Rev
enue
s
Ope
ratin
g
Rev
enue
s
Ope
ratin
g
Rev
enue
s
Ope
ratin
g
Rev
enue
s
Ope
ratin
g
Rev
enue
s
Ope
ratin
g
Rev
enue
s
Ope
ratin
g
Rev
enue
s
Ope
ratin
g
Rev
enue
s
Ope
ratin
g
Rev
enue
s
Ope
ratin
g2001 2002 2003 2004 2005 2006 2007 2008 2009 2010e 2011e
EUR/t
Price EU coupled payments (incl. Art.69) National aids
Feed Other specific costs Non specific costs
Gross margin with coupled payments
Milk specialised farms - net margin
328303 299
320 316293
349333
254
210 209 209 223 221 222 237265
234
118
94 9198 94
71
111
68
21
0
50
100
150
200
250
300
350
400
2001 2002 2003 2004 2005 2006 2007 2008 2009
EUR/t
0
20
40
60
80
100
120
140
Total revenues from milk Operating costs + depreciation + external factors
Net margin with coupled payments
Source: EU FADN DG AGRI, model of the allocation of costs for milk. 63

EU Dairy farms report 2012 Annex II BE
Belgium Milk specialised farms
Milk specialised farms - net economic margin
328303 299
320 316293
349333
254
304 304 299321 312 311
326353
32424
0 0 0 3
-17
22
-20
-69
0
50
100
150
200
250
300
350
400
2001 2002 2003 2004 2005 2006 2007 2008 2009
EUR/t
-80
-60
-40
-20
0
20
40
Total revenues from milk Total costs Net economic margin with coupled payments
Milk specialised farms - non-operating costs
34 34 34 38 39 40 44 49 47
88 86 8492 88 84 82
8777
6 8 66 3 4 7
113
0
20
40
60
80
100
120
140
160
180
200
2001 2002 2003 2004 2005 2006 2007 2008 2009
EUR/t Depreciation Wages Rent Interest Family labour costs Own capital unpaid cost
Milk specialised farms - income per work unit and margins per tonne
0
10 000
20 000
30 000
40 000
50 000
60 000
2001 2002 2003 2004 2005 2006 2007 2008 2009
EUR/WU
-100
-50
0
50
100
150
200
250EUR/t of milk
Farm Net Value Added (FNVA) Farm net income (FNI)
Remuneration of Family Labour (RFL) Gross margin with coupled payments
Net margin with coupled payments Net economic margin with coupled payments
Source: EU FADN DG AGRI, model of the allocation of costs for milk. 64

EU Dairy farms report 2012 Annex II DK
Denmark Milk specialised farms
e: estimate*: trend between the average of the first three available years and the average of the last available three yearsSTRUCTURAL INFORMATION
2001 2002 2003 2004 2005 2006 2007 2008 2009 2010e 2011e
Three years
average trend*
Trend 2011 /2007
Sample farms 434 438 399 344 379 364 372 389 487 -2%Farms represented 9 218 6 554 6 500 5 393 5 287 4 611 4 460 4 657 4 279 -40%% production from specialised farms 93% 95% 94% 96% 96% 96% 95% 97% 97% 2%Forage area - ha 46 58 60 67 63 76 81 85 95 59%Dairy cows - LU 65 84 84 93 98 113 119 118 123 55%Rented UAA - % 26% 30% 30% 30% 20% 30% 27% 26% 27% -2%Total labour - AWU 1,71 1,94 1,89 1,96 1,98 2,16 2,20 2,21 2,23 20%Family labour - % 72% 65% 66% 63% 63% 60% 59% 56% 53% -12%Milk per ha fodder area - t/ha 9,9 10,7 10,8 11,0 12,6 12,4 12,1 11,4 10,7 9%Milk yield - kg/cow 7 043 7 392 7 720 7 935 8 096 8 407 8 268 8 272 8 278 8 458 8 318 13% 1%Milk production - t 456 619 648 742 795 950 984 978 1 020 1 042 1 025 79% 4%
MILK MARGINS in EUR/t of milk (nominal)
2001 2002 2003 2004 2005 2006 2007 2008 2009 2010e 2011e
Three years
average trend*
Trend 2011 /2007
RevenuesPrice 349 344 332 311 309 299 333 387 302 350 391 2% 17%EU coupled payments (incl. Art.69) 0 0 0 11 0 0 0 0 0 0 0 - -National aids 0 0 0 0 0 0 0 0 0 0 0 - -Total revenues from milk 348 344 330 320 308 299 332 386 302 350 391 2% 18%Production costs Feed 99 99 92 90 86 85 91 118 108 99 121 13% 32%
homegrown feed 21 20 19 18 16 16 17 22 21 18 22 2% 28%puchased feed 78 79 73 72 70 69 74 96 87 80 99 16% 33%
Herd renewal purchases 1 1 2 6 6 6 0 6 4 4 4 187% #DIV/0!Milk levy 2 0 2 3 0 0 2 0 0 0 0 -97% -98%Other specific costs 23 23 24 24 24 26 28 31 31 30 31 32% 11%Specific costs 125 124 120 123 116 117 121 155 143 133 156 17% 29%Machinery and building upkeep 24 23 21 20 22 21 22 27 28 28 29 23% 29%Energy (fuel, electricity) 9 8 8 8 11 11 11 14 13 14 17 73% 53%Contract work 26 26 26 26 26 25 27 32 33 33 36 31% 31%Taxes 1 1 1 1 1 1 1 1 1 1 1 11% 25%Other direct inputs 17 16 16 15 16 14 15 17 18 19 20 17% 31%Non specific costs 76 74 73 71 76 72 76 91 93 95 102 30% 34%Total operating costs 201 197 193 194 193 189 198 247 236 228 259 22% 31%Gross margin 149 147 139 117 116 110 136 140 66 123 132 -26% -3%Gross margin with coupled payments 147 146 137 126 116 110 134 140 66 123 132 -26% -1%
%spe.farms with positive gross margin 100% 100% 99% 99% 97% 96% 99% 96% 88% 95% 95% -7% -4%
%milk production with positive gross margin 100% 100% 100% 100% 99% 99% 100% 99% 94% 98% 98% -3% -1%
Depreciation 41 39 37 38 39 37 39 45 46 10%Wages 20 22 21 21 23 23 25 30 32 36%Rent 10 12 12 13 11 17 15 15 15 37%Interest 64 61 55 52 52 49 65 120 86 52%External factors 93 95 88 86 85 89 106 165 134 46%Net margin 14 12 14 -6 -8 -16 -9 -70 -114 -584%
Net margin with coupled payments 13 12 12 2 -8 -16 -11 -70 -114 -644%
Family labour costs 76 60 60 53 54 47 47 48 45 -29%Own capital unpaid cost 11 8 8 15 21 16 8 3 8 -28%Imputed family factors 88 68 68 68 75 63 55 51 53 -29%Net economic margin -73 -56 -54 -74 -83 -79 -64 -120 -167 -92%Net economic margin with coupled payments -75 -56 -56 -66 -83 -79 -66 -121 -167 -88%
%spe.farms with positive net economic margin 4% 6% 6% - 3% 3% 7% 4% - -
%milk production with positive net economic margin 5% 9% 9% - 5% 5% 9% 5% - -
Source: EU FADN DG AGRI, model of the allocation of costs for milk. 65
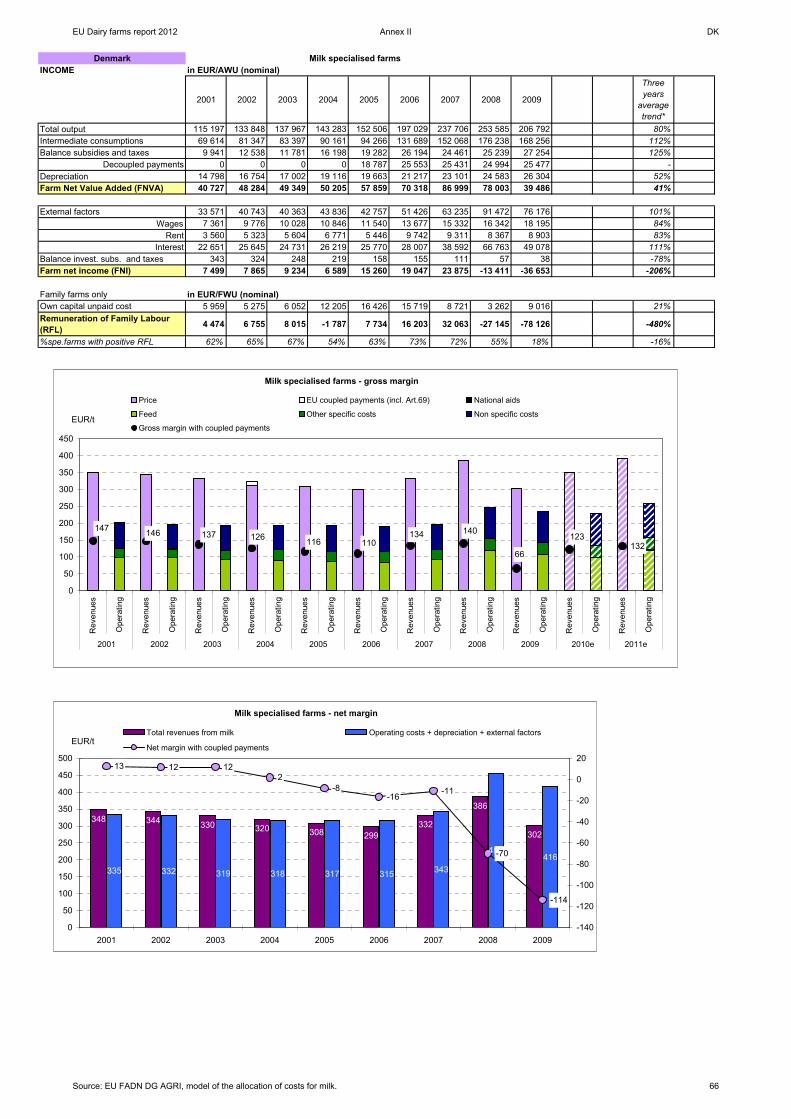
EU Dairy farms report 2012 Annex II DK
Denmark Milk specialised farmsINCOME in EUR/AWU (nominal)
2001 2002 2003 2004 2005 2006 2007 2008 2009
Three years
average trend*
Total output 115 197 133 848 137 967 143 283 152 506 197 029 237 706 253 585 206 792 80%Intermediate consumptions 69 614 81 347 83 397 90 161 94 266 131 689 152 068 176 238 168 256 112%Balance subsidies and taxes 9 941 12 538 11 781 16 198 19 282 26 194 24 461 25 239 27 254 125%
Decoupled payments 0 0 0 0 18 787 25 553 25 431 24 994 25 477 -Depreciation 14 798 16 754 17 002 19 116 19 663 21 217 23 101 24 583 26 304 52%Farm Net Value Added (FNVA) 40 727 48 284 49 349 50 205 57 859 70 318 86 999 78 003 39 486 41%
External factors 33 571 40 743 40 363 43 836 42 757 51 426 63 235 91 472 76 176 101%Wages 7 361 9 776 10 028 10 846 11 540 13 677 15 332 16 342 18 195 84%
Rent 3 560 5 323 5 604 6 771 5 446 9 742 9 311 8 367 8 903 83%Interest 22 651 25 645 24 731 26 219 25 770 28 007 38 592 66 763 49 078 111%
Balance invest. subs. and taxes 343 324 248 219 158 155 111 57 38 -78%Farm net income (FNI) 7 499 7 865 9 234 6 589 15 260 19 047 23 875 -13 411 -36 653 -206%
Family farms only in EUR/FWU (nominal)Own capital unpaid cost 5 959 5 275 6 052 12 205 16 426 15 719 8 721 3 262 9 016 21%Remuneration of Family Labour (RFL) 4 474 6 755 8 015 -1 787 7 734 16 203 32 063 -27 145 -78 126 -480%
%spe.farms with positive RFL 62% 65% 67% 54% 63% 73% 72% 55% 18% -16%
Milk specialised farms - gross margin
132
147 146 137 126 116 110134 140
66
123
0
50
100
150
200
250
300
350
400
450
Rev
enue
s
Ope
ratin
g
Rev
enue
s
Ope
ratin
g
Rev
enue
s
Ope
ratin
g
Rev
enue
s
Ope
ratin
g
Rev
enue
s
Ope
ratin
g
Rev
enue
s
Ope
ratin
g
Rev
enue
s
Ope
ratin
g
Rev
enue
s
Ope
ratin
g
Rev
enue
s
Ope
ratin
g
Rev
enue
s
Ope
ratin
g
Rev
enue
s
Ope
ratin
g2001 2002 2003 2004 2005 2006 2007 2008 2009 2010e 2011e
EUR/t
Price EU coupled payments (incl. Art.69) National aids
Feed Other specific costs Non specific costs
Gross margin with coupled payments
Milk specialised farms - net margin
348 344 330 320 308 299332
386
302
335 332 319 318 317 315 343
456416
13 12 122
-8-16
-11
-70
-114
0
50
100
150
200
250
300
350
400
450
500
2001 2002 2003 2004 2005 2006 2007 2008 2009
EUR/t
-140
-120
-100
-80
-60
-40
-20
0
20
Total revenues from milk Operating costs + depreciation + external factors
Net margin with coupled payments
Source: EU FADN DG AGRI, model of the allocation of costs for milk. 66

EU Dairy farms report 2012 Annex II DK
Denmark Milk specialised farms
Milk specialised farms - net economic margin
348 344 330 320 308 299332
386
302
423400 387 385 392 378
398
507469
-75
-56 -56-66
-83 -79-66
-121
-1670
100
200
300
400
500
600
2001 2002 2003 2004 2005 2006 2007 2008 2009
EUR/t
-180
-160
-140
-120
-100
-80
-60
-40
-20
0
Total revenues from milk Total costs Net economic margin with coupled payments
Milk specialised farms - non-operating costs
41 39 37 38 39 37 39 45 46
76 6060 53 54 47
47
48
4511
88 15 21 16
8
3
8
0
50
100
150
200
250
300
2001 2002 2003 2004 2005 2006 2007 2008 2009
EUR/t Depreciation Wages Rent Interest Family labour costs Own capital unpaid cost
Milk specialised farms - income per work unit and margins per tonne
-100 000
-80 000
-60 000
-40 000
-20 000
0
20 000
40 000
60 000
80 000
100 000
2001 2002 2003 2004 2005 2006 2007 2008 2009
EUR/WU
-200
-150
-100
-50
0
50
100
150
200
EUR/t of milk
Farm Net Value Added (FNVA) Farm net income (FNI)
Remuneration of Family Labour (RFL) Gross margin with coupled payments
Net margin with coupled payments Net economic margin with coupled payments
Source: EU FADN DG AGRI, model of the allocation of costs for milk. 67

EU Dairy farms report 2012 Annex II DE
Germany Milk specialised farms
e: estimate*: trend between the average of the first three available years and the average of the last available three yearsSTRUCTURAL INFORMATION
2001 2002 2003 2004 2005 2006 2007 2008 2009 2010e 2011e
Three years
average trend*
Trend 2011 /2007
Sample farms 1 986 1 929 1 823 1 765 1 883 1 836 1 934 1 812 2 039 1%Farms represented 76 521 69 589 67 224 62 955 66 641 61 979 65 232 60 906 60 196 -13%% production from specialised farms 81% 77% 75% 74% 80% 82% 85% 80% 80% 4%Forage area - ha 40 41 42 43 45 48 48 48 49 17%Dairy cows - LU 43 44 45 46 48 50 50 51 51 15%Rented UAA - % 64% 63% 64% 63% 66% 67% 67% 66% 65% 2%Total labour - AWU 1,86 1,80 1,82 1,79 1,93 1,95 1,95 1,95 1,92 6%Family labour - % 84% 83% 82% 84% 78% 77% 76% 76% 77% -7%Milk per ha fodder area - t/ha 7,0 7,2 7,2 7,3 7,3 7,6 7,5 7,7 7,8 8%Milk yield - kg/cow 6 506 6 640 6 769 6 890 6 976 7 243 7 190 7 297 7 387 7 465 7 628 13% 6%Milk production - t 277 294 306 319 331 361 359 369 380 384 392 32% 9%
MILK MARGINS in EUR/t of milk (nominal)
2001 2002 2003 2004 2005 2006 2007 2008 2009 2010e 2011e
Three years
average trend*
Trend 2011 /2007
RevenuesPrice 340 310 299 297 290 295 382 306 273 350 353 3% -8%EU coupled payments (incl. Art.69) 0 0 0 11 0 0 0 0 0 0 0 - -National aids 0 0 0 0 0 0 0 0 0 0 0 - -Total revenues from milk 339 310 298 305 289 295 380 306 273 350 353 3% -7%Production costs Feed 74 74 76 71 70 75 94 92 77 98 100 23% 7%
homegrown feed 27 26 26 25 26 28 33 32 26 30 31 8% -6%puchased feed 47 47 50 46 44 47 61 60 51 68 69 31% 13%
Herd renewal purchases 2 3 2 2 2 2 2 2 2 2 2 -6% -8%Milk levy 1 0 2 2 1 0 2 0 0 0 0 -96% -97%Other specific costs 22 21 21 22 22 22 24 25 23 23 22 8% -4%Specific costs 99 97 102 97 95 99 122 119 102 123 125 18% 3%Machinery and building upkeep 24 22 20 21 22 23 26 23 21 21 21 -4% -19%Energy (fuel, electricity) 19 19 19 21 24 24 27 27 24 27 28 40% 6%Contract work 14 14 13 14 14 15 17 17 17 17 17 26% -4%Taxes 2 2 2 2 2 2 2 2 2 2 2 -3% -7%Other direct inputs 30 27 27 27 29 27 29 27 26 26 25 -9% -12%Non specific costs 89 83 81 84 91 90 102 96 90 92 94 9% -8%Total operating costs 188 181 183 181 186 189 223 215 192 215 219 14% -2%Gross margin 152 129 117 116 104 106 158 91 81 135 134 -12% -16%Gross margin with coupled payments 151 129 115 124 103 106 157 91 81 135 134 -12% -15%
%spe.farms with positive gross margin 99% 99% 98% 99% 98% 99% 99% 95% 94% 97% 97% -3% -2%
%milk production with positive gross margin 100% 100% 99% 100% 99% 99% 100% 97% 97% 99% 99% -1% -1%
Depreciation 52 47 45 44 45 45 49 48 47 0%Wages 14 12 13 11 17 16 18 18 16 34%Rent 22 22 21 20 20 20 20 17 17 -17%Interest 11 11 11 10 10 10 10 9 10 -11%External factors 47 45 44 41 47 46 48 45 42 -1%Net margin 53 37 27 31 13 14 61 -2 -7 -57%
Net margin with coupled payments 52 37 26 40 11 14 59 -2 -8 -57%
Family labour costs 72 62 58 53 52 49 52 48 48 -23%Own capital unpaid cost 37 33 30 22 18 22 16 19 31 -35%Imputed family factors 109 95 88 75 70 70 68 67 80 -27%Net economic margin -56 -58 -61 -44 -57 -56 -7 -69 -87 7%Net economic margin with coupled payments -57 -58 -63 -35 -58 -56 -9 -69 -87 7%
%spe.farms with positive net economic margin 15% 12% 10% 16% 11% 10% 36% 8% 6% 4%
%milk production with positive net economic margin 26% 23% 20% 30% 20% 20% 53% 15% 12% 3%
Source: EU FADN DG AGRI, model of the allocation of costs for milk. 68
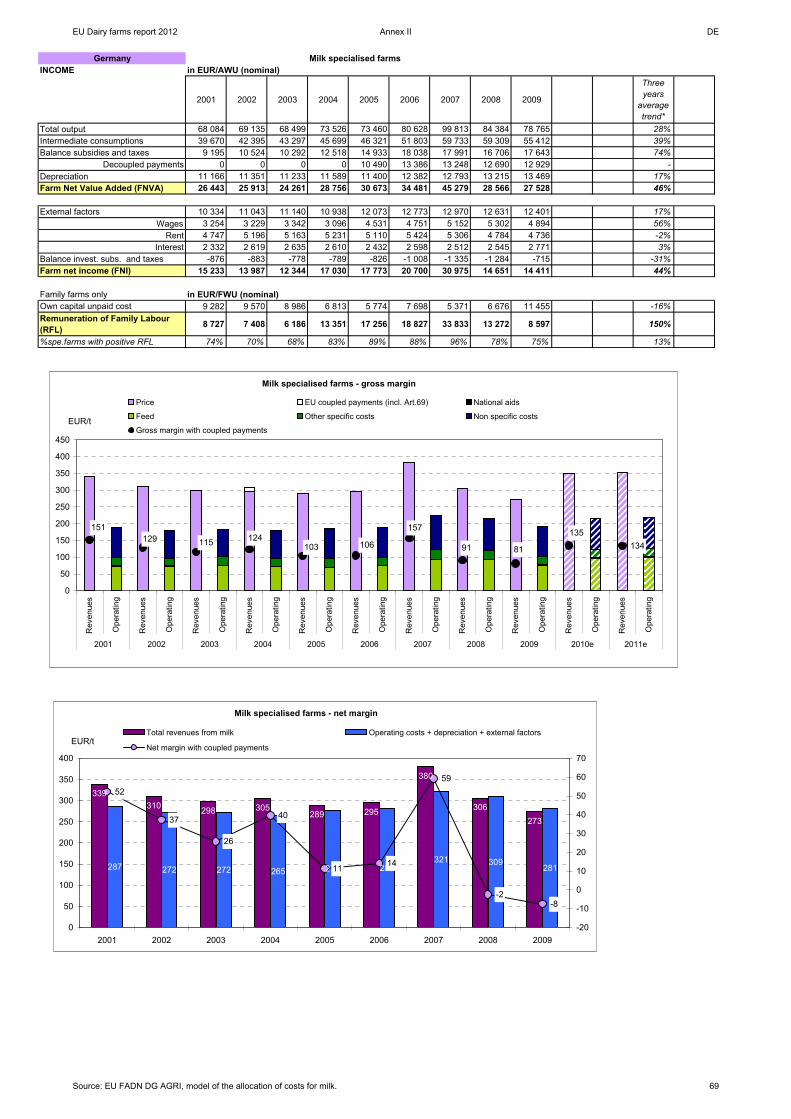
EU Dairy farms report 2012 Annex II DE
Germany Milk specialised farmsINCOME in EUR/AWU (nominal)
2001 2002 2003 2004 2005 2006 2007 2008 2009
Three years
average trend*
Total output 68 084 69 135 68 499 73 526 73 460 80 628 99 813 84 384 78 765 28%Intermediate consumptions 39 670 42 395 43 297 45 699 46 321 51 803 59 733 59 309 55 412 39%Balance subsidies and taxes 9 195 10 524 10 292 12 518 14 933 18 038 17 991 16 706 17 643 74%
Decoupled payments 0 0 0 0 10 490 13 386 13 248 12 690 12 929 -Depreciation 11 166 11 351 11 233 11 589 11 400 12 382 12 793 13 215 13 469 17%Farm Net Value Added (FNVA) 26 443 25 913 24 261 28 756 30 673 34 481 45 279 28 566 27 528 46%
External factors 10 334 11 043 11 140 10 938 12 073 12 773 12 970 12 631 12 401 17%Wages 3 254 3 229 3 342 3 096 4 531 4 751 5 152 5 302 4 894 56%
Rent 4 747 5 196 5 163 5 231 5 110 5 424 5 306 4 784 4 736 -2%Interest 2 332 2 619 2 635 2 610 2 432 2 598 2 512 2 545 2 771 3%
Balance invest. subs. and taxes -876 -883 -778 -789 -826 -1 008 -1 335 -1 284 -715 -31%Farm net income (FNI) 15 233 13 987 12 344 17 030 17 773 20 700 30 975 14 651 14 411 44%
Family farms only in EUR/FWU (nominal)Own capital unpaid cost 9 282 9 570 8 986 6 813 5 774 7 698 5 371 6 676 11 455 -16%Remuneration of Family Labour (RFL) 8 727 7 408 6 186 13 351 17 256 18 827 33 833 13 272 8 597 150%
%spe.farms with positive RFL 74% 70% 68% 83% 89% 88% 96% 78% 75% 13%
Milk specialised farms - gross margin
134
151129 115 124
103 106
157
91 81
135
0
50
100
150
200
250
300
350
400
450
Rev
enue
s
Ope
ratin
g
Rev
enue
s
Ope
ratin
g
Rev
enue
s
Ope
ratin
g
Rev
enue
s
Ope
ratin
g
Rev
enue
s
Ope
ratin
g
Rev
enue
s
Ope
ratin
g
Rev
enue
s
Ope
ratin
g
Rev
enue
s
Ope
ratin
g
Rev
enue
s
Ope
ratin
g
Rev
enue
s
Ope
ratin
g
Rev
enue
s
Ope
ratin
g2001 2002 2003 2004 2005 2006 2007 2008 2009 2010e 2011e
EUR/t
Price EU coupled payments (incl. Art.69) National aids
Feed Other specific costs Non specific costs
Gross margin with coupled payments
Milk specialised farms - net margin
339310 298 305
289 295
380
306273
287 272 272 265 278 280321 309
281
52
37
26
40
11 14
59
-2-8
0
50
100
150
200
250
300
350
400
2001 2002 2003 2004 2005 2006 2007 2008 2009
EUR/t
-20
-10
0
10
20
30
40
50
60
70
Total revenues from milk Operating costs + depreciation + external factors
Net margin with coupled payments
Source: EU FADN DG AGRI, model of the allocation of costs for milk. 69

EU Dairy farms report 2012 Annex II DE
Germany Milk specialised farms
Milk specialised farms - net economic margin
339310 298 305
289 295
380
306273
396368 360
340 347 351
389 375360
-57 -58-63
-35
-58 -56
-9
-69
-87
0
50
100
150
200
250
300
350
400
450
2001 2002 2003 2004 2005 2006 2007 2008 2009
EUR/t
-100
-90
-80
-70
-60
-50
-40
-30
-20
-10
0
Total revenues from milk Total costs Net economic margin with coupled payments
Milk specialised farms - non-operating costs
52 47 45 44 45 45 49 48 47
7262 58
53 52 4952 48 48
37
3330
22 18 22 16 19 31
0
50
100
150
200
250
2001 2002 2003 2004 2005 2006 2007 2008 2009
EUR/t Depreciation Wages Rent Interest Family labour costs Own capital unpaid cost
Milk specialised farms - income per work unit and margins per tonne
0
5 000
10 000
15 000
20 000
25 000
30 000
35 000
40 000
45 000
50 000
2001 2002 2003 2004 2005 2006 2007 2008 2009
EUR/WU
-100
-50
0
50
100
150
200EUR/t of milk
Farm Net Value Added (FNVA) Farm net income (FNI)
Remuneration of Family Labour (RFL) Gross margin with coupled payments
Net margin with coupled payments Net economic margin with coupled payments
Source: EU FADN DG AGRI, model of the allocation of costs for milk. 70

EU Dairy farms report 2012 Annex II EL
Greece Milk specialised farms
e: estimate*: trend between the average of the first three available years and the average of the last available three yearsSTRUCTURAL INFORMATION
2001 2002 2003 2004 2005 2006 2007 2008 2009 2010e 2011e
Three years
average trend*
Trend 2011 /2007
Sample farms 23 18 - - - 19 - - 15 -27%Farms represented 1 957 1 611 - - - 2 324 - - 1 302 -27%% production from specialised farms 71% 72% - - - 90% - - 100% 28%Forage area - ha 2 2 - - - 4 - - 8 394%Dairy cows - LU 23 28 - - - 31 - - 59 128%Rented UAA - % 49% 50% - - - 55% - - 72% 23%Total labour - AWU 1,54 1,75 - - - 1,77 - - 2,37 44%Family labour - % 89% 82% - - - 77% - - 73% -13%Milk per ha fodder area - t/ha 27,5 25,0 - - - 33,4 - - 39,8 52%Milk yield - kg/cow 4 560 4 969 - - - 5 174 - - 5 713 5 016 5 656 15% -Milk production - t 106 141 - - - 160 - - 336 295 332 160% -
MILK MARGINS in EUR/t of milk (nominal)
2001 2002 2003 2004 2005 2006 2007 2008 2009 2010e 2011e
Three years
average trend*
Trend 2011 /2007
RevenuesPrice 317 332 - - - 329 - - 387 383 443 25% -EU coupled payments (incl. Art.69) 0 0 - - - 20 - - 0 0 0 - -National aids 0 0 - - - 0 - - 0 0 0 - -Total revenues from milk 317 332 - - - 349 - - 387 383 443 25% -Production costs Feed 172 171 - - - 266 - - 176 207 205 14% -
homegrown feed 17 16 - - - 20 - - 17 20 19 13% -puchased feed 155 155 - - - 246 - - 159 187 186 14% -
Herd renewal purchases 0 0 - - - 1 - - 0 0 0 - -Milk levy 0 0 - - - 0 - - 0 0 0 - -Other specific costs 9 9 - - - 11 - - 7 9 8 -11% -Specific costs 181 180 - - - 279 - - 184 216 213 13% -Machinery and building upkeep 2 3 - - - 3 - - 2 3 2 -6% -Energy (fuel, electricity) 5 8 - - - 10 - - 11 16 17 119% -Contract work 7 6 - - - 9 - - 7 8 7 23% -Taxes 0 0 - - - 3 - - 0 0 0 243% -Other direct inputs 2 2 - - - 4 - - 4 5 4 76% -Non specific costs 17 19 - - - 28 - - 25 32 31 62% -Total operating costs 198 199 - - - 307 - - 208 248 244 18% -Gross margin 119 132 - - - 22 - - 179 135 199 36% -Gross margin with coupled payments 119 132 - - - 42 - - 179 135 199 36% -
%spe.farms with positive gross margin 97% 100% - - - 70% - - - - - - -
%milk production with positive gross margin 96% 100% - - - 67% - - - - - - -
Depreciation 25 23 - - - 23 - - 18 -25%Wages 5 7 - - - 10 - - 9 40%Rent 4 3 - - - 6 - - 7 103%Interest 2 3 - - - 2 - - 0 -98%External factors 11 14 - - - 18 - - 16 32%Net margin 83 96 - - - -19 - - 145 62%
Net margin with coupled payments 83 96 - - - 1 - - 145 62%
Family labour costs 49 41 - - - 42 - - 31 -31%Own capital unpaid cost 10 7 - - - 9 - - 21 147%Imputed family factors 59 48 - - - 50 - - 52 -3%Net economic margin 25 48 - - - -69 - - 94 158%Net economic margin with coupled payments 25 48 - - - -50 - - 94 158%
%spe.farms with positive net economic margin 57% - - - - - - - - -
%milk production with positive net economic margin 70% - - - - - - - - -
Source: EU FADN DG AGRI, model of the allocation of costs for milk. 71

EU Dairy farms report 2012 Annex II EL
Greece Milk specialised farmsINCOME in EUR/AWU (nominal)
2001 2002 2003 2004 2005 2006 2007 2008 2009
Three years
average trend*
Total output 30 987 36 039 - - - 44 962 - - 74 855 123%Intermediate consumptions 19 531 23 567 - - - 37 501 - - 43 071 100%Balance subsidies and taxes 1 984 4 098 - - - 8 090 - - 8 043 165%
Decoupled payments 0 0 - - - 4 380 - - 5 262 -Depreciation 2 497 2 544 - - - 2 968 - - 3 305 31%Farm Net Value Added (FNVA) 10 943 14 026 - - - 12 583 - - 36 522 157%
External factors 1 125 1 530 - - - 2 282 - - 2 915 120%Wages 535 845 - - - 1 209 - - 1 529 122%
Rent 416 424 - - - 876 - - 1 377 228%Interest 173 261 - - - 198 - - 9 -96%
Balance invest. subs. and taxes -58 0 - - - 7 395 - - 0 100%Farm net income (FNI) 9 760 12 496 - - - 17 696 - - 33 608 202%
Family farms only in EUR/FWU (nominal)Own capital unpaid cost 1 177 1 032 - - - 1 486 - - 5 398 389%Remuneration of Family Labour (RFL) 9 807 14 300 - - - 21 601 - - 40 957 240%
%spe.farms with positive RFL 82% 100% - - - 91% - - - -
Milk specialised farms - gross margin
199119 132
42
179
135
0
50
100
150
200
250
300
350
400
450
500
Rev
enue
s
Ope
ratin
g
Rev
enue
s
Ope
ratin
g
Rev
enue
s
Ope
ratin
g
Rev
enue
s
Ope
ratin
g
Rev
enue
s
Ope
ratin
g
Rev
enue
s
Ope
ratin
g
Rev
enue
s
Ope
ratin
g
Rev
enue
s
Ope
ratin
g
Rev
enue
s
Ope
ratin
g
Rev
enue
s
Ope
ratin
g
Rev
enue
s
Ope
ratin
g
2001 2002 2003 2004 2005 2006 2007 2008 2009 2010e 2011e
EUR/t
Price EU coupled payments (incl. Art.69) National aids
Feed Other specific costs Non specific costs
Gross margin with coupled payments
Milk specialised farms - net margin
317 332
0 0 0
349
0 0
387
233 236
#N/A #N/A #N/A
348
#N/A #N/A
242
8396
1
145
0
50
100
150
200
250
300
350
400
450
2001 2002 2003 2004 2005 2006 2007 2008 2009
EUR/t
0
20
40
60
80
100
120
140
160
Total revenues from milk Operating costs + depreciation + external factors
Net margin with coupled payments
Source: EU FADN DG AGRI, model of the allocation of costs for milk. 72

EU Dairy farms report 2012 Annex II EL
Greece Milk specialised farms
Milk specialised farms - net economic margin
317332
0 0 0
349
0 0
387
292 284
#N/A #N/A #N/A
398
#N/A #N/A
294
25
48
-50
94
0
50
100
150
200
250
300
350
400
450
2001 2002 2003 2004 2005 2006 2007 2008 2009
EUR/t
-60
-40
-20
0
20
40
60
80
100
120
Total revenues from milk Total costs Net economic margin with coupled payments
Milk specialised farms - non-operating costs
25 23
0 0 0
23
0 0
18
49 41
0 0 0
42
0 0
31
10
7
0 0 0
9
0 0
21
0
10
20
30
40
50
60
70
80
90
100
2001 2002 2003 2004 2005 2006 2007 2008 2009
EUR/t Depreciation Wages Rent Interest Family labour costs Own capital unpaid cost
Milk specialised farms - income per work unit and margins per tonne
0
5 000
10 000
15 000
20 000
25 000
30 000
35 000
40 000
45 000
2001 2002 2003 2004 2005 2006 2007 2008 2009
EUR/WU
-100
-50
0
50
100
150
200EUR/t of milk
Farm Net Value Added (FNVA) Farm net income (FNI)
Remuneration of Family Labour (RFL) Gross margin with coupled payments
Net margin with coupled payments Net economic margin with coupled payments
Source: EU FADN DG AGRI, model of the allocation of costs for milk. 73

EU Dairy farms report 2012 Annex II ES
Spain Milk specialised farms
e: estimate*: trend between the average of the first three available years and the average of the last available three yearsSTRUCTURAL INFORMATION
2001 2002 2003 2004 2005 2006 2007 2008 2009 2010e 2011e
Three years
average trend*
Trend 2011 /2007
Sample farms 1 415 1 041 1 042 964 993 1 061 1 171 952 935 -13%Farms represented 36 753 24 269 24 478 23 284 26 248 21 891 25 767 21 564 22 777 -18%% production from specialised farms 96% 93% 93% 93% 92% 91% 93% 96% 97% 1%Forage area - ha 12 16 16 18 18 19 16 18 19 24%Dairy cows - LU 26 33 33 37 36 37 31 43 38 23%Rented UAA - % 37% 31% 35% 42% 35% 39% 37% 41% 40% 5%Total labour - AWU 1,42 1,50 1,56 1,55 1,48 1,61 1,49 1,70 1,56 6%Family labour - % 96% 94% 94% 95% 96% 95% 95% 94% 94% -1%Milk per ha fodder area - t/ha 10,8 11,0 10,3 10,4 11,1 11,7 12,3 15,0 12,7 25%Milk yield - kg/cow 5 689 5 913 5 854 6 046 6 223 6 648 6 928 7 011 6 886 6 862 7 418 21% 7%Milk production - t 150 193 191 222 227 244 217 302 264 263 285 52% 31%
MILK MARGINS in EUR/t of milk (nominal)
2001 2002 2003 2004 2005 2006 2007 2008 2009 2010e 2011e
Three years
average trend*
Trend 2011 /2007
RevenuesPrice 318 307 305 313 307 299 353 381 297 299 318 -2% -10%EU coupled payments (incl. Art.69) 0 0 0 11 21 1 1 0 0 0 0 - -National aids 0 0 0 0 0 0 0 0 0 0 0 - -Total revenues from milk 318 307 305 324 328 300 353 380 297 299 318 -2% -10%Production costs Feed 107 116 112 106 105 100 110 136 116 118 127 8% 16%
homegrown feed 15 10 10 8 9 10 9 9 8 7 8 -35% -16%puchased feed 93 106 102 98 96 90 101 127 109 111 119 13% 18%
Herd renewal purchases 2 5 3 3 2 3 4 6 8 9 9 132% 129%Milk levy 0 0 0 0 0 0 0 0 0 0 0 -96% -98%Other specific costs 17 14 14 16 16 18 20 22 19 19 17 20% -12%Specific costs 127 135 129 125 124 121 133 164 143 145 153 13% 15%Machinery and building upkeep 9 8 9 8 7 9 10 13 11 11 11 29% 10%Energy (fuel, electricity) 11 9 9 9 10 11 11 14 12 14 16 43% 39%Contract work 3 4 4 5 5 5 5 7 6 6 6 80% 25%Taxes 0 0 0 0 0 0 0 0 0 0 0 240% 173%Other direct inputs 5 7 7 7 7 6 10 9 9 9 10 44% -6%Non specific costs 28 28 29 28 30 31 36 42 38 42 42 44% 17%Total operating costs 154 163 158 153 153 151 169 206 181 187 195 18% 15%Gross margin 164 144 147 160 153 147 183 174 116 112 123 -23% -33%Gross margin with coupled payments 164 144 147 170 175 148 184 174 116 112 123 -23% -33%
%spe.farms with positive gross margin 100% 99% 98% 98% 99% 100% 100% 98% 98% 97% 98% -1% -2%
%milk production with positive gross margin 100% 100% 99% 100% 100% 100% 100% 99% 97% 96% 98% -2% -2%
Depreciation 18 14 15 12 13 17 18 18 17 13%Wages 4 4 5 4 3 4 5 5 5 8%Rent 3 4 3 4 3 4 4 4 4 9%Interest 3 2 2 2 1 1 2 2 2 -27%External factors 10 10 10 9 7 9 10 10 10 0%Net margin 136 119 122 138 133 122 156 146 88 4%
Net margin with coupled payments 136 119 122 149 154 122 156 146 88 4%
Family labour costs 69 66 66 73 56 63 74 69 80 11%Own capital unpaid cost 12 13 10 10 6 6 13 8 21 22%Imputed family factors 80 79 76 83 62 70 87 78 101 13%Net economic margin 55 40 46 55 71 52 69 68 -12 -12%Net economic margin with coupled payments 55 40 46 65 92 53 70 68 -12 -12%
%spe.farms with positive net economic margin 63% 56% 58% 56% 72% 67% 61% 75% 35% -2%
%milk production with positive net economic margin 79% 72% 73% 76% 83% 79% 85% 81% 46% -4%
Source: EU FADN DG AGRI, model of the allocation of costs for milk. 74

EU Dairy farms report 2012 Annex II ES
Spain Milk specialised farmsINCOME in EUR/AWU (nominal)
2001 2002 2003 2004 2005 2006 2007 2008 2009
Three years
average trend*
Total output 45 268 52 414 49 576 56 997 60 871 59 880 64 145 84 143 64 341 44%Intermediate consumptions 22 652 27 471 26 419 29 701 31 000 31 508 33 001 47 012 40 548 58%Balance subsidies and taxes 1 405 1 568 1 877 3 937 5 779 6 094 5 978 8 012 8 469 363%
Decoupled payments 0 0 0 0 83 4 779 4 366 5 982 5 328 -Depreciation 2 367 2 287 2 232 2 099 2 443 3 101 3 009 3 639 3 396 46%Farm Net Value Added (FNVA) 21 654 24 223 22 802 29 133 33 207 31 365 34 112 41 505 28 866 304%
External factors 1 286 1 688 1 606 1 635 1 427 1 579 1 692 2 162 2 049 29%Wages 505 703 731 677 580 678 784 1 001 923 40%
Rent 458 651 528 671 598 648 602 832 809 37%Interest 323 335 347 286 249 253 306 330 316 -5%
Balance invest. subs. and taxes -52 -41 -114 -350 -218 184 -40 -14 84 114%Farm net income (FNI) 20 317 22 495 21 082 27 149 31 562 29 970 32 380 39 329 26 901 54%
Family farms only in EUR/FWU (nominal)Own capital unpaid cost 1 635 2 256 1 629 1 895 1 194 1 301 2 332 1 944 4 557 60%Remuneration of Family Labour (RFL) 19 428 21 746 20 722 26 536 31 747 30 183 31 635 39 511 23 797 53%
%spe.farms with positive RFL 97% 95% 95% 96% 98% 99% 99% 97% 95% 1%
Milk specialised farms - gross margin
123
164144 147
170 175148
184 174
116 112
0
50
100
150
200
250
300
350
400
Rev
enue
s
Ope
ratin
g
Rev
enue
s
Ope
ratin
g
Rev
enue
s
Ope
ratin
g
Rev
enue
s
Ope
ratin
g
Rev
enue
s
Ope
ratin
g
Rev
enue
s
Ope
ratin
g
Rev
enue
s
Ope
ratin
g
Rev
enue
s
Ope
ratin
g
Rev
enue
s
Ope
ratin
g
Rev
enue
s
Ope
ratin
g
Rev
enue
s
Ope
ratin
g2001 2002 2003 2004 2005 2006 2007 2008 2009 2010e 2011e
EUR/t
Price EU coupled payments (incl. Art.69) National aids
Feed Other specific costs Non specific costs
Gross margin with coupled payments
Milk specialised farms - net margin
318 307 305324 328
300
353380
297
182 188 183 175 174 177 197235 209
136
119 122
149 154
122
156146
88
0
50
100
150
200
250
300
350
400
2001 2002 2003 2004 2005 2006 2007 2008 2009
EUR/t
0
20
40
60
80
100
120
140
160
180
Total revenues from milk Operating costs + depreciation + external factors
Net margin with coupled payments
Source: EU FADN DG AGRI, model of the allocation of costs for milk. 75

EU Dairy farms report 2012 Annex II ES
Spain Milk specialised farms
Milk specialised farms - net economic margin
318 307 305324 328
300
353380
297263 266 259 258236 247
284312 309
55
4046
65
92
53
70 68
-120
50
100
150
200
250
300
350
400
2001 2002 2003 2004 2005 2006 2007 2008 2009
EUR/t
-20
0
20
40
60
80
100
Total revenues from milk Total costs Net economic margin with coupled payments
Milk specialised farms - non-operating costs
18 14 15 12 13 17 18 18 17
6966 66 73
5663
74 6980
1213 10 10
6
6
138
21
0
20
40
60
80
100
120
140
2001 2002 2003 2004 2005 2006 2007 2008 2009
EUR/t Depreciation Wages Rent Interest Family labour costs Own capital unpaid cost
Milk specialised farms - income per work unit and margins per tonne
0
5 000
10 000
15 000
20 000
25 000
30 000
35 000
40 000
45 000
2001 2002 2003 2004 2005 2006 2007 2008 2009
EUR/WU
-50
0
50
100
150
200EUR/t of milk
Farm Net Value Added (FNVA) Farm net income (FNI)
Remuneration of Family Labour (RFL) Gross margin with coupled payments
Net margin with coupled payments Net economic margin with coupled payments
Source: EU FADN DG AGRI, model of the allocation of costs for milk. 76

EU Dairy farms report 2012 Annex II FR
France Milk specialised farms
e: estimate*: trend between the average of the first three available years and the average of the last available three yearsSTRUCTURAL INFORMATION
2001 2002 2003 2004 2005 2006 2007 2008 2009 2010e 2011e
Three years
average trend*
Trend 2011 /2007
Sample farms 1 374 1 355 1 227 1 207 1 141 1 160 1 173 1 283 1 214 -7%Farms represented 73 040 67 693 65 569 61 218 61 582 58 820 59 517 62 771 59 335 -12%% production from specialised farms 73% 74% 72% 72% 73% 75% 74% 79% 75% 3%Forage area - ha 49 51 52 55 54 59 59 60 61 18%Dairy cows - LU 39 41 41 43 43 45 46 47 47 15%Rented UAA - % 83% 84% 85% 85% 86% 88% 88% 88% 89% 4%Total labour - AWU 1,63 1,65 1,71 1,72 1,73 1,80 1,76 1,75 1,75 5%Family labour - % 95% 94% 94% 94% 94% 93% 93% 93% 93% -1%Milk per ha fodder area - t/ha 4,8 5,0 4,8 4,9 5,1 5,0 5,1 5,1 5,1 5%Milk yield - kg/cow 5 979 6 143 6 148 6 253 6 492 6 450 6 512 6 552 6 501 6 750 7 159 12% 10%Milk production - t 235 253 253 266 276 292 300 307 308 320 339 31% 13%
MILK MARGINS in EUR/t of milk (nominal)
2001 2002 2003 2004 2005 2006 2007 2008 2009 2010e 2011e
Three years
average trend*
Trend 2011 /2007
RevenuesPrice 329 321 317 310 302 291 320 349 297 307 331 -3% 3%EU coupled payments (incl. Art.69) 0 0 0 12 22 0 0 0 0 0 0 - -National aids 0 0 0 0 0 0 0 0 0 0 0 - -Total revenues from milk 329 321 317 321 324 291 320 349 296 307 331 -3% 3%Production costs Feed 83 79 81 80 76 78 85 99 93 85 93 12% 10%
homegrown feed 36 34 34 33 32 32 33 36 36 32 34 -2% 3%puchased feed 47 44 46 47 44 46 52 64 57 54 59 23% 14%
Herd renewal purchases 2 2 1 2 2 2 3 3 2 2 2 34% -23%Milk levy 0 0 1 1 0 0 0 0 0 0 0 -21% 40%Other specific costs 16 11 12 12 12 12 12 14 13 13 12 -2% 1%Specific costs 101 92 95 94 90 93 100 116 109 101 108 11% 8%Machinery and building upkeep 18 18 19 19 20 20 20 22 21 20 20 11% -2%Energy (fuel, electricity) 14 10 11 12 13 14 14 18 14 16 17 36% 19%Contract work 25 25 26 26 26 27 28 30 30 29 28 14% 0%Taxes 2 3 3 3 3 2 2 3 3 3 3 -3% 5%Other direct inputs 28 35 35 35 34 35 37 39 38 37 36 12% -4%Non specific costs 87 92 94 95 96 100 102 112 106 104 103 15% 1%Total operating costs 188 184 188 190 187 193 202 228 215 205 211 13% 4%Gross margin 141 137 129 121 116 99 118 121 82 102 120 -25% 2%Gross margin with coupled payments 141 137 128 132 138 98 118 121 81 102 120 -25% 2%
%spe.farms with positive gross margin 100% 100% 99% 99% 99% 97% 97% 97% 94% 97% 98% -3% 1%
%milk production with positive gross margin 100% 100% 100% 99% 100% 98% 99% 98% 96% 98% 99% -2% 0%
Depreciation 52 52 54 57 56 62 62 67 68 25%Wages 4 4 4 4 4 5 5 5 5 31%Rent 18 18 18 18 18 19 19 20 20 8%Interest 11 10 10 10 9 10 10 11 11 4%External factors 32 32 32 32 32 34 34 36 37 9%Net margin 57 53 42 32 28 3 22 19 -23 -88%
Net margin with coupled payments 57 53 42 43 50 2 22 18 -23 -89%
Family labour costs 84 67 73 71 70 70 69 70 70 -7%Own capital unpaid cost 10 8 5 4 4 5 8 3 13 3%Imputed family factors 94 75 78 75 74 75 77 73 83 -6%Net economic margin -37 -22 -36 -43 -46 -73 -55 -55 -106 -127%Net economic margin with coupled payments -37 -22 -37 -32 -24 -73 -55 -55 -106 -125%
%spe.farms with positive net economic margin 21% 30% 19% 16% 13% 4% 14% 15% 2% -13%
%milk production with positive net economic margin 29% 36% 24% 21% 17% 6% 21% 19% 2% -16%
Source: EU FADN DG AGRI, model of the allocation of costs for milk. 77

EU Dairy farms report 2012 Annex II FR
France Milk specialised farmsINCOME in EUR/AWU (nominal)
2001 2002 2003 2004 2005 2006 2007 2008 2009
Three years
average trend*
Total output 64 782 67 151 64 127 66 930 67 970 69 270 79 761 87 288 75 527 24%Intermediate consumptions 39 188 40 615 39 888 42 197 43 048 45 331 49 644 57 866 55 529 36%Balance subsidies and taxes 7 937 8 635 9 379 11 224 13 168 15 421 15 117 15 671 15 348 78%
Decoupled payments 0 0 0 0 106 11 536 11 466 11 854 11 516 -Depreciation 11 297 11 954 12 271 13 509 13 708 15 202 15 886 17 198 17 930 44%Farm Net Value Added (FNVA) 22 234 23 216 21 348 22 448 24 383 24 158 29 348 27 895 17 417 22%
External factors 7 205 7 605 7 426 7 737 7 927 8 496 8 755 9 361 9 797 26%Wages 799 875 883 893 999 1 240 1 226 1 292 1 291 49%
Rent 4 038 4 299 4 182 4 454 4 564 4 821 4 893 5 189 5 473 24%Interest 2 368 2 431 2 361 2 390 2 364 2 436 2 637 2 880 3 033 19%
Balance invest. subs. and taxes 825 911 954 809 909 1 066 1 125 1 065 1 078 22%Farm net income (FNI) 15 854 16 522 14 876 15 520 17 364 16 728 21 718 19 599 8 698 6%
Family farms only in EUR/FWU (nominal)Own capital unpaid cost 2 155 2 000 1 153 1 084 955 1 262 2 171 819 3 500 22%Remuneration of Family Labour (RFL) 14 543 15 580 14 666 15 366 17 590 16 765 21 134 20 239 5 832 5%
%spe.farms with positive RFL 91% 93% 94% 92% 95% 92% 93% 91% 66% -9%
Milk specialised farms - gross margin
120
141137 128 132 138
98118 121
81102
0
50
100
150
200
250
300
350
400
Rev
enue
s
Ope
ratin
g
Rev
enue
s
Ope
ratin
g
Rev
enue
s
Ope
ratin
g
Rev
enue
s
Ope
ratin
g
Rev
enue
s
Ope
ratin
g
Rev
enue
s
Ope
ratin
g
Rev
enue
s
Ope
ratin
g
Rev
enue
s
Ope
ratin
g
Rev
enue
s
Ope
ratin
g
Rev
enue
s
Ope
ratin
g
Rev
enue
s
Ope
ratin
g2001 2002 2003 2004 2005 2006 2007 2008 2009 2010e 2011e
EUR/t
Price EU coupled payments (incl. Art.69) National aids
Feed Other specific costs Non specific costs
Gross margin with coupled payments
Milk specialised farms - net margin
329 321 317 321 324291
320349
296
272 268 275 278 275 288 298330 319
5753
42 4350
2
2218
-230
50
100
150
200
250
300
350
400
2001 2002 2003 2004 2005 2006 2007 2008 2009
EUR/t
-30
-20
-10
0
10
20
30
40
50
60
70
Total revenues from milk Operating costs + depreciation + external factors
Net margin with coupled payments
Source: EU FADN DG AGRI, model of the allocation of costs for milk. 78

EU Dairy farms report 2012 Annex II FR
France Milk specialised farms
Milk specialised farms - net economic margin
329 321 317 321 324291
320349
296
366344 353 354 348
364 375403 402
-37
-22
-37-32
-24
-73
-55 -55
-106
0
50
100
150
200
250
300
350
400
450
2001 2002 2003 2004 2005 2006 2007 2008 2009
EUR/t
-120
-100
-80
-60
-40
-20
0
Total revenues from milk Total costs Net economic margin with coupled payments
Milk specialised farms - non-operating costs
52 52 54 57 56 62 62 67 68
8467
73 71 7070 69
70 70
10
85 4 4
5 8 313
0
20
40
60
80
100
120
140
160
180
200
2001 2002 2003 2004 2005 2006 2007 2008 2009
EUR/t Depreciation Wages Rent Interest Family labour costs Own capital unpaid cost
Milk specialised farms - income per work unit and margins per tonne
0
5 000
10 000
15 000
20 000
25 000
30 000
35 000
2001 2002 2003 2004 2005 2006 2007 2008 2009
EUR/WU
-150
-100
-50
0
50
100
150
200EUR/t of milk
Farm Net Value Added (FNVA) Farm net income (FNI)
Remuneration of Family Labour (RFL) Gross margin with coupled payments
Net margin with coupled payments Net economic margin with coupled payments
Source: EU FADN DG AGRI, model of the allocation of costs for milk. 79

EU Dairy farms report 2012 Annex II IE
Ireland Milk specialised farms
e: estimate*: trend between the average of the first three available years and the average of the last available three yearsSTRUCTURAL INFORMATION
2001 2002 2003 2004 2005 2006 2007 2008 2009 2010e 2011e
Three years
average trend*
Trend 2011 /2007
Sample farms 481 403 419 384 394 366 357 348 304 -23%Farms represented 25 602 21 952 22 223 19 240 20 247 18 362 18 558 18 726 17 771 -21%% production from specialised farms 93% 89% 91% 89% 94% 95% 97% 96% 93% 5%Forage area - ha 44 46 47 47 50 51 54 55 54 19%Dairy cows - LU 42 46 47 49 50 53 55 56 58 26%Rented UAA - % 19% 19% 19% 19% 19% 19% 20% 21% 23% 2%Total labour - AWU 1,55 1,57 1,53 1,57 1,57 1,59 1,60 1,62 1,60 4%Family labour - % 89% 89% 88% 88% 88% 87% 87% 86% 88% -2%Milk per ha fodder area - t/ha 4,9 5,1 5,3 5,5 5,3 5,7 5,5 5,5 5,5 8%Milk yield - kg/cow 5 172 5 111 5 257 5 373 5 268 5 457 5 439 5 317 5 126 5 496 5 555 4% 2%Milk production - t 218 233 247 262 265 289 300 300 297 319 322 34% 7%
MILK MARGINS in EUR/t of milk (nominal)
2001 2002 2003 2004 2005 2006 2007 2008 2009 2010e 2011e
Three years
average trend*
Trend 2011 /2007
RevenuesPrice 306 283 269 271 265 258 323 331 229 285 318 -3% -2%EU coupled payments (incl. Art.69) 0 0 0 11 0 0 0 0 0 0 0 - -National aids 0 0 0 0 0 0 0 0 0 0 0 - #DIV/0!Total revenues from milk 305 281 269 280 262 258 322 329 229 285 318 -3% -1%Production costs Feed 70 72 70 66 67 75 78 98 84 74 86 15% 10%
homegrown feed 32 31 30 30 31 31 32 41 34 29 34 3% 6%puchased feed 39 41 39 37 36 44 46 56 50 45 52 24% 12%
Herd renewal purchases 5 7 9 8 7 8 10 8 7 7 7 -1% -33%Milk levy 0 2 1 1 3 0 1 2 0 0 0 - -Other specific costs 19 19 17 22 22 22 24 26 27 25 25 38% 3%Specific costs 95 101 96 98 100 105 113 133 118 106 117 17% 4%Machinery and building upkeep 21 18 16 16 17 17 18 18 15 14 14 -20% -23%Energy (fuel, electricity) 8 8 7 8 9 10 11 13 12 13 15 69% 32%Contract work 16 13 12 12 13 13 15 15 14 13 13 -3% -13%Taxes 0 0 0 1 1 0 1 1 1 1 1 28% -1%Other direct inputs 7 7 6 6 6 6 8 9 11 11 11 63% 30%Non specific costs 52 47 41 42 46 46 53 56 53 51 53 12% 0%Total operating costs 147 147 138 140 146 151 166 189 171 157 170 15% 3%Gross margin 159 135 132 132 119 107 157 142 58 128 148 -22% -6%Gross margin with coupled payments 159 134 131 141 115 107 157 140 58 128 148 -21% -6%
%spe.farms with positive gross margin 100% 98% 99% 100% 98% 98% 100% 98% 84% 99% 100% -5% 0%
%milk production with positive gross margin 100% 99% 100% 100% 99% 99% 100% 99% 94% 99% 100% -2% 0%
Depreciation 26 25 21 34 35 39 44 50 29 73%Wages 8 8 9 9 10 10 11 13 11 41%Rent 11 10 10 9 8 8 9 9 9 -12%Interest 8 8 7 6 6 6 8 10 8 15%External factors 28 26 25 24 25 25 28 32 28 12%Net margin 106 84 86 74 59 44 85 59 0 -47%
Net margin with coupled payments 105 83 85 83 55 43 84 58 1 -48%
Family labour costs 70 68 67 69 77 77 77 83 75 14%Own capital unpaid cost 48 40 34 38 35 35 40 35 71 19%Imputed family factors 118 108 102 107 113 112 117 117 145 16%Net economic margin -13 -24 -16 -34 -54 -68 -32 -58 -145 -352%Net economic margin with coupled payments -13 -25 -16 -25 -58 -68 -33 -60 -145 -334%
%spe.farms with positive net economic margin 37% 28% 33% 22% 14% 7% 25% 14% - -
%milk production with positive net economic margin 53% 41% 47% 32% 20% 15% 36% 24% - -
Source: EU FADN DG AGRI, model of the allocation of costs for milk. 80

EU Dairy farms report 2012 Annex II IE
Ireland Milk specialised farmsINCOME in EUR/AWU (nominal)
2001 2002 2003 2004 2005 2006 2007 2008 2009
Three years
average trend*
Total output 57 903 55 847 57 641 61 080 61 241 63 784 78 822 86 751 64 631 34%Intermediate consumptions 30 320 30 748 30 814 31 748 33 619 37 143 41 179 52 719 49 317 56%Balance subsidies and taxes 5 024 5 531 8 349 10 136 13 162 13 516 14 635 14 063 13 776 125%
Decoupled payments 0 0 0 0 8 804 10 717 11 341 11 228 11 257 -Depreciation 5 183 5 360 4 870 8 242 8 371 9 744 11 034 12 514 7 619 102%Farm Net Value Added (FNVA) 27 424 25 270 30 306 31 226 32 414 30 413 41 245 35 580 21 470 1%
External factors 5 551 5 536 5 777 5 677 5 843 6 202 6 965 7 953 7 078 30%Wages 1 549 1 714 1 924 2 099 2 329 2 485 2 716 3 108 2 652 63%
Rent 2 316 2 201 2 295 2 110 2 017 2 101 2 316 2 331 2 413 4%Interest 1 686 1 621 1 558 1 468 1 496 1 616 1 932 2 514 2 013 33%
Balance invest. subs. and taxes 106 232 -421 -523 -745 -944 -802 -284 6 889 7052%Farm net income (FNI) 21 979 19 965 24 108 25 027 25 826 23 267 33 478 27 344 21 282 24%
Family farms only in EUR/FWU (nominal)Own capital unpaid cost 11 155 9 824 9 218 10 702 9 731 10 256 11 846 10 336 21 294 44%Remuneration of Family Labour (RFL) 13 503 12 759 18 206 17 750 19 707 16 498 26 762 21 473 3 022 15%
%spe.farms with positive RFL 84% 87% 94% 92% 91% 85% 93% 82% 49% -14%
Milk specialised farms - gross margin
148
159
134 131141
115 107
157140
58
128
0
50
100
150
200
250
300
350
Rev
enue
s
Ope
ratin
g
Rev
enue
s
Ope
ratin
g
Rev
enue
s
Ope
ratin
g
Rev
enue
s
Ope
ratin
g
Rev
enue
s
Ope
ratin
g
Rev
enue
s
Ope
ratin
g
Rev
enue
s
Ope
ratin
g
Rev
enue
s
Ope
ratin
g
Rev
enue
s
Ope
ratin
g
Rev
enue
s
Ope
ratin
g
Rev
enue
s
Ope
ratin
g2001 2002 2003 2004 2005 2006 2007 2008 2009 2010e 2011e
EUR/t
Price EU coupled payments (incl. Art.69) National aids
Feed Other specific costs Non specific costs
Gross margin with coupled payments
Milk specialised farms - net margin
305281
269 280262 258
322 329
229
200 198 183 198 206 214238
271229
105
83 85 83
55
43
84
58
10
50
100
150
200
250
300
350
2001 2002 2003 2004 2005 2006 2007 2008 2009
EUR/t
0
20
40
60
80
100
120
Total revenues from milk Operating costs + depreciation + external factors
Net margin with coupled payments
Source: EU FADN DG AGRI, model of the allocation of costs for milk. 81
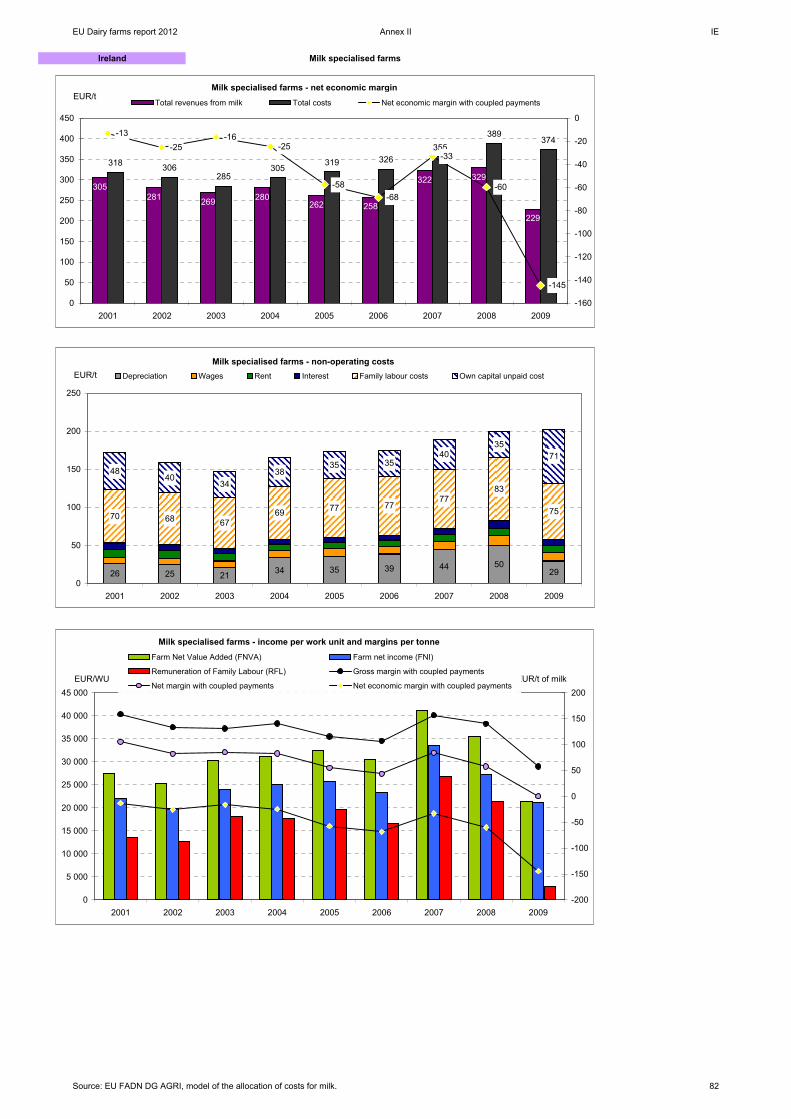
EU Dairy farms report 2012 Annex II IE
Ireland Milk specialised farms
Milk specialised farms - net economic margin
305281 269 280
262 258
322 329
229
318 306285
305319 326
355389
374-13
-25-16
-25
-58-68
-33
-60
-145
0
50
100
150
200
250
300
350
400
450
2001 2002 2003 2004 2005 2006 2007 2008 2009
EUR/t
-160
-140
-120
-100
-80
-60
-40
-20
0
Total revenues from milk Total costs Net economic margin with coupled payments
Milk specialised farms - non-operating costs
26 25 21 34 35 39 44 5029
70 68 6769 77 77
7783
75
4840
3438
35 3540
3571
0
50
100
150
200
250
2001 2002 2003 2004 2005 2006 2007 2008 2009
EUR/t Depreciation Wages Rent Interest Family labour costs Own capital unpaid cost
Milk specialised farms - income per work unit and margins per tonne
0
5 000
10 000
15 000
20 000
25 000
30 000
35 000
40 000
45 000
2001 2002 2003 2004 2005 2006 2007 2008 2009
EUR/WU
-200
-150
-100
-50
0
50
100
150
200EUR/t of milk
Farm Net Value Added (FNVA) Farm net income (FNI)
Remuneration of Family Labour (RFL) Gross margin with coupled payments
Net margin with coupled payments Net economic margin with coupled payments
Source: EU FADN DG AGRI, model of the allocation of costs for milk. 82

EU Dairy farms report 2012 Annex II IT
Italy Milk specialised farms
e: estimate*: trend between the average of the first three available years and the average of the last available three yearsSTRUCTURAL INFORMATION
2001 2002 2003 2004 2005 2006 2007 2008 2009 2010e 2011e
Three years
average trend*
Trend 2011 /2007
Sample farms 1 691 1 839 1 242 1 352 1 536 1 399 1 451 1 121 1 056 -24%Farms represented 40 561 34 903 35 980 31 873 33 054 30 801 31 399 30 695 32 353 -15%% production from specialised farms 93% 93% 93% 96% 96% 95% 93% 95% 92% 0%Forage area - ha 22 22 22 24 25 25 26 25 24 14%Dairy cows - LU 36 36 43 44 44 47 48 47 44 20%Rented UAA - % 58% 58% 53% 59% 57% 57% 58% 60% 57% 2%Total labour - AWU 2,00 1,94 2,00 2,09 2,09 2,10 2,17 1,86 1,87 -1%Family labour - % 88% 92% 84% 86% 87% 85% 84% 84% 81% -5%Milk per ha fodder area - t/ha 10,5 10,5 12,5 11,6 11,6 12,8 12,5 12,7 12,0 11%Milk yield - kg/cow 6 442 6 431 6 490 6 604 6 699 6 841 6 994 6 739 6 548 7 066 6 968 6% 0%Milk production - t 232 229 280 289 296 322 333 315 286 309 304 21% -9%
MILK MARGINS in EUR/t of milk (nominal)
2001 2002 2003 2004 2005 2006 2007 2008 2009 2010e 2011e
Three years
average trend*
Trend 2011 /2007
RevenuesPrice 400 399 385 381 366 360 385 398 382 423 480 9% 25%EU coupled payments (incl. Art.69) 0 0 0 11 21 0 0 0 0 0 0 - -National aids 0 0 0 0 0 0 0 0 0 0 0 - -Total revenues from milk 399 399 382 391 385 360 385 398 382 423 480 9% 25%Production costs Feed 117 115 136 137 124 108 124 117 115 111 125 -5% 1%
homegrown feed 14 17 16 18 17 19 21 20 18 17 19 16% -11%puchased feed 103 98 119 119 107 89 103 97 97 94 106 -8% 3%
Herd renewal purchases 0 0 0 0 0 3 2 1 2 2 2 - -2%Milk levy 0 0 2 2 1 0 0 0 0 0 0 - -Other specific costs 22 12 12 12 14 13 13 23 17 16 17 10% 28%Specific costs 140 128 150 150 139 124 140 140 135 129 145 -2% 4%Machinery and building upkeep 8 7 6 7 7 8 8 9 6 6 6 -17% -20%Energy (fuel, electricity) 20 15 16 16 18 19 19 18 22 22 25 35% 33%Contract work 4 4 4 4 4 4 4 3 4 4 4 -5% -8%Taxes 9 6 4 2 2 2 2 5 6 5 6 -9% 138%Other direct inputs 14 11 12 16 14 13 14 10 13 13 13 5% -8%Non specific costs 55 43 42 45 45 47 47 46 51 49 54 10% 14%Total operating costs 195 170 192 195 184 171 187 186 186 178 198 1% 6%Gross margin 205 229 193 187 182 189 199 212 196 244 282 15% 42%Gross margin with coupled payments 204 228 191 197 202 189 199 212 196 244 282 16% 42%
%spe.farms with positive gross margin 97% 100% 97% 97% 98% 99% 99% 99% 98% 98% 99% 0% 0%
%milk production with positive gross margin 97% 100% 97% 98% 99% 99% 100% 100% 99% 100% 100% 2% 0%
Depreciation 41 42 37 41 43 39 39 37 40 -4%Wages 19 12 15 14 14 14 15 14 18 3%Rent 9 10 9 10 10 10 11 9 9 6%Interest 3 3 2 2 2 2 2 1 1 -49%External factors 30 25 25 26 25 26 28 24 29 -1%Net margin 133 161 130 120 114 124 131 151 128 -3%
Net margin with coupled payments 133 161 128 130 133 124 131 151 128 -3%
Family labour costs 116 135 97 99 96 89 83 85 88 -27%Own capital unpaid cost 28 26 19 22 18 20 24 12 32 -6%Imputed family factors 145 161 116 121 114 109 107 98 120 -23%Net economic margin -11 0 14 -1 -1 14 24 54 8 3089%Net economic margin with coupled payments -11 0 11 9 19 14 24 54 8 35521%
%spe.farms with positive net economic margin 26% 29% 26% 30% 28% 29% 30% 39% 28% 5%
%milk production with positive net economic margin 57% 59% 62% 57% 58% 65% 65% 74% 60% 7%
Source: EU FADN DG AGRI, model of the allocation of costs for milk. 83

EU Dairy farms report 2012 Annex II IT
Italy Milk specialised farmsINCOME in EUR/AWU (nominal)
2001 2002 2003 2004 2005 2006 2007 2008 2009
Three years
average trend*
Total output 64 562 66 057 74 923 74 419 73 404 78 074 84 812 94 924 83 025 28%Intermediate consumptions 34 279 32 131 41 783 41 854 40 420 41 720 45 008 48 343 42 541 26%Balance subsidies and taxes 2 639 2 487 4 386 5 239 8 545 10 050 8 943 8 968 7 565 168%
Decoupled payments 0 0 0 0 3 318 7 924 6 576 7 225 6 260 -Depreciation 6 073 6 341 6 720 7 235 7 524 7 482 7 621 8 017 7 790 22%Farm Net Value Added (FNVA) 26 850 30 073 30 805 30 569 34 006 38 921 41 126 47 532 40 258 148%
External factors 4 548 3 854 4 523 4 493 4 401 4 997 5 517 5 091 5 676 26%Wages 2 755 1 907 2 633 2 445 2 335 2 711 2 943 2 932 3 585 30%
Rent 1 362 1 561 1 604 1 677 1 793 1 931 2 218 1 991 1 897 35%Interest 431 386 285 371 273 355 357 168 194 -35%
Balance invest. subs. and taxes 985 723 -133 384 464 768 329 -174 345 -68%Farm net income (FNI) 23 287 26 942 26 149 26 460 30 069 34 692 35 937 42 267 34 928 48%
Family farms only in EUR/FWU (nominal)Own capital unpaid cost 4 801 4 341 4 049 4 520 3 738 4 622 5 651 3 151 7 968 27%Remuneration of Family Labour (RFL) 21 652 24 839 27 051 25 831 30 855 36 029 36 824 46 960 35 248 62%
%spe.farms with positive RFL 88% 93% 85% 88% 91% 89% 91% 93% 86% 1%
Milk specialised farms - gross margin
282204 228
191 197 202 189 199 212 196244
0
100
200
300
400
500
600
Rev
enue
s
Ope
ratin
g
Rev
enue
s
Ope
ratin
g
Rev
enue
s
Ope
ratin
g
Rev
enue
s
Ope
ratin
g
Rev
enue
s
Ope
ratin
g
Rev
enue
s
Ope
ratin
g
Rev
enue
s
Ope
ratin
g
Rev
enue
s
Ope
ratin
g
Rev
enue
s
Ope
ratin
g
Rev
enue
s
Ope
ratin
g
Rev
enue
s
Ope
ratin
g2001 2002 2003 2004 2005 2006 2007 2008 2009 2010e 2011e
EUR/t
Price EU coupled payments (incl. Art.69) National aids
Feed Other specific costs Non specific costs
Gross margin with coupled payments
Milk specialised farms - net margin
399 399382 391 385
360385 398
382
266 238 255 262 252 236 254 246 254
133
161
128 130 133124
131
151
128
0
50
100
150
200
250
300
350
400
450
2001 2002 2003 2004 2005 2006 2007 2008 2009
EUR/t
0
20
40
60
80
100
120
140
160
180
Total revenues from milk Operating costs + depreciation + external factors
Net margin with coupled payments
Source: EU FADN DG AGRI, model of the allocation of costs for milk. 84

EU Dairy farms report 2012 Annex II IT
Italy Milk specialised farms
Milk specialised farms - net economic margin
399 399
382391
385
360
385
398
382
411
399
371
382
366
345
361
344
374
-11
0
11 9
1914
24
54
8
300
320
340
360
380
400
420
2001 2002 2003 2004 2005 2006 2007 2008 2009
EUR/t
-20
-10
0
10
20
30
40
50
60
Total revenues from milk Total costs Net economic margin with coupled payments
Milk specialised farms - non-operating costs
41 42 37 41 43 39 39 37 40
116 135
97 99 96 89 83 8588
2826
19 22 1820 24
12
32
0
50
100
150
200
250
2001 2002 2003 2004 2005 2006 2007 2008 2009
EUR/t Depreciation Wages Rent Interest Family labour costs Own capital unpaid cost
Milk specialised farms - income per work unit and margins per tonne
0
5 000
10 000
15 000
20 000
25 000
30 000
35 000
40 000
45 000
50 000
2001 2002 2003 2004 2005 2006 2007 2008 2009
EUR/WU
-50
0
50
100
150
200
250EUR/t of milk
Farm Net Value Added (FNVA) Farm net income (FNI)
Remuneration of Family Labour (RFL) Gross margin with coupled payments
Net margin with coupled payments Net economic margin with coupled payments
Source: EU FADN DG AGRI, model of the allocation of costs for milk. 85

EU Dairy farms report 2012 Annex II LU
Luxembourg Milk specialised farms
e: estimate*: trend between the average of the first three available years and the average of the last available three yearsSTRUCTURAL INFORMATION
2001 2002 2003 2004 2005 2006 2007 2008 2009 2010e 2011e
Three years
average trend*
Trend 2011 /2007
Sample farms 217 237 205 204 239 222 227 231 194 -1%Farms represented 865 695 657 634 729 636 668 692 551 -14%% production from specialised farms 82% 77% 74% 71% 81% 76% 79% 81% 67% -2%Forage area - ha 62 62 63 62 65 68 69 67 67 9%Dairy cows - LU 41 42 43 41 41 43 43 44 45 5%Rented UAA - % 47% 48% 49% 47% 48% 49% 48% 49% 48% 0%Total labour - AWU 1,69 1,69 1,74 1,67 1,68 1,66 1,69 1,62 1,64 -3%Family labour - % 92% 91% 91% 92% 93% 92% 92% 93% 92% 1%Milk per ha fodder area - t/ha 4,6 4,8 4,9 4,8 4,7 4,7 4,5 4,7 4,9 0%Milk yield - kg/cow 6 829 6 975 7 207 7 178 7 386 7 324 7 255 7 184 7 290 7 566 7 741 8% 7%Milk production - t 283 294 308 294 306 318 315 315 330 343 351 16% 11%
MILK MARGINS in EUR/t of milk (nominal)
2001 2002 2003 2004 2005 2006 2007 2008 2009 2010e 2011e
Three years
average trend*
Trend 2011 /2007
RevenuesPrice 332 329 321 316 304 297 352 375 265 294 324 -10% -8%EU coupled payments (incl. Art.69) 0 0 0 11 0 0 0 0 0 0 0 - -National aids 0 0 0 0 0 0 0 0 0 0 0 - -Total revenues from milk 330 324 318 324 301 295 349 372 264 294 324 -9% -7%Production costs Feed 64 65 64 65 61 62 64 73 68 65 77 9% 19%
homegrown feed 28 29 29 29 29 30 28 32 34 33 39 23% 39%puchased feed 36 36 35 36 32 32 37 41 34 32 38 -2% 3%
Herd renewal purchases 1 0 1 1 1 2 1 2 2 2 2 230% 32%Milk levy 2 5 3 3 3 2 2 2 1 1 1 -84% -75%Other specific costs 17 17 17 18 18 18 19 23 22 21 20 23% 7%Specific costs 83 88 86 87 83 84 87 100 92 89 99 9% 14%Machinery and building upkeep 20 23 22 22 24 22 25 26 24 24 25 13% 0%Energy (fuel, electricity) 14 12 12 14 18 19 18 23 17 20 22 57% 19%Contract work 15 16 14 16 15 16 17 19 18 18 18 20% 10%Taxes 1 1 1 1 1 1 2 2 1 1 1 27% -7%Other direct inputs 19 21 20 21 22 22 24 25 24 24 25 21% 5%Non specific costs 69 73 69 74 80 80 85 94 85 87 91 25% 7%Total operating costs 152 161 155 161 163 164 172 194 177 176 191 16% 11%Gross margin 180 169 166 155 140 132 179 181 88 119 133 -34% -26%Gross margin with coupled payments 178 164 163 163 137 131 177 178 87 118 133 -33% -25%
%spe.farms with positive gross margin 100% 100% 100% 100% 100% 98% 98% 97% 95% 97% 97% -4% -1%
%milk production with positive gross margin 100% 100% 100% 100% 100% 99% 99% 99% 97% 99% 99% -2% 0%
Depreciation 85 84 84 86 95 92 99 102 96 17%Wages 6 6 5 5 5 5 6 5 5 -5%Rent 18 18 18 17 19 19 19 19 17 -1%Interest 16 14 12 12 13 14 19 19 11 16%External factors 40 38 36 34 37 37 44 42 34 4%Net margin 54 47 46 35 9 2 36 36 -42 -79%
Net margin with coupled payments 52 41 43 42 6 1 34 34 -43 -82%
Family labour costs 58 61 57 60 62 60 65 69 68 14%Own capital unpaid cost 31 33 16 7 3 12 24 12 52 11%Imputed family factors 89 94 73 67 65 72 89 81 121 13%Net economic margin -35 -47 -27 -33 -56 -70 -53 -45 -163 -138%Net economic margin with coupled payments -37 -53 -30 -25 -59 -71 -55 -47 -163 -121%
%spe.farms with positive net economic margin 22% 17% 29% 27% 14% 10% 17% 20% - -
%milk production with positive net economic margin 30% 24% 40% 37% 22% 17% 27% 29% - -
Source: EU FADN DG AGRI, model of the allocation of costs for milk. 86

EU Dairy farms report 2012 Annex II LU
Luxembourg Milk specialised farmsINCOME in EUR/AWU (nominal)
2001 2002 2003 2004 2005 2006 2007 2008 2009
Three years
average trend*
Total output 79 356 80 196 81 917 80 212 84 566 123 240 102 838 112 951 85 886 25%Intermediate consumptions 45 558 48 231 48 197 49 435 51 873 90 004 59 495 68 817 64 578 36%Balance subsidies and taxes 22 719 21 797 25 591 25 761 28 186 31 311 31 395 32 081 31 117 35%
Decoupled payments 0 0 0 0 13 049 15 407 15 140 15 273 14 644 -Depreciation 22 175 22 421 23 880 24 287 26 685 28 034 28 847 30 772 30 958 32%Farm Net Value Added (FNVA) 34 343 31 340 35 431 32 251 34 194 36 513 45 891 45 443 21 467 -8%
External factors 10 400 10 176 10 116 9 589 10 314 11 236 12 707 12 784 10 773 18%Wages 1 440 1 563 1 601 1 321 1 402 1 626 1 760 1 553 1 754 10%
Rent 4 732 4 918 5 191 4 879 5 231 5 543 5 423 5 663 5 458 11%Interest 4 228 3 696 3 324 3 389 3 682 4 067 5 524 5 568 3 560 30%
Balance invest. subs. and taxes 267 -107 -818 951 2 293 2 950 4 125 2 825 4 691 1869%Farm net income (FNI) 24 210 21 058 24 497 23 613 26 173 28 226 37 308 35 484 15 385 26%
Family farms only in EUR/FWU (nominal)Own capital unpaid cost 8 968 9 806 5 024 2 172 920 4 011 7 759 3 951 18 328 26%Remuneration of Family Labour (RFL) 17 481 13 331 21 977 23 399 27 257 26 777 32 979 34 088 -1 614 24%
%spe.farms with positive RFL 85% 79% 91% 85% 92% 88% 91% 89% 50% -8%
Milk specialised farms - gross margin
133
178164 163 163
137 131
177 178
87118
0
50
100
150
200
250
300
350
400
Rev
enue
s
Ope
ratin
g
Rev
enue
s
Ope
ratin
g
Rev
enue
s
Ope
ratin
g
Rev
enue
s
Ope
ratin
g
Rev
enue
s
Ope
ratin
g
Rev
enue
s
Ope
ratin
g
Rev
enue
s
Ope
ratin
g
Rev
enue
s
Ope
ratin
g
Rev
enue
s
Ope
ratin
g
Rev
enue
s
Ope
ratin
g
Rev
enue
s
Ope
ratin
g2001 2002 2003 2004 2005 2006 2007 2008 2009 2010e 2011e
EUR/t
Price EU coupled payments (incl. Art.69) National aids
Feed Other specific costs Non specific costs
Gross margin with coupled payments
Milk specialised farms - net margin
330 324 318 324301 295
349372
264
278 283 275 282 295 294 315 338307
52
41 43 42
61
34 34
-43
0
50
100
150
200
250
300
350
400
2001 2002 2003 2004 2005 2006 2007 2008 2009
EUR/t
-60
-40
-20
0
20
40
60
Total revenues from milk Operating costs + depreciation + external factors
Net margin with coupled payments
Source: EU FADN DG AGRI, model of the allocation of costs for milk. 87

EU Dairy farms report 2012 Annex II LU
Luxembourg Milk specialised farms
Milk specialised farms - net economic margin
330 324 318 324301 295
349372
264
367 377348 349 360 366
404419 428
-37
-53
-30-25
-59-71
-55-47
-163
0
50
100
150
200
250
300
350
400
450
2001 2002 2003 2004 2005 2006 2007 2008 2009
EUR/t
-180
-160
-140
-120
-100
-80
-60
-40
-20
0
Total revenues from milk Total costs Net economic margin with coupled payments
Milk specialised farms - non-operating costs
85 84 84 86 95 92 99 102 96
58 61 57 6062 60
65 6968
31 3316 7
3 12
24 12 52
0
50
100
150
200
250
300
2001 2002 2003 2004 2005 2006 2007 2008 2009
EUR/t Depreciation Wages Rent Interest Family labour costs Own capital unpaid cost
Milk specialised farms - income per work unit and margins per tonne
-10 000
0
10 000
20 000
30 000
40 000
50 000
2001 2002 2003 2004 2005 2006 2007 2008 2009
EUR/WU
-200
-150
-100
-50
0
50
100
150
200EUR/t of milk
Farm Net Value Added (FNVA) Farm net income (FNI)
Remuneration of Family Labour (RFL) Gross margin with coupled payments
Net margin with coupled payments Net economic margin with coupled payments
Source: EU FADN DG AGRI, model of the allocation of costs for milk. 88

EU Dairy farms report 2012 Annex II NL
Netherlands Milk specialised farms
e: estimate*: trend between the average of the first three available years and the average of the last available three yearsSTRUCTURAL INFORMATION
2001 2002 2003 2004 2005 2006 2007 2008 2009 2010e 2011e
Three years
average trend*
Trend 2011 /2007
Sample farms 325 338 371 327 325 339 338 348 351 0%Farms represented 25 739 21 131 21 214 19 545 19 805 18 949 19 225 19 241 18 608 -16%% production from specialised farms 96% 96% 96% 95% 95% 96% 96% 95% 95% 0%Forage area - ha 37 40 41 43 43 44 44 44 45 13%Dairy cows - LU 62 67 69 71 71 73 72 74 76 12%Rented UAA - % 34% 37% 36% 36% 37% 37% 37% 36% 36% 1%Total labour - AWU 1,67 1,67 1,67 1,66 1,62 1,64 1,64 1,66 1,66 -1%Family labour - % 93% 91% 92% 93% 94% 93% 93% 93% 92% 1%Milk per ha fodder area - t/ha 12,2 12,3 12,6 12,5 12,6 12,7 12,6 13,1 13,3 5%Milk yield - kg/cow 7 300 7 388 7 460 7 535 7 609 7 793 7 787 7 819 7 881 8 212 8 226 10% 6%Milk production - t 453 495 518 535 539 565 558 580 603 628 629 27% 13%
MILK MARGINS in EUR/t of milk (nominal)
2001 2002 2003 2004 2005 2006 2007 2008 2009 2010e 2011e
Three years
average trend*
Trend 2011 /2007
RevenuesPrice 351 336 323 313 307 301 358 367 282 331 388 -1% 8%EU coupled payments (incl. Art.69) 0 0 0 12 23 34 0 0 0 0 0 - #DIV/0!National aids 0 0 0 0 0 0 0 0 0 0 0 - -Total revenues from milk 350 335 322 323 330 334 356 363 279 329 386 -1% 8%Production costs Feed 66 67 67 65 61 64 74 94 80 76 98 27% 33%
homegrown feed 13 13 13 13 14 12 12 16 15 14 16 12% 30%puchased feed 52 53 53 52 47 52 61 79 65 63 82 31% 33%
Herd renewal purchases 1 1 2 1 1 2 3 3 2 2 2 16% -46%Milk levy 1 1 1 2 1 1 2 3 2 2 2 136% 29%Other specific costs 18 20 20 21 21 22 24 28 28 27 27 41% 12%Specific costs 86 89 90 89 83 89 103 129 111 107 129 32% 25%Machinery and building upkeep 21 23 21 22 23 23 24 26 22 21 22 -1% -11%Energy (fuel, electricity) 12 11 11 11 13 14 14 15 14 14 15 27% 11%Contract work 19 21 19 19 20 19 20 21 20 20 21 4% 4%Taxes 2 2 1 1 1 1 1 0 0 0 0 -76% -30%Other direct inputs 27 28 26 25 26 27 27 27 27 27 28 2% 4%Non specific costs 82 84 77 79 82 82 86 91 84 82 86 4% 1%Total operating costs 168 173 167 168 165 172 189 220 195 189 216 18% 14%Gross margin 183 163 156 146 143 129 169 146 87 142 173 -20% 2%Gross margin with coupled payments 182 162 155 156 165 162 167 143 84 140 170 -21% 2%
%spe.farms with positive gross margin 99% 100% 100% 99% 100% 99% 99% 99% 94% 99% 99% -3% 0%
%milk production with positive gross margin 100% 100% 100% 100% 100% 100% 99% 99% 96% 99% 99% -2% -1%
Depreciation 35 36 36 38 39 40 40 45 48 24%Wages 5 6 5 4 4 4 4 4 5 -14%Rent 17 18 17 16 14 14 15 15 14 -17%Interest 37 38 35 34 33 37 42 46 41 17%External factors 60 62 57 54 51 55 62 65 60 4%Net margin 88 65 63 53 53 33 67 37 -22 -62%
Net margin with coupled payments 87 64 61 63 76 66 65 33 -24 -65%
Family labour costs 92 81 79 78 73 76 73 81 76 -9%Own capital unpaid cost 39 38 33 39 23 19 22 22 28 -34%Imputed family factors 131 120 111 117 96 95 95 103 104 -16%Net economic margin -43 -55 -49 -64 -43 -62 -28 -66 -126 -50%Net economic margin with coupled payments -45 -56 -50 -54 -20 -29 -30 -70 -129 -52%
%spe.farms with positive net economic margin 30% 27% 24% 18% 22% 13% 33% 14% 3% -10%
%milk production with positive net economic margin 42% 36% 33% 28% 31% 19% 44% 20% 5% -14%
Source: EU FADN DG AGRI, model of the allocation of costs for milk. 89

EU Dairy farms report 2012 Annex II NL
Netherlands Milk specialised farmsINCOME in EUR/AWU (nominal)
2001 2002 2003 2004 2005 2006 2007 2008 2009
Three years
average trend*
Total output 115 145 120 281 121 040 122 701 126 497 127 790 148 517 152 294 124 039 19%Intermediate consumptions 57 136 63 022 62 821 65 251 66 802 70 628 77 076 89 813 83 082 37%Balance subsidies and taxes 1 664 2 168 2 475 6 064 10 648 15 127 14 259 13 015 13 971 554%
Decoupled payments 0 0 0 0 92 2 653 13 760 13 275 13 290 -Depreciation 11 758 13 429 14 092 15 379 16 044 16 997 17 020 18 795 21 568 46%Farm Net Value Added (FNVA) 47 915 45 997 46 602 48 134 54 300 55 292 68 680 56 700 33 359 491%
External factors 19 664 22 707 22 175 21 744 21 133 23 106 25 763 27 234 26 721 24%Wages 1 672 2 072 1 916 1 693 1 469 1 735 1 923 1 894 2 163 6%
Rent 5 732 6 815 6 663 6 464 5 885 5 913 6 075 6 225 6 353 -3%Interest 12 259 13 820 13 595 13 588 13 779 15 459 17 764 19 116 18 205 39%
Balance invest. subs. and taxes -1 852 -2 454 -1 794 -1 409 -207 -1 471 -1 538 -1 585 -680 38%Farm net income (FNI) 26 399 20 836 22 633 24 981 32 960 30 715 41 380 27 881 5 958 8%
Family farms only in EUR/FWU (nominal)Own capital unpaid cost 13 513 15 346 13 480 17 018 9 933 8 425 9 859 9 514 13 355 -23%Remuneration of Family Labour (RFL) 14 959 7 539 11 217 9 758 25 186 24 526 34 841 20 550 -6 894 44%
%spe.farms with positive RFL 78% 72% 75% 75% 81% 82% 87% 76% 47% -5%
Milk specialised farms - gross margin
170
182162 155 156 165 162 167
143
84
140
0
50
100
150
200
250
300
350
400
450
Rev
enue
s
Ope
ratin
g
Rev
enue
s
Ope
ratin
g
Rev
enue
s
Ope
ratin
g
Rev
enue
s
Ope
ratin
g
Rev
enue
s
Ope
ratin
g
Rev
enue
s
Ope
ratin
g
Rev
enue
s
Ope
ratin
g
Rev
enue
s
Ope
ratin
g
Rev
enue
s
Ope
ratin
g
Rev
enue
s
Ope
ratin
g
Rev
enue
s
Ope
ratin
g2001 2002 2003 2004 2005 2006 2007 2008 2009 2010e 2011e
EUR/t
Price EU coupled payments (incl. Art.69) National aids
Feed Other specific costs Non specific costs
Gross margin with coupled payments
Milk specialised farms - net margin
350335 322 323 330 334
356 363
279
263 271 261 260 254 267 291330 304
87
64 61 63
7666 65
33
-24
0
50
100
150
200
250
300
350
400
2001 2002 2003 2004 2005 2006 2007 2008 2009
EUR/t
-40
-20
0
20
40
60
80
100
Total revenues from milk Operating costs + depreciation + external factors
Net margin with coupled payments
Source: EU FADN DG AGRI, model of the allocation of costs for milk. 90

EU Dairy farms report 2012 Annex II NL
Netherlands Milk specialised farms
Milk specialised farms - net economic margin
350335 322 323 330 334
356 363
279
395 390372 377
350 362386
433408
-45
-56-50 -54
-20-29 -30
-70
-129
0
50
100
150
200
250
300
350
400
450
500
2001 2002 2003 2004 2005 2006 2007 2008 2009
EUR/t
-140
-120
-100
-80
-60
-40
-20
0
Total revenues from milk Total costs Net economic margin with coupled payments
Milk specialised farms - non-operating costs
35 36 36 38 39 40 40 45 48
92 81 79 78 73 76 7381 76
3938
33 3923 19 22
22 28
0
50
100
150
200
250
2001 2002 2003 2004 2005 2006 2007 2008 2009
EUR/t Depreciation Wages Rent Interest Family labour costs Own capital unpaid cost
Milk specialised farms - income per work unit and margins per tonne
-20 000
-10 000
0
10 000
20 000
30 000
40 000
50 000
60 000
70 000
80 000
2001 2002 2003 2004 2005 2006 2007 2008 2009
EUR/WU
-150
-100
-50
0
50
100
150
200EUR/t of milk
Farm Net Value Added (FNVA) Farm net income (FNI)
Remuneration of Family Labour (RFL) Gross margin with coupled payments
Net margin with coupled payments Net economic margin with coupled payments
Source: EU FADN DG AGRI, model of the allocation of costs for milk. 91

EU Dairy farms report 2012 Annex II AT
Austria Milk specialised farms
e: estimate*: trend between the average of the first three available years and the average of the last available three yearsSTRUCTURAL INFORMATION
2001 2002 2003 2004 2005 2006 2007 2008 2009 2010e 2011e
Three years
average trend*
Trend 2011 /2007
Sample farms 517 455 408 471 553 553 515 654 537 24%Farms represented 21 180 16 576 14 784 14 551 17 496 15 658 15 191 19 452 15 279 -5%% production from specialised farms 62% 55% 50% 57% 63% 64% 60% 72% 63% 9%Forage area - ha 27 25 26 29 27 29 27 28 28 7%Dairy cows - LU 16 17 17 19 18 20 19 18 20 13%Rented UAA - % 23% 24% 27% 27% 27% 30% 30% 28% 30% 5%Total labour - AWU 1,85 1,81 1,65 1,71 1,69 1,72 1,67 1,67 1,68 -5%Family labour - % 99% 99% 98% 98% 98% 98% 98% 98% 98% -1%Milk per ha fodder area - t/ha 3,6 4,0 4,3 4,3 4,3 4,7 4,8 4,4 4,7 16%Milk yield - kg/cow 5 900 6 032 6 417 6 502 6 443 6 687 6 764 6 728 6 616 6 677 6 846 10% 1%Milk production - t 97 103 111 124 118 134 130 122 133 135 138 31% 6%
MILK MARGINS in EUR/t of milk (nominal)
2001 2002 2003 2004 2005 2006 2007 2008 2009 2010e 2011e
Three years
average trend*
Trend 2011 /2007
RevenuesPrice 335 328 293 293 290 294 333 392 299 329 365 4% 10%EU coupled payments (incl. Art.69) 0 0 0 10 20 30 0 0 0 0 0 - -National aids 0 0 0 0 0 0 0 0 0 0 0 - -Total revenues from milk 335 328 293 303 311 324 327 386 297 327 363 3% 11%Production costs Feed 56 57 73 70 67 69 80 91 77 73 82 25% 2%
homegrown feed 13 13 27 25 26 27 32 31 27 24 27 50% -14%puchased feed 43 44 46 45 41 42 48 59 50 48 54 15% 13%
Herd renewal purchases 2 3 3 1 3 3 2 4 2 3 2 -2% 28%Milk levy 0 0 0 0 0 0 6 6 2 2 2 - -60%Other specific costs 30 35 23 20 19 19 20 22 21 22 22 -26% 8%Specific costs 88 94 99 92 88 91 108 122 103 99 108 11% 0%Machinery and building upkeep 25 25 20 21 22 22 22 26 23 24 24 1% 10%Energy (fuel, electricity) 16 15 15 16 19 19 19 24 21 23 25 47% 32%Contract work 11 12 11 12 13 13 13 15 15 16 15 35% 17%Taxes 0 0 0 0 0 0 0 0 0 0 0 -51% 10%Other direct inputs 26 26 36 35 38 36 38 44 40 43 42 41% 11%Non specific costs 79 79 82 84 92 90 92 110 99 105 107 29% 16%Total operating costs 167 174 181 175 180 181 199 231 202 205 215 19% 8%Gross margin 168 155 113 118 110 113 134 160 97 125 151 -14% 13%Gross margin with coupled payments 168 155 113 128 131 143 128 155 95 122 149 -16% 16%
%spe.farms with positive gross margin 100% 100% 95% 98% 97% 98% 95% 97% 89% 94% 97% -5% 2%
%milk production with positive gross margin 100% 100% 97% 99% 99% 99% 98% 98% 95% 98% 99% -2% 0%
Depreciation 77 75 80 83 87 87 75 84 87 6%Wages 2 2 2 2 2 2 2 2 2 2%Rent 6 6 6 7 7 7 7 7 7 17%Interest 11 10 8 9 9 9 10 13 10 8%External factors 19 18 16 17 18 18 18 22 19 11%Net margin 72 62 16 17 5 8 41 53 -10 -43%
Net margin with coupled payments 72 62 16 28 25 38 35 48 -12 -52%
Family labour costs 140 130 114 110 121 110 109 131 122 -6%Own capital unpaid cost 60 62 57 46 36 44 43 34 74 -16%Imputed family factors 200 192 170 156 158 155 152 165 197 -9%Net economic margin -129 -131 -154 -139 -153 -147 -111 -112 -206 -4%Net economic margin with coupled payments -129 -131 -154 -128 -132 -116 -116 -117 -208 -7%
%spe.farms with positive net economic margin 5% 5% - - - - 6% 9% - -
%milk production with positive net economic margin 9% 11% - - - - 11% 20% - -
Source: EU FADN DG AGRI, model of the allocation of costs for milk. 92

EU Dairy farms report 2012 Annex II AT
Austria Milk specialised farmsINCOME in EUR/AWU (nominal)
2001 2002 2003 2004 2005 2006 2007 2008 2009
Three years
average trend*
Total output 26 011 27 613 29 496 31 843 31 657 36 737 40 114 43 135 36 312 44%Intermediate consumptions 12 381 13 664 17 043 18 139 17 713 19 991 21 419 23 078 22 275 55%Balance subsidies and taxes 8 795 9 005 10 159 12 099 12 685 14 266 12 765 13 164 13 715 42%
Decoupled payments 0 0 0 0 2 047 2 240 4 338 4 247 4 400 -Depreciation 6 493 6 828 8 725 9 757 9 534 10 746 9 294 9 617 10 993 36%Farm Net Value Added (FNVA) 15 931 16 126 13 887 16 046 17 095 20 266 22 166 23 604 16 758 -5%
External factors 1 608 1 666 1 799 1 990 1 992 2 178 2 184 2 460 2 372 38%Wages 134 188 222 253 232 297 202 254 228 26%
Rent 510 540 660 753 763 849 800 807 911 47%Interest 964 937 917 985 997 1 032 1 182 1 399 1 233 35%
Balance invest. subs. and taxes -289 -570 -911 -1 009 -839 -774 -1 517 -44 -226 -1%Farm net income (FNI) 14 034 13 890 11 177 13 047 14 264 17 314 18 465 21 100 14 161 37%
Family farms only in EUR/FWU (nominal)Own capital unpaid cost 5 189 5 815 6 308 5 498 4 087 5 676 5 473 4 024 9 659 11%Remuneration of Family Labour (RFL) 8 991 8 253 5 085 7 799 10 458 12 018 13 324 17 464 4 838 60%
%spe.farms with positive RFL 88% 82% 69% 80% 87% 88% 86% 92% 65% 1%
Milk specialised farms - gross margin
149
168155
113128 131
143 128155
95122
0
50
100
150
200
250
300
350
400
450
Rev
enue
s
Ope
ratin
g
Rev
enue
s
Ope
ratin
g
Rev
enue
s
Ope
ratin
g
Rev
enue
s
Ope
ratin
g
Rev
enue
s
Ope
ratin
g
Rev
enue
s
Ope
ratin
g
Rev
enue
s
Ope
ratin
g
Rev
enue
s
Ope
ratin
g
Rev
enue
s
Ope
ratin
g
Rev
enue
s
Ope
ratin
g
Rev
enue
s
Ope
ratin
g2001 2002 2003 2004 2005 2006 2007 2008 2009 2010e 2011e
EUR/t
Price EU coupled payments (incl. Art.69) National aids
Feed Other specific costs Non specific costs
Gross margin with coupled payments
Milk specialised farms - net margin
335 328293 303 311 324 327
386
297
263 266 278 276 285 286 292338 309
72
62
16
28 25
38 35
48
-120
50
100
150
200
250
300
350
400
450
2001 2002 2003 2004 2005 2006 2007 2008 2009
EUR/t
-20
-10
0
10
20
30
40
50
60
70
80
Total revenues from milk Operating costs + depreciation + external factors
Net margin with coupled payments
Source: EU FADN DG AGRI, model of the allocation of costs for milk. 93

EU Dairy farms report 2012 Annex II AT
Austria Milk specialised farms
Milk specialised farms - net economic margin
335 328293 303 311 324 327
386
297
463 459 448 432 443 440 444
503 505
-129 -131
-154
-128 -132-116 -116 -117
-208
0
100
200
300
400
500
600
2001 2002 2003 2004 2005 2006 2007 2008 2009
EUR/t
-250
-200
-150
-100
-50
0
Total revenues from milk Total costs Net economic margin with coupled payments
Milk specialised farms - non-operating costs
77 75 80 83 87 87 75 84 87
140 130 114 110121 110
109131 122
6062
57 4636 44
43
3474
0
50
100
150
200
250
300
350
2001 2002 2003 2004 2005 2006 2007 2008 2009
EUR/t Depreciation Wages Rent Interest Family labour costs Own capital unpaid cost
Milk specialised farms - income per work unit and margins per tonne
0
5 000
10 000
15 000
20 000
25 000
2001 2002 2003 2004 2005 2006 2007 2008 2009
EUR/WU
-250
-200
-150
-100
-50
0
50
100
150
200EUR/t of milk
Farm Net Value Added (FNVA) Farm net income (FNI)
Remuneration of Family Labour (RFL) Gross margin with coupled payments
Net margin with coupled payments Net economic margin with coupled payments
Source: EU FADN DG AGRI, model of the allocation of costs for milk. 94

EU Dairy farms report 2012 Annex II PT
Portugal Milk specialised farms
e: estimate*: trend between the average of the first three available years and the average of the last available three yearsSTRUCTURAL INFORMATION
2001 2002 2003 2004 2005 2006 2007 2008 2009 2010e 2011e
Three years
average trend*
Trend 2011 /2007
Sample farms 394 395 376 351 347 362 375 338 351 -9%Farms represented 10 255 9 774 9 130 7 487 6 318 5 986 6 424 6 576 7 185 -31%% production from specialised farms 97% 98% 97% 99% 97% 99% 99% 98% 98% 1%Forage area - ha 13 16 14 17 17 17 17 17 15 14%Dairy cows - LU 23 23 25 26 27 27 29 27 25 16%Rented UAA - % 43% 43% 43% 42% 41% 45% 46% 42% 39% -1%Total labour - AWU 1,70 1,74 1,73 1,74 1,85 1,83 1,98 1,79 1,65 5%Family labour - % 89% 90% 90% 90% 88% 87% 83% 85% 86% -5%Milk per ha fodder area - t/ha 10,2 9,0 10,2 9,4 10,6 10,2 11,5 10,9 11,8 16%Milk yield - kg/cow 5 960 6 144 6 062 6 230 6 527 6 526 6 842 6 956 7 052 7 107 7 144 17% 4%Milk production - t 136 141 150 161 179 178 198 190 179 181 181 27% -8%
MILK MARGINS in EUR/t of milk (nominal)
2001 2002 2003 2004 2005 2006 2007 2008 2009 2010e 2011e
Three years
average trend*
Trend 2011 /2007
RevenuesPrice 285 291 285 285 278 266 306 346 281 277 303 0% -1%EU coupled payments (incl. Art.69) 0 0 0 10 22 33 9 9 9 9 9 - -1%National aids 4 3 4 11 0 5 3 8 7 7 7 97% 121%Total revenues from milk 289 294 290 307 299 304 319 363 298 294 319 4% 0%Production costs Feed 108 103 104 107 104 101 118 136 118 117 136 17% 16%
homegrown feed 19 20 20 20 19 18 20 24 20 18 21 0% 2%puchased feed 90 83 84 87 85 83 98 113 98 98 116 21% 18%
Herd renewal purchases 8 3 4 3 5 5 9 3 4 4 4 -20% -59%Milk levy 0 0 0 0 0 0 0 0 0 0 0 - -Other specific costs 23 21 24 22 20 22 23 22 23 23 23 3% -1%Specific costs 139 128 132 131 129 128 151 162 145 144 163 13% 8%Machinery and building upkeep 12 12 13 13 13 13 14 14 13 12 12 2% -11%Energy (fuel, electricity) 12 13 14 14 17 16 17 19 17 19 22 48% 30%Contract work 4 3 3 3 2 4 4 4 5 5 5 39% 27%Taxes 0 0 1 1 1 1 2 2 1 1 1 204% -42%Other direct inputs 7 8 7 7 8 7 8 7 7 7 7 -10% -13%Non specific costs 35 37 37 38 41 41 44 46 42 44 47 21% 6%Total operating costs 174 165 169 169 170 168 195 208 187 188 210 15% 8%Gross margin 111 126 117 116 108 97 112 138 94 90 93 -22% -17%Gross margin with coupled payments 115 129 121 137 130 135 124 155 110 106 109 -11% -12%
%spe.farms with positive gross margin 99% 99% 99% 97% 99% 99% 96% 99% 91% 91% 90% -8% -5%
%milk production with positive gross margin 100% 99% 97% 99% 99% 99% 99% 100% 99% 98% 98% 0% -1%
Depreciation 33 30 30 29 30 31 31 27 26 -10%Wages 6 7 7 7 7 7 9 9 9 35%Rent 5 6 6 7 7 7 6 6 5 6%Interest 4 3 3 3 2 2 4 3 3 -8%External factors 16 15 15 16 15 15 19 18 17 15%Net margin 62 81 72 70 63 51 62 93 51 -4%
Net margin with coupled payments 66 83 76 92 85 89 75 110 68 12%
Family labour costs 56 62 56 57 49 46 47 48 52 -16%Own capital unpaid cost 5 7 5 7 7 6 8 9 19 121%Imputed family factors 61 69 61 65 55 52 55 57 72 -4%Net economic margin 2 12 10 6 8 -1 7 37 -20 -1%Net economic margin with coupled payments 6 14 15 27 29 37 20 54 -4 99%
%spe.farms with positive net economic margin 32% 42% 42% 39% 46% 41% 43% 49% 27% 1%
%milk production with positive net economic margin 58% 68% 64% 68% 64% 59% 64% 76% 44% -2%
Source: EU FADN DG AGRI, model of the allocation of costs for milk. 95

EU Dairy farms report 2012 Annex II PT
Portugal Milk specialised farmsINCOME in EUR/AWU (nominal)
2001 2002 2003 2004 2005 2006 2007 2008 2009
Three years
average trend*
Total output 28 507 30 005 31 488 33 489 33 476 33 782 38 111 45 041 39 228 36%Intermediate consumptions 18 956 18 821 20 230 21 892 22 174 22 725 25 649 29 842 28 305 44%Balance subsidies and taxes 2 287 2 102 2 228 4 088 4 407 5 803 5 356 5 981 6 463 169%
Decoupled payments 0 0 0 0 742 773 2 959 2 916 3 163 -Depreciation 3 104 2 946 3 060 3 228 3 257 3 451 3 558 3 245 3 263 11%Farm Net Value Added (FNVA) 8 734 10 340 10 426 12 456 12 452 13 409 14 260 17 934 14 123 150%
External factors 1 546 1 478 1 576 1 769 1 754 1 771 2 161 2 171 2 047 39%Wages 636 639 682 726 774 758 1 019 1 058 1 027 59%
Rent 529 579 604 769 779 833 731 807 704 31%Interest 381 260 291 274 200 180 411 307 317 11%
Balance invest. subs. and taxes 223 133 213 144 340 264 141 196 190 -7%Farm net income (FNI) 7 411 8 995 9 063 10 831 11 039 11 902 12 240 15 959 12 265 59%
Family farms only in EUR/FWU (nominal)Own capital unpaid cost 574 735 592 940 852 815 1 146 1 342 2 881 182%Remuneration of Family Labour (RFL) 7 719 9 309 9 505 11 149 11 671 12 877 13 601 17 464 11 351 60%
%spe.farms with positive RFL 91% 93% 92% 90% 95% 95% 93% 91% 88% -1%
Milk specialised farms - gross margin
109
115 129 121137
130 135 124155
110 106
0
50
100
150
200
250
300
350
400
Rev
enue
s
Ope
ratin
g
Rev
enue
s
Ope
ratin
g
Rev
enue
s
Ope
ratin
g
Rev
enue
s
Ope
ratin
g
Rev
enue
s
Ope
ratin
g
Rev
enue
s
Ope
ratin
g
Rev
enue
s
Ope
ratin
g
Rev
enue
s
Ope
ratin
g
Rev
enue
s
Ope
ratin
g
Rev
enue
s
Ope
ratin
g
Rev
enue
s
Ope
ratin
g2001 2002 2003 2004 2005 2006 2007 2008 2009 2010e 2011e
EUR/t
Price EU coupled payments (incl. Art.69) National aids
Feed Other specific costs Non specific costs
Gross margin with coupled payments
Milk specialised farms - net margin
289 294 290307 299 304
319
363
298
223 210 214 215 215 215244 253 230
66
8376
9285
89
75
110
68
0
50
100
150
200
250
300
350
400
2001 2002 2003 2004 2005 2006 2007 2008 2009
EUR/t
0
20
40
60
80
100
120
Total revenues from milk Operating costs + depreciation + external factors
Net margin with coupled payments
Source: EU FADN DG AGRI, model of the allocation of costs for milk. 96

EU Dairy farms report 2012 Annex II PT
Portugal Milk specialised farms
Milk specialised farms - net economic margin
289 294 290307 299 304
319
363
298283 279 275 279 270 266
299 309 301
6
14 15
27 29
37
20
54
-4
0
50
100
150
200
250
300
350
400
2001 2002 2003 2004 2005 2006 2007 2008 2009
EUR/t
-10
0
10
20
30
40
50
60
Total revenues from milk Total costs Net economic margin with coupled payments
Milk specialised farms - non-operating costs
33 30 30 29 30 31 31 27 26
56 62 56 5749 46
4748 52
57
5 7
7 68
919
0
20
40
60
80
100
120
2001 2002 2003 2004 2005 2006 2007 2008 2009
EUR/t Depreciation Wages Rent Interest Family labour costs Own capital unpaid cost
Milk specialised farms - income per work unit and margins per tonne
0
2 000
4 000
6 000
8 000
10 000
12 000
14 000
16 000
18 000
20 000
2001 2002 2003 2004 2005 2006 2007 2008 2009
EUR/WU
-20
0
20
40
60
80
100
120
140
160
180EUR/t of milk
Farm Net Value Added (FNVA) Farm net income (FNI)
Remuneration of Family Labour (RFL) Gross margin with coupled payments
Net margin with coupled payments Net economic margin with coupled payments
Source: EU FADN DG AGRI, model of the allocation of costs for milk. 97

EU Dairy farms report 2012 Annex II FI
Finland Milk specialised farms
e: estimate*: trend between the average of the first three available years and the average of the last available three yearsSTRUCTURAL INFORMATION
2001 2002 2003 2004 2005 2006 2007 2008 2009 2010e 2011e
Three years
average trend*
Trend 2011 /2007
Sample farms 331 333 325 348 371 378 375 379 375 14%Farms represented 19 829 15 688 16 541 14 970 14 454 12 417 12 449 12 921 12 761 -27%% production from specialised farms 98% 99% 99% 99% 99% 99% 98% 99% 99% 0%Forage area - ha 24 26 26 27 29 30 31 30 31 20%Dairy cows - LU 19 21 21 22 25 24 24 24 25 19%Rented UAA - % 36% 37% 35% 36% 36% 35% 34% 34% 34% -2%Total labour - AWU 2,06 2,11 2,11 2,10 2,14 2,09 2,04 2,01 2,01 -4%Family labour - % 92% 92% 91% 91% 90% 90% 91% 91% 91% -1%Milk per ha fodder area - t/ha 6,3 6,5 6,4 6,7 7,0 6,8 6,8 6,8 6,9 6%Milk yield - kg/cow 7 795 7 978 8 031 8 189 8 319 8 400 8 579 8 483 8 447 8 516 8 606 7% 0%Milk production - t 151 167 169 183 204 206 207 204 210 211 214 31% 3%
MILK MARGINS in EUR/t of milk (nominal)
2001 2002 2003 2004 2005 2006 2007 2008 2009 2010e 2011e
Three years
average trend*
Trend 2011 /2007
RevenuesPrice 343 354 360 353 327 336 361 439 391 396 428 15% 19%EU coupled payments (incl. Art.69) 0 0 0 11 22 0 0 0 0 0 0 - -National aids 92 93 92 101 81 76 76 77 77 76 76 -17% 0%Total revenues from milk 434 446 452 465 430 412 437 516 468 473 504 8% 15%Production costs Feed 110 104 106 106 104 103 108 125 116 116 139 16% 28%
homegrown feed 35 34 34 30 30 31 36 38 38 38 47 19% 31%puchased feed 74 71 72 76 74 72 73 86 78 78 92 14% 26%
Herd renewal purchases 3 3 2 2 4 4 3 3 4 4 4 46% 10%Milk levy 0 0 0 0 0 0 0 0 0 0 0 - -Other specific costs 29 29 29 30 29 29 30 31 34 33 33 15% 11%Specific costs 141 136 137 138 137 136 141 159 154 153 175 16% 24%Machinery and building upkeep 34 35 36 40 37 40 41 44 44 46 46 30% 14%Energy (fuel, electricity) 19 19 21 22 24 27 26 34 29 34 44 80% 67%Contract work 10 13 14 16 17 20 24 30 29 29 30 139% 24%Taxes 0 0 0 0 0 0 0 0 0 0 0 - -Other direct inputs 40 44 43 44 42 44 45 49 50 50 51 18% 12%Non specific costs 104 111 114 121 120 131 137 157 153 160 171 47% 25%Total operating costs 245 248 251 260 257 267 278 316 306 312 346 30% 24%Gross margin 97 106 109 93 70 69 83 123 85 84 82 -20% -1%Gross margin with coupled payments 189 199 201 206 174 145 159 200 162 161 158 -18% 0%
%spe.farms with positive gross margin 100% 99% 99% 99% 97% 95% 95% 96% 91% 91% 90% -9% -5%
%milk production with positive gross margin 100% 99% 100% 99% 98% 98% 97% 98% 95% 95% 95% -5% -3%
Depreciation 76 81 86 92 95 102 104 113 106 33%Wages 9 11 12 12 13 12 12 13 15 31%Rent 7 8 8 9 9 9 9 11 11 34%Interest 13 12 11 11 12 14 17 19 14 38%External factors 29 31 31 33 34 35 39 44 40 34%Net margin -8 -5 -8 -31 -59 -68 -59 -34 -61 -627%
Net margin with coupled payments 84 87 84 81 45 8 16 43 16 -70%
Family labour costs 186 183 187 189 170 184 192 219 214 12%Own capital unpaid cost 19 22 23 36 26 32 32 23 32 35%Imputed family factors 205 205 210 224 196 216 224 242 245 15%Net economic margin -212 -210 -219 -256 -255 -284 -283 -276 -306 -35%Net economic margin with coupled payments -121 -118 -127 -143 -152 -208 -208 -198 -229 -74%
%spe.farms with positive net economic margin - - - - - - - - - -
%milk production with positive net economic margin - - - - - - - - - -
Source: EU FADN DG AGRI, model of the allocation of costs for milk. 98

EU Dairy farms report 2012 Annex II FI
Finland Milk specialised farmsINCOME in EUR/AWU (nominal)
2001 2002 2003 2004 2005 2006 2007 2008 2009
Three years
average trend*
Total output 30 955 34 152 34 940 37 097 37 983 40 455 45 377 53 075 48 938 47%Intermediate consumptions 23 974 26 406 26 674 29 448 31 843 33 599 36 045 40 624 40 817 52%Balance subsidies and taxes 17 505 19 423 19 494 21 769 24 063 22 853 25 007 26 251 26 961 39%
Decoupled payments 0 0 0 0 67 6 159 6 068 6 193 6 158 -Depreciation 7 386 8 482 9 080 10 167 11 626 12 285 12 976 13 772 13 312 61%Farm Net Value Added (FNVA) 17 100 18 688 18 680 19 251 18 579 17 424 21 364 24 930 21 770 -27%
External factors 2 879 3 256 3 286 3 656 4 172 4 341 4 840 5 375 5 108 63%Wages 830 1 130 1 252 1 368 1 548 1 488 1 494 1 659 1 968 59%
Rent 742 866 867 1 047 1 125 1 158 1 216 1 406 1 394 62%Interest 1 307 1 260 1 167 1 241 1 499 1 694 2 130 2 311 1 746 66%
Balance invest. subs. and taxes 0 0 64 95 314 428 579 655 578 -Farm net income (FNI) 14 221 15 431 15 458 15 689 14 721 13 511 17 103 20 210 17 239 21%
Family farms only in EUR/FWU (nominal)Own capital unpaid cost 1 997 2 589 2 756 4 352 3 560 4 247 4 422 3 113 4 418 63%Remuneration of Family Labour (RFL) 13 396 14 217 14 306 12 906 12 842 10 707 14 349 19 166 14 605 15%
%spe.farms with positive RFL 97% 95% 95% 91% 89% 86% 89% 92% 89% -6%
Milk specialised farms - gross margin
158
189 199 201 206174 145 159
200162 161
0
100
200
300
400
500
600
Rev
enue
s
Ope
ratin
g
Rev
enue
s
Ope
ratin
g
Rev
enue
s
Ope
ratin
g
Rev
enue
s
Ope
ratin
g
Rev
enue
s
Ope
ratin
g
Rev
enue
s
Ope
ratin
g
Rev
enue
s
Ope
ratin
g
Rev
enue
s
Ope
ratin
g
Rev
enue
s
Ope
ratin
g
Rev
enue
s
Ope
ratin
g
Rev
enue
s
Ope
ratin
g2001 2002 2003 2004 2005 2006 2007 2008 2009 2010e 2011e
EUR/t
Price EU coupled payments (incl. Art.69) National aids
Feed Other specific costs Non specific costs
Gross margin with coupled payments
Milk specialised farms - net margin
434 446 452 465430 412
437
516468
350 359 368 384 386 404 420472 452
84 8784 81
45
816
43
16
0
100
200
300
400
500
600
2001 2002 2003 2004 2005 2006 2007 2008 2009
EUR/t
0
10
20
30
40
50
60
70
80
90
100
Total revenues from milk Operating costs + depreciation + external factors
Net margin with coupled payments
Source: EU FADN DG AGRI, model of the allocation of costs for milk. 99

EU Dairy farms report 2012 Annex II FI
Finland Milk specialised farms
Milk specialised farms - net economic margin
434 446 452 465430 412 437
516468
555 564 579608
582620 644
714 698
-121 -118-127
-143-152
-208 -208-198
-229
0
100
200
300
400
500
600
700
800
2001 2002 2003 2004 2005 2006 2007 2008 2009
EUR/t
-250
-200
-150
-100
-50
0
Total revenues from milk Total costs Net economic margin with coupled payments
Milk specialised farms - non-operating costs
76 81 86 92 95 102 104 113 106
186 183 187 189 170184 192
219 214
19 22 2336
2632 32
23 32
0
50
100
150
200
250
300
350
400
450
2001 2002 2003 2004 2005 2006 2007 2008 2009
EUR/t Depreciation Wages Rent Interest Family labour costs Own capital unpaid cost
Milk specialised farms - income per work unit and margins per tonne
0
5 000
10 000
15 000
20 000
25 000
30 000
2001 2002 2003 2004 2005 2006 2007 2008 2009
EUR/WU
-300
-250
-200
-150
-100
-50
0
50
100
150
200
250EUR/t of milk
Farm Net Value Added (FNVA) Farm net income (FNI)
Remuneration of Family Labour (RFL) Gross margin with coupled payments
Net margin with coupled payments Net economic margin with coupled payments
Source: EU FADN DG AGRI, model of the allocation of costs for milk. 100

EU Dairy farms report 2012 Annex II SE
Sweden Milk specialised farms
e: estimate*: trend between the average of the first three available years and the average of the last available three yearsSTRUCTURAL INFORMATION
2001 2002 2003 2004 2005 2006 2007 2008 2009 2010e 2011e
Three years
average trend*
Trend 2011 /2007
Sample farms 357 336 334 344 373 358 356 377 374 8%Farms represented 11 836 8 401 8 522 7 578 7 931 6 523 6 231 6 630 6 257 -34%% production from specialised farms 96% 93% 92% 95% 94% 96% 93% 97% 96% 2%Forage area - ha 55 65 66 71 69 77 71 71 75 17%Dairy cows - LU 39 46 45 47 45 53 53 55 57 27%Rented UAA - % 59% 60% 58% 54% 57% 61% 58% 59% 57% -1%Total labour - AWU 1,88 2,09 2,03 2,04 2,00 2,17 2,15 2,09 2,08 5%Family labour - % 81% 77% 78% 79% 80% 75% 76% 77% 76% -2%Milk per ha fodder area - t/ha 5,6 5,8 5,5 5,4 5,1 5,8 6,2 6,5 6,1 12%Milk yield - kg/cow 7 918 8 130 7 985 8 117 7 714 8 439 8 365 8 411 8 048 7 981 7 971 0% -5%Milk production - t 306 376 359 378 350 451 442 461 462 458 458 32% 3%
MILK MARGINS in EUR/t of milk (nominal)
2001 2002 2003 2004 2005 2006 2007 2008 2009 2010e 2011e
Three years
average trend*
Trend 2011 /2007
RevenuesPrice 324 326 340 331 325 294 323 361 274 352 397 3% 23%EU coupled payments (incl. Art.69) 0 0 0 11 16 23 0 0 0 0 0 - #DIV/0!National aids 0 0 0 0 0 0 0 0 0 0 0 - -Total revenues from milk 324 326 340 342 341 316 323 361 274 352 397 3% 23%Production costs Feed 103 103 99 101 96 92 107 128 103 98 109 2% 2%
homegrown feed 23 23 23 23 23 20 26 31 26 23 26 10% 3%puchased feed 80 80 76 77 73 72 81 97 78 74 83 -1% 2%
Herd renewal purchases 3 5 4 5 7 8 9 8 5 5 5 33% -43%Milk levy 0 0 0 0 0 0 0 0 0 0 0 - -Other specific costs 15 16 16 18 18 17 16 18 26 27 27 70% 72%Specific costs 121 124 120 124 122 118 132 154 135 130 142 11% 7%Machinery and building upkeep 27 23 24 25 28 25 25 26 24 24 25 -1% 0%Energy (fuel, electricity) 20 20 22 23 27 24 23 26 22 24 26 18% 16%Contract work 28 28 28 31 35 33 36 36 19 20 21 -29% -43%Taxes 0 0 0 0 0 0 0 0 0 0 0 -83% -42%Other direct inputs 11 12 13 16 18 17 18 18 21 22 23 84% 29%Non specific costs 86 83 86 95 108 99 102 107 86 90 95 6% -7%Total operating costs 207 207 206 219 230 217 234 261 221 220 237 9% 1%Gross margin 116 119 134 112 94 77 89 100 53 132 160 -6% 80%Gross margin with coupled payments 116 119 134 123 110 100 89 100 53 132 160 -6% 80%
%spe.farms with positive gross margin 95% 94% 97% 95% 92% 93% 89% 94% 80% 97% 98% -4% 9%
%milk production with positive gross margin 98% 97% 99% 99% 97% 98% 96% 95% 89% 99% 100% -2% 3%
Depreciation 66 66 72 63 68 62 46 40 41 -38%Wages 20 25 23 25 26 29 25 25 24 9%Rent 11 12 11 10 11 13 12 11 10 -4%Interest 18 19 20 17 16 16 17 20 14 -9%External factors 49 56 54 53 53 58 54 56 48 0%Net margin 1 -3 8 -4 -27 -43 -12 4 -37 -916%
Net margin with coupled payments 1 -3 8 8 -11 -20 -12 4 -37 -913%
Family labour costs 120 101 110 118 128 107 109 107 96 -5%Own capital unpaid cost 10 14 10 18 17 12 10 3 6 -45%Imputed family factors 131 115 120 136 145 118 118 110 103 -9%Net economic margin -130 -118 -112 -139 -173 -161 -130 -107 -139 -5%Net economic margin with coupled payments -130 -118 -112 -128 -156 -138 -130 -107 -139 -5%
%spe.farms with positive net economic margin - - - - - - - 5% - -
%milk production with positive net economic margin - - - - - - - 11% - -
Source: EU FADN DG AGRI, model of the allocation of costs for milk. 101

EU Dairy farms report 2012 Annex II SE
Sweden Milk specialised farmsINCOME in EUR/AWU (nominal)
2001 2002 2003 2004 2005 2006 2007 2008 2009
Three years
average trend*
Total output 71 320 78 726 87 684 89 061 85 491 91 395 101 487 115 883 91 589 30%Intermediate consumptions 50 214 54 494 60 873 65 783 64 964 71 136 76 912 86 218 78 981 46%Balance subsidies and taxes 13 449 15 319 13 908 15 278 20 364 23 581 22 457 23 881 21 784 60%
Decoupled payments 0 0 0 0 7 123 8 166 12 132 12 450 11 609 -Depreciation 15 634 17 267 18 352 16 575 16 284 17 563 13 488 12 170 12 498 -26%Farm Net Value Added (FNVA) 18 922 22 283 22 366 21 982 24 607 26 277 33 543 41 376 21 895 69%
External factors 11 750 14 738 13 780 14 184 12 948 16 450 15 944 17 484 14 678 19%Wages 4 920 6 476 5 965 6 884 6 341 8 337 7 440 7 820 7 221 29%
Rent 2 649 3 209 2 918 2 818 2 700 3 583 3 595 3 464 3 160 16%Interest 4 180 5 053 4 897 4 482 3 907 4 530 4 909 6 200 4 297 9%
Balance invest. subs. and taxes 144 63 10 0 95 38 0 0 367 69%Farm net income (FNI) 7 316 7 608 8 597 7 797 11 754 9 865 17 599 23 892 7 584 109%
Family farms only in EUR/FWU (nominal)Own capital unpaid cost 3 029 4 806 3 306 5 996 5 113 4 360 3 700 1 186 2 653 -32%Remuneration of Family Labour (RFL) 6 118 5 108 7 747 4 295 10 409 9 323 19 394 30 102 7 250 199%
%spe.farms with positive RFL 70% 66% 70% 60% 73% 71% 81% 91% 68% 11%
Milk specialised farms - gross margin
160116 119134 123
110 100 89 100
53
132
0
50
100
150
200
250
300
350
400
450
Rev
enue
s
Ope
ratin
g
Rev
enue
s
Ope
ratin
g
Rev
enue
s
Ope
ratin
g
Rev
enue
s
Ope
ratin
g
Rev
enue
s
Ope
ratin
g
Rev
enue
s
Ope
ratin
g
Rev
enue
s
Ope
ratin
g
Rev
enue
s
Ope
ratin
g
Rev
enue
s
Ope
ratin
g
Rev
enue
s
Ope
ratin
g
Rev
enue
s
Ope
ratin
g2001 2002 2003 2004 2005 2006 2007 2008 2009 2010e 2011e
EUR/t
Price EU coupled payments (incl. Art.69) National aids
Feed Other specific costs Non specific costs
Gross margin with coupled payments
Milk specialised farms - net margin
324 326340 342 341
316 323
361
274
323 329 332 335 352 336 334 357311
1
-3
8 8
-11
-20
-12
4
-370
50
100
150
200
250
300
350
400
2001 2002 2003 2004 2005 2006 2007 2008 2009
EUR/t
-40
-35
-30
-25
-20
-15
-10
-5
0
5
10
Total revenues from milk Operating costs + depreciation + external factors
Net margin with coupled payments
Source: EU FADN DG AGRI, model of the allocation of costs for milk. 102

EU Dairy farms report 2012 Annex II SE
Sweden Milk specialised farms
Milk specialised farms - net economic margin
324 326 340 342 341316 323
361
274
453 444 452 470497
455 453 468
413
-130-118
-112
-128
-156
-138-130
-107
-139
0
100
200
300
400
500
600
2001 2002 2003 2004 2005 2006 2007 2008 2009
EUR/t
-180
-160
-140
-120
-100
-80
-60
-40
-20
0
Total revenues from milk Total costs Net economic margin with coupled payments
Milk specialised farms - non-operating costs
66 66 72 63 68 62 46 40 41
120 101 110 118128
107109 107
96
1014
10 1817
1210
36
0
50
100
150
200
250
300
2001 2002 2003 2004 2005 2006 2007 2008 2009
EUR/t Depreciation Wages Rent Interest Family labour costs Own capital unpaid cost
Milk specialised farms - income per work unit and margins per tonne
0
5 000
10 000
15 000
20 000
25 000
30 000
35 000
40 000
45 000
2001 2002 2003 2004 2005 2006 2007 2008 2009
EUR/WU
-200
-150
-100
-50
0
50
100
150EUR/t of milk
Farm Net Value Added (FNVA) Farm net income (FNI)
Remuneration of Family Labour (RFL) Gross margin with coupled payments
Net margin with coupled payments Net economic margin with coupled payments
Source: EU FADN DG AGRI, model of the allocation of costs for milk. 103

EU Dairy farms report 2012 Annex II UK
United Kingdom Milk specialised farms
e: estimate*: trend between the average of the first three available years and the average of the last available three yearsSTRUCTURAL INFORMATION
2001 2002 2003 2004 2005 2006 2007 2008 2009 2010e 2011e
Three years
average trend*
Trend 2011 /2007
Sample farms 622 582 683 575 561 525 525 535 537 -15%Farms represented 24 128 20 304 20 101 19 065 19 782 15 434 15 509 15 477 15 517 -28%% production from specialised farms 95% 90% 92% 93% 96% 94% 95% 96% 97% 3%Forage area - ha 78 78 79 81 86 95 94 94 100 22%Dairy cows - LU 93 95 99 98 98 115 116 117 117 22%Rented UAA - % 36% 37% 37% 36% 39% 38% 40% 40% 45% 5%Total labour - AWU 2,24 2,23 2,27 2,26 2,36 2,52 2,51 2,53 2,56 13%Family labour - % 69% 70% 69% 69% 67% 64% 66% 65% 63% -5%Milk per ha fodder area - t/ha 7,9 8,2 8,7 8,3 8,0 8,6 8,8 8,8 8,4 5%Milk yield - kg/cow 6 592 6 720 6 972 6 855 7 002 7 091 7 093 7 078 7 116 7 374 7 636 9% 8%Milk production - t 613 641 687 669 683 815 826 830 836 866 897 34% 9%
MILK MARGINS in EUR/t of milk (nominal)
2001 2002 2003 2004 2005 2006 2007 2008 2009 2010e 2011e
Three years
average trend*
Trend 2011 /2007
RevenuesPrice 309 266 260 267 266 262 315 311 263 284 312 3% -1%EU coupled payments (incl. Art.69) 0 0 0 10 0 0 0 0 0 0 0 - -National aids 0 0 0 0 0 0 0 0 0 0 0 - -Total revenues from milk 309 266 260 277 266 262 315 311 263 284 312 3% -1%Production costs Feed 86 78 74 74 75 83 97 107 95 75 101 14% 4%
homegrown feed 21 19 18 20 20 20 22 24 22 17 21 5% -2%puchased feed 65 59 56 54 56 63 75 83 73 57 79 17% 6%
Herd renewal purchases 1 1 1 1 2 1 2 2 2 2 2 82% 1%Milk levy 0 0 0 0 0 0 0 0 0 0 0 - -Other specific costs 28 27 25 27 27 29 31 30 29 32 31 15% 2%Specific costs 115 106 100 102 104 114 130 139 126 109 134 15% 3%Machinery and building upkeep 17 16 15 16 16 17 18 17 16 16 16 0% -8%Energy (fuel, electricity) 10 9 8 10 12 12 14 15 13 14 15 51% 11%Contract work 14 13 12 13 14 14 16 16 15 15 15 15% -2%Taxes 0 0 0 0 0 0 0 0 0 0 0 62% -20%Other direct inputs 14 14 16 18 19 18 18 15 14 14 14 -6% -24%Non specific costs 56 52 51 57 62 62 66 63 57 59 61 11% -7%Total operating costs 171 158 152 159 165 176 195 203 183 168 195 14% 0%Gross margin 138 108 108 108 101 86 120 109 80 116 117 -12% -2%Gross margin with coupled payments 138 108 108 118 101 86 120 109 80 116 117 -12% -2%
%spe.farms with positive gross margin 98% 99% 97% 98% 98% 97% 99% 98% 94% 98% 97% -1% -2%
%milk production with positive gross margin 99% 99% 99% 99% 99% 98% 100% 100% 98% 100% 99% 0% 0%
Depreciation 29 26 25 26 26 28 28 29 27 6%Wages 22 20 19 19 22 22 22 20 20 1%Rent 12 12 13 11 10 9 9 8 8 -35%Interest 11 10 9 10 10 10 11 9 5 -16%External factors 46 42 41 40 42 42 42 37 32 -14%Net margin 63 41 42 42 33 17 49 43 20 -23%
Net margin with coupled payments 63 41 42 52 33 17 49 43 20 -23%
Family labour costs 50 48 44 48 51 45 47 41 37 -12%Own capital unpaid cost 26 31 26 25 15 13 14 8 10 -61%Imputed family factors 76 79 69 73 66 58 61 49 47 -30%Net economic margin -13 -39 -27 -31 -33 -41 -12 -6 -27 43%Net economic margin with coupled payments -13 -39 -28 -21 -33 -41 -12 -6 -27 43%
%spe.farms with positive net economic margin 32% 21% 25% 22% 18% 12% 31% 37% 19% 3%
%milk production with positive net economic margin 48% 33% 39% 32% 28% 20% 45% 48% 32% 2%
Source: EU FADN DG AGRI, model of the allocation of costs for milk. 104
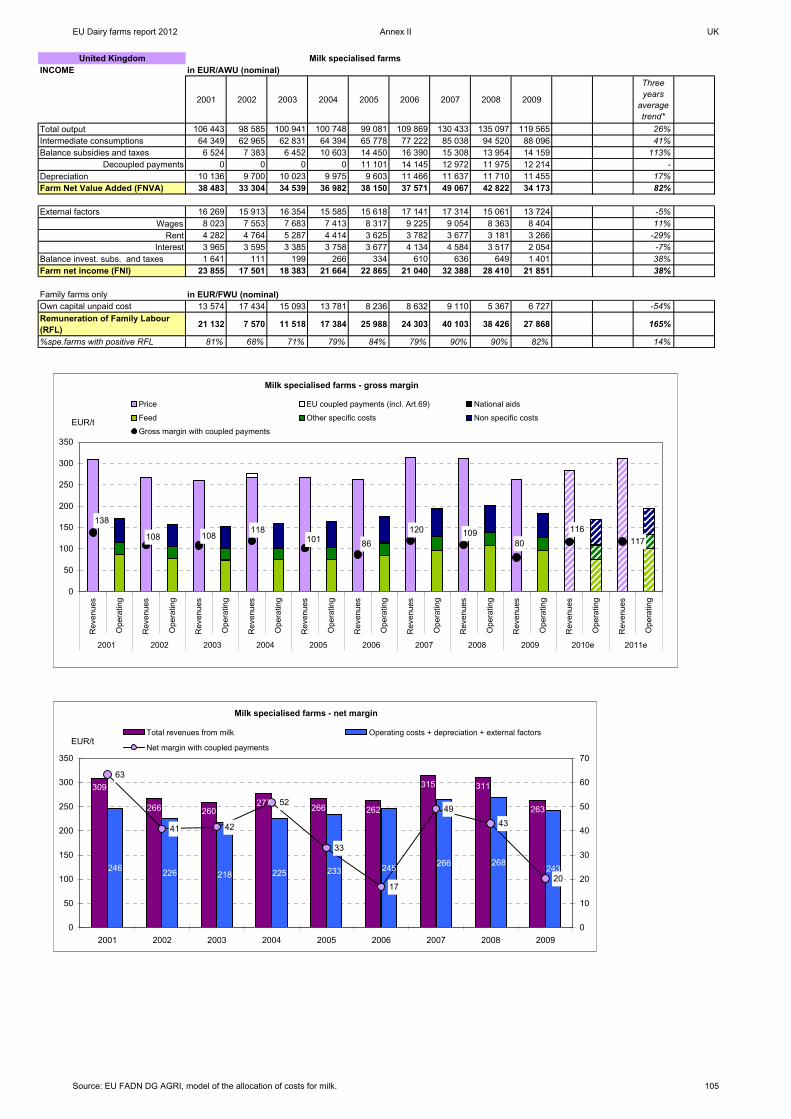
EU Dairy farms report 2012 Annex II UK
United Kingdom Milk specialised farmsINCOME in EUR/AWU (nominal)
2001 2002 2003 2004 2005 2006 2007 2008 2009
Three years
average trend*
Total output 106 443 98 585 100 941 100 748 99 081 109 869 130 433 135 097 119 565 26%Intermediate consumptions 64 349 62 965 62 831 64 394 65 778 77 222 85 038 94 520 88 096 41%Balance subsidies and taxes 6 524 7 383 6 452 10 603 14 450 16 390 15 308 13 954 14 159 113%
Decoupled payments 0 0 0 0 11 101 14 145 12 972 11 975 12 214 -Depreciation 10 136 9 700 10 023 9 975 9 603 11 466 11 637 11 710 11 455 17%Farm Net Value Added (FNVA) 38 483 33 304 34 539 36 982 38 150 37 571 49 067 42 822 34 173 82%
External factors 16 269 15 913 16 354 15 585 15 618 17 141 17 314 15 061 13 724 -5%Wages 8 023 7 553 7 683 7 413 8 317 9 225 9 054 8 363 8 404 11%
Rent 4 282 4 764 5 287 4 414 3 625 3 782 3 677 3 181 3 266 -29%Interest 3 965 3 595 3 385 3 758 3 677 4 134 4 584 3 517 2 054 -7%
Balance invest. subs. and taxes 1 641 111 199 266 334 610 636 649 1 401 38%Farm net income (FNI) 23 855 17 501 18 383 21 664 22 865 21 040 32 388 28 410 21 851 38%
Family farms only in EUR/FWU (nominal)Own capital unpaid cost 13 574 17 434 15 093 13 781 8 236 8 632 9 110 5 367 6 727 -54%Remuneration of Family Labour (RFL) 21 132 7 570 11 518 17 384 25 988 24 303 40 103 38 426 27 868 165%
%spe.farms with positive RFL 81% 68% 71% 79% 84% 79% 90% 90% 82% 14%
Milk specialised farms - gross margin
117
138
108 108118
101 86120 109
80116
0
50
100
150
200
250
300
350
Rev
enue
s
Ope
ratin
g
Rev
enue
s
Ope
ratin
g
Rev
enue
s
Ope
ratin
g
Rev
enue
s
Ope
ratin
g
Rev
enue
s
Ope
ratin
g
Rev
enue
s
Ope
ratin
g
Rev
enue
s
Ope
ratin
g
Rev
enue
s
Ope
ratin
g
Rev
enue
s
Ope
ratin
g
Rev
enue
s
Ope
ratin
g
Rev
enue
s
Ope
ratin
g2001 2002 2003 2004 2005 2006 2007 2008 2009 2010e 2011e
EUR/t
Price EU coupled payments (incl. Art.69) National aids
Feed Other specific costs Non specific costs
Gross margin with coupled payments
Milk specialised farms - net margin
309
266 260277 266 262
315 311
263
246 226 218 225 233 245 266 268243
63
41 42
52
33
17
49
43
20
0
50
100
150
200
250
300
350
2001 2002 2003 2004 2005 2006 2007 2008 2009
EUR/t
0
10
20
30
40
50
60
70
Total revenues from milk Operating costs + depreciation + external factors
Net margin with coupled payments
Source: EU FADN DG AGRI, model of the allocation of costs for milk. 105
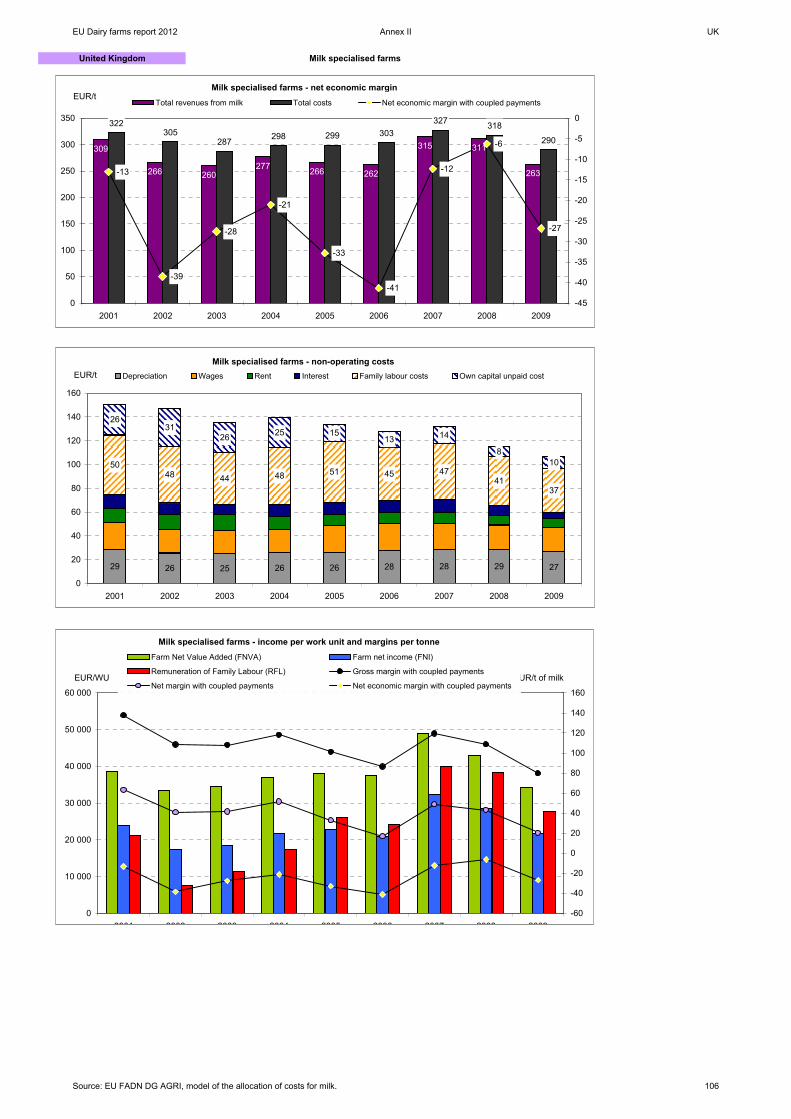
EU Dairy farms report 2012 Annex II UK
United Kingdom Milk specialised farms
Milk specialised farms - net economic margin
309
266 260277 266 262
315 311
263
322305
287 298 299 303327 318
290
-13
-39
-28
-21
-33
-41
-12
-6
-27
0
50
100
150
200
250
300
350
2001 2002 2003 2004 2005 2006 2007 2008 2009
EUR/t
-45
-40
-35
-30
-25
-20
-15
-10
-5
0
Total revenues from milk Total costs Net economic margin with coupled payments
Milk specialised farms - non-operating costs
29 26 25 26 26 28 28 29 27
5048 44 48 51 45 47
4137
2631
26 25 1513 14
810
0
20
40
60
80
100
120
140
160
2001 2002 2003 2004 2005 2006 2007 2008 2009
EUR/t Depreciation Wages Rent Interest Family labour costs Own capital unpaid cost
Milk specialised farms - income per work unit and margins per tonne
0
10 000
20 000
30 000
40 000
50 000
60 000
2001 2002 2003 2004 2005 2006 2007 2008 2009
EUR/WU
-60
-40
-20
0
20
40
60
80
100
120
140
160
EUR/t of milk
Farm Net Value Added (FNVA) Farm net income (FNI)
Remuneration of Family Labour (RFL) Gross margin with coupled payments
Net margin with coupled payments Net economic margin with coupled payments
Source: EU FADN DG AGRI, model of the allocation of costs for milk. 106

EU Dairy farms report 2012 Annex II CZ
Czech Republic Milk specialised farms
e: estimate*: trend between the average of the first three available years and the average of the last available three yearsSTRUCTURAL INFORMATION
2004 2005 2006 2007 2008 2009 2010e 2011e
Three years
average trend*
Trend 2011 /2007
Sample farms 134 144 127 126 150 137 2%Farms represented 1 216 1 155 1 031 1 004 1 142 985 -8%% production from specialised farms 24% 27% 23% 28% 30% 23% 2%Forage area - ha 122 153 137 175 170 149 20%Dairy cows - LU 68 82 74 93 85 81 15%Rented UAA - % 89% 88% 86% 86% 88% 85% -1%Total labour - AWU 7,63 9,05 8,05 10,40 9,14 8,39 13%Family labour - % 23% 19% 22% 15% 17% 20% -4%Milk per ha fodder area - t/ha 3,6 3,4 3,5 3,5 3,3 3,5 -2%Milk yield - kg/cow 6 362 6 346 6 410 6 488 6 558 6 532 6 443 6 594 2% 2%Milk production - t 435 523 474 605 555 528 521 533 11% -12%
MILK MARGINS in EUR/t of milk (nominal)
2004 2005 2006 2007 2008 2009 2010e 2011e
Three years
average trend*
Trend 2011 /2007
RevenuesPrice 250 274 274 301 330 244 304 352 13% 17%EU coupled payments (incl. Art.69) 0 0 0 0 0 0 0 0 - -National aids 0 0 0 0 0 0 0 0 - -Total revenues from milk 250 274 274 301 330 244 304 352 13% 17%Production costs Feed 74 79 80 93 105 87 84 94 14% 1%
homegrown feed 36 40 37 41 49 39 37 41 3% 1%puchased feed 38 39 43 53 56 48 48 53 24% 0%
Herd renewal purchases 2 2 2 1 2 2 2 2 27% 78%Milk levy 0 0 0 0 0 0 0 0 - -Other specific costs 16 17 18 19 21 22 22 22 27% 15%Specific costs 92 97 100 113 128 111 108 118 16% 4%Machinery and building upkeep 19 21 23 26 29 22 23 23 7% -12%Energy (fuel, electricity) 24 28 33 36 45 39 44 47 51% 31%Contract work 9 10 14 15 18 12 12 11 7% -23%Taxes 1 1 1 1 1 1 1 1 -46% -42%Other direct inputs 24 26 25 31 35 26 26 26 4% -18%Non specific costs 77 88 95 109 128 99 105 108 20% -2%Total operating costs 169 185 196 223 255 210 213 226 18% 1%Gross margin 81 89 79 78 75 34 91 127 1% 62%Gross margin with coupled payments 81 89 79 78 75 34 91 127 1% 62%
%spe.farms with positive gross margin 96% 95% 88% 94% 88% 79% 95% 98% -3% 5%
%milk production with positive gross margin 98% 97% 92% 96% 90% 77% 96% 98% -5% 2%
Depreciation 23 28 31 35 41 40 41%Wages 56 67 65 82 90 77 32%Rent 4 5 5 6 8 7 51%Interest 3 3 4 4 7 5 55%External factors 63 76 74 92 105 89 35%Net margin -5 -15 -26 -49 -71 -95 -364%
Net margin with coupled payments -5 -15 -26 -49 -71 -95 -364%
Family labour costs 20 20 23 18 22 24 2%Own capital unpaid cost 11 10 10 7 0 27 7%Imputed family factors 31 30 33 25 22 51 3%Net economic margin -36 -45 -59 -74 -93 -146 -122%Net economic margin with coupled payments -36 -45 -59 -74 -93 -146 -122%
%spe.farms with positive net economic margin 14% 20% 13% 14% 11% - -
%milk production with positive net economic margin 19% 19% 17% 13% 8% - -
Source: EU FADN DG AGRI, model of the allocation of costs for milk. 107

EU Dairy farms report 2012 Annex II CZ
Czech Republic Milk specialised farmsINCOME in EUR/AWU (nominal)
2004 2005 2006 2007 2008 2009
Three years
average trend*
Total output 25 768 27 094 27 854 32 279 36 135 27 980 19%Intermediate consumptions 18 570 19 946 21 607 24 429 28 936 24 281 29%Balance subsidies and taxes 4 188 5 776 7 490 8 213 10 200 9 863 62%
Decoupled payments 1 233 1 803 2 226 2 568 3 451 3 767 86%Depreciation 2 159 2 607 2 987 3 320 3 927 3 896 44%Farm Net Value Added (FNVA) 9 227 10 317 10 750 12 743 13 472 9 666 9%
External factors 5 966 7 188 7 236 8 994 10 354 8 990 39%Wages 5 325 6 430 6 379 7 992 8 911 7 795 36%
Rent 353 452 501 589 791 705 60%Interest 287 306 355 413 653 490 64%
Balance invest. subs. and taxes 20 344 113 499 235 213 98%Farm net income (FNI) 3 280 3 473 3 628 4 248 3 353 889 -18%
Family farms only in EUR/FWU (nominal)Own capital unpaid cost 2 570 3 113 2 858 2 718 10 8 536 32%Remuneration of Family Labour (RFL) 7 147 11 423 11 874 16 697 17 537 6 731 35%
%spe.farms with positive RFL 83% 84% 86% 90% 78% 65% -7%
Milk specialised farms - gross margin
81 89 79 78 75
34
91
127
0
50
100
150
200
250
300
350
400
Rev
enue
s
Ope
ratin
g
Rev
enue
s
Ope
ratin
g
Rev
enue
s
Ope
ratin
g
Rev
enue
s
Ope
ratin
g
Rev
enue
s
Ope
ratin
g
Rev
enue
s
Ope
ratin
g
Rev
enue
s
Ope
ratin
g
Rev
enue
s
Ope
ratin
g
2004 2005 2006 2007 2008 2009 2010e 2011e
EUR/t
Price EU coupled payments (incl. Art.69)National aids FeedOther specific costs Non specific costsGross margin with coupled payments
Milk specialised farms - net margin
250274 274
301330
244
255289 300
350401
339
-5
-15
-26
-49
-71
-95
0
50
100
150
200
250
300
350
400
450
2004 2005 2006 2007 2008 2009
EUR/t
-120
-100
-80
-60
-40
-20
0
Total revenues from milkOperating costs + depreciation + external factorsNet margin with coupled payments
Source: EU FADN DG AGRI, model of the allocation of costs for milk. 108
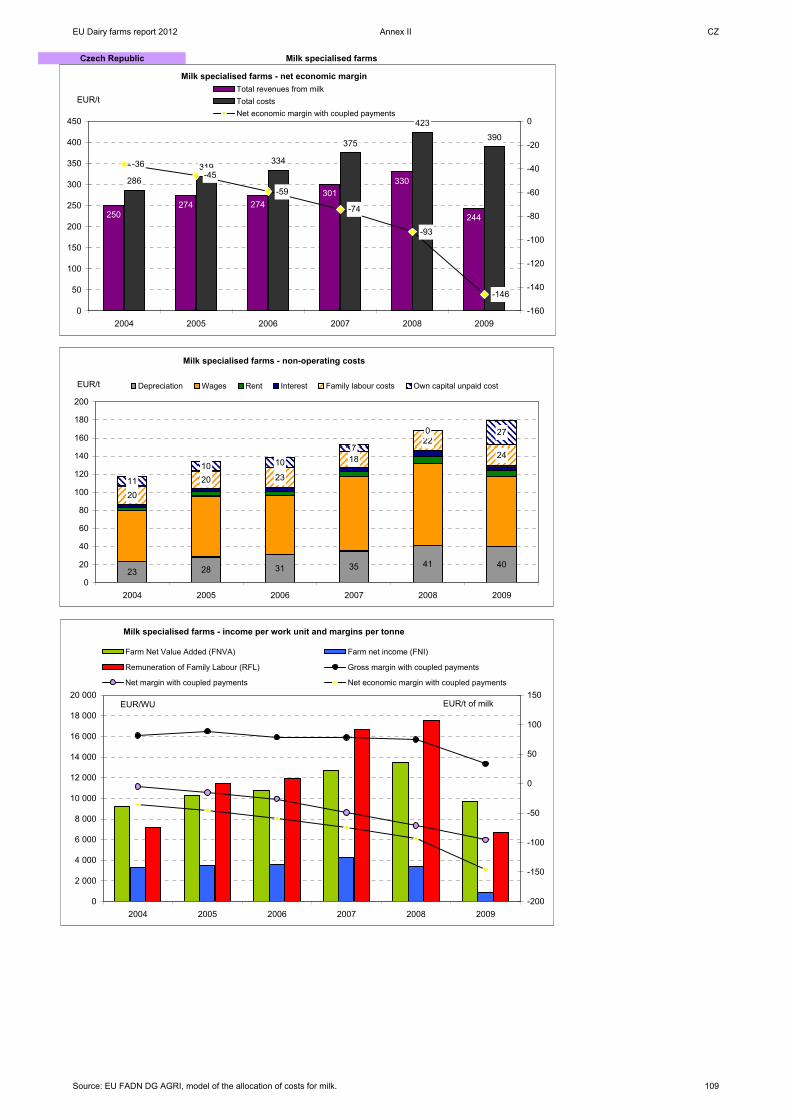
EU Dairy farms report 2012 Annex II CZ
Czech Republic Milk specialised farms
Milk specialised farms - net economic margin
250274 274
301330
244
286319
334
375
423
390
-36-45
-59
-74
-93
-146
0
50
100
150
200
250
300
350
400
450
2004 2005 2006 2007 2008 2009
EUR/t
-160
-140
-120
-100
-80
-60
-40
-20
0
Total revenues from milkTotal costsNet economic margin with coupled payments
Milk specialised farms - non-operating costs
23 28 31 35 41 40
20
20 23
18
22
24
11
10 10
7
0 27
0
20
40
60
80
100
120
140
160
180
200
2004 2005 2006 2007 2008 2009
EUR/t Depreciation Wages Rent Interest Family labour costs Own capital unpaid cost
Milk specialised farms - income per work unit and margins per tonne
0
2 000
4 000
6 000
8 000
10 000
12 000
14 000
16 000
18 000
20 000
2004 2005 2006 2007 2008 2009
EUR/WU
-200
-150
-100
-50
0
50
100
150EUR/t of milk
Farm Net Value Added (FNVA) Farm net income (FNI)
Remuneration of Family Labour (RFL) Gross margin with coupled payments
Net margin with coupled payments Net economic margin with coupled payments
Source: EU FADN DG AGRI, model of the allocation of costs for milk. 109

EU Dairy farms report 2012 Annex II EE
Estonia Milk specialised farms
e: estimate*: trend between the average of the first three available years and the average of the last available three yearsSTRUCTURAL INFORMATION
2004 2005 2006 2007 2008 2009 2010e 2011e
Three years
average trend*
Trend 2011 /2007
Sample farms 188 188 177 151 146 133 -22%Farms represented 1 806 1 517 1 201 1 241 1 291 1 319 -15%% production from specialised farms 75% 87% 90% 86% 91% 89% 4%Forage area - ha 111 137 162 156 156 146 12%Dairy cows - LU 40 52 66 63 67 63 22%Rented UAA - % 67% 67% 68% 66% 62% 61% -4%Total labour - AWU 4,71 5,71 6,87 6,02 5,98 5,32 0%Family labour - % 36% 27% 23% 26% 23% 26% -4%Milk per ha fodder area - t/ha 2,0 2,3 2,6 2,7 3,1 3,1 28%Milk yield - kg/cow 5 691 6 040 6 578 6 761 7 261 7 199 7 266 7 472 20% 11%Milk production - t 227 314 434 428 485 451 455 468 41% 9%
MILK MARGINS in EUR/t of milk (nominal)
2004 2005 2006 2007 2008 2009 2010e 2011e
Three years
average trend*
Trend 2011 /2007
RevenuesPrice 236 245 238 262 286 206 272 316 10% 21%EU coupled payments (incl. Art.69) 0 0 0 0 0 0 0 0 - -National aids 0 0 14 0 0 0 0 0 - -Total revenues from milk 236 245 252 262 286 206 272 316 8% 21%Production costs Feed 72 80 84 91 108 79 78 98 8% 7%
homegrown feed 41 43 42 45 55 47 46 57 17% 25%puchased feed 31 36 42 46 53 32 32 41 -3% -10%
Herd renewal purchases 2 1 1 1 1 0 0 0 -71% -72%Milk levy 0 0 0 0 0 0 0 0 - -Other specific costs 10 15 14 14 17 16 16 16 22% 13%Specific costs 84 95 99 107 126 95 94 114 9% 7%Machinery and building upkeep 11 15 14 16 16 13 13 14 1% -13%Energy (fuel, electricity) 23 27 27 25 32 25 28 31 8% 22%Contract work 6 10 7 7 9 7 7 7 -10% -7%Taxes 0 0 1 0 0 0 0 0 -54% 38%Other direct inputs 10 10 12 12 13 11 11 11 1% -9%Non specific costs 50 62 60 60 70 55 59 62 2% 4%Total operating costs 134 157 160 166 197 150 152 176 6% 6%Gross margin 102 89 78 96 89 56 119 140 17% 46%Gross margin with coupled payments 102 89 93 96 89 56 119 140 12% 46%
%spe.farms with positive gross margin 99% 91% 92% 82% 79% 76% 93% 95% -6% 13%
%milk production with positive gross margin 99% 99% 98% 95% 96% 95% 99% 100% -1% 5%
Depreciation 23 22 27 32 37 36 44%Wages 42 51 56 58 66 55 20%Rent 1 2 2 2 2 3 54%Interest 3 4 6 9 12 12 152%External factors 46 57 65 69 81 71 32%Net margin 33 9 -14 -5 -28 -50 -394%
Net margin with coupled payments 33 9 0 -5 -28 -50 -296%
Family labour costs 24 20 16 19 19 20 -3%Own capital unpaid cost 4 0 1 0 0 36 587%Imputed family factors 28 21 17 20 19 56 45%Net economic margin 5 -11 -31 -25 -47 -106 -384%Net economic margin with coupled payments 5 -11 -16 -25 -47 -106 -693%
%spe.farms with positive net economic margin 25% 19% 14% 16% 8% - -
%milk production with positive net economic margin 74% 46% 24% 43% 20% - -
Source: EU FADN DG AGRI, model of the allocation of costs for milk. 110

EU Dairy farms report 2012 Annex II EE
Estonia Milk specialised farmsINCOME in EUR/AWU (nominal)
2004 2005 2006 2007 2008 2009
Three years
average trend*
Total output 18 216 21 659 23 799 31 247 38 213 32 164 60%Intermediate consumptions 11 741 15 307 17 500 21 046 28 128 25 056 67%Balance subsidies and taxes 3 350 4 129 4 840 6 213 7 660 6 794 68%
Decoupled payments 819 1 094 1 367 1 691 2 234 2 785 105%Depreciation 1 693 1 844 2 423 3 460 4 404 4 501 107%Farm Net Value Added (FNVA) 8 132 8 638 8 716 12 955 13 341 9 401 -47%
External factors 3 236 4 537 5 673 7 317 9 558 8 933 92%Wages 2 965 4 071 4 916 6 107 7 819 6 988 75%
Rent 83 137 197 228 298 385 118%Interest 188 329 560 982 1 441 1 560 270%
Balance invest. subs. and taxes 528 290 276 430 2 134 1 981 316%Farm net income (FNI) 5 423 4 391 3 320 6 068 5 916 2 449 10%
Family farms only in EUR/FWU (nominal)Own capital unpaid cost 838 109 241 51 26 17 299 1363%Remuneration of Family Labour (RFL) 8 212 8 349 8 732 11 784 15 715 4 176 25%
%spe.farms with positive RFL 99% 98% 92% 95% 86% 61% -15%
Milk specialised farms - gross margin
10289 93 96 89
56
119
140
0
50
100
150
200
250
300
350
Rev
enue
s
Ope
ratin
g
Rev
enue
s
Ope
ratin
g
Rev
enue
s
Ope
ratin
g
Rev
enue
s
Ope
ratin
g
Rev
enue
s
Ope
ratin
g
Rev
enue
s
Ope
ratin
g
Rev
enue
s
Ope
ratin
g
Rev
enue
s
Ope
ratin
g
2004 2005 2006 2007 2008 2009 2010e 2011e
EUR/t
Price EU coupled payments (incl. Art.69)National aids FeedOther specific costs Non specific costsGross margin with coupled payments
Milk specialised farms - net margin
236 245 252 262286
206
203236 252 268
314
256
33
9
0-5
-28
-50
0
50
100
150
200
250
300
350
2004 2005 2006 2007 2008 2009
EUR/t
-60
-50
-40
-30
-20
-10
0
10
20
30
40
Total revenues from milkOperating costs + depreciation + external factorsNet margin with coupled payments
Source: EU FADN DG AGRI, model of the allocation of costs for milk. 111

EU Dairy farms report 2012 Annex II EE
Estonia Milk specialised farms
Milk specialised farms - net economic margin
236 245 252 262286
206
231257
268287
333313
5
-11-16
-25
-47
-106
0
50
100
150
200
250
300
350
2004 2005 2006 2007 2008 2009
EUR/t
-120
-100
-80
-60
-40
-20
0
20
Total revenues from milkTotal costsNet economic margin with coupled payments
Milk specialised farms - non-operating costs
23 22 27 32 37 36
2420
1619
1920
4 01
0
036
0
20
40
60
80
100
120
140
160
180
2004 2005 2006 2007 2008 2009
EUR/t Depreciation Wages Rent Interest Family labour costs Own capital unpaid cost
Milk specialised farms - income per work unit and margins per tonne
0
2 000
4 000
6 000
8 000
10 000
12 000
14 000
16 000
18 000
2004 2005 2006 2007 2008 2009
EUR/WU
-150
-100
-50
0
50
100
150EUR/t of milk
Farm Net Value Added (FNVA) Farm net income (FNI)
Remuneration of Family Labour (RFL) Gross margin with coupled payments
Net margin with coupled payments Net economic margin with coupled payments
Source: EU FADN DG AGRI, model of the allocation of costs for milk. 112

EU Dairy farms report 2012 Annex II HU
Hungary Milk specialised farms
e: estimate*: trend between the average of the first three available years and the average of the last available three yearsSTRUCTURAL INFORMATION
2004 2005 2006 2007 2008 2009 2010e 2011e
Three years
average trend*
Trend 2011 /2007
Sample farms 81 80 83 74 81 93 2%Farms represented 3 573 1 646 2 120 2 140 2 028 3 539 5%% production from specialised farms 50% 48% 69% 45% 47% 49% -9%Forage area - ha 29 69 55 55 68 42 7%Dairy cows - LU 27 58 55 54 61 37 9%Rented UAA - % 77% 75% 82% 80% 79% 72% -1%Total labour - AWU 2,11 4,63 4,91 4,46 4,74 3,16 6%Family labour - % 25% 21% 18% 20% 22% 34% 4%Milk per ha fodder area - t/ha 5,4 5,0 6,4 6,3 5,8 5,8 6%Milk yield - kg/cow 6 315 6 577 6 871 6 946 6 846 6 645 6 608 6 421 0% -8%Milk production - t 169 383 376 375 416 248 247 240 -21% -36%
MILK MARGINS in EUR/t of milk (nominal)
2004 2005 2006 2007 2008 2009 2010e 2011e
Three years
average trend*
Trend 2011 /2007
RevenuesPrice 258 272 246 293 323 235 285 337 11% 15%EU coupled payments (incl. Art.69) 0 0 0 0 0 0 0 0 - -National aids 7 14 30 0 0 0 0 0 -98% #DIV/0!Total revenues from milk 265 286 276 293 323 235 285 338 4% 15%Production costs Feed 114 109 87 128 144 113 125 153 26% 19%
homegrown feed 31 35 27 33 38 33 35 42 17% 27%puchased feed 83 74 60 95 106 81 90 111 29% 16%
Herd renewal purchases 2 1 1 2 1 0 0 0 -87% -91%Milk levy 0 0 0 0 0 0 0 0 - -Other specific costs 21 19 18 23 14 15 16 16 -18% -28%Specific costs 137 129 106 153 158 128 141 169 18% 11%Machinery and building upkeep 10 12 13 14 14 12 12 13 6% -7%Energy (fuel, electricity) 24 28 31 27 35 28 33 38 19% 38%Contract work 11 9 9 12 15 13 13 14 35% 15%Taxes 4 3 3 3 3 2 2 2 -39% -31%Other direct inputs 22 18 18 20 23 25 26 27 31% 35%Non specific costs 71 70 74 76 89 79 85 93 20% 23%Total operating costs 207 199 180 229 248 207 226 263 19% 15%Gross margin 51 73 66 64 75 28 59 75 -15% 17%Gross margin with coupled payments 58 86 96 64 75 28 59 75 -32% 18%
%spe.farms with positive gross margin 88% 99% 94% 91% 91% 70% 92% 92% -9% 1%
%milk production with positive gross margin 90% 97% 98% 93% 79% 77% 86% 86% -12% -8%
Depreciation 21 27 23 21 22 23 -6%Wages 39 40 49 51 51 42 12%Rent 7 6 8 11 11 10 50%Interest 11 10 9 8 9 9 -11%External factors 58 56 67 71 72 61 13%Net margin -28 -11 -23 -28 -19 -57 -67%
Net margin with coupled payments -21 3 7 -28 -19 -56 -815%
Family labour costs 12 11 10 12 13 21 38%Own capital unpaid cost 5 8 17 1 6 15 -26%Imputed family factors 17 19 27 13 19 36 8%Net economic margin -45 -30 -51 -41 -38 -93 -37%Net economic margin with coupled payments -38 -16 -21 -41 -38 -93 -131%
%spe.farms with positive net economic margin 28% 29% 26% 12% 24% - -
%milk production with positive net economic margin 19% 31% 24% 22% 27% - -
Source: EU FADN DG AGRI, model of the allocation of costs for milk. 113

EU Dairy farms report 2012 Annex II HU
Hungary Milk specialised farmsINCOME in EUR/AWU (nominal)
2004 2005 2006 2007 2008 2009
Three years
average trend*
Total output 33 522 35 307 32 720 39 871 47 888 34 004 20%Intermediate consumptions 25 812 26 240 23 686 30 897 35 737 29 001 26%Balance subsidies and taxes 4 722 5 197 6 340 7 088 8 080 7 944 42%
Decoupled payments 1 408 1 752 2 009 2 183 3 061 3 787 75%Depreciation 2 704 3 237 2 730 2 708 3 059 3 014 1%Farm Net Value Added (FNVA) 9 728 11 026 12 643 13 354 17 171 9 934 35%
External factors 7 324 6 842 7 779 8 926 9 644 7 655 19%Wages 4 934 4 812 5 772 6 363 6 860 5 126 18%
Rent 945 802 932 1 483 1 532 1 320 62%Interest 1 446 1 229 1 075 1 080 1 252 1 209 -6%
Balance invest. subs. and taxes 37 508 257 62 492 769 65%Farm net income (FNI) 2 440 4 692 5 121 4 490 8 020 3 048 27%
Family farms only in EUR/FWU (nominal)Own capital unpaid cost 2 230 4 284 11 745 685 3 495 5 659 -46%Remuneration of Family Labour (RFL) 11 781 15 094 8 386 14 561 21 851 7 052 23%
%spe.farms with positive RFL 87% 77% 84% 61% 61% 69% -19%
Milk specialised farms - gross margin
5886
9664 75
28
59
75
0
50
100
150
200
250
300
350
400
Rev
enue
s
Ope
ratin
g
Rev
enue
s
Ope
ratin
g
Rev
enue
s
Ope
ratin
g
Rev
enue
s
Ope
ratin
g
Rev
enue
s
Ope
ratin
g
Rev
enue
s
Ope
ratin
g
Rev
enue
s
Ope
ratin
g
Rev
enue
s
Ope
ratin
g
2004 2005 2006 2007 2008 2009 2010e 2011e
EUR/t
Price EU coupled payments (incl. Art.69)National aids FeedOther specific costs Non specific costsGross margin with coupled payments
Milk specialised farms - net margin
265286 276
293323
235
286 283 269321 342
292
-21
37
-28
-19
-560
50
100
150
200
250
300
350
400
2004 2005 2006 2007 2008 2009
EUR/t
-60
-50
-40
-30
-20
-10
0
10
Total revenues from milkOperating costs + depreciation + external factorsNet margin with coupled payments
Source: EU FADN DG AGRI, model of the allocation of costs for milk. 114
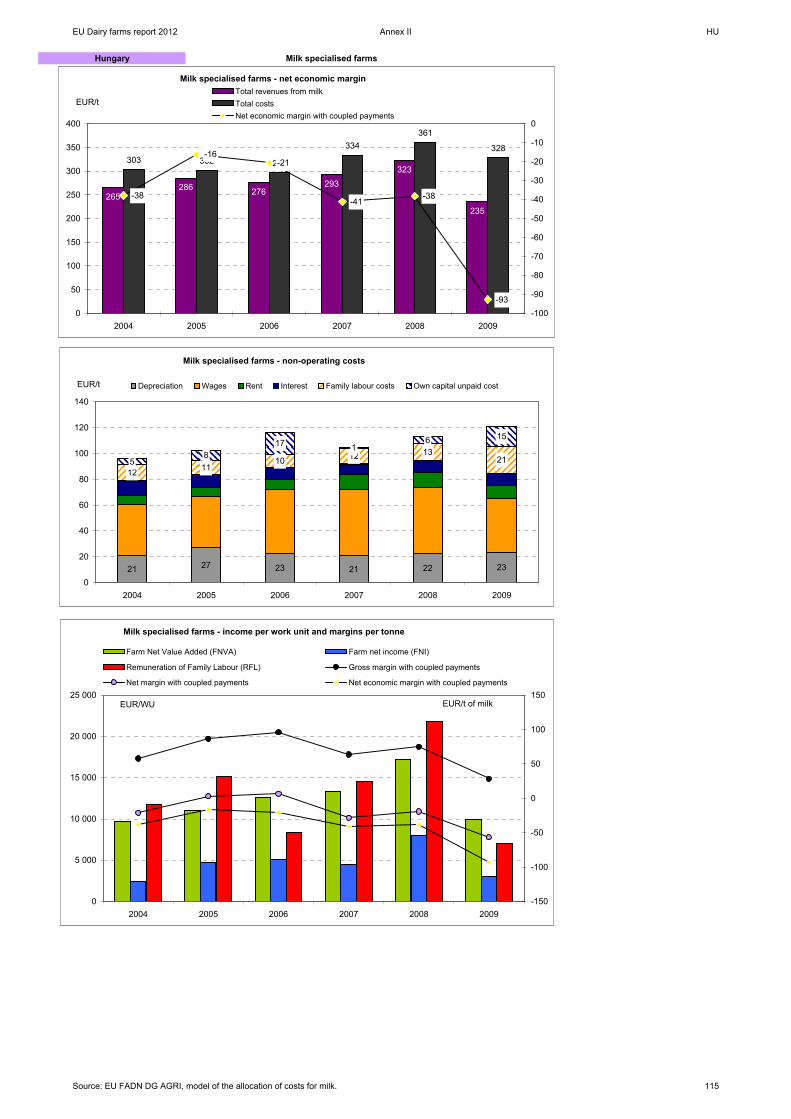
EU Dairy farms report 2012 Annex II HU
Hungary Milk specialised farms
Milk specialised farms - net economic margin
265286 276
293323
235
303 302 296
334361
328
-38
-16-21
-41-38
-930
50
100
150
200
250
300
350
400
2004 2005 2006 2007 2008 2009
EUR/t
-100
-90
-80
-70
-60
-50
-40
-30
-20
-10
0
Total revenues from milkTotal costsNet economic margin with coupled payments
Milk specialised farms - non-operating costs
21 27 23 21 22 23
12 1110 12 13
2158
17 16 15
0
20
40
60
80
100
120
140
2004 2005 2006 2007 2008 2009
EUR/t Depreciation Wages Rent Interest Family labour costs Own capital unpaid cost
Milk specialised farms - income per work unit and margins per tonne
0
5 000
10 000
15 000
20 000
25 000
2004 2005 2006 2007 2008 2009
EUR/WU
-150
-100
-50
0
50
100
150EUR/t of milk
Farm Net Value Added (FNVA) Farm net income (FNI)
Remuneration of Family Labour (RFL) Gross margin with coupled payments
Net margin with coupled payments Net economic margin with coupled payments
Source: EU FADN DG AGRI, model of the allocation of costs for milk. 115

EU Dairy farms report 2012 Annex II LT
Lithuania Milk specialised farms
e: estimate*: trend between the average of the first three available years and the average of the last available three yearsSTRUCTURAL INFORMATION
2004 2005 2006 2007 2008 2009 2010e 2011e
Three years
average trend*
Trend 2011 /2007
Sample farms 213 202 226 181 202 198 -9%Farms represented 4 475 6 088 12 991 9 306 10 344 8 108 18%% production from specialised farms 41% 59% 71% 56% 68% 63% 5%Forage area - ha 29 28 27 28 30 31 6%Dairy cows - LU 12 13 13 14 16 18 23%Rented UAA - % 60% 61% 55% 52% 55% 55% -5%Total labour - AWU 1,85 2,17 1,95 1,88 1,96 2,02 -2%Family labour - % 95% 79% 89% 87% 81% 80% -5%Milk per ha fodder area - t/ha 2,2 2,4 2,5 2,6 2,8 3,1 19%Milk yield - kg/cow 5 046 5 122 5 186 5 263 5 207 5 344 5 394 5 713 7% 9%Milk production - t 63 67 66 72 82 96 97 103 50% 43%
MILK MARGINS in EUR/t of milk (nominal)
2004 2005 2006 2007 2008 2009 2010e 2011e
Three years
average trend*
Trend 2011 /2007
RevenuesPrice 189 216 210 249 252 191 263 302 23% 22%EU coupled payments (incl. Art.69) 0 0 0 0 0 0 0 0 - -National aids 8 11 12 0 0 0 0 0 - -Total revenues from milk 197 227 222 249 252 191 263 302 17% 22%Production costs Feed 44 52 54 52 64 56 56 62 16% 18%
homegrown feed 32 40 34 30 37 34 35 38 1% 29%puchased feed 12 13 20 23 27 21 22 24 51% 5%
Herd renewal purchases 2 2 3 3 4 1 1 1 -72% -75%Milk levy 0 0 0 0 0 0 0 0 - -Other specific costs 4 5 5 7 8 8 9 9 83% 35%Specific costs 51 59 62 62 75 65 66 72 18% 15%Machinery and building upkeep 7 11 11 12 13 11 11 12 17% 2%Energy (fuel, electricity) 17 21 21 20 26 20 23 26 16% 29%Contract work 2 2 2 4 2 1 1 1 -34% -61%Taxes 0 0 0 0 0 2 2 2 4529% 5855%Other direct inputs 7 9 12 14 15 13 14 16 53% 15%Non specific costs 33 44 46 50 55 47 50 58 26% 15%Total operating costs 84 103 108 112 130 112 116 129 21% 15%Gross margin 106 113 102 136 122 80 147 173 24% 27%Gross margin with coupled payments 114 124 114 136 122 80 147 173 13% 27%
%spe.farms with positive gross margin 100% 99% 96% 100% 95% 95% 99% 99% -1% -1%
%milk production with positive gross margin 100% 100% 99% 100% 99% 98% 100% 100% 0% 0%
Depreciation 17 22 29 29 37 41 56%Wages 2 11 6 9 17 11 90%Rent 3 5 5 4 4 4 0%Interest 1 2 5 6 8 8 180%External factors 6 18 15 19 29 23 80%Net margin 83 73 58 89 56 17 -25%
Net margin with coupled payments 91 84 70 89 56 17 -34%
Family labour costs 52 52 64 69 79 60 24%Own capital unpaid cost 11 5 4 1 0 44 134%Imputed family factors 63 57 67 71 79 104 36%Net economic margin 20 16 -9 18 -24 -88 -452%Net economic margin with coupled payments 28 27 3 18 -24 -88 -262%
%spe.farms with positive net economic margin 41% 41% 22% 36% 21% 3% -14%
%milk production with positive net economic margin 62% 63% 49% 68% 55% 10% -14%
Source: EU FADN DG AGRI, model of the allocation of costs for milk. 116

EU Dairy farms report 2012 Annex II LT
Lithuania Milk specialised farmsINCOME in EUR/AWU (nominal)
2004 2005 2006 2007 2008 2009
Three years
average trend*
Total output 11 506 12 224 11 553 15 708 17 867 16 602 42%Intermediate consumptions 6 113 6 896 7 164 8 123 10 686 10 898 47%Balance subsidies and taxes 2 373 2 541 2 994 3 084 3 811 3 992 38%
Decoupled payments 726 823 1 005 1 127 1 526 1 870 77%Depreciation 857 1 161 1 405 1 659 2 281 2 912 100%Farm Net Value Added (FNVA) 6 909 6 709 5 978 9 011 8 711 6 785 -68%
External factors 332 953 738 1 032 1 879 1 642 125%Wages 109 619 298 480 1 125 783 133%
Rent 152 241 236 227 287 268 24%Interest 70 94 204 324 467 591 276%
Balance invest. subs. and taxes 172 764 2 227 739 1 048 2 528 36%Farm net income (FNI) 6 749 6 520 7 466 8 719 7 879 7 671 17%
Family farms only in EUR/FWU (nominal)Own capital unpaid cost 625 306 209 79 4 3 989 257%Remuneration of Family Labour (RFL) 6 525 7 671 8 175 9 665 9 718 5 910 13%
%spe.farms with positive RFL 100% 100% 100% 100% 95% 79% -9%
Milk specialised farms - gross margin
114 124 114136
122
80
147173
0
50
100
150
200
250
300
350
Rev
enue
s
Ope
ratin
g
Rev
enue
s
Ope
ratin
g
Rev
enue
s
Ope
ratin
g
Rev
enue
s
Ope
ratin
g
Rev
enue
s
Ope
ratin
g
Rev
enue
s
Ope
ratin
g
Rev
enue
s
Ope
ratin
g
Rev
enue
s
Ope
ratin
g
2004 2005 2006 2007 2008 2009 2010e 2011e
EUR/t
Price EU coupled payments (incl. Art.69)National aids FeedOther specific costs Non specific costsGross margin with coupled payments
Milk specialised farms - net margin
197
227 222
249 252
191
107143 152 160
196175
9184
70
89
56
17
0
50
100
150
200
250
300
2004 2005 2006 2007 2008 2009
EUR/t
0
10
20
30
40
50
60
70
80
90
100
Total revenues from milkOperating costs + depreciation + external factorsNet margin with coupled payments
Source: EU FADN DG AGRI, model of the allocation of costs for milk. 117

EU Dairy farms report 2012 Annex II LT
Lithuania Milk specialised farms
Milk specialised farms - net economic margin
197
227 222
249 252
191170
200220
231
276 27928 27
3
18
-24
-88
0
50
100
150
200
250
300
2004 2005 2006 2007 2008 2009
EUR/t
-100
-80
-60
-40
-20
0
20
40
Total revenues from milkTotal costsNet economic margin with coupled payments
Milk specialised farms - non-operating costs
17 22 29 29 37 41
52
5264
69
7960
11
5
41
0 44
0
20
40
60
80
100
120
140
160
180
2004 2005 2006 2007 2008 2009
EUR/t Depreciation Wages Rent Interest Family labour costs Own capital unpaid cost
Milk specialised farms - income per work unit and margins per tonne
0
2 000
4 000
6 000
8 000
10 000
12 000
2004 2005 2006 2007 2008 2009
EUR/WU
-100
-50
0
50
100
150EUR/t of milk
Farm Net Value Added (FNVA) Farm net income (FNI)
Remuneration of Family Labour (RFL) Gross margin with coupled payments
Net margin with coupled payments Net economic margin with coupled payments
Source: EU FADN DG AGRI, model of the allocation of costs for milk. 118

EU Dairy farms report 2012 Annex II LV
Latvia Milk specialised farms
e: estimate*: trend between the average of the first three available years and the average of the last available three yearsSTRUCTURAL INFORMATION
2004 2005 2006 2007 2008 2009 2010e 2011e
Three years
average trend*
Trend 2011 /2007
Sample farms 198 279 319 323 342 321 24%Farms represented 4 231 4 883 7 498 6 610 7 477 5 919 20%% production from specialised farms 69% 75% 83% 71% 76% 74% -2%Forage area - ha 48 44 40 42 40 43 -5%Dairy cows - LU 18 17 15 14 14 16 -11%Rented UAA - % 46% 42% 42% 39% 36% 41% -4%Total labour - AWU 2,55 2,55 2,44 2,24 1,97 2,07 -17%Family labour - % 62% 63% 66% 72% 70% 69% 6%Milk per ha fodder area - t/ha 1,9 1,9 2,0 1,8 1,9 2,1 -1%Milk yield - kg/cow 4 928 5 079 5 221 5 270 5 393 5 435 5 499 5 571 8% 6%Milk production - t 91 84 79 76 75 89 90 91 6% 20%
MILK MARGINS in EUR/t of milk (nominal)
2004 2005 2006 2007 2008 2009 2010e 2011e
Three years
average trend*
Trend 2011 /2007
RevenuesPrice 198 230 236 269 266 184 248 290 9% 8%EU coupled payments (incl. Art.69) 0 0 0 0 0 0 0 0 - -National aids 28 18 33 9 11 30 30 30 14% 239%Total revenues from milk 225 249 269 277 277 215 278 320 9% 15%Production costs Feed 62 69 77 89 90 69 66 88 8% -1%
homegrown feed 39 42 43 45 42 37 35 46 -5% 2%puchased feed 23 27 34 44 47 33 32 42 28% -3%
Herd renewal purchases 1 6 5 4 5 1 1 1 -69% -70%Milk levy 0 0 0 0 0 0 0 0 - -Other specific costs 13 13 14 16 17 15 15 15 16% -5%Specific costs 75 88 95 109 111 86 83 105 6% -4%Machinery and building upkeep 16 22 22 24 25 19 17 18 -9% -24%Energy (fuel, electricity) 27 32 32 34 41 34 38 43 26% 26%Contract work 5 5 6 7 8 6 5 5 5% -23%Taxes 0 0 0 0 0 0 0 0 24% -12%Other direct inputs 20 10 12 15 16 14 12 13 -8% -18%Non specific costs 68 69 72 81 90 73 73 80 8% -2%Total operating costs 144 157 167 190 201 159 155 184 7% -3%Gross margin 54 73 68 78 66 25 92 106 14% 35%Gross margin with coupled payments 81 92 102 87 77 55 122 135 14% 55%
%spe.farms with positive gross margin 95% 95% 93% 79% 82% 80% 97% 96% -3% 16%
%milk production with positive gross margin 97% 96% 97% 93% 90% 90% 98% 97% -2% 3%
Depreciation 18 28 36 45 49 46 72%Wages 18 20 24 23 28 24 22%Rent 2 1 2 2 2 2 18%Interest 3 5 6 10 11 8 101%External factors 22 26 32 34 41 34 36%Net margin 13 20 0 -1 -24 -56 -346%
Net margin with coupled payments 41 38 34 8 -13 -25 -128%
Family labour costs 34 44 58 74 85 71 70%Own capital unpaid cost 0 0 0 0 0 30 4832%Imputed family factors 34 44 58 74 85 101 91%Net economic margin -21 -24 -58 -76 -109 -157 -231%Net economic margin with coupled payments 6 -6 -25 -67 -98 -126 -1102%
%spe.farms with positive net economic margin 19% 30% 10% 7% 5% - -
%milk production with positive net economic margin 36% 45% 26% 25% 18% - -
Source: EU FADN DG AGRI, model of the allocation of costs for milk. 119

EU Dairy farms report 2012 Annex II LV
Latvia Milk specialised farmsINCOME in EUR/AWU (nominal)
2004 2005 2006 2007 2008 2009
Three years
average trend*
Total output 12 093 12 713 12 801 14 514 15 807 14 005 18%Intermediate consumptions 9 373 9 351 9 824 10 903 12 468 12 373 25%Balance subsidies and taxes 3 657 3 242 5 314 4 736 5 627 6 589 39%
Decoupled payments 459 536 604 752 1 072 1 338 98%Depreciation 964 1 344 1 646 2 166 2 579 2 817 91%Farm Net Value Added (FNVA) 5 412 5 260 6 645 6 181 6 388 5 404 -60%
External factors 1 150 1 273 1 520 1 647 2 182 2 100 50%Wages 901 978 1 166 1 114 1 522 1 482 35%
Rent 87 75 80 77 107 134 31%Interest 162 220 275 457 554 485 128%
Balance invest. subs. and taxes 429 1 164 909 1 466 963 393 13%Farm net income (FNI) 4 691 5 151 6 033 5 999 5 169 3 696 -6%
Family farms only in EUR/FWU (nominal)Own capital unpaid cost 30 5 16 8 5 2 657 5174%Remuneration of Family Labour (RFL) 6 156 6 933 7 883 7 573 7 114 2 666 -17%
%spe.farms with positive RFL 98% 97% 99% 96% 97% 66% -12%
Milk specialised farms - gross margin
81 92102 87
7755
122
135
0
50
100
150
200
250
300
350
Rev
enue
s
Ope
ratin
g
Rev
enue
s
Ope
ratin
g
Rev
enue
s
Ope
ratin
g
Rev
enue
s
Ope
ratin
g
Rev
enue
s
Ope
ratin
g
Rev
enue
s
Ope
ratin
g
Rev
enue
s
Ope
ratin
g
Rev
enue
s
Ope
ratin
g
2004 2005 2006 2007 2008 2009 2010e 2011e
EUR/t
Price EU coupled payments (incl. Art.69)National aids FeedOther specific costs Non specific costsGross margin with coupled payments
Milk specialised farms - net margin
225249
269 277 277
215
185211
235270 290
240
4138
34
8
-13
-250
50
100
150
200
250
300
350
2004 2005 2006 2007 2008 2009
EUR/t
-30
-20
-10
0
10
20
30
40
50
Total revenues from milkOperating costs + depreciation + external factorsNet margin with coupled payments
Source: EU FADN DG AGRI, model of the allocation of costs for milk. 120

EU Dairy farms report 2012 Annex II LV
Latvia Milk specialised farms
Milk specialised farms - net economic margin
225249
269 277 277
215
219
255
293
344
375
3416
-6
-25
-67
-98
-126
0
50
100
150
200
250
300
350
400
2004 2005 2006 2007 2008 2009
EUR/t
-140
-120
-100
-80
-60
-40
-20
0
20
Total revenues from milkTotal costsNet economic margin with coupled payments
Milk specialised farms - non-operating costs
18 28 36 45 49 46
34
44
58
7485
71
0
0
0
0
030
0
20
40
60
80
100
120
140
160
180
200
2004 2005 2006 2007 2008 2009
EUR/t Depreciation Wages Rent Interest Family labour costs Own capital unpaid cost
Milk specialised farms - income per work unit and margins per tonne
0
1 000
2 000
3 000
4 000
5 000
6 000
7 000
8 000
9 000
2004 2005 2006 2007 2008 2009
EUR/WU
-150
-100
-50
0
50
100
150EUR/t of milk
Farm Net Value Added (FNVA) Farm net income (FNI)
Remuneration of Family Labour (RFL) Gross margin with coupled payments
Net margin with coupled payments Net economic margin with coupled payments
Source: EU FADN DG AGRI, model of the allocation of costs for milk. 121

EU Dairy farms report 2012 Annex II MT
Malta Milk specialised farms
e: estimate*: trend between the average of the first three available years and the average of the last available three yearsSTRUCTURAL INFORMATION
2004 2005 2006 2007 2008 2009 2010e 2011e
Three years
average trend*
Trend 2011 /2007
Sample farms 37 42 55 51 49 52 13%Farms represented 84 98 103 96 84 95 -4%% production from specialised farms 97% 99% 97% 99% 94% 100% 1%Forage area - ha 4 4 4 6 6 6 36%Dairy cows - LU 59 65 62 63 68 68 6%Rented UAA - % 90% 82% 86% 86% 85% 84% -1%Total labour - AWU 2,13 2,31 2,30 2,61 2,66 2,56 16%Family labour - % 94% 93% 93% 92% 89% 86% -5%Milk per ha fodder area - t/ha 57,5 67,1 64,9 54,6 56,8 59,6 -10%Milk yield - kg/cow 5 214 5 326 5 544 5 822 5 691 5 457 5 457 5 457 2% -6%Milk production - t 310 346 346 368 386 369 369 369 10% 0%
MILK MARGINS in EUR/t of milk (nominal)
2004 2005 2006 2007 2008 2009 2010e 2011e
Three years
average trend*
Trend 2011 /2007
RevenuesPrice 354 332 333 360 452 435 540 603 55% 68%EU coupled payments (incl. Art.69) 3 7 12 0 0 0 0 0 - -National aids 0 32 40 34 19 17 17 17 - -49%Total revenues from milk 354 371 385 393 471 452 557 620 47% 58%Production costs Feed 210 223 220 247 276 285 290 351 42% 42%
homegrown feed 3 3 2 4 4 5 6 6 122% 39%puchased feed 207 220 218 242 272 280 284 345 41% 42%
Herd renewal purchases 2 5 10 6 2 0 0 0 -95% -95%Milk levy 0 0 0 0 0 0 0 0 - -Other specific costs 7 6 10 12 17 13 14 15 83% 25%Specific costs 219 234 240 264 295 299 304 366 40% 39%Machinery and building upkeep 10 11 11 12 19 19 19 20 79% 56%Energy (fuel, electricity) 18 19 19 26 28 31 35 41 94% 59%Contract work 2 2 2 2 2 2 2 2 17% 26%Taxes 0 0 0 0 0 0 0 0 -52% 76%Other direct inputs 7 6 8 4 5 5 5 5 -27% 18%Non specific costs 37 39 39 44 54 57 62 68 63% 53%Total operating costs 256 272 279 309 349 356 366 434 43% 41%Gross margin 98 59 54 51 103 79 174 169 100% 230%Gross margin with coupled payments 98 98 106 85 122 96 191 186 56% 119%
%spe.farms with positive gross margin 94% 93% 92% 90% 96% 77% 91% 84% -9% -7%
%milk production with positive gross margin 98% 96% 98% 92% 96% 84% 96% 91% -7% -1%
Depreciation 13 11 12 16 18 20 44%Wages 4 4 4 6 9 11 136%Rent 4 8 2 1 1 1 -75%Interest 2 2 1 5 4 7 242%External factors 9 14 7 12 14 19 49%Net margin 75 34 35 24 71 40 -6%
Net margin with coupled payments 75 73 87 58 90 57 -13%
Family labour costs 58 54 61 64 73 70 20%Own capital unpaid cost 16 16 15 38 1 27 43%Imputed family factors 74 70 75 103 74 97 25%Net economic margin 1 -36 -41 -79 -3 -58 -84%Net economic margin with coupled payments 1 3 11 -45 16 -41 -554%
%spe.farms with positive net economic margin 47% - - - 33% - -
%milk production with positive net economic margin 55% - - - 53% - -
Source: EU FADN DG AGRI, model of the allocation of costs for milk. 122

EU Dairy farms report 2012 Annex II MT
Malta Milk specialised farmsINCOME in EUR/AWU (nominal)
2004 2005 2006 2007 2008 2009
Three years
average trend*
Total output 67 537 66 297 67 857 66 102 81 906 78 945 13%Intermediate consumptions 50 703 56 765 56 785 59 595 70 203 68 758 21%Balance subsidies and taxes 6 742 11 256 11 439 18 023 15 532 10 320 49%
Decoupled payments 0 0 0 3 102 4 213 6 344 -Depreciation 2 514 2 301 2 420 2 722 3 018 3 472 27%Farm Net Value Added (FNVA) 21 061 18 487 20 091 21 808 24 217 17 035 13%
External factors 1 819 2 538 1 450 1 944 2 396 3 176 29%Wages 736 742 735 972 1 492 1 796 93%
Rent 768 1 446 453 214 207 204 -77%Interest 314 349 262 757 697 1 175 184%
Balance invest. subs. and taxes 0 0 0 0 1 717 0 -Farm net income (FNI) 19 242 15 950 18 641 19 865 23 537 13 859 6%
Family farms only in EUR/FWU (nominal)Own capital unpaid cost 3 388 3 381 3 085 7 359 240 5 554 33%Remuneration of Family Labour (RFL) 16 354 13 318 16 432 14 426 25 214 11 044 10%
%spe.farms with positive RFL 92% 71% 80% 79% 85% 64% -5%
Milk specialised farms - gross margin
98 98 106 85122 96
191
186
0
100
200
300
400
500
600
700
Rev
enue
s
Ope
ratin
g
Rev
enue
s
Ope
ratin
g
Rev
enue
s
Ope
ratin
g
Rev
enue
s
Ope
ratin
g
Rev
enue
s
Ope
ratin
g
Rev
enue
s
Ope
ratin
g
Rev
enue
s
Ope
ratin
g
Rev
enue
s
Ope
ratin
g
2004 2005 2006 2007 2008 2009 2010e 2011e
EUR/t
Price EU coupled payments (incl. Art.69)National aids FeedOther specific costs Non specific costsGross margin with coupled payments
Milk specialised farms - net margin
354371 385 393
471452
279 297 298336
381 395
75 73
87
58
90
57
0
50
100
150
200
250
300
350
400
450
500
2004 2005 2006 2007 2008 2009
EUR/t
0
10
20
30
40
50
60
70
80
90
100
Total revenues from milkOperating costs + depreciation + external factorsNet margin with coupled payments
Source: EU FADN DG AGRI, model of the allocation of costs for milk. 123

EU Dairy farms report 2012 Annex II MT
Malta Milk specialised farms
Milk specialised farms - net economic margin
354 371 385 393
471452
353 367 373
438 455493
13
11
-45
16
-41
0
100
200
300
400
500
600
2004 2005 2006 2007 2008 2009
EUR/t
-50
-40
-30
-20
-10
0
10
20
Total revenues from milkTotal costsNet economic margin with coupled payments
Milk specialised farms - non-operating costs
13 11 12 16 18 20
58 54 6164
7370
16 16 15
381
27
0
20
40
60
80
100
120
140
160
2004 2005 2006 2007 2008 2009
EUR/t Depreciation Wages Rent Interest Family labour costs Own capital unpaid cost
Milk specialised farms - income per work unit and margins per tonne
0
5 000
10 000
15 000
20 000
25 000
30 000
2004 2005 2006 2007 2008 2009
EUR/WU
-60
-40
-20
0
20
40
60
80
100
120
140EUR/t of milk
Farm Net Value Added (FNVA) Farm net income (FNI)
Remuneration of Family Labour (RFL) Gross margin with coupled payments
Net margin with coupled payments Net economic margin with coupled payments
Source: EU FADN DG AGRI, model of the allocation of costs for milk. 124

EU Dairy farms report 2012 Annex II PL
Poland Milk specialised farms
e: estimate*: trend between the average of the first three available years and the average of the last available three yearsSTRUCTURAL INFORMATION
2004 2005 2006 2007 2008 2009 2010e 2011e
Three years
average trend*
Trend 2011 /2007
Sample farms 1 465 1 950 1 866 1 798 2 105 2 206 16%Farms represented 67 806 88 430 80 549 71 629 80 362 83 850 0%% production from specialised farms 60% 70% 68% 63% 66% 68% 0%Forage area - ha 9 12 14 14 13 13 12%Dairy cows - LU 16 14 16 16 16 15 2%Rented UAA - % 28% 31% 33% 28% 30% 29% -2%Total labour - AWU 1,85 1,86 1,92 1,88 1,88 1,87 0%Family labour - % 96% 94% 92% 95% 94% 95% 1%Milk per ha fodder area - t/ha 8,2 6,0 6,2 6,2 6,4 6,2 -7%Milk yield - kg/cow 4 968 5 165 5 362 5 304 5 345 5 340 5 384 5 747 6% 8%Milk production - t 77 75 85 86 85 80 81 86 4% 0%
MILK MARGINS in EUR/t of milk (nominal)
2004 2005 2006 2007 2008 2009 2010e 2011e
Three years
average trend*
Trend 2011 /2007
RevenuesPrice 202 234 246 284 293 207 256 276 8% -3%EU coupled payments (incl. Art.69) 0 0 0 0 0 0 0 0 - -National aids 0 0 0 0 0 0 0 0 - -Total revenues from milk 202 234 246 284 293 207 256 276 8% -3%Production costs Feed 56 63 69 85 97 68 66 76 11% -11%
homegrown feed 34 39 40 49 56 41 39 44 10% -10%puchased feed 23 23 29 36 40 27 27 31 14% -14%
Herd renewal purchases 4 4 3 3 3 2 2 2 -37% -34%Milk levy 0 0 0 0 0 0 0 0 - -Other specific costs 8 9 13 12 14 11 11 10 2% -14%Specific costs 68 76 85 101 114 80 79 88 8% -12%Machinery and building upkeep 8 11 13 14 15 13 13 13 21% -8%Energy (fuel, electricity) 13 17 18 18 23 19 20 20 22% 14%Contract work 5 5 5 5 7 6 6 7 31% 31%Taxes 0 0 0 0 0 0 0 0 -2% 28%Other direct inputs 5 8 8 8 10 8 9 9 22% 15%Non specific costs 31 42 44 45 56 47 48 49 23% 9%Total operating costs 100 118 129 146 170 127 127 137 13% -6%Gross margin 103 117 117 139 123 80 129 138 3% 0%Gross margin with coupled payments 103 117 117 139 123 80 129 138 3% 0%
%spe.farms with positive gross margin 100% 97% 99% 99% 93% 89% 95% 95% -5% -4%
%milk production with positive gross margin 100% 99% 100% 100% 98% 97% 99% 99% -1% -1%
Depreciation 27 32 32 35 44 40 29%Wages 2 5 7 4 7 5 11%Rent 1 2 2 2 3 2 61%Interest 2 2 2 3 4 3 39%External factors 5 9 11 9 13 10 28%Net margin 70 76 73 95 66 30 -12%
Net margin with coupled payments 70 76 73 95 66 30 -12%
Family labour costs 39 50 46 56 77 71 51%Own capital unpaid cost 21 24 30 25 20 20 -11%Imputed family factors 59 73 77 81 97 91 29%Net economic margin 10 3 -4 14 -31 -61 -932%Net economic margin with coupled payments 10 3 -4 14 -31 -61 -932%
%spe.farms with positive net economic margin 39% 34% 32% 39% 22% 10% -11%
%milk production with positive net economic margin 64% 59% 55% 66% 46% 27% -13%
Source: EU FADN DG AGRI, model of the allocation of costs for milk. 125

EU Dairy farms report 2012 Annex II PL
Poland Milk specialised farmsINCOME in EUR/AWU (nominal)
2004 2005 2006 2007 2008 2009
Three years
average trend*
Total output 11 988 13 436 16 017 18 981 19 181 13 041 24%Intermediate consumptions 6 112 6 818 8 457 9 371 11 298 8 564 37%Balance subsidies and taxes 1 304 1 388 2 553 2 498 2 923 2 941 59%
Decoupled payments 434 635 876 934 1 170 1 387 80%Depreciation 1 698 1 883 2 131 2 347 2 864 2 415 33%Farm Net Value Added (FNVA) 5 482 6 123 7 982 9 761 7 942 5 003 13%
External factors 329 544 776 601 863 638 28%Wages 120 317 504 260 447 300 7%
Rent 67 99 122 152 187 146 68%Interest 142 129 149 189 229 193 45%
Balance invest. subs. and taxes -146 -263 -438 -185 -14 3 77%Farm net income (FNI) 5 007 5 316 6 768 8 975 7 064 4 368 19%
Family farms only in EUR/FWU (nominal)Own capital unpaid cost 1 345 1 462 2 163 1 817 1 434 1 292 -9%Remuneration of Family Labour (RFL) 3 853 4 174 5 216 7 579 6 042 3 357 28%
%spe.farms with positive RFL 86% 86% 89% 94% 88% 80% 0%
Milk specialised farms - gross margin
103 117 117139
123
80
129
138
0
50
100
150
200
250
300
350
Rev
enue
s
Ope
ratin
g
Rev
enue
s
Ope
ratin
g
Rev
enue
s
Ope
ratin
g
Rev
enue
s
Ope
ratin
g
Rev
enue
s
Ope
ratin
g
Rev
enue
s
Ope
ratin
g
Rev
enue
s
Ope
ratin
g
Rev
enue
s
Ope
ratin
g
2004 2005 2006 2007 2008 2009 2010e 2011e
EUR/t
Price EU coupled payments (incl. Art.69)National aids FeedOther specific costs Non specific costsGross margin with coupled payments
Milk specialised farms - net margin
202
234246
284 293
207
132159 173 189
227177
7076 73
95
66
30
0
50
100
150
200
250
300
350
2004 2005 2006 2007 2008 2009
EUR/t
0
10
20
30
40
50
60
70
80
90
100
Total revenues from milkOperating costs + depreciation + external factorsNet margin with coupled payments
Source: EU FADN DG AGRI, model of the allocation of costs for milk. 126

EU Dairy farms report 2012 Annex II PL
Poland Milk specialised farms
Milk specialised farms - net economic margin
202
234246
284 293
207192
232250
270
324
268
10
3-4
14
-31
-61
0
50
100
150
200
250
300
350
2004 2005 2006 2007 2008 2009
EUR/t
-70
-60
-50
-40
-30
-20
-10
0
10
20
Total revenues from milkTotal costsNet economic margin with coupled payments
Milk specialised farms - non-operating costs
27 32 32 35 44 40
3950 46 56
777121
24 3025
2020
0
20
40
60
80
100
120
140
160
180
2004 2005 2006 2007 2008 2009
EUR/t Depreciation Wages Rent Interest Family labour costs Own capital unpaid cost
Milk specialised farms - income per work unit and margins per tonne
0
2 000
4 000
6 000
8 000
10 000
12 000
2004 2005 2006 2007 2008 2009
EUR/WU
-100
-50
0
50
100
150EUR/t of milk
Farm Net Value Added (FNVA) Farm net income (FNI)
Remuneration of Family Labour (RFL) Gross margin with coupled payments
Net margin with coupled payments Net economic margin with coupled payments
Source: EU FADN DG AGRI, model of the allocation of costs for milk. 127

EU Dairy farms report 2012 Annex II SK
Slovakia Milk specialised farms
e: estimate*: trend between the average of the first three available years and the average of the last available three yearsSTRUCTURAL INFORMATION
2004 2005 2006 2007 2008 2009 2010e 2011e
Three years
average trend*
Trend 2011 /2007
Sample farms 42 33 60 33 39 28 -26%Farms represented 266 183 269 139 194 131 -35%% production from specialised farms 24% 18% 29% 19% 23% 22% -2%Forage area - ha 397 383 602 699 643 618 42%Dairy cows - LU 142 128 157 190 168 207 32%Rented UAA - % 98% 97% 99% 99% 99% 98% 1%Total labour - AWU 21,65 17,71 25,33 26,86 26,47 28,71 27%Family labour - % 4% 7% 4% 2% 4% 4% -1%Milk per ha fodder area - t/ha 1,8 2,1 1,5 1,5 1,4 1,8 -13%Milk yield - kg/cow 5 400 6 296 5 608 5 779 5 642 5 877 5 730 5 995 2% 4%Milk production - t 768 804 882 1 096 946 1 215 1 185 1 239 48% 13%
MILK MARGINS in EUR/t of milk (nominal)
2004 2005 2006 2007 2008 2009 2010e 2011e
Three years
average trend*
Trend 2011 /2007
RevenuesPrice 236 251 260 302 311 233 303 352 19% 16%EU coupled payments (incl. Art.69) 0 0 0 0 0 0 0 0 - -National aids 0 0 0 0 0 0 0 0 - -Total revenues from milk 236 251 260 302 311 233 303 352 19% 16%Production costs Feed 70 75 91 109 136 112 109 119 43% 9%
homegrown feed 27 32 45 44 57 52 50 54 48% 21%puchased feed 43 43 46 64 79 59 59 65 39% 1%
Herd renewal purchases 1 1 5 1 2 4 4 4 80% 315%Milk levy 0 0 0 0 0 0 0 0 - -Other specific costs 43 28 20 18 20 31 32 31 2% 75%Specific costs 114 104 116 127 157 146 145 154 33% 21%Machinery and building upkeep 11 20 24 15 19 29 30 29 61% 98%Energy (fuel, electricity) 32 33 45 41 49 52 59 68 63% 65%Contract work 13 24 20 17 16 26 26 25 36% 46%Taxes 1 1 1 1 2 1 1 1 3% -14%Other direct inputs 16 15 36 17 48 59 60 58 168% 239%Non specific costs 73 93 126 92 135 167 177 182 80% 98%Total operating costs 187 197 242 219 292 314 321 335 55% 53%Gross margin 49 54 18 83 19 -81 -19 16 -168% -80%Gross margin with coupled payments 49 54 18 83 19 -81 -19 16 -168% -80%
%spe.farms with positive gross margin 70% 87% 79% 90% 60% - 55% 62% - -28%
%milk production with positive gross margin 76% 86% 73% 93% 63% - 44% 61% - -32%
Depreciation 69 50 151 135 61 84 4%Wages 53 62 105 102 130 127 64%Rent 9 12 14 7 10 10 -21%Interest 6 3 7 6 9 16 103%External factors 68 77 125 116 149 154 55%Net margin -88 -73 -258 -167 -190 -318 -61%
Net margin with coupled payments -88 -73 -258 -167 -190 -318 -61%
Family labour costs 3 5 5 3 5 6 6%Own capital unpaid cost 0 6 1 23 2 5 359%Imputed family factors 3 11 5 26 7 11 125%Net economic margin -91 -84 -264 -193 -197 -330 -64%Net economic margin with coupled payments -91 -84 -264 -193 -197 -330 -64%
%spe.farms with positive net economic margin - - - - - - -
%milk production with positive net economic margin - - - - - - -
Source: EU FADN DG AGRI, model of the allocation of costs for milk. 128

EU Dairy farms report 2012 Annex II SK
Slovakia Milk specialised farmsINCOME in EUR/AWU (nominal)
2004 2005 2006 2007 2008 2009
Three years
average trend*
Total output 13 812 19 392 16 690 23 353 20 105 18 898 25%Intermediate consumptions 11 279 15 023 16 403 18 437 19 676 26 454 51%Balance subsidies and taxes 2 284 5 031 6 316 9 380 9 665 11 474 124%
Decoupled payments 1 032 1 548 1 934 2 327 2 501 3 729 90%Depreciation 4 001 3 804 8 360 9 163 3 594 6 151 17%Farm Net Value Added (FNVA) 817 5 596 -1 758 5 133 6 500 -2 234 81%
External factors 3 823 5 814 6 895 7 934 8 891 11 147 69%Wages 3 035 4 689 5 805 7 014 7 802 9 124 77%
Rent 482 870 724 472 575 752 -13%Interest 306 254 366 449 514 1 271 141%
Balance invest. subs. and taxes 0 0 217 327 445 706 -Farm net income (FNI) -3 006 -218 -8 436 -2 474 -1 946 -12 674 -47%
Family farms only in EUR/FWU (nominal)Own capital unpaid cost 4 6 959 837 69 534 2 016 8 095 921%Remuneration of Family Labour (RFL) 4 360 3 589 118 -22 955 3 889 768 -327%
%spe.farms with positive RFL 60% 71% 41% - - - -
Milk specialised farms - gross margin
49 5418
83
19
-81
-19
16
-150
-100
-50
0
50
100
150
200
250
300
350
400
Rev
enue
s
Ope
ratin
g
Rev
enue
s
Ope
ratin
g
Rev
enue
s
Ope
ratin
g
Rev
enue
s
Ope
ratin
g
Rev
enue
s
Ope
ratin
g
Rev
enue
s
Ope
ratin
g
Rev
enue
s
Ope
ratin
g
Rev
enue
s
Ope
ratin
g
2004 2005 2006 2007 2008 2009 2010e 2011e
EUR/t
Price EU coupled payments (incl. Art.69)National aids FeedOther specific costs Non specific costsGross margin with coupled payments
Milk specialised farms - net margin
236 251 260302 311
233324 324
519470 502
551
-88-73
-258
-167-190
-318
0
100
200
300
400
500
600
2004 2005 2006 2007 2008 2009
EUR/t
-350
-300
-250
-200
-150
-100
-50
0
Total revenues from milkOperating costs + depreciation + external factorsNet margin with coupled payments
Source: EU FADN DG AGRI, model of the allocation of costs for milk. 129

EU Dairy farms report 2012 Annex II SK
Slovakia Milk specialised farms
Milk specialised farms - net economic margin
236 251 260302 311
233
327 335
524496 508
563
-91 -84
-264
-193 -197
-3300
100
200
300
400
500
600
2004 2005 2006 2007 2008 2009
EUR/t
-350
-300
-250
-200
-150
-100
-50
0
Total revenues from milkTotal costsNet economic margin with coupled payments
Milk specialised farms - non-operating costs
6950
151 135
6184
3 5
5
3
5
6
0 6
123
2
5
0
50
100
150
200
250
300
2004 2005 2006 2007 2008 2009
EUR/t Depreciation Wages Rent Interest Family labour costs Own capital unpaid cost
Milk specialised farms - income per work unit and margins per tonne
-25 000
-20 000
-15 000
-10 000
-5 000
0
5 000
10 000
2004 2005 2006 2007 2008 2009
EUR/WU
-400
-350
-300
-250
-200
-150
-100
-50
0
50
100
150EUR/t of milk
Farm Net Value Added (FNVA) Farm net income (FNI)
Remuneration of Family Labour (RFL) Gross margin with coupled payments
Net margin with coupled payments Net economic margin with coupled payments
Source: EU FADN DG AGRI, model of the allocation of costs for milk. 130
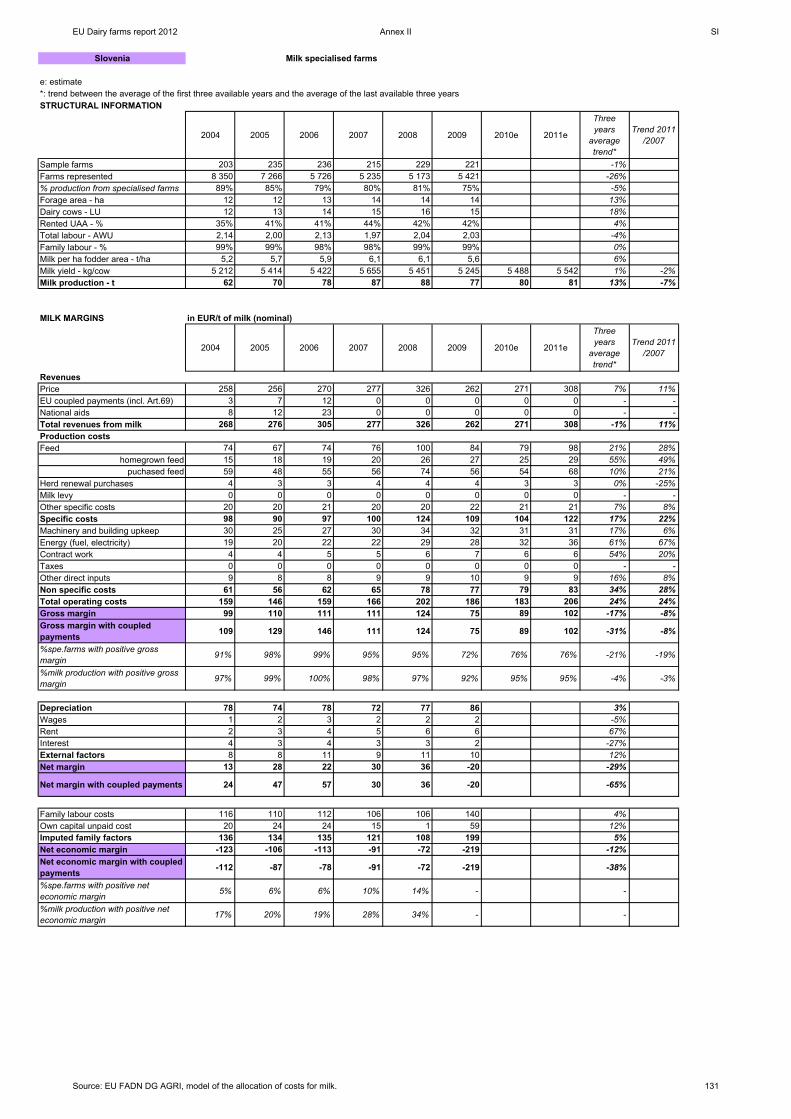
EU Dairy farms report 2012 Annex II SI
Slovenia Milk specialised farms
e: estimate*: trend between the average of the first three available years and the average of the last available three yearsSTRUCTURAL INFORMATION
2004 2005 2006 2007 2008 2009 2010e 2011e
Three years
average trend*
Trend 2011 /2007
Sample farms 203 235 236 215 229 221 -1%Farms represented 8 350 7 266 5 726 5 235 5 173 5 421 -26%% production from specialised farms 89% 85% 79% 80% 81% 75% -5%Forage area - ha 12 12 13 14 14 14 13%Dairy cows - LU 12 13 14 15 16 15 18%Rented UAA - % 35% 41% 41% 44% 42% 42% 4%Total labour - AWU 2,14 2,00 2,13 1,97 2,04 2,03 -4%Family labour - % 99% 99% 98% 98% 99% 99% 0%Milk per ha fodder area - t/ha 5,2 5,7 5,9 6,1 6,1 5,6 6%Milk yield - kg/cow 5 212 5 414 5 422 5 655 5 451 5 245 5 488 5 542 1% -2%Milk production - t 62 70 78 87 88 77 80 81 13% -7%
MILK MARGINS in EUR/t of milk (nominal)
2004 2005 2006 2007 2008 2009 2010e 2011e
Three years
average trend*
Trend 2011 /2007
RevenuesPrice 258 256 270 277 326 262 271 308 7% 11%EU coupled payments (incl. Art.69) 3 7 12 0 0 0 0 0 - -National aids 8 12 23 0 0 0 0 0 - -Total revenues from milk 268 276 305 277 326 262 271 308 -1% 11%Production costs Feed 74 67 74 76 100 84 79 98 21% 28%
homegrown feed 15 18 19 20 26 27 25 29 55% 49%puchased feed 59 48 55 56 74 56 54 68 10% 21%
Herd renewal purchases 4 3 3 4 4 4 3 3 0% -25%Milk levy 0 0 0 0 0 0 0 0 - -Other specific costs 20 20 21 20 20 22 21 21 7% 8%Specific costs 98 90 97 100 124 109 104 122 17% 22%Machinery and building upkeep 30 25 27 30 34 32 31 31 17% 6%Energy (fuel, electricity) 19 20 22 22 29 28 32 36 61% 67%Contract work 4 4 5 5 6 7 6 6 54% 20%Taxes 0 0 0 0 0 0 0 0 - -Other direct inputs 9 8 8 9 9 10 9 9 16% 8%Non specific costs 61 56 62 65 78 77 79 83 34% 28%Total operating costs 159 146 159 166 202 186 183 206 24% 24%Gross margin 99 110 111 111 124 75 89 102 -17% -8%Gross margin with coupled payments 109 129 146 111 124 75 89 102 -31% -8%
%spe.farms with positive gross margin 91% 98% 99% 95% 95% 72% 76% 76% -21% -19%
%milk production with positive gross margin 97% 99% 100% 98% 97% 92% 95% 95% -4% -3%
Depreciation 78 74 78 72 77 86 3%Wages 1 2 3 2 2 2 -5%Rent 2 3 4 5 6 6 67%Interest 4 3 4 3 3 2 -27%External factors 8 8 11 9 11 10 12%Net margin 13 28 22 30 36 -20 -29%
Net margin with coupled payments 24 47 57 30 36 -20 -65%
Family labour costs 116 110 112 106 106 140 4%Own capital unpaid cost 20 24 24 15 1 59 12%Imputed family factors 136 134 135 121 108 199 5%Net economic margin -123 -106 -113 -91 -72 -219 -12%Net economic margin with coupled payments -112 -87 -78 -91 -72 -219 -38%
%spe.farms with positive net economic margin 5% 6% 6% 10% 14% - -
%milk production with positive net economic margin 17% 20% 19% 28% 34% - -
Source: EU FADN DG AGRI, model of the allocation of costs for milk. 131

EU Dairy farms report 2012 Annex II SI
Slovenia Milk specialised farmsINCOME in EUR/AWU (nominal)
2004 2005 2006 2007 2008 2009
Three years
average trend*
Total output 9 730 11 624 12 908 22 231 24 764 19 033 93%Intermediate consumptions 6 012 6 504 7 458 15 044 17 472 14 861 137%Balance subsidies and taxes 1 963 2 531 2 884 4 243 4 501 4 063 74%
Decoupled payments 0 0 0 2 818 2 780 2 567 -Depreciation 3 201 3 563 3 915 4 441 4 501 4 583 27%Farm Net Value Added (FNVA) 2 480 4 088 4 418 6 988 7 292 3 653 2%
External factors 303 380 515 548 619 528 42%Wages 57 83 130 115 106 101 20%
Rent 90 143 204 277 324 308 108%Interest 156 154 182 156 189 120 -5%
Balance invest. subs. and taxes 1 492 466 -98 252 730 -10 -48%Farm net income (FNI) 3 670 4 174 3 805 6 691 7 403 3 114 48%
Family farms only in EUR/FWU (nominal)Own capital unpaid cost 841 1 179 1 230 947 88 3 250 32%Remuneration of Family Labour (RFL) 2 869 3 063 2 667 5 857 7 428 -89 53%
%spe.farms with positive RFL 66% 80% 70% 82% 87% 37% -3%
Milk specialised farms - gross margin
109129
146111 124
7589
102
0
50
100
150
200
250
300
350
Rev
enue
s
Ope
ratin
g
Rev
enue
s
Ope
ratin
g
Rev
enue
s
Ope
ratin
g
Rev
enue
s
Ope
ratin
g
Rev
enue
s
Ope
ratin
g
Rev
enue
s
Ope
ratin
g
Rev
enue
s
Ope
ratin
g
Rev
enue
s
Ope
ratin
g
2004 2005 2006 2007 2008 2009 2010e 2011e
EUR/t
Price EU coupled payments (incl. Art.69)National aids FeedOther specific costs Non specific costsGross margin with coupled payments
Milk specialised farms - net margin
268 276
305
277
326
262
245 228 248 247289 282
24
47
57
3036
-20
0
50
100
150
200
250
300
350
2004 2005 2006 2007 2008 2009
EUR/t
-30
-20
-10
0
10
20
30
40
50
60
70
Total revenues from milkOperating costs + depreciation + external factorsNet margin with coupled payments
Source: EU FADN DG AGRI, model of the allocation of costs for milk. 132

EU Dairy farms report 2012 Annex II SI
Slovenia Milk specialised farms
Milk specialised farms - net economic margin
268 276305
277
326
262
381362
383 368397
481
-112
-87-78
-91
-72
-219
0
100
200
300
400
500
600
2004 2005 2006 2007 2008 2009
EUR/t
-250
-200
-150
-100
-50
0
Total revenues from milkTotal costsNet economic margin with coupled payments
Milk specialised farms - non-operating costs
78 74 78 72 77 86
116 110 112 106 106140
20 24 2415 1
59
0
50
100
150
200
250
300
350
2004 2005 2006 2007 2008 2009
EUR/t Depreciation Wages Rent Interest Family labour costs Own capital unpaid cost
Milk specialised farms - income per work unit and margins per tonne
-1 000
0
1 000
2 000
3 000
4 000
5 000
6 000
7 000
8 000
2004 2005 2006 2007 2008 2009
EUR/WU
-250
-200
-150
-100
-50
0
50
100
150
200EUR/t of milk
Farm Net Value Added (FNVA) Farm net income (FNI)
Remuneration of Family Labour (RFL) Gross margin with coupled payments
Net margin with coupled payments Net economic margin with coupled payments
Source: EU FADN DG AGRI, model of the allocation of costs for milk. 133

EU Dairy farms report 2012 Annex II BG
Bulgaria Milk specialised farms
e: estimate*: trend between the average of the first three available years and the average of the last available three yearsSTRUCTURAL INFORMATION
2007 2008 2009 2010e 2011e Trend 2009/2007
Trend 2011 /2007
Sample farms 262 234 194 -26%Farms represented 19 174 15 844 12 249 -36%% production from specialised farms 93% 90% 90% -3%Forage area - ha 8 10 8 10%Dairy cows - LU 10 11 12 20%Rented UAA - % 78% 77% 81% 3%Total labour - AWU 2,02 2,11 2,12 5%Family labour - % 71% 64% 64% -8%Milk per ha fodder area - t/ha 3,9 3,5 3,8 -3%Milk yield - kg/cow 3 910 3 781 3 696 3 814 3 838 -2%Milk production - t 40 42 45 42 43 7%
MILK MARGINS in EUR/t of min EUR/t of milk (nominal)
2007 2008 2009 2010e 2011e Trend 2009/2007
Trend 2011 /2007
RevenuesPrice 269 287 234 313 370 37%EU coupled payments (incl. Art.69) 0 0 0 0 0 -National aids 4 19 8 19 19 334%Total revenues from milk 274 306 241 332 389 42%Production costs Feed 109 120 113 122 130 19%
homegrown feed 22 19 24 20 21 -4%puchased feed 88 101 89 103 110 25%
Herd renewal purchases 1 2 0 2 2 297%Milk levy 0 0 0 0 0 -Other specific costs 10 9 10 9 9 -6%Specific costs 119 132 123 133 141 19%Machinery and building upkeep 6 11 7 11 11 81%Energy (fuel, electricity) 18 21 20 22 27 48%Contract work 8 9 10 9 10 28%Taxes 0 0 0 0 0 18%Other direct inputs 6 12 21 12 12 102%Non specific costs 39 53 58 56 61 58%Total operating costs 158 185 181 189 202 28%Gross margin 112 102 52 124 168 50%Gross margin with coupled payments 116 121 60 143 186 61%
%spe.farms with positive gross margin 97% 79% 74% 85% 92% -5%
%milk production with positive gross margin 96% 88% 85% 92% 95% -1%
Depreciation 14 15 15 9%Wages 19 29 27 44%Rent 4 7 6 51%Interest 2 6 5 150%External factors 25 42 39 55%Net margin 73 45 -2 -102%Net margin with coupled payments 77 64 6 -92%
Family labour costs 53 57 52 -2%Own capital unpaid cost 0 0 14 13379%Imputed family factors 53 57 66 25%Net economic margin 20 -11 -68 -445%Net economic margin with coupled payments 24 8 -60 -350%
%spe.farms with positive net economic margin 52% 40% 11% -41%
%milk production with positive net economic margin 64% 56% 23% -41%
Source: EU FADN DG AGRI, model of the allocation of costs for milk. 134
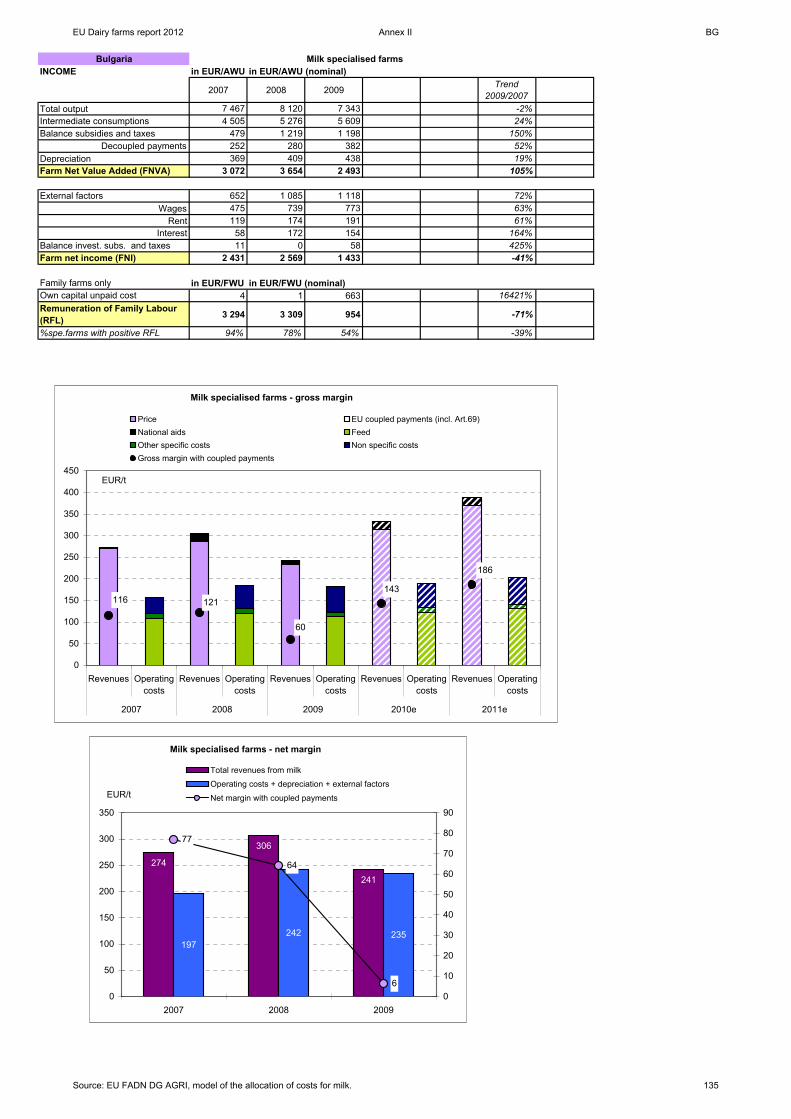
EU Dairy farms report 2012 Annex II BG
Bulgaria Milk specialised farmsINCOME in EUR/AWU in EUR/AWU (nominal)
2007 2008 2009 Trend 2009/2007
Total output 7 467 8 120 7 343 -2%Intermediate consumptions 4 505 5 276 5 609 24%Balance subsidies and taxes 479 1 219 1 198 150%
Decoupled payments 252 280 382 52%Depreciation 369 409 438 19%Farm Net Value Added (FNVA) 3 072 3 654 2 493 105%
External factors 652 1 085 1 118 72%Wages 475 739 773 63%
Rent 119 174 191 61%Interest 58 172 154 164%
Balance invest. subs. and taxes 11 0 58 425%Farm net income (FNI) 2 431 2 569 1 433 -41%
Family farms only in EUR/FWU in EUR/FWU (nominal)Own capital unpaid cost 4 1 663 16421%Remuneration of Family Labour (RFL) 3 294 3 309 954 -71%
%spe.farms with positive RFL 94% 78% 54% -39%
Milk specialised farms - gross margin
116 121
60
143
186
0
50
100
150
200
250
300
350
400
450
Revenues Operatingcosts
Revenues Operatingcosts
Revenues Operatingcosts
Revenues Operatingcosts
Revenues Operatingcosts
2007 2008 2009 2010e 2011e
EUR/t
Price EU coupled payments (incl. Art.69)National aids FeedOther specific costs Non specific costsGross margin with coupled payments
Milk specialised farms - net margin
274
306
241
197242 235
77
64
60
50
100
150
200
250
300
350
2007 2008 2009
EUR/t
0
10
20
30
40
50
60
70
80
90
Total revenues from milk
Operating costs + depreciation + external factors
Net margin with coupled payments
Source: EU FADN DG AGRI, model of the allocation of costs for milk. 135

EU Dairy farms report 2012 Annex II BG
Bulgaria Milk specialised farms
Milk specialised farms - net economic margin
274
306
241
250
299 30124
8
-60
0
50
100
150
200
250
300
350
2007 2008 2009
EUR/t
-70
-60
-50
-40
-30
-20
-10
0
10
20
30
Total revenues from milkTotal costsNet economic margin with coupled payments
Milk specialised farms - non-operating costs
14 15 15
53
5752
0
0 14
0
20
40
60
80
100
120
140
2007 2008 2009
EUR/t
Depreciation Wages Rent
Interest Family labour costs Own capital unpaid cost
Milk specialised farms - income per work unit and margins per tonne
0
500
1 000
1 500
2 000
2 500
3 000
3 500
4 000
2007 2008 2009
EUR/WU
-80
-60
-40
-20
0
20
40
60
80
100
120
140EUR/t of milk
Farm Net Value Added (FNVA)Farm net income (FNI)Remuneration of Family Labour (RFL)Gross margin with coupled paymentsNet margin with coupled paymentsNet economic margin with coupled payments
Source: EU FADN DG AGRI, model of the allocation of costs for milk. 136

EU Dairy farms report 2012 Annex II RO
Romania Milk specialised farms
e: estimate*: trend between the average of the first three available years and the average of the last available three yearsSTRUCTURAL INFORMATION
2007 2009 2010e 2011e Trend 2009/2007
Trend 2011 /2007
Sample farms 95 319 236%Farms represented 154 151 107 326 -30%% production from specialised farms 71% 61% -10%Forage area - ha 4 3 -5%Dairy cows - LU 5 6 33%Rented UAA - % 42% 32% -10%Total labour - AWU 2,00 1,76 -12%Family labour - % 92% 89% -2%Milk per ha fodder area - t/ha 4,1 5,0 20%Milk yield - kg/cow 4 062 3 917 4 554 4 214 4%Milk production - t 19 25 29 27 38%
MILK MARGINS in EUR/t of milk (nominal)
2007 2009 2010e 2011e Trend 2009/2007
Trend 2011 /2007
RevenuesPrice 348 282 332 391 12%EU coupled payments (incl. Art.69) 0 0 0 0 -National aids 18 9 8 9 -52%Total revenues from milk 366 292 340 400 9%Production costs Feed 66 57 53 77 16%
homegrown feed 25 25 23 32 26%puchased feed 41 32 30 45 9%
Herd renewal purchases 1 4 3 4 328%Milk levy 0 0 0 0 -Other specific costs 22 19 18 20 -7%Specific costs 89 80 75 100 13%Machinery and building upkeep 10 11 10 11 12%Energy (fuel, electricity) 22 19 19 25 14%Contract work 13 10 8 9 -26%Taxes 1 1 1 1 -37%Other direct inputs 6 6 6 6 14%Non specific costs 51 47 44 52 3%Total operating costs 140 127 119 153 9%Gross margin 208 156 213 238 15%Gross margin with coupled payments 226 165 221 247 9%
%spe.farms with positive gross margin 97% 97% 99% 99% 2%
%milk production with positive gross margin 96% 93% 96% 96% 0%
Depreciation 27 32 21%Wages 15 19 26%Rent 6 3 -48%Interest 5 2 -57%External factors 26 24 -7%Net margin 155 99 -36%Net margin with coupled payments 173 108 -37%
Family labour costs 163 120 -26%Own capital unpaid cost 18 35 89%Imputed family factors 182 155 -15%Net economic margin -27 -56 -109%Net economic margin with coupled payments -9 -47 -437%
%spe.farms with positive net economic margin 25% 26% 1%
%milk production with positive net economic margin 50% 45% -4%
Source: EU FADN DG AGRI, model of the allocation of costs for milk. 137

EU Dairy farms report 2012 Annex II RO
Romania Milk specialised farmsINCOME in EUR/AWU (nominal)
2007 2009 Trend 2009/2007
Total output 5 065 6 501 28%Intermediate consumptions 2 606 3 325 28%Balance subsidies and taxes 764 738 -3%
Decoupled payments 134 254 90%Depreciation 395 694 76%Farm Net Value Added (FNVA) 2 828 3 221 -78%
External factors 340 497 46%Wages 198 392 98%
Rent 78 63 -18%Interest 64 41 -36%
Balance invest. subs. and taxes 0 0 -112%Farm net income (FNI) 2 488 2 725 10%
Family farms only in EUR/FWU (nominal)Own capital unpaid cost 294 840 186%Remuneration of Family Labour (RFL) 1 539 2 115 37%
%spe.farms with positive RFL 88% 79% -9%
Milk specialised farms - gross margin
226
165
221247
0
50
100
150
200
250
300
350
400
450
Revenues Operatingcosts
Revenues Operatingcosts
Revenues Operatingcosts
Revenues Operatingcosts
2007 2009 2010e 2011e
EUR/t
Price EU coupled payments (incl. Art.69)National aids FeedOther specific costs Non specific costsGross margin with coupled payments
Milk specialised farms - net margin
366
292
193
0
173
108
0
50
100
150
200
250
300
350
400
2007 2009
EUR/t
0
20
40
60
80
100
120
140
160
180
200
Total revenues from milk
Operating costs + depreciation + external factors
Net margin with coupled payments
Source: EU FADN DG AGRI, model of the allocation of costs for milk. 138

EU Dairy farms report 2012 Annex II RO
Romania Milk specialised farms
Milk specialised farms - net economic margin
366
292
375
0
-9
-470
50
100
150
200
250
300
350
400
2007 2009
EUR/t
-50
-45
-40
-35
-30
-25
-20
-15
-10
-5
0
Total revenues from milkTotal costsNet economic margin with coupled payments
Milk specialised farms - non-operating costs
27 32
163120
18
35
0
50
100
150
200
250
2007 2009
EUR/t
Depreciation WagesRent InterestFamily labour costs Own capital unpaid cost
Milk specialised farms - income per work unit and margins per tonne
0
500
1 000
1 500
2 000
2 500
3 000
3 500
2007 2009
EUR/WU
-100
-50
0
50
100
150
200
250EUR/t of milk
Farm Net Value Added (FNVA)Farm net income (FNI)Remuneration of Family Labour (RFL)Gross margin with coupled paymentsNet margin with coupled paymentsNet economic margin with coupled payments
Source: EU FADN DG AGRI, model of the allocation of costs for milk. 139

EU Dairy farms report 2012 Annex II BE RG
Belgium 2009 Milk specialised farms
e: estimate*: trend between the average of the first three available years and the average of the last available three yearsSTRUCTURAL INFORMATION
Vlaanderen Wallonie Belgium
Sample farms 118 96 214Farms represented 3 283 2 114 5 397% production from specialised farms 67% 56% 62%Forage area - ha 31 56 41Dairy cows - LU 51 58 54Rented UAA - % 71% 76% 74%Total labour - AWU 1,67 1,59 1,64Family labour - % 99% 97% 98%Milk per ha fodder area - t/ha 12,0 6,5 9,1Milk yield - kg/cow 7 418 6 227 6 910Milk production - t 375 364 371
MILK MARGINS in EUR/t of milk (nominal)Vlaanderen Wallonie Belgium
RevenuesPrice 253 257 254EU coupled payments (incl. Art.69) 0 0 0National aids 0 0 0Total revenues from milk 253 257 254Production costs Feed 72 77 74
homegrown feed 27 26 26purchased feed 45 51 47
Herd renewal purchases 4 2 3Milk levy 0 0 0Other specific costs 20 20 20Specific costs 96 100 97Machinery and building upkeep 12 17 14Energy (fuel, electricity) 12 14 13Contract work 19 19 19Taxes 1 0 1Other direct inputs 11 12 11Non specific costs 55 62 58Total operating costs 151 162 155Gross margin 102 95 99Gross margin with coupled payments 102 95 99
%spe.farms with positive gross margin 99% 95% 97%
%milk production with positive gross margin 99% 97% 98%
Depreciation 46 50 47Wages 0 2 1Rent 12 16 14Interest 14 20 16External factors 27 39 31Net margin 29 6 21Net margin with coupled payments 29 6 21
Family labour costs 80 74 77Own capital unpaid cost 12 14 13Imputed family factors 92 88 90Net economic margin -62 -81 -70Net economic margin with coupled payments -62 -81 -69
%spe.farms with positive net economic margin 13% - 11%
%milk production with positive net economic margin 19% - 15%
Source: EU FADN DG AGRI, model of the allocation of costs for milk. 140

EU Dairy farms report 2012 Annex II BE RG
Belgium 2009 Milk specialised farmsINCOME in EUR/AWU (nominal)
Vlaanderen Wallonie BelgiumTotal output 77 583 77 107 77 339Intermediate consumptions 45 192 47 221 45 926Balance subsidies and taxes 12 099 18 428 14 492
Decoupled payments 10 825 11 430 11 046Depreciation 14 039 14 992 14 390Farm Net Value Added (FNVA) 30 451 33 322 31 516
External factors 8 115 11 739 9 484Wages 146 568 306
Rent 3 829 4 977 4 262Interest 4 140 6 193 4 916
Balance invest. subs. and taxes -1 316 1 443 -267Farm net income (FNI) 21 021 23 026 21 765
Family farms only in EUR/FWU (nominal)Own capital unpaid cost 3 800 4 374 4 007Remuneration of Family Labour (RFL) 17 431 19 352 18 152
%spe.farms with positive RFL 87% 91% 88%
Milk specialised farms - gross margin
10295 99
0
50
100
150
200
250
300
Revenues Operating costs Revenues Operating costs Revenues Operating costs
Vlaanderen Wallonie Belgium
EUR/t
Price EU coupled payments (incl. Art.69)National aids FeedOther specific costs Non specific costsGross margin with coupled payments
Milk specialised farms - net margin
253257
254
223
250
234
29
6
21
200
210
220
230
240
250
260
Vlaanderen Wallonie Belgium
EUR/t
0
5
10
15
20
25
30
35
Total revenues from milkOperating costs + depreciation + external factorsNet margin with coupled payments
Source: EU FADN DG AGRI, model of the allocation of costs for milk. 141

EU Dairy farms report 2012 Annex II BE RG
Belgium 2009 Milk specialised farms
Milk specialised farms - net economic margin
253 257 254
315338
324
-62
-81
-69
0
50
100
150
200
250
300
350
400
Vlaanderen Wallonie Belgium
EUR/t
-90
-80
-70
-60
-50
-40
-30
-20
-10
0
Total revenues from milk Total costs Net economic margin with coupled payments
Milk specialised farms - non-operating costs
46 50 47
8074
77
1214
13
0
20
40
60
80
100
120
140
160
180
200
Vlaanderen Wallonie Belgium
EUR/t Depreciation Wages Rent Interest Family labour costs Own capital unpaid cost
Milk specialised farms - income per work unit and margins per tonne
0
5 000
10 000
15 000
20 000
25 000
30 000
35 000
Vlaanderen Wallonie Belgium
EUR/WU
-100
-50
0
50
100
150EUR/t of milk
Farm Net Value Added (FNVA) Farm net income (FNI)
Remuneration of Family Labour (RFL) Gross margin with coupled payments
Net margin with coupled payments Net economic margin with coupled payments
Source: EU FADN DG AGRI, model of the allocation of costs for milk. 142

EU Dairy farms report 2012 Annex II DE RG
Germany 2009 Milk specialised farms
e: estimate*: trend between the average of the first three available years and the average of the last available three yearsSTRUCTURAL INFORMATION
Schleswig-Holstein
Niedersachsen
Nordrhein-Westfalen Hessen Rheinland-
Pfalz
Baden-Wurttember
gBayern Saarland Brandenbur
g
Mecklenburg-
Vorpommern
Sachsen Sachsen-Anhalt Thueringen Germany
Sample farms 200 301 170 135 118 222 516 51 54 53 100 64 55 2 039Farms represented 4 271 9 082 4 894 2 536 1 911 6 411 28 707 191 329 439 830 370 224 60 196% production from specialised farm 89% 89% 88% 89% 91% 87% 87% 88% 49% 56% 55% 69% 41% 80%Forage area - ha 64 59 47 54 60 40 31 87 333 242 147 274 233 49Dairy cows - LU 70 64 60 48 52 43 34 63 228 225 147 265 198 51Rented UAA - % 55% 63% 67% 74% 68% 63% 55% 72% 80% 71% 81% 87% 90% 65%Total labour - AWU 1,83 1,84 1,74 1,79 1,74 1,61 1,53 2,18 10,45 7,49 8,54 10,81 10,46 1,92Family labour - % 78% 83% 82% 83% 90% 91% 97% 85% 9% 18% 15% 15% 15% 77%Milk per ha fodder area - t/ha 8,7 8,8 10,1 6,3 6,3 6,8 7,4 5,3 5,7 7,8 8,1 7,8 6,9 7,8Milk yield - kg/cow 8 011 8 071 7 976 6 944 7 258 6 375 6 606 7 351 8 317 8 362 8 127 8 036 8 113 7 387Milk production - t 561 517 476 336 379 273 225 461 1 899 1 881 1 191 2 127 1 604 380
MILK MARGINS in EUR/t of milk (nominal)
Schleswig-Holstein
Niedersachsen
Nordrhein-Westfalen Hessen Rheinland-
Pfalz
Baden-Wurttember
gBayern Saarland Brandenbur
g
Mecklenburg-
Vorpommern
Sachsen Sachsen-Anhalt Thueringen Germany
RevenuesPrice 259 266 275 279 275 290 286 273 257 255 256 260 268 273EU coupled payments (incl. Art.69) 0 0 0 0 0 0 0 0 0 0 0 0 0 0National aids 0 0 0 0 0 0 0 0 0 0 0 0 0 0Total revenues from milk 259 266 275 279 275 290 286 273 257 255 256 260 268 273Production costs Feed 62 76 76 75 72 76 81 76 86 77 80 89 90 77
homegrown feed 21 20 19 29 24 28 32 30 25 26 30 23 32 26purchased feed 41 56 58 47 48 48 49 46 61 51 50 66 58 51
Herd renewal purchases 2 2 4 3 1 2 1 6 5 3 1 2 6 2Milk levy 0 0 0 0 0 0 0 1 0 0 0 0 0 0Other specific costs 33 22 23 23 22 23 22 27 19 32 14 21 12 23Specific costs 97 100 103 102 95 101 104 109 110 112 95 112 108 102Machinery and building upkeep 18 17 21 26 22 27 22 23 20 18 20 18 22 21Energy (fuel, electricity) 19 19 22 30 26 28 27 31 30 25 29 27 30 24Contract work 22 18 22 14 15 17 15 16 10 25 7 11 14 17Taxes 2 2 1 1 1 1 2 1 2 3 2 2 2 2Other direct inputs 18 19 23 28 26 34 29 26 31 22 36 22 35 26Non specific costs 80 77 90 99 91 107 95 97 93 93 94 79 103 90Total operating costs 177 177 193 200 186 208 199 206 204 205 189 191 211 192Gross margin 82 89 82 78 90 82 87 67 54 50 66 68 57 81Gross margin with coupled payments 82 89 82 78 90 82 87 67 54 50 66 68 57 81
%spe.farms with positive gross margin 98% 98% 95% 91% 92% 87% 95% 83% 88% 93% 92% 99% 93% 94%
%milk production with positive gross margin 99% 99% 98% 94% 98% 94% 96% 90% 95% 91% 98% 99% 91% 97%
Depreciation 29 33 38 57 50 59 64 56 41 34 44 37 52 47Wages 9 7 8 9 7 7 3 10 67 50 81 62 85 16Rent 19 19 23 15 15 17 14 12 14 12 12 18 14 17Interest 10 11 10 11 8 9 9 11 14 15 6 10 10 10External factors 37 37 40 35 30 33 26 33 95 76 99 90 109 42Net margin 16 18 4 -14 10 -10 -3 -22 -82 -61 -76 -59 -103 -7Net margin with coupled payments 16 18 4 -14 10 -10 -3 -22 -82 -61 -76 -59 -103 -8
Family labour costs 32 41 40 60 50 66 76 54 8 12 17 12 16 48Own capital unpaid cost 18 58 19 16 20 28 39 12 5 5 10 5 7 31Imputed family factors 51 99 59 76 70 94 115 66 14 18 26 17 23 80Net economic margin -35 -81 -55 -89 -60 -104 -118 -88 -96 -78 -102 -76 -126 -87Net economic margin with coupled payments -35 -81 -55 -89 -60 -104 -118 -88 -96 -78 -102 -76 -126 -87
%spe.farms with positive net economic margin 16% 14% 9% - - - 2% - - - - - - 6%
%milk production with positive net economic margin 25% 24% 16% - - - 4% - - - - - - 12%
Source: EU FADN DG AGRI, model of the allocation of costs for milk. 143

EU Dairy farms report 2012 Annex II DE RG
Germany 2009 Milk specialised farmsINCOME in EUR/AWU (nominal)
Schleswig-Holstein
Niedersachsen
Nordrhein-Westfalen Hessen Rheinland-
Pfalz
Baden-Wurttember
gBayern Saarland Brandenbur
g
Mecklenburg-
Vorpommern
Sachsen Sachsen-Anhalt Thueringen Germany
Total output 113 246 101 848 101 923 73 539 81 483 69 029 63 413 80 996 76 007 96 958 63 245 81 671 66 999 78 765Intermediate consumptions 77 569 70 021 73 180 55 382 55 579 49 291 42 224 61 237 61 152 77 260 49 678 59 057 54 210 55 412Balance subsidies and taxes 21 046 18 714 20 120 19 650 17 882 16 046 15 473 20 757 22 554 21 216 15 982 20 811 18 878 17 643
Decoupled payments 19 053 15 428 15 611 13 559 13 386 10 922 9 488 16 870 17 486 18 443 12 829 17 743 12 522 12 929Depreciation 12 416 12 873 14 307 15 149 15 012 14 176 14 176 16 667 11 962 12 679 10 047 11 414 12 105 13 469Farm Net Value Added (FNVA) 44 308 37 667 34 556 22 659 28 774 21 608 22 485 23 850 25 446 28 234 19 502 32 011 19 562 27 528
External factors 16 181 14 391 14 712 9 527 8 954 7 800 5 699 9 916 28 306 29 050 23 469 28 411 25 700 12 401Wages 3 860 2 852 2 795 2 452 2 088 1 725 706 3 139 20 344 19 270 19 283 19 672 20 105 4 894
Rent 8 139 7 383 8 397 4 089 4 481 4 001 3 049 3 696 4 074 4 536 2 739 5 662 3 280 4 736Interest 4 182 4 156 3 519 2 987 2 385 2 073 1 945 3 080 3 889 5 244 1 447 3 078 2 315 2 771
Balance invest. subs. and taxes -1 537 -1 693 -1 677 32 -1 528 -927 -594 -1 252 446 -326 1 722 22 124 -715Farm net income (FNI) 26 589 21 583 18 167 13 164 18 292 12 881 16 191 12 682 -2 413 -1 142 -2 246 3 622 -6 014 14 411
Family farms only in EUR/FWU (nominal)Own capital unpaid cost 9 974 26 516 8 472 4 982 6 690 7 348 8 918 4 172 17 641 11 405 14 235 9 664 11 631 11 455Remuneration of Family Labour (RFL) 24 024 -562 13 664 10 923 13 725 6 875 7 846 10 706 11 480 23 142 9 774 27 116 4 299 8 597
%spe.farms with positive RFL 87% 80% 75% 76% 77% 62% 75% 73% 44% 71% 53% 65% 53% 75%
Milk specialised farms - gross margin
66 68 5781
82 89 82 78 90 82 8767 54 50
0
50
100
150
200
250
300
350
Rev
enue
s
Ope
ratin
g
Rev
enue
s
Ope
ratin
g
Rev
enue
s
Ope
ratin
g
Rev
enue
s
Ope
ratin
g
Rev
enue
s
Ope
ratin
g
Rev
enue
s
Ope
ratin
g
Rev
enue
s
Ope
ratin
g
Rev
enue
s
Ope
ratin
g
Rev
enue
s
Ope
ratin
g
Rev
enue
s
Ope
ratin
g
Rev
enue
s
Ope
ratin
g
Rev
enue
s
Ope
ratin
g
Rev
enue
s
Ope
ratin
g
Rev
enue
s
Ope
ratin
g
Schleswig-Holstein
NiedersachsenNordrhein-Westfalen
Hessen Rheinland-Pfalz
Baden-Wurttemberg
Bayern Saarland BrandenburgMecklenburg-Vorpommern
Sachsen Sachsen-Anhalt
Thueringen Germany
EUR/t
Price EU coupled payments (incl. Art.69) National aidsFeed Other specific costs Non specific costsGross margin with coupled payments
Milk specialised farms - net margin
259 266 275 279 275290 286
273257 255 256 260 268 273
243 248 271 292265
300 289 295340 316 332 319
371
281
16 18
4
-14
10
-10-3
-22
-82
-61
-76
-59
-103
-8
0
50
100
150
200
250
300
350
400
Sch
lesw
ig-
Hol
stei
n
Nie
ders
achs
en
Nor
drhe
in-
Wes
tfale
n
Hes
sen
Rhe
inla
nd-
Pfa
lz
Bad
en-
Wur
ttem
berg
Bay
ern
Saa
rland
Bra
nden
burg
Mec
klen
burg
-V
orpo
mm
ern
Sac
hsen
Sac
hsen
-A
nhal
t
Thue
ringe
n
Ger
man
y
EUR/t
-120
-100
-80
-60
-40
-20
0
20
40
Total revenues from milk Operating costs + depreciation + external factors
Net margin with coupled payments
Source: EU FADN DG AGRI, model of the allocation of costs for milk. 144
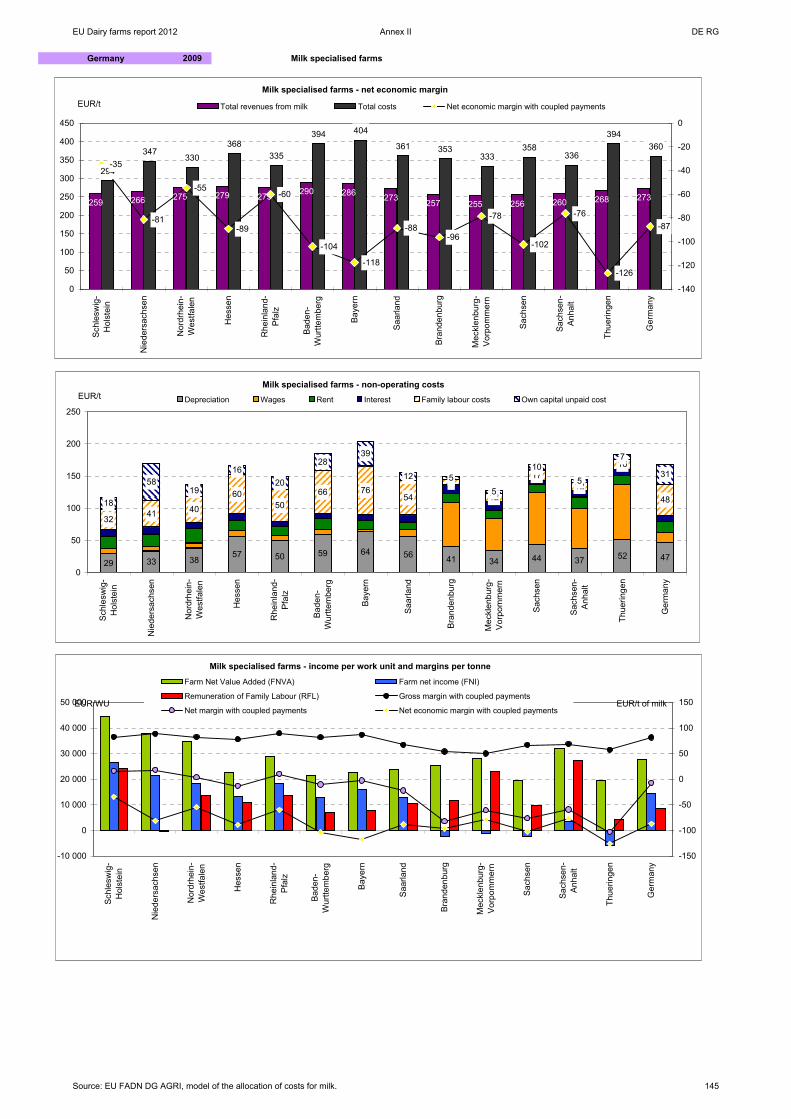
EU Dairy farms report 2012 Annex II DE RG
Germany 2009 Milk specialised farms
Milk specialised farms - net economic margin
259 266 275 279 275 290 286 273 257 255 256 260 268 273
294
347330
368335
394 404
361 353333
358336
394360
-35
-81
-55
-89
-60
-104
-118
-88-96
-78
-102
-76
-126
-87
0
50
100
150
200
250
300
350
400
450
Sch
lesw
ig-
Hol
stei
n
Nie
ders
achs
en
Nor
drhe
in-
Wes
tfale
n
Hes
sen
Rhe
inla
nd-
Pfa
lz
Bad
en-
Wur
ttem
berg
Bay
ern
Saa
rland
Bra
nden
burg
Mec
klen
burg
-V
orpo
mm
ern
Sac
hsen
Sac
hsen
-A
nhal
t
Thue
ringe
n
Ger
man
y
EUR/t
-140
-120
-100
-80
-60
-40
-20
0
Total revenues from milk Total costs Net economic margin with coupled payments
Milk specialised farms - non-operating costs
29 33 3857 50 59 64 56 41 34 44 37 52 47
32 41 40
6050
66 7654
8
12
1712
16
4818
5819
1620
2839
12 55
105
7
31
0
50
100
150
200
250
Sch
lesw
ig-
Hol
stei
n
Nie
ders
achs
en
Nor
drhe
in-
Wes
tfale
n
Hes
sen
Rhe
inla
nd-
Pfa
lz
Bad
en-
Wur
ttem
berg
Bay
ern
Saa
rland
Bra
nden
burg
Mec
klen
burg
-V
orpo
mm
ern
Sac
hsen
Sac
hsen
-A
nhal
t
Thue
ringe
n
Ger
man
y
EUR/t Depreciation Wages Rent Interest Family labour costs Own capital unpaid cost
Milk specialised farms - income per work unit and margins per tonne
-10 000
0
10 000
20 000
30 000
40 000
50 000
Sch
lesw
ig-
Hol
stei
n
Nie
ders
achs
en
Nor
drhe
in-
Wes
tfale
n
Hes
sen
Rhe
inla
nd-
Pfa
lz
Bad
en-
Wur
ttem
berg
Bay
ern
Saa
rland
Bra
nden
burg
Mec
klen
burg
-V
orpo
mm
ern
Sac
hsen
Sac
hsen
-A
nhal
t
Thue
ringe
n
Ger
man
y
EUR/WU
-150
-100
-50
0
50
100
150EUR/t of milk
Farm Net Value Added (FNVA) Farm net income (FNI)
Remuneration of Family Labour (RFL) Gross margin with coupled payments
Net margin with coupled payments Net economic margin with coupled payments
Source: EU FADN DG AGRI, model of the allocation of costs for milk. 145

EU Dairy farms report 2012 Annex II ES RG
Spain 2009 Milk specialised farms
e: estimate*: trend between the average of the first three available years and the average of the last available three yearsSTRUCTURAL INFORMATION
Galicia Asturias Cantabria Pais Vasco Navarra Cataluna Baleares Castilla-Leon Andalucia Spain
Sample farms 266 152 135 78 44 49 23 27 137 935Farms represented 12 323 2 321 1 795 442 237 821 166 2 814 1 191 22 777% production from specialised farm 96% 100% 100% 100% 100% 97% 82% 95% 100% 97%Forage area - ha 17 19 31 30 26 37 76 11 11 19Dairy cows - LU 28 40 44 60 74 83 51 43 58 38Rented UAA - % 15% 48% 80% 61% 69% 56% 88% 51% 15% 40%Total labour - AWU 1,43 1,79 1,60 2,24 1,94 2,30 1,51 1,39 1,94 1,56Family labour - % 97% 99% 97% 88% 84% 70% 81% 94% 94% 94%Milk per ha fodder area - t/ha 11,2 12,7 8,4 17,4 22,3 20,0 4,3 21,6 21,8 12,7Milk yield - kg/cow 6 668 5 834 5 957 8 747 8 573 9 012 6 348 7 107 7 042 6 886Milk production - t 188 234 264 522 635 749 325 307 407 264
MILK MARGINS in EUR/t of milk (nominal)
Galicia Asturias Cantabria Pais Vasco Navarra Cataluna Baleares Castilla-Leon Andalucia Spain
RevenuesPrice 281 325 324 320 313 301 293 299 290 297EU coupled payments (incl. Art.69) 0 0 0 0 0 0 0 0 0 0National aids 0 0 0 0 0 0 0 0 0 0Total revenues from milk 281 325 324 320 313 301 293 299 290 297Production costs Feed 98 152 143 164 165 135 144 102 86 116
homegrown feed 11 6 3 3 5 11 24 4 1 8purchased feed 87 145 140 161 160 125 120 98 85 109
Herd renewal purchases 11 0 1 4 2 2 0 20 2 8Milk levy 0 0 0 0 0 0 0 0 0 0Other specific costs 16 24 19 25 31 34 14 14 13 19Specific costs 124 176 162 193 199 171 158 135 101 143Machinery and building upkeep 7 18 14 13 15 17 15 18 3 11Energy (fuel, electricity) 12 12 13 13 14 15 18 11 10 12Contract work 5 7 8 3 1 16 6 3 1 6Taxes 0 0 0 0 0 0 0 0 0 0Other direct inputs 4 10 11 17 18 18 8 11 6 9Non specific costs 28 47 47 45 50 66 47 45 21 38Total operating costs 152 223 210 239 248 237 205 180 122 181Gross margin 129 102 114 82 64 64 88 119 169 116Gross margin with coupled payments 129 102 114 82 64 64 88 119 169 116
%spe.farms with positive gross margin 99% 99% 97% 87% 97% 95% 95% 97% 100% 98%
%milk production with positive gross margin 99% 99% 99% 96% 94% 95% 99% 98% 100% 97%
Depreciation 16 23 19 42 33 29 17 6 8 17Wages 2 1 4 7 10 17 12 4 2 5Rent 2 6 8 3 4 8 33 5 1 4Interest 1 1 3 6 6 4 1 1 0 2External factors 5 8 14 17 20 29 45 10 3 10Net margin 108 71 80 23 11 6 25 103 157 88Net margin with coupled payments 108 71 80 23 11 6 25 103 157 88
Family labour costs 81 192 112 63 39 29 42 70 47 80Own capital unpaid cost 26 26 17 19 17 20 13 15 17 21Imputed family factors 107 217 130 82 56 48 55 85 64 101Net economic margin 2 -146 -49 -58 -45 -43 -30 18 92 -12Net economic margin with coupled payments 2 -146 -49 -58 -46 -43 -30 18 92 -12
%spe.farms with positive net economic margin 32% - 27% - - - - 59% 79% 35%
%milk production with positive net economic margin 54% - 31% - - - - 54% 95% 46%
Source: EU FADN DG AGRI, model of the allocation of costs for milk. 146

EU Dairy farms report 2012 Annex II ES RG
Spain 2009 Milk specialised farmsINCOME in EUR/AWU (nominal)
Galicia Asturias Cantabria Pais Vasco Navarra Cataluna Baleares Castilla-Leon Andalucia Spain
Total output 49 435 53 540 61 860 81 248 119 831 128 049 81 169 88 892 69 521 64 341Intermediate consumptions 28 636 40 087 42 278 63 625 97 463 106 457 60 646 48 022 31 201 40 548Balance subsidies and taxes 7 287 5 377 7 478 12 197 12 012 13 237 19 160 11 265 8 881 8 469
Decoupled payments 4 082 3 968 5 275 7 755 10 205 10 535 8 260 6 805 5 736 5 328Depreciation 2 513 3 322 3 545 10 803 12 368 10 540 4 415 1 635 1 977 3 396Farm Net Value Added (FNVA) 25 574 15 509 23 515 19 017 22 012 24 289 35 268 50 499 45 225 28 866
External factors 727 1 242 2 723 4 318 7 435 10 487 10 682 3 187 832 2 049Wages 371 217 672 1 932 3 531 6 098 2 824 1 248 556 923
Rent 250 830 1 541 803 1 594 2 917 7 666 1 588 276 809Interest 106 194 510 1 584 2 310 1 471 191 351 0 316
Balance invest. subs. and taxes -119 -228 91 2 538 7 047 1 382 -229 -361 -403 84Farm net income (FNI) 24 727 14 039 20 884 17 237 21 624 15 184 24 358 46 952 43 990 26 901
Family farms only in EUR/FWU (nominal)Own capital unpaid cost 4 316 3 827 3 405 5 603 7 677 10 170 4 031 4 825 4 440 4 557Remuneration of Family Labour (RFL) 21 268 10 372 18 184 13 892 18 174 11 657 25 884 43 919 42 097 23 797
%spe.farms with positive RFL 99% 94% 93% 80% 84% 58% 91% 100% 84% 95%
Milk specialised farms - gross margin
129
102114
8264 64
88
119
169
116
0
50
100
150
200
250
300
350
Rev
enue
s
Ope
ratin
g
Rev
enue
s
Ope
ratin
g
Rev
enue
s
Ope
ratin
g
Rev
enue
s
Ope
ratin
g
Rev
enue
s
Ope
ratin
g
Rev
enue
s
Ope
ratin
g
Rev
enue
s
Ope
ratin
g
Rev
enue
s
Ope
ratin
g
Rev
enue
s
Ope
ratin
g
Rev
enue
s
Ope
ratin
g
Galicia Asturias Cantabria Pais Vasco Navarra Cataluna Baleares Castilla-Leon Andalucia Spain
EUR/t
Price EU coupled payments (incl. Art.69) National aidsFeed Other specific costs Non specific costsGross margin with coupled payments
Milk specialised farms - net margin
281
325 324 320 313301 293 299 290 297
173
254 243
297 302 296268
196
133
209
108
7180
23
116
25
103
157
88
0
50
100
150
200
250
300
350
Galicia Asturias Cantabria Pais Vasco Navarra Cataluna Baleares Castilla-Leon Andalucia Spain
EUR/t
0
20
40
60
80
100
120
140
160
180
Total revenues from milk Operating costs + depreciation + external factors
Net margin with coupled payments
Source: EU FADN DG AGRI, model of the allocation of costs for milk. 147

EU Dairy farms report 2012 Annex II ES RG
Spain 2009 Milk specialised farms
Milk specialised farms - net economic margin
281
325 324 320 313 301 293 299 290 297280
471
373 379358
344323
281
198
309
2
-146
-49 -58-46 -43
-30
18
92
-12
0
50
100
150
200
250
300
350
400
450
500
Galicia Asturias Cantabria Pais Vasco Navarra Cataluna Baleares Castilla-Leon Andalucia Spain
EUR/t
-200
-150
-100
-50
0
50
100
150
Total revenues from milk Total costs Net economic margin with coupled payments
Milk specialised farms - non-operating costs
16 23 1942 33 29 17 6 8 17
81
192
112 6339 29
42
7047
80
26
26
17
19
17 2013
15
17
21
0
50
100
150
200
250
300
Galicia Asturias Cantabria Pais Vasco Navarra Cataluna Baleares Castilla-Leon Andalucia Spain
EUR/tDepreciation Wages Rent Interest Family labour costs Own capital unpaid cost
Milk specialised farms - income per work unit and margins per tonne
0
10 000
20 000
30 000
40 000
50 000
60 000
Galicia Asturias Cantabria Pais Vasco Navarra Cataluna Baleares Castilla-Leon Andalucia Spain
EUR/WU
-200
-150
-100
-50
0
50
100
150
200
EUR/t of milk
Farm Net Value Added (FNVA) Farm net income (FNI)
Remuneration of Family Labour (RFL) Gross margin with coupled payments
Net margin with coupled payments Net economic margin with coupled payments
Source: EU FADN DG AGRI, model of the allocation of costs for milk. 148
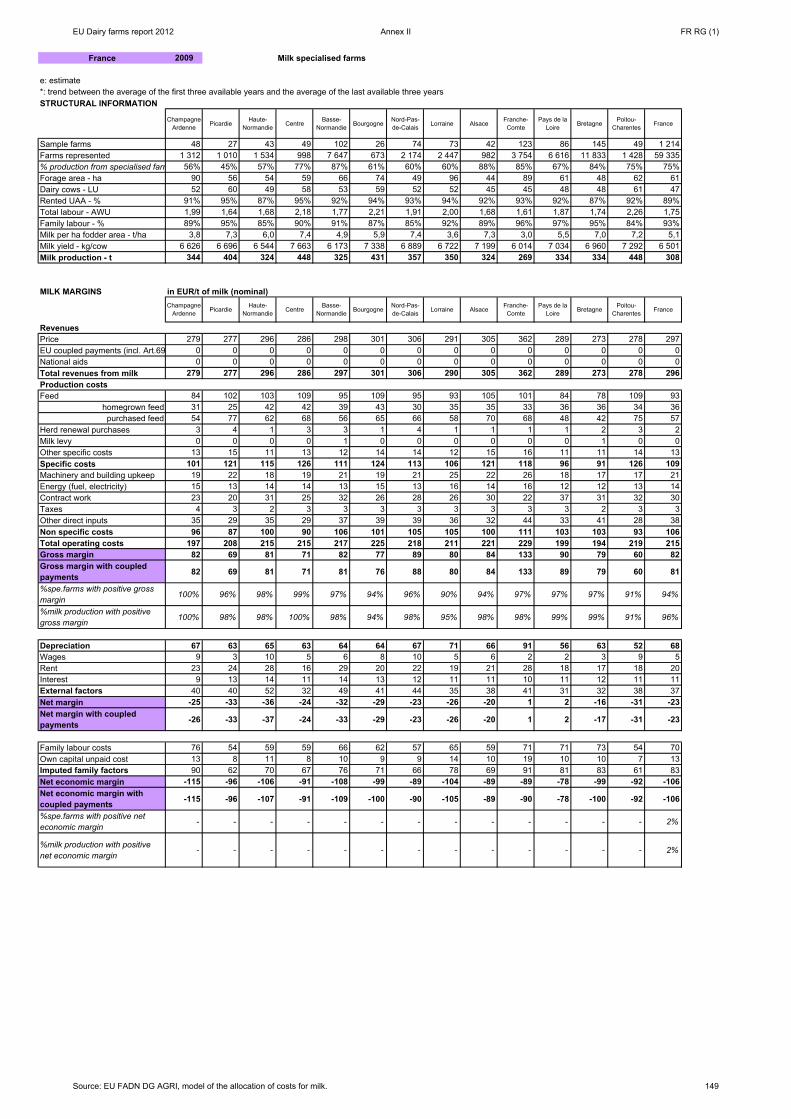
EU Dairy farms report 2012 Annex II FR RG (1)
France 2009 Milk specialised farms
e: estimate*: trend between the average of the first three available years and the average of the last available three yearsSTRUCTURAL INFORMATION
Champagne-Ardenne Picardie
Haute-Normandie Centre
Basse-Normandie Bourgogne
Nord-Pas-de-Calais Lorraine Alsace
Franche-Comte
Pays de la Loire Bretagne
Poitou-Charentes France
Sample farms 48 27 43 49 102 26 74 73 42 123 86 145 49 1 214Farms represented 1 312 1 010 1 534 998 7 647 673 2 174 2 447 982 3 754 6 616 11 833 1 428 59 335% production from specialised farm 56% 45% 57% 77% 87% 61% 60% 60% 88% 85% 67% 84% 75% 75%Forage area - ha 90 56 54 59 66 74 49 96 44 89 61 48 62 61Dairy cows - LU 52 60 49 58 53 59 52 52 45 45 48 48 61 47Rented UAA - % 91% 95% 87% 95% 92% 94% 93% 94% 92% 93% 92% 87% 92% 89%Total labour - AWU 1,99 1,64 1,68 2,18 1,77 2,21 1,91 2,00 1,68 1,61 1,87 1,74 2,26 1,75Family labour - % 89% 95% 85% 90% 91% 87% 85% 92% 89% 96% 97% 95% 84% 93%Milk per ha fodder area - t/ha 3,8 7,3 6,0 7,4 4,9 5,9 7,4 3,6 7,3 3,0 5,5 7,0 7,2 5,1Milk yield - kg/cow 6 626 6 696 6 544 7 663 6 173 7 338 6 889 6 722 7 199 6 014 7 034 6 960 7 292 6 501Milk production - t 344 404 324 448 325 431 357 350 324 269 334 334 448 308
MILK MARGINS in EUR/t of milk (nominal)Champagne-
Ardenne PicardieHaute-
Normandie CentreBasse-
Normandie BourgogneNord-Pas-de-Calais Lorraine Alsace
Franche-Comte
Pays de la Loire Bretagne
Poitou-Charentes France
RevenuesPrice 279 277 296 286 298 301 306 291 305 362 289 273 278 297EU coupled payments (incl. Art.69 0 0 0 0 0 0 0 0 0 0 0 0 0 0National aids 0 0 0 0 0 0 0 0 0 0 0 0 0 0Total revenues from milk 279 277 296 286 297 301 306 290 305 362 289 273 278 296Production costs Feed 84 102 103 109 95 109 95 93 105 101 84 78 109 93
homegrown feed 31 25 42 42 39 43 30 35 35 33 36 36 34 36purchased feed 54 77 62 68 56 65 66 58 70 68 48 42 75 57
Herd renewal purchases 3 4 1 3 3 1 4 1 1 1 1 2 3 2Milk levy 0 0 0 0 1 0 0 0 0 0 0 1 0 0Other specific costs 13 15 11 13 12 14 14 12 15 16 11 11 14 13Specific costs 101 121 115 126 111 124 113 106 121 118 96 91 126 109Machinery and building upkeep 19 22 18 19 21 19 21 25 22 26 18 17 17 21Energy (fuel, electricity) 15 13 14 14 13 15 13 16 14 16 12 12 13 14Contract work 23 20 31 25 32 26 28 26 30 22 37 31 32 30Taxes 4 3 2 3 3 3 3 3 3 3 3 2 3 3Other direct inputs 35 29 35 29 37 39 39 36 32 44 33 41 28 38Non specific costs 96 87 100 90 106 101 105 105 100 111 103 103 93 106Total operating costs 197 208 215 215 217 225 218 211 221 229 199 194 219 215Gross margin 82 69 81 71 82 77 89 80 84 133 90 79 60 82Gross margin with coupled payments 82 69 81 71 81 76 88 80 84 133 89 79 60 81
%spe.farms with positive gross margin 100% 96% 98% 99% 97% 94% 96% 90% 94% 97% 97% 97% 91% 94%
%milk production with positive gross margin 100% 98% 98% 100% 98% 94% 98% 95% 98% 98% 99% 99% 91% 96%
Depreciation 67 63 65 63 64 64 67 71 66 91 56 63 52 68Wages 9 3 10 5 6 8 10 5 6 2 2 3 9 5Rent 23 24 28 16 29 20 22 19 21 28 18 17 18 20Interest 9 13 14 11 14 13 12 11 11 10 11 12 11 11External factors 40 40 52 32 49 41 44 35 38 41 31 32 38 37Net margin -25 -33 -36 -24 -32 -29 -23 -26 -20 1 2 -16 -31 -23Net margin with coupled payments -26 -33 -37 -24 -33 -29 -23 -26 -20 1 2 -17 -31 -23
Family labour costs 76 54 59 59 66 62 57 65 59 71 71 73 54 70Own capital unpaid cost 13 8 11 8 10 9 9 14 10 19 10 10 7 13Imputed family factors 90 62 70 67 76 71 66 78 69 91 81 83 61 83Net economic margin -115 -96 -106 -91 -108 -99 -89 -104 -89 -89 -78 -99 -92 -106Net economic margin with coupled payments -115 -96 -107 -91 -109 -100 -90 -105 -89 -90 -78 -100 -92 -106
%spe.farms with positive net economic margin - - - - - - - - - - - - - 2%
%milk production with positive net economic margin
- - - - - - - - - - - - - 2%
Source: EU FADN DG AGRI, model of the allocation of costs for milk. 149
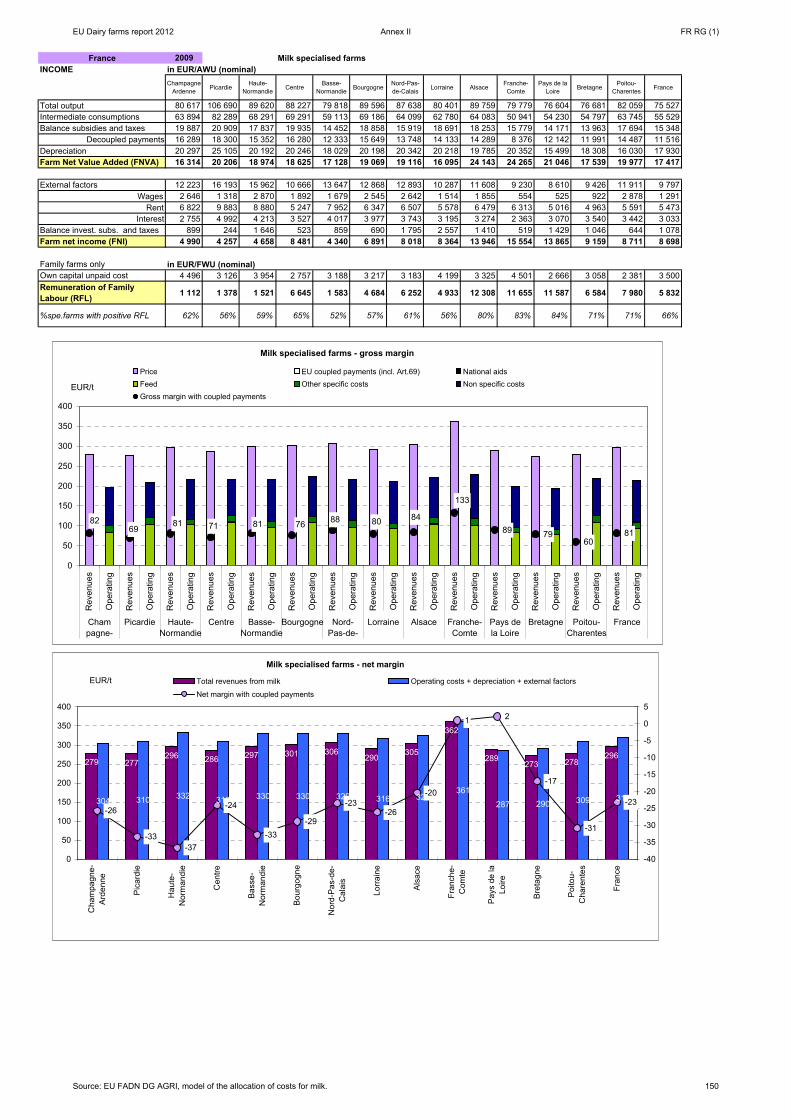
EU Dairy farms report 2012 Annex II FR RG (1)
France 2009 Milk specialised farmsINCOME in EUR/AWU (nominal)
Champagne-Ardenne Picardie
Haute-Normandie Centre
Basse-Normandie Bourgogne
Nord-Pas-de-Calais Lorraine Alsace
Franche-Comte
Pays de la Loire Bretagne
Poitou-Charentes France
Total output 80 617 106 690 89 620 88 227 79 818 89 596 87 638 80 401 89 759 79 779 76 604 76 681 82 059 75 527Intermediate consumptions 63 894 82 289 68 291 69 291 59 113 69 186 64 099 62 780 64 083 50 941 54 230 54 797 63 745 55 529Balance subsidies and taxes 19 887 20 909 17 837 19 935 14 452 18 858 15 919 18 691 18 253 15 779 14 171 13 963 17 694 15 348
Decoupled payments 16 289 18 300 15 352 16 280 12 333 15 649 13 748 14 133 14 289 8 376 12 142 11 991 14 487 11 516Depreciation 20 297 25 105 20 192 20 246 18 029 20 198 20 342 20 218 19 785 20 352 15 499 18 308 16 030 17 930Farm Net Value Added (FNVA) 16 314 20 206 18 974 18 625 17 128 19 069 19 116 16 095 24 143 24 265 21 046 17 539 19 977 17 417
External factors 12 223 16 193 15 962 10 666 13 647 12 868 12 893 10 287 11 608 9 230 8 610 9 426 11 911 9 797Wages 2 646 1 318 2 870 1 892 1 679 2 545 2 642 1 514 1 855 554 525 922 2 878 1 291
Rent 6 822 9 883 8 880 5 247 7 952 6 347 6 507 5 578 6 479 6 313 5 016 4 963 5 591 5 473Interest 2 755 4 992 4 213 3 527 4 017 3 977 3 743 3 195 3 274 2 363 3 070 3 540 3 442 3 033
Balance invest. subs. and taxes 899 244 1 646 523 859 690 1 795 2 557 1 410 519 1 429 1 046 644 1 078Farm net income (FNI) 4 990 4 257 4 658 8 481 4 340 6 891 8 018 8 364 13 946 15 554 13 865 9 159 8 711 8 698
Family farms only in EUR/FWU (nominal)Own capital unpaid cost 4 496 3 126 3 954 2 757 3 188 3 217 3 183 4 199 3 325 4 501 2 666 3 058 2 381 3 500Remuneration of Family Labour (RFL) 1 112 1 378 1 521 6 645 1 583 4 684 6 252 4 933 12 308 11 655 11 587 6 584 7 980 5 832
%spe.farms with positive RFL 62% 56% 59% 65% 52% 57% 61% 56% 80% 83% 84% 71% 71% 66%
Milk specialised farms - gross margin
89 7960
8182
6981 71 81 76 88 80 84
133
0
50
100
150
200
250
300
350
400
Rev
enue
s
Ope
ratin
g
Rev
enue
s
Ope
ratin
g
Rev
enue
s
Ope
ratin
g
Rev
enue
s
Ope
ratin
g
Rev
enue
s
Ope
ratin
g
Rev
enue
s
Ope
ratin
g
Rev
enue
s
Ope
ratin
g
Rev
enue
s
Ope
ratin
g
Rev
enue
s
Ope
ratin
g
Rev
enue
s
Ope
ratin
g
Rev
enue
s
Ope
ratin
g
Rev
enue
s
Ope
ratin
g
Rev
enue
s
Ope
ratin
g
Rev
enue
s
Ope
ratin
gChampagne-
Picardie Haute-Normandie
Centre Basse-Normandie
Bourgogne Nord-Pas-de-
Lorraine Alsace Franche-Comte
Pays dela Loire
Bretagne Poitou-Charentes
France
EUR/t
Price EU coupled payments (incl. Art.69) National aidsFeed Other specific costs Non specific costsGross margin with coupled payments
Milk specialised farms - net margin
279 277296 286 297 301 306
290305
362
289273 278
296
304 310 332 310 330 330 329 316 325361
287 290 309 319-26
-33-37
-24
-33-29
-23-26
-20
1 2
-17
-31
-23
0
50
100
150
200
250
300
350
400
Cha
mpa
gne-
Ard
enne
Pic
ardi
e
Hau
te-
Nor
man
die
Cen
tre
Bas
se-
Nor
man
die
Bou
rgog
ne
Nor
d-P
as-d
e-C
alai
s
Lorra
ine
Als
ace
Fran
che-
Com
te
Pay
s de
laLo
ire
Bre
tagn
e
Poi
tou-
Cha
rent
es
Fran
ce
EUR/t
-40
-35
-30
-25
-20
-15
-10
-5
0
5
Total revenues from milk Operating costs + depreciation + external factors
Net margin with coupled payments
Source: EU FADN DG AGRI, model of the allocation of costs for milk. 150
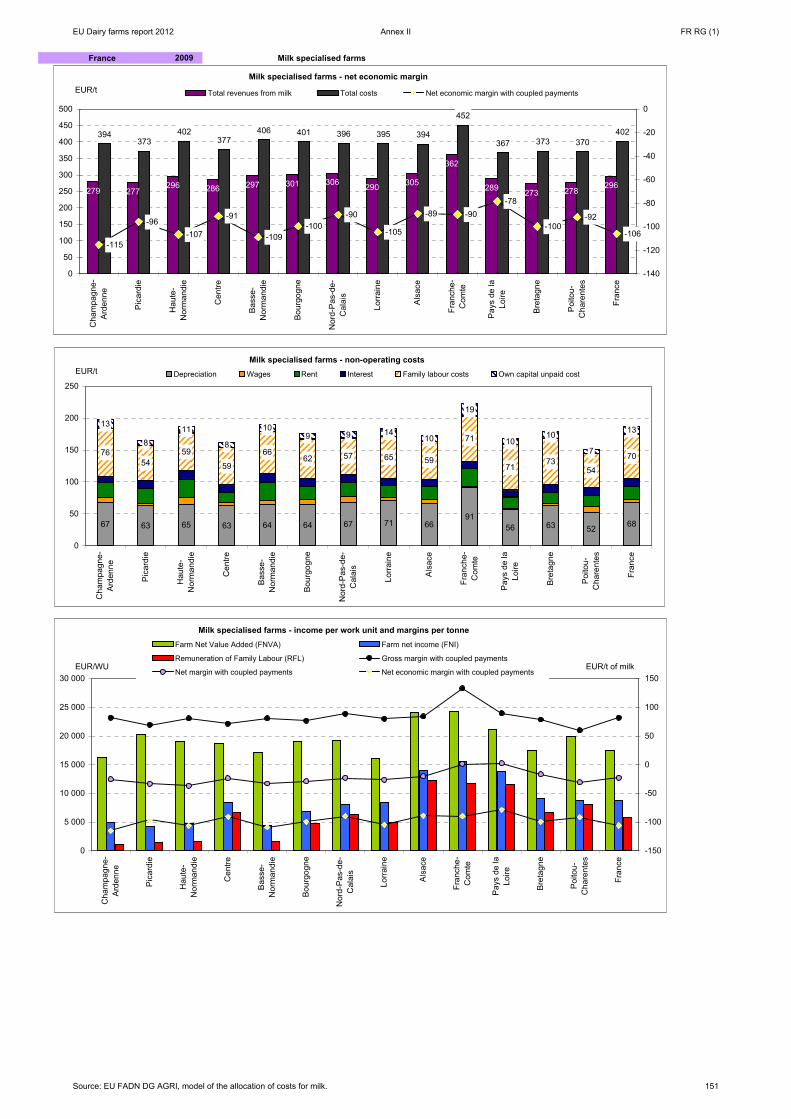
EU Dairy farms report 2012 Annex II FR RG (1)
France 2009 Milk specialised farms
Milk specialised farms - net economic margin
279 277296 286 297 301 306 290 305
362
289 273 278296
394373
402377
406 401 396 395 394
452
367 373 370402
-115
-96-107
-91
-109-100
-90
-105
-89 -90-78
-100-92
-106
0
50
100
150
200
250
300
350
400
450
500
Cha
mpa
gne-
Ard
enne
Pic
ardi
e
Hau
te-
Nor
man
die
Cen
tre
Bas
se-
Nor
man
die
Bou
rgog
ne
Nor
d-P
as-d
e-C
alai
s
Lorra
ine
Als
ace
Fran
che-
Com
te
Pay
s de
laLo
ire
Bre
tagn
e
Poi
tou-
Cha
rent
es
Fran
ce
EUR/t
-140
-120
-100
-80
-60
-40
-20
0
Total revenues from milk Total costs Net economic margin with coupled payments
Milk specialised farms - non-operating costs
67 63 65 63 64 64 67 71 6691
56 63 52 68
7654
59
59
6662 57 65 59
71
7173
54
70
13
811
8
109 9 14
10
19
1010
7
13
0
50
100
150
200
250
Cha
mpa
gne-
Ard
enne
Pic
ardi
e
Hau
te-
Nor
man
die
Cen
tre
Bas
se-
Nor
man
die
Bou
rgog
ne
Nor
d-P
as-d
e-C
alai
s
Lorra
ine
Als
ace
Fran
che-
Com
te
Pay
s de
laLo
ire
Bre
tagn
e
Poi
tou-
Cha
rent
es
Fran
ce
EUR/t Depreciation Wages Rent Interest Family labour costs Own capital unpaid cost
Milk specialised farms - income per work unit and margins per tonne
0
5 000
10 000
15 000
20 000
25 000
30 000
Cha
mpa
gne-
Ard
enne
Pic
ardi
e
Hau
te-
Nor
man
die
Cen
tre
Bas
se-
Nor
man
die
Bou
rgog
ne
Nor
d-P
as-d
e-C
alai
s
Lorra
ine
Als
ace
Fran
che-
Com
te
Pay
s de
laLo
ire
Bre
tagn
e
Poi
tou-
Cha
rent
es
Fran
ce
EUR/WU
-150
-100
-50
0
50
100
150EUR/t of milk
Farm Net Value Added (FNVA) Farm net income (FNI)
Remuneration of Family Labour (RFL) Gross margin with coupled payments
Net margin with coupled payments Net economic margin with coupled payments
Source: EU FADN DG AGRI, model of the allocation of costs for milk. 151

EU Dairy farms report 2012 Annex II FR RG (2)
France 2009 Milk specialised farms
e: estimate*: trend between the average of the first three available years and the average of the last available three yearsSTRUCTURAL INFORMATION
Aquitaine Midi-Pyrenees Limousin Rhones-Alpes Auvergne Languedoc-Roussillon France
Sample farms 42 41 20 97 104 16 1 214Farms represented 1 728 2 579 504 6 084 5 460 433 59 335% production from specialised farm 81% 86% 80% 86% 84% 90% 75%Forage area - ha 42 48 68 58 61 94 61Dairy cows - LU 45 46 46 37 40 33 47Rented UAA - % 85% 77% 68% 85% 80% 75% 89%Total labour - AWU 1,72 1,59 1,71 1,67 1,53 1,25 1,75Family labour - % 91% 97% 96% 93% 94% 94% 93%Milk per ha fodder area - t/ha 7,2 5,8 4,0 3,8 3,4 1,7 5,1Milk yield - kg/cow 6 708 6 081 5 826 5 851 5 203 4 859 6 501Milk production - t 302 278 270 219 208 158 308
MILK MARGINS in EUR/t of milk (nominal)
Aquitaine Midi-Pyrenees Limousin Rhones-Alpes Auvergne Languedoc-Roussillon France
RevenuesPrice 284 293 281 353 296 285 297EU coupled payments (incl. Art.69) 0 0 0 0 0 0 0National aids 0 0 0 0 0 0 0Total revenues from milk 284 293 281 353 296 285 296Production costs Feed 120 107 89 104 92 115 93
homegrown feed 38 43 33 40 29 45 36purchased feed 81 64 55 64 63 70 57
Herd renewal purchases 2 3 0 5 5 3 2Milk levy 0 0 0 0 0 0 0Other specific costs 20 14 15 17 16 17 13Specific costs 142 124 104 126 113 135 109Machinery and building upkeep 27 21 21 26 25 27 21Energy (fuel, electricity) 16 17 15 17 16 21 14Contract work 31 30 27 34 22 29 30Taxes 2 2 2 3 3 2 3Other direct inputs 37 37 34 51 44 37 38Non specific costs 112 107 100 131 110 115 106Total operating costs 254 231 203 257 223 250 215Gross margin 30 62 78 96 73 35 82Gross margin with coupled payments 30 62 78 96 73 35 81
%spe.farms with positive gross margin 76% 85% 100% 92% 88% - 94%
%milk production with positive gross margin 76% 86% 100% 96% 93% - 96%
Depreciation 66 68 62 89 85 98 68Wages 7 2 2 7 4 4 5Rent 16 17 12 18 18 18 20Interest 11 9 12 9 7 8 11External factors 34 28 26 34 29 31 37Net margin -70 -34 -10 -27 -41 -94 -23Net margin with coupled payments -70 -34 -10 -27 -41 -94 -23
Family labour costs 82 76 72 98 67 98 70Own capital unpaid cost 10 16 16 21 24 35 13Imputed family factors 92 92 88 119 90 133 83Net economic margin -162 -126 -98 -146 -131 -227 -106Net economic margin with coupled payments -162 -126 -99 -146 -131 -227 -106
%spe.farms with positive net economic margin - - - - - - 2%
%milk production with positive net economic margin - - - - - - 2%
Source: EU FADN DG AGRI, model of the allocation of costs for milk. 152
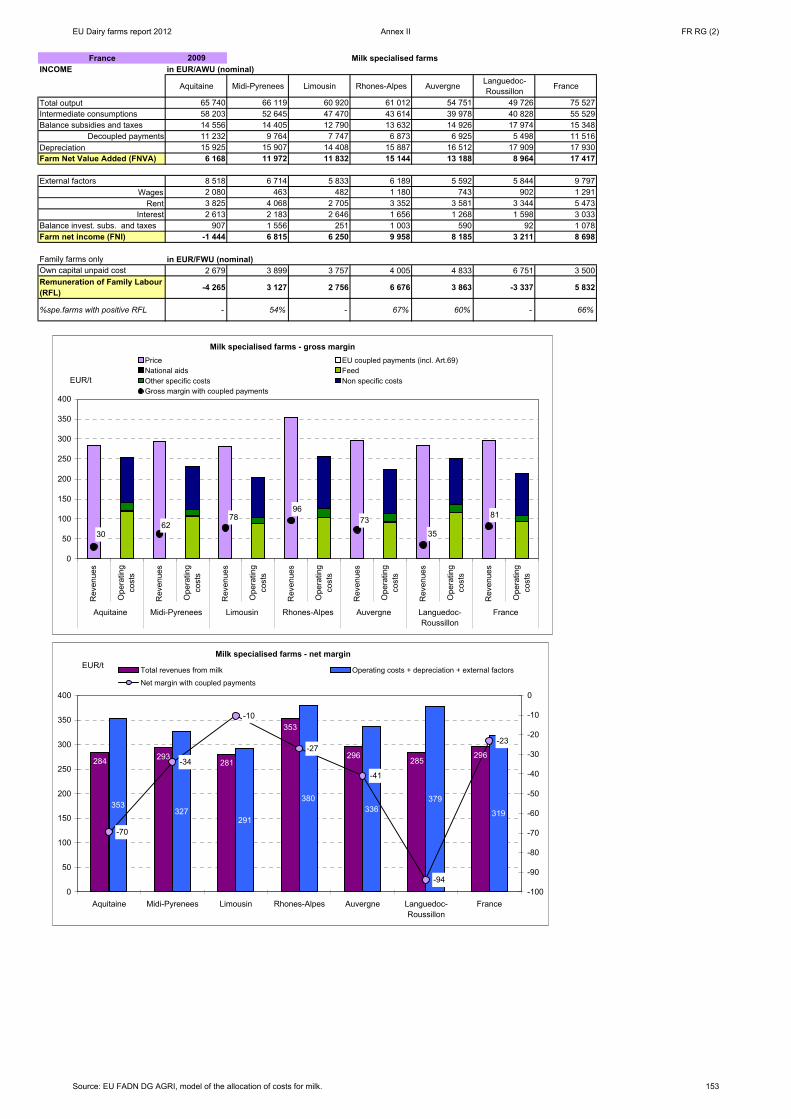
EU Dairy farms report 2012 Annex II FR RG (2)
France 2009 Milk specialised farmsINCOME in EUR/AWU (nominal)
Aquitaine Midi-Pyrenees Limousin Rhones-Alpes Auvergne Languedoc-Roussillon France
Total output 65 740 66 119 60 920 61 012 54 751 49 726 75 527Intermediate consumptions 58 203 52 645 47 470 43 614 39 978 40 828 55 529Balance subsidies and taxes 14 556 14 405 12 790 13 632 14 926 17 974 15 348
Decoupled payments 11 232 9 764 7 747 6 873 6 925 5 498 11 516Depreciation 15 925 15 907 14 408 15 887 16 512 17 909 17 930Farm Net Value Added (FNVA) 6 168 11 972 11 832 15 144 13 188 8 964 17 417
External factors 8 518 6 714 5 833 6 189 5 592 5 844 9 797Wages 2 080 463 482 1 180 743 902 1 291
Rent 3 825 4 068 2 705 3 352 3 581 3 344 5 473Interest 2 613 2 183 2 646 1 656 1 268 1 598 3 033
Balance invest. subs. and taxes 907 1 556 251 1 003 590 92 1 078Farm net income (FNI) -1 444 6 815 6 250 9 958 8 185 3 211 8 698
Family farms only in EUR/FWU (nominal)Own capital unpaid cost 2 679 3 899 3 757 4 005 4 833 6 751 3 500Remuneration of Family Labour (RFL) -4 265 3 127 2 756 6 676 3 863 -3 337 5 832
%spe.farms with positive RFL - 54% - 67% 60% - 66%
Milk specialised farms - gross margin
3062
7896
73
35
81
0
50
100
150
200
250
300
350
400
Rev
enue
s
Ope
ratin
gco
sts
Rev
enue
s
Ope
ratin
gco
sts
Rev
enue
s
Ope
ratin
gco
sts
Rev
enue
s
Ope
ratin
gco
sts
Rev
enue
s
Ope
ratin
gco
sts
Rev
enue
s
Ope
ratin
gco
sts
Rev
enue
s
Ope
ratin
gco
sts
Aquitaine Midi-Pyrenees Limousin Rhones-Alpes Auvergne Languedoc-Roussillon
France
EUR/t
Price EU coupled payments (incl. Art.69)National aids FeedOther specific costs Non specific costsGross margin with coupled payments
Milk specialised farms - net margin
284 293281
353
296285
296
353327
291
380336
379
319
-70
-34
-10
-27
-41
-94
-23
0
50
100
150
200
250
300
350
400
Aquitaine Midi-Pyrenees Limousin Rhones-Alpes Auvergne Languedoc-Roussillon
France
EUR/t
-100
-90
-80
-70
-60
-50
-40
-30
-20
-10
0
Total revenues from milk Operating costs + depreciation + external factors
Net margin with coupled payments
Source: EU FADN DG AGRI, model of the allocation of costs for milk. 153

EU Dairy farms report 2012 Annex II FR RG (2)
France 2009 Milk specialised farms
Milk specialised farms - net economic margin
284 293 281
353
296 285 296
446420
379
500
427
511
402
-162
-126
-99
-146-131
-227
-106
0
100
200
300
400
500
600
Aquitaine Midi-Pyrenees Limousin Rhones-Alpes Auvergne Languedoc-Roussillon
France
EUR/t
-250
-200
-150
-100
-50
0
Total revenues from milk Total costs Net economic margin with coupled payments
Milk specialised farms - non-operating costs
66 68 6289 85 98
68
82 7672
98
67
98
70
10 1616
21
24
35
13
0
50
100
150
200
250
300
Aquitaine Midi-Pyrenees Limousin Rhones-Alpes Auvergne Languedoc-Roussillon
France
EUR/t Depreciation Wages Rent Interest Family labour costs Own capital unpaid cost
Milk specialised farms - income per work unit and margins per tonne
-10 000
-5 000
0
5 000
10 000
15 000
20 000
Aquitaine Midi-Pyrenees Limousin Rhones-Alpes Auvergne Languedoc-Roussillon
France
EUR/WU
-250
-200
-150
-100
-50
0
50
100
150EUR/t of milk
Farm Net Value Added (FNVA) Farm net income (FNI)
Remuneration of Family Labour (RFL) Gross margin with coupled payments
Net margin with coupled payments Net economic margin with coupled payments
Source: EU FADN DG AGRI, model of the allocation of costs for milk. 154
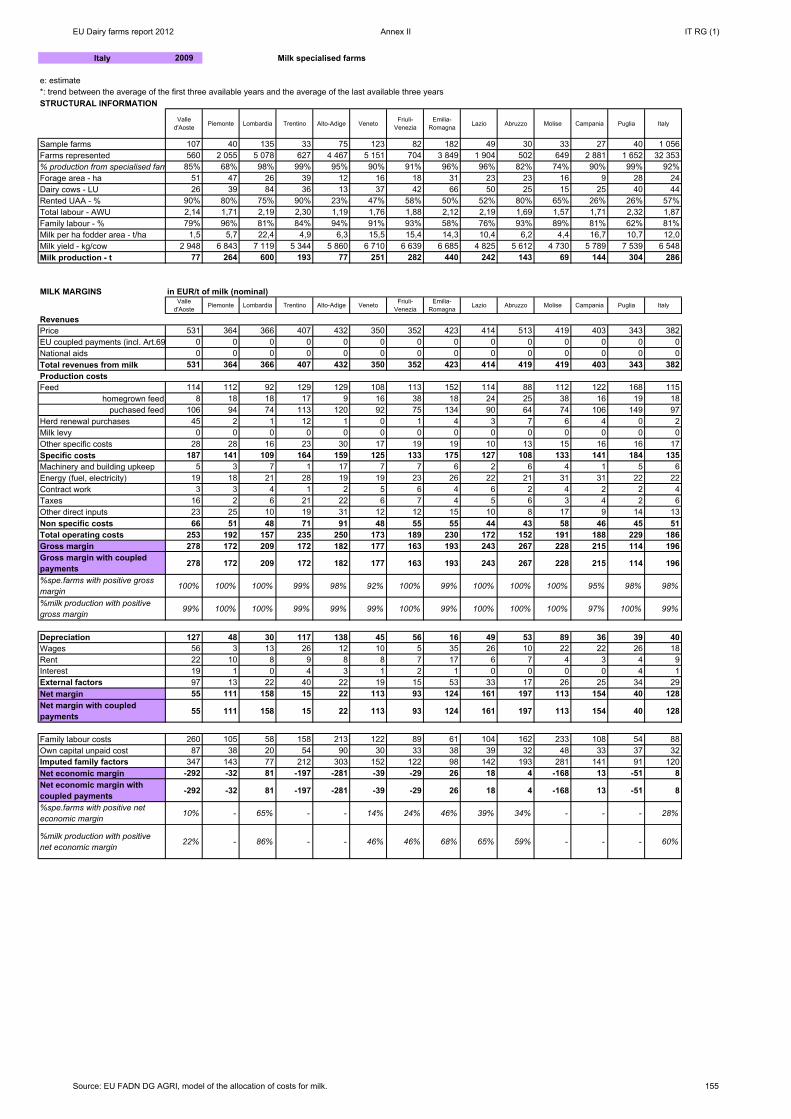
EU Dairy farms report 2012 Annex II IT RG (1)
Italy 2009 Milk specialised farms
e: estimate*: trend between the average of the first three available years and the average of the last available three yearsSTRUCTURAL INFORMATION
Valle d'Aoste Piemonte Lombardia Trentino Alto-Adige Veneto
Friuli-Venezia
Emilia-Romagna Lazio Abruzzo Molise Campania Puglia Italy
Sample farms 107 40 135 33 75 123 82 182 49 30 33 27 40 1 056Farms represented 560 2 055 5 078 627 4 467 5 151 704 3 849 1 904 502 649 2 881 1 652 32 353% production from specialised farm 85% 68% 98% 99% 95% 90% 91% 96% 96% 82% 74% 90% 99% 92%Forage area - ha 51 47 26 39 12 16 18 31 23 23 16 9 28 24Dairy cows - LU 26 39 84 36 13 37 42 66 50 25 15 25 40 44Rented UAA - % 90% 80% 75% 90% 23% 47% 58% 50% 52% 80% 65% 26% 26% 57%Total labour - AWU 2,14 1,71 2,19 2,30 1,19 1,76 1,88 2,12 2,19 1,69 1,57 1,71 2,32 1,87Family labour - % 79% 96% 81% 84% 94% 91% 93% 58% 76% 93% 89% 81% 62% 81%Milk per ha fodder area - t/ha 1,5 5,7 22,4 4,9 6,3 15,5 15,4 14,3 10,4 6,2 4,4 16,7 10,7 12,0Milk yield - kg/cow 2 948 6 843 7 119 5 344 5 860 6 710 6 639 6 685 4 825 5 612 4 730 5 789 7 539 6 548Milk production - t 77 264 600 193 77 251 282 440 242 143 69 144 304 286
MILK MARGINS in EUR/t of milk (nominal)Valle
d'AostePiemonte Lombardia Trentino Alto-Adige Veneto Friuli-
VeneziaEmilia-
RomagnaLazio Abruzzo Molise Campania Puglia Italy
RevenuesPrice 531 364 366 407 432 350 352 423 414 513 419 403 343 382EU coupled payments (incl. Art.69 0 0 0 0 0 0 0 0 0 0 0 0 0 0National aids 0 0 0 0 0 0 0 0 0 0 0 0 0 0Total revenues from milk 531 364 366 407 432 350 352 423 414 419 419 403 343 382Production costs Feed 114 112 92 129 129 108 113 152 114 88 112 122 168 115
homegrown feed 8 18 18 17 9 16 38 18 24 25 38 16 19 18puchased feed 106 94 74 113 120 92 75 134 90 64 74 106 149 97
Herd renewal purchases 45 2 1 12 1 0 1 4 3 7 6 4 0 2Milk levy 0 0 0 0 0 0 0 0 0 0 0 0 0 0Other specific costs 28 28 16 23 30 17 19 19 10 13 15 16 16 17Specific costs 187 141 109 164 159 125 133 175 127 108 133 141 184 135Machinery and building upkeep 5 3 7 1 17 7 7 6 2 6 4 1 5 6Energy (fuel, electricity) 19 18 21 28 19 19 23 26 22 21 31 31 22 22Contract work 3 3 4 1 2 5 6 4 6 2 4 2 2 4Taxes 16 2 6 21 22 6 7 4 5 6 3 4 2 6Other direct inputs 23 25 10 19 31 12 12 15 10 8 17 9 14 13Non specific costs 66 51 48 71 91 48 55 55 44 43 58 46 45 51Total operating costs 253 192 157 235 250 173 189 230 172 152 191 188 229 186Gross margin 278 172 209 172 182 177 163 193 243 267 228 215 114 196Gross margin with coupled payments 278 172 209 172 182 177 163 193 243 267 228 215 114 196
%spe.farms with positive gross margin 100% 100% 100% 99% 98% 92% 100% 99% 100% 100% 100% 95% 98% 98%
%milk production with positive gross margin 99% 100% 100% 99% 99% 99% 100% 99% 100% 100% 100% 97% 100% 99%
Depreciation 127 48 30 117 138 45 56 16 49 53 89 36 39 40Wages 56 3 13 26 12 10 5 35 26 10 22 22 26 18Rent 22 10 8 9 8 8 7 17 6 7 4 3 4 9Interest 19 1 0 4 3 1 2 1 0 0 0 0 4 1External factors 97 13 22 40 22 19 15 53 33 17 26 25 34 29Net margin 55 111 158 15 22 113 93 124 161 197 113 154 40 128Net margin with coupled payments 55 111 158 15 22 113 93 124 161 197 113 154 40 128
Family labour costs 260 105 58 158 213 122 89 61 104 162 233 108 54 88Own capital unpaid cost 87 38 20 54 90 30 33 38 39 32 48 33 37 32Imputed family factors 347 143 77 212 303 152 122 98 142 193 281 141 91 120Net economic margin -292 -32 81 -197 -281 -39 -29 26 18 4 -168 13 -51 8Net economic margin with coupled payments -292 -32 81 -197 -281 -39 -29 26 18 4 -168 13 -51 8
%spe.farms with positive net economic margin 10% - 65% - - 14% 24% 46% 39% 34% - - - 28%
%milk production with positive net economic margin
22% - 86% - - 46% 46% 68% 65% 59% - - - 60%
Source: EU FADN DG AGRI, model of the allocation of costs for milk. 155

EU Dairy farms report 2012 Annex II IT RG (1)
Italy 2009 Milk specialised farmsINCOME in EUR/AWU (nominal)
Valle d'Aoste
Piemonte Lombardia Trentino Alto-Adige Veneto Friuli-Venezia
Emilia-Romagna
Lazio Abruzzo Molise Campania Puglia Italy
Total output 27 854 79 242 139 073 48 654 40 098 70 113 83 609 128 420 63 577 54 906 30 253 46 170 63 570 83 025Intermediate consumptions 13 448 43 301 62 485 28 309 24 681 36 409 45 804 70 123 31 598 22 000 14 503 24 234 42 349 42 541Balance subsidies and taxes 9 296 8 244 12 158 6 721 5 213 6 031 7 952 10 995 3 695 5 411 4 991 2 911 6 387 7 565
Decoupled payments 1 366 5 956 11 867 2 384 1 985 4 951 8 165 9 524 4 032 3 952 2 825 2 527 4 941 6 260Depreciation 6 454 9 652 10 411 12 126 10 755 8 312 12 257 4 374 6 591 6 012 5 759 4 067 6 678 7 790Farm Net Value Added (FNVA) 17 248 34 534 78 335 14 940 9 876 31 424 33 501 64 919 29 083 32 305 14 982 20 780 20 930 40 258
External factors 4 746 2 696 7 466 4 100 1 664 3 378 3 099 14 975 4 434 1 808 1 527 2 468 5 642 5 676Wages 2 831 671 4 522 2 615 863 1 907 1 049 9 676 3 496 1 060 1 211 2 146 4 277 3 585
Rent 1 096 1 927 2 891 978 575 1 353 1 596 4 915 899 746 317 322 620 1 897Interest 819 98 53 506 226 118 454 384 40 2 0 0 745 194
Balance invest. subs. and taxes 1 926 -200 -286 -305 1 784 827 -757 -1 0 -110 -27 0 1 809 345Farm net income (FNI) 14 427 31 638 70 583 10 536 9 996 28 874 29 645 49 943 24 649 30 387 13 428 18 312 17 097 34 928
Family farms only in EUR/FWU (nominal)Own capital unpaid cost 5 525 7 678 8 345 6 637 7 480 5 983 7 744 18 579 6 904 3 818 3 527 4 535 10 116 7 968Remuneration of Family Labour (RFL) 12 652 25 128 78 343 5 849 3 143 25 803 24 128 68 037 25 452 28 744 11 522 17 992 17 568 35 248
%spe.farms with positive RFL 79% 84% 96% 69% 66% 91% 88% 92% 83% 100% 95% 91% 82% 86%
Milk specialised farms - gross margin
228 215
114
196
278
172209
172 182 177 163193
243 267
0
100
200
300
400
500
600
Rev
enue
s
Ope
ratin
g
Rev
enue
s
Ope
ratin
g
Rev
enue
s
Ope
ratin
g
Rev
enue
s
Ope
ratin
g
Rev
enue
s
Ope
ratin
g
Rev
enue
s
Ope
ratin
g
Rev
enue
s
Ope
ratin
g
Rev
enue
s
Ope
ratin
g
Rev
enue
s
Ope
ratin
g
Rev
enue
s
Ope
ratin
g
Rev
enue
s
Ope
ratin
g
Rev
enue
s
Ope
ratin
g
Rev
enue
s
Ope
ratin
g
Rev
enue
s
Ope
ratin
g
Valled'Aoste
Piemonte Lombardia Trentino Alto-Adige
Veneto Friuli-Venezia
Emilia-Romagna
Lazio Abruzzo Molise Campania Puglia Italy
EUR/t
Price EU coupled payments (incl. Art.69) National aidsFeed Other specific costs Non specific costsGross margin with coupled payments
Milk specialised farms - net margin
531
364 366407
432
350 352
423 414 419 419 403
343382
476
253208
392 410
237 259 299254 222
307249
30325455
111
158
15 22
11393
124
161
197
113
154
40
128
0
100
200
300
400
500
600
Val
le d
'Aos
te
Pie
mon
te
Lom
bard
ia
Tren
tino
Alto
-Adi
ge
Ven
eto
Friu
li-V
enez
ia
Em
ilia-
Rom
agna
Lazi
o
Abr
uzzo
Mol
ise
Cam
pani
a
Pug
lia
Italy
EUR/t
0
50
100
150
200
250
Total revenues from milk Operating costs + depreciation + external factors
Net margin with coupled payments
Source: EU FADN DG AGRI, model of the allocation of costs for milk. 156

EU Dairy farms report 2012 Annex II IT RG (1)
Italy 2009 Milk specialised farms
Milk specialised farms - net economic margin
531
364 366407 432
350 352423 414 419 419 403
343382
823
396
286
604
713
389 381 397 396 415
588
390 394 374
-292
-32
81
-197
-281
-39 -29
26 18 4
-168
13
-51
8
0
100
200
300
400
500
600
700
800
900V
alle
d'A
oste
Pie
mon
te
Lom
bard
ia
Tren
tino
Alto
-Adi
ge
Ven
eto
Friu
li-V
enez
ia
Em
ilia-
Rom
agna
Lazi
o
Abr
uzzo
Mol
ise
Cam
pani
a
Pug
lia
Italy
EUR/t
-350
-300
-250
-200
-150
-100
-50
0
50
100
Total revenues from milk Total costs Net economic margin with coupled payments
Milk specialised farms - non-operating costs
12748 30
117 13845 56 16 49 53 89
36 39 40
260
10558
158213
122 89 61104 162
233
108 54 88
87
38
20
54
90
3033
38
3932
48
3337
32
0
100
200
300
400
500
600
Val
le d
'Aos
te
Pie
mon
te
Lom
bard
ia
Tren
tino
Alto
-Adi
ge
Ven
eto
Friu
li-V
enez
ia
Em
ilia-
Rom
agna
Lazi
o
Abr
uzzo
Mol
ise
Cam
pani
a
Pug
lia
Italy
EUR/t Depreciation Wages Rent Interest Family labour costs Own capital unpaid cost
Milk specialised farms - income per work unit and margins per tonne
0
10 000
20 000
30 000
40 000
50 000
60 000
70 000
80 000
90 000
Val
le d
'Aos
te
Pie
mon
te
Lom
bard
ia
Tren
tino
Alto
-Adi
ge
Ven
eto
Friu
li-V
enez
ia
Em
ilia-
Rom
agna
Lazi
o
Abr
uzzo
Mol
ise
Cam
pani
a
Pug
lia
Italy
EUR/WU
-400
-300
-200
-100
0
100
200
300
400EUR/t of milk
Farm Net Value Added (FNVA) Farm net income (FNI)
Remuneration of Family Labour (RFL) Gross margin with coupled payments
Net margin with coupled payments Net economic margin with coupled payments
Source: EU FADN DG AGRI, model of the allocation of costs for milk. 157

EU Dairy farms report 2012 Annex II IT RG (2)
Italy 2009 Milk specialised farms
e: estimate*: trend between the average of the first three available years and the average of the last available three yearsSTRUCTURAL INFORMATION
Basilicata Sicilia Sardegna Italy
Sample farms 25 19 15 1 056Farms represented 540 622 502 32 353% production from specialised farms 80% 74% 99% 92%Forage area - ha 17 42 38 24Dairy cows - LU 20 37 48 44Rented UAA - % 38% 58% 32% 57%Total labour - AWU 1,54 2,42 2,54 1,87Family labour - % 86% 79% 83% 81%Milk per ha fodder area - t/ha 5,9 4,4 10,0 12,0Milk yield - kg/cow 5 212 5 047 7 913 6 548Milk production - t 102 186 382 286
MILK MARGINS in EUR/t of milk (nominal)Basilicata Sicilia Sardegna Italy
RevenuesPrice 387 402 355 382EU coupled payments (incl. Art.69) 0 0 0 0National aids 0 0 0 0Total revenues from milk 387 402 355 382Production costs Feed 124 93 76 115
homegrown feed 20 34 23 18puchased feed 104 59 52 97
Herd renewal purchases 1 0 0 2Milk levy 0 0 0 0Other specific costs 11 7 18 17Specific costs 136 100 94 135Machinery and building upkeep 5 3 3 6Energy (fuel, electricity) 27 29 18 22Contract work 3 2 6 4Taxes 1 3 1 6Other direct inputs 9 5 14 13Non specific costs 45 41 42 51Total operating costs 181 141 137 186Gross margin 206 261 218 196Gross margin with coupled payments 206 261 218 196
%spe.farms with positive gross margin 100% 100% 100% 98%
%milk production with positive gross margin 100% 100% 100% 99%
Depreciation 71 44 31 40Wages 16 27 13 18Rent 4 18 9 9Interest 0 0 0 1External factors 20 45 22 29Net margin 115 172 165 128Net margin with coupled payments 115 172 165 128
Family labour costs 120 135 91 88Own capital unpaid cost 40 34 27 32Imputed family factors 161 170 118 120Net economic margin -46 2 48 8Net economic margin with coupled payments -46 2 48 8
%spe.farms with positive net economic margin - - - 28%
%milk production with positive net economic margin - - - 60%
Source: EU FADN DG AGRI, model of the allocation of costs for milk. 158

EU Dairy farms report 2012 Annex II IT RG (2)
Italy 2009 Milk specialised farmsINCOME in EUR/AWU (nominal)
Basilicata Sicilia Sardegna ItalyTotal output 38 941 48 040 74 635 83 025Intermediate consumptions 19 740 21 127 39 598 42 541Balance subsidies and taxes 4 138 3 214 7 205 7 565
Decoupled payments 3 723 3 059 6 759 6 260Depreciation 6 588 4 385 5 269 7 790Farm Net Value Added (FNVA) 16 752 25 741 36 974 40 258
External factors 1 777 4 680 3 834 5 676Wages 1 422 2 768 2 385 3 585
Rent 354 1 912 1 441 1 897Interest 0 0 8 194
Balance invest. subs. and taxes 0 0 0 345Farm net income (FNI) 14 975 21 062 33 139 34 928
Family farms only in EUR/FWU (nominal)Own capital unpaid cost 4 285 4 339 5 545 7 968Remuneration of Family Labour (RFL) 13 043 22 301 34 364 35 248
%spe.farms with positive RFL 65% 100% - 86%
Milk specialised farms - gross margin
206261
218 196
0
50
100
150
200
250
300
350
400
450
Revenues Operatingcosts
Revenues Operatingcosts
Revenues Operatingcosts
Revenues Operatingcosts
Basilicata Sicilia Sardegna Italy
EUR/t
Price EU coupled payments (incl. Art.69)
National aids Feed
Other specific costs Non specific costs
Gross margin with coupled payments
Milk specialised farms - net margin
387 402
355382
272230
190254
115
172 165
128
0
50
100
150
200
250
300
350
400
450
Basilicata Sicilia Sardegna Italy
EUR/t
0
20
40
60
80
100
120
140
160
180
200
Total revenues from milk Operating costs + depreciation + external factors
Net margin with coupled payments
Source: EU FADN DG AGRI, model of the allocation of costs for milk. 159
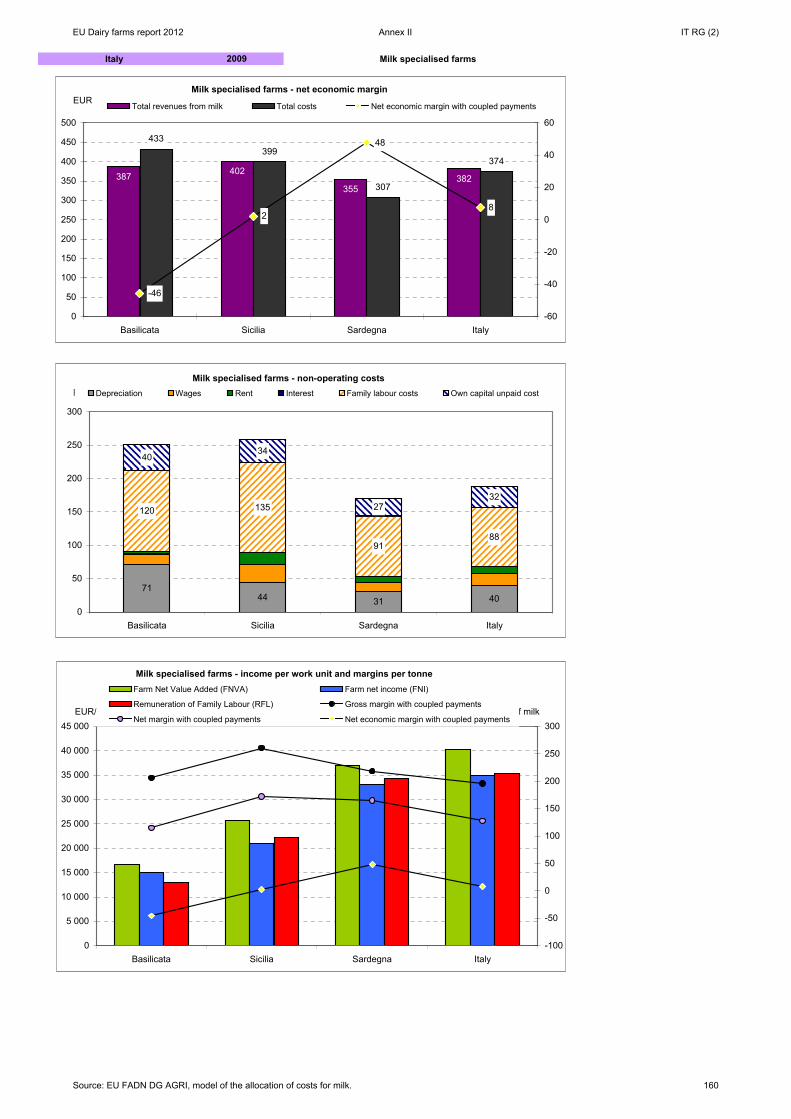
EU Dairy farms report 2012 Annex II IT RG (2)
Italy 2009 Milk specialised farms
Milk specialised farms - net economic margin
387 402
355382
433399
307
374
-46
2
48
8
0
50
100
150
200
250
300
350
400
450
500
Basilicata Sicilia Sardegna Italy
EUR/t
-60
-40
-20
0
20
40
60
Total revenues from milk Total costs Net economic margin with coupled payments
Milk specialised farms - non-operating costs
7144 31 40
120 135
9188
4034
2732
0
50
100
150
200
250
300
Basilicata Sicilia Sardegna Italy
EUR/tDepreciation Wages Rent Interest Family labour costs Own capital unpaid cost
Milk specialised farms - income per work unit and margins per tonne
0
5 000
10 000
15 000
20 000
25 000
30 000
35 000
40 000
45 000
Basilicata Sicilia Sardegna Italy
EUR/WU
-100
-50
0
50
100
150
200
250
300EUR/t of milk
Farm Net Value Added (FNVA) Farm net income (FNI)
Remuneration of Family Labour (RFL) Gross margin with coupled payments
Net margin with coupled payments Net economic margin with coupled payments
Source: EU FADN DG AGRI, model of the allocation of costs for milk. 160

EU Dairy farms report 2012 Annex II PT RG
Portugal 2009 Milk specialised farms
e: estimate*: trend between the average of the first three available years and the average of the last available three yearsSTRUCTURAL INFORMATION
Norte e Centro Acores Portugal
Sample farms 221 110 351Farms represented 4 413 2 570 7 185% production from specialised farms 99% 97% 98%Forage area - ha 10 22 15Dairy cows - LU 25 23 25Rented UAA - % 20% 65% 39%Total labour - AWU 1,86 1,26 1,65Family labour - % 84% 95% 86%Milk per ha fodder area - t/ha 19,2 6,2 11,8Milk yield - kg/cow 7 575 6 114 7 052Milk production - t 192 139 179
MILK MARGINS in EUR/t of milk (nominal)Norte e Centro Acores Portugal
RevenuesPrice 293 246 281EU coupled payments (incl. Art.69) 0 33 9National aids 0 26 7Total revenues from milk 293 305 298Production costs Feed 128 83 118
homegrown feed 20 25 20puchased feed 108 58 98
Herd renewal purchases 5 2 4Milk levy 0 0 0Other specific costs 29 11 23Specific costs 162 97 145Machinery and building upkeep 15 8 13Energy (fuel, electricity) 19 11 17Contract work 4 6 5Taxes 2 0 1Other direct inputs 8 4 7Non specific costs 48 30 42Total operating costs 210 126 187Gross margin 84 119 94Gross margin with coupled payments 84 179 110
%spe.farms with positive gross margin 86% 100% 91%
%milk production with positive gross margin 98% 100% 99%
Depreciation 30 18 26Wages 11 2 9Rent 2 14 5Interest 3 1 3External factors 16 17 17Net margin 38 84 51Net margin with coupled payments 38 144 68
Family labour costs 51 63 52Own capital unpaid cost 21 15 19Imputed family factors 72 78 72Net economic margin -34 7 -20Net economic margin with coupled payments -34 66 -4
%spe.farms with positive net economic margin 18% 42% 27%
%milk production with positive net economic margin 34% 63% 44%
Source: EU FADN DG AGRI, model of the allocation of costs for milk. 161

EU Dairy farms report 2012 Annex II PT RG
Portugal 2009 Milk specialised farmsINCOME in EUR/AWU (nominal)
Norte e Centro Acores PortugalTotal output 40 144 32 751 39 228Intermediate consumptions 30 770 18 563 28 305Balance subsidies and taxes 4 472 11 358 6 463
Decoupled payments 4 206 0 3 163Depreciation 3 503 2 414 3 263Farm Net Value Added (FNVA) 10 343 23 133 14 123
External factors 1 840 2 370 2 047Wages 1 198 297 1 027
Rent 276 1 876 704Interest 366 197 317
Balance invest. subs. and taxes 151 307 190Farm net income (FNI) 8 654 21 069 12 265
Family farms only in EUR/FWU (nominal)Own capital unpaid cost 2 981 2 076 2 881Remuneration of Family Labour (RFL) 7 317 20 115 11 351
%spe.farms with positive RFL 80% 100% 88%
Milk specialised farms - gross margin
84
179
110
0
50
100
150
200
250
300
350
Revenues Operating costs Revenues Operating costs Revenues Operating costs
Norte e Centro Acores Portugal
EUR/t
Price EU coupled payments (incl. Art.69)National aids FeedOther specific costs Non specific costsGross margin with coupled payments
Milk specialised farms - net margin
293305 298
256
161
230
38
144
68
0
50
100
150
200
250
300
350
Norte e Centro Acores Portugal
EUR/t
0
20
40
60
80
100
120
140
160
Total revenues from milkOperating costs + depreciation + external factorsNet margin with coupled payments
Source: EU FADN DG AGRI, model of the allocation of costs for milk. 162
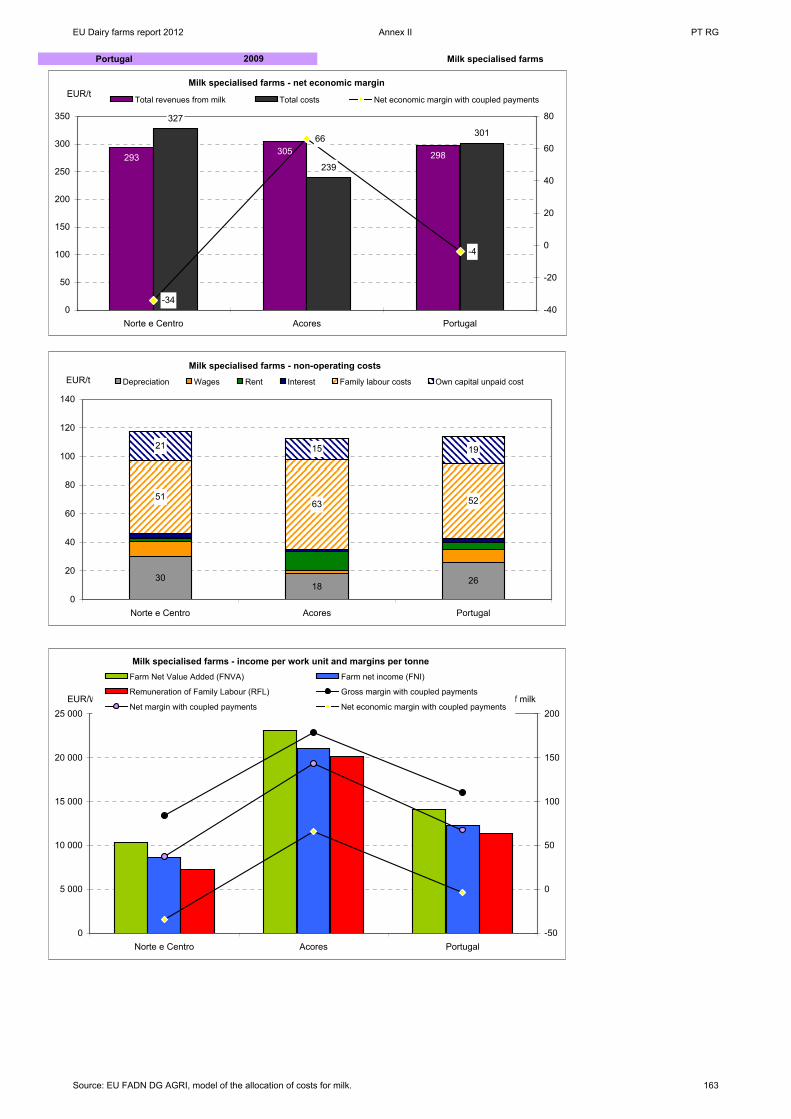
EU Dairy farms report 2012 Annex II PT RG
Portugal 2009 Milk specialised farms
Milk specialised farms - net economic margin
293305 298
327
239
301
-34
66
-4
0
50
100
150
200
250
300
350
Norte e Centro Acores Portugal
EUR/t
-40
-20
0
20
40
60
80
Total revenues from milk Total costs Net economic margin with coupled payments
Milk specialised farms - non-operating costs
3018 26
5163 52
21 15 19
0
20
40
60
80
100
120
140
Norte e Centro Acores Portugal
EUR/t Depreciation Wages Rent Interest Family labour costs Own capital unpaid cost
Milk specialised farms - income per work unit and margins per tonne
0
5 000
10 000
15 000
20 000
25 000
Norte e Centro Acores Portugal
EUR/WU
-50
0
50
100
150
200EUR/t of milk
Farm Net Value Added (FNVA) Farm net income (FNI)
Remuneration of Family Labour (RFL) Gross margin with coupled payments
Net margin with coupled payments Net economic margin with coupled payments
Source: EU FADN DG AGRI, model of the allocation of costs for milk. 163

EU Dairy farms report 2012 Annex II FI RG
Finland 2009 Milk specialised farms
e: estimate*: trend between the average of the first three available years and the average of the last available three yearsSTRUCTURAL INFORMATION
Etela-Suomi Sisa-Suomi Pohjanmaa Pohjois-Suomi Finland
Sample farms 87 101 103 84 375Farms represented 3 301 4 663 2 588 2 209 12 761% production from specialised farms 99% 99% 100% 99% 99%Forage area - ha 28 28 29 41 31Dairy cows - LU 25 23 27 26 25Rented UAA - % 33% 36% 33% 34% 34%Total labour - AWU 2,16 1,90 1,95 2,12 2,01Family labour - % 90% 91% 94% 87% 91%Milk per ha fodder area - t/ha 7,9 6,9 7,2 5,5 6,9Milk yield - kg/cow 8 686 8 562 7 965 8 466 8 447Milk production - t 221 194 212 223 210
MILK MARGINS in EUR/t of milk (nominal)Etela-Suomi Sisa-Suomi Pohjanmaa Pohjois-Suomi Finland
RevenuesPrice 387 390 393 397 391EU coupled payments (incl. Art.69) 0 0 0 0 0National aids 40 79 78 127 77Total revenues from milk 428 469 471 524 468Production costs Feed 104 118 115 134 116
homegrown feed 38 38 38 38 38puchased feed 65 80 77 97 78
Herd renewal purchases 2 2 6 6 4Milk levy 0 0 0 0 0Other specific costs 36 35 31 33 34Specific costs 141 155 151 173 154Machinery and building upkeep 47 41 43 49 44Energy (fuel, electricity) 28 28 28 36 29Contract work 28 30 28 29 29Taxes 0 0 0 0 0Other direct inputs 45 50 49 57 50Non specific costs 148 150 148 170 153Total operating costs 289 305 299 344 306Gross margin 98 86 94 53 85Gross margin with coupled payments 138 165 172 180 162
%spe.farms with positive gross margin 86% 95% 90% 94% 91%
%milk production with positive gross margin 92% 97% 97% 95% 95%
Depreciation 98 97 117 120 106Wages 16 15 9 21 15Rent 11 11 14 7 11Interest 12 11 18 18 14External factors 39 37 40 46 40Net margin -39 -49 -63 -114 -61Net margin with coupled payments 1 30 15 14 16
Family labour costs 205 240 204 189 214Own capital unpaid cost 30 36 35 21 32Imputed family factors 236 277 240 209 245Net economic margin -275 -325 -303 -323 -306Net economic margin with coupled payments -235 -246 -225 -196 -229
%spe.farms with positive net economic margin - - - - -
%milk production with positive net economic margin - - - - -
Source: EU FADN DG AGRI, model of the allocation of costs for milk. 164

EU Dairy farms report 2012 Annex II FI RG
Finland 2009 Milk specialised farmsINCOME in EUR/AWU (nominal)
Etela-Suomi Sisa-Suomi Pohjanmaa Pohjois-Suomi FinlandTotal output 48 454 47 151 51 801 49 239 48 938Intermediate consumptions 38 983 38 950 41 799 45 477 40 817Balance subsidies and taxes 23 468 25 185 28 546 33 531 26 961
Decoupled payments 6 864 5 588 6 260 5 961 6 158Depreciation 12 356 11 679 15 693 15 094 13 312Farm Net Value Added (FNVA) 20 584 21 707 22 856 22 199 21 770
External factors 5 069 4 499 5 504 5 817 5 108Wages 2 085 1 880 1 295 2 652 1 968
Rent 1 477 1 314 1 874 882 1 394Interest 1 507 1 305 2 336 2 283 1 746
Balance invest. subs. and taxes 549 371 886 670 578Farm net income (FNI) 16 064 17 580 18 237 17 052 17 239
Family farms only in EUR/FWU (nominal)Own capital unpaid cost 4 340 4 778 5 089 3 031 4 418Remuneration of Family Labour (RFL) 13 557 14 607 14 341 16 552 14 605
%spe.farms with positive RFL 85% 94% 89% 86% 89%
Milk specialised farms - gross margin
138 165 172 180162
0
100
200
300
400
500
600
Rev
enue
s
Ope
ratin
gco
sts
Rev
enue
s
Ope
ratin
gco
sts
Rev
enue
s
Ope
ratin
gco
sts
Rev
enue
s
Ope
ratin
gco
sts
Rev
enue
s
Ope
ratin
gco
sts
Etela-Suomi Sisa-Suomi Pohjanmaa Pohjois-Suomi Finland
EUR/t
Price EU coupled payments (incl. Art.69)
National aids Feed
Other specific costs Non specific costs
Gross margin with coupled payments
Milk specialised farms - net margin
428469 471
524
468
426 439 456511
452
1
30
15 1416
0
100
200
300
400
500
600
Etela-Suomi Sisa-Suomi Pohjanmaa Pohjois-Suomi Finland
EUR/t
0
5
10
15
20
25
30
35
Total revenues from milk Operating costs + depreciation + external factors
Net margin with coupled payments
Source: EU FADN DG AGRI, model of the allocation of costs for milk. 165

EU Dairy farms report 2012 Annex II FI RG
Finland 2009 Milk specialised farms
Milk specialised farms - net economic margin
428469 471
524468
662715 696 720 698
-235-246
-225
-196
-229
0
100
200
300
400
500
600
700
800
Etela-Suomi Sisa-Suomi Pohjanmaa Pohjois-Suomi Finland
EUR/t
-300
-250
-200
-150
-100
-50
0
Total revenues from milk Total costs Net economic margin with coupled payments
Milk specialised farms - non-operating costs
98 97 117 120 106
205240 204 189 214
30
36 3521 32
0
50
100
150
200
250
300
350
400
450
Etela-Suomi Sisa-Suomi Pohjanmaa Pohjois-Suomi Finland
EUR/t Depreciation Wages Rent Interest Family labour costs Own capital unpaid cost
Milk specialised farms - income per work unit and margins per tonne
0
5 000
10 000
15 000
20 000
25 000
Etela-Suomi Sisa-Suomi Pohjanmaa Pohjois-Suomi Finland
EUR/WU
-300
-250
-200
-150
-100
-50
0
50
100
150
200
250EUR/t of milk
Farm Net Value Added (FNVA) Farm net income (FNI)
Remuneration of Family Labour (RFL) Gross margin with coupled payments
Net margin with coupled payments Net economic margin with coupled payments
Source: EU FADN DG AGRI, model of the allocation of costs for milk. 166
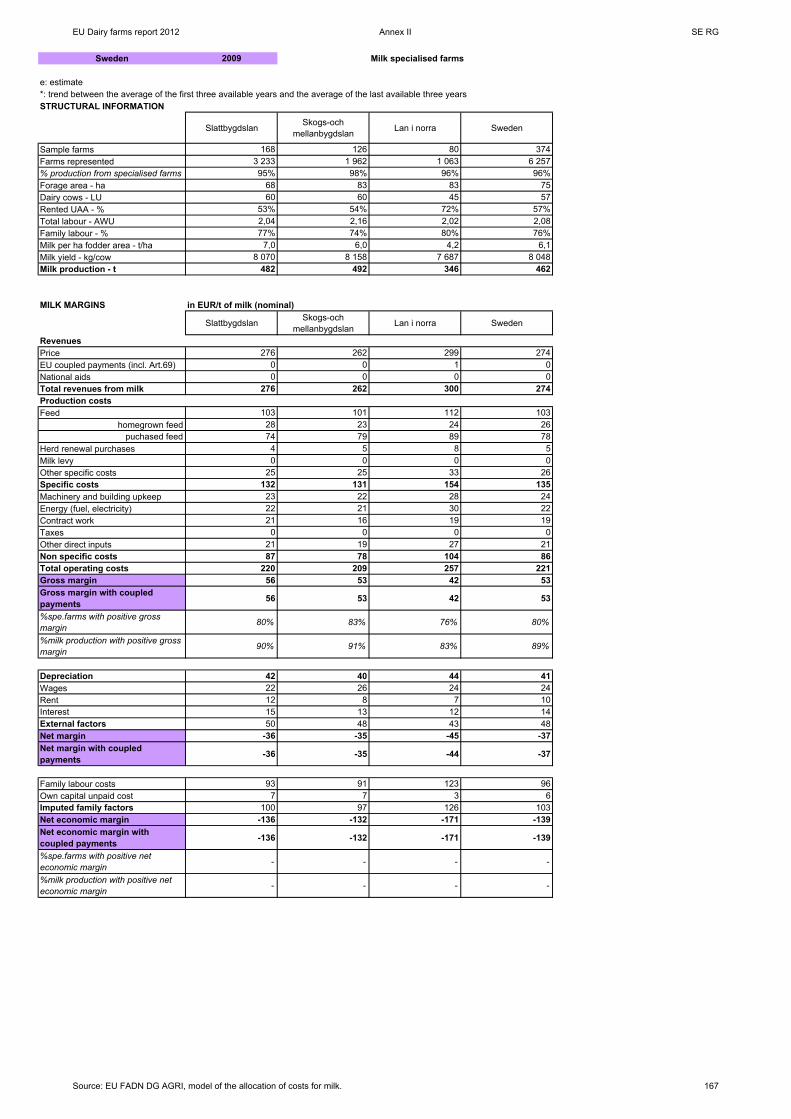
EU Dairy farms report 2012 Annex II SE RG
Sweden 2009 Milk specialised farms
e: estimate*: trend between the average of the first three available years and the average of the last available three yearsSTRUCTURAL INFORMATION
Slattbygdslan Skogs-och mellanbygdslan Lan i norra Sweden
Sample farms 168 126 80 374Farms represented 3 233 1 962 1 063 6 257% production from specialised farms 95% 98% 96% 96%Forage area - ha 68 83 83 75Dairy cows - LU 60 60 45 57Rented UAA - % 53% 54% 72% 57%Total labour - AWU 2,04 2,16 2,02 2,08Family labour - % 77% 74% 80% 76%Milk per ha fodder area - t/ha 7,0 6,0 4,2 6,1Milk yield - kg/cow 8 070 8 158 7 687 8 048Milk production - t 482 492 346 462
MILK MARGINS in EUR/t of milk (nominal)
Slattbygdslan Skogs-och mellanbygdslan Lan i norra Sweden
RevenuesPrice 276 262 299 274EU coupled payments (incl. Art.69) 0 0 1 0National aids 0 0 0 0Total revenues from milk 276 262 300 274Production costs Feed 103 101 112 103
homegrown feed 28 23 24 26puchased feed 74 79 89 78
Herd renewal purchases 4 5 8 5Milk levy 0 0 0 0Other specific costs 25 25 33 26Specific costs 132 131 154 135Machinery and building upkeep 23 22 28 24Energy (fuel, electricity) 22 21 30 22Contract work 21 16 19 19Taxes 0 0 0 0Other direct inputs 21 19 27 21Non specific costs 87 78 104 86Total operating costs 220 209 257 221Gross margin 56 53 42 53Gross margin with coupled payments 56 53 42 53
%spe.farms with positive gross margin 80% 83% 76% 80%
%milk production with positive gross margin 90% 91% 83% 89%
Depreciation 42 40 44 41Wages 22 26 24 24Rent 12 8 7 10Interest 15 13 12 14External factors 50 48 43 48Net margin -36 -35 -45 -37Net margin with coupled payments -36 -35 -44 -37
Family labour costs 93 91 123 96Own capital unpaid cost 7 7 3 6Imputed family factors 100 97 126 103Net economic margin -136 -132 -171 -139Net economic margin with coupled payments -136 -132 -171 -139
%spe.farms with positive net economic margin - - - -
%milk production with positive net economic margin - - - -
Source: EU FADN DG AGRI, model of the allocation of costs for milk. 167

EU Dairy farms report 2012 Annex II SE RG
Sweden 2009 Milk specialised farmsINCOME in EUR/AWU (nominal)
Slattbygdslan Skogs-och mellanbygdslan Lan i norra Sweden
Total output 98 017 90 573 75 389 91 589Intermediate consumptions 82 408 77 655 72 398 78 981Balance subsidies and taxes 19 669 19 270 33 611 21 784
Decoupled payments 12 560 10 953 10 178 11 609Depreciation 13 372 12 131 10 749 12 498Farm Net Value Added (FNVA) 21 906 20 058 25 853 21 895
External factors 16 228 14 230 11 048 14 678Wages 7 250 7 704 6 301 7 221
Rent 4 039 2 496 1 822 3 160Interest 4 939 4 030 2 926 4 297
Balance invest. subs. and taxes 0 0 2 226 367Farm net income (FNI) 5 678 5 828 17 031 7 584
Family farms only in EUR/FWU (nominal)Own capital unpaid cost 2 957 3 040 1 020 2 653Remuneration of Family Labour (RFL) 4 362 4 821 20 382 7 250
%spe.farms with positive RFL 62% 69% 86% 68%
Milk specialised farms - gross margin
56 53 4253
0
50
100
150
200
250
300
350
Revenues Operatingcosts
Revenues Operatingcosts
Revenues Operatingcosts
Revenues Operatingcosts
Slattbygdslan Skogs-ochmellanbygdslan
Lan i norra Sweden
EUR/t
Non specific costsOther specific costsFeedNational aidsEU coupled payments (incl. Art.69)PriceGross margin with coupled payments
Milk specialised farms - net margin
276262
300274
312 297344
311
-36 -35
-44
-37
0
50
100
150
200
250
300
350
400
Slattbygdslan Skogs-och mellanbygdslan Lan i norra Sweden
EUR/t
-50
-45
-40
-35
-30
-25
-20
-15
-10
-5
0
Total revenues from milk Operating costs + depreciation + external factors
Net margin with coupled payments
Source: EU FADN DG AGRI, model of the allocation of costs for milk. 168

EU Dairy farms report 2012 Annex II SE RG
Sweden 2009 Milk specialised farms
Milk specialised farms - net economic margin
276 262300
274
412394
470
413
-136 -132
-171
-139
0
50
100
150
200
250
300
350
400
450
500
Slattbygdslan Skogs-och mellanbygdslan Lan i norra Sweden
EUR/t
-180
-160
-140
-120
-100
-80
-60
-40
-20
0
Total revenues from milk Total costs Net economic margin with coupled payments
Milk specialised farms - non-operating costs
42 40 44 41
93 91123
96
7 7
3
6
0
50
100
150
200
250
Slattbygdslan Skogs-och mellanbygdslan Lan i norra Sweden
EUR/tDepreciation Wages Rent Interest Family labour costs Own capital unpaid cost
Milk specialised farms - income per work unit and margins per tonne
0
5 000
10 000
15 000
20 000
25 000
30 000
Slattbygdslan Skogs-och mellanbygdslan Lan i norra Sweden
EUR/WU
-200
-150
-100
-50
0
50
100EUR/t of milk
Farm Net Value Added (FNVA) Farm net income (FNI)
Remuneration of Family Labour (RFL) Gross margin with coupled payments
Net margin with coupled payments Net economic margin with coupled payments
Source: EU FADN DG AGRI, model of the allocation of costs for milk. 169

EU Dairy farms report 2012 Annex II UK RG
United Kingdom 2009 Milk specialised farms
e: estimate*: trend between the average of the first three available years and the average of the last available three yearsSTRUCTURAL INFORMATION
England-North England-East England-West Wales Scotland Northern Ireland United Kingdom
Sample farms 89 68 137 89 44 110 537Farms represented 3 030 1 287 4 456 2 036 1 302 3 405 15 517% production from specialised farms 97% 90% 96% 100% 98% 98% 97%Forage area - ha 107 108 105 96 137 71 100Dairy cows - LU 130 127 127 111 139 86 117Rented UAA - % 57% 55% 49% 28% 26% 37% 45%Total labour - AWU 2,75 3,18 2,89 2,23 2,83 1,80 2,56Family labour - % 57% 46% 56% 77% 63% 89% 63%Milk per ha fodder area - t/ha 9,1 8,9 8,8 7,7 7,2 7,7 8,4Milk yield - kg/cow 7 526 7 583 7 296 6 658 7 108 6 317 7 116Milk production - t 977 964 926 738 991 545 836
MILK MARGINS in EUR/t of milk (nominal)England-North England-East England-West Wales Scotland Northern Ireland United Kingdom
RevenuesPrice 260 276 284 246 263 227 263EU coupled payments (incl. Art.69) 0 0 0 0 0 0 0National aids 0 0 0 0 0 0 0Total revenues from milk 260 276 284 246 263 227 263Production costs Feed 95 99 92 85 106 99 95
homegrown feed 20 23 22 22 25 21 22puchased feed 75 75 70 63 81 79 73
Herd renewal purchases 3 3 3 1 1 1 2Milk levy 0 0 0 0 0 0 0Other specific costs 35 31 30 28 25 21 29Specific costs 133 133 125 114 132 120 126Machinery and building upkeep 14 18 17 15 17 13 16Energy (fuel, electricity) 11 13 12 13 13 14 13Contract work 15 18 17 13 9 12 15Taxes 0 0 0 0 0 0 0Other direct inputs 13 18 15 12 12 11 14Non specific costs 54 68 62 54 51 51 57Total operating costs 187 201 187 168 184 171 183Gross margin 73 75 97 79 80 56 80Gross margin with coupled payments 73 75 97 79 80 56 80
%spe.farms with positive gross margin 91% 87% 98% 98% 93% 93% 94%
%milk production with positive gross margin 96% 96% 100% 99% 97% 97% 98%
Depreciation 23 24 24 26 33 40 27Wages 22 31 24 12 19 6 20Rent 8 11 9 5 3 9 8Interest 3 7 5 6 3 6 5External factors 33 48 38 24 25 21 32Net margin 17 4 35 29 22 -5 20Net margin with coupled payments 17 4 35 29 22 -5 20
Family labour costs 30 30 35 41 36 56 37Own capital unpaid cost 8 8 9 13 10 14 10Imputed family factors 37 37 44 54 46 70 47Net economic margin -20 -34 -9 -24 -24 -75 -27Net economic margin with coupled payments -20 -34 -9 -24 -24 -75 -27
%spe.farms with positive net economic margin 25% 18% 31% 18% - - 19%
%milk production with positive net economic margin 38% 27% 46% 29% - - 32%
Source: EU FADN DG AGRI, model of the allocation of costs for milk. 170

EU Dairy farms report 2012 Annex II UK RG
United Kingdom 2009 Milk specialised farmsINCOME in EUR/AWU (nominal)
England-North England-East England-West Wales Scotland Northern Ireland United KingdomTotal output 122 976 125 243 125 338 115 174 130 569 96 900 119 565Intermediate consumptions 92 309 94 286 87 687 85 804 95 121 77 494 88 096Balance subsidies and taxes 11 791 14 718 14 023 17 784 17 771 12 582 14 159
Decoupled payments 10 375 12 684 11 185 14 818 16 677 12 081 12 214Depreciation 10 320 9 861 10 137 11 003 15 904 14 612 11 455Farm Net Value Added (FNVA) 32 138 35 815 41 537 36 150 37 315 17 376 34 173
External factors 14 527 20 170 15 775 10 151 12 199 7 724 13 724Wages 9 708 12 863 10 036 5 110 9 320 2 204 8 404
Rent 3 359 4 814 3 573 2 234 1 362 3 404 3 266Interest 1 460 2 493 2 166 2 807 1 516 2 116 2 054
Balance invest. subs. and taxes 434 0 264 57 784 7 425 1 401Farm net income (FNI) 18 044 15 645 26 026 26 057 25 899 17 076 21 851
Family farms only in EUR/FWU (nominal)Own capital unpaid cost 6 239 7 267 6 718 7 365 7 864 6 173 6 727Remuneration of Family Labour (RFL) 25 444 27 033 39 908 26 391 33 258 13 033 27 868
%spe.farms with positive RFL 85% 73% 87% 83% 80% 79% 82%
Milk specialised farms - gross margin
73 7597
79 8056
80
0
50
100
150
200
250
300
Rev
enue
s
Ope
ratin
gco
sts
Rev
enue
s
Ope
ratin
gco
sts
Rev
enue
s
Ope
ratin
gco
sts
Rev
enue
s
Ope
ratin
gco
sts
Rev
enue
s
Ope
ratin
gco
sts
Rev
enue
s
Ope
ratin
gco
sts
Rev
enue
s
Ope
ratin
gco
sts
England-North England-East England-West Wales Scotland Northern Ireland United Kingdom
EUR/t
Price EU coupled payments (incl. Art.69) National aids
Feed Other specific costs Non specific costs
Gross margin with coupled payments
Milk specialised farms - net margin
260276 284
246263
227
263
243272
249217
241 232 243
17
4
35
29
22
-5
20
0
50
100
150
200
250
300
England-North England-East England-West Wales Scotland Northern Ireland United Kingdom
EUR/t
-10
-5
0
5
10
15
20
25
30
35
40
Total revenues from milk Operating costs + depreciation + external factors
Net margin with coupled payments
Source: EU FADN DG AGRI, model of the allocation of costs for milk. 171

EU Dairy farms report 2012 Annex II UK RG
United Kingdom 2009 Milk specialised farms
Milk specialised farms - net economic margin
260276 284
246263
227
263
280
310293
271287
302290
-20
-34
-9
-24 -24
-75
-27
0
50
100
150
200
250
300
350
England-North England-East England-West Wales Scotland Northern Ireland United Kingdom
EUR/t
-80
-70
-60
-50
-40
-30
-20
-10
0
Total revenues from milk Total costs Net economic margin with coupled payments
Milk specialised farms - non-operating costs
23 24 24 26 33 4027
30
3035
4136
56
37
8
8 913 10
14
10
0
20
40
60
80
100
120
140
England-North England-East England-West Wales Scotland Northern Ireland United Kingdom
EUR/t Depreciation Wages Rent Interest Family labour costs Own capital unpaid cost
Milk specialised farms - income per work unit and margins per tonne
0
5 000
10 000
15 000
20 000
25 000
30 000
35 000
40 000
45 000
England-North England-East England-West Wales Scotland Northern Ireland United Kingdom
EUR/WU
-100
-80
-60
-40
-20
0
20
40
60
80
100
120EUR/t of milk
Farm Net Value Added (FNVA) Farm net income (FNI)
Remuneration of Family Labour (RFL) Gross margin with coupled payments
Net margin with coupled payments Net economic margin with coupled payments
Source: EU FADN DG AGRI, model of the allocation of costs for milk. 172

EU Dairy farms report 2012 Annex II HU RG
Hungary Milk specialised farms
e: estimate*: trend between the average of the first three available years and the average of the last available three yearsSTRUCTURAL INFORMATION
Eszak-Alfold Del-Alfold Hungary
Sample farms 20 20 93Farms represented 530 717 3 539% production from specialised farms 45% 81% 49%Forage area - ha 49 33 42Dairy cows - LU 47 36 37Rented UAA - % 72% 76% 72%Total labour - AWU 3,82 3,31 3,16Family labour - % 29% 30% 34%Milk per ha fodder area - t/ha 5,2 7,2 5,8Milk yield - kg/cow 6 254 6 713 6 645Milk production - t 294 240 248
MILK MARGINSEszak-Alfold Del-Alfold Hungary
RevenuesPrice 231 214 235EU coupled payments (incl. Art.69) 0 0 0National aids 2 0 0Total revenues from milk 233 214 235Production costs Feed 113 104 113
homegrown feed 33 27 33purchased feed 80 78 81
Herd renewal purchases 0 0 0Milk levy 0 0 0Other specific costs 16 15 15Specific costs 129 120 128Machinery and building upkeep 9 9 12Energy (fuel, electricity) 32 29 28Contract work 5 11 13Taxes 1 2 2Other direct inputs 14 21 25Non specific costs 61 73 79Total operating costs 190 192 207Gross margin 40 21 28Gross margin with coupled payments 42 21 28
%spe.farms with positive gross margin 87% - 70%
%milk production with positive gross margin 88% - 77%
Depreciation 24 18 23Wages 40 46 42Rent 8 9 10Interest 8 4 9External factors 56 59 61Net margin -40 -56 -57Net margin with coupled payments -38 -56 -56
Family labour costs 17 18 21Own capital unpaid cost 17 14 15Imputed family factors 34 32 36Net economic margin -74 -88 -93Net economic margin with coupled payments -72 -88 -93
%spe.farms with positive net economic margin - - -
%milk production with positive net economic margin - - -
Source: EU FADN DG AGRI, model of the allocation of costs for milk. 173

EU Dairy farms report 2012 Annex II HU RG
Hungary Milk specialised farmsINCOME
Eszak-Alfold Del-Alfold HungaryTotal output 30 161 29 643 34 004Intermediate consumptions 24 890 24 157 29 001Balance subsidies and taxes 8 279 6 152 7 944
Decoupled payments 3 920 2 765 3 787Depreciation 3 021 2 157 3 014Farm Net Value Added (FNVA) 10 530 9 482 9 934
External factors 6 843 7 284 7 655Wages 4 838 5 740 5 126
Rent 1 052 1 020 1 320Interest 952 523 1 209
Balance invest. subs. and taxes 763 1 059 769Farm net income (FNI) 4 450 3 257 3 048
Family farms onlyOwn capital unpaid cost 7 282 5 452 5 659Remuneration of Family Labour (RFL) 4 139 787 7 052
%spe.farms with positive RFL - - 69%
Milk specialised farms - gross margin
42
2128
0
50
100
150
200
250
Revenues Operating costs Revenues Operating costs Revenues Operating costs
Eszak-Alfold Del-Alfold Hungary
EUR/t
Price EU coupled payments (incl. Art.69)
National aids Feed
Other specific costs Non specific costs
Gross margin with coupled payments
Milk specialised farms - net margin
233214
235
270 292-38
-56 -560
50
100
150
200
250
300
350
Eszak-Alfold Del-Alfold Hungary
EUR/t
-60
-50
-40
-30
-20
-10
0
Total revenues from milk Operating costs + depreciation + external factors
Net margin with coupled payments
Source: EU FADN DG AGRI, model of the allocation of costs for milk. 174
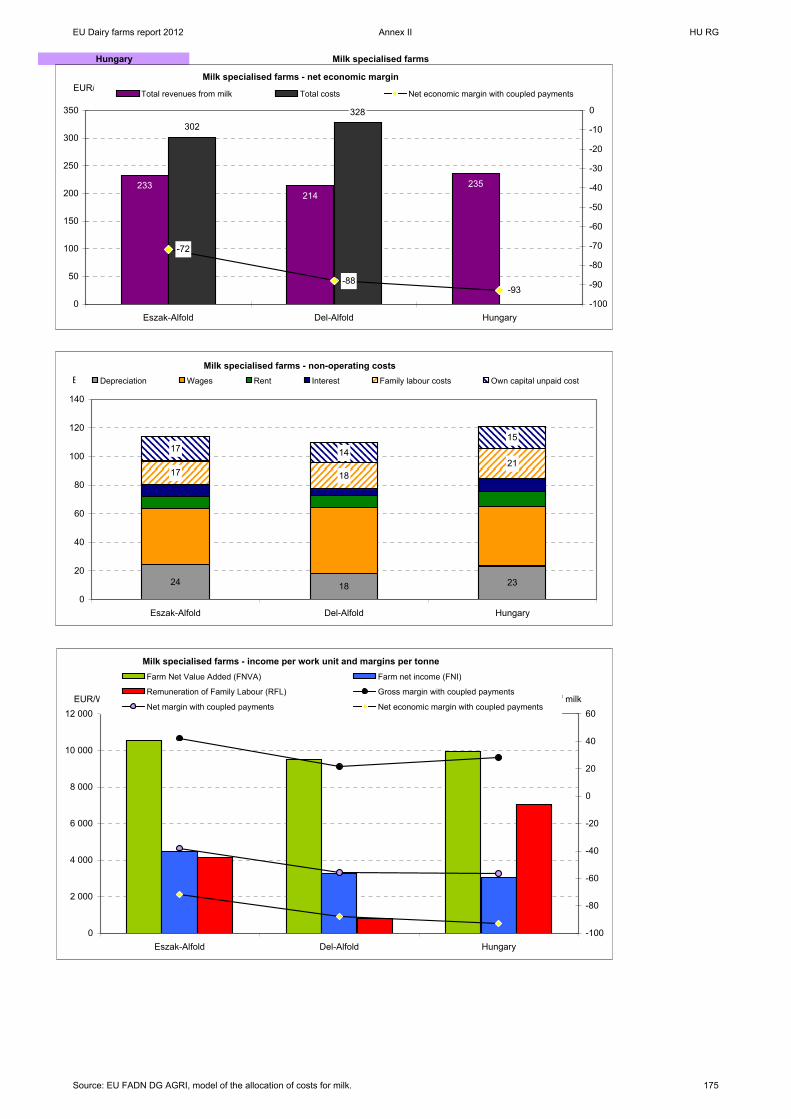
EU Dairy farms report 2012 Annex II HU RG
Hungary Milk specialised farms
Milk specialised farms - net economic margin
233214
235
302328
-72
-88-93
0
50
100
150
200
250
300
350
Eszak-Alfold Del-Alfold Hungary
EUR/t
-100
-90
-80
-70
-60
-50
-40
-30
-20
-10
0
Total revenues from milk Total costs Net economic margin with coupled payments
Milk specialised farms - non-operating costs
24 18 23
17 1821
17 14
15
0
20
40
60
80
100
120
140
Eszak-Alfold Del-Alfold Hungary
EUR/t Depreciation Wages Rent Interest Family labour costs Own capital unpaid cost
Milk specialised farms - income per work unit and margins per tonne
0
2 000
4 000
6 000
8 000
10 000
12 000
Eszak-Alfold Del-Alfold Hungary
EUR/WU
-100
-80
-60
-40
-20
0
20
40
60EUR/t of milk
Farm Net Value Added (FNVA) Farm net income (FNI)
Remuneration of Family Labour (RFL) Gross margin with coupled payments
Net margin with coupled payments Net economic margin with coupled payments
Source: EU FADN DG AGRI, model of the allocation of costs for milk. 175

EU Dairy farms report 2012 Annex II PL RG
Poland 2009 Milk specialised farms
e: estimate*: trend between the average of the first three available years and the average of the last available three yearsSTRUCTURAL INFORMATION
Pomorze and Mazury
Wielkopolska and Slask
Mazowsze and Podlasie
Malopolska and Pogorze Poland
Sample farms 338 429 1 237 202 2 206Farms represented 8 539 9 822 55 223 10 266 83 850% production from specialised farms 95% 95% 63% 63% 69%Forage area - ha 22 16 12 9 13Dairy cows - LU 20 21 14 9 15Rented UAA - % 27% 39% 26% 32% 29%Total labour - AWU 2,01 2,15 1,83 1,72 1,87Family labour - % 91% 81% 98% 98% 95%Milk per ha fodder area - t/ha 5,0 8,0 6,4 4,5 6,2Milk yield - kg/cow 5 482 6 297 5 148 4 592 5 340Milk production - t 109 131 74 40 80
MILK MARGINS in EUR/t of milk (nominal)Pomorze and
MazuryWielkopolska and
SlaskMazowsze and
PodlasieMalopolska and
Pogorze Poland
RevenuesPrice 200 213 208 203 207EU coupled payments (incl. Art.69) 0 0 0 0 0National aids 0 0 0 0 0Total revenues from milk 200 213 208 203 207Production costs Feed 58 78 67 67 68
homegrown feed 36 40 41 50 41purchased feed 22 39 25 17 27
Herd renewal purchases 1 2 3 2 2Milk levy 0 0 0 0 0Other specific costs 11 13 10 11 11Specific costs 70 93 79 80 80Machinery and building upkeep 13 11 13 15 13Energy (fuel, electricity) 20 20 18 23 19Contract work 7 8 6 5 6Taxes 0 0 0 0 0Other direct inputs 10 10 7 11 8Non specific costs 50 50 44 54 47Total operating costs 120 143 123 135 127Gross margin 80 71 85 69 80Gross margin with coupled payments 80 71 85 69 80
%spe.farms with positive gross margin 89% 93% 90% 84% 89%
%milk production with positive gross margin 95% 98% 97% 92% 97%
Depreciation 36 33 42 49 40Wages 8 13 1 3 5Rent 2 3 2 2 2Interest 4 3 3 3 3External factors 13 19 7 8 10Net margin 31 18 36 11 30Net margin with coupled payments 31 18 36 11 30
Family labour costs 78 51 71 115 71Own capital unpaid cost 15 17 23 23 20Imputed family factors 93 68 93 138 91Net economic margin -61 -49 -57 -127 -61Net economic margin with coupled payments -61 -49 -57 -127 -61
%spe.farms with positive net economic margin 7% 12% 11% 4% 10%
%milk production with positive net economic margin 23% 29% 29% 16% 27%
Source: EU FADN DG AGRI, model of the allocation of costs for milk. 176

EU Dairy farms report 2012 Annex II PL RG
Poland 2009 Milk specialised farmsINCOME in EUR/AWU (nominal)
Pomorze and Mazury
Wielkopolska and Slask
Mazowsze and Podlasie
Malopolska and Pogorze Poland
Total output 16 017 20 583 11 967 7 126 13 041Intermediate consumptions 10 194 14 538 7 663 4 897 8 564Balance subsidies and taxes 3 890 3 711 2 751 2 158 2 941
Decoupled payments 1 974 1 772 1 283 932 1 387Depreciation 2 773 3 074 2 346 1 645 2 415Farm Net Value Added (FNVA) 6 939 6 682 4 709 2 741 5 003
External factors 996 1 896 379 259 638Wages 575 1 380 64 86 300
Rent 128 259 137 76 146Interest 294 257 178 96 193
Balance invest. subs. and taxes -104 53 -2 71 3Farm net income (FNI) 5 839 4 839 4 328 2 553 4 368
Family farms only in EUR/FWU (nominal)Own capital unpaid cost 1 241 1 882 1 287 762 1 292Remuneration of Family Labour (RFL) 5 254 4 597 3 113 1 816 3 357
%spe.farms with positive RFL 89% 84% 79% 76% 80%
Milk specialised farms - gross margin
8071
8569 80
0
50
100
150
200
250
Rev
enue
s
Ope
ratin
gco
sts
Rev
enue
s
Ope
ratin
gco
sts
Rev
enue
s
Ope
ratin
gco
sts
Rev
enue
s
Ope
ratin
gco
sts
Rev
enue
s
Ope
ratin
gco
sts
Pomorze and Mazury Wielkopolska andSlask
Mazowsze andPodlasie
Malopolska andPogorze
Poland
EUR/t
Non specific costsOther specific costsFeedNational aidsEU coupled payments (incl. Art.69)PriceGross margin with coupled payments
Milk specialised farms - net margin
200213 208 203 207
169195
172192 177
31
18
36
11
30
0
50
100
150
200
250
Pomorze and Mazury Wielkopolska andSlask
Mazowsze andPodlasie
Malopolska andPogorze
Poland
EUR/t
0
5
10
15
20
25
30
35
40
Total revenues from milk Operating costs + depreciation + external factors
Net margin with coupled payments
Source: EU FADN DG AGRI, model of the allocation of costs for milk. 177

EU Dairy farms report 2012 Annex II PL RG
Poland 2009 Milk specialised farms
Milk specialised farms - net economic margin
200213 208 203 207
261 263 265
330
268
-61
-49-57
-127
-61
0
50
100
150
200
250
300
350
Pomorze and Mazury Wielkopolska andSlask
Mazowsze andPodlasie
Malopolska andPogorze
Poland
EUR/t
-140
-120
-100
-80
-60
-40
-20
0
Total revenues from milk Total costs Net economic margin with coupled payments
Milk specialised farms - non-operating costs
36 33 42 49 40
7851 71
115
71
15
1723
23
20
0
50
100
150
200
250
Pomorze and Mazury Wielkopolska andSlask
Mazowsze andPodlasie
Malopolska andPogorze
Poland
EUR/t Depreciation Wages Rent Interest Family labour costs Own capital unpaid cost
Milk specialised farms - income per work unit and margins per tonne
0
1 000
2 000
3 000
4 000
5 000
6 000
7 000
8 000
Pomorze and Mazury Wielkopolska andSlask
Mazowsze andPodlasie
Malopolska andPogorze
Poland
EUR/WU
-150
-100
-50
0
50
100EUR/t of milk
Farm Net Value Added (FNVA) Farm net income (FNI)
Remuneration of Family Labour (RFL) Gross margin with coupled payments
Net margin with coupled payments Net economic margin with coupled payments
Source: EU FADN DG AGRI, model of the allocation of costs for milk. 178

EU Dairy farms report 2012 Annex II BG RG
Bulgaria 2009 Milk specialised farms
e: estimate*: trend between the average of the first three available years and the average of the last available three yearsSTRUCTURAL INFORMATION
Severozapaden Severen tsentralen Severoiztochen Yugozapaden Yuzhen tsentralen Yugoiztochen Bulgaria
Sample farms 43 40 17 24 29 41 194Farms represented 2 420 1 734 1 731 716 1 690 3 959 12 249% production from specialised farms 81% 92% 77% 95% 97% 92% 90%Forage area - ha 13 13 3 13 12 4 8Dairy cows - LU 10 12 8 17 28 7 12Rented UAA - % 80% 90% 66% 81% 89% 68% 81%Total labour - AWU 1,94 1,82 2,08 3,91 3,19 1,59 2,12Family labour - % 69% 72% 79% 30% 39% 84% 64%Milk per ha fodder area - t/ha 2,5 3,6 6,1 2,5 4,9 5,1 3,8Milk yield - kg/cow 3 220 4 008 3 501 3 004 3 572 4 461 3 696Milk production - t 34 50 28 52 100 33 45
MILK MARGINS in EUR/t of milk (nominal)
Severozapaden Severen tsentralen Severoiztochen Yugozapaden Yuzhen tsentralen Yugoiztochen Bulgaria
RevenuesPrice 200 201 225 309 273 207 234EU coupled payments (incl. Art.69) 0 0 0 0 0 0 0National aids 1 7 4 7 14 8 8Total revenues from milk 200 207 229 316 287 215 241Production costs Feed 90 87 162 108 139 94 113
homegrown feed 26 31 27 13 26 19 24purchased feed 64 56 135 96 113 75 89
Herd renewal purchases 0 0 0 1 0 0 0Milk levy 0 0 0 0 0 0 0Other specific costs 11 7 12 9 11 9 10Specific costs 101 94 174 118 150 104 123Machinery and building upkeep 15 6 2 13 5 6 7Energy (fuel, electricity) 22 21 18 33 23 10 20Contract work 14 14 10 8 5 10 10Taxes 0 0 0 4 0 1 0Other direct inputs 11 44 27 13 19 16 21Non specific costs 63 85 57 71 52 43 58Total operating costs 164 179 232 189 202 146 181Gross margin 36 21 -7 120 71 61 52Gross margin with coupled payments 36 28 -3 127 85 68 60
%spe.farms with positive gross margin 66% 26% - 99% 100% 99% 74%
%milk production with positive gross margin 75% 57% - 95% 100% 97% 85%
Depreciation 13 13 18 32 11 16 15Wages 31 21 17 64 34 12 27Rent 7 12 4 10 6 3 6Interest 1 5 1 23 7 3 5External factors 39 39 22 97 47 18 39Net margin -17 -30 -47 -9 13 27 -2Net margin with coupled payments -17 -23 -43 -2 27 35 6
Family labour costs 70 51 128 30 21 58 52Own capital unpaid cost 18 10 18 21 11 15 14Imputed family factors 89 61 146 50 33 74 66Net economic margin -106 -92 -193 -59 -20 -47 -68Net economic margin with coupled payments -105 -85 -189 -52 -6 -39 -60
%spe.farms with positive net economic margin - - - - - 9% 11%
%milk production with positive net economic margin - - - - - 21% 23%
Source: EU FADN DG AGRI, model of the allocation of costs for milk. 179

EU Dairy farms report 2012 Annex II BG RG
Bulgaria 2009 Milk specialised farmsINCOME in EUR/AWU (nominal)
Severozapaden Severen tsentralen Severoiztochen Yugozapaden Yuzhen tsentralen Yugoiztochen Bulgaria
Total output 5 693 8 725 4 582 6 371 11 384 6 468 7 343Intermediate consumptions 4 496 7 938 4 423 4 029 8 246 4 423 5 609Balance subsidies and taxes 1 013 2 371 744 981 1 588 776 1 198
Decoupled payments 597 699 207 196 302 318 382Depreciation 333 442 332 601 454 491 438Farm Net Value Added (FNVA) 1 877 2 715 571 2 722 4 272 2 330 2 493
External factors 1 007 1 388 435 1 809 1 846 531 1 118Wages 785 775 337 1 224 1 318 350 773
Rent 189 428 84 183 251 88 191Interest 34 184 14 402 277 94 154
Balance invest. subs. and taxes 0 0 0 0 278 0 58Farm net income (FNI) 870 1 327 135 913 2 704 1 798 1 433
Family farms only in EUR/FWU (nominal)Own capital unpaid cost 661 503 432 1 345 1 168 543 663Remuneration of Family Labour (RFL) 741 652 -261 537 2 493 1 325 954
%spe.farms with positive RFL 66% 21% - 92% 59% 60% 54%
Milk specialised farms - gross margin
3628
-3
127
85 68 60
-50
0
50
100
150
200
250
300
350
Rev
enue
s
Ope
ratin
gco
sts
Rev
enue
s
Ope
ratin
gco
sts
Rev
enue
s
Ope
ratin
gco
sts
Rev
enue
s
Ope
ratin
gco
sts
Rev
enue
s
Ope
ratin
gco
sts
Rev
enue
s
Ope
ratin
gco
sts
Rev
enue
s
Ope
ratin
gco
sts
Severozapaden Severen tsentralen Severoiztochen Yugozapaden Yuzhen tsentralen Yugoiztochen Bulgaria
EUR/t
Price EU coupled payments (incl. Art.69) National aidsFeed Other specific costs Non specific costsGross margin with coupled payments
Milk specialised farms - net margin
200 207229
316287
215241
217 231272
318260
180235
-17-23
-43
-2
27
35
6
0
50
100
150
200
250
300
350
Severozapaden Severen tsentralen Severoiztochen Yugozapaden Yuzhen tsentralen Yugoiztochen Bulgaria
EUR/t
-50
-40
-30
-20
-10
0
10
20
30
40
Total revenues from milk Operating costs + depreciation + external factors
Net margin with coupled payments
Source: EU FADN DG AGRI, model of the allocation of costs for milk. 180

EU Dairy farms report 2012 Annex II BG RG
Bulgaria 2009 Milk specialised farms
Milk specialised farms - net economic margin
200 207229
316287
215241
306 292
418
368
292
254
301
-105
-85
-189
-52
-6
-39
-60
0
50
100
150
200
250
300
350
400
450
Severozapaden Severen tsentralen Severoiztochen Yugozapaden Yuzhen tsentralen Yugoiztochen Bulgaria
EUR/t
-200
-180
-160
-140
-120
-100
-80
-60
-40
-20
0
Total revenues from milk Total costs Net economic margin with coupled payments
Milk specialised farms - non-operating costs
13 13 1832
11 16 15
7051
128
30
21 58
52
18
10
1821
1115
14
0
20
40
60
80
100
120
140
160
180
200
Severozapaden Severen tsentralen Severoiztochen Yugozapaden Yuzhen tsentralen Yugoiztochen Bulgaria
EUR/t Depreciation Wages Rent Interest Family labour costs Own capital unpaid cost
Milk specialised farms - income per work unit and margins per tonne
-500
0
500
1 000
1 500
2 000
2 500
3 000
3 500
4 000
4 500
Severozapaden Severen tsentralen Severoiztochen Yugozapaden Yuzhen tsentralen Yugoiztochen Bulgaria
EUR/WU
-250
-200
-150
-100
-50
0
50
100
150EUR/t of milk
Farm Net Value Added (FNVA) Farm net income (FNI)
Remuneration of Family Labour (RFL) Gross margin with coupled payments
Net margin with coupled payments Net economic margin with coupled payments
Source: EU FADN DG AGRI, model of the allocation of costs for milk. 181

EU Dairy farms report 2012 Annex II RO RG
Romania 2009 Milk specialised farms
e: estimate*: trend between the average of the first three available years and the average of the last available three yearsSTRUCTURAL INFORMATION
Nord-Est Sud-Est Sud-Muntenia Sud-Vest-Oltenia Vest Nord-Vest Centru Bucarest Romania
Sample farms 43 43 53 29 - 64 67 - 319Farms represented 16 486 13 306 19 202 15 758 - 21 318 12 553 - 107 326% production from specialised farms 52% 69% 63% 68% - 47% 68% - 61%Forage area - ha 2 1 1 1 - 3 15 - 3Dairy cows - LU 5 7 5 4 - 6 12 - 6Rented UAA - % 7% 6% 19% 0% - 22% 61% - 32%Total labour - AWU 1,74 1,84 1,40 1,60 - 1,88 2,20 - 1,76Family labour - % 97% 96% 91% 93% - 91% 66% - 89%Milk per ha fodder area - t/ha 7,3 8,1 12,7 5,0 - 5,5 3,5 - 5,0Milk yield - kg/cow 3 170 3 991 4 089 3 174 - 3 838 4 580 - 3 917Milk production - t 17 29 20 12 - 23 56 - 25
MILK MARGINS in EUR/t of milk (nominal)
Nord-Est Sud-Est Sud-Muntenia Sud-Vest-Oltenia Vest Nord-Vest Centru Bucarest Romania
RevenuesPrice 315 234 268 281 - 259 263 - 282EU coupled payments (incl. Art.69) 0 0 0 0 - 0 0 - 0National aids 38 5 1 0 - 24 1 - 9Total revenues from milk 353 239 269 281 - 283 264 - 292Production costs Feed 51 62 54 50 - 51 60 - 57
homegrown feed 24 7 17 32 - 27 35 - 25puchased feed 28 54 37 18 - 24 25 - 32
Herd renewal purchases 1 0 2 0 - 1 8 - 4Milk levy 0 0 0 0 - 0 0 - 0Other specific costs 8 13 7 6 - 17 37 - 19Specific costs 60 75 63 56 - 69 105 - 80Machinery and building upkeep 7 14 12 5 - 11 15 - 11Energy (fuel, electricity) 15 10 16 17 - 17 31 - 19Contract work 12 5 10 19 - 7 8 - 10Taxes 0 0 1 1 - 1 1 - 1Other direct inputs 4 5 6 4 - 7 8 - 6Non specific costs 39 34 45 46 - 42 63 - 47Total operating costs 99 109 108 102 - 112 168 - 127Gross margin 216 126 161 179 - 147 95 - 156Gross margin with coupled payments 254 131 161 179 - 171 96 - 165
%spe.farms with positive gross margin 100% 100% 93% 96% - 100% 88% - 97%
%milk production with positive gross margin 100% 99% 95% 98% - 92% 83% - 93%
Depreciation 41 23 50 66 - 24 18 - 32Wages 8 7 18 33 - 9 37 - 19Rent 2 0 3 0 - 3 6 - 3Interest 1 0 1 0 - 2 4 - 2External factors 11 7 21 34 - 14 47 - 24Net margin 164 96 90 80 - 110 31 - 99
Net margin with coupled payments 202 101 91 80 - 133 32 - 108
Family labour costs 134 167 157 190 - 99 51 - 120Own capital unpaid cost 47 26 53 25 - 31 26 - 35Imputed family factors 180 193 210 215 - 129 77 - 155Net economic margin -16 -97 -120 -135 - -20 -46 - -56Net economic margin with coupled payments 21 -92 -119 -135 - 4 -45 - -47
%spe.farms with positive net economic margin 29% 16% 16% - - 36% 29% - 26%
%milk production with positive net economic margin 51% 41% 24% - - 59% 45% - 45%
Source: EU FADN DG AGRI, model of the allocation of costs for milk. 182

EU Dairy farms report 2012 Annex II RO RG
Romania 2009 Milk specialised farmsINCOME in EUR/AWU (nominal)
Nord-Est Sud-Est Sud-Muntenia Sud-Vest-Oltenia Vest Nord-Vest Centru Bucarest Romania
Total output 4 991 4 938 6 376 3 845 - 5 416 11 961 - 6 501Intermediate consumptions 2 021 2 547 3 135 1 829 - 2 701 7 713 - 3 325Balance subsidies and taxes 705 814 414 314 - 841 1 139 - 738
Decoupled payments 204 72 198 145 - 222 667 - 254Depreciation 624 454 1 080 850 - 440 682 - 694Farm Net Value Added (FNVA) 3 051 2 750 2 575 1 480 - 3 116 4 705 - 3 221
External factors 136 148 456 411 - 252 1 712 - 497Wages 92 144 384 408 - 167 1 339 - 392
Rent 31 4 59 0 - 47 238 - 63Interest 13 0 13 3 - 38 135 - 41
Balance invest. subs. and taxes 0 0 0 0 - 0 0 - 0Farm net income (FNI) 2 915 2 602 2 119 1 070 - 2 864 2 993 - 2 725
Family farms only in EUR/FWU (nominal)Own capital unpaid cost 729 553 1 300 345 - 633 1 562 - 840Remuneration of Family Labour (RFL) 2 054 2 167 1 576 805 - 2 466 2 850 - 2 115
%spe.farms with positive RFL 77% 73% 83% 58% - 91% 81% - 79%
Milk specialised farms - gross margin
254
131
161179 171
96
165
0
50
100
150
200
250
300
350
400
Rev
enue
s
Ope
ratin
gco
sts
Rev
enue
s
Ope
ratin
gco
sts
Rev
enue
s
Ope
ratin
gco
sts
Rev
enue
s
Ope
ratin
gco
sts
Rev
enue
s
Ope
ratin
gco
sts
Rev
enue
s
Ope
ratin
gco
sts
Rev
enue
s
Ope
ratin
gco
sts
Rev
enue
s
Ope
ratin
gco
sts
Rev
enue
s
Ope
ratin
gco
sts
Nord-Est Sud-Est Sud-Muntenia Sud-Vest-Oltenia Vest Nord-Vest Centru Bucarest Romania
EUR/t Price EU coupled payments (incl. Art.69) National aids Feed Other specific costs Non specific costs Gross margin with coupled payments
Milk specialised farms - net margin
353
239269 281
0
283264
0
292
151 138178 201
#N/A
150
232
#N/A
184
202
10191
80
133
32
108
0
50
100
150
200
250
300
350
400
Nord-Est Sud-Est Sud-Muntenia Sud-Vest-Oltenia Vest Nord-Vest Centru Bucarest Romania
EUR/t
0
50
100
150
200
250
Total revenues from milk Operating costs + depreciation + external factors Net margin with coupled payments
Source: EU FADN DG AGRI, model of the allocation of costs for milk. 183

EU Dairy farms report 2012 Annex II RO RG
Romania 2009 Milk specialised farms
Milk specialised farms - net economic margin
353
239269 281
#N/A
283264
#N/A
292
331 331
388416
#N/A
279309
#N/A
338
21
-92
-119
-135
4
-45 -47
0
50
100
150
200
250
300
350
400
450
Nord-Est Sud-Est Sud-Muntenia Sud-Vest-Oltenia Vest Nord-Vest Centru Bucarest Romania
EUR/t
-160
-140
-120
-100
-80
-60
-40
-20
0
20
40
Total revenues from milk Total costs Net economic margin with coupled payments
Milk specialised farms - non-operating costs
41 2350 66
024 18 0
32
134 167
157
190
0
99 51
0
120
47 26
53
25
0
3126
0
35
0
50
100
150
200
250
300
350
Nord Est Sud Est Sud Muntenia Sud Vest Oltenia Vest Nord Vest Centru Bucarest Romania
EUR/t Depreciation Wages Rent Interest Family labour costs Own capital unpaid cost
Milk specialised farms - income per work unit and margins per tonne
0
500
1 000
1 500
2 000
2 500
3 000
3 500
4 000
4 500
5 000
Nord-Est Sud-Est Sud-Muntenia Sud-Vest-Oltenia Vest Nord-Vest Centru Bucarest Romania
EUR/WU
-200
-150
-100
-50
0
50
100
150
200
250
300EUR/t of milk
Farm Net Value Added (FNVA) Farm net income (FNI)
Remuneration of Family Labour (RFL) Gross margin with coupled payments
Net margin with coupled payments Net economic margin with coupled payments
Source: EU FADN DG AGRI, model of the allocation of costs for milk. 184
European Commission
EU dairy farms – Report 2012based on FADN
Disclaimer:This publication does not necessarily reflect the official opinion of the European Union. Neither the European Union institutions and bodies nor any person acting on their behalf may be held responsible for the use which may be made of the information contained therein.
Contact:European CommissionDG Agriculture & Rural Development,Microeconomic analysis of EU agricultural holdingsE-mail: [email protected]: http://ec.europa.eu/agriculture/rica/index.cfm

This report provides an overview of the EU dairy farms based on the latest data available from the Farm Accountancy Data Network (FADN). It analyses the trend in income, costs of production and milk margin until 2009 and provides estimates of the gross margin until 2011. .
European CommissionDirectorate-General for Agriculture and Rural Development
http://ec.europa.eu/agriculture