
EU Climate Policy Explained - European Commission · EU Climate Policy Explained The EU has been...
125
EU Climate Policy Explained Edited by JOS DELBEKE and PETER VIS
Transcript of EU Climate Policy Explained - European Commission · EU Climate Policy Explained The EU has been...

EU Climate Policy Explained
Edited by JOS DELBEKE and PETER VIS


EU Climate Policy Explained The EU has been the region of the world where the most climate policies have been
implemented, and where practical policy experimentation in the field of the
environment and climate change has been taking place at a rapid pace over the last
twenty-five years. This has led to considerable success in reducing pollution,
decoupling emissions from economic growth and fostering global technological
leadership.
The objective of the book is to explain the EU's climate policies with a minimum of
jargon, and to demonstrate the step-by-step approach that has been used to develop
these policies and the ways in which they have been tested and further improved in the
light of experience. The book shows that there is no single policy instrument that can
bring down greenhouse gas emissions, but the challenge has been to put a jigsaw of
policy instruments together that is coherent, delivers emissions reductions, and is cost-
effective. The book differs from existing books by the fact it covers the EU's emission
trading system, the energy sector and other economic sectors, including their
development in the context of international climate policy.
Set against the backdrop of the 2015 UN Climate Change Conference in Paris, this
accessible book will be of great relevance to students, scholars and policymakers alike.
Jos Delbeke has been the Director-General of the European Commission's Directorate-
General for Climate Action since its creation in 2010 (on-going). He holds a PhD in
economics (Louvain, 1986) and lectures at the University of Louvain (Belgium) on
European and international environmental policy.
Peter Vis is currently Adviser in the European Commission after having been the EU
Visiting Fellow at St. Antony’s College, University of Oxford, for the academic year
2014-2015 .Prior to that he was Head of Cabinet to Connie Hedegaard, European
Commissioner for Climate Action (2010-2014). He has a Master of Arts degree
(History) from the University of Cambridge.

EU Climate Policy Explained
Edited by Jos Delbeke and Peter Vis
With Ger Klaassen, Jürgen Lefevere, Damien Meadows,
Yvon Slingenberg, Artur Runge-Metzger, Stefaan
Vergote, Jake Werksman and Peter Zapfel

© European Union, 2016
Reuse authorised.
The reuse policy of European Commission documents is regulated by Decision
2011/833/EU (OJ L 330, 14.12.2011, p. 39).
This document was first published as a book of the same title by Routledge in 2015:
https://www.routledge.com/EU-Climate-Policy-Explained/Delbeke-
Vis/p/book/9789279482618

Contents
Figures and tables
Foreword
Acknowledgements
Contributors
Editors’ introduction
Jos Delbeke and Peter Vis
1
1 EU's climate leadership in a rapidly changing world
Jos Delbeke and Peter Vis
4
2 EU ETS: pricing carbon to drive cost-effective reductions across Europe
Damien Meadows, Yvon Slingenberg and Peter Zapfel
26
3 Climate-related energy policies
Jos Delbeke, Ger Klaassen and Stefaan Vergote
52
4 Framing Member States policies
Jos Delbeke and Ger Klaassen
79
5 The EU and international climate change policy
Jürgen Lefevere, Artur Runge-Metzger and Jake Werksman
94
6 Outlook
Jos Delbeke and Peter Vis
108
Figures and tables
Figures
1.1 (a) and ((b) Observed global mean combined land and ocean surface temperature
and map of the observed surface temperature change
1.2 Greenhouse gases, energy use, population and GDP in the EU-28:1990-2012
1.3 Why the EU's CO2 emissions from fossil fuel combustion changed between 2005 and
2012
1.4 Total greenhouse gas emissions by gas in the EU-28 in 2012
1.5 Changes in EU-28 greenhouse gas emissions by sector, 1990-2012
1.6 The transition to a low-carbon EU economy in 2050
2.1 Annual emissions reported under EU ETS
2.2 Annual market volume
2.3 Annual market value
2.4 Share of free allocation based on carbon leakage list 2015-19
2.5 Market price for European allowances
2.6 Surplus of ETS allowances without account taken of the introduction of the Market
Stability Reserve
3.1 Net oil and gas import dependency by region
3.2 The development of renewable energy use in the EU by type of renewable
3.3 Renewables policies contribute to reducing technology cost
3.4 EU-2030 target: at least 27 % energy savings in 2030
3.5 Average emission standards for new passenger cars in the world
4.1 Sharing the efforts in the non-ETS sectors in relation to GDP per capita
4.2 Expected impact of the new F-gas Regulation on EU HFC emissions
4.3 LULUCF emissions in the EU-28
5.1 A possible pathway to the below - 2°C objective

5.2 Emissions of major economies, 1990-2012 (all greenhouse gases, all sources and
sinks)
5.3 CO2 emissions per capita from fossil-fuel use and cement production
5.4 CO2 emissions per capita from fossil-fuel use and cement production per unit of
GDP
Tables
Table 1.1 Global greenhouse gas emissions since 1990 per country and capita
Table 2.1 Product benchmarks for free allocation defined as allowances
Table 3.1 Progress towards national renewable energy targets for 2020
Table 3.2 Impacts in 2020 of energy efficiency measures under the Ecodesign Directive
Table 4.1 National targets for 2020 for the non-ETS sectors
Table 4.2 Development of non-CO2 emissions in relation to CO2 emissions in the EU
Table 4.3 Forest management reference levels 2013 -2020 for the EU 28.
Foreword
The development and implementation of climate policies, and their adjustment over
time, must be informed by experience and lessons learned. This book appraises the
EU’s climate policy instruments, how initial choices of instrument have been adjusted,
how effective they have been, and where we are going in terms of adapting these
instruments to the challenges ahead. It also gives an overview of the international
negotiations on climate change.
The authors are those who have been working on these policies in the European
Commission, and who possess the insights acquired and now shared.
Policymaking is not about what can be done in theory, but much inspired by
practicalities and political feasibility. This is also the case for climate policy in the
specific context of the European Union. Starting points for policies are not always ideal
or fully in line with economic or legal theory, but where else to start from if not from
how things are? Some would like the international climate negotiations, or the actions
of third countries, to be very different from what they are. Such wishful thinking must
not detract from need for progress; we must avoid the perfect being the enemy of the
good.
The science makes clear how much more needs to be done to effectively tackle
dangerous climate change from impacting the planet and its people. The effectiveness
and costs of policies will be key to determining the pace of progress. The EU is making
its share of efforts needed to reduce greenhouse gas emissions and has put in place
ambitious climate policies leading to a true decoupling of emissions and economic
growth. But the problem of climate change is obviously not one that the EU can solve
alone. Fortunately, the experience of the EU, can also serve as valuable learning-by-
doing for other countries, as they develop their climate policies while putting their
economies on a solid track towards prosperous, low-carbon development.
I commend the authors for their contributions to this book and for their relentless efforts
for an ambitious EU climate policy throughout the years. I am confident that through
developing low-carbon pathways and taking up innovative technologies and best
practices, we can make our common objective of averting dangerous climate change a
success – starting with a robust agreement at COP21 in Paris in December 2015!
Miguel Arias Cañete
European Commissioner for Climate Action & Energy
Disclaimer
Responsibility for the information and views set out in this publication lies entirely with
the authors. The views and opinions contained in this publication do not necessarily
reflect the official positions of the European Commission or the European Union.

Acknowledgements
The authors would like to thank Jenny Avery, Hans Bergman, Ilona Billaux-Koman,
Jolene Cook, Raya Corry-Fitton, Ben Gill, Polona Gregorin, Christian Holzleitner, Alan
Huyton, Anna Johansson, Arno Kaschl, Simon Kay, Edas Kazakevicius, Ariane Labat,
Roel Merckx, Alexandre Paquot, Cornelius Rhein, Piotr Tulej and Tom Van Ierland for
comments, suggestions and support.
Contributors
Jos Delbeke joined the European Commission in 1986 and has been the Director-General
of the Directorate-General for Climate Action since its creation in 2010. He was closely
involved in negotiations on the 2020 and 2030 policy packages on climate change and
energy. He holds a PhD in economics (Louvain, 1986) and in 1985 worked at the
International Monetary Fund (Washington DC, USA). He lectures at the University of
Leuven (Belgium) on European and international environmental policy.
Ger Klaassen is policy analyst on strategy and economic assessment at the European
Commission’s Directorate-General for Climate Action. Before joining the Commission,
he worked as an economist at the International Institute for Applied Systems Analysis
(IIASA). He holds a PhD in economics from the Free University in Amsterdam. He was
Visiting Professor at Colorado College in Colorado Springs and the University of
Economics and Business Administration in Vienna, teaching environmental economics
and innovation.
Jürgen Lefevere is currently on sabbatical leave from the European Commission. Until
1 July 2014, he was Adviser on International and Climate Strategy at the Directorate-
General for Climate Action. Prior to joining the Commission in October 2003, he
worked at the London-based Foundation for International Environmental Law and
Development (FIELD). He has a law degree from the University of Maastricht and was
a research associate on EU environmental policy from 1993 to 1998.
Damien Meadows is the Adviser on European and International Carbon Markets at the
European Commission’s Directorate-General for Climate Action. Before this he was
Head of the Directorate-General’s Unit for the International Carbon Market, Aviation
and Maritime. He is a solicitor of the High Court of England and Wales. Before joining
the European Commission in 2001, he worked for the UK government and in private
practice, as well as with the United Nations Climate Change Secretariat.
Artur Runge-Metzger is the Director on International & Climate Strategy at the
European Commission’s Directorate-General for Climate Action. He spent two years in
the EU Delegation in Sarajevo/Bosnia and Herzegovina, and worked in the Directorate-
General for Development, the Directorate-General for the Environment in Brussels and
the EU Delegation in Harare/Zimbabwe. He holds a PhD in agricultural economics from
the Georg-August-University in Göttingen. From June 2013 to December 2014, he
served as co-chair of the Ad Hoc Working Group on the Durban Platform for Enhanced
Action preparing the new global climate agreement to be concluded in Paris in 2015.
Yvon Slingenberg is Senior Adviser in the Cabinet of Commissioner Miguel Arias
Cañete. She was previously Head of the Unit for Implementation of the EU ETS in the
European Commission’s Directorate-General for Climate Action. She joined the
Commission in 1993 and is a lawyer with a degree in international law (specialisation in
environmental law) from the University of Amsterdam.
Stefaan Vergote is Head of the Unit for Economic Analysis and Financial Instruments
at the European Commission’s Directorate-General for Energy. He was previously Head
of the Unit for Strategy and Economic Analysis in the Directorate-General for Climate
Action. He holds a degree in electro-mechanical engineering and a postgraduate degree
in environmental management from the University of Leuven (Belgium).
Peter Vis is currently Adviser in the European Commission after having been the EU
Visiting Fellow at St. Antony’s College, University of Oxford, for the academic year
2014-2015. He was Head of Cabinet to Connie Hedegaard, European Commissioner for
Climate Action from 2010-2014. Before joining the European Commission in 1990, he
worked for the UK’s tax and customs authority (HM Revenue & Customs). He has a
degree in History from the University of Cambridge.
Jake Werksman is Principal Adviser to the European Commission’s Directorate-
General for Climate Action, where his work focuses on the international dimensions of
European climate policy. Before joining the Commission in 2012, he held posts at the
World Resources Institute, the Rockefeller Foundation, United Nations Development
Programme, and the Foundation for International Environmental Law and Development
(FIELD) in London. He has lectured in international environmental and economic law
at Masters level at the New York University Law School, Georgetown University Law
Center, and at the School of Oriental and African Studies and University College at the
University of London. He holds degrees from Columbia University (A.B.), the
University of Michigan (J.D.) and the University of London (LL.M.).
Peter Zapfel is Head of the Unit for Implementation of the EU ETS in the European
Commission’s Directorate-General for Climate Action. Prior to his current assignment
he was Assistant to the Director-General, responsible for policy coordination and
economic assessment. He holds academic degrees from the University of Business and
Economics in Vienna, Austria, and the John F. Kennedy School of Government at
Harvard University, USA.

1
Editors’ introduction
Jos Delbeke and Peter Vis
“Go as far as you can see; when you get there you’ll be able to see farther”
Thomas Carlyle, Scottish Philosopher (1795-1881)
The purpose of this book is to explain the European Union's climate policies to the
interested but not necessarily specialist reader. The main theme is that the EU has been
the place in the world where, over the last quarter of a century, active learning has
characterised policymaking in the field of the environment and climate change. This has
led to considerable success in cleaning up pollution, decoupling emissions from
economic growth and fostering global technological leadership.
A first important lesson is that European climate policy has been built up step-by-step.
Learning-by-doing has turned out to be a key feature. Tackling the new and complex
problem of climate change means that many consumers and producers need to change
their habits and reduce greenhouse gas emissions. It is like changing the course of a huge
supertanker at sea: it requires time. Such changes also have many economy-wide
repercussions. This has all needed to be done in a rapidly changing world, and in a multi-
level regulatory environment, such as exists in the EU.
In the 1990s, economists were actively looking at how to improve environmental
policymaking, and made a strong case for putting a price on the impacts of pollution that
are not otherwise paid for by the polluter (“pricing environmental externalities”). Their
preferred way to do this was through taxation, and the EU tried for almost a decade to get
a carbon-energy tax adopted. This failed for political reasons, as the notion of creating
new taxes was an unpopular message at a time when many people already felt over-taxed.
This also failed for institutional reasons, as European taxes need to be adopted with the
unanimous agreement of the Member States, which proved impossible. An alternative
approach, limiting the quantity of pollution, was subsequently preferred to imposing a
fixed tax on pollution.
One of the most striking examples of learning-by-doing concerns the EU’s emissions
trading system, where initially the allocation of allowances was made by EU Member
States, predominantly on the basis of free handouts to private companies. While it was
generally known that this was sub-optimal, it was a necessary step to get the system in
place. Quite quickly, on the basis of the experience gained, consensus grew that better
solutions were needed and allocation now takes place on the basis of auctioning and EU-
wide performance benchmarks.
Similarly, the emission reduction policy for passenger cars was initially based on
Voluntary Agreements with the car industry in the late 1990s. These did not work as
intended and so were replaced by binding, but flexible, legislation. Learning-by-doing in
policymaking is important; no new policy-approach will ever be perfect from the outset,
especially in a rapidly changing world.

2
A second important lesson is that there is no “silver bullet”, no one single policy
instrument, suited to bring down greenhouse gas emissions across so many sectors of
economic activities. Different approaches are called for across different economic
sectors. The art is therefore in putting together a “jigsaw” of policy approaches that is
effective, coherent, and cost-effective. At the same time, it is important to avoid double
regulation or overlaps between different instruments as these may give conflicting signals
to economic operators.
A third lesson is that solid economic and technical preparation of policy, as well as
extensive stakeholder consultation, is of the utmost importance. This is not only
necessary to gain sufficient understanding and backing at political level, but also to make
sure that the policy context – once agreed – remains as stable as possible. There are often
high, and largely conflicting, economic interests at stake, and creating maximum
transparency has been a necessary pre-condition for success. Our experience has shown
that policymaking on the basis of facts and figures, an explicit analysis of costs and
benefits to society, and an active engagement with stakeholders has been more rewarding
than overly concentrating on what is considered politically opportune in the short-term.
While the journey of building up a comprehensive climate policy in the EU started in the
1990s, it really took off around the year 2000, when the Kyoto Protocol was approved but
work to have it ratified was still on-going. Given the huge task that the decarbonisation of
Europe implies, a decade and a half is a short period of time. It is too early, therefore, to
make a final assessment of the EU’s climate change policy experience. Nevertheless the
following key elements are already emerging:
1. The EU has demonstrated that emissions can be reduced while economic growth
continued: between 1990 and 2013, GDP of the 28 Member States increased by
45% while emissions were reduced by 19%. In times of recession, as might be
expected, the trend of steadily falling emissions continues.
2. The EU has successfully used market mechanisms to reduce emissions, in
particular by putting a price on carbon. This pricing process has worked its way
through the economy in a consistent manner, as a result of which relatively easy
and inexpensive reductions of emissions were achieved. However the most severe
economic recession of the post-war period, starting in 2008, has caused sub-
optimal market functioning that still needs to be corrected.
3. The EU has been a leader in deploying low-carbon and energy-efficient
technologies, both in new sectors, such as renewable energy, as well as in more
traditional industrial sectors, such as the automotive, chemicals and steel sectors.
Significantly, the EU is a global leader in the number of patents registered for
low-carbon technologies.
4. The integration of the climate dimension in the design of policies with economic
relevance, such as energy, transport, industry, or regional development, has been
crucial. This is important at all levels: EU, national and local. New initiatives
taken locally are promising, such as those developed under the Covenant of the

3
Mayors.
5. Businesses ask for a stable regulatory environment, directed at long-term
structural changes rather than short-term policy interventions and regulatory
changes. That is why European leaders have already decided on a climate and
energy policy framework for 2030, confirming and accelerating the now
established trend towards decarbonisation, and placing emphasis on a stronger
carbon constraint as well as on renewable energy and highly energy-efficient
equipment.
The policy landscape will continue to evolve in the light of experience and
circumstances, while endeavouring to provide maximum predictability for businesses
and consumers. Consolidation of some of these new policies has taken time, and a
further revision of much of the legislation explained in this book is to be expected. This
will happen when implementing the 2030 framework for climate and energy policy.
These changes will offer another opportunity not to re-invent policy approaches, which
are now established and proving their worth, but to “fine-tune” them so as to increase
their effectiveness.
We hope this book will be valuable to all those involved in policymaking, not least in
countries starting to set up their own climate policies, as well as the academic reader
interested in how and why policies implemented may sometimes differ from textbook
theory.
This book is deliberately written with a minimum of jargon and abbreviations, a
particularly challenging task in the field of climate policy. The purpose of each chapter is
to explain why and how policies have been developed, and the experience with them so
far. Each section ends with a brief conclusion. For those interested in the complete texts
of our legislation, ample references are made to the websites where these can be found.
This book has the following structure. Chapter 1 describes the EU's climate policy
leadership in a changing world, ending with the proposed framework for a climate and
energy framework for 2030. Chapter 2 describes the workings of the core piece of EU
climate policy: the EU Emissions Trading System (EU ETS). Chapter 3 summarizes
how EU's energy-related policies not only improve energy security but also contribute
to reducing the EU's greenhouse gas emissions. Chapter 4 is of a cross-cutting nature
and describes a range of EU policies that help Member States to reduce greenhouse gas
emissions in the sectors not covered by the EU ETS. Chapter 5 describes the
international developments from the signing of the Kyoto Protocol to the present, in the
run-up to the comprehensive climate agreement that so urgently needs to be agreed in
Paris in 2015. Finally, chapter 6 makes some concluding remarks on the future outlook.

4
1 EU climate leadership in a rapidly changing world
Jos Delbeke and Peter Vis
Compelling scientific evidence
Climate change is an environmental problem that is very different from the more
traditional areas of pollution, such as water, waste or air quality. Greenhouse gas
emissions do not have a direct impact on human health, they are not visible and do not
smell. Moreover climate change is a truly global environmental problem, as it does not
matter at all where greenhouse gases are emitted – they have the same impact. Such
greenhouse gas emissions are predominantly related to the use of fossil fuels that have
been massively used since the industrial revolution that started in Europe in the late 18th
century, mostly coal and later oil and gas. In the light of emerging uncertainties in the
early 1980s, one of the most important decisions at the international level was to create in
1988 the Intergovernmental Panel on Climate Change (IPCC) as a forum for the world’s
scientists to come forward with a consensual view on what climate science can say.
The “Summary for Policymakers” of the IPCC’s Fifth Assessment Report of Working
Group I, finalised in 2013, made a number of key statements in a very clear manner. The
most important ones were that: “Warming of the climate system is unequivocal, and since
the 1950s, many of the observed changes are unprecedented over decades to millennia”
and that “Human influence on the climate system is clear” (IPCC, 2013, p 6)
From its assessment, the IPCC also concluded that continued emissions of greenhouse
gases will cause further changes to the atmosphere, land and oceans in all regions of the
world, many of which would continue for centuries even if further emissions ceased.
Thus, the science points to the inevitable conclusion that if we are to limit future climate
change and avoid catastrophic, potentially irreversible, impacts we need to make
significant and immediate reductions in global greenhouse gas emissions. As climate
scientist James Hansen put it: “Imagine a giant asteroid on a direct collision course
with Earth. That is the equivalent of what we face now [with climate change], yet we
dither”.1
The IPCC's Fifth Assessment Report is the culmination of years of effort to examine the
vast body of scientific literature on climate change. The contribution on the physical
climate science confirms and strengthens the findings of its previous assessments using
new evidence. It draws on more extensive observations, improved climate models,
greater understanding of climate processes and feedbacks, and a wider range of climate
change projections.
Assessing the literature is a significant undertaking which must examine multiple
strands of evidence to produce coherent messages that accurately reflect the science. To
this end, the report is subject to a robust, open and transparent review process which
1 Hansen, J. (2012) "Why I must speak out about climate change”, TED2012 Talk, February 2012
Conference Presentation:
http://www.ted.com/talks/james_hansen_why_i_must_speak_out_about_climate_change

5
involves both scientific experts and governments around the world. Ultimately, though,
the scientists have the final word and that final word remains firmly rooted in the
scientific evidence. For the IPCC’s Working Group I report, this evidence was provided
in over 9000 peer-reviewed papers published since 2007 and assessed by over 850
scientists involved as authors, contributors or review editors. A further 1000 or so
experts were also involved in the review process. On this basis, the high degree of
scientific consensus becomes undeniable.
While some prominence has been given in the media to a slower increase in global
surface temperature over the past 15 years (see Figure 1.1, top part panel (a)), the
scientific community and policy-makers remain focussed on the risks posed by human-
induced climate change of the more relevant long-term trend. Over short timescales,
typically considered to be periods of less than 30 years, surface temperatures are
strongly dominated by natural fluctuations in the earth's climate that mask the influence
of increasing concentrations of greenhouse gases in the atmosphere. Examination of the
longer-term trend, however, shows a much clearer picture of what lies ahead. The last
three decades have been successively warmer than all preceding decades on record
(lower part panel (a) Figure 1.1).
Figure 1.1 covers the period from 1850 to 2012 (the last year for which data were
available when the IPCC report of 2013 was published). Changes are given as changes
compared to the average temperature in the period 1961 to 1990. In 2012, for example,
the annual average was more than 0.4°C higher than in the period 1961 to 1990 (upper
panel Figure 1.1). In the last decade (2000 to 2010) the global temperature was around
0.45°C higher than the period 1961 to 1990 (lower panel Figure 1.1)
Despite some past periods where global temperature has been stable or even decreased,
it is irrefutable that overall the planet is warming. Temperature changes are uneven
across the globe, and regional observations show that land areas are warming more than
the ocean surface, and that some regions, the Arctic and Africa for example, are
warming much faster than others (see part (b) of Figure 1.1.
Change in global average surface temperature, however, is just a small part of the much
bigger global warming and climate change picture. Observations of multiple indicators of
climate change all reveal a consistent message that the planet is gaining energy, leading
to warming of the climate system as a whole. More than 90% of the additional energy
resulting from increasing greenhouse gas concentrations is stored in the world's oceans
and this is having measurable and unprecedented impacts. Sea level has been observed to
be rising at an increasing pace as a result of the expansion of oceans as they warm, and as
a result of additional water from melting glaciers and the large ice sheets of Greenland
and Antarctica. The extent of Arctic sea ice is also decreasing and it is projected that, if
no efforts are made to reduce greenhouse gas emissions, the Arctic could be nearly ice
free in September before the middle of the 21st century.

6
Figure 1.1 (IPCC, 2013) Figure SPM.1 | (a) Observed global mean combined land
and ocean surface temperature anomalies, from 1850 to 2012 from three data sets.
Top panel: annual mean values. Bottom panel: decadal mean values including the
estimate of uncertainty for one dataset (black). Anomalies are relative to the mean
of 1961−1990. (b) Map of the observed surface temperature change from 1901 to
2012 derived from temperature trends determined by linear regression from one
dataset (orange line in panel (a). Trends have been calculated where data
availability permits a robust estimate (i.e. only for grid boxes with greater than
70% complete records and more than 20% data availability in the first and last
10% of the time period). Other areas are white. Grid boxes where the trend is
significant at the 10% level are indicated by a + sign. For a listing of the datasets
and further technical details see the Technical Summary.

7
On the basis of an increasing body of evidence, the EU’s Environment Council already
agreed in 1996 to limit global average surface temperature rise to below 2°C (3.6°F)
above pre-industrial levels2 to prevent the most severe impacts of climate change or
dangerous human interference with the climate system. In March 2007 the European
Council, i.e. the EU Heads of State and Government, underlined the vital importance of
achieving the strategic objective of limiting the global average temperature increase to
not more than 2°C above pre-industrial levels3. In 2014 many world leaders also
endorsed this commitment in 2014, at a Summit organised by UN Secretary-General
Ban Ki-moon4.
To be exact, however, science does not specify a "safe" level of temperature rise, but
recognises that as temperature increases, climate impacts worsen and the risk of
triggering catastrophic and potentially irreversible changes increases. To make it likely
(a probability of 66% to 100%) to stay within the 2°C average temperature increase,
global greenhouse gas emissions (expressed in CO2-equivalent emissions) would have
to be reduced between 41% and 72% in 2050 compared to 2010. In the year 2100 global
greenhouse gas reductions would have to be between 78 and 118% lower than
emissions in 2010 (IPCC, 2014, p. 22). Reductions of more than 100% are possible if
biomass is burned in power plants and the resulting CO2 emissions are captured and
stored. In this way CO2 equivalent concentrations are kept at levels of around 450 parts
per million (ppm), consistent with a likely chance to keep global warming below 2°C
over the 21st century relative to pre-industrial levels.
The scientific evidence suggests that, while meeting the 2°C objective is challenging, it
remains possible. The basic implication is that the world must stop the growth in global
greenhouse gas emissions by around 2020, and reduce emissions by at least half of 1990
levels by the middle of this century and continue cutting them thereafter. In this context
the European Union has reaffirmed that developed countries as a group should continue
to take the lead and should reduce their greenhouse gas emissions by 80-95% by 2050
compared to 1990.5
2 Community Strategy on Climate Change - Council Conclusions, paragraph 6:
http://europa.eu/rapid/press-release_PRES-96-188_en.htm?locale=en 3 See paragraph 27 of Brussels European Council Conclusions of 8/9 March 2007 (document reference:
7224/1/07 REV 1 dated 2 May 2007):
http://www.consilium.europa.eu/uedocs/cms_data/docs/pressdata/en/ec/93135.pdf 4 Climate Summit 2014, Chair’s Summary: “Leaders committed to limit global temperature rise to less
than 2 degrees Celsius from pre-industrial levels.”
http://www.un.org/climatechange/summit/2014/09/2014-climate-change-summary-chairs-summary/ 5 Submission by Latvia and the European Commission on behalf of the European Union and its Member
States, dated 6 March 2015, on the Intended Nationally Determined Contribution of the EU and its
Member States: http://ec.europa.eu/clima/news/docs/2015030601_eu_indc_en.pdf

8
Conclusion: the planet is warming at an unprecedented speed, measured not only
over decades but also over millennia. This is caused by humans, and due mainly to
the huge consumption of fossil fuels since the beginning of the industrial
revolution. Scientists tell us that it is possible to contain the worst impacts of
climate change provided we keep global temperature increases below 2°C
compared to pre-industrial times. For that reason EU and world leaders have
confirmed the importance of the below - 2°C objective.
The EU has a strong multilateral tradition
As part of the new post-war world order, the European nations strongly supported the
creation of multilateral institutions, known as the “Pax Americana”. In fact, the EU's
own institutional development is an expression of that same multilateralism. Today,
there is a strong belief by Europeans that global problems need to be addressed
multilaterally, in the context of the United Nations (UN), despite concerns and
disappointments regarding its efficiency and effectiveness.
In the field of environmental protection, the United Nations has been a preferred forum
to discuss issues related to trans-boundary pollution. In the 1970s questions related to
the environment were subject of political debate in the wake of the reports of the Club
of Rome (in particular Meadows et al, 1972), to a large extent responding to the first
compelling evidence of a demographic explosion. The sustainability question was
elevated for the first time to the UN level in Stockholm in 1972 and taken over with
vigour, among others, by Ms Gro Harlem Brundtland, the then Prime Minister of
Norway and Chairperson of the World Commission on Environment and Development
in its report “Our Common Future” (1987).
This led to the 1992 “Earth Summit” in Rio de Janeiro at which was agreed the UN
Framework Convention on Climate Change (UNFCCC), following convincing
scientific evidence related to climate change. Five years later the Kyoto Protocol was
agreed (1997) in which developed countries committed to take the lead in reducing
greenhouse gas emissions by committing to quantitative emission reductions and
limitation targets.
Ratification of the Kyoto Protocol by the EU and its Member States was finalised in
April 2002, but by that time the US had decided not follow up its signature by
ratification. This was a major blow to the Kyoto Protocol, but it nevertheless entered
into force thanks to ratification by a sufficient number of countries including, crucially,
the Russian Federation. The Kyoto Protocol created the platform for the EU to start
developing a comprehensive set of policies specifically targeted to reduce greenhouse
gas emissions. These policies largely contributed to the EU overachieving its target of
8% reduction compared to 1990 by the end of the Protocol’s first commitment period in
2012.
Climate change, together with ozone depletion, represents a new generation of
environmental issues that are truly global in nature. Irrespective of where the emissions
of ozone-depleting substances or of carbon dioxide occur in the world, their impact is

9
global. That is why there is such a need for global action. For the EU, the UN is the
obvious level at which to act, as is widely recognised by public opinion.
Since 1992, however, the world has changed a great deal. Back then, the world was
divided between developed and developing nations. Today, more than 20 years later, the
EU, the US and Japan represent a lower share of world economic activity, due to the
impressive emergence of new industrial players, not least in Asia. This also translates
into pollution patterns that visibly impair air quality, for example. This is true also of
the greenhouse gas emissions of these emerging economies, which have dramatically
increased in the meantime.
This changed outlook has obviously influenced the global debate. The United States has
made it clear that it will not join commitments that do not include China, now the
world’s largest emitter of greenhouse gases. For Europeans, this only underlines the
logic of their preference for multilateralism. At the same time, emerging economies feel
that their importance is not adequately acknowledged in the structures of the UN, which
too much reflects the post-1945 balance of power. And on top of that, the environmental
agenda is perceived by these emerging economies as a potential brake on their
development, and so is met with some suspicion just as they start enjoying the fruits of
general economic progress.
Conclusion: the EU remains deeply attached to its tradition of multilateralism, and
prefers global environmental problems to be tackled at UN level.
The environment: a new policy area for the EU
EU climate policy basically started as part of environmental policy, which had a sound
legal basis established by the Single European Act, which entered into force in 1987.
Through that Act, new provisions were added to the EU Treaty dealing with the
environment6. These provided that the Council (i.e. representatives of the EU Member
States) could, together with the European Parliament, decide upon environmental laws
on the basis of qualified majority, a provision that is now called the “ordinary legislative
procedure”. Today, 25 years later, there is almost a complete set of EU legislation
addressing environmental protection of air quality, water, waste and biodiversity.
With hindsight it is not surprising that decisions on environmental policy were pushed
to the European level. Often, countries face similar problems, and pollution often
extends beyond borders. For example, discharges into the Rhine, the Meuse or the
Danube rivers, may cause pollution in another country further downstream. The same
goes for air pollution, as was clearly demonstrated in the 1980s by “acid rain” caused by
UK coal-fired power stations damaging forests and lakes in Scandinavia. As concerns
about climate change emerged, it was immediately recognised that the actions of one
country affected all others, and the effects too, were often trans-boundary. In addition, it
6 Now Part 3, Title XX of the Treaty on the Functioning of the European Union, OJ C 326, 26.10.2012, p.
132–134:
http://eur-lex.europa.eu/legal-content/EN/TXT/PDF/?uri=CELEX:12012E/TXT&from=en

10
became quickly clear that the EU needed to speak with one voice at international
negotiations.
Moreover, the development of the EU’s Single Market for goods and services
accelerated in the 1980s and 1990s. More competition between products and services
produced in different Member States provoked questions about short-term distortions of
competition as a result of environmental policy measures developed at Member State-
level. The institutional move embodied in the Single European Act reflected a general
opinion that it would be better that the EU adopts rules to protect the environment at
European level, thereby minimising the risk of distortions of competition with the EU’s
internal market.
In the years following implementation of the new institutional provisions, a debate
unfolded on which kind of instruments were the best to use. In particular, the question
was raised whether the policy mix should be widened to include economic instruments7.
A long and comprehensive debate took place on "pricing the economic externality" and
how to put this into practice. Prices are a very effective way of transmitting information
through the economy and influencing behaviour, right down to the levels of individual
producers and consumers. This can be achieved through taxes or, alternatively, through
the setting of overall limits on pollution levels (“a cap”). In other words, economic
instruments can work either directly through setting prices for polluting (e.g. through
taxes) or through defining quantities of pollution allowed (e.g. through capping
pollution levels).
In the 1990s, the favoured way for pricing was through taxes. Already in 1992, the
Commission made a proposal for a combined carbon and energy tax. This led to
controversy in the Council and Parliament, the main question being whether adoption
was to be done through unanimity (where all Member States have to agree, for example
as applied in matters of taxation) or through qualified majority voting (where the
Member States have votes weighted according to their size, as applied to matters related
to the environment). In the end, after almost a decade of difficult negotiations, the tax
route was abandoned at the European level, in particular due to the reservations by some
Member States, such as the UK, in giving supra-national EU institutions a say over the
taxation policies of Member States.
The debate on economic instruments at EU level shifted to cap-setting and emissions
trading. The US introduced into the international debate on climate change the
advantages that an instrument such as “cap-and-trade” could bring in fostering the
overall cost-effectiveness of policy solutions. Led by their successful policy experience
on reducing sulphur and NOx emissions, the US pushed successfully for its introduction
into the Kyoto Protocol, much to the irritation of the Europeans at the time. It took a
while before the Europeans appreciated that setting a limit on the total amount of
emissions is truly an environmental benefit. Moreover, the EU gradually realised that
legislation for such instruments could be decided through Council qualified majority
7 See European Commission (1993) White Paper Growth, competitiveness, employment: The challenges
and ways forward into the 21st century. COM(1993)700 of 5 December 1993, pages 140-151:
http://europa.eu/documentation/official-docs/white-papers/pdf/growth_wp_com_93_700_parts_a_b.pdf
11
voting , a welcome difference after the institutional stalemate that had stymied progress
on carbon and energy taxation.
Conclusion: since the Treaty change of 1987, the EU decides legislation in the field
of the environment on the basis of a qualified majority voting of Member States
with the European Parliament. This has allowed for the development of a
comprehensive set of new environmental legislation and facilitated a smooth policy
response towards climate change.
Facts and figures on EU greenhouse gases
The development of new policy instruments such as those on carbon pricing led to a
whole new set of policy questions. Are the facts and figures available? What would the
estimated economic impact be on important sectors, not least on the energy sector or on
manufacturing industry? Could estimations be undertaken of related costs of emission
reductions? These questions had been uncommon in the development of environmental
policy until then.
One of the first policy decisions was to create a much better statistical information system
through the systematic monitoring, reporting and verification of greenhouse gas
emissions in the Member States and in the different economic sectors. Today, the EU’s
Monitoring Mechanism Regulation8 is one of the best developed tools worldwide,
delivering in the autumn of every year a comprehensive report (EEA, 2014). The
availability of solid statistical information is still one of the essential foundations of EU
climate policy.
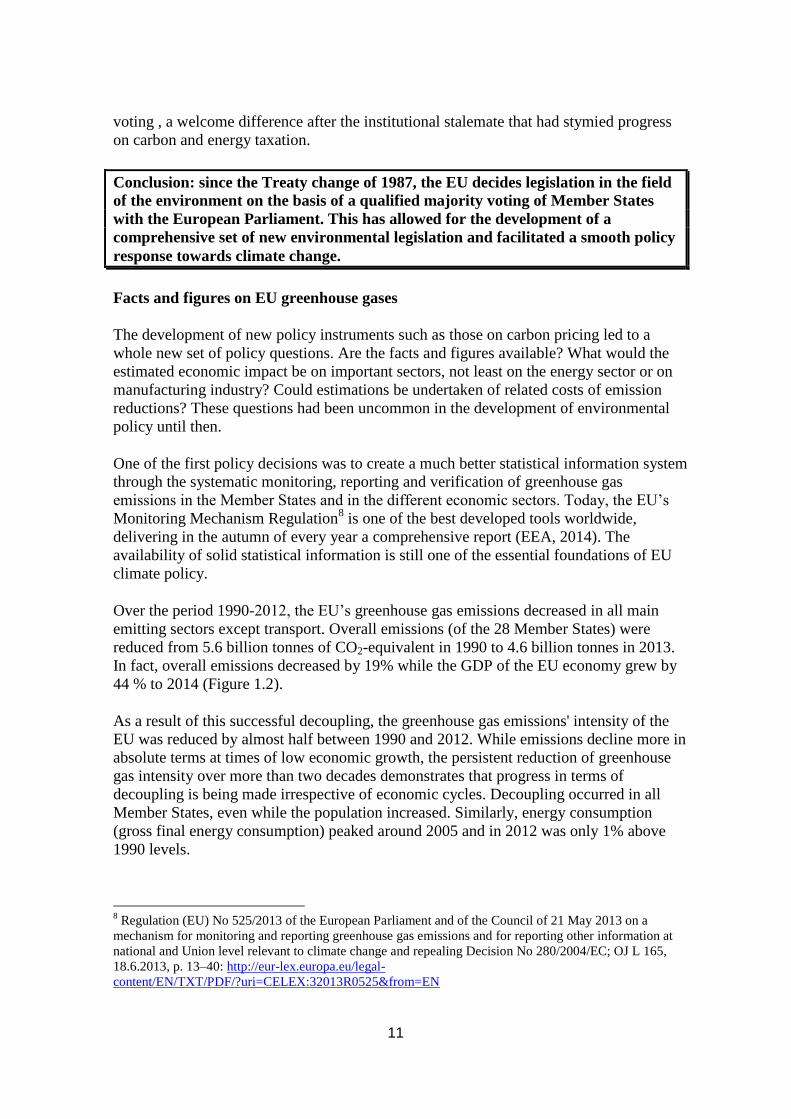
Over the period 1990-2012, the EU’s greenhouse gas emissions decreased in all main
emitting sectors except transport. Overall emissions (of the 28 Member States) were
reduced from 5.6 billion tonnes of CO2-equivalent in 1990 to 4.6 billion tonnes in 2013.
In fact, overall emissions decreased by 19% while the GDP of the EU economy grew by
44 % to 2014 (Figure 1.2).
As a result of this successful decoupling, the greenhouse gas emissions' intensity of the
EU was reduced by almost half between 1990 and 2012. While emissions decline more in
absolute terms at times of low economic growth, the persistent reduction of greenhouse
gas intensity over more than two decades demonstrates that progress in terms of
decoupling is being made irrespective of economic cycles. Decoupling occurred in all
Member States, even while the population increased. Similarly, energy consumption
(gross final energy consumption) peaked around 2005 and in 2012 was only 1% above
1990 levels.
8 Regulation (EU) No 525/2013 of the European Parliament and of the Council of 21 May 2013 on a
mechanism for monitoring and reporting greenhouse gas emissions and for reporting other information at
national and Union level relevant to climate change and repealing Decision No 280/2004/EC; OJ L 165,
18.6.2013, p. 13–40: http://eur-lex.europa.eu/legal-
content/EN/TXT/PDF/?uri=CELEX:32013R0525&from=EN

12
Figure 1.2 Greenhouse gases, energy use, population and GDP in the EU-28:1990-
2012 (Index 1990=100). (Based on: EEA (2014a), EEA inventory database, and
European Commission (Ameco database); data to 2012 (latest inventory data).
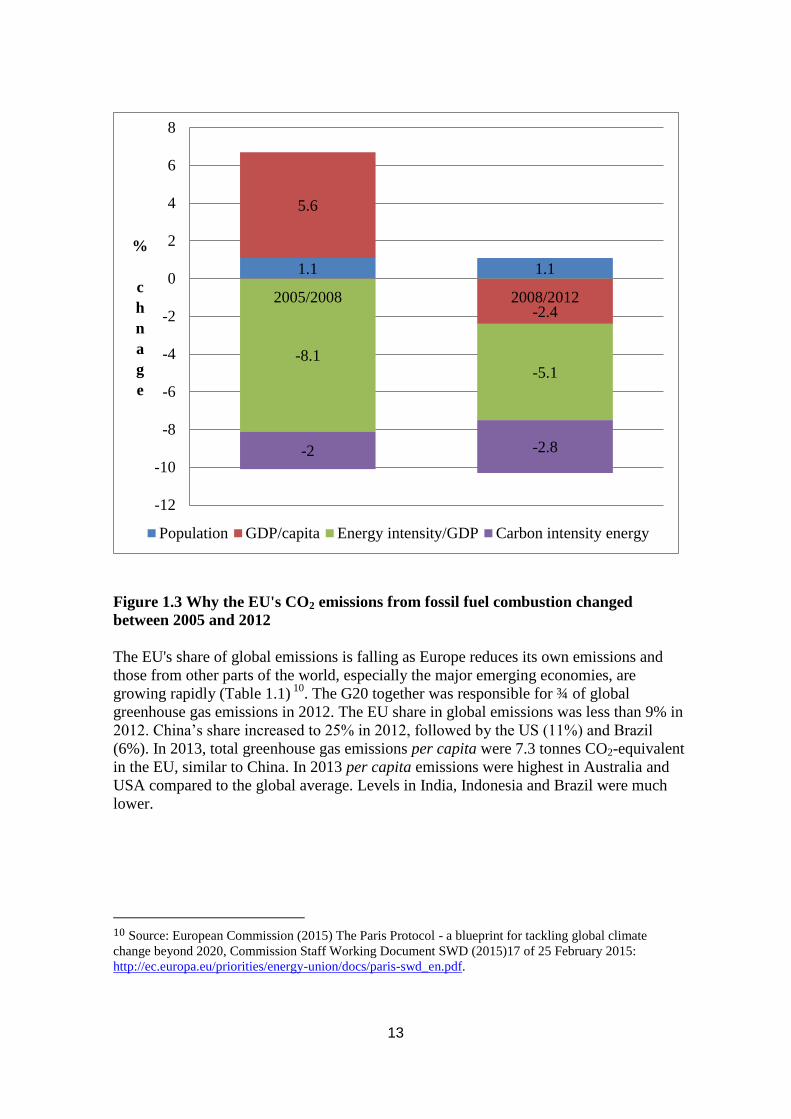
The structural policies implemented in the field of climate and energy (see chapters 2 to
4) have contributed significantly to the EU emission reduction observed since 2005. A
detailed analysis of the reduction in CO2 emissions from fossil fuel combustion between
2005-2012 is shown below in Figure 1.3. Between 2005 and 2008 CO2 emissions from
fossil fuel combustion decreased by 3.4%. This result was the sum of increases caused by
population and GDP per capita growth, on the one hand, and improvements in energy
intensity and carbon intensity, on the other hand. Between 2008 and 2012 CO2 emissions
from fossil fuel combustion fell by 9.2%. This reduction was the sum of an increase
caused by population growth, decreases caused by a decline in GDP per capita,
improvements in energy intensity of GDP and also of carbon intensity per unit of energy
produced9. This indicates, significantly, that the economic crisis that occurred during the
2008-2012 period contributed to less than half of the reduction of emissions observed
during this period.
9 Report from the Commission to the European Parliament and the Council: Progress towards achieving
the Kyoto and EU 2020 objectives, Brussels (COM(2014)689 final dated 28 October 2014):
http://ec.europa.eu/transparency/regdoc/rep/1/2014/EN/1-2014-689-EN-F1-1.Pdf . The figure is based on
analysis of the EEA (2012) Why did greenhouse gas emissions decrease in the EU in 2012?” European
Environment Agency – EEA Analysis, Copenhagen, 3 June 2014
((http://www.eea.europa.eu/publications/why-did-ghg-emissions-decrease
13
Figure 1.3 Why the EU's CO2 emissions from fossil fuel combustion changed
between 2005 and 2012
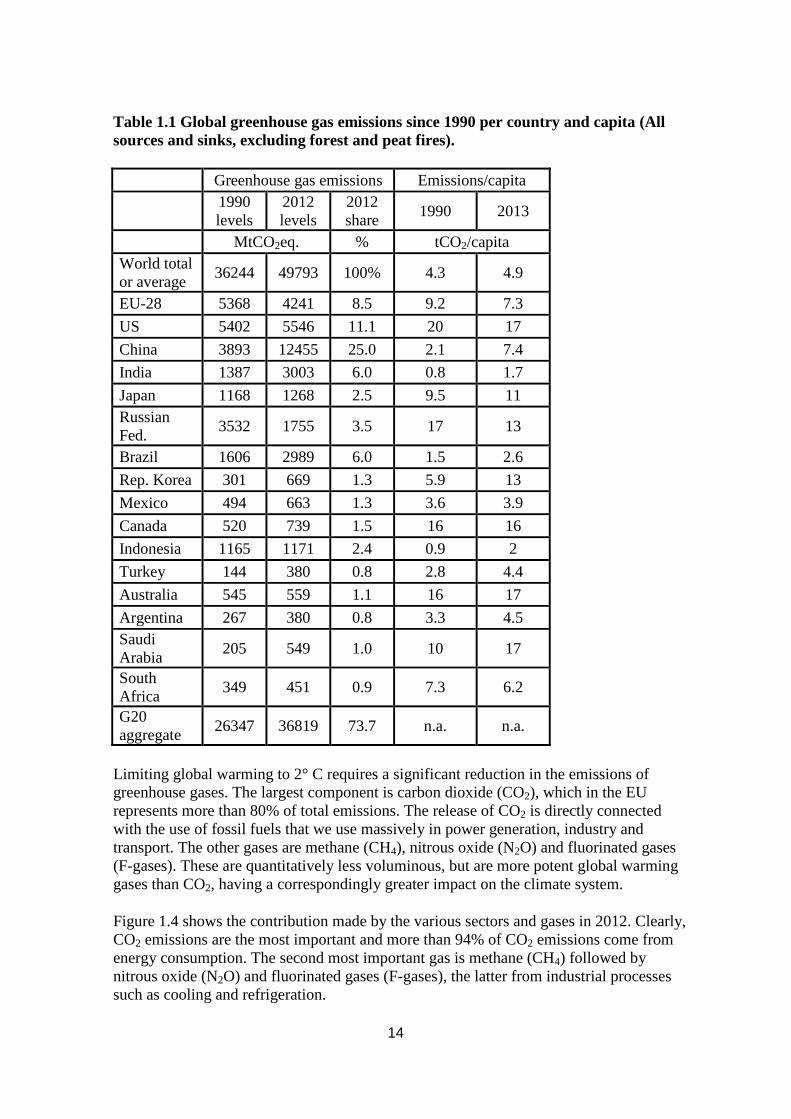
The EU's share of global emissions is falling as Europe reduces its own emissions and
those from other parts of the world, especially the major emerging economies, are
growing rapidly (Table 1.1) 10
. The G20 together was responsible for ¾ of global
greenhouse gas emissions in 2012. The EU share in global emissions was less than 9% in
2012. China’s share increased to 25% in 2012, followed by the US (11%) and Brazil
(6%). In 2013, total greenhouse gas emissions per capita were 7.3 tonnes CO2-equivalent
in the EU, similar to China. In 2013 per capita emissions were highest in Australia and
USA compared to the global average. Levels in India, Indonesia and Brazil were much
lower.
10 Source: European Commission (2015) The Paris Protocol - a blueprint for tackling global climate
change beyond 2020, Commission Staff Working Document SWD (2015)17 of 25 February 2015:
http://ec.europa.eu/priorities/energy-union/docs/paris-swd_en.pdf.
1.1 1.1
5.6
-2.4
-8.1 -5.1
-2 -2.8
-12
-10
-8
-6
-4
-2
0
2
4
6
8
2005/2008 2008/2012
%
c
h
n
a
g
e
Population GDP/capita Energy intensity/GDP Carbon intensity energy
14
Table 1.1 Global greenhouse gas emissions since 1990 per country and capita (All
sources and sinks, excluding forest and peat fires).
Greenhouse gas emissions Emissions/capita
1990
levels
2012
levels
2012
share 1990 2013
MtCO2eq. % tCO2/capita
World total
or average 36244 49793 100% 4.3 4.9
EU-28 5368 4241 8.5 9.2 7.3
US 5402 5546 11.1 20 17
China 3893 12455 25.0 2.1 7.4
India 1387 3003 6.0 0.8 1.7
Japan 1168 1268 2.5 9.5 11
Russian
Fed. 3532 1755 3.5 17 13
Brazil 1606 2989 6.0 1.5 2.6
Rep. Korea 301 669 1.3 5.9 13
Mexico 494 663 1.3 3.6 3.9
Canada 520 739 1.5 16 16
Indonesia 1165 1171 2.4 0.9 2
Turkey 144 380 0.8 2.8 4.4
Australia 545 559 1.1 16 17
Argentina 267 380 0.8 3.3 4.5
Saudi
Arabia 205 549 1.0 10 17
South
Africa 349 451 0.9 7.3 6.2
G20
aggregate 26347 36819 73.7 n.a. n.a.
Limiting global warming to 2° C requires a significant reduction in the emissions of
greenhouse gases. The largest component is carbon dioxide (CO2), which in the EU
represents more than 80% of total emissions. The release of CO2 is directly connected
with the use of fossil fuels that we use massively in power generation, industry and
transport. The other gases are methane (CH4), nitrous oxide (N2O) and fluorinated gases
(F-gases). These are quantitatively less voluminous, but are more potent global warming
gases than CO2, having a correspondingly greater impact on the climate system.
Figure 1.4 shows the contribution made by the various sectors and gases in 2012. Clearly,
CO2 emissions are the most important and more than 94% of CO2 emissions come from
energy consumption. The second most important gas is methane (CH4) followed by
nitrous oxide (N2O) and fluorinated gases (F-gases), the latter from industrial processes
such as cooling and refrigeration.

15
Figure 1.4 Total greenhouse gas emissions by gas in the EU-28 in 2012 (Source:
EEA)
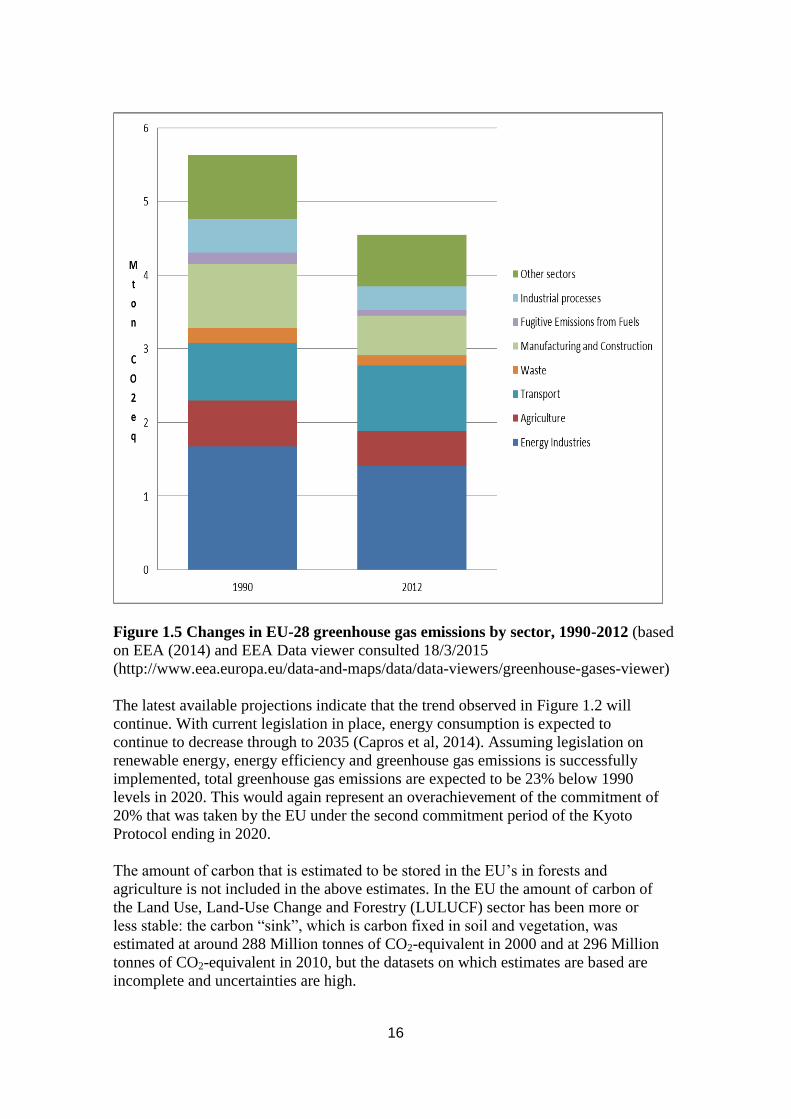
Figure 1.5 shows the changes for the various sectors over time. Compared to the EU-wide
reduction of 19% in the period 1990 to 2012, most sectors have achieved more than this
with the exception of the transport sector, where emissions have increased since 1990.
Emissions from waste, energy use and industrial processes have, by contrast, fallen by
considerably more than the 19% average.
Under the Kyoto Protocol, the 15 countries which were EU Member States in 1997 (the
"EU-15") agreed to reduce their collective emissions of six greenhouse gases in the 2008-
2012 period by 8% below 1990 levels. Over the period, these Member States
substantially over-achieved this target and actually reduced their emissions by as much as
18.5%.
CO2 81.6%
CH4 8.9%
N2O 7.5%
F-gases 2.1%
CO2:
Combustion 94%
Industrial processes 6%
CH4 :
Agriculture 50%
Waste 31%
Fugitives &
combustion 19%
F-gases:
industrial
processes
100%
N2O:
Agriculture 81%
Ind. Processes
and solvents 5%
Combustion 10%
Waste 4%
16
Figure 1.5 Changes in EU-28 greenhouse gas emissions by sector, 1990-2012 (based
on EEA (2014) and EEA Data viewer consulted 18/3/2015
(http://www.eea.europa.eu/data-and-maps/data/data-viewers/greenhouse-gases-viewer)
The latest available projections indicate that the trend observed in Figure 1.2 will
continue. With current legislation in place, energy consumption is expected to
continue to decrease through to 2035 (Capros et al, 2014). Assuming legislation on
renewable energy, energy efficiency and greenhouse gas emissions is successfully
implemented, total greenhouse gas emissions are expected to be 23% below 1990
levels in 2020. This would again represent an overachievement of the commitment of
20% that was taken by the EU under the second commitment period of the Kyoto
Protocol ending in 2020.
The amount of carbon that is estimated to be stored in the EU’s in forests and
agriculture is not included in the above estimates. In the EU the amount of carbon of
the Land Use, Land-Use Change and Forestry (LULUCF) sector has been more or
less stable: the carbon “sink”, which is carbon fixed in soil and vegetation, was
estimated at around 288 Million tonnes of CO2-equivalent in 2000 and at 296 Million
tonnes of CO2-equivalent in 2010, but the datasets on which estimates are based are
incomplete and uncertainties are high.

17
Conclusion: the EU has succeeded in decoupling its emissions from economic
growth. Since 1990 GDP increased by 45% (to 2013) while emissions decreased
by 19%. At the same time the obligations under the Kyoto Protocol to 2012
were achieved and surpassed: a reduction of 8% was promised; a reduction of
18% was delivered. Also for 2020 an over-achievement is likely.
Implementation of the 2020 climate and energy package
On the basis of the Commission’s proposal, the March 2007 European Council made an
independent commitment to reduce overall greenhouse gas emissions by 20% compared
to 1990 levels.
“Independent” meant that the EU would implement the emission reduction commitment
irrespective of what other countries would do in terms of reducing greenhouse gas
emissions. This commitment was part of a broader climate and energy strategy, aimed at
creating a competitive edge in emerging new technologies, and reducing economic
vulnerability against rising import prices for fossil fuels, and more generally for energy
security reasons. The greenhouse gas reduction commitment was therefore
accompanied by specific energy objectives, notably a binding target to increase the
share of renewable energy in final energy consumption to 20% in 2020 (from about
8.5% in 2005), and an indicative target to reduce energy consumption by 20% in 202011
.
The 20% greenhouse gas reduction commitment12
was embodied in a package of
legislative measures that were all agreed by the EU before the Copenhagen Conference
of Parties to the United Nations Framework Convention on Climate Change (UNFCCC)
in December 2009. The underlying rationale for doing this was to show the EU’s
seriousness of intent and commitment to the international negotiations.
These legislative initiatives were collectively called the "climate and energy package",
and consisted of six pieces of legislation that were all finally adopted in April 2009:
1. Directive 2009/29/EC of the European Parliament and of the Council of 23
April 2009 amending Directive 2003/87/EC so as to improve and extend the
greenhouse gas emission allowance trading scheme of the Community13
;
2. Decision No 406/2009/EC of the European Parliament and of the Council of 23
April 2009 on the effort of Member States to reduce their greenhouse gas
emissions to meet the Community’s greenhouse gas emission reduction
commitments up to 2020, hereafter referred to as the Effort Sharing Decision14
;
11 Compared to the EU’s projected energy consumption in 2020, as established in the 2007 baseline
scenario of the Impact Assessment for the 2020 climate and energy package. (see Capros et al, 2008) 12
The 20% reduction in greenhouse gas emissions compared to 2020 is equivalent to an emissions
reduction of 14% compared to 2005. 13
OJ L 140, 5.6.2009, p. 63–87; http://eur-
lex.europa.eu/LexUriServ/LexUriServ.do?uri=OJ:L:2009:140:0063:0087:en:PDF 14
OJ L 140, 5.6.2009, p. 136–148; http://eur-
18
3. Directive 2009/28/EC of the European Parliament and of the Council of 23
April 2009 on the promotion of the use of energy from renewable sources and
amending and subsequently repealing Directives 2001/77/EC and 2003/30/EC15
;
4. Directive 2009/30/EC of the European Parliament and of the Council of 23
April 2009 amending Directive 98/70/EC as regards the specification of petrol,
diesel and gas-oil and introducing a mechanism to monitor and reduce
greenhouse gas emissions and amending Council Directive 1999/32/EC as
regards the specification of fuel used by inland waterway vessels16
;
5. Regulation (EC) No 443/2009 of the European Parliament and of the Council
of 23 April 2009 setting emission performance standards for new passenger cars
as part of the Community's integrated approach to reduce CO2 emissions from
light-duty vehicles17
;
6. Directive 2009/31/EC of the European Parliament and of the Council of 23
April 2009 on the geological storage of carbon dioxide18
.
To meet the 20% reduction target in greenhouse gas emissions it was decided that the
sources covered by the EU’s Emissions Trading System (ETS) should reduce their
greenhouse gas emissions by 21% compared to 2005. 2005 was chosen since it was the
first year for which verified emissions data for the installations covered by the ETS
were available.
Other emissions sources, not covered by the ETS (e.g. transport, buildings, the services
sector, small industries and agriculture), but covered by the Effort Sharing Decision,
had to reduce their collective emissions by 10% compared to 2005. The split between
reductions to be delivered by ETS versus the sectors not covered by the ETS was based
on economic analysis showing that it would be relatively cheaper to reduce emissions in
the ETS sectors than in the non-ETS sectors. In other words, for the same marginal
costs (or carbon price) more reduction would be achieved in the ETS than in the non-
ETS.
A major issue in the negotiations leading to adoption of the package was the distribution
of effort, and hence costs, across Member States. The economic analysis underpinning
the package had demonstrated considerable differences in costs if effort (and targets)
would be distributed purely on the basis of cost-effectiveness (i.e. an equal marginal
cost of abatement per Member State). Cost-effectiveness alone would mean that lower-
lex.europa.eu/LexUriServ/LexUriServ.do?uri=OJ:L:2009:140:0136:0148:EN:PDF 15
OJ L 140, 5.6.2009, p. 16–62; http://eur-lex.europa.eu/legal-
content/EN/TXT/PDF/?uri=CELEX:32009L0028&from=en 16
OJ L 140, 5.6.2009, p. 88–113; http://eur-lex.europa.eu/legal-
content/EN/TXT/PDF/?uri=CELEX:32009L0030&from=EN 17
OJ L 140, 5.6.2009, p. 1–15; http://eur-lex.europa.eu/legal-
content/EN/TXT/PDF/?uri=CELEX:32009R0443&from=EN 18
OJ L 140, 5.6.2009, p. 114–135; http://eur-lex.europa.eu/legal-
content/EN/TXT/PDF/?uri=CELEX:32009L0031&from=EN
19
income Member States, notably in Eastern Europe, would be facing relatively higher
costs in relative terms, because of their relatively higher energy- and carbon-intensity
and because of their relatively lower GDP. At the same time, it was crucial to ensure
cost-effectiveness, as the costs of compliance could rise sharply if low-cost abatement
options, for instance in old and inefficient power and industrial plants in Eastern
Europe, were not realised.
The architecture of the package therefore had to engineer a smart combination of
targets, on the one hand, that were differentiated to reflect fairness and solidarity, and
policy instruments on the other hand, that ensure a cost-effective implementation.
The principle of using cost-effective policy instruments is exemplified by the use of the
EU ETS as an EU-wide market-based instrument, covering more than 11,000 power and
industrial installations across Europe, with one EU-wide cap on emissions (rather than
distinct national targets for ETS-covered sectors). Such an EU-wide approach ensures
that abatement is achieved where cheapest and avoids distortion of competition between
large industrial installations within the EU. Similarly, EU-wide energy- or CO2-
efficiency standards for cars and products are based on internal market principles, given
that these goods can be freely traded across the EU, and thereby enable the harnessing
of economies of scale provided by a market of more than 500 million consumers.
The principle of ensuring a fair distribution of the effort was achieved in several ways.
First, in the EU ETS, this was accomplished through a redistribution of allowances for
auctioning (as explained in more detail in chapter 2), thereby ensuring a redistribution
of the revenues that each Member Statecould expect. In other words, the burden-sharing
as agreed in the Council for the first commitment period of the Kyoto Protocol was
replaced, at least for the sectors covered by the EU ETS, by a fully harmonised policy
instrument with a sharing of auctioning revenues.
Second, when setting emissions targets for each Member State in sectors not covered by
the EU ETS (notably transport, buildings, agriculture and smaller businesses), account
was taken of the national per capita income19
, leading to the differentiated targets for
each Member State of the Effort Sharing Decision, ranging from -20% compared to
2005 for the highest income countries to +20% compared to 2005 for countries with the
lowest average per capita income(see Delbeke et al., 2010 and Capros et al., 2011). In
this way, Member States with similar economic performance, often neighbouring each
other, were allocated similar targets. This approach greatly facilitated agreement in the
Council.
Considering the uncertainties related to future economic development, and to enhance
cost-effective achievement of targets, further flexibility was also introduced between
Member States in the Effort Sharing Decision, allowing the transfer of emission rights
between them. In this way, countries facing higher costs could achieve their target more
cheaply, and countries over-achieving their target could be financially rewarded.
19
This principle was also used, to some extent, in the definition of the renewable energy targets for each
Member State.

20
Finally, in both the ETS and the Effort Sharing Decision a limited amount of
international credits were allowed to be used.
Conclusion: the EU adopted for 2020 a set of targets for climate and energy: 20%
greenhouse gas reduction, 20% renewable energy, and 20% energy efficiency
improvement. An integrated approach, with the flexibilities foreseen in each of the
instruments, allows the targets to be met in a cost-effective manner, while sharing
the burden between Member States on the basis of their relative wealth.
The road to 2050 and the new targets for 2030
The EU has repeatedly confirmed its commitment to the below - 2°C objective, as well
as to the long-term target this requires, i.e. a 80-95% reduction of greenhouse gases by
2050 compared to 1990. But questions still remained on the reduction pathways and on
the technological, behavioural and energy and transport-system changes that such a
major transition to a low-carbon economy implies over time.
In 2011, the European Commission therefore produced a Low Carbon Roadmap and an
Energy Roadmap to flesh out the perspective through to 205020
. The objective of this
exercise was not to try to forecast the likely economic, technological and societal
changes over such a long time frame, but rather to deepen the understanding and
provide more underlying analysis regarding questions such as:
- What is the domestic greenhouse gas reduction the EU needs to achieve as part
of a low-carbon transition consistent with the below - 2°C objective?
- What is the cost-efficient pathway towards 2050, and what are the milestones for
2030, 2040 and 2050? What does this pathway look like for key sectors, such as
power generation, transport, industry, buildings, agriculture? What is the range
of the expected costs and benefits?
- Can we afford to delay action until, perhaps, more technologies are available?
What are the key technologies that are crucially important in the low-carbon
transition and which therefore require important R&D efforts? What is the
impact of early availability or non-availability of certain technologies (nuclear,
Carbon Capture and Storage, energy storage, electrification of transport)?
- Can we make estimates of the investment needs and in how far is that balanced
through reduced energy bills?
- How does the energy mix evolve? What is the role of gas in the transition? Is it
feasible to have very high levels of variable renewables (wind, solar) and if so,
what are the implications for the electricity system? What is the impact of a
global energy transition on fossil fuel prices and hence on the policies needed to
achieve such a pathway?
20
COM(2011)112 final of 08/03/2011: Communication: “A Roadmap for moving to a competitive low
carbon economy in 2050”.: http://eur-lex.europa.eu/resource.html?uri=cellar:5db26ecc-ba4e-4de2-ae08-
dba649109d18.0002.03/DOC_1&format=PDF &
COM(2011) 885 final of 15/12/2011: Communication: “Energy Roadmap 2050”: http://eur-
lex.europa.eu/legal-content/EN/TXT/PDF/?uri=CELEX:52011DC0885&rid=3

21
- What might be the role of biomass or biofuels considering potential global land-
use constraints, such as the need to stop deforestation?
- What does decarbonisation imply for energy-intensive industrial sectors?
The Low-carbon economy 2050 Roadmap was based primarily on economic and cost-
effectiveness considerations. It showed that, as part of a global effort to meet 2°C, it is
technologically and economically feasible for the EU to achieve domestic emission
reductions of at least 80% compared to 1990 in 2050. In this way, the 2050 Roadmap
made clear that making use of international offset credits could not be the main
instrument to achieve deep emission reductions in the order of 80 to 95%.
The Roadmap also sets out interim reductions, so called “milestones”, of 40% by 2030
and 60% by 2040. It also elaborates how the main sectors (power generation, industry,
transport, buildings and construction, as well as agriculture) could make the transition to
a low-carbon economy cost-effectively (see Figure 1.6) 21
. These pathways are quite
different for the different sectors, in terms of scale and pace. The analysis done showed,
for example, that the pace of the transition was the fastest in power generation, enabled
through a mix of comparatively low-cost low-carbon technologies. Also in buildings
substantial progress is possible through sustained efforts to build new low-energy
houses, deep renovation of existing buildings and increased efficiency of heating and
cooling systems.
Transport and industry also show moderate reductions until 2030, mostly through
efficiency improvements. However, after 2030, innovative technologies would be
needed, such as the deployment of electric mobility and Carbon Capture and Storage
(CCS). Finally, agricultural emissions are the ones that are reduced the least. This is in
large part due to the fact that these emissions are closely linked to meat consumption,
and hence further reductions would require behavioural changes of diet.
An important finding of the low-carbon economy 2050 Roadmap relates to investments
needs. To make this transition, it was estimated that the EU would need to invest an
additional €270 billion, or 1.5% of its GDP annually, on average, over the period 2010-
2050, over and above investments that would be needed anyway. These are largely
investments in capital goods, such as low-carbon generation technologies (e.g. solar, on
and offshore wind, nuclear, CCS), extended grid connections, including smart grids,
new automotive and other transport technologies, low-energy houses, more efficient
appliances, etc.
21
See: COM(2011)112 final of 08/03/2011: Communication: “A Roadmap for moving to a competitive
low carbon economy in 2050” http://eur-lex.europa.eu/resource.html?uri=cellar:5db26ecc-ba4e-4de2-
ae08-dba649109d18.0002.03/DOC_1&format=PDF

22
Figure 1.6 The transition to a low-carbon EU economy in 2050 (greenhouse gas
emissions by sector over time as % of 1990 levels)
The development and production of these kinds of products and equipment are one of
the strengths of Europe’s economy. The low-carbon transition therefore provides a
major opportunity for Europe’s manufacturing industry, provided it succeeds in
maintaining and enhancing its technological edge. No longer blessed with major natural
resources and confronted with higher labour costs, innovation is clearly one of the
major industrial policy directions needed for the EU to create more economic growth
and new jobs. In addition, the EU would become less dependent on expensive imports
of oil and gas and less vulnerable to increases in oil prices. On average, and subject to
the uncertainties of future oil prices, the EU could save between €175-320 billion
annually in fuel costs over the next 40 years.
Furthermore, greater use of clean technologies and electric cars is expected to also
substantially reduce air pollution in European cities. Fewer people would suffer from
asthma and other respiratory diseases, and mortality would decline. Considerably less
money would need to be spent on equipment to control air pollution and significant
monetary benefits would accrue from, for example, reduced mortality. By 2050, the EU
could save up to €88 billion a year in respect of air quality benefits.
Building on these discussions the Commission published a Communication entitled “A
policy framework for climate and energy policies in the period from 2020 to 2030”22
. It
22
European Commission (2014) A policy framework for climate and energy in the period from 2020 to
2030, European Commission, COM (2014)15 final of 22/01/2014. http://eur-lex.europa.eu/legal-
0%
20%
40%
60%
80%
100%
1990 2000 2010 2020 2030 2040 2050
0%
20%
40%
60%
80%
100%
Current policy
Power Sector
Residential & Tertiary
Non CO2 Other Sectors
Industry
Transport
Non CO2 Agriculture

23
concentrated on the opportunities and challenges for 2030 and outlined the questions for
a debate by Heads of State and Government.
In October 2014, the European Council adopted a series of targets in view of 2030: at
least 40% domestic greenhouse gas reduction target (below 1990 levels), of “at least
27%” for renewable energy “binding at EU level”, and an “indicative target” of “at least
27%” for energy efficiency23
. An additional objective of “arriving at a 15% target by
2030” with respect to interconnectivity in electricity networks between Member States
was also agreed, reflecting the crucial role of electricity connectors to strengthen the EU
internal market for electricity, to enable greater penetration of renewable energy and to
improve security of supply.
It was further agreed that the reduction factor of the EU ETS would be increased from
1.74% per year at present to 2.2% per year from 2021. This would equate to a reduction
of emissions from the EU ETS sectors of 43% compared to their level in 2005. For the
sectors not covered by the ETS, a reduction of emissions of 30% compared to 2005 was
agreed and would be differentiated amongst Member States between 0% and -40%
(compared to 2005). Further elements were agreed ensuring fairness between the Member
States, as well as provisions to limit “carbon leakage” (i.e. the shifting of production and
emissions outside the EU) resulting from third country competition.
For renewable energy a target at EU level was agreed without explicit differentiation
between Member States. No sub-target was set for transport, unlike for 2020, reflecting
the wish of Member States for greater flexibility. At the same time, the European
Council suggested a strengthened role of the EU ETS in spurring the deployment of
mature renewable technologies, and a strengthened role for the EU to ensure that the
target is met collectively. All of this implies that a revision of the Directive on
renewable energy is necessary for the period after 2020.
Energy efficiency will continue to play an important role in meeting all objectives of
EU energy policy. The indicative target of “at least 27%” will enhance energy supply
security and is expected to stimulate investments in buildings as well as in new
technologies. It will contribute to growth and jobs while limiting energy bills for
consumers24
.
Important to note is that the European Council reaffirmed the central role of the EU
ETS as a key instrument to reduce greenhouse gas emissions in the covered sectors. It
further acknowledged the importance of “an instrument to stabilise the market in line
with the Commission proposal” for a Market Stability Reserve25
to address the
content/EN/TXT/PDF/?uri=CELEX:52014DC0015&from=EN 23
European Council 23/24 October 2014, Conclusions. EUCO 169/14. European Council, Brussels, 24
October 2014: http://www.consilium.europa.eu/uedocs/cms_data/docs/pressdata/en/ec/145397.pdf
24
European Commission (2014) Energy efficiency and its contribution to energy security and the 2030
Framework for climate and energy policy, Communication, COM (2014)520 final, 23.7.2014, as well as
its accompanying Staff Working Document:
http://ec.europa.eu/energy/sites/ener/files/documents/2014_eec_communication_adopted_0.pdf 25
European Commission (2014) Proposal for a Decision of the European Parliament and of the Council
concerning the establishment and operation of a market stability reserve for the Union greenhouse gas
emission trading scheme and amending Directive 2003/87/EC, of 22.01.2014; http://eur-

24
significant surplus of allowances in the EU ETS. In May 2015 negotiations on this were
still not formally finalised between the European Parliament and the Council, although a
political agreement had been reached. Once operating, the Market Stability Reserve will
automatically adjust the volumes of allowances to be auctioned in accordance with pre-
defined and transparent rules. As such, this proposal will enhance the resilience of the
EU ETS in the case of unexpected increases or decreases in the number of allowances in
the market.
Conclusion: the EU has taken up the challenge to limit climate change to 2°C. This
requires a domestic emission reduction of at least 80% by 2050. Today the 20%
target for 2020 has almost been achieved and a political commitment at the highest
political level has been made for a domestic reduction of (at least) 40% by 2030. The
EU has based its policy on considerations related to cost-effectiveness and relies on
market-based instruments. Through more than a decade of continued policy along
those lines, the EU has assumed leadership in the development and deployment of
low-carbon technology.
References
Capros, P. Mantzos L., Papandreou V., Tasios N. (2008) European Energy and
transport trends to 2030 – update 2007.Publications office of the European Union,
Luxembourg
(http://ec.europa.eu/dgs/energy_transport/figures/trends_2030_update_2007/energy_tra
nsport_trends_2030_update_2007_en.pdf.).
Capros, P., Mantzos L., Parousos L., Tasios N., Klaassen G. and van Ierland T. (2011)
Analysis of the EU policy package on climate change and renewables. Energy Policy
39(3): 1476-1485.
Capros, P. de Vita A., Tasios N., Papadopoulos D., Siskos P., Apostolaki E., Zampara
M, Paroussos L., Fragiadakis K., Kouvaritakis N., Hoglund-Isaksson L., Winiwarter
W., Purohit P., Böttcher H., Frank S., Havlik P., Gustu M. and Witzke H.P.. (2014) EU
energy, transport and GHG emissions: trends to 2050, reference scenario 2013.
Publications office of the European Union, Luxembourg.
(http://ec.europa.eu/clima/policies/2030/models/eu_trends_2050_en.pdf).
Delbeke, J., Klaassen G., van Ierland T. and Zapfel P. (2010) The Role of
Environmental Economics in Recent Policy Making at the European Commission
Review of Environmental Economics and Policy 4(1): 24-43.
EEA (2014) Annual European Union greenhouse gas inventory 1990-2012 and
inventory report 2014, Technical report Submission to the UNFCCC Secretariat, EEA Technical report No 9/2014, European Environment Agency, Copenhagen.
(http://www.eea.europa.eu/publications/european-union-greenhouse-gas-inventory-
2014).
lex.europa.eu/legal-content/EN/TXT/PDF/?uri=CELEX:52014PC0020&from=EN
25
EEA (2014a) Why did greenhouse gas emissions decrease in the EU in 2012? European
Environment Agency - Analysis, Copenhagen.
(http://www.eea.europa.eu/publications/why-did-ghg-emissions-decrease).
IPCC (2013) Summary for Policy Makers. In: Climate Change 2013: The Physical
Science Basis. Contribution of Working Group I to the Fifth Assessment Report of the
Intergovernmental Panel on Climate Change [Stocker, T.F., D. Qin, G.-K. Plattner, M.
Tignor, S. K. Allen, J. Boschung, A. Nauels, Y. Xia, V. Bex and P.M. Midgley (eds.)]
Cambridge University Press, Cambridge, United Kingdom and New York, NY, USA,
pp 1-30..doi:10.1017/CBO9781107415324.004 (http://www.ipcc.ch/pdf/assessment-
report/ar5/wg1/WG1AR5_SPM_FINAL.pdf)
IPCC (2014): Climate Change 2014: Synthesis Report. Contribution of Working
Groups I, II and III to the Fifth Assessment Report of the Intergovernmental Panel on
Climate Change [Core Writing Team, R.K. Pachauri and L.A. Meyer (eds.)]. IPCC,
Geneva, Switzerland, 151 pp.
Meadows, D.H, Meadows D., Randers J., and Behrens III W W. (1972) Limits to
Growth, New York: Universe Books. (http://www.donellameadows.org/wp-
content/userfiles/Limits-to-Growth-digital-scan-version.pdf )

26
2 EU ETS: Pricing carbon to drive cost-effective reductions
across Europe
Damien Meadows, Yvon Slingenberg and Peter Zapfel
The ETS is the EU's cap-and-trade system for greenhouse gas emissions
The EU ETS covers half of EU emissions
A core element of the EU climate and energy policy since 2005 has been putting a price
on greenhouse gas emissions and using market forces to contribute to the necessary
emission reductions. The EU Emissions Trading System (ETS), a so-called cap-and-trade
system, creates such a price.
Cap-and-trade systems guarantee an environmental outcome by setting a limit (“cap”) on
the total amount of carbon emissions. Such a system foresees the issuance of allowances
in quantities corresponding to the emissions cap, and these allowances are then allocated
to companies covered by the system. The trading of these allowances is allowed, while
maintaining the obligation that companies covered regularly surrender sufficient
allowances to match their actual emissions. The benefit is that it enables reductions in
emissions across all the installations covered by the system in the most cost-effective
manner. A company will find it in its own interest to cut emissions and sell allowances
when the market price for allowances is higher than the costs to reduce its emissions.
Conversely, those companies with reduction costs exceeding the market price will prefer
to purchase allowances. Reductions are incentivised where costs of abatement are lowest,
while the environmental outcome remains guaranteed by the overall emissions ceiling.
When a variety of sectors is covered, it allows continued growth for individual sectors by
purchasing allowances from other sectors, where emission reductions are cheaper to
make.
Cap-and-trade systems, and other market-based measures like carbon taxes, also have the
potential to generate money that can be used for climate change mitigation and
adaptation. They also strengthen the business case for making investments in low-carbon
technology: the rate of return is improved and the payback period is reduced, as
compared to more carbon-intensive ones. By putting a price on carbon, companies and
economic actors are encouraged to include its value in their operational decision-making
and long-term investment planning.
In short, cap-and-trade is a valuable tool because it can reduce greenhouse gas emissions
more cost-effectively than other policy options, which means that greater reductions can
be achieved for the same cost. In the light of the advantages of this instrument, the EU
established the EU ETS, which has been in place since 2005. Some inspiration was found
from the solid design of the SO2 allowance trading system under the U.S. Clean Air Act.
For the EU, the choice of this market-based instrument represented a significant
departure from previous EU environmental legislation.
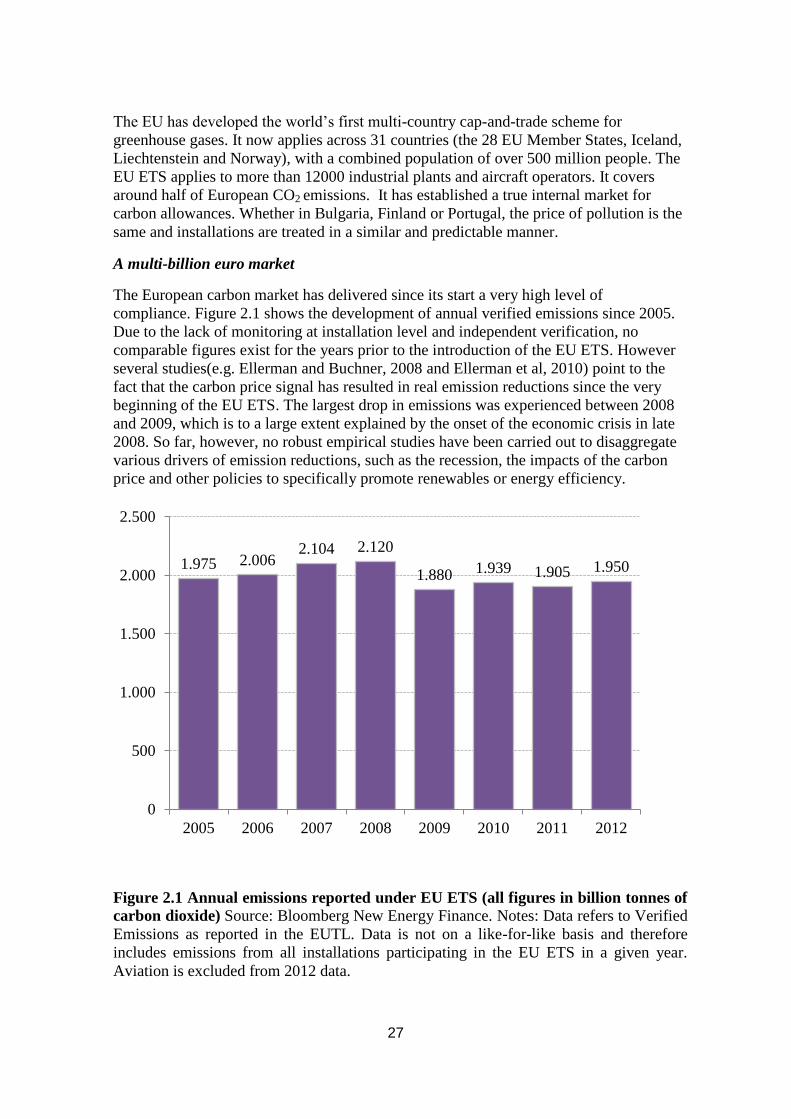
27
The EU has developed the world’s first multi-country cap-and-trade scheme for
greenhouse gases. It now applies across 31 countries (the 28 EU Member States, Iceland,
Liechtenstein and Norway), with a combined population of over 500 million people. The
EU ETS applies to more than 12000 industrial plants and aircraft operators. It covers
around half of European CO2 emissions. It has established a true internal market for
carbon allowances. Whether in Bulgaria, Finland or Portugal, the price of pollution is the
same and installations are treated in a similar and predictable manner.
A multi-billion euro market
The European carbon market has delivered since its start a very high level of
compliance. Figure 2.1 shows the development of annual verified emissions since 2005.
Due to the lack of monitoring at installation level and independent verification, no
comparable figures exist for the years prior to the introduction of the EU ETS. However
several studies(e.g. Ellerman and Buchner, 2008 and Ellerman et al, 2010) point to the
fact that the carbon price signal has resulted in real emission reductions since the very
beginning of the EU ETS. The largest drop in emissions was experienced between 2008
and 2009, which is to a large extent explained by the onset of the economic crisis in late
2008. So far, however, no robust empirical studies have been carried out to disaggregate
various drivers of emission reductions, such as the recession, the impacts of the carbon
price and other policies to specifically promote renewables or energy efficiency.
Figure 2.1 Annual emissions reported under EU ETS (all figures in billion tonnes of
carbon dioxide) Source: Bloomberg New Energy Finance. Notes: Data refers to Verified
Emissions as reported in the EUTL. Data is not on a like-for-like basis and therefore
includes emissions from all installations participating in the EU ETS in a given year.
Aviation is excluded from 2012 data.
1.975 2.006 2.104 2.120
1.880 1.939 1.905 1.950
0
500
1.000
1.500
2.000
2.500
2005 2006 2007 2008 2009 2010 2011 2012
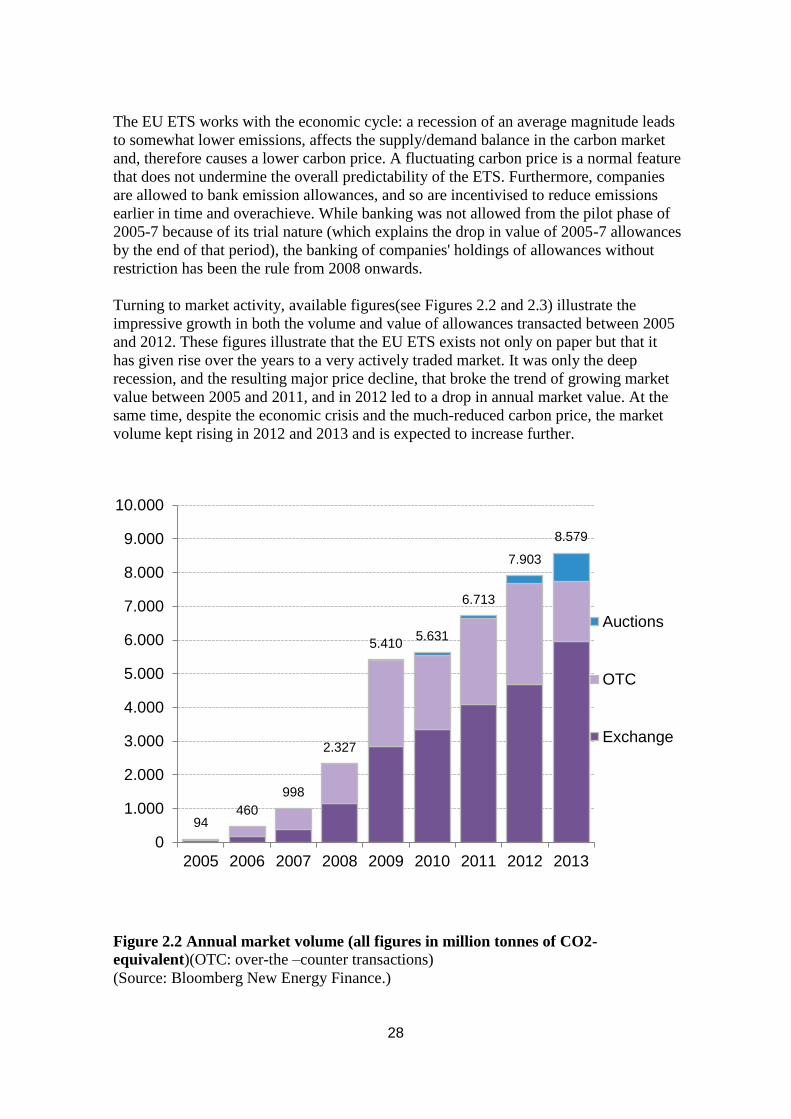
28
The EU ETS works with the economic cycle: a recession of an average magnitude leads
to somewhat lower emissions, affects the supply/demand balance in the carbon market
and, therefore causes a lower carbon price. A fluctuating carbon price is a normal feature
that does not undermine the overall predictability of the ETS. Furthermore, companies
are allowed to bank emission allowances, and so are incentivised to reduce emissions
earlier in time and overachieve. While banking was not allowed from the pilot phase of
2005-7 because of its trial nature (which explains the drop in value of 2005-7 allowances
by the end of that period), the banking of companies' holdings of allowances without
restriction has been the rule from 2008 onwards.
Turning to market activity, available figures(see Figures 2.2 and 2.3) illustrate the
impressive growth in both the volume and value of allowances transacted between 2005
and 2012. These figures illustrate that the EU ETS exists not only on paper but that it
has given rise over the years to a very actively traded market. It was only the deep
recession, and the resulting major price decline, that broke the trend of growing market
value between 2005 and 2011, and in 2012 led to a drop in annual market value. At the
same time, despite the economic crisis and the much-reduced carbon price, the market
volume kept rising in 2012 and 2013 and is expected to increase further.
Figure 2.2 Annual market volume (all figures in million tonnes of CO2-
equivalent)(OTC: over-the –counter transactions)
(Source: Bloomberg New Energy Finance.)
94 460
998
2.327
5.410 5.631
6.713
7.903
8.579
0
1.000
2.000
3.000
4.000
5.000
6.000
7.000
8.000
9.000
10.000
2005 2006 2007 2008 2009 2010 2011 2012 2013
Auctions
OTC
Exchange

29
Figure 2.3 Annual market value (all figures in 1000 million euro).Source: Data taken
from Bloomberg, ICE, Bluenext, EEX, GreenX, Climex, CCX, Greenmarket, Nordpool;
other sources include UNFCCC and Bloomberg New Energy Finance estimations.
A well-functioning market requires trust and confidence that all players play by the rules.
It is therefore of utmost importance that a solid system of monitoring, reporting and
verification of emissions is in place. Similarly, there have to be effective compliance
provisions. Since 2008 in the EU ETS, in case of failure to comply, there is a penalty of
€100 per tonne of excess emission plus the obligation to make up the shortfall.
Conclusion: the EU ETS covers half of the EU's CO2 emissions, mainly from the
power sector and manufacturing industry. It represents today emissions of a little
less than 2 billion tonnes of CO2, and this amount is declining gradually over time.
Market value was climbing to some €80 billion in 2011, but fell back to some €50
billion in 2013 following the protracted economic downturn in Europe.
Key design elements
The central role of a binding emissions cap
A binding, enforceable and decreasing cap placed on absolute greenhouse gas emissions
is a core principle of the EU ETS. This is simple, clear, and has significant advantages
alternative approaches such as setting targets based on expectations of future emissions
growth, or compared to the relative efficiency of particular processes or production
techniques. Within this overall limit, individual companies have the freedom to reduce
or increase emissions as they see fit, and the system will ensure that the overall cap is
met.
2
8
18
51
67 73
81
56
37
0
10
20
30
40
50
60
70
80
90
2005 2006 2007 2008 2009 2010 2011 2012 2013
Auctions
OTC
Exchange

30
The overall cap for the EU ETS has been calculated to correspond with what economic
analysis has shown would be a cost-effective contribution from the sectors covered to
meeting the EU's overall economy-wide 20% greenhouse gas reduction commitment for
2020. The cap decreases by 1.74% per year from 2010 based on the average cap for
2008-12, the second phase of the EU ETS26
. This annual reduction factor of 1.74% has
been fixed in order to reach an annual amount of carbon allowances 21% below 200527
levels by 2020.
The cap continues to reduce after 2020, although as mentioned in chapter 1, the
European Council has agreed that the reduction factor be increased to 2.2% a year from
2021, in order that a 43% reduction be attained by the ETS sectors by 2030 compared to
2005. These respective shares are determined by what is estimated to be a cost-effective
contribution by the sectors covered to meet a 40% economy-wide target by 2030.
The progressively tighter, legally binding cap on emissions applies at an overall level, not
at company level. Four months after the end of each calendar year, each company must
surrender sufficient allowances to cover its entire emissions for the previous year, or
financial penalties apply.
Conclusion: a clear and predictable decline of the cap over a long period of time is a
core design feature of the EU ETS. The total amount of allowances is being reduced
annually at a rate of 1.74% until 2020, and by 2.2% as of 2021.
More than half of carbon allowances are auctioned
There is a choice when setting up an emissions trading system as to whether allowances
are given away for free or not. The political decision when setting up the system in 2005
was for the majority of allowances to be given out for free. From 2013 onwards, about
half of the allowances are being auctioned, primarily to the power sector.
It is important to note that an emissions trading system is intended to have price effects
that flow through supply chains to the final consumer. There have been several studies
on when and to what extent these signals are passed through (Sijm et al, 2008,
Alexeeva-Talebi, 2010, Lise et al, 2010, Solier and Jouvet, 2013). In this context, there
has been much discussion on the question of whether companies were making
additional profits by passing through to consumers the price of allowances that they
received for free (so-called “windfall profits”). This has been particularly highlighted in
relation to the power sector, and for that reason no free allocation is given to the power
sector from 2013, except for some investment support in 8 Member States.
26
Article 1(9) of Directive 2009/29/EC of the European Parliament and of the Council of 23 April 2009
amending Directive 2003/87/EC so as to improve and extend the greenhouse gas emission allowance
trading scheme of the Community; OJ L 140, 05/06/2009, p. 63–87. http://eur-lex.europa.eu/legal-
content/EN/TXT/PDF/?uri=CELEX:32009L0029&from=EN 27
2005 is used as the reference year for ETS sectors because this is the first year for which comparable
monitoring, reporting and verification data is available for all installations covered by the system.

31
The decisions taken to avoid “windfall profits” does not affect the environmental
outcome of the EU ETS, but their political importance must not be under-estimated. It
should also be noted that, alongside the encouragement that the EU ETS gives for
emission reductions, the value of free allocations can help companies with investment
costs for equipment to make emission reductions. For example, the technology to gasify
paper-industry waste products into biofuel costs more than twice as much as a standard
boiler, and the value of allowances can help pay for such capital investments.
The EU ETS has seen an evolution from individual Member State initially selling very
limited amounts of allowances by auction, to an EU-wide auctioning process using a
common auction platform in which almost all Member States participate. The
legislation states that auctions shall be designed to ensure that operators have full, fair
and equitable access, that all participants have access to the same information at the
same time, that access to allowances is granted for small emitters and that the
organization and participation in auctions is cost-efficient. The Auctioning Regulation
adopted in 2010 fixes the auctioning rules in detail.
From a European perspective, it makes sense to have one single platform, a single
regime where everyone can have equal access. The European Energy Exchange (EEX)
based in Leipzig has been carrying out the role of the EU ETS' common auction
platform on behalf of 25 Member States, after selection through a joint procurement
exercise. Germany, the UK and Poland opted out of the common platform and have
parallel auction platforms or arrangements.
The EU itself has also been involved in the sale of allowances, through a provision of the
Directive which earmarks the value of up to 300 million allowances for investment in the
commercial demonstration of specific technologies for reducing emissions, in particular
for carbon capture and storage (CCS) plants and large-scale demonstration of innovative
renewable energy technologies. This provision is administered through a fund called the
“NER300”, which refers to the New Entrant Reserve from which 300 million allowances
were reserved for this purpose. Acting through the European Investment Bank (EIB),
around €2 billion has been raised from selling these allowances. This is of particular
relevance because the EU ETS carbon price is intended to stimulate the lowest-cost
emission reductions, and therefore it does not directly promote pre-commercial
demonstration of promising technologies which have higher costs than the prevailing
carbon price. The NER300 proceeds have been used to co-finance a number of
development and demonstration projects28
.
In addition, the legislation29
allows conditional free allocation for modernization of the
power sector. Eight of the Member States that joined the EU in 2004 have taken up this
option and submitted plans to the European Commission on how these free allocations 28
More details of about this Fund, and the investments it has contributed to, can be obtained from the
website of the European Commission at:
http://ec.europa.eu/clima/policies/lowcarbon/ner300/index_en.htm 29
Article 1(12) (inserting new Article 10c) of Directive 2009/29/EC of the European Parliament and of
the Council of 23 April 2009 amending Directive 2003/87/EC so as to improve and extend the
greenhouse gas emission allowance trading scheme of the Community; OJ L 140, 05/06/2009, p. 63–87;
http://eur-lex.europa.eu/legal-content/EN/TXT/PDF/?uri=CELEX:32009L0029&from=EN

32
will be linked to commitments from private companies for investments to modernize the
power sector. Conditional allocations worth the value of around 680 million allowances
are to be invested in the modernization of their power sectors up to 2019.
Aside from a limited earmarking of revenues at EU level for CCS and renewables under
the NER300, it is important to note that the majority of money generated from auctions is
in the control of Member States. European legislation states that at least half of auction
revenues should be used by Member States to tackle climate change, and a Declaration
by Heads of State emphasises Member States’ willingness to do this30
. A first official
reporting by Member States shows that over €3 billion of auctioning revenues in 2013 is
intended to be used for supporting internal and external climate policies31
.
Finally, it is also important to note that auction revenue is, to an extent, redistributed
across the EU to reflect equity and solidarity. 88% of allowances to be auctioned are
distributed amongst Member States based on their historical share of verified emissions,
while 10% is distributed amongst certain Member States for the purpose of solidarity
and growth and, up to 2020, a further 2% distributed amongst Member States whose
emissions were at least 20 % below their Kyoto Protocol base-year emissions in 200532
This distributional element in a multi-country context was instrumental in mobilizing
support for the legislation and is a valuable tool – like free allowances for companies – to
gain political acceptability for a cap-and-trade system while preserving an efficient
market outcome. This worked out well for the 2020 targets. Similar distributional
elements have been of key importance to the adoption of the 2030 package. While the
10% distribution was kept, the 2% element was substituted in favour of a modernisation
fund that will facilitate the modernisation of the power sector in Member States with a
GDP per capita significantly below the EU average.
Conclusion: of the allowances issued, more than half are being auctioned according
to strict market rules, primarily to the power sector.
30
See Council of European Union document date 12/12/2008 (Reference: 17215/08) “Energy and climate
change - Elements of the final compromise”: “The European Council recalls that Member States will
determine, in accordance with their respective constitutional and budgetary requirements, the use of
revenues generated from the auctioning of allowances in the EU emissions trading system. It takes note of
their willingness to use at least half of this amount for actions to reduce greenhouse gas emissions,
mitigate and adapt to climate change, for measures to avoid deforestation, to develop renewable
energies, energy efficiency as well as other technologies contributing to the transition to a safe and
sustainable low-carbon economy, including through capacity building, technology transfers, research
and development.” http://www.consilium.europa.eu/uedocs/cms_data/docs/pressdata/en/ec/104672.pdf 31
Report from the Commission to the European Parliament and the Council: Progress towards achieving
the Kyoto and EU 2020 objectives, Brussels (COM(2014)689 final dated 28 October 2014):
http://ec.europa.eu/transparency/regdoc/rep/1/2014/EN/1-2014-689-EN-F1-1.Pdf; see page 14 of report. 32
Article 1(12) (inserting new Article 10(2) and new Annexes IIa & IIb) of Directive 2009/29/EC of the
European Parliament and of the Council of 23 April 2009 amending Directive 2003/87/EC so as to
improve and extend the greenhouse gas emission allowance trading scheme of the Community; OJ L 140,
05/06/2009, p. 63–87. http://eur-lex.europa.eu/legal-
content/EN/TXT/PDF/?uri=CELEX:32009L0029&from=EN
33
A considerable proportion of carbon allowances are given out for free
Almost half of the allowances under the EU ETS are given out for free from 2013
onwards, the majority of these to industrial activities. While in a perfect world,
economists would advise that all allowances should be auctioned, this is less the case
for as long as all major economies are not pricing the external costs of greenhouse gas
emissions to an equivalent extent. Emission trading is very transparent in terms of its
price signal and, while recognising that there are many factors involved in investment
and operational decisions, an important issue for the EU is not to lose industry from
Europe to other countries (referred to as “carbon leakage”) simply because those other
countries might not pursue a similar carbon pricing approach. A multiplicity of actions
are, in fact, being taken around the world at various levels of governance, and these
actions also have economic impacts, albeit less transparent than an ETS. There is still a
perception, however, that free allocation is necessary to alleviate adverse impacts on
competitiveness.
The decision was taken in 2005 for there to be free allocation to industry under the EU
ETS, and in 2014 the EU’s Heads of State and Government decided to continue this
approach. This differs from other approaches which some stakeholders proposed, such
as putting a carbon price on imports of certain products from third country by means of
making importers subject to the requirement to surrender allowances. The rules for
these free allocations are harmonized across the EU, meaning that installations are
treated the same whichever Member State they are established in. This is a major step
forward in terms of ensuring a level playing field across the EU.
Ahead of the start of phase 3 of the EU ETS in 2013, 52 benchmarks and 3 fall-back
approaches for ex ante free allocation were agreed with Member States33
. These EU-
wide and fully-harmonized benchmarks cover all free allocations taking place under the
EU ETS from 2013 onwards (except in respect of modernization of the power sector as
described above). Table 2.1 gives the product benchmarks (based on Annex II to the
decision) setting the initial free allocation. In addition to these heat and fuel
benchmarks, benchmarks for refineries and aromatic benchmarks are defined.
The benchmarks take account of the most efficient techniques, substitutes and
alternative production processes. All allocations are decided ex ante and no free
allocation is made in respect of electricity production (except for electricity produced
from waste gases, and for the encouragement of modernization in 8 Member States).
Free allocation is given to district heating as well as to high-efficiency cogeneration in
respect of heating or cooling. Benchmarks are calculated for production, rather than
inputs to the production process, to maximize greenhouse gas emission reductions and
energy efficiency savings. The starting point for each benchmark was the average
performance of the 10% most efficient installations in a sector in the EU in 2005-8 or
2009-10.
33
Commission Decision of 27 April 2011 determining transitional Union-wide rules for harmonised free
allocation of emission allowances pursuant to Article 10a of Directive 2003/87/EC of the European
Parliament and of the Council, 2011/278/EU; OJ L 130, 17.5.2011, p. 1–45. http://eur-
lex.europa.eu/legal-content/EN/TXT/PDF/?uri=CELEX:32011D0278&from=EN

34
Table 2.1 Product benchmarks for free allocation defined as allowances (tonne
CO2 per 1000 tonnes produced) Product Benchmark Product Benchmark Product Benchmark
Coke 286 Sintered ore 171 Hot metal 1328
Pre-bake anode 224 Aluminium 1514 Grey cement 766
White cement clinker 987 Lime 954 Dolomite 1072
Sintered dolomite 987 Floatglass 453 Bottles&jars colourless 382
Bottles&jars coloured 306 Continuous
filament glass
fibre
406 Facing bricks
139
Pavers 192 Roof tiles 144 Spray dried powder 76
Plaster 48 Dried secondary
gypsum
17 Short fibre kraftpulp 120
Long fibre kraftpulp 60 Sulphite pulp 20 Recovered paper pulp 39
Newsprint 298 Uncoated fine
paper
318 Coated fine paper 318
Tissue 334 Testliner and
fluting
248 Uncoated carbon board 237
Coated carbon board 273 Nitric acid 302 Adipic acid 2790
Vinyl chloride
monomere
204 Phenol/acetone 266 S-PVC 85
E-PVC 238 Soda ash 843
The most efficient installations receive allocations around the level of their actual
emissions, while less efficient installations are faced with a shortfall. Three quarters of
industrial emissions are covered by the 52 product benchmarks. Given the diversity of
industrial activities, it is not possible for every product to have a specific benchmark.
For the other quarter, there is a hierarchy of approaches. The first is the application of a
heat-based energy benchmark (which applies to four fifths of the remaining emissions).
The remainder is covered by a fuel-based energy benchmark, or – for a small percentage
– is allocated in relation to process emissions based on past emissions levels.
The legislation includes a safeguard clause that ensures that the amount of allowances
given out for free through the application of the benchmarks cannot exceed the share of
emissions of those installations in the overall EU ETS cap in 2005-200734
.If this
34
Article 1(12) (inserting new Article 10a(5)) of Directive 2009/29/EC of the European Parliament and of
the Council of 23 April 2009 amending Directive 2003/87/EC so as to improve and extend the
greenhouse gas emission allowance trading scheme of the Community; OJ L 140, 05/06/2009, p. 63–87:
http://eur-lex.europa.eu/legal-content/EN/TXT/PDF/?uri=CELEX:32009L0029&from=EN

35
happens a uniform cross-sectoral correction factor is applied, which operates to reduce
allocations uniformly across all beneficiaries of free allocation. In this way, it is ensured
that the pre-determined limit of free allocation is not exceeded.
The benchmark decision allowed a choice of base years for production values, and this
reduced to some extent the stringency of the benchmarks and contributed to the need for
the cross-sectoral correction factor to be applied in practice. In 2013, the cross-sectoral
correction factor was around 6% increasing to around 18% by 2020. This created some
dissatisfaction in industry and led to the realisation that a more refined carbon leakage
system may be necessary for the post-2020 period so as to better focus on sectors or
sub-sectors where a real competitiveness impact arises.
In recognition of the fact that Europe’s cap-and-trade system was not replicated by
similar systems in most other major economies in 2009, it was decided that, from 2013
to 2020, allocations to a wide range of industry that are included on a list of those
“deemed to be exposed to carbon leakage” should be at the level of 100% of the
benchmarks that are adopted for harmonised free allocation. In the absence of this status,
industrial facilities are allocated at 80% of the benchmark in 2013 declining annually and
in a linear manner to a level of 30% in 2020. Allocation at a level of 100% of the
benchmark still means, however, that a majority of companies are allocated fewer
allowances than they are expected to need.
The list of industries “deemed to be exposed to a significant risk of carbon leakage” was
first adopted in 200935
for five years, and a new list has been adopted for 2015-1936
.
While industries cannot be removed from the list during the five-year period, a limited
number of additional sectors or subsectors have been added.
A sector is “deemed to be exposed to a significant risk of carbon leakage” if the sum of
additional costs related to both the direct emissions and the indirect impacts from the
use of electricity would lead to an increase of production costs of 5% or more and the
sector's intensity of trade with third countries is above 10%. Sectors are also included if
either EU ETS direct and indirect additional costs would lead to an increase of
production costs of at least 30%, or a sector's intensity of trade with third countries
exceeds 30%. Most of the sectors and sub-sectors are included on the 2009 list because
their intensity of trade with third countries exceeds 30%37
. The 2009 and 2014
assessments were based on an assumed carbon price of €30 a tonne.
35
Commission Decision of 24 December 2009 determining, pursuant to Directive 2003/87/EC of the
European Parliament and of the Council, a list of sectors and subsectors which are deemed to be exposed
to a significant risk of carbon leakage, 2010/2/EU; OJ L 1, 5.1.2010, p. 10–18: http://eur-
lex.europa.eu/legal-content/EN/TXT/PDF/?uri=CELEX:32010D0002&from=EN This decision was
subsequently amended in 2011, 2012 and 2013; for more details see:
http://ec.europa.eu/clima/policies/ets/cap/leakage/documentation_en.htm 36
2014/746/EU: Commission Decision of 27 October 2014 determining, pursuant to Directive
2003/87/EC of the European Parliament and of the Council, a list of sectors and subsectors which are
deemed to be exposed to a significant risk of carbon leakage, for the period 2015 to 2019 (notified under
document C(2014) 7809); OJ L 308, 29.10.2014, p. 114–124. http://eur-lex.europa.eu/legal-
content/EN/TXT/PDF/?uri=CELEX:32014D0746&from=EN 37
The level of disaggregation for sectors and sub-sectors was undertaken at a detailed level, so-called
“NACE-4”, with more disaggregated analysis for specific sub-sectors where this was considered justified.

36
Other sectors have been included on the list based on a qualitative assessment, taking
into account the extent to which it is possible for individual installations to reduce
emission levels or electricity consumption, current and projected market characteristics,
and profit margins.
Based on the harmonised benchmarks, Member States are required to calculate the
number of ex ante free allowances for each installation, based on EU-wide rules.
National implementing measures for all free allocation have been approved by the
Commission, and around 6.6 billion allowances are being given out over the period
2013-20.
Figure 2.4 Share of free allocation (%) based on carbon leakage list 2015-2019
As concerns new entrants to the EU ETS, 5% of the total quantity of allowances is set
aside for new investments, either in terms of entirely new installations or significant
capacity extensions of existing installations. Harmonized benchmarking rules are set out
for allocations to new entrants. As noted above, a large proportion of the new entrants
reserve has been earmarked for specific support for demonstration activities for CCS
and innovative renewable energy technologies. With regard to installations that close,
Cement, 19
Lime, 4 Industrial
gases, 1
Steel, 23
Refineries, 14
Organic
chemicals, 10
Fertilizers, 5
Paper, 4
Inorganic
chemicals, 2
Aluminium, 2
Hollow glass, 1
16 other sectors, 5
Oil extraction, 3
130 other sectors,
5
Bricks & tiles, 1 5 other sectors, 1 Veneer
sheets, 1
72 other
sectors, 1

37
the legislation provides that no free allocation is given any longer to an installation that
has ceased its operations unless the operator shows that production will be resumed
within a reasonable time. The same rule applies for the partial closure of installations or
significant reductions of capacity.
In addition, taking into account the general rule that no free allocation is given to
electricity generation, the Directive also states that Member States may grant State aid,
i.e. government subsidies, for the benefit of sectors which are found in practice to be
exposed to a significant risk of carbon leakage due to emission costs passed on in
electricity prices. A number of Member States, including Germany, for example, have
granted such State aid, which was approved by the European Commission in 201338
.
Conclusion: of the allowances issued, a little less than half are given out for free to
manufacturing industry according to objective criteria, such as technological
benchmarks, to shield them from risks of so-called “carbon leakage”.
The EU ETS covers large stationary emitters
The EU ETS covers more than 11,000 industrial plants, focusing on large emitters,
excluding aircraft operators, dealt with in following section. The sectors covered are set
out in Annex I to the Directive and include power plants and combustion units larger
than 20 MW, oil refineries, iron and steel production, production of non-ferrous metals,
cement, lime, pulp and paper, glass, ceramics, bricks, gypsum, mineral wool and
ammonia. The coverage was initially limited to CO2 but, from 2013, emissions of
perfluorocarbons from aluminium production and nitrous oxide from adipic acid and
nitric acid production in the chemical industry are also covered, extending the coverage
of the system by around 100 million tonnes CO2 equivalent a year.
The EU ETS makes an installation, irrespective of company ownership, subject to ETS
coverage if the installed capacity reaches a certain threshold. Alternative concepts like
coverage subject to a minimum emissions output or coverage of all installations by a
company have not been pursued for reasons of stability in coverage and administration.
Despite this choice, the coverage of combustion units larger than 20 MW required
extensive coordination by public authorities across the EU to ensure that the same
definition was applied, and the revision of the EU ETS confirmed that “combustion”
means any oxidation of fuels, regardless of the way in which the heat, electrical or
mechanical energy produced by this process is used, and any other directly associated
activities, including flue gas scrubbing. This clarification is particularly important as
regards coverage of the chemicals sector.
While largely harmonized across the EU in terms of coverage, the Directive has specific
provisions that allow Member States to vary this scope. First, Member States can
38
Currently, Belgium (Flanders), Germany, Greece, the Netherlands, Norway, Spain and the UK are
compensating for indirect costs. State aid reference for Germany: SA.36103 State aid for indirect CO2
costs (ETS).

38
individually opt-in other installations and activities. Under these provisions, Member
States have included some installations in the EU ETS that would otherwise have fallen
under the capacity thresholds. Second, there are provisions for Member States to opt
small installations out of the EU ETS. These provisions have been used only by a few
Member States to take some smaller installations out of the system, and the opt-out is
subject to requirements, such as the introduction of national measures.
Conclusion: the EU ETS applies to some 11000 industrial installations in a
harmonised way, but Member States may opt-in additional installations.
Extension to emissions from aviation
As of 2012 all flights between European airports are covered by the EU ETS. Coverage
of flights from EU airports to third countries, and potential coverage of flights to
airports in the EU from third countries, has been postponed until 2017. By that date,
agreement on a global market-based mechanism should have been reached in the
context of the International Civil Aviation Organisation (ICAO). In case of failure, the
legislation provides that the original scope will be implemented as of 2017. While
aviation comprises less than one tenth of the overall emissions of the EU ETS, it has
attracted considerable political attention.
The key features of aviation's inclusion are the following. The legislation39
applies to all
aircraft operators active in the EU market equally. Between 2013 and 2020, the cap was
set at 5% below 2004-6 emission levels. 85% of allocations were given out for free
based on an efficiency-related benchmark using 2010 levels of activity. Allocations to
aircraft operators were based on their respective flight activity in 2010 (measured in
terms of the total distance travelled and the total mass of passengers and freight carried).
Allocations based on activity reward those that are more efficient.
In terms of scope, the legislation explicitly foresees its amendment to take into account
any future agreement adopted at global level, which would clearly be a preferred
outcome. Globally, CO2 emissions from the aviation sector have been growing rapidly
and are forecast to continue to increase. By 2020, international aviation emissions are
projected to be around 70% higher than 2005 levels. Alongside major modernisation of
airspace management, research and development of aviation technology and fuels,
market-based measures are an essential part of a comprehensive approach to reduce
emissions from aviation.
The ICAO has been very successful in adopting technical standards and operational
rules, but States have been reluctant to agree on global economic measures through UN
institutions such as the ICAO. In 2004, States in the ICAO concluded that a single
global system should not be pursued at the time. Instead, they unanimously agreed to
pursue implementation through other avenues, one of which was “to incorporate
39
Directive 2008/101/EC of the European Parliament and of the Council of 19 November 2008 amending
Directive 2003/87/EC so as to include aviation activities in the scheme for greenhouse gas emission
allowance trading within the Community; OJ L 8, 13.1.2009, p. 3–21:

39
emissions from international aviation into Contracting States' emissions trading
systems40
. This is the avenue that the EU followed.
The EU considers that it is essential for any measure to be non-discriminatory. The US,
for example, took the view that permission should be necessary from the US for any
US-based airline to be regulated by third countries for any of its activities. The EU
Member States have not accepted this claim because of the inevitable market distortions
that such an approach would bring if permissions were not forthcoming.
The EU ETS covers the total emissions from a given flight, and is not airspace related.
Over-flight of EU territory is not regulated. Several airlines based in the United States
brought litigation to the highest court in the EU, the European Court of Justice, against
the EU ETS. In 2011, the Court reached a final judgement that confirmed that the EU
ETS law is fully compatible with international law, with the EU/US Open Skies
Agreement and the provisions of the Chicago Convention which state that States have
the sovereign right to determine the conditions for admission to or departure from their
territory and require all airlines to comply. The Court confirmed that the EU’s
provisions have no extra-territorial effect because no obligations are imposed in the
territory of any other State. The requirement to report emissions and to surrender
allowances under the EU ETS only arises when an aircraft lands or takes off from an
airport in an EU Member State. This point, at which a liability arises, is entirely and
exclusively within the EU. The amount of liability depends on the emissions of the
flight, taking into account length of journey and specific emissions of the aircraft, but
irrespective of whether the flight was to or from another Member State or a third
country. This is why the European Court of Justice upheld the measure as not infringing
the sovereignty of other States, and not being discriminatory.
Non-discriminatory application of the law is essential. Few business sectors are as
international as aviation, and non-discrimination between aircraft operators on flight
routes is crucial. Creation of any distortive effect for airlines operating on the same
routes in a competitive marketplace must be avoided. The EU has an open aviation
market and, for example, commercial flights between the United States and Europe are
operated not only by EU and US airlines, but also by other airlines, such as Air India
and even airlines from least developed countries such as Ethiopian Airways. In
addition, US-based carriers like UPS and Fedex operate substantial flights within the
EU. Having different treatment for aircraft operators of different nationalities would
distort competition between those operating on the same routes, so the EU ETS applies
to airlines operating in the European market without distinction as to nationality.
With the inclusion of aviation into the EU ETS, the EU has been ambitious, but has
shown clear willingness to adjust its policies in the light of experience. This led to some
controversy and future outcomes are not known, but the EU’s willingness to lead the
way, while respecting international law, is clearly demonstrated. The EU vigorously
supports multilateral action in the ICAO to create a global market-based instrument for
40
Assembly Resolutions in Force, Doc 9848, Published by authority of the Secretary General,
International Civil Aviation Organization (as of 8 October 2004): http://www.icao.int/environmental-
protection/Documents/a35-5.pdf
40
a sector in which emissions are rising rapidly. But with the 2016 deadline approaching,
time is running out very fast to prove that this can be done.
Conclusion: the scope of the ETS has been extended gradually, also to encompass
aviation in Europe. Intensive discussions are on-going in the context of the ICAO
to establish a worldwide market-based instrument to control emissions from
international aviation.
The ETS infrastructure
The EU ETS registry: the IT backbone of the carbon market
“Allowances” are the currency of the carbon market and they exist in electronic form. A
computerised system to keep track of the ownership of allowances held in electronic
accounts is therefore one of the essential requirements for a carbon market to function.
The registry works in much the same way as a bank has a record of all its customers and
their money. From 2012 onwards, the “Union registry” keeps track of all carbon units
held in the EU ETS. The registry component has been updated more frequently than any
other part of the EU ETS infrastructure, primarily to maintain high standards of
security. The registry has no role in trading per se, which is carried out at exchanges
that are also involved in trading a range of energy commodities. The Union registry’s
role is simply to keep a definitive record of the holding of allowances and other units
usable in the EU ETS, and of transfers that take place. From a trading perspective
registry transfers is the mechanism by which delivery of allowances from the buyer to
the seller takes place.
The EU ETS registry system has been operational since 2005 and has undergone
considerable changes. Today it is a centrally managed system that has left behind the
more complex set-up that reflected the historical, State-orientated architecture of the
Kyoto Protocol (Delbeke, 2006, pp 1-13). The EU ETS registry based in the European
Commission’s data centre in Luxembourg has a communication link to the International
Transaction Log (ITL) administered by the UNFCCC Secretariat based in Bonn, the
main role of which is to issue and transfer Clean Development Mechanism (CDM) and
Joint Implementation (JI) credits.
The European Commission and Member States work closely on the operation of the
Union registry, with each Member State administrating accounts and, where relevant,
providing services in national languages, including helpdesks. Each operator covered by
the EU ETS has an account. The second major category of account holders is market
intermediaries (banks, brokers) participating in the EU ETS. Individuals can also open
accounts.
The registry also facilitates a number of regulatory functions easing the work of public
authorities, market participants and service providers alike. Each year allowances which
are handed out for free are transferred into the accounts of operators of installations and
airlines by the end of February. Operators report their verified emissions during the
41
previous year by 31 March each year. If this does not take place by then, the registry
plays a role in enforcement of rules by public authorities, as transfers out of accounts
are automatically blocked.
The Union registry also provides for operators to exchange certain CDM and JI credits,
up to certain levels, for EU ETS allowances. Last but not least the information publicly
accessible in the registry (verified emissions, surrendered units, etc.) plays an important
role for market analysts to provide market participants with robust analysis in order to
assure pricing of allowances is based on well-understood facts.
The Union registry also has specific features developed in relation to attempts to
undermine, hack into or abuse the system. Transfers of allowances take place within a
26 hour pending period, which was one of the security measures introduced following
alleged theft of allowances, to limit the speed at which such allowances can be
transferred to third parties. Access to the registry is also subject to two-factor
authentication, similar to many on-line banking systems.
Conclusion: the EU ETS registry is a computerised system to keep track of
ownership of allowances. Its design and security parameters have evolved in the
light of experience and IT developments, as well as through pressures related to
cyber security.
Emissions accounting – monitoring, reporting and verification
The rules for monitoring, reporting and verification (MRV) of emissions are, alongside
the registries system, another key infrastructure requirement for a carbon market to
function properly. Similar to contemporary financial systems underpinned by robust
accounting systems, a carbon market needs a solid underpinning by an emissions
accounting system. Moreover, the EU ETS installed a system of self-reporting by
companies that needs to be verified by an independent third-party.
One of the main lessons learnt from the EU ETS's pilot-phase between 2005 and 2007 is
the need for reliable data industry-wide and on plant-specific emissions. There needs to
be confidence that emissions are reliably measured and with high accuracy. Given the
“invisible” nature of emissions it is indispensable for operators, buyers and sellers to
have trust that a tonne of emissions is really a tonne. This confidence comes from a
well-developed set of rules for monitoring, reporting and verification, and activities of
competent authorities to check that they are followed in practice.
The first part of these rules is the Regulation for monitoring and reporting of
emissions41
. This Regulation covers the monitoring of direct emissions from stationary
installations and from aviation in detail. Emissions are monitored either by
measurement using standardised or accepted methods, or on the basis of the calculation
41
Commission Regulation (EU) No 601/2012 of 21 June 2012 on the monitoring and reporting of
greenhouse gas emissions pursuant to Directive 2003/87/EC of the European Parliament and of the
Council; OJ L 181, 12.7.2012, p. 30–104: http://eur-lex.europa.eu/legal-
content/EN/TXT/PDF/?uri=CELEX:32012R0601&from=EN

42
using the formula: Activity data × Emission factor × Oxidation factor42
. A range of
default factors have been determined, and the emission factor for biomass is considered
to be zero. A separate calculation is made for each activity, installation and for each
fuel, and uncertainty levels are also documented. Equally, emissions that are captured
and permanently stored are exempted from the surrender requirements, which
incentivises the development of Carbon Capture and Storage technologies.
The second part of the rules is the Regulation on verification and on accreditation of
verifiers. Member States are required to ensure that reports submitted by operators are
verified by independent third parties by 31 March each year, failing which an operator
is not able to make transfers of allowances until a report has been verified as
satisfactory. The regulation for verification and on accreditation of verifiers43
specifies
conditions for the accreditation and withdrawal of accreditation, for mutual recognition
and peer evaluation of accreditation bodies.
The verification process addresses the reliability, credibility and accuracy of monitoring
systems and the reported data and information relating to emissions, in particular: the
reported activity data and related measurements and calculations, the choice and the
employment of emission factors, and calculations leading to the determination of the
overall emissions. Reported emissions may only be validated if reliable and credible
data and information allow the emissions to be determined with a high degree of
accuracy, meaning that the reported data is free of inconsistencies, the collection of the
data has been carried out in accordance with the applicable scientific standards, and the
relevant records of the installation are complete and consistent.
The relative complexity of establishing reliable figures for direct emissions, linked to
production, highlights the challenges facing attempts to elaborate detailed estimates of
emissions produced from the consumption patterns of countries or specific consumers,
as advocated by some. While general patterns can be identified and may be useful in
influencing individual consumption decisions and actions, such patterns are far from the
level of accuracy that would be needed for using economic instruments to internalise the
external costs from greenhouse gas emissions on the basis of consumption. Any border
adjustments could only feasibly be applied by using averages and approximations, with
the obvious weakness that specific products would be treated unfairly. Averaging to
make a consumption-based accounting workable, by definition, would also make it
inaccurate.
Conclusion: a well-functioning carbon market requires a solid monitoring and
reporting system that sets out clear rules to all market participants.
42
An example for an activity is the combustion of coal, an example for an emissions factor is the
emissions per unit of coal combusted; the oxidation factor is a technical feature to account for the
incomplete combustion of coal as a result of which not all emissions are released into the atmosphere. 43
Commission Regulation (EU) No 600/2012 of 21 June 2012 on the verification of greenhouse gas
emission reports and tonne-kilometre reports and the accreditation of verifiers pursuant to Directive
2003/87/EC of the European Parliament and of the Council; OJ L 181, 12.7.2012, p. 1–29.
43
Developing a robust market oversight regime
Given some unique characteristics of carbon allowances and the lack of prior
experience about how carbon markets operate in practice, no tailor-made market
oversight rules were included in the initial legal framework. Introducing a stringent
market oversight regime from the outset was feared to hamper the development of a
carbon price signal based on a liquid market.
As a result of this approach, the EU ETS has rapidly given rise to a liquid market across
Europe. While anyone can trade allowances, in practice the most active market
participants are power companies with compliance obligations under the EU ETS, and
financial intermediaries, who often act on behalf of companies and small emitters.
As detailed above, the carbon market has experienced significant growth in volume and
sophistication since 2005. On the basis of experience, regulators have started work to
close any gaps in market oversight.
The overwhelming share of EU ETS trading takes place in the “futures” markets for
delivery on a future fixed date, and is therefore covered by pre-existing financial market
rules including the Markets in Financial Instruments Directive (MiFID) and the Market
Abuse Directive (MAD). These financial rules contain anti-money laundering
safeguards (e.g. “know-your-customer” checks) and, among other things, are intended
to ensure that high integrity standards apply to all market participants, prohibiting
manipulation through practices such as spreading false information or rumours, and
profiting from inside information.
However, a small share (some 5-10% over time) of EU ETS trading has taken place in
“spot” trading markets, for immediate delivery. “Spot” trading in allowances has lacked
consistent regulation at EU level, which made access to the market easy. It is in this
area where there have been cases of alleged fraud and theft, with, for a period of time,
Value Added Tax (VAT) fraud focusing on carbon markets rather than other traded
goods, such as mobile phones and computer chips. The introduction of a system of
reverse charging for VAT has largely solved this issue, and the full records of
transactions in the registry system have facilitated the follow-up of particular cases by
authorities.
The Commission made a proposal in 2011 to revise financial markets rules, including to
bring “spot” trading of allowances under similar regulatory supervision as “futures”
trading. This proposal is being considered by the European Parliament and Council, and
should extend the same safeguards to all trading of allowances.
The revised EU ETS legislation gives the specific responsibility to the Commission to
monitor the functioning of the European carbon market, and produce an annual report
on the functioning of the carbon market, including on the implementation of the
auctions, liquidity and the volumes traded. Authority is also conferred on the
Commission to act in respect of excessive price fluctuations. In the event that, for more
than half a year, the allowance price is more than three times the average price of
allowances during the two preceding years, and this does not correspond to changing
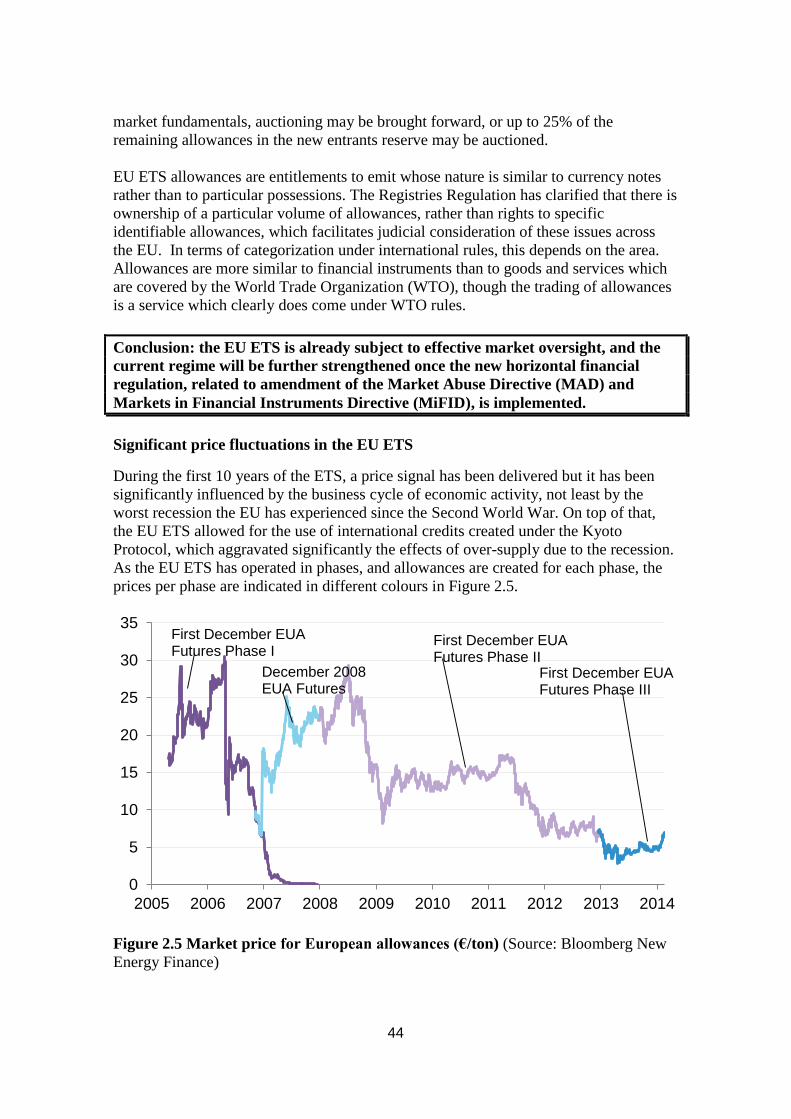
44
market fundamentals, auctioning may be brought forward, or up to 25% of the
remaining allowances in the new entrants reserve may be auctioned.
EU ETS allowances are entitlements to emit whose nature is similar to currency notes
rather than to particular possessions. The Registries Regulation has clarified that there is
ownership of a particular volume of allowances, rather than rights to specific
identifiable allowances, which facilitates judicial consideration of these issues across
the EU. In terms of categorization under international rules, this depends on the area.
Allowances are more similar to financial instruments than to goods and services which
are covered by the World Trade Organization (WTO), though the trading of allowances
is a service which clearly does come under WTO rules.
Conclusion: the EU ETS is already subject to effective market oversight, and the
current regime will be further strengthened once the new horizontal financial
regulation, related to amendment of the Market Abuse Directive (MAD) and
Markets in Financial Instruments Directive (MiFID), is implemented.
Significant price fluctuations in the EU ETS
During the first 10 years of the ETS, a price signal has been delivered but it has been
significantly influenced by the business cycle of economic activity, not least by the
worst recession the EU has experienced since the Second World War. On top of that,
the EU ETS allowed for the use of international credits created under the Kyoto
Protocol, which aggravated significantly the effects of over-supply due to the recession.
As the EU ETS has operated in phases, and allowances are created for each phase, the
prices per phase are indicated in different colours in Figure 2.5.
Figure 2.5 Market price for European allowances (€/ton) (Source: Bloomberg New
Energy Finance)
0
5
10
15
20
25
30
35
2005 2006 2007 2008 2009 2010 2011 2012 2013 2014
First December EUA Futures Phase I
December 2008 EUA Futures
First December EUA Futures Phase II
First December EUA Futures Phase III

45
In phase 1 (2005-7) the price of EU allowances dropped steeply in the second quarter of
2006 after the first verified emissions figures were reported. It became clear that the
Member States had determined an aggregate number of allowances in excess of
expected total emissions in 2005 to 2007. Due to the fact that phase 1 allowances could
not be banked into phase 2, any excess of allowances would have resulted in a price of
zero, as indeed happened for most of 2007. At the same time the market price in 2007
for phase 2 allowances (light blue colour) was much higher in view of the market
expectation that the system would be much more constrained in the second phase.
A second major price drop came in late 2008/ early 2009 as the longer-term effects of
the economic and financial crisis became clear. It is important to note that the sectors
covered by the EU ETS in aggregate are subject to much stronger swings than the
economy overall. Individual sectors covered by the EU ETS saw annual output losses
between 2008 and 2009 of over 30%. It was, in fact, largely thanks to the fact that, as of
phase 2, allowances could be banked without any restrictions or expiry that the price did
not fall further. Together with the design changes agreed in the European Council in
2008, the carbon price stabilised at around €15 for some two years despite deep and
prolonged economic recession which gave rise to the emergence of a severe market
imbalance.
As of 2009, the supply started to exceed demand so that by the end of phase 2 the
market was characterised by a supply overhang of almost 2 billion allowances, which
were banked into Phase 3 (See Figure 2.6). The growing market imbalance and lack of
signs of an economic recovery weighed heavily on the price in 2012 so that it fell to
single digits.
The low price of allowances in 2012 gave rise to a debate on what policy action to take
to restore market confidence and rejuvenate the European carbon market as a driver for
low-carbon investments. The short-term legislative response was to reduce the quantity
of allowances for auctioning in 2014 to 2016 by 900 million allowances, and re-inject
them into the market in the year 2019-2020 when, it was hoped, economic
circumstances were more favourable44
This proposal, referred to as “Backloading”, was
controversial, but nevertheless endorsed by the Council and the European Parliament.
The longer-term legislative response was the proposal, made in early 2014, for a Market
Stability Reserve45
This proposal provides for allowances to be taken out of the
quantities to be auctioned and put into a reserve if the cumulative surplus of allowances
in the market exceeded 833 million, and for allowances to be released from the reserve
if the cumulative surplus of allowances in the market fell below 400 million allowances.
44
Commission Regulation (EU) No 176/2014 of 25 February 2014 amending Regulation (EU) No
1031/2010 in particular to determine the volumes of greenhouse gas emission allowances to be auctioned
in 2013-20; OJ L 56, 26.2.2014, p. 11–13: http://eur-lex.europa.eu/legal-
content/EN/TXT/PDF/?uri=CELEX:32014R0176&from=EN 45
Proposal for a Decision of the European Parliament and of the Council concerning the establishment
and operation of a market stability reserve for the Union greenhouse gas emission trading scheme and
amending Directive 2003/87/EC, of 22.01.2014. http://eur-lex.europa.eu/legal-
content/EN/TXT/PDF/?uri=CELEX:52014PC0020&from=EN.

46
Figure 2.6 Surplus of ETS allowances without account taken of the introduction of
the Market Stability Reserve (Source: European Commission).
As such, the Market Stability Reserve was designed to dampen large swings in the
supply of allowances on the market in a predictable way. All the rules would be pre-
determined, so as to minimise discretionary intervention into the market. The purpose
was very explicitly to increase the resilience of the EU ETS in the case of pronounced
market imbalances emerging.
In May 2015, the Council and the European Parliament reached political agreement on
the Market Stability Reserve proposal, including on the date of entry into effect of 1
January 2019, inclusion of backloaded allowances into the reserve, as well as
unallocated allowances being transferred directly to the reserve in 2020 and their future
usage to be considered under the wider EU ETS review.
There has been active debate around the functioning and design of the EU ETS since its
inception. The magnitude of the economic recession from 2008 and continuing slow
economic growth were unforeseen. In this context, legislative proposals were made that
were considered to be in the best interest of the carbon market. It should be no surprise
that it was long debated whether this legislation would not compromise the market’s
predictability. However, given the unique character of the economic events, regulators
intervened, as they did in many other markets, includingthe saving of financial
institutions from collapse.
0,0
500,0
1000,0
1500,0
2000,0
2500,0
3000,0
International credits (including aviation)
Aviation
Phase 3 allowances other than aviation
Phase 2 allowances other than aviation
Emissions
Surplus

47
The Market Stability Reserve, by its predictability, is intended to avoid the need for
further market intervention. If the experience of recent years had been known, the EU
ETS would without doubt have integrated a Market Stability Reserve mechanism from
the outset. Once again, the EU’s ability to respond to changed circumstances and learn
from experience has been demonstrated.
Conclusion: the price development in the EU ETS has been subject to considerable
fluctuation, mainly as a result of the deep and prolonged economic recession.
Decisions have been taken to create a Market Stability Reserve to make the EU
ETS more resilient to such economic fluctuation as well as to the influence of other
policies that may lead to an unforeseen surplus of allowances.
Pathways to an international carbon market
International credits – linking EU instruments beyond Europe
Apart from establishing a price for greenhouse gas emissions in Europe, the EU ETS
has also given incentives for emission reduction projects46
around the world. This has
been through the EU ETS providing the main market for credits from the Kyoto
Protocol's two project-based mechanisms, Joint Implementation (JI) and the Clean
Development Mechanism (CDM). The biggest demand for CDM credits has in fact
come from the EU ETS. By May 2015, the EU ETS has been responsible for the use of
approximately 866 million CDM credits (CERs) and 570 million JI credits (ERUs)47
.
The openness of the EU ETS for international credits achieved a number of things.
Perhaps the most important one being that constituencies in other countries were made
more aware of the opportunities for channelling finance provided by the flexibilities
foreseen in the Kyoto Protocol and having involved themselves in reducing emissions
locally. This certainly was the case in China. Another benefit of the use of international
credits in the ETS is that European businesses had an additional option to meet their
obligations by using such credits for compliance purposes, and this increased the overall
cost-effectiveness of the system. Despite the fact that the use of external reductions has
always been supplemental to domestic reductions within the EU, billions of euros of
investments took place through the CDM in sustainable development projects in
developing countries including, for example, in renewable energy investments.
The EU relied upon the UNFCCC systems for producing credits in respect of emission
reductions, by allowing for the broad use of JI and CDM credits except where emission
reductions were either not permanent, as is the case for forestry-based credits, or
considered by the EU as politically unacceptable, such as for new nuclear power
46
Although it is important to keep in mind that the credits of these emissions reductions outside Europe
give rise to a corresponding increase in emissions within the EU. This feature has been frequently
misunderstood. 47
European Commission Press Release, Brussels, 16 May 2013: “Emissions trading: 2012 saw
continuing decline in emissions but growing surplus of allowances”: http://www.europa.eu/rapid/press-
release_IP-13-437_en.doc and European Commission Regulatory Update of 4 May 2015 at:
http://ec.europa.eu/clima/news/articles/news_2015050402_en.htm.

48
stations. Apart from these, the EU ETS only set minimum standards for Member States'
involvement in approving large hydro-electric projects, and full reliance was placed in
the UNFCCC systems for all other issues.
As of 2010, however, the Commission and European Parliament were made aware of
serious doubts about the environmental sustainability of credits from projects involving
HFC-23 destruction and from adipic acid production in the EU ETS. In 2011, the EU
put in place quality standards that would prohibit the use of such JI and CDM credits48
.
With hindsight, this also helped to temper the influx of international credits into an
increasingly over-supplied market.
While the EU ETS has been the main market for JI and CDM credits, the relative role of
international credits should be kept in perspective. Transactions in the EU ETS have
been estimated to make up approximately 84% of the international carbon market
activity, while the CDM has made up less than 13% of this activity (out of which a large
proportion was to meet demand from operators covered by the EU ETS).
In terms of the EU policy on international credits, the EU ETS has taken a more
targeted approach from 2013 onwards. Initially, the EU created a market for CDM
projects in China, India and elsewhere as a demonstration of support in the Kyoto
system that has not been matched by many other countries. However, such credits do
not actually reduce emissions on a global level, but rather displace emissions for
reasons of overall economic efficiency. Starting in 2013, the EU ETS therefore
restricted credits from new CDM projects only to projects located in States defined by
the UN as “Least Developed Countries” (LDCs). Most of the existing 7 000 CDM
projects49
principally in China, India, Brazil or South Africa, continue to have a market
in the EU ETS.
Conclusion: up to now, the EU ETS has absorbed more than 1.4 billion tonnes of
international credits. As of 2013 a more targeted approach is being followed
focusing on new CDM projects based in the Least Developed Countries.
Linking
In the wake of the 1997 Kyoto Protocol, it was thought by some that an international
carbon market could be developed in “top-down” fashion by the UNFCCC. Article 17
of Kyoto on international emissions trading foresaw that Parties could exchange part of
their quantitative commitments. In Kyoto, the US pushed the option of emissions
trading very actively, following their success in reducing sulphur emissions inside the
48
Commission Regulation (EU) No 550/2011 of 7 June 2011 on determining, pursuant to Directive
2003/87/EC of the European Parliament and of the Council, certain restrictions applicable to the use of
international credits from projects involving industrial gases; OJ L 149, 8.6.2011, p. 1–3. http://eur-
lex.europa.eu/legal-content/EN/TXT/PDF/?uri=CELEX:32011R0550&from=EN 49
UNFCCC News Release: Kyoto Protocol’s clean development mechanism reaches milestone at 7,000
registered projects:
https://cdm.unfccc.int/CDMNews/issues/issues/I_8XM9FF99N0WN7MMK9XFBJLSX23LX8Q/viewne
wsitem.html

49
US in a cost-effective manner. Moreover, in Kyoto, the US negotiated a target for itself
of -7% (compared to 1990) with a view to trading with other Parties who were more
generously allocated, such as Russia.
We all know the history. In practice, the US never ratified the Kyoto Protocol, and no
one traded with Russia under Article 17. The irony of the story is that international
emissions trading was opposed by the EU in the run-up to Kyoto, but since then only
the EU has engaged in it. The reason for this is that the EU applies the Kyoto rules of
transferring entitlement between EU Member States whenever trading of EU
allowances happens between entities located in different Member States. As the EU
ETS is about trading between companies, irrespective of where they are located in the
EU, there needs to be an automatic and corresponding adjustment in the entitlement of
Member States to emit under the Kyoto Protocol. Otherwise, if German power
generators, for example, buy allowances in order to emit more, Germany also needs to
be entitled to emit more under the Protocol to remain in compliance. These adjustments
of Kyoto entitlements happen through the registry without companies even being aware
of this matching. This explains, also, why Member States were willing to introduce
meaningful and harmonized penalties for companies in non-compliance, as failure by
companies would put the country’s compliance with its Kyoto Protocol obligations at
risk. To this extent, therefore, the EU ETS has been linked, and fully compatible with,
the international regime since the outset.
The first formal linking of the EU ETS with other States was the extension to the
neighbouring countries of the European Economic Area – Norway, Iceland and
Liechtenstein – in 2008, and Croatia has applied the system from 2013 when it joined
the EU. Formal linking negotiations are still on-going with Switzerland.
While the UNFCCC process remains important in a general climate policy context,
there has never been a serious attempt to establish a company-based emissions trading
system through UN institutions, and it looks unlikely that the international community
is sufficiently interested in trying to do so. However, it must be stressed that the
existence and continuation of the EU ETS is completely independent of the success or
not under the UNFCCC. It should be remembered that the EU ETS started in 2005 prior
to the first commitment period of the Kyoto Protocol, although it was built so as to be
completely compatible with UN requirements. Its more “bottom-up” establishment
proved useful and important, however, in being able to adapt and correct quickly if
needed in the light of experience.
Over the last decade, Europe's share of global greenhouse gas emissions has decreased
from around 14% to 9%. Clearly, climate change cannot be addressed effectively
without broader action by other countries. Action is increasingly being taken through
national initiatives. For various reasons, including the generally positive experience
with the EU ETS, other developed and developing countries are establishing their own
emissions trading systems. There is a growing recognition that the magnitude of the
climate change challenge requires that a price be put on greenhouse gas emissions in
order for market forces to be effectively harnessed to deliver the necessary emission
reductions. Without effective pricing approaches, companies will not have the
incentives or economic interest to invest in low-carbon activities.

50
Legislation to put a price on emissions will be passed by national legislatures, whether
in the form of emissions trading or taxes on emissions, such as Ireland put in place for
emissions outside the scope of the EU ETS. The difficultiy of putting such legislation in
place was demonstrated by the United States' inability to pass Federal legislation to put
a price on emissions since the McCain-Lieberman bill that was first proposed in 2003.
At Federal level, the United States came close to having a similar system to the EU
ETS, by the House of Representatives' passage of the Waxman-Markey bill in 2009.
However, the companion bill in the Senate, the Kerry-Boxer bill (S. 1733), was not
passed and the near-term prospects for passage of legislation in the US Congress that
puts a price on greenhouse gas emissions appear low.
Other regions of the world have also been developing market-based measures to tackle
climate change. Australia, after difficult domestic discussions, established a national
emissions trading system that initially functioned as a tax and would have moved to
being an emissions trading system. It was foreseen to be linked with the EU ETS.
However, the current government halted further development of this approach.
The most promising policy experiments are today happening in Asia. South Korea has a
national greenhouse gas emissions trading system that is up and running as of January
2015. China has established 7 pilot emissions trading systems, covering some 15-20%
of the economy and plans are on the table to extend these towards a nation-wide
system50
. California has an emissions trading system operating since January 2013.
New Zealand also has an emissions trading system that has been in operation since
2008, and the North-Eastern States in the US have been operating the Regional
Greenhouse Gas Initiative, RGGI, since 200951
.
It is widely under-estimated how much the emergence of these national and sub-
national emissions trading systems also offer the prospect for the development of an
international carbon market. Indeed carbon allowances can be traded across
jurisdictions and a common carbon price can be established within a geographically
wider area over time. This process is enabled by a provision in the legal framework of
the EU ETS which allows for “linking” of carbon markets by means of mutual
recognition of carbon allowances. The procedural step needed is a bilateral agreement
between the EU and a third country.
The “bottom-up” development of an international carbon market via national
legislation, and linking agreements between them, will take time. In order to facilitate
such a process, bilateral cooperation as well as programmes, such as the World Bank's
Partnership for Market Readiness, has proved to be very valuable. The potential for
more cost-effectiveness is clearly there, but linking systems first needs robust and
50
Han, G, M. Olsson, K. Hallding and D. Lunsford (2012) China’s Carbon Emission Trading: An
Overview of Current Development”, FORES, Bellmansgatan 10, SE-118 20 Stockholm, http://www.sei-
international.org/mediamanager/documents/Publications/china-cluster/SEI-FORES-2012-China-Carbon-
Emissions.pdf 51
ICAP, 2015: Emissions Trading Worldwide: ICAP Status Report 2015:
https://icapcarbonaction.com/images/StatusReport2015/ICAP_Report_2015_02_10_online_version.pdf

51
environmentally effective cap-and-trade systems to be put in place. Only then will an
international market be achieved.
Conclusion: the EU is open to engage in linking its ETS to other comparable systems
so as to create over time a global carbon price through a truly international market.
It believes such an international market will best be achieved through a bottom-up
process rather than through top-down approaches overseen by the UN.
References
Alexeeva-Talebi, V. (2010) Cost Pass-Through of the EU Emissions Allowances:
Examining the European Petroleum Markets Discussion Paper No. 10-086, ZEW,
Mannheim. (ftp://ftp.zew.de/pub/zew-docs/dp/dp10086.pdf, consulted 31 March 2014)
Delbeke, J (2006)(ed.) EU Environmental Law: The EU Greenhouse Gas Emissions
Trading Scheme, 1, pp. 1-13. Claeys & Casteels, Leuven.
Ellerman, D. and B. Buchner (2008) Over-Allocation or Abatement? A Preliminary
Analysis of the EU ETS Based on the 2005–06 Emissions Data. Environmental and
Resource Economics 41(2) 267-287.
(http://link.springer.com/article/10.1007%2Fs10640-008-9191-2# )
Ellerman, A.D, Convery F.J. and de Perthuis C. (2010) The European Union Emission
Trading Scheme, Cambridge University Press, Cambridge.
Lise,W., Sijm, J. and Hobbs, B. F. (2010) The Impact of the EU ETS on Prices, Profits
and Emissions in the Power Sector: Simulation Results with the COMPETES EU20
Model. Environmental and Resource Economics (47) 23–44.
Sijm, J., Hers S., Lise W. and Wetzelaer B. (2008) The impact of the EU ETS on
electricity prices, ECN, Petten, ECN-E--08-007, December 2008.
(http://re.indiaenvironmentportal.org.in/files/e08007.pdf, consulted 31 March 2014)
Solier, B. and Jouvet, P. A. (2013) An overview of CO2 cost pass-through to electricity
prices in Europe. Energy Policy (61) 1370-1376.

52
3 Climate related energy policies
Jos Delbeke, Ger Klaassen and Stefaan Vergote
The EU's energy policy: towards a more sustainable, more secure and more
competitive energy system
Unlike environmental issues, the EU Treaty incorporated the field of energy policy only
recently. Only from 2009 did the so-called Lisbon Treaty (the Treaty on the Functioning
of the European Union) include specific provisions relating to energy policy. In its
Article 194 it is specified that the EU's energy policy shall aim, in a spirit of solidarity
between Member States, to:
1. ensure the functioning of the energy market;
2. ensure security of energy supply in the Union;
3. promote energy efficiency and energy saving and the development of new and
renewable forms of energy; and
4. promote the interconnection of energy networks.
All this should be done taking account of the need to preserve and improve the
environment and in the context of the establishment and functioning of the internal
market. In terms of procedure, the European Parliament and the Council, acting in
accordance with the ordinary legislative procedure (or “co-decision”, as it was
previously known), shall establish the measures necessary to achieve the above
objectives.
In contrast to environmental policy, many energy issues are still decided at national
level. This is most evident for issues related to the energy mix. Even now under the
Lisbon Treaty, it is explicitly stated that the EU's energy policy shall neither affect a
Member State's right to determine the conditions for exploiting its energy resources, nor
its choice between different energy sources and the general structure of its energy
supply.
Procedures aside, the current way of consuming and producing energy in the EU is, at
the moment, neither sustainable, nor secure, nor competitive. First, current levels of
energy use contribute significantly (around 80% in the EU) to greenhouse gas emissions
both in the EU and globally. Energy use also affects air pollution, water pollution and
land use.
Second, the security of energy supply in the EU is at risk. In 2012 the EU-28's overall
dependency on energy imports was 53% (compared with 43% in 1995). In 2012 the EU
imported 86 % of its oil compared to 74% in 1995. Gas imports increased to 66% in
2012 up from 43% in 199552
.More importantly, the imports do not always come from
52
EUROSTAT, (2014): EU Energy in figures Statistical Pocketbook 2014; pages 66, 70 & 72:
http://ec.europa.eu/energy/sites/ener/files/documents/2014_pocketbook.pdf

53
politically stable regions and, most notably, gas comes from a limited number of
countries. In 2013, 67% of the EU oil imports came from only five countries: Russia,
Norway, Saudi Arabia, Nigeria and Iran. In the same year 87% of natural gas imports
were supplied by just 5 countries: Russia, Norway, Algeria, Qatar and Nigeria. During
the last decade, gas supply to the EU was disrupted in 2006, 2008, and 200953
. More
recently, the crisis between Ukraine and Russia has raised the question of possible
interruptions in the supply of gas from Russia into the spotlight. The IEA has forecasted
that, on the basis of current policies, the EU’s import dependency for oil and gas
(calculated as net imports divided by primary energy demand for each fuel) will
increase through to 2035 (see Figure 3.1 below)(IEA, 2012).
Figure 3.1 Net oil and gas import dependency by region (source © OECD/IEA 2012
World Energy Outlook, IEA Publishing)
Third, another issue of concern is the impact of energy costs on the competiveness of
European industry in relation to its main competitors. This issue became more
prominent as a result of the rapid development of shale gas in the US. This led to a
divergence of gas wholesale prices between the US and the EU, reaching a factor 3 to 4
times higher gas prices in Europe in the period 2011-2012. This led to fears that new
investment in, for example, the petro-chemical or gas-intensive industries, would move
outside the EU. However, since then, the divergence has decreased to a factor of two.
Important progress has been made in the field of the internal market. Consecutive
legislative packages have forced the unbundling of traditionally vertically integrated
energy companies. Over the years, liquid wholesale markets have been established in
electricity and gas. Nevertheless, the creation of a truly integrated EU internal market
for electricity and gas is far from complete:
53
COM(2011) 885 final of 15/12/2011: Communication: “Energy Roadmap 2050http://eur-
lex.europa.eu/legal-content/EN/TXT/PDF/?uri=CELEX:52011DC0885&rid=3
-60%
-40%
-20%
0%
20%
40%
60%
80%
100%
0% 20% 40% 60% 80% 100%
Gas
Oil
United States
China
India
European Union
Japan & Korea
ASEAN
2010
2035
54
1. interconnections are still insufficient in many areas to allow for cross-border
trade and competition, and connect “energy islands” such as the Baltic States or
the Iberian peninsula to the rest of the EU;
2. regulated tariffs, market dominance by incumbents, and low switching rates are
evidence of too low levels of competition in retail markets;
3. public intervention at national level has been steadily increasing, notably in the
field of renewable energy and capacity mechanisms, leading to increasing
concerns of fragmentation of the internal market and distortions of competition.
One of the major developments – and achievements – of the past 10 years has been the
alignment and coordination of energy and climate policies. This arises from the strategic
view that, for a region such as the EU that is largely dependent on imports of fossil
fuels, the instruments and technologies to achieve a more competitive and secure energy
system largely coincide with those needed to reduce greenhouse gas emissions, notably:
1. increasing energy efficiency;
2. increased utilisation of low-carbon technologies, such as renewables, nuclear,
and, in the future, potentially coal combined with Carbon Capture and Storage;
3. accelerating innovation in low-carbon and energy efficient technologies as a
means to create a competitive edge in rapidly growing global markets for these
products, and one of the means to ensure long-term sustainable growth (see also
Stiglitz, 2013).
In this context, it is important to highlight the compatibility and complementarity of the
EU ETS with the functioning of electricity markets. The EU ETS needs a well-
functioning electricity market so that competition in dispatch and investment enables a
shift to low-carbon generation. Integrating the price of CO2 fully in the price-setting
mechanisms of a liberalised electricity market, rather than replacing it “outside the
market” through specific interventions, will ensure that emissions are being reduced
where it is cheapest to do so.
The purpose of this chapter is to describe the major EU energy policy instruments that
try to address the above problems. However, their examination is confined to how they
relate to climate policy and the need to reduce greenhouse gas emissions. This means, in
particular, that this chapter does not deal with issues related to the development of a
single European energy market, nor with measures that are specifically addressed to
increase energy supply security.
Energy policy in the EU is evolving fast, and in February 2015, the Commission
outlined a strategy towards the establishment of a “resilient Energy Union with a
forward looking climate policy”.54
The strategy is being built around 5 dimensions:
1. energy security, solidarity and trust;
2. a fully integrated European energy market;
54
Communication from the Commission: “A Framework Strategy for a Resilient Energy Union with a
Forward-Looking Climate Change Policy”, COM(2015)80 final dated 25/02/2015.
http://ec.europa.eu/priorities/energy-union/docs/energyunion_en.pdf

55
3. energy efficiency contributing to moderation of demand;
4. decarbonising the economy;
5. research, Innovation and Competitiveness.
What is more, the Energy Union strategy is accompanied by an ambitious plan of action
entailing 15 concrete action points. The approach confirms the strategic alignment of
the climate and energy agenda. Important further developments can be expected in the
coming years, building on and learning from the policies described in this chapter.
This chapter has the following structure: section 3.2 deals with renewable energy.
section 3.3 with energy efficiency; section 3.4 covers the regulations related to the
emissions of passenger cars, vans, lorries and ships; section 3.5 looks ahead.
Renewable Energy
The Renewable Energy Sources Directive
The Renewable Energy Sources Directive was agreed in its present form as part of the
climate and energy package adopted early in 200955
. The Directive aims to increase the
share of renewable energy in the EU to 20% of gross final energy consumption in the
year 2020. “Renewable energy” covers wind energy, solar energy (for heat and
electricity), hydropower, tidal and wave power, geothermal energy and biomass energy.
Extra energy generated through heat pumps and renewable electricity used in transport
also counts towards the renewable energy target.
Renewable energy provides an essential alternative to energy from (mostly imported)
fossil fuels. Increasing its contribution is expected to reduce greenhouse gas emissions,
increase energy supply security and promote innovation and technological development
while at the same time providing employment opportunities. In 2005 the share of
renewable energy in the EU was 8.5%. In 2013 the share had increased to
approximately 15% (see Table 3.1).
To achieve the overall objective of a 20% share in 2020, legally binding objectives for
the share of renewable energy in national energy consumption were agreed for each
Member State. Such mandatory targets were expected to provide the business sector
with the long-term stability needed to make investments in renewables. It was left to
each Member State to meet its national target through national policy measures.
The starting point for defining the quantitative target for each Member State was the
share of renewable energy in its energy mix in 2005. The overall renewable energy
share was 8.5% in 2005, so an additional 11.5% needed to be found. Consequently, a
55
Directive 2009/28/EC of the European Parliament and of the Council of 23 April 2009 on the
promotion of the use of energy from renewable sources and amending and subsequently repealing
Directives 2001/77/EC and 2003/30/EC; : OJ L 140, 5.6.2009, p. 16–62: http://eur-lex.europa.eu/legal-
content/EN/TXT/PDF/?uri=CELEX:32009L0028&from=en
56
flat-rate additional percentage was allocated uniformly to all Member States (5.75%),
and a further equivalent effort was distributed on the basis of GDP per capita. Finally, a
small adjustment was made for the five Member States who had taken most early
action.
Table 3.1 shows the mandatory objectives of all EU-countries as well as the progress
made up to 2013. By June 2010, each Member State was required to submit a National
Renewable Energy Action Plan to the European Commission. This Plan had to specify,
among other things, the energy consumption of the Member State, the targets per sector
(electricity, heating and cooling, and transport) and the national measures that were
expected to be taken to reach these targets.
Every single Member State developed its own national support schemes, and as a result
a wide variety emerged. This implied that Member States in principle had control over
the costs of their own schemes. However, when the unit costs of renewables started to
tumble, Member States were generally slow to adapt their support schemes, and this
created situations of overly generous subsidies. This undermined the credibility of the
policy, which coincided with the budgetary crisis that spread over Europe. As a result
the support schemes were modified and sometimes even subject to retroactive revisions.
The Renewables Directive also foresees some flexibility allowing Member States to
reach part of the target outside their territory. The Commission was much more
outspoken on the need for such flexibilities, notably through harmonised “guarantees of
origin” that would facilitate cross-border trade, in an attempt to reach the overall target
cost-effectively56
. Many Member States, however, feared that such a system would
undermine their freedom to determine their own support schemes. In addition they were
reluctant to pay for renewable energy investments in other Member States, while
leaving the co-benefits, such as in terms of energy security and “green jobs”, in the
country where the investment takes place. Similarly, the renewable energy sector feared
that successful support schemes would be undermined.
Therefore, during the interinstitutional decision-making process, only weak flexibility
provisions were adopted. First, the Directive provided that physical consumption of
renewable energy in a Member State other than the one it was produced in could be
taken into account (such as the export of hydroelectricity from Austria to Germany).
Second, the Directive also allowed that renewable energy paid for and consumed (but
not physically transferred) in one Member State could count towards the national target
of another Member State. This would have to be subject to the agreement of both
Member States concerned. These “cooperation mechanisms” included either joint
projects between Member States (such as the building of a large-scale solar plant), or
joint support schemes or statistical transfers (see Articles 6 to 10 of the Directive).
Significantly, however, these flexibilities had to be agreed between the Member States
themselves, and not only between operators.
56
Notably in Article 6(3) of the Commission’s original Proposal: http://eur-lex.europa.eu/legal-
content/EN/TXT/PDF/?uri=CELEX:52008PC0019&from=EN

57
Progress towards 2020 renewable energy targets
Table 3.1 indicates that the vast majority of Member States (as well as the EU as a
whole) made good progress and met their interim renewable energy targets for
2011/201257
).
Table 3.1 Progress towards national renewable energy targets for 2020
2005 2011 2012
Target
2011/2012
2013
Objective
2020
EU-28 8.7 12.9 14.1 10.7 15.0 20.0
Belgium 2.3 5.2 6.8 4.4 7.9 13,0
Bulgaria 9.5 14.6 16.3 10.7 19.0 16.0
Czech Republic 60 9.3 11.2 7.5 12.4 13,0
Denmark 156 24.0 26.0 19.6 27.2 30.0
Germany 67 11.6 12.4 8.2 12.4 18.0
Estonia 175 25.6 25.8 10.7 25.6 25.0
Ireland 28 6.6 7.2 5.7 7.8 13.0
Greece 70 10.9 13.8 9.1 15.0 18.0
Spain 84 13.2 14.3 10.9 15.4 20.0
France 95 11.3 13.4 10.7 14.2 20.0
Croatia 128 15.4 16.8 No target 18.0 20.0
Italy 5.9 12.3 13.5 7.6 16.7 17.0
Cyprus 3.1 6.0 6.8 .9 8.1 13,0
Latvia 32.3 33.5 35.8 34.0 37.1 42.0
Lithuania 17.0 20.2 21.7 16.6 23.0 23.0
Luxembourg 1.4 2.9 3.1 2.9 3.6* 11.0
Hungary 4.5 9.1 9.6 6.0 9.8 13.0
Malta 0.3 0.7 2.7 2.0 3.8 10.0
Netherlands 2.3 4.3 4.5 4.7 4.5 14.0
Austria 24.0 30.8 32.1 25.4 32.6 34.0
Poland 7.0 10.4 11.0 8.8 11.3 15.0
Portugal 19.5 24.5 24.6 22.6 25.7 31.0
Romania 17.6 21.2 22.9 19.0 23.9 24.0
Slovenia 16.0 19.4 20.2 17.8 21.5 25.0
Slovakia 5.5 10.3 10.4 8.2 9.8 14.0
Finland 28,9 32,7 34.3 30.4 36.8 38.0
Sweden 40.5 48.8 51.0 41.6 52.1 49.0
United Kingdom 1.4 3.8 4.2 4.0 5.1 15.0 Source: Eurostat; estimates based on the national data transmission under Regulation (EC) No
1099/2008 on energy statistics is an estimate by Eurostat
57
European Commission (2013) Renewable energy progress report, 27/03/2013. COM (2013) 175 final,
http://eur-lex.europa.eu/legal-content/EN/TXT/PDF/?uri=CELEX:52013DC0175&from=EN

58
Total use of renewable energy in 2011 dropped compared to 2010 but the latest data
(from March 2015) show that the share of renewables in gross inland consumption of
energy increased to 15% in 201358
.The increase in the use of renewable energy by type
of renewable in the EU since 1990 has been impressive, as can be seen from Figure
3.2(Eurostat, 201459
) There has been a steady increase across all types of renewables,
most notably in wind and solar. Also wood, biogas and liquid biofuels show remarkable
growth.
Figure 3.2 The development of renewable energy use by type of renewable (Source:
Eurostat)
Falling costs and rapid globalisation of the renewable energy industry
The costs of producing electricity using renewable energy (for example, solar
photovoltaic (PV) but also wind energy and some biomass technologies) have been
reduced considerably over the past years. Figure 3.3 shows that the average costs (in €/
MWh) of electricity generated by onshore wind turbines in Denmark and Germany
dropped significantly over time as a result learning-by-doing (Klaassen et al, 2005).
Each time capacity doubled investment per kilowatt capacity dropped by 8% to 11%,
starting from an initial level of around $2,000/kW). At a global level similar cost
58
Source: Eurostat News Release 43/2015 - 10 March 2015:
http://ec.europa.eu/eurostat/documents/2995521/6734513/8-10032015-AP-EN.pdf/3a8c018d-3d9f-4f1d-
95ad-832ed3a20a6b 59
Source of graphic: http://ec.europa.eu/eurostat/statistics-
explained/images/e/e5/F_RENEWABLES_ENERGY_FOR_FINAL_CONSUMPTION_2012.png
0
20
40
60
80
100
120
140
160
180
200
1990 1995 2000 2005 2010 2013
Mto
e
Renewable wastes
Geothermal energy
Solar energy
Wind power
Hydro power
Liquid biofuels
Biogas
Wood & other solid biofuels

59
reductions have been observed60
. Similarly costs of PV modules (in $/W) have fallen by
over 80% since 2009. The costs of installed rooftop PV systems fell by 65% between
2006 and 2012 in Germany enabling solar PV to undercut residential electricity tariffs.
The costs are expected to continue to fall over time, and this is the most striking for
capital costs. For solar PV modules costs might still be reduced by up to 22% in the
future for every doubling of capacity61
. For offshore wind, capital costs could drop by
7% each time capacity doubles. By 2030 this would reduce investment costs by some
25-27% for offshore wind and commercial solar PV. For on-shore wind, cost reductions
are typically lower, but this technology has come to a point of being nearly competitive
with conventional power plants.
Figure 3.3 Renewables policies contribute to reducing technology cost
These cost reductions have been accompanied by rapid globalisation. This has led to
first-mover advantages, in particular for companies and countries that were able to
benefit from a stable local demand. In the wind sector, those countries that were the first
to develop a strong demand-side policy, such as Denmark, Spain and Germany, are still
home to some of the world’s leading companies in this field. However, evidence shows
that the first-mover advantages should not be taken for granted. This is particularly true
in the PV sector. European and Japanese companies went through a strong demand-
60
See Bloomberg http://about.bnef.com/summit/content/uploads/sites/3/2013/12/2013-04-23-BNEF-
Summit-2013-keynote-presentation-Michael-Liebreich-BNEF-Chief-Executive.pdf
61
See IRENA “Summary for Policymakers: Renewable Power Generation Costs”, November 2012.
http://www.irena.org/DocumentDownloads/Publications/Renewable_Power_Generation_Costs.pdf.
Consulted 17/04/2015, & JRC (2014) ETRI 2014 Energy technology reference indicator projections for
2012-2050. JRC Science and Policy reports. Report EUR 26950 EN, Luxembourg, Publication Office of
the European Commission.

60
driven growth, but now face tough competition by, most notably, Chinese companies
that have now the biggest market shares globally (Pollit et al, 2015, page 14).
The evolution of cost reduction has been accompanied by rapid globalisation, but also
by replication of similar renewable energy policies across the globe. Today, China is not
only the largest producer of wind and solar commponents, but also the largest installer.
Fuels and biofuels
The Renewable Energy Sources Directive also requires that at least 10% of all energy
used in the transport sector comes from renewable sources in 2020. This mainly
involves biofuels (liquid or gaseous fuels made from biomass), such as ethanol and
biodiesel, but also includes the use of electricity from renewable sources in the transport
sector (for example, for trains). This 10% objective is to be met by each EU Member
State in 2020. This sub-target (as it contributes also to the 20% renewable energy target)
is the same for each country, as transport fuels are easily traded and transported within
the EU.
In parallel, since 2009, Article 7a(2) of the Fuel Quality Directive62
requires a reduction
of the greenhouse gas intensity of fuels used in vehicles by up to 6% by 2020. The Fuel
Quality Directive has existed for several decades, and addresses air pollution caused by
the use of road fuels through regulating, for example, lead and sulphur content of fuels.
Common fuel quality rules are important as they not only ensure that there can be a
single market for road transport fuels, but also that vehicles can be driven safely,
without causing damage to engines, using fuels bought anywhere in the EU in the
course of a journey.
The Fuel Quality Directive establishes an obligation on suppliers of transport fuels.
Suppliers can choose to act as a group to jointly meet the targets. Calculation of the
greenhouse gas intensity of fuels is based on a life-cycle analysis. This means that all
emissions from the extraction, processing and distribution of fuels are included,
wherever possible. Hence, a “well-to-wheels” approach is required. Direct life-cycle
greenhouse gas emission reductions are calculated from a 2010 baseline of fossil fuel
greenhouse gas intensity.
For biofuels to count towards the greenhouse gas emission reduction targets of the Fuel
Quality Directive, as well as the provisions of the Renewable Energy Sources Directive,
certain sustainability criteria must be achieved. These should minimise the undesirable
impacts of their production. The criteria require that greenhouse gas emissions must be
at least 35% lower than from the fossil fuels they replace. From 2017 this increases to
50%, and from 2018 the savings must be at least 60% for new installations.
62
Directive 2009/30/EC of 23/04/2009 amending Directive 98/70/EC as regards the specification of
petrol, diesel and gas-oil and introducing a mechanism to monitor and reduce greenhouse gas emissions
and amending Council Directive 1999/32/EC as regards the specification of fuel used by inland waterway
vessels and repealing Directive 93/12/EEC; OJ L 140, 5.6.2009, p. 88–113. http://eur-lex.europa.eu/legal-
content/EN/TXT/PDF/?uri=CELEX:32009L0030&from=EN

61
Biofuels and bioliquids shall not be made from raw material derived from land with a
high biodiversity value (e.g. primary forest), a high carbon stock (e.g. wetlands) or land
that was peat land. However, more often the pressure to convert land does not come
from the wish to produce biofuels directly on the converted land, but rather to produce
food that would otherwise have been produced on existing agricultural land now used to
produce biofuels. This “knock-on” effect is called “Indirect Land-Use Change” (ILUC).
ILUC may significantly reduce the greenhouse gas savings from biofuels, and if it is not
taken into account, the environmental added-value of using biofuels in the first place
can be greatly exaggerated (and even eliminated altogether). Furthermore, and rather
more obviously, the use of biofuels can also conflict with food production: often the
same raw materials can be used to produce both food and biofuels. So-called “first-
generation” biofuels are usually produced from cereal crops (e.g. wheat, maize), oil
crops (e.g. rapeseed, palm oil) and sugar crops (e.g. sugar beet, sugar cane) using
established technology. However, “second-generation” or “advanced” biofuels usually
use non-food feedstock, such as straw and waste, or algae and non-food crops grown on
land that would not otherwise be used for food or feed production (e.g. miscanthus and
short-rotation coppice).
For those reasons, the European Commission proposed an amendment to the Fuel
Quality Directive as well as to the Renewable Energy Sources Directive to limit the
amount of food-based biofuels to 5%, which was approximately equal to the current
(2012) consumption level at that time. This constraint is expected to allow non-food-
based biofuels to make a greater contribution to meeting the 10% renewable energy in
transport target. At the same time, second-generation and advanced biofuels would be
promoted as they are expected to have low or no indirect land use emissions associated
with them. In April 2015 agreement was reached between the European Parliament and
Council on the ILUC proposal including a percentage cap on food-based first-
generation biofuels of 7%.
After a promising start the target of a 10% share renewable energy in transport fuels
may not be met63
.In 2010 the share was only 4.7% while the planned share was 4.9%,
the bulk of which was biodiesel, followed by bio-gasoline64
In 2013 the share was 5.3
% 65
.Progress made in implementing the biofuel sustainability criteria is clearly not
sufficient in the absence of provisions that adequately address ILUC. Furthermore,
regarding the risk of biodiversity loss related to the domestic and imported biofuels,
although it has been found that production from most EU countries poses a low risk for
biodiversity losses, biofuel imports from Brazil (soy and sugar), the US (soy and maize)
and Russia (rapeseed and soy), on the other hand, were assessed to be at high risk of
causing biodiversity loss66
.
63
European Commission (2013) Renewable energy progress report. COM(2013) 175 final of 27 March
2013; p. 6. ; http://eur-lex.europa.eu/legal-content/EN/TXT/PDF/?uri=CELEX:52013DC0175&from=EN 64
EUROSTAT (2014) EU Energy in figures Statistical Pocketbook 2014; page 114:
http://ec.europa.eu/energy/sites/ener/files/documents/2014_pocketbook.pdf 65
See EUROSTAT http://ec.europa.eu/eurostat/statistics
explained/index.php/File:Share_of_energy_from_renewable_sources_in_transport_-_2013.png ,
consulted 6/5/2015 66
European Commission (2013) Renewable energy progress report, Commission Staff Working
62
The experience with the EU's regulation on fuels and biofuels has not always provided
sufficient regulatory certainty for businesses, but also the scientific evidence still raises
doubts about the environmental added-value of biofuels and bioliquids. The European
Commission indicated that for these reasons it does not intend to propose new targets
for renewable energy or for the greenhouse gas intensity of fuels in the transport sector
beyond 202067
. The European Council’s Conclusions of October 2014 did not
contradict such a change of approach, but invited the Commission “to further examine
instruments and measures for a comprehensive and technology neutral approach for the
promotion of emissions reductions and energy efficiency in transport, for electric
transportation and for renewable energy sources in transport also after 2020.”
Opportunities and challenges: cost-effectiveness and market integration
Excessive divergence between the support schemes of the Member States, the limited
use of the cooperation mechanisms, and the pressure on available public money
following the economic recession, necessitated the European Commission to define a
more orderly framework for the delivery of renewable targets.
In 2013, the Commission encouraged Member States to develop more cost-effective
schemes adaptable over time to technological progress, so as to keep costs in check68
. It
was also stressed that specific barriers hindering the diffusion of renewable energy
(administrative burdens, slow infrastructure build and delays in connections, as well as
grid operating rules that disadvantage renewable energy) were not always adequately
removed.
In 2014, new guidelines on State Aid for projects in the field of environmental protection
and energy were adopted69
. These guidelines contained the following key elements:
1. to promote a gradual move to market-based support for renewable energy by
2017. Some renewable energy technologies are already mature, which calls for
their integration in the market. To increase cost effectiveness and limit distortions,
the new guidelines foresee the gradual introduction of competitive bidding
processes for allocating public support, while offering flexibility to take account
of national circumstances. The guidelines also foresee the gradual replacement of
feed-in tariffs by feed-in premiums, which increase the exposure of renewable
energy to market price signals. Document, SWD(2013102 final,, 27 March 2013, pages 27-28.; http://eur-lex.europa.eu/legal-
content/EN/TXT/PDF/?uri=CELEX:52013DC0175&from=EN 67
: Commission (2014) A policy framework for climate and energy in the period from 2020 to 2030”
COM(2014)15 final of 22/01/2014;; Communication from the Commission to the European Parliament,
the Council, the Economic and Social Committee and the Committee of the Regions, http://eur-
lex.europa.eu/legal-content/EN/TXT/PDF/?uri=CELEX:52014DC0015&from=EN with further
information at: http://ec.europa.eu/clima/policies/2030/documentation_en.htm 68
In particular, pages 9 and 13 of European Commission (2013)Renewable energy progress report,
COM(2013) 175 final of 27 March 2013; http://eur-lex.europa.eu/legal-
content/EN/TXT/PDF/?uri=CELEX:52013DC0175&from=EN 69
European Commission (2014) Guidelines on State aid for environmental protection and energy 2014-
2020,, Communication, OJ C 200, 28.6.2014, p. 1–55.; http://eur-lex.europa.eu/legal-
content/EN/TXT/PDF/?uri=CELEX:52014XC0628%2801%29&from=EN

63
2. to include criteria on how Member States can relieve energy intensive companies
that are particularly exposed to international competition from charges levied for
the support of renewables. The guidelines allow for reducing the burden for a
limited number of energy intensive sectors defined for the whole EU.
3. to include new provisions on aid to generation capacity so as to strengthen the
internal energy market and ensure security of supply.
Opportunities and challenges: network infrastructure and flexibility
To achieve the overall renewable target of 20% in 2020, as well as the differentiated
national targets, it is not only relevant to set the right incentives. It is also important to
improve infrastructure, such as the electricity network. In terms of location, the supply
of renewable energy may not always match demand. If the wind is strong in Denmark
but demand is high in Bavaria in Southern Germany or in Poland, then adequate
electricity connections are needed. It is also necessary to ensure that annual or daily
peaks in power consumption can be absorbed either by enabling storage or by using
more flexible power generation that can be switched on and off quickly.
The emergence of large amounts of variable electricity generation requires the need to
move towards a more interconnected, smart and flexible electricity system. This will
have very profound impacts on the functioning of electricity markets in the EU. For
instance, greater flexibility can be achieved by a further development of shorter-term
markets, such as intra-day and balancing markets, so as to ensure the right price signals
reward short-term flexibility.
Conventional power is currently confronted with a series of issues in this transition:
reduced demand due to the economic recession and the build-up of alternative capacity,
the need to provide higher flexibility but for a reduced number of load-hours, and the
“mothballing” of gas plants that are not competitive compared to coal and lignite. Some
Member States have therefore opted, or are considering introducing capacity
mechanisms. This, however, raises the same questions regarding how to prevent
potential fragmentation of the internal energy market and potential distortions of
competition, while ensuring generation adequacy.
Opportunities and challenges: interactions between policy instruments
There are also implications for the operation of the EU ETS. On the one hand, the
renewables legislation will contribute towards meeting the greenhouse gas reductions
agreed both in the sectors covered by the EU ETS and those outside the ETS (such as
transport). On the other hand, the renewable subsidies increase the use of renewable
energy beyond what they would otherwise have been, and so they reduce demand for
EU ETS allowances – thereby exerting a downward pressure on carbon prices.
There is, however, a more fundamental question at hand. A high target for renewables
might lead to higher (implicit) costs for reducing greenhouse gas emissions than strictly
necessary (Marcantonini and Ellermann, 2013 and Marcantonini and Ellermann, 2014).
64
The argument runs that cheaper options, such as energy efficiency measures, demand-
side management, or fuel switching from coal to gas, may not have been fully used, but
instead may be replaced by more expensive options such as some forms of renewable
energy.
This argument indicates the approach of the Renewable Energy Sources Directive was
quite different than the one followed by the EU ETS. In the latter case full
harmonisation at EU-level was pursued for reasons related to the cost-effectiveness of
climate policy, while the promotion of renewable energy followed a reasoning of
national governance, pursuing potentially various benefits such as greenhouse gas
reduction, energy mix preferences, industrial policy and local employment
opportunities. The ETS is technology neutral as to which low-carbon route was
preferred by economic operators, while the renewable energy approach was by
definition technology specific.
Some analysis suggests that the costs for the EU of meeting its 20% greenhouse gas
reduction target in 2020 may have been some 10% higher than what was strictly
necessary (Capros et al, 2011). This is due to the fact that other options, such as energy
efficiency or fuel switching might ultimately have been cheaper. These extra costs can,
however, be defended by the additional benefits renewables bring in terms of reducing
dependency on oil and gas imports, and in terms of the advantages gained by
developing new technologies (innovation) through learning-by-doing. Moreover, the
policies that drive the demand for these technologies may lead to a first-mover
advantage in the diffusion of technologies that raises exports, GDP and employment
(Pollit et al, 2015).
These are very relevant questions for the design of a revised Renewable Energy Sources
Directive that will implement the decision of the European Council of October 2014 to
increase the objective to “at least 27%”…“binding at EU level”. This is in line with the
commitment of the European Union to become the world leader in renewable energy.
This will require the development of the next generation of advanced, competitive
renewables energies. Costs have been reduced significantly due to past EU's
commitment. Moreover renewable production needs to be progressively and efficiently
integrated into the internal energy market and energy markets and grids needs to be
made fit for renewables.70
More interconnection and flexibility (flexible supply,
including storage, and demand-response) will have to be deployed so as to allow for a
full use of the potential renewable energy can offer.
70
European Commission (2015) “A Framework Strategy for a Resilient Energy Union with a Forward-
Looking Climate Change Policy”, COM(2015)80 final dated 25/02/2015.;
http://ec.europa.eu/priorities/energy-union/docs/energyunion_en.pdf

65
Conclusion: the EU policy on renewables has been successful in increasing the
share of renewables in final energy consumption from 8.5% in 2005 to 15% in
2015, and is well on track to deliver the target of 20% by 2020. The EU-wide
renewable energy target of at least 27% in 2030 as agreed by the European
Council is an important signal to the investor community that renewable energy
will be an increasingly important and mainstream energy source. Most notably in
electricity some 45% will be renewable in 2030. This is challenging but achievable.
Finally and crucially, renewable energy will need to be fully integrated into the
EU’s internal energy market.
Improving energy efficiency
Dependence and barriers
Concerns persist that the EU will be increasingly reliant on imported energy. In 2012,
86% of oil and 66% of gas was imported and by 2030 imports could even increase to
94% for oil and 83% for gas. In addition, even if oil prices have gone down
significantly in recent months, energy may also become more expensive over the course
of time. The risk of supply interruptions continues because energy imports (especially
of oil and gas) are anticipated to come from an increasingly limited number of
supplying countries, while domestic production, for example, in the Netherlands and the
North Sea, is expected to decline.
Moderating energy demand is one of the options to increase security of supply, as well
as being a means to reduce greenhouse gas emissions. The good news is that
technological progress in the field of energy efficiency has been considerable, be it in
the field of buildings, cars, appliances or in industry.
But a number of market barriers prevent the development and diffusion of these
technologies. Such barriers might be imperfect information on the costs and benefits of
energy saving measures, the existence of split incentives (where owners are reluctant to
invest in energy savings measures which would benefit the tenant through reduced
energy bills), and the lack of knowledge on actual energy consumption or difficulty
financing large up-front investments. Individual consumers may pay higher interest
rates than assumed for the economy in general. These elements typically lead to
underinvestment in energy efficiency compared to what could be regarded as optimal
from a social point of view. Such market barriers are not necessarily overcome by
setting a price on emissions or by high energy prices.
There are, therefore, strong arguments for government intervention and regulation
mainly at Member State-level but also at EU-level. As part of the climate and energy
package of 2009, a non-binding energy efficiency target was agreed. The target is to
reduce gross primary energy consumption in 2020 by 20% compared to the 1842
Million tonnes of oil equivalent (Mtoe) level that was expected for 2020 under the
“business-as-usual” projection made in 2007. The latest projections based on additional
66
measures adopted suggest that a reduction of 17% or perhaps even 18 to 19% may be
achieved71
(Capros et al, 2014).
Regulating the energy use of products and devices
EU-level intervention is especially relevant when it comes to the energy use of products
and devices that are traded internationally. One central element is the "Ecodesign
Directive”72
. This is a European Directive to regulate the design, from an environmental
perspective, of products that use energy. All kinds of electrical and electronic
equipment are covered, including heating equipment.
The purpose of the legislation is the provision of coherent rules for “ecodesign” within
the European Union so that differences in national laws pose no obstacles to intra-EU
trade. The Directive offers a framework to set minimum energy efficiency standards
that have to be met for new appliances. Conditions and criteria can also be defined for
relevant environmental characteristics for specific products. These can, for example, be
criteria relating to water consumption of the product, waste production or the extension
of the lifespan of a product. By means of the specific implementing measures the EU
seeks to affect the design of electrical and electronic products with a view to their swift
and efficient improvement.
Over recent years, within this legal framework, many specific implementing measures
have been taken. Table 3.2 gives an overview of the measures that have already been
taken so far to improve the energy use of products. An order of magnitude of their
expected impact on CO2 emissions is given as well as an estimated cost impact. Cost
estimates are the subject of discussion because they are sensitive to the discount rate
used and the expected change of prices over time. The study by Irrek et al73
, for
example, shows that using 2% real discount rates may make the annual net cost savings
between 0 and 50% higher. For example, for office and street lighting cost savings vary
between €3.3 billion (4% discount rate) and € 1.7 billion (8% discount rate) per year.
71
European Commission, (2014) Energy efficiency and its contribution to energy security and the 2030
Framework for climate and energy policy, Communication, European Commission, COM (2014) 520
final, 23.7.2014. ;
http://ec.europa.eu/energy/sites/ener/files/documents/2014_eec_communication_adopted_0.pdf 72
Directive 2009/125/EC of the European Parliament and of the Council of 21 October 2009 establishing
a framework for the setting of ecodesign requirements for energy-related products; OJ L 285, 31.10.2009,
p. 10–35: http://eur-lex.europa.eu/legal-content/EN/TXT/PDF/?uri=CELEX:32009L0125&from=EN 73
Irrek, W., L. Tholen and M. Franke (2010): Analysis of impact of efficiency standards on EU GHG
emissions, Final Task 3 report: outlook on the estimated greenhouse gas emission reductions (Contract
EC DGENV), Hamburg, Ökopol: http://ec.europa.eu/clima/policies/effort/docs/impact_ggas_en.pdf
(Consulted 21/04/2015)
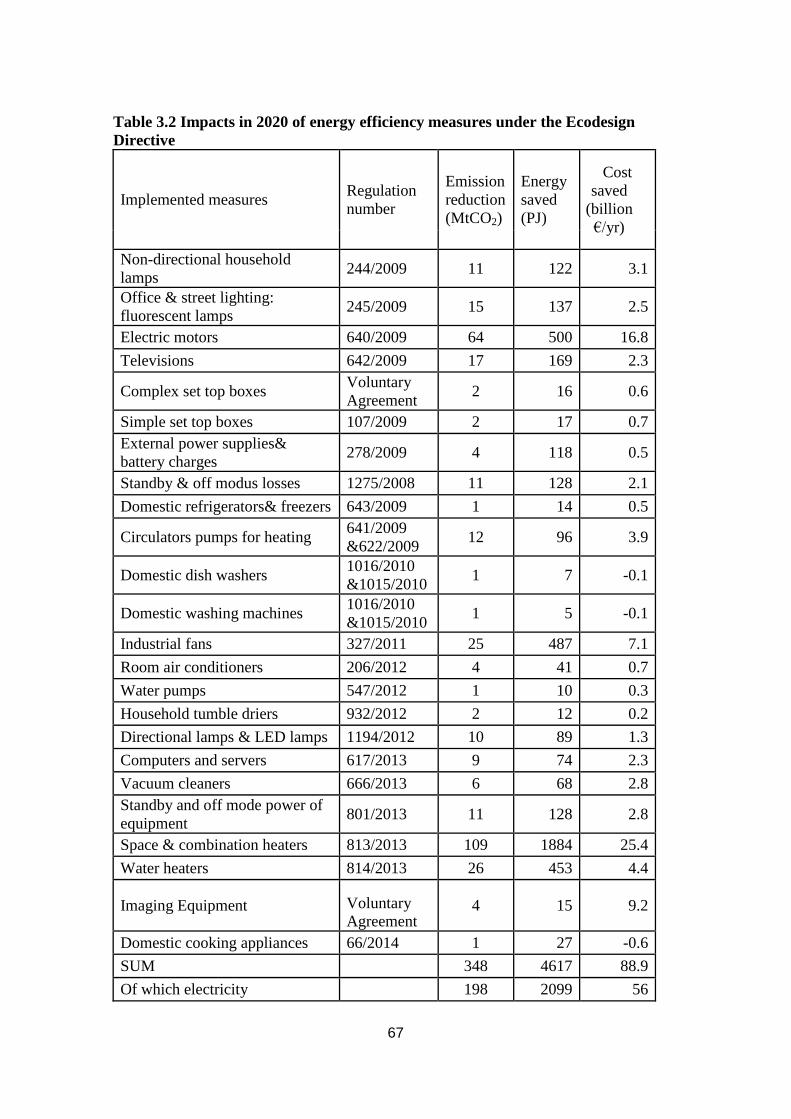
67
Table 3.2 Impacts in 2020 of energy efficiency measures under the Ecodesign
Directive
Implemented measures Regulation
number
Emission
reduction
(MtCO2)
Energy
saved
(PJ)
Cost
saved
(billion
€/yr)
Non-directional household
lamps 244/2009 11 122 3.1
Office & street lighting:
fluorescent lamps 245/2009 15 137 2.5
Electric motors 640/2009 64 500 16.8
Televisions 642/2009 17 169 2.3
Complex set top boxes Voluntary
Agreement 2 16 0.6
Simple set top boxes 107/2009 2 17 0.7
External power supplies&
battery charges 278/2009 4 118 0.5
Standby & off modus losses 1275/2008 11 128 2.1
Domestic refrigerators& freezers 643/2009 1 14 0.5
Circulators pumps for heating 641/2009
&622/2009 12 96 3.9
Domestic dish washers 1016/2010
&1015/2010 1 7 -0.1
Domestic washing machines 1016/2010
&1015/2010 1 5 -0.1
Industrial fans 327/2011 25 487 7.1
Room air conditioners 206/2012 4 41 0.7
Water pumps 547/2012 1 10 0.3
Household tumble driers 932/2012 2 12 0.2
Directional lamps & LED lamps 1194/2012 10 89 1.3
Computers and servers 617/2013 9 74 2.3
Vacuum cleaners 666/2013 6 68 2.8
Standby and off mode power of
equipment 801/2013 11 128 2.8
Space & combination heaters 813/2013 109 1884 25.4
Water heaters 814/2013 26 453 4.4
Imaging Equipment Voluntary
Agreement 4 15 9.2
Domestic cooking appliances 66/2014 1 27 -0.6
SUM
348 4617 88.9
Of which electricity 198 2099 56

68
Bearing in mind the above caveats, Table 3.2 shows that the expected impacts of this
Directive could be significant. The Table is based on Irrek et al (2010) and the Specific
Impact Assessments of the Regulations under the Ecodesign Directive. The table is
based on the analysis of the preferred option which may differ from the precise
formulation finally agreed by the Member States. 74
The 22 specific Regulations and 2
Voluntary Agreements agreed as of 2014 are expected to reduce the EU's greenhouse
gas emissions by nearly 350 Million tonnes of CO2-equivalent (MtCO2eq.) in 2020.
Noteworthy is that 40% of the energy savings comes from only one measure: improving
the efficiency of space and combination heaters (heat and hot water) (See Table 3.2).
Major contributions are also made by efficiency improvements of electric motors,
industrial fans and water heaters. The Ecodesign Directive’s estimated impact
corresponds to a 7% reduction in electricity demand in 2020.
As Table 3.2 illustrates, the measures are generally expected to result in net cost
savings, since the energy costs saved outweigh the expected additional investment and
possible operating and maintenance costs. There are three exceptions, however, where
there are additional net costs rather than net cost savings, and these are all in the
household appliances sector: dish washers, washing machines and cooking appliances.
Since 1992 there is also a Directive for a European energy label75
. The energy label is a
tool to assist consumers when purchasing household appliances, such as washing
machines and dishwashers. The categories “A” to “G” show to what extent the product
is economical and environmentally friendly. In providing a clearer regulatory
framework for industry, the Directive increases the amount of information available to
consumers on the energy use of products, enabling more informed choice and lower
energy bills, as well as reducing CO2 emissions in the European Union.
Importantly, in 2010 the Directive on the energy performance of buildings was
reviewed76
. Residential and commercial buildings are large users of energy and
buildings account for some 40% of energy consumption in the EU. Under this
Directive, Member States must establish and apply minimum energy performance
requirements for new and existing buildings, ensure the certification of these energy
performance requirements and ensure the regular inspection of boilers and air-
conditioning systems in buildings. Moreover, the Directive requires Member States to
ensure that by 2021 all new buildings are so-called “nearly zero-energy buildings”. The
recasting in 2010 of the Directive is expected to reduce energy consumption by 60-80
Million tons of oil equivalent (Mtoe), and reduce CO2 emissions by 5% in 2020. It
could also create 280,000 to 450,000 new jobs in the building sector that in total
employs around 8 million people in the EU.
74
see http://ec.europa.eu/energy/efficiency/ecodesign/doc/overview_legislation_eco-design.pdf ,
consulted 23/05/2014) , 75
Directive 2010/30/EU of the European Parliament and of the Council of 19 May 2010 on the indication
by labelling and standard product information of the consumption of energy and other resources by
energy-related products; OJ L 153, 18.6.2010, p. 1–12; http://eur-lex.europa.eu/legal-
content/EN/TXT/PDF/?uri=CELEX:32010L0030&from=EN 76
Directive 2010/31/EU of the European Parliament and of the Council of 19 May 2010 on the energy
performance of buildings; OJ L 153, 18.6.2010, p. 13–35.; http://eur-lex.europa.eu/legal-
content/EN/TXT/PDF/?uri=CELEX:32010L0031&from=EN

69
The Energy Efficiency Directive of 2012
On top of the initiatives on ecodesign, energy labelling and the energy performance of
buildings, an new Energy Efficiency Directive was adopted in 201277. The main
purpose was to make a significant contribution to meeting the EU’s 2020 energy
efficiency target of 20%. The Directive includes a wide range of policy measures, and
covers residential energy efficiency, smart meters, home energy management, energy
audits in the commercial sector, retrofitting of public buildings, district heating as well
as demand response.
The main elements of the Directive are the following.
1. Member States have to establish a long-term strategy for the renovation of
residential and commercial buildings. They also need to renovate 3% of the
floor area of public buildings owned by central governments.
2. Central governments must buy only products, services and buildings that
have high energy efficiency “insofar as this is consistent with cost-
effectiveness, economic feasibility, wider sustainability, technical suitability,
as well as sufficient competition”.
3. Member States have to introduce legislation that obliges energy distribution
companies to achieve cumulative end-use savings of on average 1.5% a year
of energy sales to final consumers between 2014 and 2020.
4. Large enterprises must undergo energy audits at least every 4 years. Audits
for small- and medium-sized enterprises must be promoted by governments.
5. Billing in homes must be based on actual, rather than estimated, energy
consumption by 2015.
6. Member States have to assess the potential for cogeneration, district heating
and cooling by 2015, and thereafter every 5 years.
Article 7, introducing energy savings obligations on energy suppliers or distributors of
the Directive is the most innovative, since it could make energy suppliers de facto
“suppliers” of energy-efficient services and products. Nearly half of the energy savings
from the Directive are expected to come from this Article alone78
.. Flexibilities are
allowed in meeting these energy saving obligations by energy suppliers and distributors,
and the Directive also allows Member States to adopt equivalent measures that meet the
same energy savings as an alternative. Overall the Directive is estimated to reduce
energy consumption by 58 Million tons of oil equivalent. This is expected to result in a
12% reduction in energy consumption compared to the 2007 baseline.
77
Directive 2012/27/EU of the European Parliament and of the Council of 25 October 2012 on energy
efficiency, amending Directives 2009/125/EC and 2010/30/EU and repealing Directives 2004/8/EC and
2006/32/EC; OJ L 315, 14.11.2012, p. 1–56. http://eur-lex.europa.eu/legal-
content/EN/TXT/PDF/?uri=CELEX:32012L0027&from=EN 78
EC (2012c): Non paper of the services of the European Commission on energy efficiency Directive,
Informal Energy Council, 19-20 April 2012; http://ec.europa.eu/energy/en/content/non-paper-energy-
efficiency-directive (Consulted 21/04/2015).
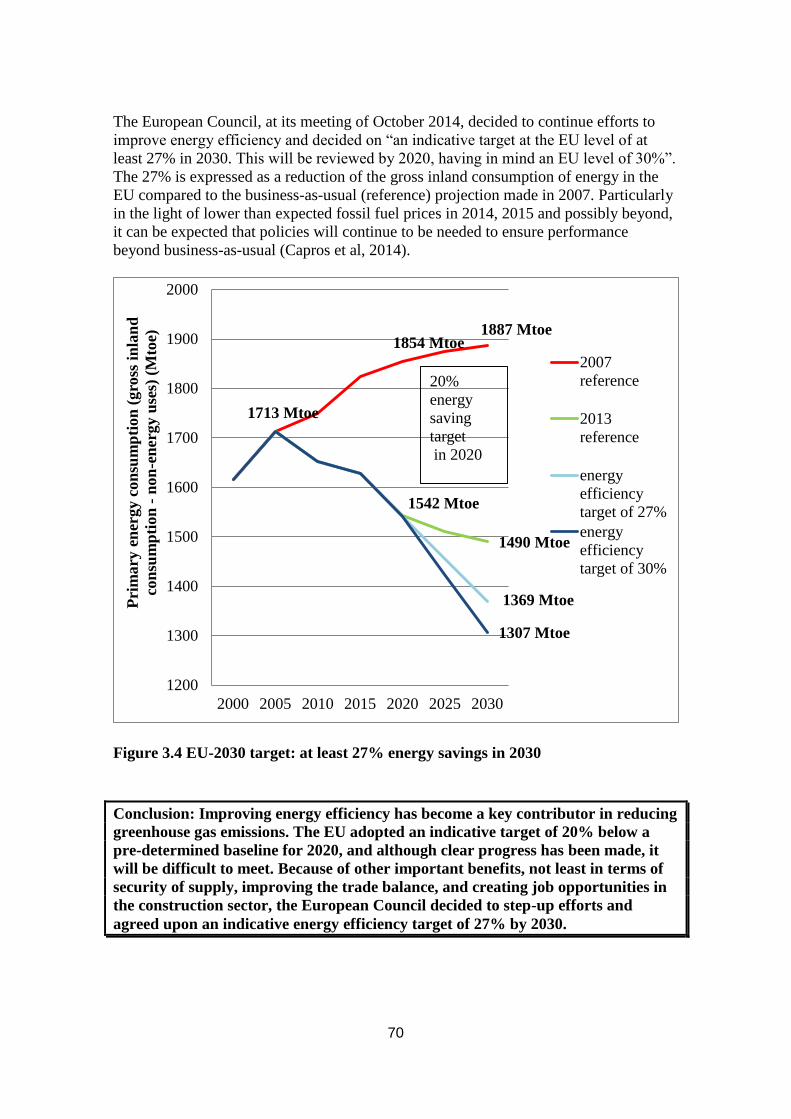
70
The European Council, at its meeting of October 2014, decided to continue efforts to
improve energy efficiency and decided on “an indicative target at the EU level of at
least 27% in 2030. This will be reviewed by 2020, having in mind an EU level of 30%”.
The 27% is expressed as a reduction of the gross inland consumption of energy in the
EU compared to the business-as-usual (reference) projection made in 2007. Particularly
in the light of lower than expected fossil fuel prices in 2014, 2015 and possibly beyond,
it can be expected that policies will continue to be needed to ensure performance
beyond business-as-usual (Capros et al, 2014).
Figure 3.4 EU-2030 target: at least 27% energy savings in 2030
Conclusion: Improving energy efficiency has become a key contributor in reducing
greenhouse gas emissions. The EU adopted an indicative target of 20% below a
pre-determined baseline for 2020, and although clear progress has been made, it
will be difficult to meet. Because of other important benefits, not least in terms of
security of supply, improving the trade balance, and creating job opportunities in
the construction sector, the European Council decided to step-up efforts and
agreed upon an indicative energy efficiency target of 27% by 2030.
1713 Mtoe
1854 Mtoe 1887 Mtoe
1542 Mtoe
1490 Mtoe
1369 Mtoe
1307 Mtoe
1200
1300
1400
1500
1600
1700
1800
1900
2000
2000 2005 2010 2015 2020 2025 2030
Pri
mary
en
ergy c
on
sum
pti
on
(gro
ss i
nla
nd
con
sum
pti
on
- n
on
-en
erg
y u
ses)
(M
toe)
2007
reference
2013
reference
energy
efficiency
target of 27%
energy
efficiency
target of 30%
20%
energy
saving
target
in 2020
71
Emissions from cars, vans, lorries and ships
Introduction
Approximately one-fifth of the total greenhouse gas emissions in the EU come from the
transport sector, and these are expected to continue growing up to 2050, but at a reduced
rate. These emissions are covered by the Effort Sharing Decision (which regulates
greenhouse gas emissions in the EU that are not covered by the EU ETS (see chapter 4)
representing around half of the EU's greenhouse gas emissions including transport.
Regulating transport emissions is therefore essential to meeting the non-ETS targets.
Regulating emissions from cars and vans
Initially, emission standards for the average emissions of new passenger cars were fixed
in Voluntary Agreements with car manufacturers, notably to reach 140 grams per
kilometre (g/km) by 2008/2009. That did not function well in practice, as the targets
were not met. Since 2009, these emissions standards have therefore been set in binding
legislation79
so as to create clarity and regulatory certainty. All new passenger cars
registered in the EU in 2015 and 2021 shall emit on average an emission standard of
130 and 95 g CO2/km respectively. Heavier cars may emit more than lighter cars but
the average of all new cars sold by each manufacturer must reach the set target.
The 2015 and 2021 targets represent reductions of 18% and 40% respectively compared
with the 2007 fleet average of 158.7 g/km. In terms of fuel consumption, the 2015 target
is approximately equivalent to 5.6 litres per 100 kilometres (l/100 km) of petrol or 4.9
l/100 km of diesel. The 2021 target equates to approximately 4.1 l/100 km of petrol or
3.6 l/100 km of diesel. Car manufacturers have been innovating with a variety of
technologies and succeeded the 130g target well before the date of delivery80
. This
contrasts with the average of 186g in 1995 and 173 g CO2/km in the year 2000.
In 2011 and in 201481
the EU adopted legislation to reduce CO2 emissions from light-
duty vehicles setting CO2 emission targets for new vans sold on the European market.
79
Regulation (EC) No 443/2009 of the European Parliament and of the Council of 23 April 2009 setting
emission performance standards for new passenger cars as part of the Community's integrated approach
to reduce CO2 emissions from light-duty vehicles; OJ L 140, 5.6.2009, p. 1-25: http://eur-
lex.europa.eu/legal-content/EN/TXT/PDF/?uri=CELEX:02009R0443-20130508&from=EN and
Regulation (EU) No 333/2014 of the European Parliament and of the Council of 11 March 2014
amending Regulation (EC) No 443/2009 to define the modalities for reaching the 2020 target to reduce
CO2 emissions from new passenger cars; OJ L 103, 5.4.2014, p. 15–21: http://eur-lex.europa.eu/legal-
content/EN/TXT/PDF/?uri=CELEX:32014R0333&from=EN 80
CO2 emission performance of car manufacturers in 2011, European Environment Agency, Copenhagen;
http://www.eea.europa.eu//publications/monitoring-co2-emissions-from-new 81
Regulation (EU) No 510/2011 of the European Parliament and of the Council of 11 May 2011 setting
emission performance standards for new light commercial vehicles as part of the Union's integrated
approach to reduce CO2 emissions from light-duty vehicles; OJ L 145, 31.5.2011, p. 1–18; http://eur-
lex.europa.eu/legal-content/EN/TXT/PDF/?uri=CELEX:32011R0510&from=EN; and
Regulation (EU) No 253/2014 of the European Parliament and of the Council of 26 February 2014
amending Regulation (EU) No 510/2011 to define the modalities for reaching the 2020 target to reduce
CO2 emissions from new light commercial vehicles; OJ L 84, 20.3.2014, p. 38–41.;: http://eur-

72
The obligations are comparable to those relating to new passenger cars. The Regulation
limits CO2 emissions from new vans to a fleet average of 175 g CO2 per kilometre by
2017 and 147 g/km by 2020. These targets represent reductions of 3% and 19%
respectively compared with the 2012 average of 180.2 g CO2/km. This Regulation is
expected to reduce fuel consumption to 5.5 l/100 km for diesel-fuelled vans by 2020.
Important to note are the flexibilities allowed for compliance purposes with the targets
for new passenger cars. The 95 g CO2/km target in 2021 allows for the use of special
incentives (“super credits”). The “super credits” apply to cars with emissions below 50
g CO2/km, such as electric or plug-in hybrid cars. Such low-emitting cars will be
counted as 2 vehicles in 2020, 1.67 in 2021, 1.33 in 2022 and as 1 vehicle from 2023.
This will incentivise manufacturers to develop and deploy new technologies that could
help further reduce the average emissions of the new car fleet. The contribution of these
“super credits” will be capped and the credits can only make a contribution of 7.5 g/km
for each car manufacturer between 2020-22. There are also specific provisions for
smaller manufacturers of less than 10,000 vehicles per year, and producers of less than
1,000 cars per year are exempted.
If we compare the EU policy with that of other countries, both Japan and the EU appear
currently to be world leaders based on a study on the average emissions in grams per
kilometre per passenger car. Figure 3.5 shows the emission standards for passenger cars
in a number of countries82
. In 2002, the average emissions of new passenger cars in the
EU and Japan were well below that of other countries. Countries like the United States
and China are catching up quickly, closely followed by others, including Canada and
Korea. From 2020, however, the EU is expected to have the strictest fuel efficiency
standard of 4.1 l/100 km (in effect from 2021 onwards), followed closely by Japan (4.5
l/100 km) and India and China (4.8 and 5 l/ 100 km respectively).
It is remarkable that despite the fact these policies have developed quite independently
from each other, today 75% of global car sales are subject to some form of CO2 or
energy efficiency legislation, and that the stringency of these policies is converging.
In addition to the emission limit values, an EU Directive is in place that ensures that
consumers buying a new passenger car receive information about fuel consumption and
CO2 emissions of the specific car83
. This labelling is essential for consumers to make
informed choices, as it cannot be simply assumed that they have ready access to this
information.
lex.europa.eu/legal-content/EN/TXT/PDF/?uri=CELEX:32014R0253&from=EN 82
Based on data from the ICCT see:
http://www.theicct.org/info-tools/global-passenger-vehicle-standards
consulted 21.04.2015
83
Directive 1999/94/EC of the European Parliament and of the Council of 13 December 1999 relating to
the availability of consumer information on fuel economy and CO2 emissions in respect of the marketing
of new passenger cars; OJ L 12, 18.1.2000, p. 16–23: http://eur-lex.europa.eu/legal-
content/EN/TXT/PDF/?uri=CELEX:31999L0094&from=EN

73
Figure 3.5 Average emission standards for new passenger cars in the world (US and
Canada values are for light duty vehicles)(source: ICCT)
Emissions from heavy-duty vehicles
While passenger car emissions are now subject to EU legislation, this is not yet the case
for Heavy-Duty Vehicles (HDV), such as trucks and buses. CO2 emissions from HDV
have increased by around 36% between 1990 and 2010 and are expected to more or less
remain at this level until 205084
..
A core issue is that CO2 emissions from HDV are neither measured nor certified or
recorded when new vehicles are registered. Technically speaking, CO2 emissions from
new HDV could be reduced by at least 30% in a cost-effective way. However, a number
of market barriers however prevent the uptake of these measures: few companies have
data to evaluate the fuel efficiency of new HDV; HDV producers offer fewer fuel saving
technology options; operators use high discount rates when making decisions, expecting
returns on investment within 3 years rather than over the technical lifetime of 11 years; or
split incentives between the owner of the vehicle (a leasing company, for example) and
the operator who would benefit from lower fuel costs85
. For the above reasons, the
84
European Commission (2014) Strategy for reducing Heavy-Duty Vehicles' fuel consumption and CO2
emissions” COM(2104) 285 final, 21/05/2014,
.http://ec.europa.eu/clima/policies/transport/vehicles/heavy/docs/com_285_2014_en.pdf
More information available on the European Commission’s website at:
http://ec.europa.eu/clima/policies/transport/vehicles/heavy/documentation_en.htm 85
Executive Summary of the Impact Assessment of a Strategy for reducing Heavy-Duty Vehicles' fuel
consumption and CO2 emissions, Commission Staff Working Document reference: SWD(2014)159 final,
21/05/2014; http://ec.europa.eu/clima/policies/transport/vehicles/heavy/docs/swd_2014_159_en.pdf

74
Commission proposed in May 2014 that first action is needed to improve knowledge of
the actual fuel consumption of HDV using a new methodology, as well as on certifying
and reporting CO2 emissions of new vehicles, as was done for passenger cars previously.
Once this is implemented, further action may be considered.
Addressing greenhouse gas emissions from shipping
The annual global CO2 emissions from shipping exceed 870 million tonnes, and these
are accompanied by emissions of black carbon that are believed to have significant
climate impacts, in particular in the Arctic. The CO2 emissions from journeys between
ports in the EU, and to and from the ports outside the EU, are expected to reach 210
Million tonnes of CO2 by 202086
. By 2050, without action, global emissions from
shipping are expected to more than double from current levels.
The EU’s climate policy for shipping is similar in a number of ways to aviation: there is
a UN organisation, the International Maritime Organisation (IMO), with a good track
record for adopting technical and operational measures. At the same time, a number of
third countries have expressed concern about any measure not adopted by global
consensus. Compared to aviation, however, a major difference is that the quality of data
for shipping emissions is generally poor, with levels of uncertainty up to approximately
20%. Moreover, many cost-saving CO2 reduction measures in the maritime transport
sector are not being implemented, in part due to market barriers such as a lack of
information, access to finance, and split incentives.
Against this background, in June 2013 the Commission published a Strategy for
addressing maritime emissions87
, and at the same time proposed a Regulation of the
European Parliament and of the Council on the on monitoring, reporting and
verification of greenhouse gas emissions from shipping88
. This proposal has been
agreed by the European Parliament and the Council as EU Regulation 2015/757, of 29
April 201589
. Rather than proposing market-based measures, such as the inclusion of
shipping into the EU ETS, the Commission considered it more appropriate to progress
in a step-wise manner, given the importance of a robust system of measuring emissions.
(consulted 22/04/2015) 86
European Commission (2013) Impact Assessment - Part 1, Commission Staff Working Document
Accompanying the document Proposal for a Regulation of the European Parliament and of the Council
on the monitoring, reporting and verification of carbon dioxide emissions from maritime
transport and amending Regulation (EU) n° 525/2013 {COM(2013) 480 final}
{SWD(2013) 236 fin, Brussels of 28.6.2013. SWD(2013) 237 final/2
http://ec.europa.eu/clima/policies/transport/shipping/docs/swd_2013_237_1_en.pdf 87
European Commission (2013) Integrating maritime transport emissions in the EU's greenhouse gas
reduction policies. COM(2013)479 of 28/06/2013.
http://ec.europa.eu/clima/policies/transport/shipping/docs/com_2013_479_en.pdf 88
Proposal for a Regulation of the European Parliament and of the Council on the monitoring, reporting
and verification of carbon dioxide emissions from maritime transport and amending Regulation (EU) No
525/2013, COM(2013) 480 final of 28/06/2013.
http://ec.europa.eu/clima/policies/transport/shipping/docs/com_2013_480_en.pdf 89 see http://eur-lex.europa.eu/legal-content/EN/TXT/PDF/?uri=OJ:JOL_2015_123_R_0007&from=EN
75
A system of monitoring, reporting and verification (MRV) by itself is expected to
reduce costs by increasing information and transparency on fuel use, and to highlight
the potential for cost-effective emission reductions. The EU’s measure is explicitly
intended to facilitate adoption of comparable MRV standards within the IMO, and is
enabling better insights into the potential of the sector to reduce its emissions.
Conclusion: Emissions from new cars have been successfully brought down in the
EU through setting mandatory standards and this triggered accelerated innovation
in the automotive sector. Fuel consumption of cars is projected to fall year-by-year
to an average consumption of not more than 4.1 litres per 100 km by 2021. Vans
follow a similar path of improvement. From a global perspective similar regulation
has been introduced in all major regions of the world. For lorries and emissions
from shipping, the first emphasis has been put on establishing a solid monitoring
of emissions.
Outlook
This chapter started with an assessment of the current way that the EU produces and
consumes energy, concluding that for the moment it is neither sustainable, nor secure or
competitive. It also clearly indicated the important role that Member States play in
designing policies in this field, in particular when energy security is at stake.
Enhancing the role of renewable energy is an important aspect of the EU's strategy in
this respect, and the EU appears to be well on the way to meeting its target of a 20 %
share of renewable energy by 2020. Compared to 10 years ago, where renewable energy
was a niche market in a few countries, the prospect of many renewable energy sources
being competitive with mainstream technology is no longer a distant dream but a reality
that needs to be addressed.
The rapid development of renewable energy, notably in the power sector, the cost
reductions and the increasing globalisation of the industry is bringing major new
challenges. How should the EU adapt its regulatory framework that governs the EU
internal market so as to enable a more interconnected, smart and flexible electricity
system? How can regional cooperation contribute? How should the EU remain a leader
in renewable energy and keep, or regain, a first-mover advantage in the face of
aggressive industrial policies in other parts of the world? It is these questions that are
also at the heart of the Energy Union strategy paper launched by the European
Commission in February 2015.
On energy efficiency, a collection of policies has been introduced: efficiency measures
under the Ecodesign Directive, CO2 Regulations for passenger cars and vans, the
Energy Performance of Buildings Directive and the Energy Efficiency Directive. These
measures will reduce energy consumption compared to the projections, but reaching the
target of reducing energy consumption by 20% in 2020 and by 27% in 2030 below the
business-as-usual forecast of 2007 will still require enhanced efforts.
Irrespective of whether the indicative target will be met or not, progress in energy
efficiency has been remarkable. Most notably, efficiency standards for appliances and
76
legislation for cars have been shown to trigger accelerated product innovation. An
important lesson for the future may be that such legislation that directly regulates
particular sectors in an internal market of more than 500 million consumers, is effective,
and can lead to significant results.
Another element is the link to global developments. Despite quite independent
regulatory developments, and indeed the lack of any real coordination, such as could
have been triggered by an ambitious international climate agreement, we see a
dissemination and replication of policies throughout the world, not least in major
emerging economies. This is certainly an encouraging sign. This has led to a situation
that in some areas, such as renewable energy, emerging economies are now bigger
markets than the developed world.
In addition, global competition in energy innovation has been increasing steadily. As
other countries have identified the potential benefits of new technology for their
economy, they also strive towards technological leadership, This is very important for
Europe, as renewable energy, the automotive sector (and transport technology more
generally), industrial and household equipment are all strongholds of the European
manufacturing sector. The growth in global “clean-tech” therefore provides a major
growth opportunity for European companies, but realising this opportunity will require
strenuous efforts in the light of international competition.
In parallel with all the developments in the energy field of such relevance to the EU’s
climate policies, the EU’s energy security strategy90
has undoubtedly received new
impetus as a result of the tensions between Russia and Ukraine. This only underlines the
need for ambitious energy and climate policies in the decade up to 2030. The
moderation of energy demand is indeed a central pillar of the Energy Union as well as a
most important contribution to meet the EU’s climate goals.
Finally, this chapter has shown that the EU has more work to do on energy policy so as
to make it sustainable, secure and competitive. It remains, however, the EU’s belief that
it is in its long-term interests to develop alternative low-carbon or carbon-free energy
sources that will in time become price competitive with fossil-generated energy. The
cost curves of many renewable energy technologies continue to fall, while the price of
polluting must increasingly be made to reflect all externalities. The “crossing point”,
when renewable energies become equal to or lower in cost than conventional energy,
will occur for different technologies at different times. The EU’s climate and energy
policy frameworks now being put in place, in conjunction with Member State policies,
are focussed on bringing forward in time this “crossing point”, thereby providing
greater resilience and competitiveness to the EU economy.
In the meantime, keeping climate and energy policies as cost-effective as possible is
crucial. Evidence of this realisation can be seen in the evolution of climate and energy
policies over time, with increasing emphasis on flexibilities in complying with EU
legislation and goals, and on the minimisation of inconsistencies between instruments.
90
European Commission (2014)European Energy Security Strategy. COM(2014)330 final of 28/05/2014.
http://eur-lex.europa.eu/legal-content/EN/TXT/PDF/?uri=CELEX:52014DC0330&from=EN

77
It is important to see the 2030 climate and energy policy framework, as endorsed by the
European Council, in this light. The 2030 framework comprises fewer binding national
targets, no “sub-targets” such as exist to 2020 for transport, and greater flexibilities for
Member States to choose what is right for them. This gradual evolution of policy is
evidence once again of the EU’s learning-by-doing, and the gradual improvement of
both the effectiveness and cost-effectiveness of policies over time.
References
Capros, P., Mantzos L., Parousos L., Tasios N., Klaassen G. and van Ierland T. (2011)
Analysis of the EU policy package on climate change and renewables. Energy Policy,
39(3), pp. 1476-1485.
Capros, P. A. de Vita, N. Tasios, D. Papadopoulos, Siskos P., Apostolaki E., Zampara
M, Paroussos L., Fragiadakis K., Kouvaritakis N., Hoglund-Isaksson L., Winiwarter
W., Purohit P., Böttcher H., Frank S., Havlik P., Gustu M. and Witzke H.P.. (2014) EU
energy, transport and GHG emissions: trends to 2050, reference scenario 2013.
Publications office of the European Union, Luxembourg.
(http://ec.europa.eu/clima/policies/2030/models/eu_trends_2050_en.pdf), consulted
9/4/2014).
EEA (2012a) CO2 emission performance of car manufacturers in 2011, European
Environment Agency, Copenhagen.
Eurostat, (2014): EU Energy in figures Statistical Pocketbook 2014:
http://ec.europa.eu/energy/sites/ener/files/documents/2014_pocketbook.pdf
IEA (2012) World Energy Outlook 2012. Paris, page 76. © OECD/IEA 2012 World
Energy Outlook, IEA Publishing, Paris.
Irrek, W., L. Tholen and M. Franke (2010) Analysis of impact of efficiency standards
on EU GHG emissions, Final Task 3 report: outlook on the estimated greenhouse gas
emission reductions (Contract EC DGENV), Hamburg, Ökopol.
(http://ec.europa.eu/clima/policies/effort/docs/impact_ggas_en.pdf. Consulted
26/3/2013)
Joint Research Centre (2014) 2013 JRC wind status report: Technology, market and
economic aspects of wind energy in Europe, by Roberto Lacal Arántegui.
https://ec.europa.eu/jrc/sites/default/files/ldna26266enc_2013_jrc_wind_status_report_f
inal.pdf
JRC (2014) ETRI 2014 Energy technology reference indicator projections for 2012-
2050. JRC Science and Policy reports. Report EUR 26950 EN, Luxembourg,
Publication Office of the European Commission.
Klaassen, G. Miketa A., Larsen K. and Sundqvist T. (2005) The impact of R&D on
innovation for wind energy in Denmark, Germany and the United Kingdom, Ecological
Economics, 54, pp 227-240.

78
Marcantonini, C. and Ellermann D. (2013): The Cost of Abating CO2 Emissions by
Renewable Energy Incentives in Germany. European University Institute, Florence.
EUI Working Paper RSCAS 2013/05.
http://cadmus.eui.eu/bitstream/handle/1814/25842/RSCAS_2013_05rev.pdf?sequence=
1 (consulted 21/04/2015).
Marcantonini, C. and Ellermann D. (2014): The Implicit Carbon Price of Renewable
Energy Incentives in Germany, European University Institute, Florence. EUI Working
Paper RSCAS 2014/28.
http://cadmus.eui.eu/bitstream/handle/1814/30200/RSCAS_2014_28_REV.pdf?sequenc
e=3 (consulted 21 April 2015).
Pollit, H., Summerton P. and Klaassen G. (2015) A model-based assessment of first-
mover advantage and climate policy. Environmental Economics and Policy Studies, 17:
299-312.
Stiglitz, J. (2013) The price of inequality, New York: W.W. Norton & Company.

79
4 Framing Member States policies
Jos Delbeke and Ger Klaassen
Introduction
The previous two chapters explained the EU's emissions trading system and the
contribution energy policy makes to changing energy consumption and reducing
greenhouse gas emissions. Other pieces of (non-energy) related EU legislation to
address climate change from sectors outside the scope of the EU ETS have not yet been
discussed. This is the purpose of this chapter.
Section 2 starts with a description of the Effort Sharing Decision that determines the
emission reductions of greenhouse gas emissions not covered by the ETS. This is
followed by EU legislation to control non-CO2 greenhouse gas emissions, such as the
revision of the “F-gas” Regulation agreed in March 2014. Then, the carbon sources and
sinks from land use, land-use change and forestry (LULUCF) are addressed. The
chapter is closed with a description of EU climate adaptation policy and mainstreaming
into the EU budget.
The Effort Sharing Decision for the non-ETS sectors
The sectors outside the ETS constitute around half of the EU's greenhouse gas
emissions. Included are the greenhouse gas emissions from smaller industrial
installations, services, transport, agriculture, waste and households. The reductions for
the non-ETS sectors are made legally binding by the Effort Sharing Decision91
. Carbon
emissions (or carbon sinks) from land use and land-use changes and forestry (LULUCF)
are not included under the existing targets for the period up to 2020 set in the Effort
Sharing Decision.
The EU target for greenhouse gas reductions in 2020 compared to 1990 is 20%. This
implies an emission reduction of around 14% compared to EU greenhouse gas
emissions in 2005, 2005 being the first year for which comparable verified emissions
data was available for the sectors covered by the EU ETS. The 14% reduction in 2020
was not equally shared between the ETS and the non-ETS sectors, since emission
reductions were expected to be cheaper in the ETS than in the non-ETS sectors. The
reduction agreed for the sectors covered by the EU ETS was 21% compared to 2005 and
the reduction for the non-ETS sectors was around 10% compared to 2005. These
reduction objectives were based on extended economic analysis(see Delbeke et al., 2010
and Capros et al, 2011).
91
Decision No 406/2009/EC of the European Parliament and of the Council of 23 April 2009 on the
effort of Member States to reduce their greenhouse gas emissions to meet the Community’s greenhouse
gas emission reduction commitments up to 2020, OJ L 140, 05/06/2009, p. 136–148. http://eur-
lex.europa.eu/LexUriServ/LexUriServ.do?uri=OJ:L:2009:140:0136:0148:EN:PDF

80
The central element of the Effort Sharing Decision is the fact that emission reductions
are distributed between Member States in order to arrive at an efficient and fair sharing
of the abatement efforts. The differentiated national targets set by the Effort Sharing
Decision are only one part of the overall burden-sharing. The other parts are the
redistribution of auctioning revenues and the differentiated renewable energy targets for
each Member State. This combination of burden-sharing was intended to ensure a fair
sharing of the efforts between the EU Member States, while also maintaining, as much
as possible, the incentives to implement cost-effective measures.
Fairness considerations for the distribution of the emission reductions from the non-
ETS sectors were based on GDP per capita (in 2005). Member States with a lower GDP
per capita would still be allowed to increase emissions compared to 2005, to allow for
catching-up. Relatively rich Member States would have to reduce emissions. For
example, Bulgaria and Romania were allowed to increase their emissions by 20%
compared to 2005, whereas the three richest EU Member States at the time (Denmark,
Ireland and Luxembourg) had to reduce emissions by 20% compared to 2005. The
remaining Member States had to reduce emissions by percentages between +20% and -
20% (see Figure 4.1). Belgium, for example, has to reduce emissions by 15% and the
Netherlands by 16% in 2020. The target for Croatia was agreed on the same principles
during the accession negotiations.
Figure 4.1 Sharing the efforts in the non-ETS sectors in relation to GDP per capita
(Source: European Commission)
20% Bulgaria
19% Rumania
17% Latvia
15% Lithuania
14% Poland 13% Slovakia 11% Estonia,
Croatia
10% Hungary 9% Czech
Republic
5% Malta
1% Portugal,
4% Slovenia
-5% Cyprus,
-4% Greece -10% Spain
-13% Italy
-15% Belgium,
-14% France,
Germany
-16% Austria
Finland, UK,
Netherlands
-17 % Sweden
-20% Denmark
Ireland &
Luxemburg -30
-20
-10
0
10
20
30
-5 5 15 25 35 45
Red
uct
ion
%
GDP/Capita (€1000)
Non-ETS target % cf to 2005

81
Member States are responsible for these binding targets and hence have to put in place
policies to meet them. However, a number of EU-wide sector-specific measures are in
place to assist countries in meeting these targets (See chapter 3 and the next sections of
this chapter).
The targets are set according to the principle of fairness, which was important to gain
political acceptability. However, it is legitimate to ask whether this has not been bought
at the expense of economic efficiency. Some Member States might, for example, have a
high GDP per capita but fewer technical (or more expensive) options to reduce
emissions. To alleviate this problem the Effort Sharing Decision includes a number of
flexibilities. First, Member States may transfer any surplus of their annual emission
allocation for a given year to other Member States if their actual emissions are below
their pre-determined allocation. This would, of course, be done in exchange for
financial transfers, or some equivalent benefit. Secondly, Member States may make
limited use of credits from project activities under the Kyoto Protocol (CDM and JI) to
meet the national targets, subject to a number of restrictions. These flexibilities would
significantly improve the cost-efficiency of the Decision (See, for example, Tol, 2009).
Furthermore, these flexibilities are essential in view of the inherent uncertainties around
future emissions, resulting from uncertainties linked to the underlying factors causing
emissions, such as weather, economic growth and energy prices.
The national targets for 2020 for the non-ETS sectors have been translated in a linear
trajectory for the period 2013 to 2020 for the purposes of monitoring of progress over
time. The actual setting of annual emission allocations for each Member State for the
years 2013 to 2020 was decided separately (see Table 4.1)92
. Table 4.1 gives the
numbers for 2013 and 2020 based on the greenhouse gas warming potentials of the 2nd
IPCC Assessment Report.
The differentiated allocation of targets per Member State and the precise translation of
the targets into annual emission budgets, has been a complicated exercise, technically as
well as politically. In the international negotiations it is sometimes overlooked how
much experience the EU has acquired in reaching agreements that take account of
fairness and ability to pay while maintaining overall a cost-effective approach. The EU
Member States are, after all, a grouping of developed countries that are remarkably
diverse in terms of economic profile and energy mix.
92
Commission Decision of 26 March 2013 on determining Member States’ annual emission allocations
for the period from 2013 to 2020 pursuant to Decision No 406/2009/EC of the European Parliament and
of the Council, reference 2013/162/EU, OJ L 90, 28.3.2013, p. 106–110; http://eur-lex.europa.eu/legal-
content/EN/TXT/PDF/?uri=CELEX:32013D0162&from=EN. Figures based on the greenhouse gas
warming potentials of the IPCC 2nd
Assessment Report.

82
Table 4.1 National targets for 2020 for the non-ETS sectors
% change in 2020
compared to 2005 Allocation (MtCO2)
2013 2020
Belgium -15 81.2 70.2
Bulgaria 20 27.3 28.8
Czech Republic 9 63.6 86.3
Denmark -20 35.9 29.7
Germany -14 487.1 437.6
Estonia 11 6.1 6.3
Ireland -20 45.2 37.5
Greece -4 58.9 60.7
Spain -10 228.9 215.5
France -14 397.9 363.1
Croatia 11 20.6 21.8
Italy -13 310.1 296.3
Cyprus -5 5.6 5.5
Latvia 17 9.0 9.6
Lithuania 15 16.7 18.6
Luxemburg -20 9.7 8.3
Hungary 10 49.3 57.0
Malta 5 1.1 1.1
Netherlands -16 121.8 106.4
Austria -16 54.0 49.6
Poland 14 197.9 204.6
Portugal 1 47.6 49.5
Romania 19 79.1 90.1
Slovenia 4 11.9 12.1
Slovakia 13 25.0 27.3
Finland -16 32.7 29.2
Sweden -17 42.5 37.9
United Kingdom -16 350.0 319.8
EU-28
2816.5 2679.9
Source: Commission Decision 2013/162/EU of 26 March 2013 on determining Member
States’ annual emissions allocation (2013-2020) pursuant to Decision, No. 406/2009/EC
of the European Parliament and of the Council, OJ L 90, 28.3.2013 pp. 106-110

83
Conclusion: The emissions reductions for sectors outside the EU ETS have been
shared out between Member States in a way that reflects their differences in GDP
per capita. Through flexibilities in implementation, an overall cost-effective result
can be maintained.
Controlling non-CO2 greenhouse gases
Non-CO2 greenhouse gases (methane, nitrous oxides and fluorinated gases or F-gases)
made up 27% of the EU's greenhouse gas emissions in 1990 (see Table 4.2)93. By 2010
their share had decreased to around 22%. This reduction is faster than the overall
reduction in greenhouse gas emissions of 15% in the same period. The reduction in
methane and nitrous oxides emissions is particularly pronounced but is partially
compensated by a sharp increase in the use of F-gases (i.e. HFCs, but also PFCs and
SF6). These reductions have been brought about as a secondary benefit from several
pieces of environmental legislation.
Table 4.2 Development of non-CO2 emissions in relation to CO2 emissions in the
EU
1990 1995 2000 2005 2010 2012
CO2 without
LULUCF
4437 4149 4136 4262 3908 3401
CH4 (Methane) 607 552 501 449 413 403
N20 (Nitrous
Oxide)
533 474 417 402 350 341
HFCs 28 41 47 62 82 86
PFCs 21 14 10 6 3 3
SF6 11 16 11 7 6 6
Sum without
LULUCF
5626 5253 5122 5178 4751 4544
Sources: Annual European Union greenhouse gas inventory 1990-2010 and inventory
report 2012; technical report No. 3/2012. European Environment Agency, Copenhagen
The reduction in methane emissions is partially related to developments in the
agricultural sector. For example, quotas for milk production existed until recently under
EU agriculture policy. These quotas combined with productivity gains limited
emissions. As part of the reform of the EU's Common Agricultural Policy (CAP) a ban
on stubble burning was agreed in order to maintain soil organic matter.94
This ban may
93
See: Annual European Union greenhouse gas inventory 1990–2010 and inventory report 2012;
Technical report No 3/2012. European Environment Agency, Copenhagen. 94
Regulation No 1306/2013 OF THE EUROPEAN PARLIAMENT AND OF THE COUNCIL of 17
December 2013 on the financing, management and monitoring of the common agricultural policy and
repealing Council Regulations (EEC) No 352/78, (EC) No 165/94, (EC) No 2799/98, (EC) No 814/2000,
(EC) No 1290/2005 and (EC) No 485/2008 Annex II. Rules on cross compliance to Article 93, OJ, L
347/602/603, 20.12.2013.
84
reduce methane emissions from agriculture by 0.5% in 2030 (up to some 1 Million
tonnes of CO2-equivalent (MtCO2eq) per year).
Methane emissions from the waste sector fell by 35% between 1990 and 2010, mainly
as a result of the EU Landfill Directive95
. The Directive requires biodegradable waste to
be diverted from landfills to reduce the volume of biodegradable waste that is landfilled
by 65% in 2018. Several Member States, such as Austria, Belgium, Denmark, Germany
and the Netherlands, have even banned the landfilling of biodegradable waste. The
EU’s forthcoming policy initiatives on resource efficiency and the “circular economy”
are expected to further reduce methane emissions.
The European Commission carried out a comprehensive review of the EU’s existing air
quality policy between 2011-2013, which has already had significant benefits on
reducing greenhouse gas emissions. In December 2013, A “Clean Air Programme for
Europe” was tabled96
with new air quality objectives for the period up to 2030, with
stricter national emission ceilings for six main pollutants, including methane. Methane
emissions not only act as a greenhouse gas but also increase ground level ozone
(summer smog) in the EU. The methane ceilings of the Clean Air Programme are based
on measures that are expected to be implemented at low cost97
. Costs can even be
negative if the revenues from the methane captured (for example, from anaerobic
digestion) are higher than the costs of distributing and using the gas. The national
ceilings are Member State specific. The proposal would require reductions in methane
between 7% and 55% in 2030 compared to 2005. For the EU as whole a reduction of
33% is proposed for 2030 but targets are also proposed for individual Member States.
As of June 2016 the proposal was still being negotiated with EU Member States and the
European Parliament.
The EU Nitrates Directive98
has reduced animal manure spreading and mineral fertilizer
use over time. Indirectly, this has reduced emissions of nitrous oxide (N2O) from
agriculture. The emissions of nitrous oxide from the production of nitric acid, adipic
acid and glyoxal and glyoxal acid are also regulated by the inclusion of these sectors in
the EU-ETS as of 2013.
Fluorinated gases, or F-gases as they are often known, are very powerful greenhouse
gases. Their potential warming effect on the atmosphere can be up to 23,000 times
95
Council Directive 1999/31/EC of 26 April 1999 on the landfill of waste; OJ L 182, 16.7.1999, p. 1–19:
http://eur-lex.europa.eu/legal-content/EN/TXT/PDF/?uri=CELEX:31999L0031&from=en 96
For all documents related to the Clean Air Policy Package see:
http://ec.europa.eu/environment/air/clean_air_policy.htm 97
Proposal for a Directive of the European Parliament and of the Council on the reduction of national
emissions of certain atmospheric pollutants and amending Directive 2003/35/EC, COM/2013/920 final of
18/12/2013; http://eur-lex.europa.eu/resource.html?uri=cellar:5fbb1091-77a9-11e3-b889-
01aa75ed71a1.0021.04/DOC_1&format=PDF
Annexes of Proposal available at: http://eur-lex.europa.eu/resource.html?uri=cellar:5fbb1091-77a9-11e3-
b889-01aa75ed71a1.0021.04/DOC_2&format=PDF 98
Council Directive of 12 December 1991 concerning the protection of waters against pollution caused
by nitrates from agricultural sources; OJ L 375, 31.12.1991, p. 1–8: http://eur-lex.europa.eu/legal-
content/EN/TXT/PDF/?uri=CELEX:31991L0676&from=fr
85
higher than carbon dioxide. These gases are used for example in refrigerators, air
conditioning, foams, heat pumps, as aerosols or in fire protection. The EU has banned
certain uses of hydro fluorocarbons (HFCs) and other fluorinated greenhouse gases. It
has put in place strict rules to prevent leakage from products and to ensure appropriate
treatment at the end of their life99
.. These measures were taken in response to the sharp
increase in the use of HFCs as the main alternative for ozone depleting substances that
were no longer allowed under the Montreal Protocol. One of the paradoxes of the
Montreal Protocol was that substances, such as HFCs, solved the problem of protecting
the ozone layer but had the unintentional side effect of being very potent greenhouse
gases.
The EU Mobile Air Conditioning (MAC) Directive100
requires that all new passenger
cars sold from 1 January 2011 have to use cooling agents with a greenhouse warming
potential of less than 150 times that of CO2. From 2018, all new passenger cars have to
use more climate friendly refrigerants in their air conditioning systems. The EU
Directive on proper handling of end-of-life vehicles101
has required the collection and
proper disposal of scrapped mobile air conditioners.
Perfluorocarbons (PFCs) released from primary aluminium production are covered by
the EU ETS Directive (from 2013 onwards). The small number of producers in the
semiconductor industry that emit PFCs made a Voluntary Agreement to reduce their
PFC emissions by 10% in 2010 compared to 1995, and in fact the industry achieved a
41% absolute reduction in this period102
.
With the help of all the above measures, F-gases have ceased to increase further but
have stabilized at levels of 110 to 120 MtCO2eq. This is still, however, a level
inconsistent with a 40% greenhouse gas reduction foreseen for 2030. In 2014, therefore,
a new F-gas Regulation103
was adopted to phase-down the total amount of HFCs that
can be sold in the EU from 2015 to one fifth of today's sales by 2030. This is expected
to cut emissions by around 70 MtCO2eq in 2030 at marginal costs per tonne roughly
equal to the overall marginal costs needed to reduce the EU´s greenhouse gas emissions
by 40% in 2030. By 2030 the Regulation is expected to reduce the EU's F-gas emissions
by two thirds compared to today's levels (see Figure 4.2).
99
Regulation (EC) No 842/2006 of the European Parliament and of the Council of 17 May 2006 on
certain fluorinated greenhouse gases; OJ L 161, 14.6.2006, p. 1–11: http://eur-lex.europa.eu/legal-
content/EN/TXT/PDF/?uri=CELEX:32006R0842&from=EN 100
Directive 2006/40/EC of the European Parliament and of the Council of 17 May 2006 relating to
emissions from air-conditioning systems in motor vehicles and amending Council Directive 70/156/EEC;
OJ L 161, 14.6.2006, p. 12–18. http://eur-lex.europa.eu/legal-
content/EN/TXT/PDF/?uri=CELEX:32006L0040&from=EN 101
Directive 2000/53/EC of the European Parliament and of the Council of 18 September 2000 on end-of
life vehicles; OJ L 269, 21.10.2000, p. 34–43. http://eur-lex.europa.eu/resource.html?uri=cellar:02fa83cf-
bf28-4afc-8f9f-eb201bd61813.0005.02/DOC_1&format=PDF 102
http://www.eeca.eu/esia/public-policy/sustainability-esh/pfc-gases 103
Regulation (EU) No 517/2014 of the European Parliament and of the Council of 16 April 2014 on
fluorinated greenhouse gases and repealing Regulation (EC) No 842/2006; OJ L 150, 20.5.2014, p. 195–
230: http://eur-lex.europa.eu/legal-content/EN/TXT/PDF/?uri=CELEX:32014R0517&from=EN
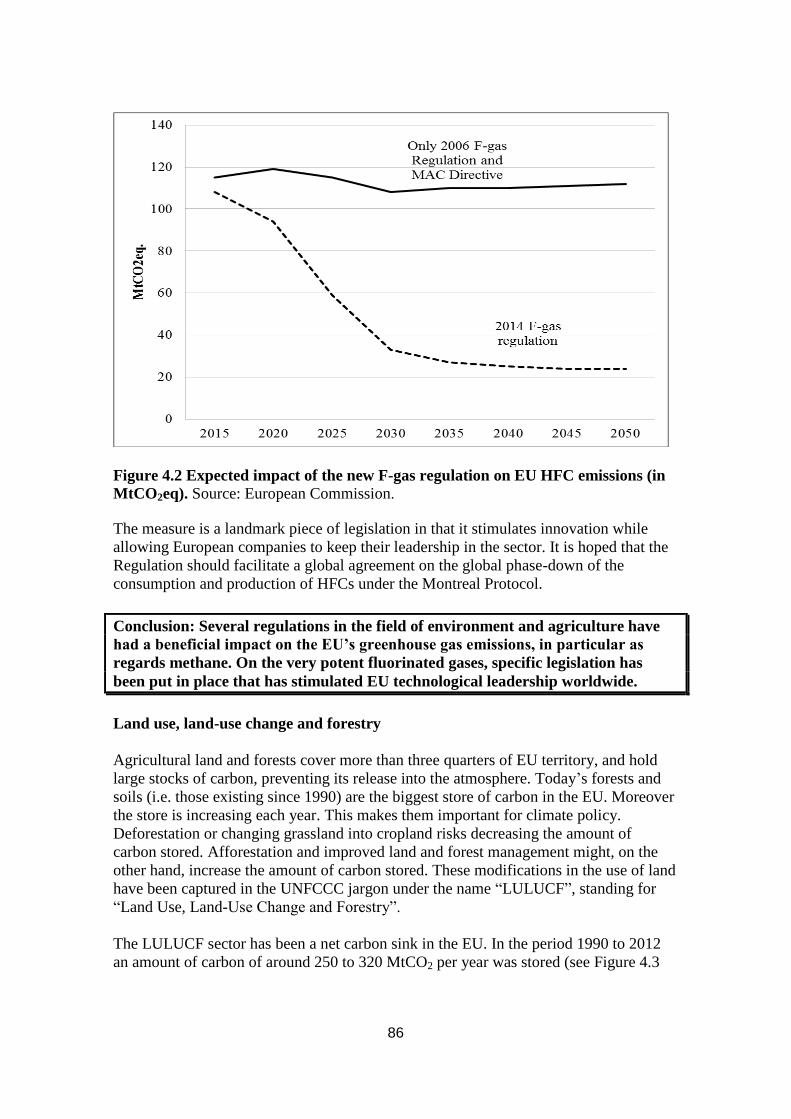
86
Figure 4.2 Expected impact of the new F-gas regulation on EU HFC emissions (in
MtCO2eq). Source: European Commission.
The measure is a landmark piece of legislation in that it stimulates innovation while
allowing European companies to keep their leadership in the sector. It is hoped that the
Regulation should facilitate a global agreement on the global phase-down of the
consumption and production of HFCs under the Montreal Protocol.
Conclusion: Several regulations in the field of environment and agriculture have
had a beneficial impact on the EU’s greenhouse gas emissions, in particular as
regards methane. On the very potent fluorinated gases, specific legislation has
been put in place that has stimulated EU technological leadership worldwide.
Land use, land-use change and forestry
Agricultural land and forests cover more than three quarters of EU territory, and hold
large stocks of carbon, preventing its release into the atmosphere. Today’s forests and
soils (i.e. those existing since 1990) are the biggest store of carbon in the EU. Moreover
the store is increasing each year. This makes them important for climate policy.
Deforestation or changing grassland into cropland risks decreasing the amount of
carbon stored. Afforestation and improved land and forest management might, on the
other hand, increase the amount of carbon stored. These modifications in the use of land
have been captured in the UNFCCC jargon under the name “LULUCF”, standing for
“Land Use, Land-Use Change and Forestry”.
The LULUCF sector has been a net carbon sink in the EU. In the period 1990 to 2012
an amount of carbon of around 250 to 320 MtCO2 per year was stored (see Figure 4.3
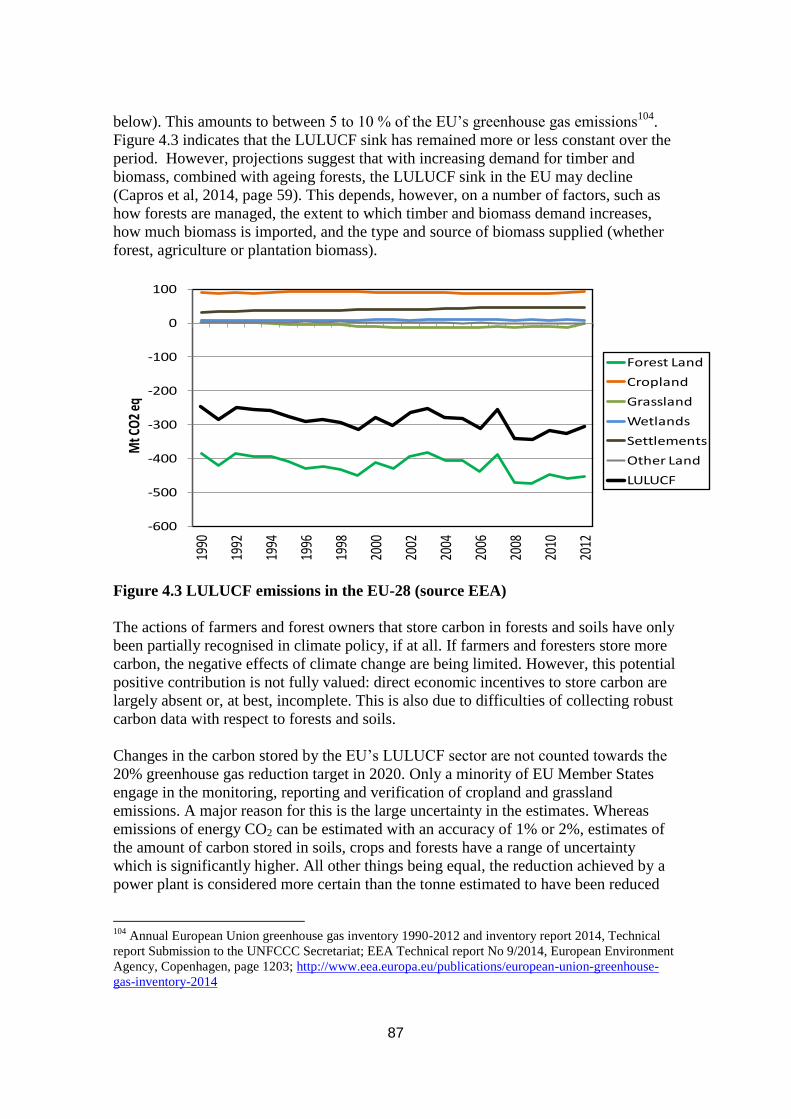
87
below). This amounts to between 5 to 10 % of the EU’s greenhouse gas emissions104
.
Figure 4.3 indicates that the LULUCF sink has remained more or less constant over the
period. However, projections suggest that with increasing demand for timber and
biomass, combined with ageing forests, the LULUCF sink in the EU may decline
(Capros et al, 2014, page 59). This depends, however, on a number of factors, such as
how forests are managed, the extent to which timber and biomass demand increases,
how much biomass is imported, and the type and source of biomass supplied (whether
forest, agriculture or plantation biomass).
Figure 4.3 LULUCF emissions in the EU-28 (source EEA)
The actions of farmers and forest owners that store carbon in forests and soils have only
been partially recognised in climate policy, if at all. If farmers and foresters store more
carbon, the negative effects of climate change are being limited. However, this potential
positive contribution is not fully valued: direct economic incentives to store carbon are
largely absent or, at best, incomplete. This is also due to difficulties of collecting robust
carbon data with respect to forests and soils.
Changes in the carbon stored by the EU’s LULUCF sector are not counted towards the
20% greenhouse gas reduction target in 2020. Only a minority of EU Member States
engage in the monitoring, reporting and verification of cropland and grassland
emissions. A major reason for this is the large uncertainty in the estimates. Whereas
emissions of energy CO2 can be estimated with an accuracy of 1% or 2%, estimates of
the amount of carbon stored in soils, crops and forests have a range of uncertainty
which is significantly higher. All other things being equal, the reduction achieved by a
power plant is considered more certain than the tonne estimated to have been reduced
104
Annual European Union greenhouse gas inventory 1990-2012 and inventory report 2014, Technical
report Submission to the UNFCCC Secretariat; EEA Technical report No 9/2014, European Environment
Agency, Copenhagen, page 1203; http://www.eea.europa.eu/publications/european-union-greenhouse-
gas-inventory-2014
-600
-500
-400
-300
-200
-100
0
100
1990
1992
1994
1996
1998
2000
2002
2004
2006
2008
2010
2012
Mt C
O2
eq
Forest Land
Cropland
Grassland
Wetlands
Settlements
Other Land
LULUCF

88
by the forest. The amount stored in the forest is also influenced by sun, wind, fires and
rain. Also the co-benefits of mitigation measures are not easily comparable: air quality
benefits due to a more efficient power plant may be easier to estimate than the benefits
of improved biodiversity or water management of forest conservation.
Although LULUCF emissions were therefore excluded from the EU's internal 20%
greenhouse gas reduction target in 2020, their measurement, and to a certain degree
their contribution, has become part of the EU's Kyoto Protocol obligations, with
mandatory accounting for forestry (afforestation, deforestation and forest management)
but voluntary inclusion of grassland and cropland management. In addition, LULUCF
emissions are affected by the way the 20% greenhouse gases are reduced in the EU. If
this reduction would rely, for example, on a large increase in the use of biomass in the
energy sector, this could lead to a reduction in the amount of carbon stored in the forest.
Projections available at the end of 2013 indicate that the LULUCF sink for the 28 EU
Member States might decrease (perhaps by some 10%) by 2030 compared to 2005
(Capros et al, 2014, page 59-63). This is a result of an expected increase in the demand
for timber, including demand for biomass for energy. One should note, however, that
there are many modelling uncertainties that qualify such estimates.
In order to reduce the uncertainties in the data and to improve the scope of the sources
covered, the EU adopted in 2013 a decision on accounting rules on greenhouse gas
emissions and removals related to LULUCF105
.These accounting rules are consistent
with agreements made during the UNFCCC negotiations on the second commitment
period of the Kyoto Protocol106
. Furthermore, Member States are now obliged to adopt
action plans that provide information on LULUCF actions to limit or reduce emissions
and to maintain or increase removals of carbon. However, the sector still does not have
a specific greenhouse gas target under EU regulations.
For the period 2013 to 2020, all Member States have to account for emissions and
removals from afforestation, reforestation, deforestation and forest management. The
same applies for producing emissions estimates from cropland and grazing land
management, for which annual accounting also becomes mandatory as of 2021. Re-
vegetation and wetlands are accounted for on a voluntary basis following specific rules.
The accounting shall include the following carbon stocks: above and below ground
biomass, litter, dead wood, soil organic carbon and harvested wood products. Notably,
the amount of carbon stored in wood products (sawn wood, wood panels and paper) has
also to be taken into account. This is in view of the fact that the carbon is not released
immediately into the atmosphere, but is stored in products such as furniture and
building structures for a certain period.
105
Decision No 529/2013/EU of the European Parliament and of the Council of 21 May 2013 on
accounting rules on greenhouse gas emissions and removals resulting from activities relating to land use,
land-use change and forestry and on information concerning actions relating to those activities; OJ L 165,
18.6.2013, p. 80–97. http://eur-lex.europa.eu/legal-
content/EN/TXT/PDF/?uri=CELEX:32013D0529&from=EN 106
Definitions, modalities, rules and guidelines relating to land use, land-use change and forestry
activities under the Kyoto Protocol (FCCC/KP/CMP/2011/10/Add.1), 15 March 2011;
http://unfccc.int/resource/docs/2011/cmp7/eng/10a01.pdf
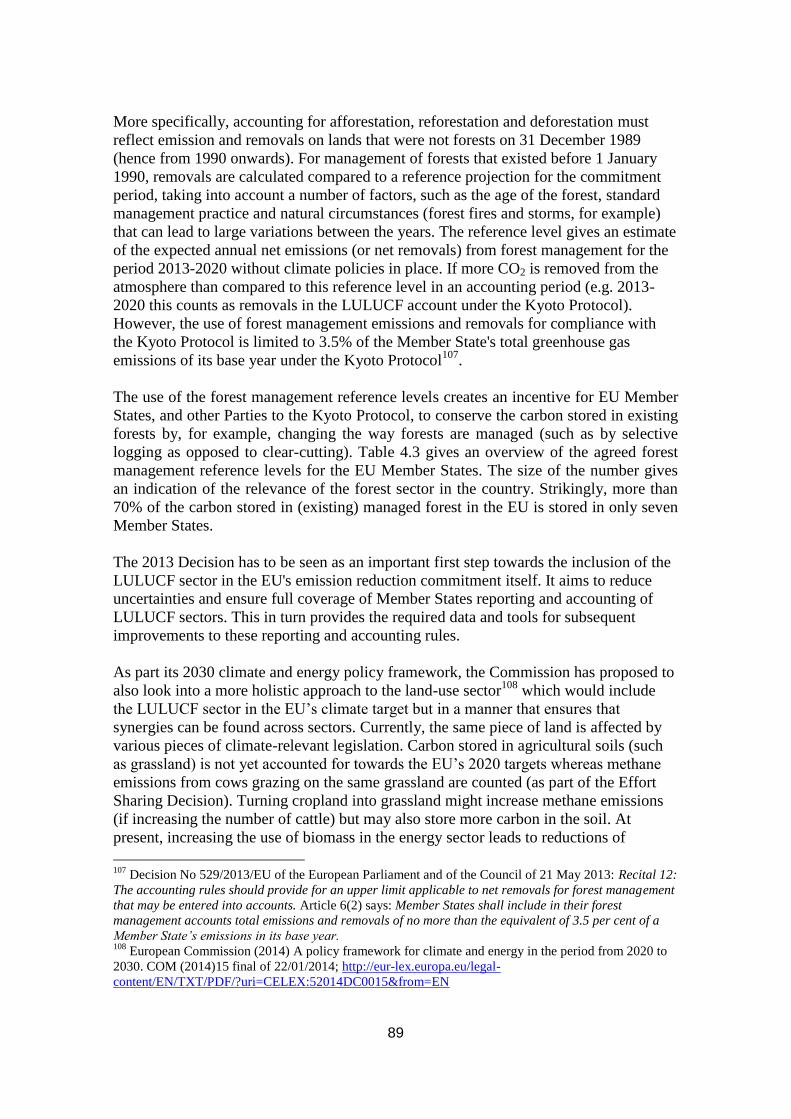
89
More specifically, accounting for afforestation, reforestation and deforestation must
reflect emission and removals on lands that were not forests on 31 December 1989
(hence from 1990 onwards). For management of forests that existed before 1 January
1990, removals are calculated compared to a reference projection for the commitment
period, taking into account a number of factors, such as the age of the forest, standard
management practice and natural circumstances (forest fires and storms, for example)
that can lead to large variations between the years. The reference level gives an estimate
of the expected annual net emissions (or net removals) from forest management for the
period 2013-2020 without climate policies in place. If more CO2 is removed from the
atmosphere than compared to this reference level in an accounting period (e.g. 2013-
2020 this counts as removals in the LULUCF account under the Kyoto Protocol).
However, the use of forest management emissions and removals for compliance with
the Kyoto Protocol is limited to 3.5% of the Member State's total greenhouse gas
emissions of its base year under the Kyoto Protocol107
.
The use of the forest management reference levels creates an incentive for EU Member
States, and other Parties to the Kyoto Protocol, to conserve the carbon stored in existing
forests by, for example, changing the way forests are managed (such as by selective
logging as opposed to clear-cutting). Table 4.3 gives an overview of the agreed forest
management reference levels for the EU Member States. The size of the number gives
an indication of the relevance of the forest sector in the country. Strikingly, more than
70% of the carbon stored in (existing) managed forest in the EU is stored in only seven
Member States.
The 2013 Decision has to be seen as an important first step towards the inclusion of the
LULUCF sector in the EU's emission reduction commitment itself. It aims to reduce
uncertainties and ensure full coverage of Member States reporting and accounting of
LULUCF sectors. This in turn provides the required data and tools for subsequent
improvements to these reporting and accounting rules.
As part its 2030 climate and energy policy framework, the Commission has proposed to
also look into a more holistic approach to the land-use sector108
which would include
the LULUCF sector in the EU’s climate target but in a manner that ensures that
synergies can be found across sectors. Currently, the same piece of land is affected by
various pieces of climate-relevant legislation. Carbon stored in agricultural soils (such
as grassland) is not yet accounted for towards the EU’s 2020 targets whereas methane
emissions from cows grazing on the same grassland are counted (as part of the Effort
Sharing Decision). Turning cropland into grassland might increase methane emissions
(if increasing the number of cattle) but may also store more carbon in the soil. At
present, increasing the use of biomass in the energy sector leads to reductions of
107
Decision No 529/2013/EU of the European Parliament and of the Council of 21 May 2013: Recital 12:
The accounting rules should provide for an upper limit applicable to net removals for forest management
that may be entered into accounts. Article 6(2) says: Member States shall include in their forest
management accounts total emissions and removals of no more than the equivalent of 3.5 per cent of a
Member State’s emissions in its base year. 108
European Commission (2014) A policy framework for climate and energy in the period from 2020 to
2030. COM (2014)15 final of 22/01/2014; http://eur-lex.europa.eu/legal-
content/EN/TXT/PDF/?uri=CELEX:52014DC0015&from=EN
90
emissions under the ETS or Effort Sharing Decision while there may be no incentive to
avoid increased emissions or reduced absorption under the LULUCF sector. Therefore
the inclusion of LULUCF into the EU should ensure for more coherent approach across
sectors to reduce emissions.
Table 4.3 Forest management reference levels 2013 to 2020 for the EU-28.
Country Kton CO2eq. Country Kton
CO2eq.
Austria -6516 Latvia -16302
Belgium -2 499 Lithuania -4552
Bulgaria -7 950 Luxemburg -418
Cyprus -157 Malta -49
Czech
Republic -4 686 Netherlands -1425
Denmark 409 Poland -27133
Estonia -2741 Portugal -6830
Finland -20466 Romania -15793
France - 67140 Slovakia -1084
Germany - 22148 Slovenia -3171
Greece - 1830 Spain - 23100
Hungary 4.3 Sweden -41336
Ireland - 142 United
Kingdom -8268
Italy -22166 Croatia -6289
EU-28
-313025
Source: For EU-27: Annex II to Decision No 529/2013/EU, and for Croatia: Appendix to
FCCC/KP/CMP/2011/10/Add.1. Note: Most Member States take account of the carbon stored
in harvest wood products except Croatia, Greece, Luxembourg and Malta.
For those reasons the EU’s Heads of State and Government decided in October 2014 to
include agriculture and forestry into the overall target of “at least 40%” reduction by
2030. Such an approach could, for example, build on the existing Effort Sharing
Decision governing the non-EU ETS sectors (by including LULUCF), or could
construct an explicit separate (third) land-use pillar (in addition to the EU ETS and the
Effort Sharing Decision sectors), or a combination of both. Clearly, the promotion of
cost-efficiency and environmental integrity has to be at the forefront of these
considerations. Further analysis is needed to assess the mitigation potential and the most
appropriate policy approach.
91
Conclusion: Carbon emissions from land use, land-use change and forestry are not
covered by the EU’s 2020 targets, but complete emission inventories are being
established. It has been decided that these sinks are to be an integral part of the
climate and energy framework for 2030, but the modalities are still being
elaborated.
Adaptation and the mainstreaming of climate action
Another EU policy area that frames national and domestic policies concerns the field of
adaptation to climate change. In comparison to mitigation, the EU was late in
formulating its own adaptation policy. However in 2013 the Commission presented a
comprehensive strategy on adaptation109
in order to make Europe more climate-resilient.
Extreme weather events have indeed been intensifying over the last decades, whether it
is increased flooding, heat waves, or water restrictions. Climate change manifests itself
at the local level, and hence the EU policy has basically been about encouraging
Member States to develop their own climate adaptation plans.
The impacts of climate change are very diverse across the EU. In mountainous regions,
such as the Alps or the Pyrenees, glaciers are melting at a much faster pace; many have
already entirely disappeared. In the North there is the Arctic region, where the changes
are probably the most pronounced as the permanent ice retreats much faster. The Arctic
region is undergoing profound natural changes leading also to increased geopolitical
attention, ranging from the exploration of underground resources that were not
previously accessible to the opening of new navigation routes. The Mediterranean area
is confronted with increased water stress, and desertification in some areas. The North
West of Europe needs to prepare for a higher sea level, as many areas, big cities and
major industrial zones are close to the sea and situated in low-lying areas.
The EU Adaptation strategy encourages Member States to develop their adaptation
plans with their neighbours, in particular in view of undertaking transboundary action.
Special focus is put on urban areas, which are often ill equipped, and a stream of action
has been developed as part of the successful Covenant of the Mayors initiative. Another
major focus of attention is making infrastructure in the field of transport, energy and
construction more climate-resilient. European standardisation bodies are involved in
this work. A third work-stream is to engage with insurance providers to urge the
creation of insurance products that offer increased protection to consumers against the
effects of climate change.
At EU-level two specific actions have been developed, one on finance and one on
knowledge-sharing. The EU Adaptation strategy recognizes that improved access to
funding will be critical in building a climate-resilient Europe. A third of the EU budget
is spent on regional aid through the so-called Structural and Investment Funds.
Adaptation, along with mitigation, is being mainstreamed into regional policies, and
109
European Commission (2013) An EU Strategy on adaptation to climate change”, COM(2013)216 final
dated 16.4.2013; http://eur-lex.europa.eu/legal-content/EN/TXT/PDF/?uri=CELEX:52013DC0216&from=EN
92
into other areas of EU spending, such that a political commitment has been agreed to
spend at least 20% of the EU budget on actions that have a direct and indirect link to
climate change110
. Furthermore, a tracking system for EU budget expenditure has been
put in place to guarantee this objective is met. This is particularly important as these
funds flow predominantly to those Member States and regions that are less wealthy than
the EU average. Through the EU’s budgetary spending, there is clear evidence of
solidarity and the wish for fairness in the field of climate action.
The EU is also investing in knowledge-sharing and best practice. Adaptation to climate
change manifests itself in unique ways at the local level, but experiences can
nevertheless be very similar. In particular in developing adaptation policies a wealth of
success stories exist at the local level. Therefore a web-based European platform has
been created called “Climate-ADAPT” (see: http://climate-adapt.eea.europa.eu/), which
is designed to help Europe adapt to climate change by the sharing of information and
best-practice. This has effectively become a one-stop-shop for adaptation information in
Europe. Furthermore, in order to encourage adaptation policy experimentation, grants of
limited size are available through a dedicated climate change sub-programme of the
LIFE fund within the EU budget.
Conclusion: The EU has developed an adaptation strategy that encourages and
assists Member States in developing adaptation plans and policies. At EU-level, the
mainstreaming of adaptation and mitigation is reflected through a commitment to
spend at least 20% of EU funds on climate-related expenditure through to 2020.
Cooperation exists with the Covenant of the Mayors’ initiative and information
sharing happens through the Climate-ADAPT web-based platform.
References
Capros., P. Matzos L., Parousos L., Tasios N., Klaassen G. and van Ierland T. (2011)
‘Analysis of the EU policy package on climate change and renewables’ Energy Policy
39: 476-1485.
Capros, P., de Vita A., Tasios N., Papadopoulos D., Siskos P., Apostolaki E., Zampara
M, Paroussos L., Fragiadakis K., Kouvaritakis N., Hoglund-Isaksson L., Winiwarter
W., Purohit P., Böttcher H., Frank S., Havlik P., Gusti M. and Witzke H.P.. (2014) EU
energy, transport and GHG emissions: trends to 2050, reference scenario 2013,
Luxembourg: Publications office of the European Union.
(http://ec.europa.eu/clima/policies/2030/models/eu_trends_2050_en.pdf
110
European Council Conclusions (EUCO 37/13) of 8 February 2013, Paragraph 10: “The optimal
achievement of objectives in some policy areas depends on the mainstreaming of priorities such as
environmental protection into a range of instruments in other policy areas. Climate action objectives will
represent at least 20% of EU spending in the period 2014-2020 and therefore be reflected in the
appropriate instruments to ensure that they contribute to strengthen energy security, building a low-
carbon, resource efficient and climate resilient economy that will enhance Europe's competitiveness and
create more and greener jobs.” (Document consulted on 10 April 2015:
http://www.consilium.europa.eu/uedocs/cms_data/docs/pressdata/en/ec/135344.pdf

93
Delbeke, J. (2006)(ed.) EU Environmental Law: The EU Greenhouse Gas Emissions
Trading Scheme, 1, pp. 1-13. Claeys & Casteels, Leuven.
Delbeke, J., Klaassen G., van Ierland T. and Zapfel P. (2010)’The Role of
Environmental Economics in Recent Policy Making at the European Commission’
Review of Environmental Economics and Policy 4:24-43.
Tol, R. (2009)’Intra-union flexibility of non-ETS emission reduction obligations in the
European Union’ Energy Policy 37:1745–1752.

94
5 The EU and International Climate Change Policy
Jacob Werksman, Jürgen Lefevere and Artur Runge-Metzger
Introduction
Since the 1990s, the EU has played a leading role in the development of international
climate change policy. International climate change policy has, over the past twenty
years, shaped the EU's domestic climate change policy. This dynamic of leadership and
learning reflects the EU's strong commitment to a multilateral response to climate
change. It also reflects the EU's understanding that it cannot successfully combat
climate change on its own. It is therefore necessary to encourage others and build
partnerships with other countries. Ambitious European climate policy will increasingly
depend upon the rest of the world acting collectively, and with comparable ambition, to
reduce greenhouse gas emissions.
This chapter describes the stages in the development of international climate change
policy, from the 1992 United Nations Framework Convention on Climate Change
(UNFCCC), via the 1997 Kyoto Protocol, to the current negotiations on a new
agreement to be reached in Paris in 2015 (2015 Agreement). Throughout these
negotiations, the EU has, together with other progressive countries, called for
international agreements that are: (i) ambitious and inclusive, by ensuring that all
countries play a role in reducing greenhouse gas emissions in line with what science
indicates is necessary; (ii) fair, by taking into account the common but different
responsibilities, capabilities and vulnerabilities of countries at different levels of
economic development; and (iii) robust, by providing a strong legal basis for holding all
countries accountable for the commitments that they make.
As will be described, the international community has not yet been able to reach an
agreement that is sufficiently ambitious and inclusive, fair, and robust to have the
potential to reduce global emissions to levels scientists would consider safe. But
international climate policy, like EU climate policy, has made important, incremental
progress, and two decades of experience has yielded critical lessons for future action.
As the negotiations proceed towards the 2015 Agreement, which will determine
international climate policy from 2020 onwards, the EU is working with its partners to
ensure these lessons are applied.
The 2015 Agreement will need to take into account major structural changes in the
global economy since 1992, by covering emissions from all major economies. It will,
however, need to be sensitive to the fact that many countries are beginning to regulate
greenhouse gases for the first time. Thus, the 2015 Agreement will need to allow for a
wide diversity of commitments that reflect significant differences in countries' starting
points. This diversity will need to be brought together under a common framework of
rules for reporting on emissions that will enable governments and the public to track
performance over time.

95
While designing the 2015 Agreement, it must be recognised that there are limits to the
role that a multilateral agreement – involving more than 190 countries – can play in
setting common standards for specific national and regional policies, such as the use of
carbon markets. In that respect it will be different from the Kyoto Protocol, which was
created at a time when there were no national or regional carbon markets and climate
policies generally were only in their infancy. Meeting the Protocol’s targets gave the
initial impetus for the EU’s carbon market, but the Protocol has since failed to keep up
with the learning and further development of domestic and regional markets. The 2015
Agreement will need to enable the further development of national and regional climate
policies, while at the same time encourage their ambition, effectiveness and
transparency.
The 2015 Agreement cannot focus on cutting emissions alone. It will need to respond
to the needs of the poorest countries, which will continue to require financial and
technical support to transition towards a low-carbon future. Countries vulnerable to the
impacts of climate change will need support in building resilience to higher
temperatures, rising seas and extremes in weather. Finally, the outcome in Paris will
need to acknowledge that legally binding agreements between governments can only
provide part of the solution. In order to transform a fossil fuel-based economy into a
low-carbon economy, the tens of billions of public sector finance and development
assistance made available by governments will need to leverage trillions in commercial
investments. Governments, of both developed and developing countries, need to learn
how to better recognise and incentivise actions by cities, local authorities and the
private sector.
Conclusion: the international community has not yet been able to reach an
agreement that is sufficiently ambitious and inclusive, fair, and robust to reduce
global emissions to levels scientists would consider safe. The Kyoto Protocol helped
the EU to shape its domestic policies, such as the carbon market. The 2015
Agreement should, in a similar manner, act as a catalyst to the development of
domestic policies in all countries.
A brief history of the UNFCCC
The 1992 UNFCCC is a framework treaty with 195 Parties – a near universal
membership of States. The UNFCCC sets a long-term, science-based objective which
calls for the stabilization of greenhouse gas concentrations in the atmosphere at safe
levels. The Parties have since clarified that this will mean limiting global average
temperature rise to less than 2°C as compared to pre-industrial levels. The UNFCCC
also sets out principles, establishes bodies and procedures to guide future international
negotiations towards this objective.
The UNFCCC has succeeded in ensuring that climate change remains an important
issue near the top of the international policy agenda. Its annual Conferences of the
Parties (COPs) regularly attract the participation of more than 100 ministers, and many
Heads of State. It demands better data and analysis, spurring support for the
development of climate science, both domestically and internationally. Its reporting

96
requirements and capacity-building programmes have ensured that most countries now
regularly collect and report on greenhouse gas emissions from their economies.
The financial and market-based mechanisms established under the UNFCCC have
channelled billions of euros of investment in mitigation and adaptation in developing
countries, through new financial institutions and through market-based mechanisms that
have expanded and tested the boundaries of what is possible through international
cooperation. The EU and its Member States have played a major role in this success, as
world's largest provider of development finance, and the world's largest carbon market.
However, the UNFCCC process has struggled to reach agreement on specific emission
reduction targets that are ambitious and inclusive enough to put the world on track not
to exceed the below -2°C objective. In the early 1990s, when the Framework
Convention on Climate Change was being negotiated, a scientific and political
consensus on the risks of climate change was still emerging. Many actors perceived
efforts to reduce greenhouse gas emissions to be primarily the concern and
responsibility of wealthy industrialized nations. These countries are historically the
largest emitters of greenhouse gases, with the resources to invest in alternative
technologies. Developing countries could only be expected to take action on climate
change if it was consistent with their overriding responsibilities to reduce poverty and
promote economic growth.
In order to achieve the broad political consensus necessary to adopt the Convention,
negotiators recognised that developed and developing countries had "common but
differentiated responsibilities and respective capabilities", a principle that led to the
design of a treaty that divided Parties into "developed" (Annex I) countries (members,
in 1992, of the Organization for Economic Cooperation and Development, Eastern
European countries and the Former Soviet Union); and "developing" country Parties
(the rest of the world).
While all UNFCCC Parties are expected to put in place and report on policies to
mitigate and adapt to climate change, Annex I countries took on an additional, if softly
worded, commitment to aim to stabilize their greenhouse gas emissions at 1990 levels
by the year 2000. The richest of the Annex I countries (OECD members listed in
Annex II) were also required to provide an unspecified level of "new and additional"
financial support to developing countries that chose to take action on climate change.
This division of responsibilities between developed and developing countries, based on
their development status in 1992, often referred to as "the firewall", continues to shape
climate politics.
The UNFCCC, therefore, provided an important first basis for international climate
policy. Among the most important of the Convention's commitments is the collective
procedural obligation to review the adequacy of Parties' commitments to mitigate
greenhouse gas emissions "in light of the best available scientific information" on
climate change and to "take appropriate action" including through the adoption of
additional Protocols or amendments to the Convention. The first major effort at better
aligning Parties' mitigation commitments with the Convention's objective concluded
with the adoption of the Kyoto Protocol in 1997.
97
While the Kyoto Protocol was designed to set the world on a low-carbon pathway by
capping and reducing the emissions of industrialized countries between 2008 and 2012,
it was severely undermined by the decision in 2001 by the United States – then the
world's largest emitter of greenhouse gases – not to ratify the Kyoto Protocol. While the
US has in the past decades developed a reputation for failing to ratify international
treaties that it has helped to design, the US’ fundamental objection to the Kyoto
Protocol was its perpetuation of the UNFCCC “firewall” by setting targets and
timetables exclusively for Annex I (developed country) Parties.
Since then, the international community has struggled with attempts to strengthen and
expand the scope of the Kyoto Protocol, and/or to design an ambitious new agreement
that could secure the meaningful participation of the US, as well as emerging economies
whose emissions have been growing rapidly.
The most recent effort to negotiate a new agreement that would replace the Kyoto
Protocol and engage the US, the rest of the industrialised world and the emerging
economies, failed, at the 2009 Climate Summit in Copenhagen. Instead of delivering a
new, legally binding treaty that many (including the EU) had hoped for, these
negotiations led to the informal Copenhagen Accords, reflected formally a year later in
the Cancun Agreement. An international registry of domestic climate mitigation
policies was set up, whereby each country notifies its pledge unilaterally and without
international discussion or negotiation.
The unilateral, or "bottom-up", nature of the Copenhagen-Cancun pledging process
allowed for a more inclusive international approach. For the first time the US, China,
India, Brazil, South Africa, the EU and many middle- and low-income countries made
pledges at the international level to achieve specific domestic climate policies as part of
this initiative.
However, in addition to being voluntary, a number of the pledges made by major
economies are conditioned, for example on others taking more ambitious action and the
availability of financial resources. Most importantly, current pledges leave a substantial
"ambition gap": even if fully implemented, these pledges would lead to a temperature
rise of 3.5°C instead of the maximum 2°C that is recommended by scientists.
Conclusion: The Kyoto Protocol was signed but not ratified by the US. An attempt
to adopt a similar agreement failed in Copenhagen in 2009. Since then a “bottom-
up” pledging process led to some progress but has not delivered the emission
reductions necessary to respect the below -2°C objective.
A fundamental change in the landscape
The fundamental challenge revealed by these two efforts is how to limit global
emissions of greenhouse gases consistent with the UNFCCC objective while allocating
those limits among countries in a way that is broadly perceived as fair. The science tells
us that the world has to peak its emissions by 2020, reduce by 50% by 2050, and reach
near zero levels by the end of the present century. Using the 1992 division of developed
(Annex I) and developing (non-Annex I) countries, it is possible to map out emissions

98
pathways that would require Annex I reductions in the order of 85% by 2050, beginning
now and delivering a 30% reduction by 2020. In the meantime, non-Annex I emissions
could continue to grow until 2020, and decline thereafter at a similar trajectory as
Annex I countries. (See Figure 5.1)111
.
Figure 5.1 A possible pathway to the below -2°C objective
However, since 1992, the world has not followed this path. As indicated in Figure 5.2
Annex I country emissions have plateaued but do not yet show signs, as a group, of a
steep decline. The most spectacular change is undoubtedly the industrialization and
rising emissions of China which is now by far the largest emitter with more than 12
billion tonnes per year, twice as much as the US and three times as much as the EU.
111
Source: European Commission: adapted from data in http://eur-
lex.europa.eu/resource.html?uri=cellar:7f15e8ba-71b6-402f-a767-
4588f2b41cfa.0001.02/DOC_1&format=PDF. Original data provided by JRC, PBL and IIASA.

99
Figure 5.2 Emissions of major economies, 1990-2012 (all greenhouse gases, all
sources and sinks)(Source: historical emissions data: inventories data to the UNFCCC
(http://unfccc.int/national_reports/), emissions with Land Use, Land-Use Change and
Forestry; for China and India data from EDGAR, all greenhouse gas emissions, all
sources and sinks, excl. forest and peat fires)
Behind this spectacular change, more noteworthy evolutions took place. Chinese per
capita emissions are now higher than the EU’s. And while India is now the world's third
largest emitter of greenhouse gases, persistent poverty has kept its per capita emissions
relatively low (Figure 5.3). Any future international climate change agreement will need
to recalibrate the UNFCCC principle of "common but differentiated responsibilities and
respective capabilities" to align with this new reality, and accelerate the plateauing and
reduction of emissions across all major economies.
Another noteworthy structural change is the emissions intensity of economic
development over the same period. Measured per unit of GDP, emissions have been
going down significantly in all parts of the world, industrialised as well as emerging
economies. Figure 5.4 gives an overview and offers some hope that the trend that was
observed in the EU since 1990, of growing GDP and declining emissions, may become
closer to reality for the world as a whole. The fact that emissions in the world have been
plateauing in 2014 while economic growth was about 3% is another indication that the
world may be soon finding a structural way of declining emissions in absolute terms112
.
112
See IEA: http://www.iea.org/newsroomandevents/news/2015/march/global-energy-related-emissions-
of-carbon-dioxide-stalled-in-2014.html.
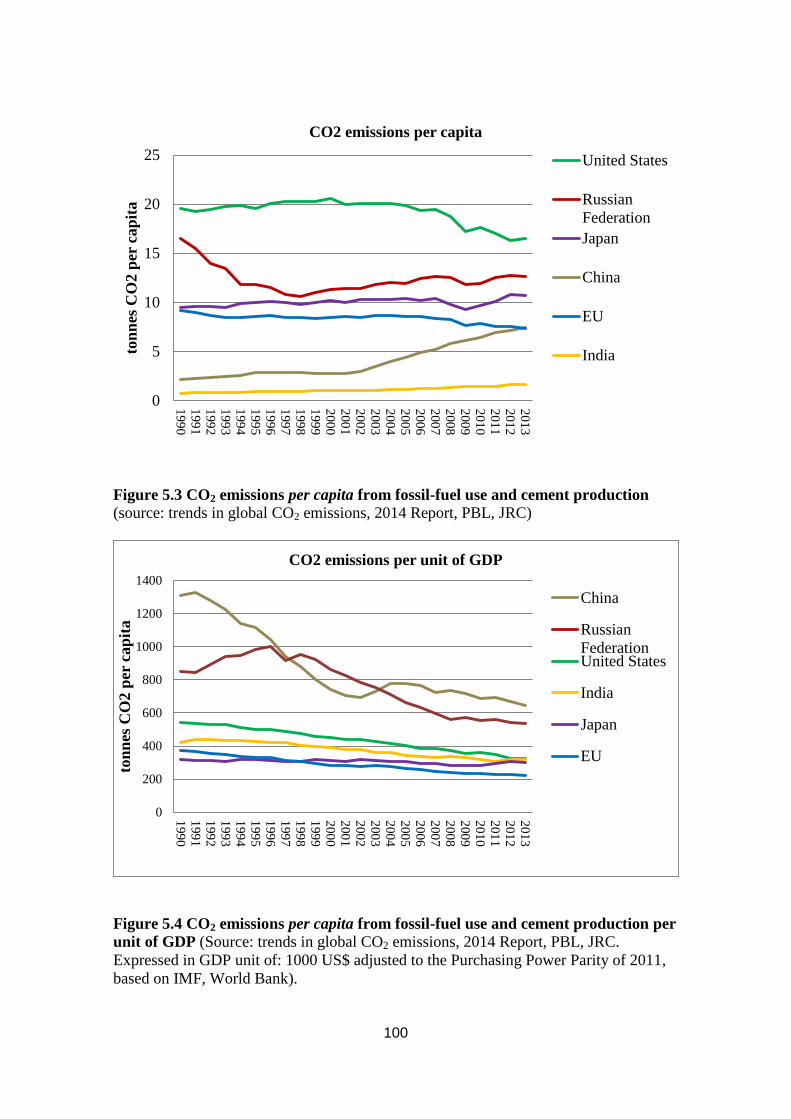
100
Figure 5.3 CO2 emissions per capita from fossil-fuel use and cement production
(source: trends in global CO2 emissions, 2014 Report, PBL, JRC)
Figure 5.4 CO2 emissions per capita from fossil-fuel use and cement production per
unit of GDP (Source: trends in global CO2 emissions, 2014 Report, PBL, JRC.
Expressed in GDP unit of: 1000 US$ adjusted to the Purchasing Power Parity of 2011,
based on IMF, World Bank).
0
5
10
15
20
25
199
01
99
11
99
21
99
31
99
41
99
51
99
61
99
71
99
81
99
92
00
02
00
12
00
22
00
32
00
42
00
52
00
62
00
72
00
82
00
92
01
02
01
12
01
22
01
3
ton
nes
CO
2 p
er c
ap
ita
CO2 emissions per capita
United States
Russian
Federation
Japan
China
EU
India
0
200
400
600
800
1000
1200
1400
199
01
99
11
99
21
99
31
99
41
99
51
99
61
99
71
99
81
99
92
00
02
00
12
00
22
00
32
00
42
00
52
00
62
00
72
00
82
00
92
01
02
01
12
01
22
01
3
ton
nes
CO
2 p
er c
ap
ita
CO2 emissions per unit of GDP
China
Russian
FederationUnited States
India
Japan
EU
101
Conclusion: the world has evolved significantly since 1990. The “firewall” of the
UNFCCC, separating the obligations between developed and developing countries,
no longer corresponds with the economic realities of the world today.
Setting the foundations for a 2015 Agreement
Recognizing the shortcomings of the Copenhagen/Cancun/approach and the failure of
the Kyoto Protocol to attract more Parties, the UNFCCC agreed in 2011 in Durban to
launch negotiations on a new international agreement to be completed by the end of
2015 and to apply from 2020 onwards.
The EU worked closely with progressive allies to agree a "Durban mandate" for these
negotiations that is designed to ensure a result that, unlike the Kyoto Protocol, will be
"applicable to all Parties" and that, unlike the voluntary Copenhagen/Cancun pledges,
will be set out in a Protocol or another form of international agreement "with legal
force".
To help secure this deal, and to reassure developing and emerging countries that
industrialised countries will continue to take a leadership role, the EU agreed to enter
into a second commitment period under the Kyoto Protocol, from 2012 to 2020. All
Parties agreed to make efforts to raise their ambition in that same time period.
Since 2011, the negotiators returned to the challenge of how to set emission reduction
targets, applicable to all Parties, that are both ambitious and fair. It became quickly
apparent that Parties would be unable to agree an approach that set a global emissions
budget for a specific timeframe, or to allocate that budget on the basis of agreed criteria
– in the way, for example, the EU negotiates its effort sharing for emissions outside the
ETS. It also became clear that Parties were unwilling to agree to a single commitment
type, such as the economy-wide emission reduction targets that are part of the Kyoto
Protocol.
In this context Parties began to map out the third model of international climate policy –
a hybrid approach between the "top-down" aspects of the Kyoto Protocol and the
"botto- up" approach of the Cancun/Copenhagen pledges. In Warsaw, in 2013, and in
Lima, in 2014, Parties agreed to come forward in the run up to Paris, with "Intended
Nationally Determined Contributions" (INDCs) that will serve as the basis for their
commitments in the 2015 Agreement.
Parties agreed that each INDC would represent a contribution towards the UNFCCC
objective of limiting dangerous climate change. Each INDC must represent a
progression beyond what a Party has committed to already, in the form of domestic
policy, an international pledge or target. Each Party must communicate its INDC in a
clear and understandable manner, and that explains how that Party considers its
commitment will be fair and ambitious, in the light of its national circumstance and of
the UNFCCC's ultimate objective to stabilize greenhouse gas concentrations at a safe
level. While many countries continue to indicate their reluctance to have their INDCs
scrutinized or negotiated through a multilateral process, the international guidance

102
provided by the Warsaw and Lima decisions creates a "top down" political expectation
of clarity and ambition.
The INDC process has already generated some promising results. In preparation for
Paris, the EU Heads of State and Government announced their INDC in October 2014.
Shortly thereafter, the US and China made a joint announcement setting out the basic
elements of their targets. And there is evidence that many other countries are in the
process of preparing their commitment in advance of Paris. The challenge that remains
is capturing these commitments, and the commitments of as many countries as possible
in a legally binding 2015 Agreement framework that supports their implementation.
Conclusion: a third model of international climate policy seems to be emerging as
a hybrid between the "top down" aspects of the Kyoto Protocol and the "bottom
up" approach of the Copenhagen/Cancun pledges.
An EU vision for the 2015 Agreement
Introduction
The EU believes the 2015 Agreement should take the form of a legally binding Protocol
to the UNFCCC, as this is the best-understood form of "legal instrument" the Parties
can adopt. 113
In essence, the Paris Protocol should:
secure each Party's INDC in the form of a clear, specific, ambitious and fair legally
binding mitigation commitment. Together, these commitments should put the world
on track towards achieving the below -2°C objective. These commitments must be
consistent with the UNFCCC's principles applied in the light of evolving
responsibilities, capabilities and different national circumstances;
ensure dynamism by providing for a global review, to be conducted every five
years, to strengthen the ambition of these mitigation commitments consistent with
the latest science. This review should be guided by a long term goal to reduce global
emissions by at least 60% below 2010 levels by 2050;
strengthen transparency and accountability in order to be able to assess whether
emission reduction targets and related commitments have been met. A common set
113
European Commission (2015) The Paris Protocol – A blueprint for tackling global climate change
beyond 2020. COM(2015)81 final/2 and its Annex 1 of 04/03/2015, and the accompanying Commission
Staff Working Document SWD(2015)17 final of 25/02/2015;
http://ec.europa.eu/clima/policies/international/paris_protocol/docs/com_2015_81_en.pdf and Annex 1 to
the above:
http://ec.europa.eu/clima/policies/international/paris_protocol/docs/com_2015_81_annex_en.pdf
and Accompanying Staff Working Document:
http://ec.europa.eu/clima/policies/international/paris_protocol/docs/swd_2015_17_en.pdf
103
of rules and procedures for annual reporting and regular verification and
international expert reviews of emission inventories needs to be established;
encourage climate-resilient sustainable development by promoting international
cooperation and supporting policies that decrease vulnerability and improve
countries' capacity to adapt to the impacts of climate change; and
promote efficient and effective implementation and cooperation by encouraging
policies that mobilise substantial, transparent and predictable public and private
sector investment in low-emission climate-resilient development.
To join the Agreement, each Party must make a legally binding mitigation commitment.
This will give the clearest signal that Parties will commit themselves to provide:
The strongest expression of a Party's political will to achieve its commitments;
Necessary predictability and certainty for all public and private actors; and
Durability in the context of domestic political changes.
Securing ambitious mitigation commitments
The new Protocol needs to cover, in a comprehensive manner, the bulk of global
emissions, to send a strong signal to the public and to the markets that the world is
serious about phasing-down greenhouse gas emissions over time. The announcements
made by the EU, the US and China, which cover nearly half of global emissions, is a
promising first step.
Each Party's INDC should represent a significant progression in the level of mitigation
ambition and scope compared to its current pledge. It should demonstrate convergence
on low levels of overall emissions and per capita emissions and improvement in
emission intensity over time.
Countries with the highest responsibilities and capabilities need to have the most
ambitious mitigation commitments. Economy-wide absolute targets combined with
emission budgets are the most robust commitment type. They have a number of
advantages including certainty, transparency, flexibility and, if used widely, reduced
risk of carbon leakage. In line with the idea of progression over time, all countries that
already have such targets should maintain and increase these against a historic base year
or reference period. G20 and other high-income countries that do not have absolute
targets under the Protocol from 2020 should commit to doing so by 2025 at the latest.
Other emerging economies and middle-income countries are encouraged to do so as
early as possible and not later than 2030.
Parties' commitments must create strong incentives for all actors to further reduce and
limit global emissions. The Protocol should require emission reductions in all sectors,
including agriculture, forestry and other land uses, international aviation and shipping,
and fluorinated gases. The ICAO, IMO, and the Montreal Protocol should act to
effectively regulate emissions from international aviation and shipping and the
production and consumption of fluorinated gases, respectively, by the end of 2016.

104
Ensuring dynamism through the regular review of targets
The Protocol should set out a process, applicable to all Parties, to regularly review and
strengthen mitigation commitments, consistent with the Protocol's long-term goal. If
Parties' collective efforts fall short of what is necessary, the process should encourage
Parties to raise the level of ambition of existing commitments and formulate sufficiently
ambitious commitments in subsequent target periods.
Starting in 2020, the review should be repeated every five years and facilitate
transparency, clarity and understanding of mitigation commitments in the light of their
contribution to the below 2°C objective. The review should invite Parties to explain
progress on their mitigation commitments and why they think their actions have been
fair and ambitious.
The process should be informed by science, be evidence-based, and be guided by
considerations of evolving responsibilities, capabilities and different national
circumstances. It should be simple, efficient, and avoid duplication of other processes.
The arrangements for the review cycle should be improved over time to stay on track to
achieve the below - 2°C objective.
The Protocol and accompanying decisions by the Conference of the Parties need to
provide for the dynamic mobilisation of climate finance, technology transfer and
capacity building for eligible Parties, particularly those with least capabilities. This will
include processes to regularly assess and improve the adequacy and effectiveness of the
means of implementation mobilised by the UNFCCC. Support for Parties to regularly
review and strengthen their approaches to adaptation over time will also need to be
ensured in Paris.
Strengthening transparency and accountability
The Protocol must set out the key elements of a common transparency and
accountability system, applicable to all Parties. This must include robust rules on
monitoring, reporting, verification and accounting, and a process for holding each Party
accountable for achieving its commitments. This system will be essential to provide
confidence that each Party is implementing its commitments and is on track to meet its
target. It will also be crucial to build trust, encourage ambition, and provide
predictability and legal certainty. As such, Parties should submit, at the latest by the
time of ratification, the most recent set of annual emissions inventories from 2010
covering the period up to 2015.
This system should be fit for the long-term. While it must be sufficiently flexible to
cater for a diverse range of commitment types, national capabilities and circumstances,
this flexibility should not undermine transparency, accountability and ambition.
Independent expert review teams should conduct regular reviews. The new Protocol
should recognise net transfers between those countries that have decided to link their
domestic carbon markets, and this should be taken into account when evaluating
compliance.
Finally, the Protocol should establish a body to facilitate implementation and address
questions that are raised over compliance with regard to the implementation of any

105
Party's commitments. This body should focus on commitments related to mitigation,
including monitoring, reporting, verification and accounting. The body should be expert
and non-political, with its mandate to be specified in the Protocol.
Achieving climate resilience through adaptation
While ambitious mitigation action is essential, it will be equally important to encourage
individual and collaborative actions to prepare for and adapt to the adverse impacts of
climate change. The role of the land-use sector with regard to food security, and other
environmental, social and economic benefits is key to this work. The EU's strategy on
adaptation, complementing Member States' strategies, aims to develop a more climate-
resilient Europe. Ecosystem-based adaptation can reduce flood risk and soil erosion as
well as improve water and air quality.
In the context of achieving climate-resilient sustainable development of all Parties, the
Protocol should reinforce the commitments of all Parties to continue to formulate, plan
and implement measures to facilitate adaptation and to report on these through their
national communications. The Protocol should continue to facilitate assistance to those
regions and countries that are particularly vulnerable to the adverse effects of climate
change, including the provision of financial and technical support and capacity-
building.
In this way the Protocol will provide further visibility for adaptation action and support,
and strengthen the monitoring and reporting provisions under the UNFCCC. It will also
enable greater understanding of the effectiveness of measures carried out to facilitate
adequate adaptation, drawing on national reports and other relevant information in order
to inform further enhanced action to be undertaken by Parties.
Mobilising public and private climate finance
The transformation into low-emission climate-resilient economies will only be achieved
through large-scale shifts in investment patterns. The Protocol should promote
investments in low-emission climate-resilient programmes and policies. All countries
should commit to take steps to improve their enabling of environments for attracting
climate-friendly investments. Countries in a position to do so should mobilise financial
support for eligible Parties to the Protocol. The base of financial support needs to be
broadened over time as capabilities of Parties change. Clarity should also be provided
by all Parties on the climate impact of financial flows that do not fall within the remit of
climate finance.
Public sector climate finance will continue to play an important role in mobilising
resources after 2020. The Protocol should also recognise the importance of the private
sector as a key source to scaling-up climate finance. The Protocol should provide
assurances to the poorest countries and those most vulnerable to climate change that
they will continue to receive priority support.
The Protocol should promote the formulation and implementation of strong enabling
environments for the transformation to low-emission climate-resilient economies
including:
Ambitious national climate policies;
106
Effective governance, including investment frameworks, price incentives and
financing instruments favouring low-emission and climate resilient investments; and
Providing information on how to address climate change.
Carbon pricing and the investment policies of public development banks will play a
central role in this. Mainstreaming climate considerations into all policies, development
strategies and investments is essential to make use of the synergies between
development, mitigation and adaptation financing.
Conclusion: the core of the 2015 Agreement will basically consist of each Party’s
Intended Nationally Determined Contributions; a process on how to review and
adopt new contributions in the future; and, arrangements related to transparency
and accountability. Climate finance will be important to facilitate the
transformation towards a low-carbon economy.
Conclusions
The UNFCCC process has been too slow in delivering the outcomes and impacts
necessary to put the world on a path towards a stable climate system. But two decades
of trying has laid a solid foundation for the essential next step in the formulation of
international climate policy – the preparation of ambitious domestic legislation and
regulation by the world's largest economies, and the willingness of these countries to
hold themselves regularly accountable for the implementation of these policies.
Early indications are that this process of policy formulation, stimulated by consistent
demands that all countries demonstrate how they are contributing to this collective
challenge, is indeed taking place in all major economies. This seems in part to have
resulted from a much deeper and widely-shared understanding of climate science, and
of how most countries will suffer from the impacts of climate change. Governments,
businesses and civil society across countries in diverse circumstances are sharing an
appreciation of the co-benefits – from improvements in local air quality, to greater
energy independence – that can be generated by more ambitious climate policy. And
there seems to be a growing awareness that first-movers on low-carbon policies and
technologies are likely to emerge more competitive in tomorrow's markets.
Twenty years of experimentation in policymaking and institution-building under the
UNFCCC has also built a better appreciation of what functions the next generation of
the international climate regime can and should perform. As countries adopt more
ambitious climate policies they will be increasingly concerned that their trading partners
follow suit. Only a successive strengthening of national and regional policies will
deliver the emission reductions required by science. These policies will undoubtedly
have some trade effects, at least in the short-term. The UNFCCC, however, must
generate comparable policy efforts by all countries with significant emissions if trade
tensions are to be avoided in the future.
It is, therefore, also of capital importance that an international climate regime provides a
high level of transparency, comparability and accountability so as to reassure economic

107
competitors across multiple sectors that they are competing on a level playing field.
Similarly, as more countries opt to create and possibly link markets in carbon
allowances, they will appreciate some basic rules being agreed in an international
climate regime to promote fungibility and liquidity as well as help prevent fraud and
double-counting.
Finally, the future international climate regime will need to continue to provide a forum
that regularly brings together evolving climate science with political leadership at the
highest possible level. The third way that is now on the table for Paris may also serve as
a good example for addressing future global challenges in a multilateral context. What
seems to be required is excellent science, political leadership as well as a solid re-
assurance that all countries contribute to the solution of the problem in a fair and
balanced manner, basically building further on their domestically formulated policies.
Conclusion: the essential next step to be taken after a successful 2015 Agreement
in Paris would be for the world’s largest economies to develop domestic policies
consistent with their commitments, and for them to be prepared to be held
regularly accountable for the effective implementation of these policies.

108
6 Outlook
Jos Delbeke and Peter Vis
Policymaking backdrop
Climate policy in the EU started in the 1990s with its active involvement in the relevant
international processes, such as the IPCC, the Intergovernmental Panel on Climate
Change, and the UNFCCC, the United Nations Framework Convention on Climate
Change.
Much effort was invested by the IPCC in establishing a consensus amongst almost all
climate scientists in the world on what we know, and do not know, about climate change.
With the finalisation of the Fifth Assessment Report in 2014, a further and substantial
piece of convincing evidence has been provided. Climate change is happening in a way
that is unprecedented over decades, centuries, and millennia. What is proven as well is
that this is happening as a result of human influences, in particular since the industrial
revolution of the 18th
century. Since then, the world’s use of fossil fuels – the major
contributor to climate change – has kept increasing to today’s levels. Scientists tell us
that, if we want to avoid dangerous impacts of climate change, we should not allow the
average global temperature to rise beyond 2°C compared to pre-industrial levels. That
implies that the world as a whole should be peaking its emissions by no later than 2020,
and then halve its emissions by 2050.
The other major piece of international governance in which the EU has invested
considerable effort is the UNFCCC process. The Framework Convention on Climate
Change was adopted in 1992 at the UN Summit on Sustainable Development in Rio de
Janeiro. The first major operational decisions were made through the agreement of the
Kyoto Protocol in 1997. That Protocol, reflecting the Annexes to the Convention, divided
the obligations of Parties between quantitative emission limitation or reduction
commitments for developed countries, on the one hand, and the rest of the world on the
other, without binding quantitative commitments. What seemed logical in the 1990s,
however, has become increasingly less so as many of these developing countries
transformed into emerging economies with higher annual emissions than many developed
countries. The economic and industrial rise of China since the year 2000 is one of the
most striking elements in this respect.
This sharp division between developed and developing nations undermined the
effectiveness of the Kyoto Protocol, and remains the Achilles heel of the multilateral
approach to climate change. The US did not ratify the Kyoto Protocol as a result, Canada
shunned its obligations, and Australia and Japan are unwilling to take on a second
commitment through to 2020. Only the EU, together with Norway, Iceland and
Switzerland, delivered on their obligations and assumed new ones until 2020. However,
climate change cannot be halted if only some 12% of global emissions are covered by
emission reduction commitments. The challenge for the upcoming Paris Climate Change
Conference in December of 2015 is to find a new way of involving all countries in

109
undertaking action, albeit in a differentiated manner, consistent with what science tells us
is necessary.
Fairness and cost-effectiveness
The EU has useful experience when it comes to differentiation of efforts to reduce
greenhouse gas emissions. The EU is seen as a homogenous group of developed countries
although in fact there is considerable diversity between them. A considerable number of
its Member States have wealth per capita similar to many developing countries, or
emerging economies. When the EU prepared domestic policies to deliver on its Kyoto
Protocol obligations, sufficient differentiation between the effort being asked of each
Member State was a condition for agreement. The EU therefore distributed its efforts and
compliance costs in line with the relative wealth of its Member States by differentiating
these according to their GDP per capita.
For the EU not only fairness mattered but also the overall cost-effectiveness of its
policies, as climate policy measures show very different cost patterns. If low-cost options
are implemented first, then more reductions can be realised. And choosing highest-cost
options would ultimately limit ambition by exhausting the willingness to pay of
governments and consumers. This willingness to pay was further tested by the fact that
many of the EU’s trading partners had no binding international reductions obligations.
Yet these domestic climate policies were being developed at a moment when the EU was
experiencing rapid globalisation in the 1990s and 2000s. So, cost considerations have
always been of capital importance in delivering the significant emission reductions that
the EU has committed to at the international level.
Two major lines of action were taken to ensure fairness and cost-efficiency. The first is
that policies at EU-level were pursued in areas where it made sense in the context of the
internal market to facilitate economies of scale and market-driven efficiencies, thereby
keeping costs as low as possible. The EU ETS, covering all major industrial installations
in power generation and manufacturing, established a unified market for emission
reductions. The EU ETS treated all participating companies in exactly the same manner,
and reaped low-cost options first across the EU. At the same time important energy-
relevant products, such as cars, transport fuels and energy-consuming appliances, were
subject to harmonised regulations, as the only way to avoid trade distortions and barriers
inside the EU’s internal market. Also some specific regulations were developed, such as
for fluorinated gases, as a limited number of key-players were mainly large companies
operating in the EU market.
The other major line of action concerned the millions of individual consumers in very
diverse economic and social circumstances. For these emissions, from housing, transport,
and agriculture, the obligations of Member States were differentiated according to their
relative wealth, expressed by GDP per capita. But to keep costs low and acceptable,
much attention was given to flexibility provisions allowed to the Member States. This
flexibility was therefore designed into the Effort Sharing Decision, and into the
legislation related to renewable energy or energy efficiency. It is to be expected that, as

110
2020 approaches, more effort will be made by Member States to use these flexibilities in
order to keep costs down.
This combination of fairness and cost-efficiency has already delivered significant
emission reductions. A significant decoupling of emissions from economic growth has
been sustained since 1990: economic growth has increased by 45% to 2013 while
emissions have decreased by 19%. The key to this was technological developments in all
sectors, but even more important was to actually deploy these technological
developments in everyday life. Through its regulations, the EU offered a huge market for
these technologies and became a champion in low-carbon and highly-energy efficient
equipment, products and services, and in doing so created millions of new high-quality
jobs. At the same time it has prepared itself for deeper emission reductions in the future
through a systematic encouragement of research and innovation in this area, in particular
through the EU’s €80 billion “Horizon 2020” Research and Development programme, the
Energy Union framework, and through a remarkable increase in patents for low-carbon
technologies114
.
EU record of achievement
This book has explained how the EU learned and established its policies. After making a
start, and, in the light of experience, refinements were introduced, and this will
undoubtedly continue in the future. Perhaps a relatively “hidden” part of its experience is
the understanding of how important a solid monitoring and accounting system of its
emissions is. Out of its obligations based on Articles 5, 7 and 8 of the Kyoto Protocol, the
EU has put in place the mechanisms it needs to accurately track, year-on-year, its
emissions without there being arguments among practitioners and scientists. Such data
has offered a transparent basis for the further refinement of measures or for concentration
on areas that need to be brought to the attention of the policy-makers, such as forestry
and land-use emissions.
For the Paris Agreement that is in preparation, or for further action in the context of the
ICAO and IMO on aviation and maritime sectors respectively, three major lessons can
be drawn from the EU’s experience. The first is that the monitoring, reporting and
verification of emissions (MRV) are of capital importance. Decisions on this must
complement the submissions by Parties of their Intended Nationally Determined
Contributions. Transparent and comparable data on emissions should be the “cement”
amongst Parties that ensures the building of trust, and which inspires the development
of future policies. The second lesson is that sufficient differentiation of policies and
ambition levels between Parties can ensure a fair distribution of mitigation effort. The
richer you are, the more you should be ready to contribute to the solutions, and this
must go beyond the simplistic divide between developed and developing countries that
is now largely out-of-date. The third lesson is about cost-effectiveness: maintaining
114
EU companies have a share of 40% of all patents for renewable technologies, compared to a 32% EU
share in overall global patents (source: European Commission COM(2015)80 final of 25/02/2015).
111
public support for action makes the prioritisation of low-cost policies essential, both
because it allows for more action, but also because it limits any potential trade disputes
between Parties.
It is sometimes said that the EU’s record of achievement in reducing its emissions of
greenhouse gas is flattered by the methodology used, which is to count the direct
emissions related to production rather than the indirect emissions of imported goods
consumed. First, that criticism is above all criticism of the partial coverage of quantitative
climate commitments under the Kyoto Protocol, which are limited to industrialised
countries. The Paris Agreement should correct that. Second, the direct emissions
approach, used by the IPCC and the UNFCCC has been agreed internationally and is
more feasible to implement from a monitoring, reporting and verification perspective.
Third, an indirect emissions, or consumption-based, approach, as advocated by some,
would logically require that emissions of third countries be included within the scope of
the domestic climate policies of the country of consumption, which would pose such
challenges of implementation and enforcement as to be unfeasible. Developing countries
are not in favour of such an approach, which would impose carbon constraints on their
factories and production without taking account of different levels of development
between countries (as reflected by indicators such as greenhouse gas emissions per capita
or GDP per capita). Finally, developing countries also fear that an indirect emissions, or
consumption-based, approach could also lead to the imposition of border tax adjustments.
That could trigger trade disputes that are better avoided through a wide participation of
all countries in a multilateral agreement.
What lessons does the EU draw from its experience to date? The EU has realised that
climate policies need to be integrated into its “normal” economic policies, in particular to
ensure maximum coherence between climate and energy policy. EU leaders underlined
this need for coherence through their decisions at the European Councils of October
2014, on the Climate and Energy framework for 2030, and on the establishment of a
European Energy Union, in March 2015115
. They underlined that the 5 dimensions of an
Energy Union are deeply interrelated: (1) energy security, solidarity and trust; (2) a fully
integrated European energy market; (3) energy efficiency contributing to moderation of
demand; (4) decarbonising the economy; and (5) research, innovation and
competitiveness.
The preparation of further policies will assess increasingly the relation between
environmental ambition, energy prices and competitiveness. Furthermore, by working in
“packages” of measures developed, proposed and adopted simultaneously, the integration
of political decision-making is enhanced. This process is likely to put increasing
emphasis on flexibilities that would enable greater cost-effectiveness of policies.
Evidence of such flexibilities extend beyond the more obvious use of market-based
instruments, such as emissions trading, but also includes the flexibilities of the regulation
on the CO2 performance of passenger cars, the cooperation between Member States on
115
European Council Conclusions of 19-20 March 2015, document EUCO 11/15 dated 20 March 2015;
http://www.consilium.europa.eu/en/press/press-releases/2015/03/20-conclusions-european-council/
112
renewable energy, and, more recently, the choice by the European Council to impose
neither Member State-specific renewable energy targets nor energy efficiency targets for
2030.
Another major change in policymaking, as mentioned in chapter 4, is the mainstreaming
of climate action and energy objectives into the EU’s budget. The EU has resolved that at
least 20% of its budget for the years 2014 to 2020 would be spent in direct or indirect
relation to climate change. This amounts to some €180 billion, in the major policy
domains such as regional development, agriculture and research and development.
Structural and Cohesion funds, for example, can assist lower-income Member States with
a high potential for energy efficiency improvements to invest in buildings renovation,
refurbishment of district heating systems, and the replacement or upgrading of ageing
infrastructure. In 2014, climate-related expenditure of the EU budget amounted to 15.5%,
and determination exists to keep increasing this figure.
Until now, the EU’s record of achievement and “climate leadership” has been with regard
to its emissions performance, judged against the internationally agreed yardstick.
Leadership has also been provided, as described in this book, as a laboratory of “learning-
by-doing” which has enabled considerable experience to be gained. It is hoped that this
could be of benefit to all countries, and improve the effectiveness of climate policies over
time.
Conclusion: the European institutions are investing much effort to improve the
preparation of the EU’s climate policies through the systematic assessment of
costs, benefits and distributive effects. The EU has acquired considerable expertise
in differentiating effort between diverse EU Member States so as to ensure
fairness. Cost-effectiveness considerations and flexibilities in implementation are
key. This is being done within the internationally agreed accounting framework of
the direct emissions approach.