SXL-8 LTO Archive System. SXL-8 Components: HP 1/8 Autoloader XenData SX-10 1RU.

ENERGY TRANSFER
RBC Capital Markets Midstream ConferenceNovember 15th & 16th, 2017

2
FORWARD-LOOKING STATEMENTS
Management of Energy Transfer Equity, L.P. (ETE) and Energy Transfer Partners, L.P. (ETP) will provide this presentation to
analysts at meetings to be held on November 15 & 16, 2017. At the meetings, members of the Partnerships’ management may
make statements about future events, outlook and expectations related to Panhandle Eastern Pipe Line Company, LP (PEPL),
Sunoco LP (SUN), ETP and ETE (collectively, the Partnerships), and their subsidiaries and this presentation may contain
statements about future events, outlook and expectations related to the Partnerships and their subsidiaries all of which
statements are forward-looking statements. Any statement made by a member of management of the Partnerships at this
meeting and any statement in this presentation that is not a historical fact will be deemed to be a forward-looking statement.
These forward-looking statements rely on a number of assumptions concerning future events that members of management of
the Partnerships believe to be reasonable, but these statements are subject to a number of risks, uncertainties and other
factors, many of which are outside the control of the Partnerships. While the Partnerships believe that the assumptions
concerning these future events are reasonable, we caution that there are inherent risks and uncertainties in predicting these
future events that could cause the actual results, performance or achievements of the Partnerships and their subsidiaries to be
materially different. These risks and uncertainties are discussed in more detail in the filings made by the Partnerships with the
Securities and Exchange Commission, copies of which are available to the public. The Partnerships expressly disclaim any
intention or obligation to revise or publicly update any forward-looking statements, whether as a result of new information, future
events, or otherwise.
All references in this presentation to capacity of a pipeline, processing plant or storage facility relate to maximum capacity under
normal operating conditions and with respect to pipeline transportation capacity, is subject to multiple factors (including natural
gas injections and withdrawals at various delivery points along the pipeline and the utilization of compression) which may
reduce the throughput capacity from specified capacity levels.
RECENT HIGHLIGHTS

RECENT ETP HIGHLIGHTS
4
Q3 2017 ETP
Earnings
• Adjusted EBITDA (consolidated): $1.74 billion
• Distributable Cash Flow attributable to the partners of ETP: $1.05 billion
• Distribution per ETP common unit paid November 14, 2017: $0.565 ($2.26 per ETP common unit annualized)
• Distribution coverage ratio: 1.13x
Rover Equity Sale
• On October 31st, ETP closed on its sale of a 49.9% interest in ET Rover Pipeline (HoldCo), to a fund managed by
Blackstone
• At closing, Blackstone contributed funds to reimburse ETP for its pro rata share of the Rover construction costs incurred by
ETP through the closing date, along with the payment of certain additional amounts
• ETP used the proceeds to pay down debt, therefore reducing its leverage, and to help fund future growth projects
• ETP will remain the operator of the Rover Pipeline Project
• HoldCo is now owned 50.1% by Energy Transfer, and 49.9% by Blackstone
• ETP now owns 32.56% of Rover, Blackstone owns 32.44%, and Traverse owns 35%
Perpetual Preferred
• On November 13, 2017, ETP priced an underwritten public offering of 950,000 of its 6.25% Series A Fixed-to-Floating Rate
Cumulative Redeemable Perpetual Preferred Units at a price of $1,000 per unit, and 550,000 of its 6.625% Series B Fixed-
to-Floating Rate Cumulative Redeemable Perpetual Preferred Units at a price of $1,000 per unit¹
• These securities provide an extremely cost-effective means of raising capital
• Expect to receive 50% equity treatment from all three ratings agencies
• These types of securities provide equity credit at a lower yield than common equity and without the associated IDRs.
Additionally, they are not convertible into common units
Liquidity• As of September 30, 2017, the combined partnerships (legacy ETP and legacy SXL) had borrowing capacity of up to $6.25
billion under their respective long-term credit facilities, with total liquidity available of approximately $4 billion
Expected Cash Flow
Growth
• Permian Express 3 expected in service year-end 2017
• Rebel II Processing Plant in West Texas expected to go into service in Q2 2018
• Mariner East 2 expected in service Q2 2018
• Long-term, fee-based gathering and processing agreement with Enable to begin utilizing idle pipeline and processing
capacity in North Texas
• Red Bluff Pipeline expected online in Q2 2018
• Bayou Bridge segment from Lake Charles to St. James expected to be completed in second half of 2018
• Frac V at Mont Belvieu, Texas expected to be in-service Q3 2018
• Frac VI at Mont Belvieu, Texas expected to be in-service Q2 2019
(1) The offering of the Preferred Units is expected to close on or about November 16, 2017, subject to the satisfaction of customary closing conditions

ENERGY TRANSFER FAMILY ORGANIZATIONAL STRUCTURE
ENERGY TRANSFER PARTNERS, L.P. (1)
(1) The ETP/SXL merger closed April 28, 2017; the combined company is named Energy Transfer Partners, L.P. and trades on the NYSE under “ETP” ticker symbol
(2) Owner and operator of LNG Regasification facility in Lake Charles, LA5
ENERGY TRANSFER
LNG(2)
~2.5% LP
Interest,
100% GP / IDRs
Retail
Marketing
SUNOCO LP
ENERGY TRANSFER EQUITY, L.P.
Intrastate
Transportation &
Storage
~2.3% LP Interest
100% GP / IDRs
Legend:Publicly
Traded
MLP
Operating
Business
100%
Interest
~43.7% LP
Interest
Lake Charles
LNG (Regas)
Lake Charles
LNG
Export Co
60%
Interest
Interstate
Transportation &
Storage
Midstream
NGL/ Refined
Products
Crude
40%
Interest

Recently In-service &
Announced Growth Projects
SIGNIFICANT GEOGRAPHIC FOOTPRINT ACROSS THE FAMILY
6
Asset Overview
ETP Assets
Legacy SXL Assets
Terminals
Marcus Hook
Eagle Point
Nederland
Midland
Lake Charles LNG
Dakota Access Pipeline
ETCO Pipeline
Comanche Trail Pipeline
Trans-Pecos Pipeline
Bayou Bridge
Rover Pipeline
Revolution System
Mariner East Phase 2
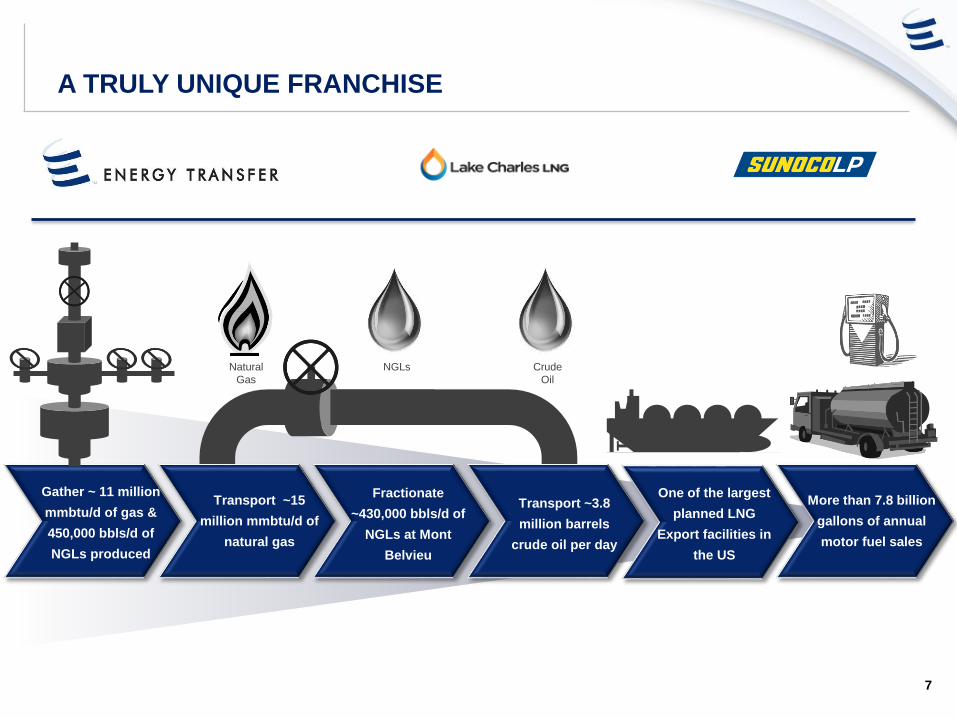
A TRULY UNIQUE FRANCHISE
7
Transport ~15
million mmbtu/d of
natural gas
Fractionate
~430,000 bbls/d of
NGLs at Mont
Belvieu
Gather ~ 11 million
mmbtu/d of gas &
450,000 bbls/d of
NGLs produced
Transport ~3.8
million barrels
crude oil per day
Natural
Gas
NGLs Crude
Oil
One of the largest
planned LNG
Export facilities in
the US
More than 7.8 billion
gallons of annual
motor fuel sales

FULLY INTEGRATED PLATFORM SPANNING THE
ENTIRE MIDSTREAM VALUE CHAIN
8
Involvement in Major Midstream Themes Across the Best Basins and Logistics Hubs
Interstate Natural
Gas T&S
Franchise Strengths
Intrastate Natural
Gas T&S
Midstream
Crude Oil
NGL & Refined
Products
• Access to multiple shale plays, storage facilities and markets
• Approximately 95% of revenue from reservation fee contracts
• Well-positioned to capitalize on changing market dynamics
• Key assets: Rover, PEPL, FGT, Transwestern, Trunkline, Tiger
• Marcellus natural gas takeaway to the Midwest, Gulf Coast, and Canada
• Backhaul to LNG exports and new petrochemical demand on Gulf Coast
Opportunities
• Natural gas exports to Mexico
• Additional demand from LNG and petrochemical development on Gulf
Coast
• Gathering and processing build out in Texas and Marcellus/Utica
• Synergies with ETP downstream assets
• Significant growth projects ramping up to full capacity over the next two
years
• Increased volumes from transporting and fractionating volumes from
Permian/Delaware and Midcontinent basins
• Increased fractionation volumes as large NGL fractionation third-party
agreements expire
• Permian NGL takeaway
• Permian Express 3 expected to provide Midland & Delaware Basin
crude oil takeaway to various markets, including Nederland, TX
• Permian Express Partners Joint Venture with ExxonMobil
• Well-positioned to capture additional revenues from anticipated
changes in natural gas supply and demand
• Largest intrastate natural gas pipeline and storage system on the
Gulf Coast
• Key assets: ET Fuel Pipeline, Oasis Pipeline, Houston Pipeline
System, ETC Katy Pipeline
• ~33,000 miles of gathering pipelines with ~6.7 Bcf/d of processing
capacity
• Projects placed in-service underpinned by long-term, fee-based
contracts
• Bakken Crude Oil pipeline supported by long-term, fee-based
contracts; expandable to 570,000 bpd with incremental pumps
• Significant Permian takeaway abilities with potential to provide the
market with ~1 million barrels of crude oil takeaway
• 27 million barrel Nederland crude oil terminal on the Gulf Coast
• Bakken crude takeaway to Gulf Coast refineries
• World-class integrated platform for processing, transporting,
fractionating, storing and exporting NGLs
• Fastest growing NGLs business in Mont Belvieu via Lone Star
• Liquids volumes from our midstream segment culminate in the ETE
family’s Mont Belvieu / Mariner South / Nederland Gulf Coast
Complex
• Mariner East provides significant Appalachian liquids takeaway
capacity connecting NGL volumes to local, regional and
international markets via Marcus Hook

FULLY INTEGRATED MIDSTREAM/LIQUIDS
PLATFORM ACROSS NORTH AMERICA
9
Refined Products/NGL
Crude
Growth Projects
Legacy
Sunoco Logistics
Facility
NGL Pipelines
Crude Projects¹
NGL Projects
Legacy
Energy Transfer
LNG Facilities
Fractionator
The ability to integrate an end-to-end liquids solution will better serve customers and alleviate bottlenecks
currently faced by producers
Lone Star is the fastest growing NGLs business
in Mont Belvieu
• Fracs I, II, III and IV in service. Fracs V and VI expected in-service Q3 2018 and Q2
2019, respectively
• Plot plan in place for an additional Frac on existing footprint (7 fractionators in total)
• Total Frac capacity potentially 800,000 bpd
• ~2,000 miles of NGL pipelines with fully-expanded capacity of ~1,300,000 bpd
• Storage capacity of 53 millions barrels
• ~200,000 bpd LPG export terminal
• ETP’s Lone Star presence in Mont Belvieu combined with SXL’s Nederland terminal
provide opportunities for multiple growth projects
• Potential ethane and ethylene projects delivering Lone Star fractionated products to
Nederland for export
Marcus Hook: The future Mont
Belvieu of the North
• 800 acre site: inbound and
outbound pipeline along with
infrastructure connectivity
• Logistically and financially
advantaged for exports being
1,500 miles closer to Europe,
significantly reducing shipping
cost.
• Advantaged to local and regional
markets
• No ship channel restriction,
compared to the Houston Ship
Channel
• 4 seaborne export docks can
accommodate VLGC sized
vessels
• ETP’s Rover and Revolution
system, combined with SXL’s NE
Mariner system provide long-term
growth potential
(1) Via joint ventures
Lone Star is the fastest growing NGLs business
in Mont Belvieu
Marcus Hook: The future Mont
Belvieu of the North
9

PRIMARILY FEE-BASED BUSINESS MIX
10
• Midstream: Approximately 80% fee-based margins from
minimum volume commitment, acreage dedication and
throughput-based contracts
• NGL & Refined Products: Transportation revenue from
dedicated capacity and take-or-pay contracts, storage
revenues consisting of both storage fees and throughput
fees, and fractionation fees, which are primarily frac-or-
pay structures
• Interstate Transportation & Storage: Approximately
95% firm reservation charges based on amount of firm
capacity reserved, regardless of usage
• Crude Oil: Primarily fee-based revenues derived from the
transporting and terminalling of crude oil
• Intrastate: Primarily fixed-fee reservation charges,
transport fees based on actual throughput, and storage
fees
Stability of Cash Flows Q3 2017 Segment Margin by Segment
Midstream Fee 20%
Midstream Non-Fee 5%
NGL & Refined Products
23%Crude28%
Interstate11%
Intrastate8%
All Other5%
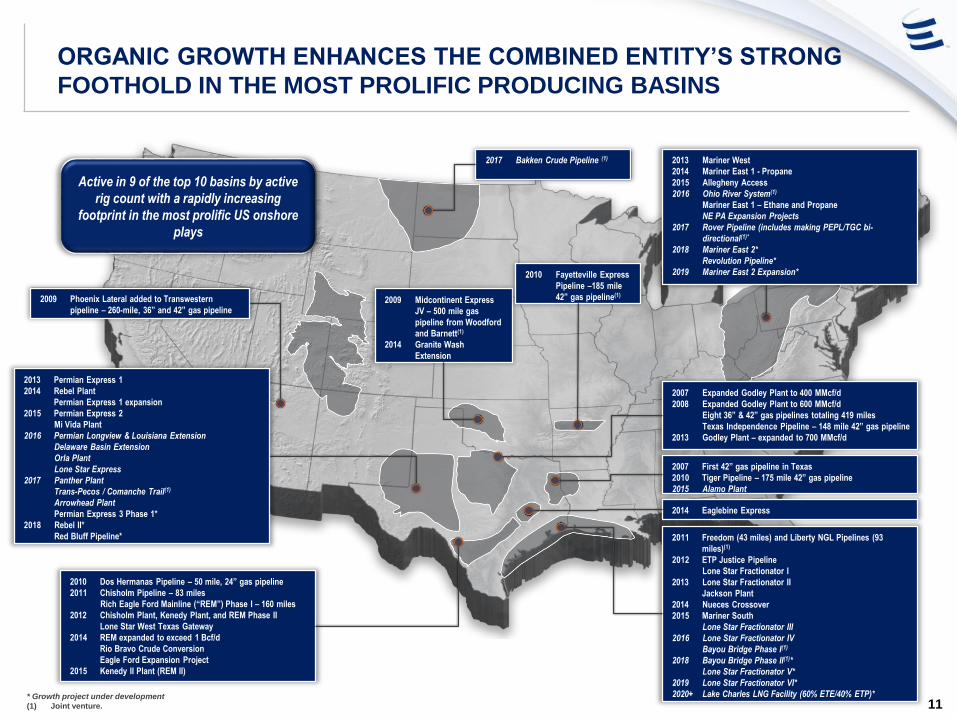
ORGANIC GROWTH ENHANCES THE COMBINED ENTITY’S STRONG
FOOTHOLD IN THE MOST PROLIFIC PRODUCING BASINS
11* Growth project under development
(1) Joint venture.
2007 Expanded Godley Plant to 400 MMcf/d
2008 Expanded Godley Plant to 600 MMcf/d
Eight 36” & 42” gas pipelines totaling 419 miles
Texas Independence Pipeline – 148 mile 42” gas pipeline
2013 Godley Plant – expanded to 700 MMcf/d
2009 Midcontinent Express
JV – 500 mile gas
pipeline from Woodford
and Barnett(1)
2014 Granite Wash
Extension
2010 Fayetteville Express
Pipeline –185 mile
42” gas pipeline(1)
2007 First 42” gas pipeline in Texas
2010 Tiger Pipeline – 175 mile 42” gas pipeline
2015 Alamo Plant
2011 Freedom (43 miles) and Liberty NGL Pipelines (93
miles)(1)
2012 ETP Justice Pipeline
Lone Star Fractionator I
2013 Lone Star Fractionator II
Jackson Plant
2014 Nueces Crossover
2015 Mariner South
Lone Star Fractionator III
2016 Lone Star Fractionator IV
Bayou Bridge Phase I(1)
2018 Bayou Bridge Phase II(1)*
Lone Star Fractionator V*
2019 Lone Star Fractionator VI*
2020+ Lake Charles LNG Facility (60% ETE/40% ETP)*
2010 Dos Hermanas Pipeline – 50 mile, 24” gas pipeline
2011 Chisholm Pipeline – 83 miles
Rich Eagle Ford Mainline (“REM”) Phase I – 160 miles
2012 Chisholm Plant, Kenedy Plant, and REM Phase II
Lone Star West Texas Gateway
2014 REM expanded to exceed 1 Bcf/d
Rio Bravo Crude Conversion
Eagle Ford Expansion Project
2015 Kenedy II Plant (REM II)
2014 Eaglebine Express
2017 Bakken Crude Pipeline (1) 2013 Mariner West
2014 Mariner East 1 - Propane
2015 Allegheny Access
2016 Ohio River System(1)
Mariner East 1 – Ethane and Propane
NE PA Expansion Projects
2017 Rover Pipeline (includes making PEPL/TGC bi-
directional(1)*
2018 Mariner East 2*
Revolution Pipeline*
2019 Mariner East 2 Expansion*
2013 Permian Express 1
2014 Rebel Plant
Permian Express 1 expansion
2015 Permian Express 2
Mi Vida Plant
2016 Permian Longview & Louisiana Extension
Delaware Basin Extension
Orla Plant
Lone Star Express
2017 Panther Plant
Trans-Pecos / Comanche Trail(1)
Arrowhead Plant
Permian Express 3 Phase 1*
2018 Rebel II*
Red Bluff Pipeline*
Active in 9 of the top 10 basins by active
rig count with a rapidly increasing
footprint in the most prolific US onshore
plays
2009 Phoenix Lateral added to Transwestern
pipeline – 260-mile, 36” and 42” gas pipeline
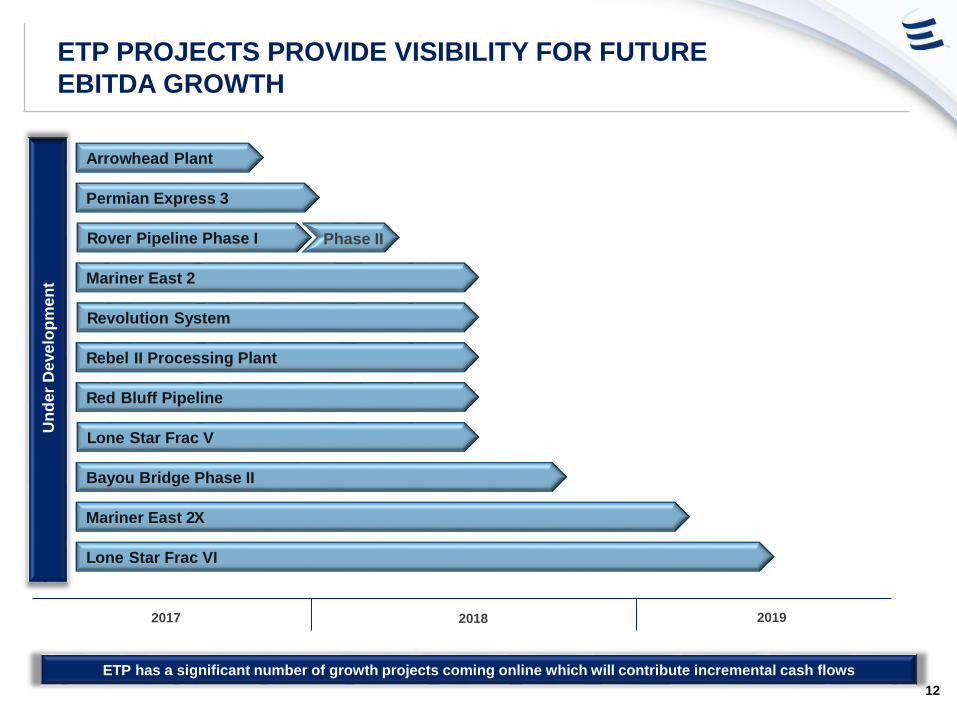
ETP PROJECTS PROVIDE VISIBILITY FOR FUTURE
EBITDA GROWTH
12
Lone Star Frac VI
Lone Star Frac V
Arrowhead Plant
Rebel II Processing Plant
Bayou Bridge Phase II
Red Bluff Pipeline
Mariner East 2
Revolution System
Un
de
r D
eve
lop
me
nt
Rover Pipeline Phase I
Permian Express 3
Mariner East 2X
2017 2018 2019
ETP has a significant number of growth projects coming online which will contribute incremental cash flows
Phase II
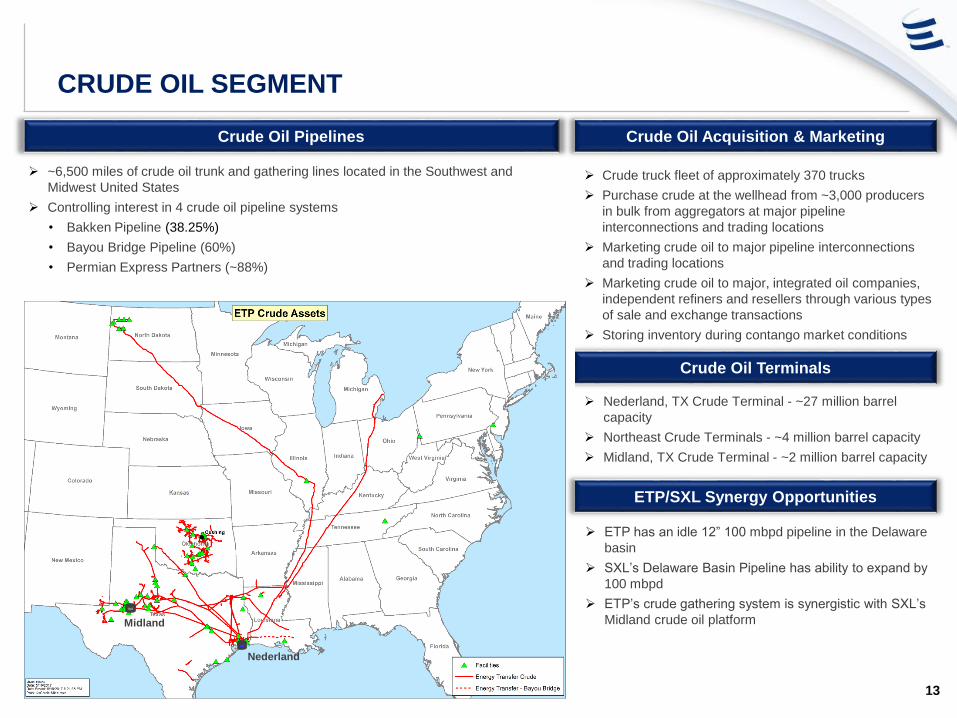
CRUDE OIL SEGMENT
Crude truck fleet of approximately 370 trucks
Purchase crude at the wellhead from ~3,000 producers
in bulk from aggregators at major pipeline
interconnections and trading locations
Marketing crude oil to major pipeline interconnections
and trading locations
Marketing crude oil to major, integrated oil companies,
independent refiners and resellers through various types
of sale and exchange transactions
Storing inventory during contango market conditions
Crude Oil Pipelines Crude Oil Acquisition & Marketing
Nederland, TX Crude Terminal - ~27 million barrel
capacity
Northeast Crude Terminals - ~4 million barrel capacity
Midland, TX Crude Terminal - ~2 million barrel capacity
Crude Oil Terminals
Nederland
Midland
~6,500 miles of crude oil trunk and gathering lines located in the Southwest and
Midwest United States
Controlling interest in 4 crude oil pipeline systems
• Bakken Pipeline (38.25%)
• Bayou Bridge Pipeline (60%)
• Permian Express Partners (~88%)
13
ETP/SXL Synergy Opportunities
ETP has an idle 12” 100 mbpd pipeline in the Delaware
basin
SXL’s Delaware Basin Pipeline has ability to expand by
100 mbpd
ETP’s crude gathering system is synergistic with SXL’s
Midland crude oil platform
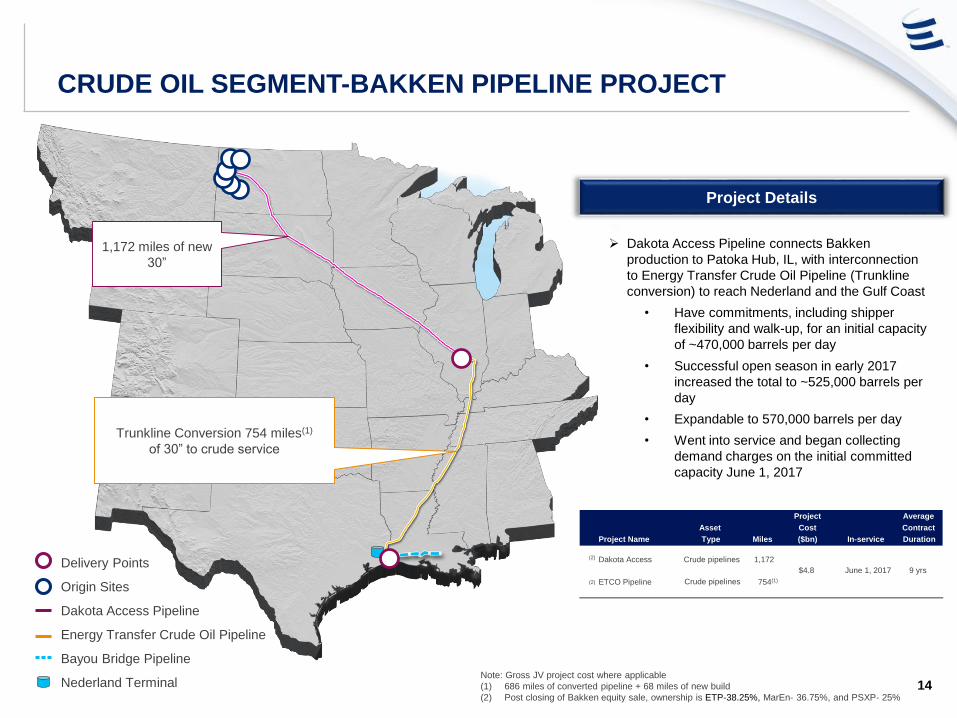
CRUDE OIL SEGMENT-BAKKEN PIPELINE PROJECT
1,172 miles of new
30”
Trunkline Conversion 754 miles(1)
of 30” to crude service
Dakota Access Pipeline connects Bakken
production to Patoka Hub, IL, with interconnection
to Energy Transfer Crude Oil Pipeline (Trunkline
conversion) to reach Nederland and the Gulf Coast
• Have commitments, including shipper
flexibility and walk-up, for an initial capacity
of ~470,000 barrels per day
• Successful open season in early 2017
increased the total to ~525,000 barrels per
day
• Expandable to 570,000 barrels per day
• Went into service and began collecting
demand charges on the initial committed
capacity June 1, 2017
Note: Gross JV project cost where applicable
(1) 686 miles of converted pipeline + 68 miles of new build
(2) Post closing of Bakken equity sale, ownership is ETP-38.25%, MarEn- 36.75%, and PSXP- 25%
Delivery Points
Origin Sites
Dakota Access Pipeline
Energy Transfer Crude Oil Pipeline
Bayou Bridge Pipeline
Nederland Terminal
Project Details
Project Average
Asset Cost Contract
Project Name Type Miles ($bn) In-service Duration
Dakota Access(2) Crude pipelines 1,172
ETCO Pipeline(2) Crude pipelines 754(1)
June 1, 2017$4.8 9 yrs
14

Strategic joint venture with ExxonMobil
(ETP owns ~88% and is the operator)
Combines key crude oil pipeline network of
both companies and aligns ETP’s Permian
takeaway assets with ExxonMobil’s crude
pipeline network
Will provide increased volume opportunities,
and expect to achieve significantly greater
long-term accretion working together as
domestic crude oil production grows over
time
CRUDE OIL SEGMENT - PERMIAN EXPRESS PARTNERS
Joint Venture DetailsPermian Express Partners
15
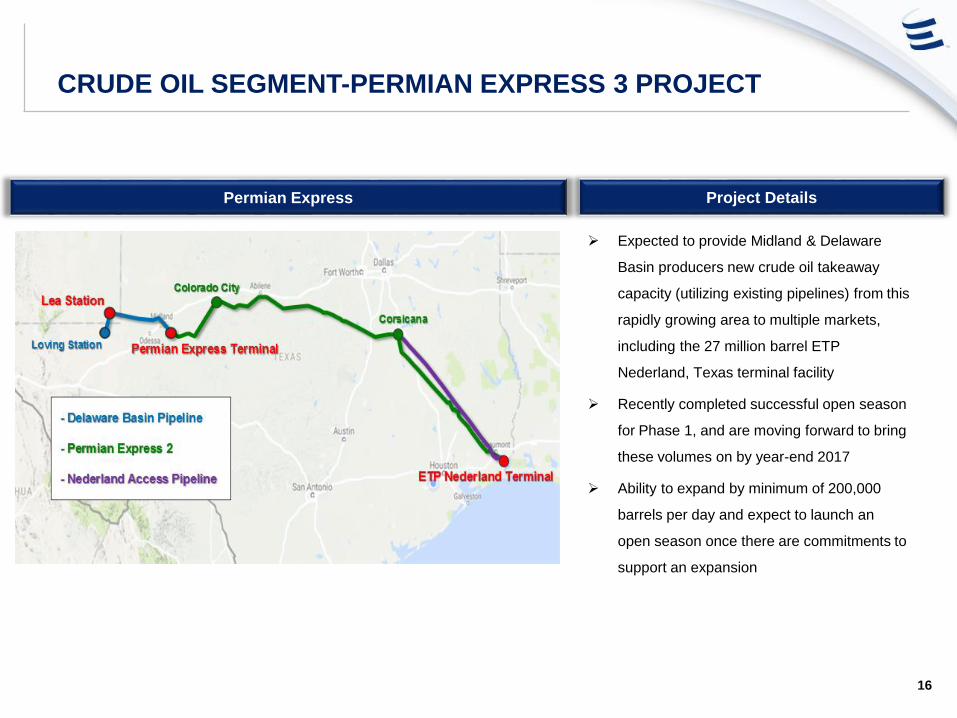
Expected to provide Midland & Delaware
Basin producers new crude oil takeaway
capacity (utilizing existing pipelines) from this
rapidly growing area to multiple markets,
including the 27 million barrel ETP
Nederland, Texas terminal facility
Recently completed successful open season
for Phase 1, and are moving forward to bring
these volumes on by year-end 2017
Ability to expand by minimum of 200,000
barrels per day and expect to launch an
open season once there are commitments to
support an expansion
CRUDE OIL SEGMENT-PERMIAN EXPRESS 3 PROJECT
Project DetailsPermian Express
16
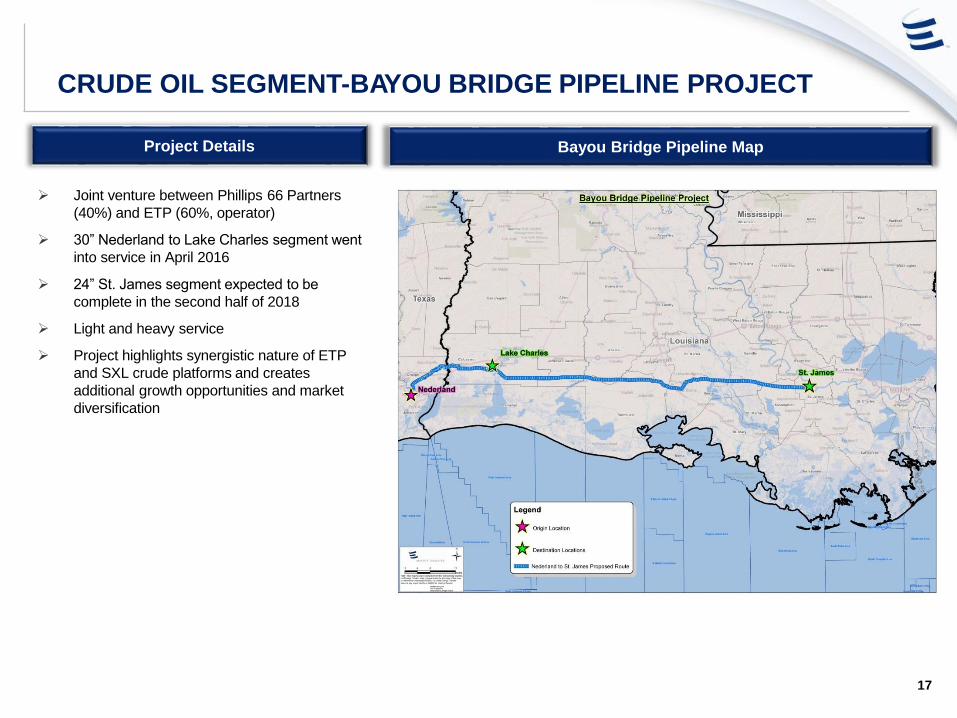
CRUDE OIL SEGMENT-BAYOU BRIDGE PIPELINE PROJECT
Joint venture between Phillips 66 Partners
(40%) and ETP (60%, operator)
30” Nederland to Lake Charles segment went
into service in April 2016
24” St. James segment expected to be
complete in the second half of 2018
Light and heavy service
Project highlights synergistic nature of ETP
and SXL crude platforms and creates
additional growth opportunities and market
diversification
Bayou Bridge Pipeline MapProject Details
17

NGL & REFINED PRODUCTS SEGMENT
NGL Storage Fractionation NGL Pipeline Transportation
Refined Products
Mariner Franchise
~1,800 miles of refined products pipelines in the
northeast, Midwest and southwest US markets
38 refined products terminals with 8 million barrels
storage capacity
~4,180 miles of NGL Pipelines throughout Texas and
Northeast
~ 1,300 Mbpd of raw make transport capacity in Texas
~ 1,130 Mbpd of purity NGL pipeline capacity
732 Mbpd on the Gulf Coast
398 Mbpd in the Northeast
~200 Mbpd Mariner South LPG from Mont Belvieu to
Nederland
50 Mbpd Mariner West ethane to Canada
70 Mbpd ME1 ethane and propane to Marcus Hook
275 Mbpd ME2 NGLs to Marcus Hook (Q2 2018)
Up to 250 Mbpd ME2X expected in-service Q1 2019
Nederland
Mont Belvieu
Marcus
Hook
TET Mont Belvieu Storage Hub ~50 million
barrels NGL storage, ~600 Mbpd throughput
3 million barrel Mont Belvieu cavern under
development
~5 million barrels of NGL storage at Marcus
Hook, Nederland and Inkster
Hattiesburg Butane Storage ~3 million
barrels
4 Mont Belvieu fractionators (420+ Mbpd)
40 Mbpd King Ranch, 25 Mbpd Geismar
50 Mbpd Houston DeEthanizer and 30 to 50
Mbpd Marcus Hook C3+ Frac in service Q4
2017
120 Mbpd Frac V in-service Q3 2018
120 Mbpd Frac VI in-service Q2 2019
18

MARINER EAST SYSTEM
A comprehensive Marcellus Shale solution
Will transport Natural Gas Liquids from OH / Western PA to the Marcus Hook Industrial Complex on the East Coast
Supported by long-term, fee-based contracts
Mariner East 1:
• Currently in-service for Propane &
Ethane transportation, storage &
terminalling services
• Approximately capacity of 70,000
barrels per day
Mariner East 2x:
• Expected to be in-service Q1 2019
• Currently in open season to offer
transportation, storage and
terminalling services for ethane,
propane, butane, C3+, natural
gasoline, condensate and refined
products
• Incremental capacity of up to
250,000 barrels per day
19
Mariner East 2:
• Expected to be in-service Q2 2018
• NGL transportation, storage &
terminalling services
• Initial capacity of 275,000 barrels
per day with upside of up to
450,000 barrels per day
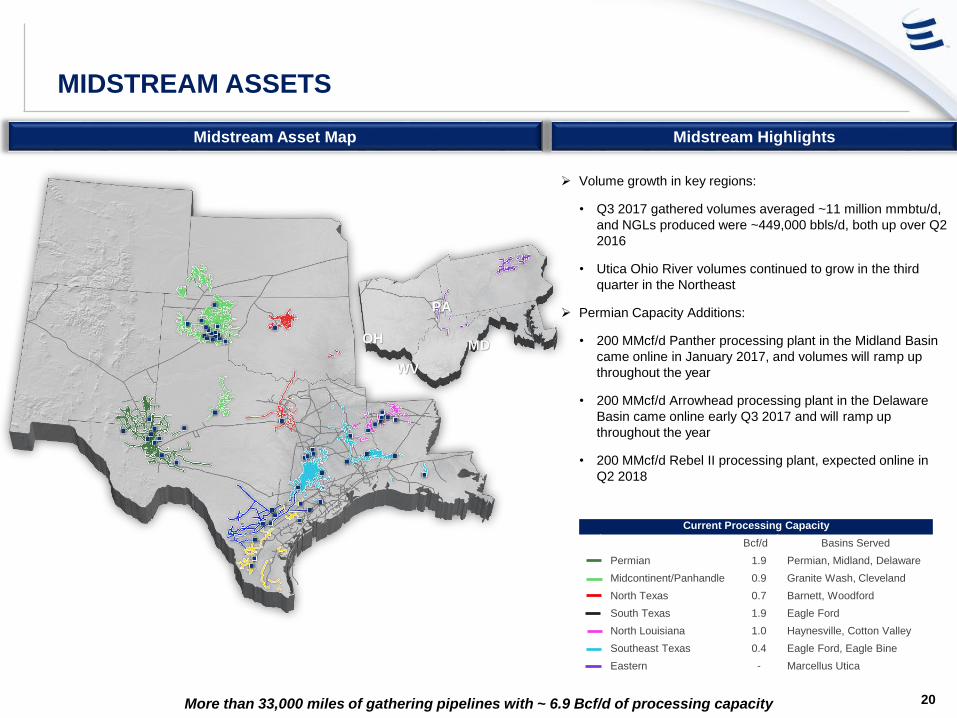
MIDSTREAM ASSETS
More than 33,000 miles of gathering pipelines with ~ 6.9 Bcf/d of processing capacity
PA
WV
MDOH
Midstream Highlights
Volume growth in key regions:
• Q3 2017 gathered volumes averaged ~11 million mmbtu/d,
and NGLs produced were ~449,000 bbls/d, both up over Q2
2016
• Utica Ohio River volumes continued to grow in the third
quarter in the Northeast
Permian Capacity Additions:
• 200 MMcf/d Panther processing plant in the Midland Basin
came online in January 2017, and volumes will ramp up
throughout the year
• 200 MMcf/d Arrowhead processing plant in the Delaware
Basin came online early Q3 2017 and will ramp up
throughout the year
• 200 MMcf/d Rebel II processing plant, expected online in
Q2 2018
Midstream Asset Map
Current Processing Capacity
Bcf/d Basins Served
Permian 1.9 Permian, Midland, Delaware
Midcontinent/Panhandle 0.9 Granite Wash, Cleveland
North Texas 0.7 Barnett, Woodford
South Texas 1.9 Eagle Ford
North Louisiana 1.0 Haynesville, Cotton Valley
Southeast Texas 0.4 Eagle Ford, Eagle Bine
Eastern - Marcellus Utica
20

PERMIAN BASIN INFRASTRUCTURE BUILDOUT
21
Continued producer demand and strong growth outlook in the Permian continues to necessitate infrastructure buildout
• Brought 600 mmcf/d of processing capacity online in 2016 and 2017. Expect to bring an incremental 200 mmcf/d
of processing online by mid-2018
• Continue to see volumes fill up on processing plants in the Permian Basin, and expect to announce future
processing expansions to support volume growth from committed shippers

REVOLUTION SYSTEM PROJECT
System is located in Pennsylvania’s
Marcellus/Upper Devonian Shale rich-gas
area
Rich-gas, complete solution system
Currently 20 miles of 16” in-service
Build out assets will include:
• 110 miles of 20”, 24” & 30” gathering
pipelines
• Cryogenic processing plant with de-
ethanizer
• Natural gas residue pipeline with direct
connect to Rover pipeline
• Purity ethane pipeline to Mariner East
system
• C3+ pipeline and storage to Mariner East
system
• Fractionation facility located at Marcus
Hook facility
Multiple customers committed to project,
which includes volume commitments and a
large acreage dedication
Expected to be complete in Q1 2018, and
will be waiting to go into full service once
Rover and ME2 are in service
Project Details Revolution Project Map
• Opportunity to connect Revolution system to Mariner East system to move
additional NGL volumes out of the Marcellus / Utica
• Potential to increase product flows to Marcus Hook
22

INTERSTATE PIPELINE ASSETS
PEPL TGC (1) TW FGT SR FEP Tiger MEP
Gulf
States Rover(2) Total
Miles of Pipeline 6,000 2,230 2,600 5,400 1,000 185 195 500 10 712 18,830
Capacity (Bcf/d) 2.8 1.0 2.1 3.1 2.3 2.0 2.4 1.8 0.2 3.3 21.3
Owned Storage (Bcf) 55.1 13 -- -- -- -- -- -- -- -- 68.1
Ownership 100% 100% 100% 50% 100% 50% 100% 50% 100% 32.56%
(1) After abandonment of 30” line being connected to crude service
(2) Phase 1A currently in service. Expect to be fully in service by end of Q1 2018
Transwestern
Gulf States
Tiger
Sea Robin
Florida Gas Transmission
Fayetteville Express
Trunkline
Rover
Interstate Asset Map Interstate Highlights
Our interstate pipelines provide:
Stability
• Approximately 95% of revenue is derived
from fixed reservation fees
Diversity
• Access to multiple shale plays, storage
facilities and markets
Growth Opportunities
• Well-positioned to capitalize on changing
supply and demand dynamics
• Expect earnings to pick up once Rover is
in service
• In addition, will be receiving significant
revenues from backhaul capabilities on
Panhandle and Trunkline
~18,120 miles of interstate pipelines with 18 Bcf/d of throughput capacity currently in-service 23
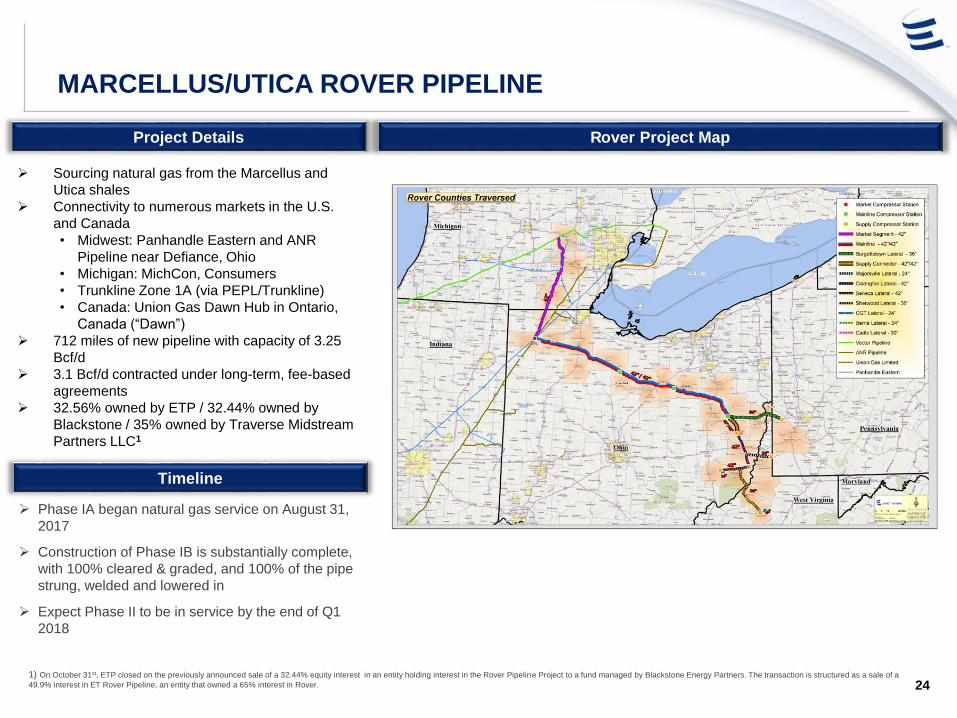
MARCELLUS/UTICA ROVER PIPELINE
Rover Project MapProject Details
Sourcing natural gas from the Marcellus and
Utica shales
Connectivity to numerous markets in the U.S.
and Canada
• Midwest: Panhandle Eastern and ANR
Pipeline near Defiance, Ohio
• Michigan: MichCon, Consumers
• Trunkline Zone 1A (via PEPL/Trunkline)
• Canada: Union Gas Dawn Hub in Ontario,
Canada (“Dawn”)
712 miles of new pipeline with capacity of 3.25
Bcf/d
3.1 Bcf/d contracted under long-term, fee-based
agreements
32.56% owned by ETP / 32.44% owned by
Blackstone / 35% owned by Traverse Midstream
Partners LLC1
Phase IA began natural gas service on August 31,
2017
Construction of Phase IB is substantially complete,
with 100% cleared & graded, and 100% of the pipe
strung, welded and lowered in
Expect Phase II to be in service by the end of Q1
2018
Timeline
241) On October 31st, ETP closed on the previously announced sale of a 32.44% equity interest in an entity holding interest in the Rover Pipeline Project to a fund managed by Blackstone Energy Partners. The transaction is structured as a sale of a
49.9% interest in ET Rover Pipeline, an entity that owned a 65% interest in Rover.

Capacity
(Bcf/d)
Pipeline
(Miles)
Storage
Capacity (Bcf)
Bi-Directional
Capabilities
Major Connect
Hubs
Trans Pecos & Comanche
Trail Pipelines2.5 337 NA No
Waha Header,
Mexico Border
ET Fuel Pipeline 5.2 2,770 12.4 YesWaha, Katy,
Carthage
Oasis Pipeline 1.2 600 NA Yes Waha, Katy
Houston Pipeline System 5.3 3,800 52.5 NoHSC, Katy,
Aqua Dulce
ETC Katy Pipeline 2.4 370 NA No Katy
RIGS 2.1 450 NA NoUnion Power,
LA Tech
In Service
INTRASTATE PIPELINE ASSETS
• ~ 8,700 miles of intrastate pipelines
• ~18.5 Bcf/d of throughput capacity
Intrastate Asset Map Intrastate Highlights
Continue to expect volumes to Mexico to grow,
particularly with the startup of Trans-Pecos and
Comanche Trail in the Q1 2017, which will result in
increased demand for transport services through
ETP’s existing pipeline network
Well-positioned to capture additional revenues from
anticipated changes in natural gas supply and demand
in the next five years
Announced Red Bluff Pipeline, which will connect the
Red Bluff and Orla Plants, as well as 3rd party plants,
to the Waha Oasis Header, and is expected to be
online in Q2 2018
(1) ETP owns a 49.99% general partnership interest
1
25
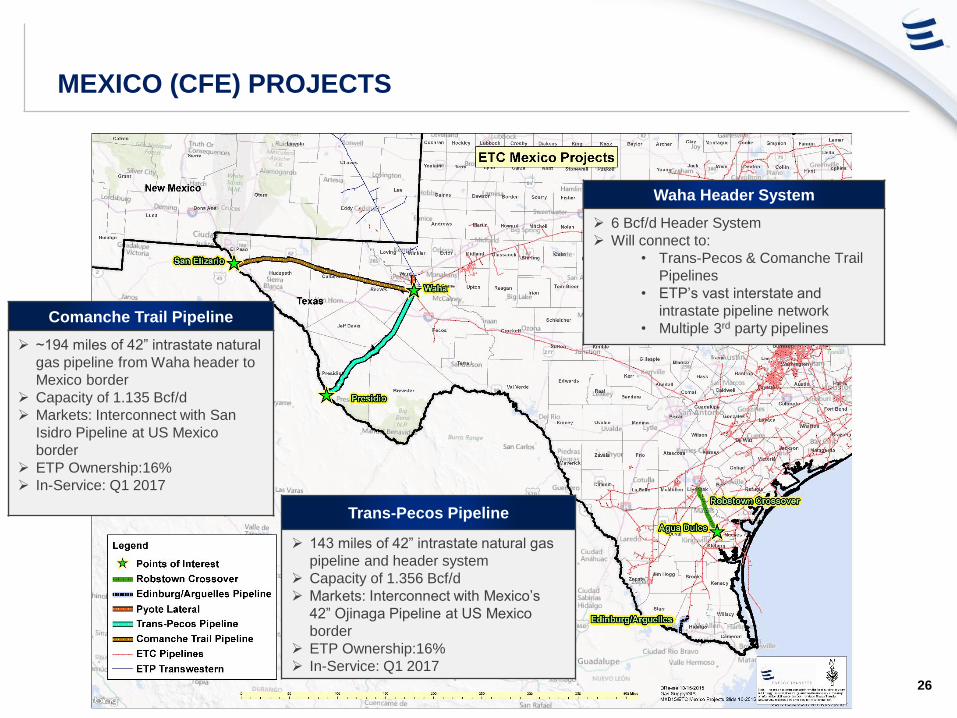
MEXICO (CFE) PROJECTS
Waha Header System
6 Bcf/d Header System
Will connect to:
• Trans-Pecos & Comanche Trail
Pipelines
• ETP’s vast interstate and
intrastate pipeline network
• Multiple 3rd party pipelines
Trans-Pecos Pipeline
143 miles of 42” intrastate natural gas
pipeline and header system
Capacity of 1.356 Bcf/d
Markets: Interconnect with Mexico’s
42” Ojinaga Pipeline at US Mexico
border
ETP Ownership:16%
In-Service: Q1 2017
Comanche Trail Pipeline
~194 miles of 42” intrastate natural
gas pipeline from Waha header to
Mexico border
Capacity of 1.135 Bcf/d
Markets: Interconnect with San
Isidro Pipeline at US Mexico
border
ETP Ownership:16%
In-Service: Q1 2017
26
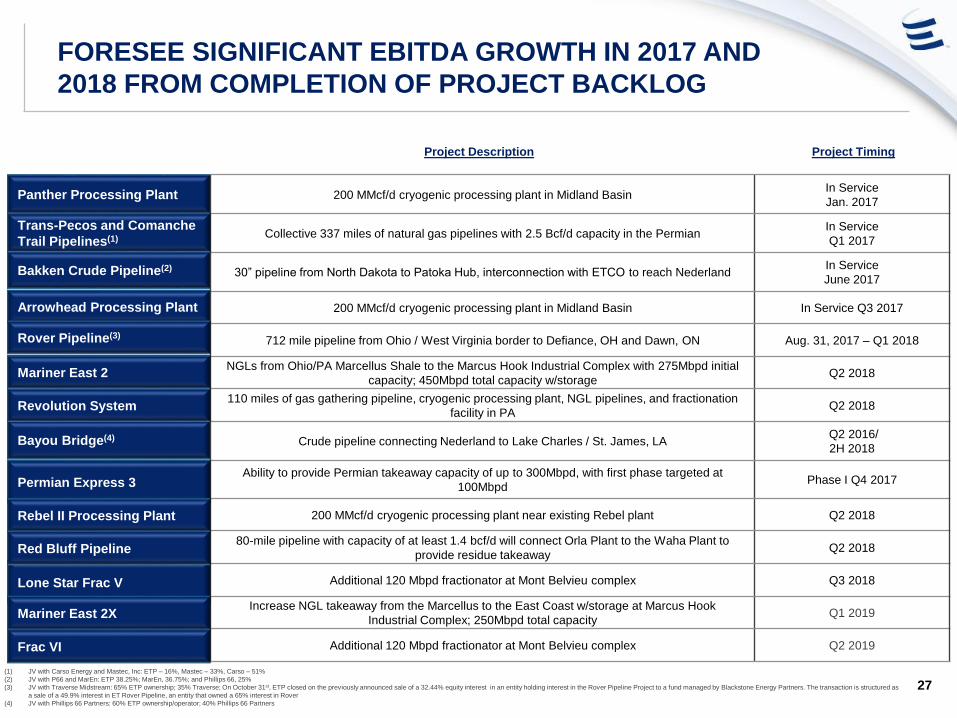
FORESEE SIGNIFICANT EBITDA GROWTH IN 2017 AND
2018 FROM COMPLETION OF PROJECT BACKLOG
27
Bayou Bridge(4)
Panther Processing Plant
Bakken Crude Pipeline(2)
Arrowhead Processing Plant
Project Timing
200 MMcf/d cryogenic processing plant in Midland BasinIn Service
Jan. 2017
Collective 337 miles of natural gas pipelines with 2.5 Bcf/d capacity in the PermianIn Service
Q1 2017
30” pipeline from North Dakota to Patoka Hub, interconnection with ETCO to reach NederlandIn Service
June 2017
200 MMcf/d cryogenic processing plant in Midland Basin In Service Q3 2017
712 mile pipeline from Ohio / West Virginia border to Defiance, OH and Dawn, ON Aug. 31, 2017 – Q1 2018
NGLs from Ohio/PA Marcellus Shale to the Marcus Hook Industrial Complex with 275Mbpd initial
capacity; 450Mbpd total capacity w/storageQ2 2018
110 miles of gas gathering pipeline, cryogenic processing plant, NGL pipelines, and fractionation
facility in PAQ2 2018
Crude pipeline connecting Nederland to Lake Charles / St. James, LAQ2 2016/
2H 2018
Ability to provide Permian takeaway capacity of up to 300Mbpd, with first phase targeted at
100MbpdPhase I Q4 2017
200 MMcf/d cryogenic processing plant near existing Rebel plant Q2 2018
80-mile pipeline with capacity of at least 1.4 bcf/d will connect Orla Plant to the Waha Plant to
provide residue takeawayQ2 2018
Additional 120 Mbpd fractionator at Mont Belvieu complex Q3 2018
Increase NGL takeaway from the Marcellus to the East Coast w/storage at Marcus Hook
Industrial Complex; 250Mbpd total capacityQ1 2019
Additional 120 Mbpd fractionator at Mont Belvieu complex Q2 2019
Project Description
Revolution System
(1) JV with Carso Energy and Mastec, Inc: ETP – 16%, Mastec – 33%, Carso – 51%
(2) JV with P66 and MarEn: ETP 38.25%; MarEn, 36.75%; and Phillips 66, 25%
(3) JV with Traverse Midstream: 65% ETP ownership; 35% Traverse; On October 31st, ETP closed on the previously announced sale of a 32.44% equity interest in an entity holding interest in the Rover Pipeline Project to a fund managed by Blackstone Energy Partners. The transaction is structured as
a sale of a 49.9% interest in ET Rover Pipeline, an entity that owned a 65% interest in Rover
(4) JV with Phillips 66 Partners: 60% ETP ownership/operator; 40% Phillips 66 Partners
Trans-Pecos and Comanche
Trail Pipelines(1)
Lone Star Frac V
Rover Pipeline(3)
Mariner East 2
Permian Express 3
Rebel II Processing Plant
Mariner East 2X
Red Bluff Pipeline
Frac VI

Further
deleveraging
expected
driven by
EBITDA1
growth
5.74x 5.66x
5.22x4.92x
STRONG FOCUS ON THE BALANCE SHEET AND LIQUIDITY
POSITION
Focus on liquidity and the balance sheet Improving leverage metrics
Liquidity position:
• As of September 30, 2017, the combined
partnership had borrowing capacity of up to
$6.25bn under its revolving credit facilities
• As of the same period ended, the partnership had
approximately $4bn borrowing capacity available
under its revolving credit facilities
Recent credit-supportive strategic actions:
• In August 2017, ETP priced a public offering of
common units for $1bn of proceeds. Proceeds
from the offering were used to repay amounts
outstanding under its RCF, to fund capex, and for
general partnership purposes
• In October 2017, ETP announced the closing of its
previously announced sale of a minority equity
interest in the Rover Pipeline project
• In November 2017, ETP raised $1.48 billion
through Series A and Series B Perpetual Preferred
Units. These securities are expected to receive
50% equity treatment from all three ratings
agencies
Debt/Adjusted EBITDA1
1 EBITDA and Adjusted EBITDA represents ETP consolidated on a last quarter annualized basis. See reconciliation of non-GAAP measures in the Appendix to this presentation. 28
29
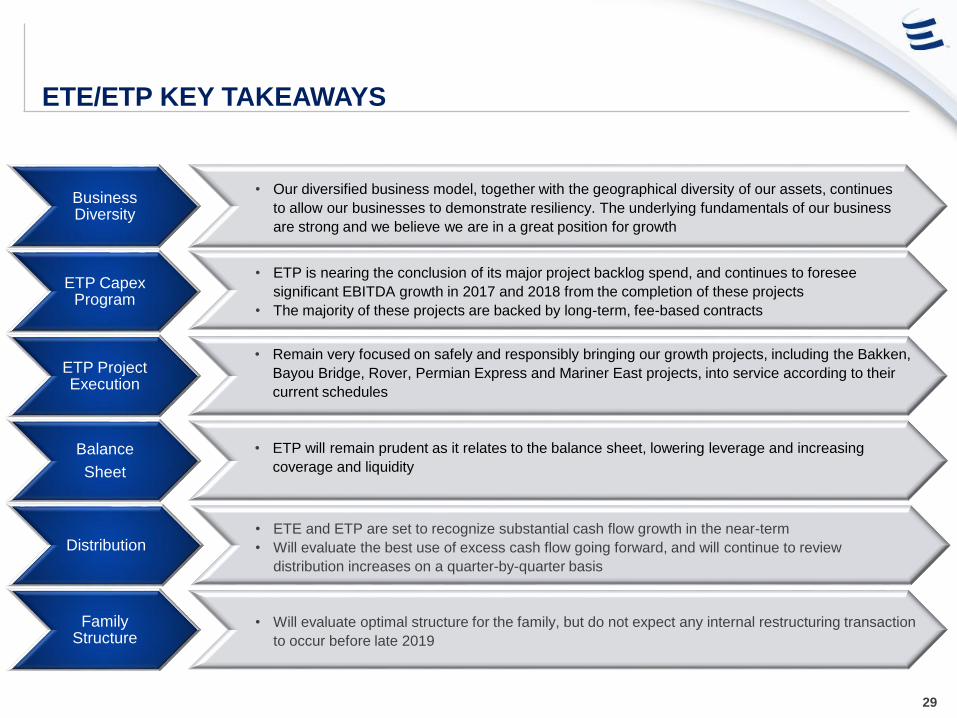
Business Diversity
ETP Capex Program
ETP Project Execution
Balance
Sheet
Distribution
Family Structure
• Our diversified business model, together with the geographical diversity of our assets, continues
to allow our businesses to demonstrate resiliency. The underlying fundamentals of our business
are strong and we believe we are in a great position for growth
• ETP is nearing the conclusion of its major project backlog spend, and continues to foresee
significant EBITDA growth in 2017 and 2018 from the completion of these projects
• The majority of these projects are backed by long-term, fee-based contracts
• Remain very focused on safely and responsibly bringing our growth projects, including the Bakken,
Bayou Bridge, Rover, Permian Express and Mariner East projects, into service according to their
current schedules
• Will evaluate optimal structure for the family, but do not expect any internal restructuring transaction
to occur before late 2019
ETE/ETP KEY TAKEAWAYS
• ETE and ETP are set to recognize substantial cash flow growth in the near-term
• Will evaluate the best use of excess cash flow going forward, and will continue to review
distribution increases on a quarter-by-quarter basis
• ETP will remain prudent as it relates to the balance sheet, lowering leverage and increasing
coverage and liquidity

APPENDIX

EXISTING IDR SUBSIDIES
31
Total IDR Reduction
March 31, 2017 $157,000
June 30, 2017 $162,000
September 30, 2017 $163,250
December 31, 2017 $173,250
FY 2017 $655,500
FY 2018 $153,000
FY 2019 $128,000
Total Through 2019 $936,500
(in thousands)

POST-MERGER SEGMENTS
32
Intrastate Transportation
and Storage
Interstate Transportation
and Storage
Midstream
Liquids Transportation and
Services
Investment in Sunoco
Logistics
All Other All Other
NGL and Refined Products
Crude Oil
Midstream
Interstate Transportation
and Storage
Intrastate Transportation
and Storage
Refined Products
Natural Gas Liquids
Crude Oil
ETP Segments
Pre-Merger
Segments
Post-MergerSXL Segments
Pre-Merger

NON-GAAP FINANCIAL MEASURES
33
Reconciliation of Non-GAAP Measures
Full Year
2015 Q1 Q2 Q3 Q4 YTD Q1 Q2 Q3 YTD
Net income (loss) 1,521$ 376$ 472$ 138$ (362)$ 624$ 364$ 292$ 761$ 1,417$
Interest expense, net 1,291 319 317 345 336 1,317 339 346 367 1,052
Gains on acquisitions - - - - (83) (83) - - - -
Impairment losses 339 - - 308 813 1,121 - - - -
Income tax expense (benefit) (123) (58) (9) (64) (55) (186) 55 79 (112) 22
Depreciation, depletion and amortization 1,929 470 496 503 517 1,986 560 557 596 1,713
Non-cash unit-based compensation expense 79 19 19 22 20 80 23 15 19 57
(Gains) losses on interest rate derivatives 18 70 81 28 (167) 12 (5) 25 8 28
Unrealized (gains) losses on commodity risk management activities 65 63 18 15 35 131 (64) (34) 81 (17)
Inventory valuation adjustments 104 26 (132) (37) (27) (170) (2) 58 (86) (30)
Losses on extinguishments of debt 43 - - - - - - - - -
Equity in (earnings) losses of unconsolidated affiliates (469) (76) (119) (65) 201 (59) (73) 61 (127) (139)
Adjusted EBITDA related to unconsolidated affiliates 937 219 252 240 235 946 239 247 279 765
Other, net (20) (16) (25) (43) (30) (114) (22) (47) (42) (111)
Adjusted EBITDA (consolidated) 5,714 1,412 1,370 1,390 1,433 5,605 1,414 1,599 1,744 4,757
Adjusted EBITDA related to unconsolidated affiliates (937) (219) (252) (240) (235) (946) (239) (247) (279) (765)
Distributable cash flow from unconsolidated affiliates 646 144 116 124 134 518 144 123 169 436
Interest expense, net (1,291) (319) (317) (345) (336) (1,317) (339) (346) (367) (1,052)
Current income tax (expense) benefit 325 1 (13) (11) 40 17 (1) (12) (9) (22)
Transaction-related income taxes (51) - - - - - - - - -
Maintenance capital expenditures (485) (59) (78) (97) (134) (368) (60) (107) (119) (286)
Other, net (24) (4) (2) 3 4 1 15 12 16 43
Distributable Cash Flow (consolidated) 3,897 956 824 824 906 3,510 934 1,022 1,155 3,111
Distributable Cash Flow attributable to PennTex Midstream Partners, LP (100%) - - - - (11) (11) (19) - - (19)
Distributions from PennTex Midstream Partners, LP to ETP - - - 8 8 16 8 - - 8
Distributable Cash Flow attributable to Sunoco LP (100%) (68) - - - - - - - - -
Distributions from Sunoco LP to ETP 24 - - - - - - - - -
Distributable cash flow attributable to noncontrolling interest in other consolidated subsidiaries (24) (8) (9) (11) (12) (40) (23) (57) (119) (199)
Distributable Cash Flow attributable to the partners of ETP 3,829 948 815 821 891 3,475 900 965 1,036 2,901
Transaction-related expenses 42 2 - 2 12 16 7 25 13 45
Distributable Cash Flow attributable to the partners of ETP, as adjusted 3,871$ 950$ 815$ 823$ 903$ 3,491$ 907$ 990$ 1,049$ 2,946$
Pro Forma for ETP/SXL Merger
20172016

NON-GAAP FINANCIAL MEASURES
34
In the following analysis of segment operating results, a measure of segment margin is reported for segments with sales revenues.
Segment Margin is a non -GAAP financial measure and is presented herein to assist in the analysis of segment operating results
and particularly to facilitate an understanding of the impacts that changes in sales revenues have on the segment performance
measure of Segment Adjusted EBITDA. Segment Margin is similar to the GAAP measure of gross margin, except that Segment
Margin excludes charges for depreciation, depletion and amortization.
In addition, for certain segments, the sections below include information on the components of Segment Margin by sales type
which components are included in order to provide additional disaggregated information to facilitate the analysis of Segment
Margin and Segment Adjusted EBITDA. For example, these components include transportation margin, storage margin, and other
margin. These components of Segment Margin are calculated consistent with the calculation of Segment Margin; therefore these
components also exclude charges for depreciation, depletion and amortization.
Following is a reconciliation of Segment Margin to operating income, as reported in the Partnership’s consolidated statements of
operations: