
ETL-200 Instructional Manual - CNBC Instructional Manual.pdfISCAN ETL-200 Instructions TABLE OF...
81
Last Revision Date: 8/4/11 OPERATING INSTRUCTIONS ETL-200 PRIMATE EYE TRACKING LABORATORY 21 Cabot Road Woburn, MA 01801 Tel. 781-932-1199 Fax: 781-932-1155 Email: [email protected] I SCAN INCORPORATED Eye & Target Tracking Instrumentation
Transcript of ETL-200 Instructional Manual - CNBC Instructional Manual.pdfISCAN ETL-200 Instructions TABLE OF...

Last Revision Date: 8/4/11
OPERATING INSTRUCTIONS
ETL-200 PRIMATE EYE TRACKING LABORATORY
21 Cabot Road Woburn, MA 01801
Tel. 781-932-1199 Fax: 781-932-1155
Email: [email protected]
I SCAN INCORPORATED
Eye & Target Tracking
Instrumentation

ISCAN ETL-200 Instructions
TABLE OF CONTENTS
i
Pages 1 - 2
Pages 3 - 4
Pages 5 - 10
Pages 11 - 18
Section 1: ETL-200 Components
Computer System ..................................................................................................................... 1 Eye Imaging System ................................................................................................................ 2
Section 2: ETL-200 Overview
Figure 1: ETL-200 Set-up ........................................................................................................ 3
Section 3: Setting Up the Tabletop System for Monocular Eye Tracking
Figure 1: ETL-200 Set-up ........................................................................................................ 5 Figure 2: Position of Eye Imager Unit (Side View) ................................................................ 6 Figure 3: Position of Eye Imager Unit (Top View) ................................................................. 6 Setting up the Eye Tracker Computer .................................................................................... 7 Figure 4: Interconnection of Circuit Boards in Back of Eye Tracker PC .............................. 8 Power Supply Configuration ................................................................................................... 8 Figure 5: Computer Front View .............................................................................................. 9 Figures 6A & 6B: Windows Start-up Screen & DQW Start-up Window .............................. 10
Section 4: Obtaining a Monocular Eye Image
Figure 7: ETL-200 DQW Main Window .................................................................................. 11 Figure 8: Monocular Eye Image Landmarks .......................................................................... 12 The Eye Imaging Camera Matrix and Eye Landmarks ........................................................ 13 Figure 9: Detailed View of Expanded On-screen Eye Monitor .............................................. 13 Obtaining an Eye Image .......................................................................................................... 14 Monocular Camera-to-Eye/Close-up Lens Chart ................................................................... 14 Figure 10: Camera & Pan/Tilt Controls .................................................................................. 15 Figure 11: Image Out of Focus ................................................................................................ 15 Figure 12: Eye Tracking Controls (1,2) ................................................................................... 16 Re Figure 12 (A) Threshold: Displays the threshold level of the detected
pupil and CR ............................................................................................... 17 Figure 13: Pupil Threshold Adjustment ................................................................................. 17 Re Figure 12 (B) Pupil Threshold Slider: Controls the threshold level of
the pupil ...................................................................................................... 17 Figure 14: Corneal Reflection Threshold Adjustment ........................................................... 18 Re Figure 12 (C) C.R. Threshold Slider: Controls the threshold level of
the corneal reflection .................................................................................. 18
ISCAN ETL-200 Instructions
TABLE OF CONTENTS
ii
Pages 19 - 26
Pages 27 - 32
Section 5: Tracking the Eye (Monocular Mode)
Figure 15: Good Tracking Eye Image with Threshold ........................................................... 19 Re Figure 12 (D) Pupil X-Hairs: Turns on/off pupil crosshair display .................................. 19 Re Figure 12 (E) C.R. X-Hairs: Turns on/off corneal reflection crosshair
display ......................................................................................................... 19 Figure 16: Pupil and CR Crosshairs On with Threshold Display Off ................................... 19 Adjusting the Eye Illumination ............................................................................................... 20 Figure 17: Adjusting the Infrared Illuminator to Optimize Eye Tracking ........................... 20 Figure 18: Adjusting the Iris Setting of the Eye Camera Lens ............................................. 21 Figure 19: Trackable Eye Image, Threshold & Crosshairs Enabled ..................................... 21 Re Figure 12 (F) C.R. Limit: Turns on/off pre-set limit for CR ............................................. 22 Figure 20: Image Gate ............................................................................................................. 22 Re Figure 12 (G) Image Gate: Turns on/off 2-dimensional image gate; eye
tracking is active only inside the gate boundaries .................................... 22 Figure 21: Eye Tracking Controls, Aux 1 Panel ..................................................................... 23 Figure 22: Aux 1 Setting Controls .......................................................................................... 23 Subjects Wearing Eyeglasses .................................................................................................. 24 Figure 23: Eyeglasses Reflections ........................................................................................... 24 Figure 24: Adjustments for Effect of Eyeglasses Reflections ................................................ 24 Tracking the Pupil vs. Tracking the Pupil and Corneal Reflection ...................................... 25 Tracking the Pupil ................................................................................................................... 25 Tracking the Pupil and Corneal Reflections ........................................................................... 25 Example of Differing Results with Pupil Alone vs. Pupil Minus Corneal Reflection ........... 26 Figure 25: Eye Tracking with Fixed Camera and Head Movement ..................................... 26
Section 6: Graph Display Controls
Figure 26: Graph Control & Display Area .............................................................................. 27 Graph Display Parameters Labels & Descriptions ................................................................ 29 Eye Tracker #1, #2, #3, & #4 ................................................................................................................................29 Eye Trigger State ...................................................................................................................................................30 Point-of-Regard (P.O.R.) Calibrator #1 & #2 ....................................................................................................30 Head Tracker Input Parameters ........................................................................................................................31 Auxiliary Serial Input Parameters .....................................................................................................................31 Auxiliary Digital Input Parameters ...................................................................................................................31 Auxiliary Digital Output Parameters ................................................................................................................32 Auxiliary Analog Input Parameters ...................................................................................................................32 Eye Tracker #1 & #2 - Eye Angle Output Parameters (After Eye Angle Calibration) ............................32

ISCAN ETL-200 Instructions
TABLE OF CONTENTS
iii
Pages 33 - 58 Section 7: DQW Software Features and Functions
A. Eye Angle Calibration ......................................................................................................... 33 Figure 27: Eye Angle Calibration Points ......................................................................... 34 Figure 28: Tracker #1 Configuration Panel ..................................................................... 34 Figure 29: Eye Angle Calibration Controls ...................................................................... 35 Figure 30: Eye Angle Calibration DQW Window ............................................................ 35 Figure 31: Eye Angle Center Point Calibration ............................................................... 36 Figure 32: Eye Angle Left Point Calibration ................................................................... 37 Figure 33: Eye Angle Calibration of Right, Up, and Down Points ................................. 37 Figure 34: Reset to Activate Eye Angle ............................................................................ 38 Figure 35: Eye Angle Graphing Functions ....................................................................... 38
B. Blink Monitoring Subsystem .............................................................................................. 39 Figure 36: Blink Monitor Configuration Panel ................................................................ 39 Figure 37: Blink Controls Enabled ................................................................................... 40 Figure 38: Blink Control Panel ......................................................................................... 40
C. Fixation Monitoring Subsystem ......................................................................................... 41 Figure 39: Fixation Trigger Configuration Panel ............................................................ 41 Figure 40: Eye Trigger Output Controls .......................................................................... 42
D. Analog Outputs ................................................................................................................... 43 Selecting Analog Outputs ................................................................................................. 43 Figure 41: Analog Output Control Panel ......................................................................... 43 Figure 42: Select Analog Output Parameters .................................................................. 43 Figure 43: Analog Output Parameters & Graph Displays .............................................. 44 Configuring the Analog Outputs ...................................................................................... 45 Figure 44: Analog Inputs & Outputs Control Panel ........................................................ 45
E. Serial I/O .............................................................................................................................. 46 Example of How to Use Serial Port .................................................................................. 46 Figure 45: Serial I/O Configuration Panel ....................................................................... 45 Figure 46: Serial Output Controls Panel ......................................................................... 47
F. Digital I/O ............................................................................................................................ 48 Figure 47: ISCAN Digital I/O Connector ......................................................................... 48 Figure 48: Digital I/O Configuration Panel ...................................................................... 49 Figure 49: Digital Output Controls Panel ........................................................................ 49 Figure 50: Digital Output Bit Selection ........................................................................... 50
G. Data Recording .................................................................................................................... 51 Figure 51: Data Recording Control Panel ........................................................................ 51 Figure 52: Data Recording Parameters Bank .................................................................. 52 Recording Configuration Panel ......................................................................................... 53 Figure 53: Recording Configuration Panel ....................................................................... 53

ISCAN ETL-200 Instructions
TABLE OF CONTENTS
iv
Pages 59 - 63
Page 64
Pages 33 - 58 Section 7: DQW Software Features and Functions
Example of Recording and Reading Data ........................................................................ 55 Figure 54: Data Recording Controls Info ......................................................................... 55 Figure 55: Save TDA Data in File .................................................................................... 56 Figure 56: Saving Data as Test.TDA ................................................................................ 56 Figure 57: Open WordPad ................................................................................................. 57 Figure 58: Test.TDA Data ................................................................................................. 58
Section 8: Saving and Retrieving Configuration Settings
Updateable Definition Files .................................................................................................... 59 Saving Definition Files ............................................................................................................ 59 Figure 59: Save As a DEF File ................................................................................................ 59 Figure 60: Save a Unique DEF File ........................................................................................ 60 Retrieving DQW Settings Via Definition Files ...................................................................... 60 Figure 61: Retrieve a DEF File ............................................................................................... 60 Figure 62: Restore DQW Settings with a DEF File ............................................................... 61 Retrieving DQW Settings Via Definition Files ...................................................................... 61 Factory Definition File System Configuration Setting .......................................................... 62
Section 9: IR Irradiance and Safety
Eye-to-Illuminator Distances .................................................................................................. 64

ISCAN ETL-200 Instructions
TABLE OF CONTENTS
v
Pages 65 - 75 Section 10: ETL-200 Appendices
Appendix A: ETL-200 High-speed Operation ......................................................................... 65 120 Hz Operation ............................................................................................................... 65 Figure A.1: 120 Hz System Configuration ....................................................................... 65 Figure A.2: Camera Set to 120 Hz .................................................................................... 65 240 Hz Operation ............................................................................................................... 66 Figure A.3: 240 Hz System Configuration ....................................................................... 66 Figure A.4: Camera Set to 240 Hz .................................................................................... 66 Eye Camera Speed Mismatch ........................................................................................... 67 Figure A.5: Eye Camera Plugged into Wrong Port .......................................................... 67
Appendix B: Eye and Room Monitor ....................................................................................... 68 Adding a Room Monitor .................................................................................................... 68 Figure B.1: Room Monitor Connected .............................................................................. 68 Figure B.2: Room Monitor Enlarged ................................................................................ 69 Eye & Room Monitor Settings .......................................................................................... 69 Figure B.3: On-Screen Video Display Monitor Configuration Panel .............................. 69
Appendix C: Serial I/O ............................................................................................................. 71 Auxiliary Serial Output Formats ..................................................................................... 71 ISCAN Serial Output Format (ASCII) ............................................................................. 71 Binary Output Format ...................................................................................................... 71 Remote Serial Controls ..................................................................................................... 72 Remote Serial Command Bytes ........................................................................................ 72
Appendix D: Optional 24-bit Digital I/O ................................................................................. 73 Figure D.1: DIO24 Configuration Panel .......................................................................... 73 Figure D.2: Digital Output Controls using 24-bit Card .................................................. 73 Figure D.3: Digital IO Configuration Panel ..................................................................... 74 Figure D.4: Digital Output Controls for Params Out ...................................................... 74 Figure D.5: 37-pin D-sub Connector Pin-Out Diagram.................................................... 75
ISCAN ETL-200 Instructions
Section 1: ETL-200 Components 1
Section 1: ETL-200 Components
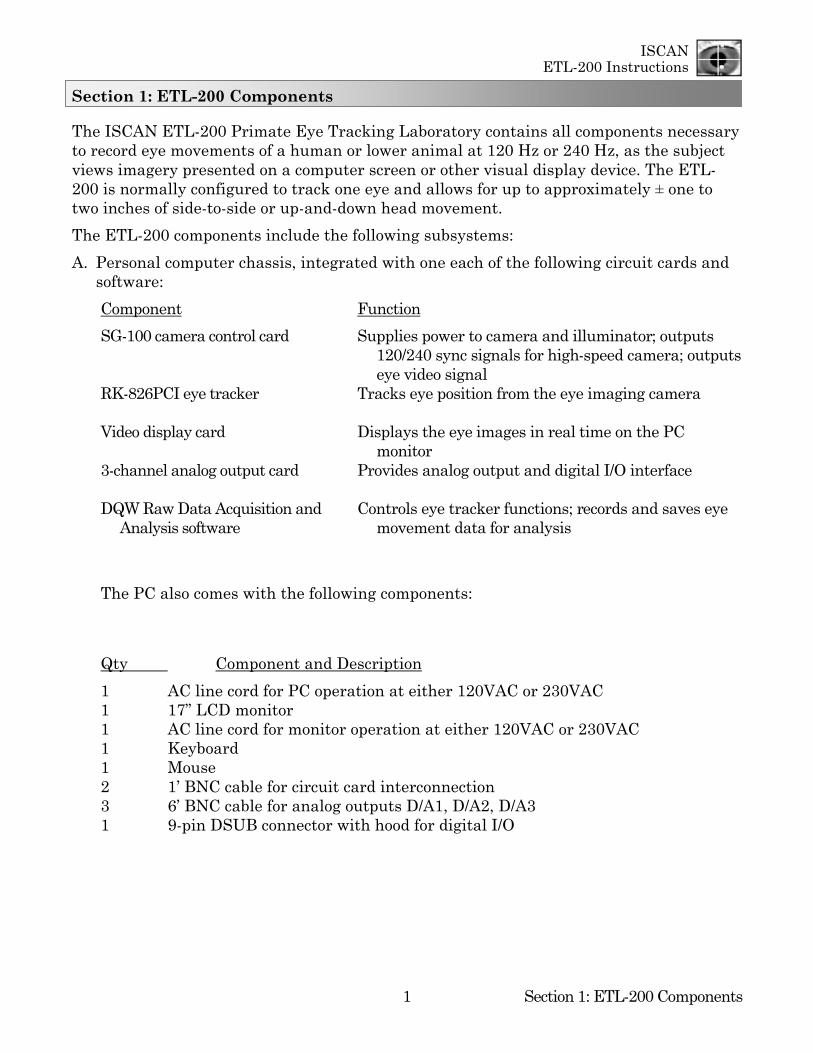
The ISCAN ETL-200 Primate Eye Tracking Laboratory contains all components necessary to record eye movements of a human or lower animal at 120 Hz or 240 Hz, as the subject views imagery presented on a computer screen or other visual display device. The ETL-200 is normally configured to track one eye and allows for up to approximately ± one to two inches of side-to-side or up-and-down head movement.
The ETL-200 components include the following subsystems:
A. Personal computer chassis, integrated with one each of the following circuit cards and software:
Component
SG-100 camera control card RK-826PCI eye tracker Video display card 3-channel analog output card DQW Raw Data Acquisition and
Analysis software
Function
Supplies power to camera and illuminator; outputs 120/240 sync signals for high-speed camera; outputs eye video signal
Tracks eye position from the eye imaging camera Displays the eye images in real time on the PC
monitor Provides analog output and digital I/O interface Controls eye tracker functions; records and saves eye
movement data for analysis
The PC also comes with the following components:
Qty Component and Description
1 AC line cord for PC operation at either 120VAC or 230VAC 1 17” LCD monitor 1 AC line cord for monitor operation at either 120VAC or 230VAC 1 Keyboard 1 Mouse 2 1’ BNC cable for circuit card interconnection 3 6’ BNC cable for analog outputs D/A1, D/A2, D/A3 1 9-pin DSUB connector with hood for digital I/O

ISCAN ETL-200 Instructions
Section 10: ETL-200 Appendices 2
B. Tabletop Eye Imager, comprised of the following items:
• Eye imaging camera • Manual zoom/focus/iris lens • Infrared illuminator • Pan/tilt unit positions on tabletop base • 55mm close-up lens set (+1, +2, +4 diopter set) • 25’ camera cable connecting camera unit to SG-100 camera control card in PC • 25’ pan/tilt cable with hand controller • Pan/tilt mounting bracket
ISCAN ETL-200 Instructions
Section 2: ETL-200 Overview 3
Section 2: ETL-200 Overview
The ISCAN ETL-200 Primate Eye Tracking Laboratory images and tracks one eye of a human subject or lower animal at an operator-selected sampling rate of 120 Hz or 240 Hz.
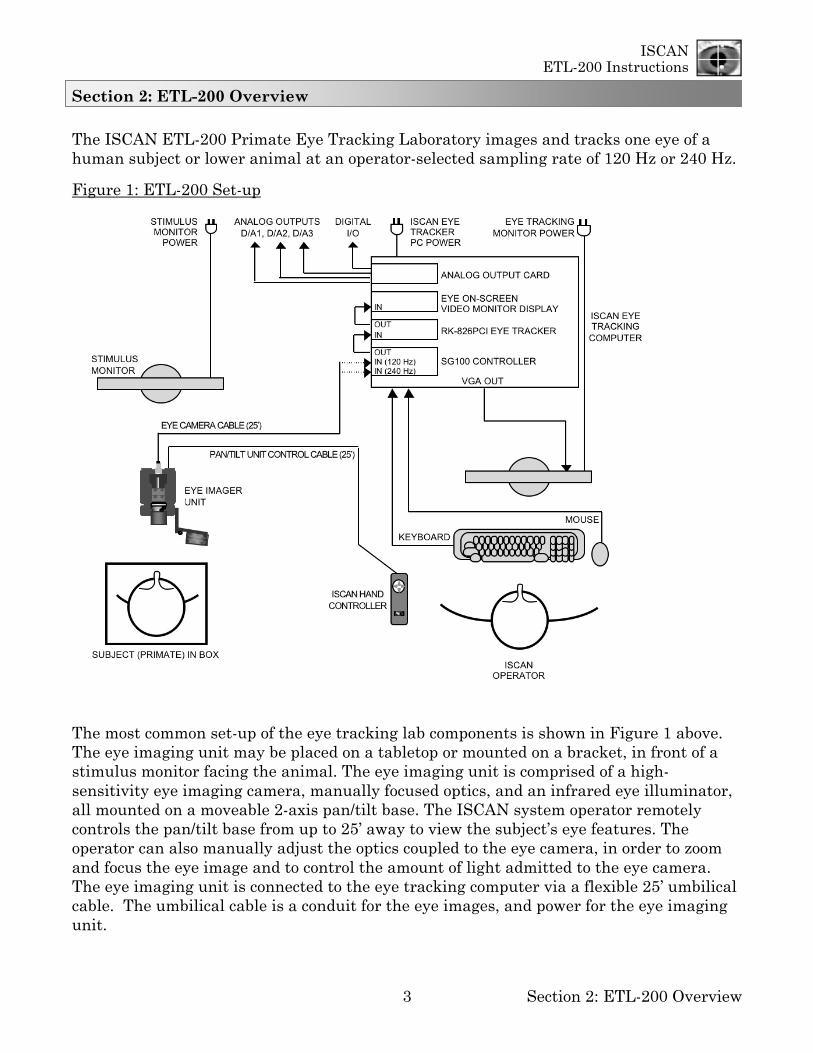
Figure 1: ETL-200 Set-up
The most common set-up of the eye tracking lab components is shown in Figure 1 above. The eye imaging unit may be placed on a tabletop or mounted on a bracket, in front of a stimulus monitor facing the animal. The eye imaging unit is comprised of a high-sensitivity eye imaging camera, manually focused optics, and an infrared eye illuminator, all mounted on a moveable 2-axis pan/tilt base. The ISCAN system operator remotely controls the pan/tilt base from up to 25’ away to view the subject’s eye features. The operator can also manually adjust the optics coupled to the eye camera, in order to zoom and focus the eye image and to control the amount of light admitted to the eye camera. The eye imaging unit is connected to the eye tracking computer via a flexible 25’ umbilical cable. The umbilical cable is a conduit for the eye images, and power for the eye imaging unit.

ISCAN ETL-200 Instructions
Section 2: ETL-200 Overview 4
The umbilical cable connects to the SG100 camera control card in the bottom slot of the eye tracker PC. The camera control card generates power for the eye camera, optics, IR illuminator and pan/tilt unit.
The eye images are input to the RK-826PCI eye tracker processor card, which automatically tracks the eye landmarks present in the eye images generated by the eye imaging camera. The output of the eye tracker is input to the eye monitor that displays an on-screen video image of the eye being tracked in the ISCAN software window.
The ISCAN data acquisition and control software (DQW) displays graphical representations of the pupil size and eye position. Analog and serial real-time outputs of the eye position and pupil size may be appropriately scaled by the operator for interface to a variety of psycho-visual stimuli software such as Cortex, or acquired by data acquisition software like MatLab.

ISCAN ETL-200 Instructions
Section 3: Setting Up the System 5
Section 3: Setting Up the Tabletop System for Monocular Eye Tracking
All connectors are labeled so as to exactly match each end, cable to component. Set up all the components as shown in Figure 1 below. Please note: ISCAN does not include a stimulus monitor. This must be provided by the researcher.
Figure 1: ETL-200 Set-up

ISCAN ETL-200 Instructions
Section 3: Setting Up the System 6
PAN/T
IR ILLUMINATOR EYE IMAGER UNIT
LOWER PRIMATE IN BOX OR HUMAN SUBJECT
20” / 51cm
25’ UMBILICAL CABLE
CLOSE-UP LENS
29” / 74cm
CAMERA HEAD
17” DIAGONAL STIMULUS MONITOR
29” / 74cm
17” DIAGONAL STIMULUS MONITOR
EYE IMAGER UNIT: Camera & Optics, mounted on Pan/Tilt, mounted on Base
CLOSE-UP LENS
Lower Primate in Box or Human Subject
20” / 51cm
Position the eye imaging unit in front of the stimulus monitor. Use Figures 2 and 3 below as a guide to positioning the eye imaging unit with respect to the stimulus monitor.
Figure 2: Position of Eye Imager Unit (Side View)
Figure 3: Position of Eye Imager Unit (Top View)

ISCAN ETL-200 Instructions
Section 3: Setting Up the System 7
Connect the black 15-pin high-density female connector at the end of the eye camera cable marked RK-264 into the back of the eye imaging unit
Connect the silver 7-pin DIN connector labeled PTU IN to the back of the eye imaging unit.
Note that the above two cables are encased in a black split-loom sleeve for protection from crushing.
Connect the ISCAN hand controller to the black 7-pin DIN connector labeled PTU OUT.
Setting Up the Eye Tracker Computer
Set up the eye tracker PC chassis as shown in Figure 1, referring also to Figure 4 below, showing the interconnect of the circuit cards in the eye tracker PC.
Figure 4: Interconnection of Circuit Boards in Back of Eye Tracker PC

ISCAN ETL-200 Instructions
Section 3: Setting Up the System 8
Connect the eye tracker PC 17” LCD monitor to the VGA output port of the computer chassis labeled “Connect PC VGA Monitor Here Only.”
Connect the AC line cord to the monitor.
Connect the mouse to an open USB port in the back of the PC.
Connect the keyboard to an open USB port in the back of the PC.
Connect the AC line cord to the power connection receptacle in the back of the PC.
Connect the black 15-pin high-density D-SUB male connector from the eye camera cable (Figure 4 above), labeled “Eye Imager In,” to the 120 Hz port of the SG100 camera control card. (The SG100 is normally located in the bottom slot of the eye tracker PC chassis.)
Using the 1’ BNC cable labeled “Eye Camera Video Out” on one end and “RK-826PCI Video In” on the other, connect the BNC output on the SG100 card (in the bottom PC slot) to the input of the RK-826PCI eye tracker card labeled “RK-826PCI Video In.” The RK-826PCI eye tracker is usually mounted in the second slot, directly above the SG100 camera control card.
Connect the RK-826PCI Video Out connector to the “Eye Monitor In” connector in the on-screen video display card in the third slot. Use the 1’ BNC cable labeled “RK-826PCI Video Out” on one end and “Eye Monitor Video In” on the other.
Connect the three 6’ BNC cables labeled “D/A 1,” “D/A 2,” “D/A 3” to the appropriate BNC connectors on the ISCAN D/A output card. This card is normally located three slots above the on-screen video image display. These analog outputs may be directly connected to the analog inputs of Cortex, or integrated with Matlab or any other appropriate data acquisition software or hardware.
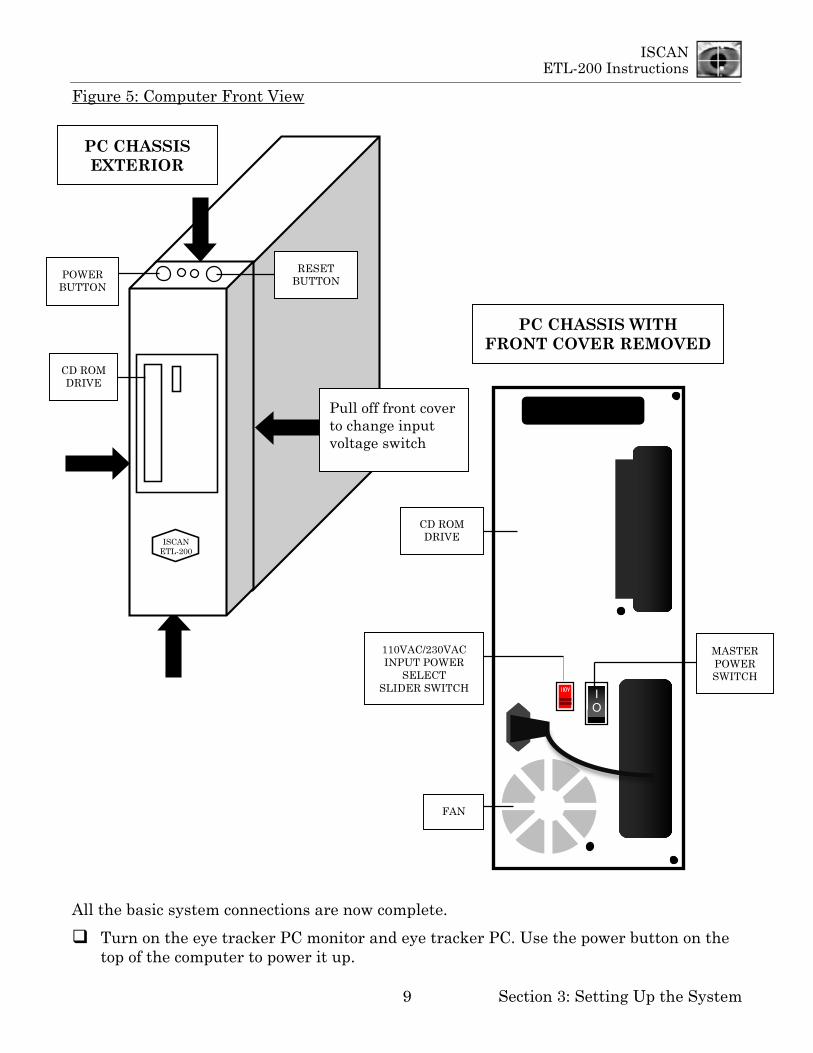
The computer chassis is normally configured for 120 VAC power input for use in North American and Japan. If the system is shipped to the rest of Asia or to Europe, the power supplies are configured for 230 VAC, and a label above the power receptacle will indicate this. If it is necessary to configure the PC for 230 VAC input, unsnap the front cover and push up the voltage selection switch as shown in Figure 5 below.
Plug in the PC and the PC monitor to the appropriate electrical outlet.
Warning: Do not apply 230 VAC to the PC chassis if the voltage selection switch reads 110V. This will result in damage to the computer power supply, and possibly the eye tracking circuit cards.
ISCAN ETL-200 Instructions
Section 3: Setting Up the System 9
FAN
I O
CD ROM DRIVE
MASTER POWER SWITCH
110VAC/230VAC INPUT POWER
SELECT SLIDER SWITCH
PC CHASSIS WITH FRONT COVER REMOVED
ISCAN ETL-200
RESET BUTTON
POWER BUTTON
CD ROM DRIVE
Pull off front cover to change input voltage switch
PC CHASSIS EXTERIOR
Figure 5: Computer Front View
All the basic system connections are now complete.
Turn on the eye tracker PC monitor and eye tracker PC. Use the power button on the top of the computer to power it up.

ISCAN ETL-200 Instructions
Section 3: Setting Up the System 10
The eye tracker PC will start up, and after a brief interval a Windows 7 start-up screen should appear looking like this:
Figure 6A: Windows Start-up Screen
Check that all components have power, looking for the green light on the back of the eye imaging system, and using the remote hand controller to move the pan/tilt unit.
Note that there is an ISCAN ETL-200 software icon.
Click on the ISCAN ETL-200 icon to open the DQW eye tracking control software.
The DQW software window will start up looking like something like this:
Figure 6B: DQW Start-up Window
The presence of an image (even a blurry one) in the Eye Monitor panel means that the eye camera is operating. (A black Eye Monitor may simply mean the camera iris is closed; see Figure 10 to identify the iris controller.) The next section will discuss how to obtain a high-quality eye image that can be tracked.

ISCAN ETL-200 Instructions
Section 4: Obtaining a Monocular Eye Image 11
Section 4: Obtaining a Monocular Eye Image
With the ISCAN DQW software main window now open, this section will discuss the tools and techniques involved in obtaining a clear, in-focus eye image:
Figure 7: ETL-200 DQW Main Window

ISCAN ETL-200 Instructions
Section 4: Obtaining a Monocular Eye Image 12
Figure 7 shows the DQW main window configured for monocular eye tracking. The eye tracking controls panel is located in the upper left quadrant of the DQW control window and is labeled (1).
First, set both the pupil and corneal reflection threshold levels to zero. (There will be discussion of these functions later in the manual.) Use the mouse to drag the pupil threshold slider and the corneal reflection CR slider to the lowest point of the slider controls. The number 0 should be present in both boxes below the sliders.
On the top right-hand side of the DQW window is a panel labeled Eye Monitor. The video from the eye imager camera runs through the RK-826PCI eye tracker card and is displayed in the eye monitor.
In the upper right of the eye monitor display there is a small click box. Clicking on this box will expand the monitor image to fill in the area of the graph display controls (7).
Click on the box to expand the eye image display so the eye can be clearly viewed.
Figure 8: Monocular Eye Image Landmarks
The eye monitor display will present an image of the left or right eye when the eye camera unit has been adjusted to obtain a clear, in-focus image of the subject’s eye. The image will be adjusted to look similar to that shown in Figure 8 above. Again, note that both the pupil and corneal reflection threshold levels are set to zero at this time, the lowest setting.
The excellent eye image shown in Figure 8 is the result of the system operator properly aligning the positions of the eye camera and illuminator to point at the eye, precisely adjusting the zoom and focus of the eye imaging lens, and adjusting the iris setting or aperture of the eye imaging lens to allow enough light to enter the camera for a clear, high-contrast image of the pupil, iris and corneal reflection.
Figure 8 has the expanded view of the eye image to show clearly the landmarks. With the eye illuminated by the infrared (IR) light source mounted on the eye imager unit, the pupil appears as a dark hole or sink to the infrared light. The IR illuminator also generates a
ISCAN ETL-200 Instructions
Section 4: Obtaining a Monocular Eye Image 13
bright spot off the cornea, (the curved anterior portions in front of the pupil). The bright spot is called the corneal reflection (CR).
The Eye Imaging Camera Matrix and Eye Landmarks
Monocular eye images similar to that shown above are input to the RK-826PCI eye tracker card, which detects the dark pupil and bright corneal reflection data present in the eye images. To track the eye in real time, the RK-826PCI eye tracking card processes the video signal representing the eye images generated by the eye imaging camera. The images of the eye contain dark video information corresponding to the pupil of the eye and bright video information corresponding to the corneal reflection.
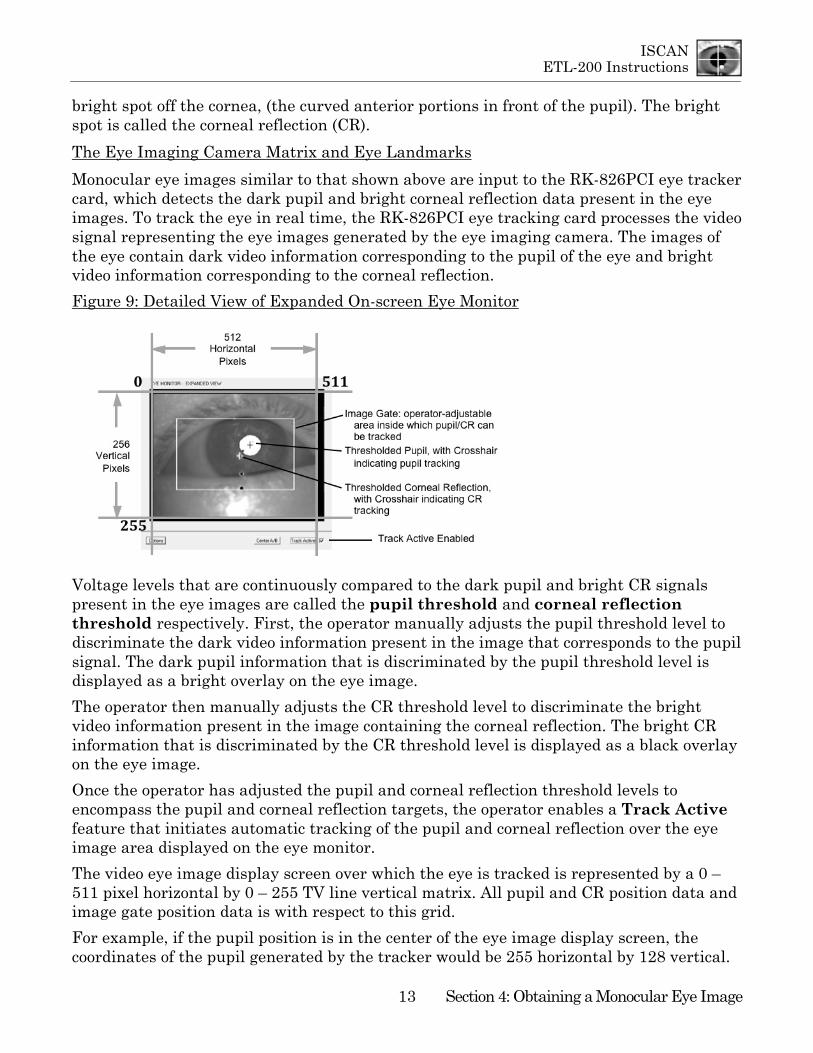
Figure 9: Detailed View of Expanded On-screen Eye Monitor
Voltage levels that are continuously compared to the dark pupil and bright CR signals present in the eye images are called the pupil threshold and corneal reflection threshold respectively. First, the operator manually adjusts the pupil threshold level to discriminate the dark video information present in the image that corresponds to the pupil signal. The dark pupil information that is discriminated by the pupil threshold level is displayed as a bright overlay on the eye image.
The operator then manually adjusts the CR threshold level to discriminate the bright video information present in the image containing the corneal reflection. The bright CR information that is discriminated by the CR threshold level is displayed as a black overlay on the eye image.
Once the operator has adjusted the pupil and corneal reflection threshold levels to encompass the pupil and corneal reflection targets, the operator enables a Track Active feature that initiates automatic tracking of the pupil and corneal reflection over the eye image area displayed on the eye monitor.
The video eye image display screen over which the eye is tracked is represented by a 0 – 511 pixel horizontal by 0 – 255 TV line vertical matrix. All pupil and CR position data and image gate position data is with respect to this grid.
For example, if the pupil position is in the center of the eye image display screen, the coordinates of the pupil generated by the tracker would be 255 horizontal by 128 vertical.

ISCAN ETL-200 Instructions
Section 4: Obtaining a Monocular Eye Image 14
The coordinates for the upper left corner of the eye image display screen are 0H, 0V and the lower right corner of the screen coordinate values are 511H, 255V.
Another feature shown in Figure 9 above is the image gate. This box is a 2-dimensional window displayed on the eye image display screen. The eye threshold and eye tracking features are active only within the gated area. The image gate can be turned off by the operator for eye tracking over the full extent of the eye camera’s field of view.
Obtaining An Eye Image
Please refer to Figures 2 and 3 in Section 3, and have a human or lower primate subject in front of the eye imager unit. Have a cooperative subject sitting relatively still or in a monkey box in front of the eye imager unit, as shown in Figure 2. Be sure to remove the lens cap that is installed over the end of the lens assembly prior to shipment.
Make sure that the proper close-up lens is attached to the front of the eye camera optics. The close-up lens set included with the ETL-200 contains a +1, +2, and +4 diopter close-up lens. For normal monocular operation, with the end of camera-to-eye distance of approximately 20”, a +2 lens screwed onto the end of the eye camera optics is required.
If the subject is closer than the normal working distance of 20 inches, use a higher diopter lens or combination of lenses to focus at this nearer distance.
A typical camera-to-eye distance/close-up chart for the monocular eye imaging configuration is shown below. In all these measurements, zoom of lens is set to maximum.
Eye-to-Camera Distance Range Diopter
20” – 30” (51 cm – 77 cm) +1 14” – 20” (36 cm – 51 cm) +2 12” – 14” (31 cm – 36 cm) +1, +2 (so as to equal +3) 6” – 12” (16 cm – 31 cm) +4
The ISCAN hand controller, and manual adjustment of the eye imager lens provide the adjustments necessary to pan the eye imager unit left and right and tilt the unit up and down, to initially position the eye camera to view the eye. The manual camera lens controls [Figure 10] allow the operator to zoom the images in and out, focus the eye images, and control the iris setting on the optics, allowing more or less of the incident infrared light illuminating the eye to be admitted to the camera. The camera lens controls must be used by the operator to obtain clear, in-focus, high-contrast images of the eye.

ISCAN ETL-200 Instructions
Section 4: Obtaining a Monocular Eye Image 15
Figure 10: Camera & Pan/Tilt Controls
With the subject seated or lower primate in its box, adjust the zoom control to obtain an image size of the area of the face as shown in Figure 11.
Figure 11: Image Out of Focus
Feel free to experiment with the zoom, focus, iris and pan/tilt controls thus far mentioned (See Figure 10) to obtain a recognizable monocular eye image. If the image is too dark or too light, manually open the iris (to brighten the image) or close the iris (to dim the image). The proper iris settings are described in detail in Section 5. It is easier to understand how to achieve the optimal iris adjustment during the actual eye tracking procedure described in Section 5.

ISCAN ETL-200 Instructions
Section 4: Obtaining a Monocular Eye Image 16
Move the pan/tilt by pressing the right/left/up/down arrows on the pan/tilt controller to adjust the eye camera so the eye is clearly within the image gate area. Roughly center the eye imaging camera’s field of view on the subject’s eye. Pressing the right pan/tilt control arrow moves the pan/tilt to the right. Pressing the left pan/tilt control arrow moves the pan/tilt to the left. Pressing the up pan/tilt control arrow moves the pan/tilt up. Pressing the down pan/tilt control arrow moves the pan/tilt down.
Adjust the focus near and far on the lens to obtain a clear, in-focus image of the eye as seen previously in Figure 8.
The eye tracker controls are located in the upper left hand side of the DQW main software window. The control panel is configured for monocular eye tracking and contains all the functional adjustments necessary to threshold and track the pupil and corneal reflection targets.
Figure 12: Eye Tracking Controls (1,2)
In the monocular configuration, the above controls function for one eye. As shown in Figure 12 above, there are controls for the following functions:
A) Threshold: Displays the threshold level of the detected pupil and CR. B) Pupil Threshold Slider: Controls the threshold level of the pupil. C) C.R. Threshold Slider: Controls the threshold level of the corneal reflection. D) Pupil X-Hairs: Turns on/off pupil crosshair display. E) C.R. X-Hairs: Turns on/off corneal reflection crosshair display. F) C.R. Limit: Turns on/off pre-set limit for CR. G) Image Gate: Turns on/off 2-dimensional image gate; eye tracking is active only inside
the gate boundaries. H) Automatic Threshold.
ISCAN ETL-200 Instructions
Section 4: Obtaining a Monocular Eye Image 17
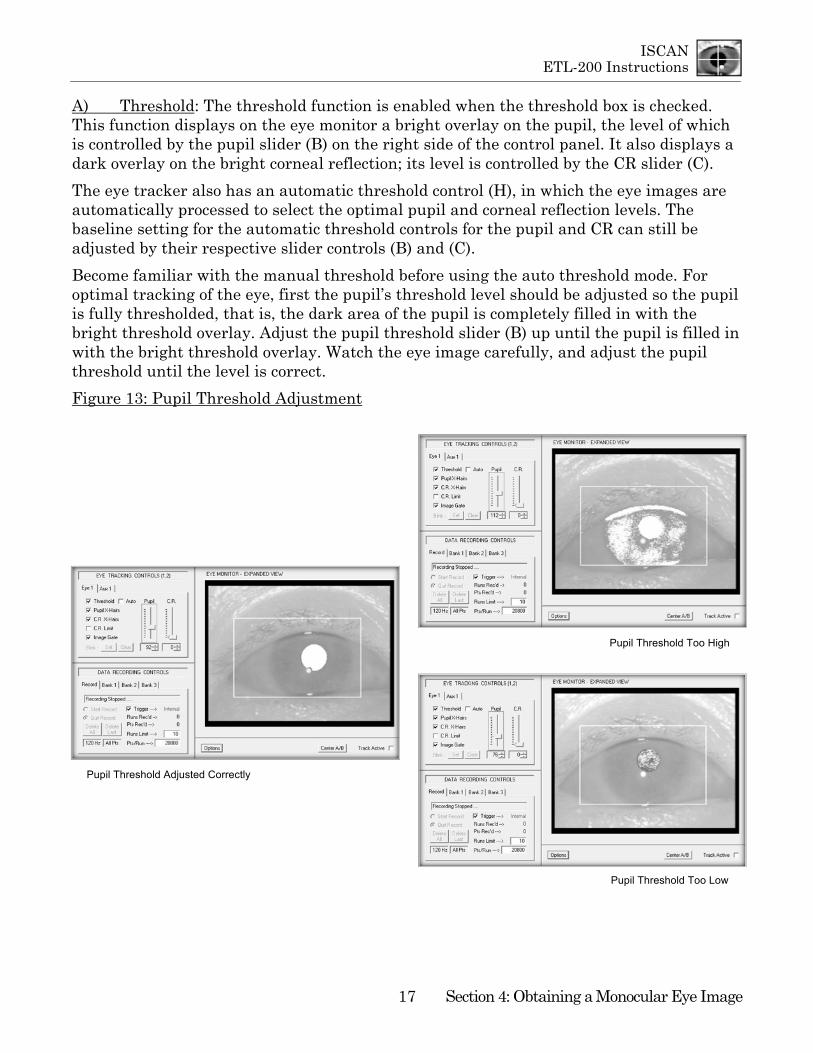
Pupil Threshold Adjusted Correctly
Pupil Threshold Too High
Pupil Threshold Too Low
A) Threshold: The threshold function is enabled when the threshold box is checked. This function displays on the eye monitor a bright overlay on the pupil, the level of which is controlled by the pupil slider (B) on the right side of the control panel. It also displays a dark overlay on the bright corneal reflection; its level is controlled by the CR slider (C).
The eye tracker also has an automatic threshold control (H), in which the eye images are automatically processed to select the optimal pupil and corneal reflection levels. The baseline setting for the automatic threshold controls for the pupil and CR can still be adjusted by their respective slider controls (B) and (C).
Become familiar with the manual threshold before using the auto threshold mode. For optimal tracking of the eye, first the pupil’s threshold level should be adjusted so the pupil is fully thresholded, that is, the dark area of the pupil is completely filled in with the bright threshold overlay. Adjust the pupil threshold slider (B) up until the pupil is filled in with the bright threshold overlay. Watch the eye image carefully, and adjust the pupil threshold until the level is correct.
Figure 13: Pupil Threshold Adjustment

ISCAN ETL-200 Instructions
Section 4: Obtaining a Monocular Eye Image 18
CR Threshold Adjusted Correctly
CR Threshold Too High
CR Threshold Too Low
Next, the CR threshold control must be adjusted to detect and fill in the small bright corneal reflection generated by the reflection of the IR light source off the cornea. The images below show the proper level of the CR threshold, adjusted using the CR slider control (C). Note that there is a dark threshold overlay covering the bright corneal reflections when the CR threshold level is properly adjusted. The following eye images illustrate a CR level that is too low and a level that is too high.
Figure 14: Corneal Reflection Threshold Adjustment

ISCAN ETL-200 Instructions
Section 5: Tracking the Eye (Monocular) 19
Section 5: Tracking the Eye (Monocular Mode)
When the pupil and corneal reflection threshold levels are set in the proper range, enable Track Active [Figure 7 (4)] and the Pupil X-Hairs function [Figure 12 (D)]. The Track Active control button enables the eye tracking and graph display functions [Figure 7 (7)]. With both Track Active and the Pupil X-Hairs enabled, you will see a black crosshair centered over the pupil. The black crosshair is displayed on top of the bright threshold overlay. With the CR X-Hairs function turned on [Figure 12 (E)], the eye image should look like the image in Figure 15.
Figure 15: Good Tracking Eye Image with Threshold
The Pupil X-Hair function [Figure 12 (D)] turns on and off the pupil crosshair. If the crosshair is present over the pupil and is solidly locked on the center of the pupil as the subject looks around, the RK-826PCI eye tracker card is properly tracking the pupil. Note that the crosshair appears dark when the threshold function [Figure 12 (A)] is enabled and it turns bright when the threshold function is turned off. (See Figure 16 below.)
The CR X-Hair function [Figure 12 (E)] turns on and off the corneal reflection crosshair. If the crosshair is present over the small bright CR and is solidly locked on the center of the CR as the subject looks around, the RK-826PCI eye tracker card is properly tracking the CR. Note that the crosshair appears bright when the threshold function [Figure 12 (A)] is enabled and it turns dark when the threshold function is turned off. (See Figure 16 below.)
Figure 16: Pupil and CR Crosshairs On with Threshold Display Off

ISCAN ETL-200 Instructions
Section 5: Tracking the Eye (Monocular) 20
Turning off the threshold display changes the color of both crosshairs. With the Threshold Display off [Figure 12 (A)], the pupil crosshairs become bright and the CR crosshairs turn black.
Adjusting the Eye Illumination
The ETL-200 has an adjustable illuminator, in order to redirect the infrared (IR) light source so it is aimed at the orbital area. While watching the eye monitor, adjust the infrared light source so it is pointed directly at the subject’s eye, providing balanced illumination of both sides of the eye. The illuminator can be adjusted to move freely by loosening the two thumbscrews holding it to the camera lens. To ensure that the light is pointing at the eye, the subject should be able to glance at the illuminator and see a reflection of his/her eye in the red plastic cover.
Figure 17: Adjusting the Infrared Illuminator to Optimize Eye Tracking
Once the illuminator has been properly positioned, tighten down the two thumbscrews so it is securely fastened to the side of the camera lens.
With the IR illuminator properly positioned to balance the amount of light on the tracked eye, it may also be necessary to adjust the iris (the aperture of the eye camera lens) to admit enough light to generate a clear, high-contrast image of the pupils.
Manually adjust the iris control (see Figure 10) to open the iris so the pupil is clear and in focus, as in Figure 18 below.

ISCAN ETL-200 Instructions
Section 5: Tracking the Eye (Monocular) 21
Figure 18: Adjusting the Iris Setting of the Eye Camera Lens
If the iris is closed down too much, the eye image will appear dim and the pupil will be over-thresholded. If the iris is open too much, an excessive amount of IR light is entering the camera and the bright corneal reflection will have a halo around it, obscuring part of the pupil.
The image below shows what a good eye image looks like with the threshold and crosshairs functions enabled. As the subject looks around the center ±20 degrees of the environment, the pupil crosshairs and corneal reflection crosshairs should be solidly tracking their respective targets.
Figure 19: Trackable Eye Image, Threshold & Crosshairs Enabled
IMPORTANT: Getting a good trackable eye image is possible with virtually every subject, by using a combination of the iris control, properly focusing the image, and adjusting the pupil and corneal reflection threshold levels.
ISCAN ETL-200 Instructions
Section 5: Tracking the Eye (Monocular) 22
The C.R. Limit function [Figure 12 (F)] enables a user-programmable search area around the pupil for detection of the CR. This function can be used if there are other bright corneal reflection candidates that may compete for detection as a CR target. This function is normally disabled in normal system operation.
Having turned the function on, adjusting the CR limit requires leaving the Eye 1 panel and clicking on the AUX 1 tab to the right of the Eye 1 tab. The C.R. % numbers can be adjusted to detect the corneal reflection with a +/-% of the pupil horizontal and vertical size. The default detection area is 150% of the pupil horizontal and 150% of the pupil vertical size.
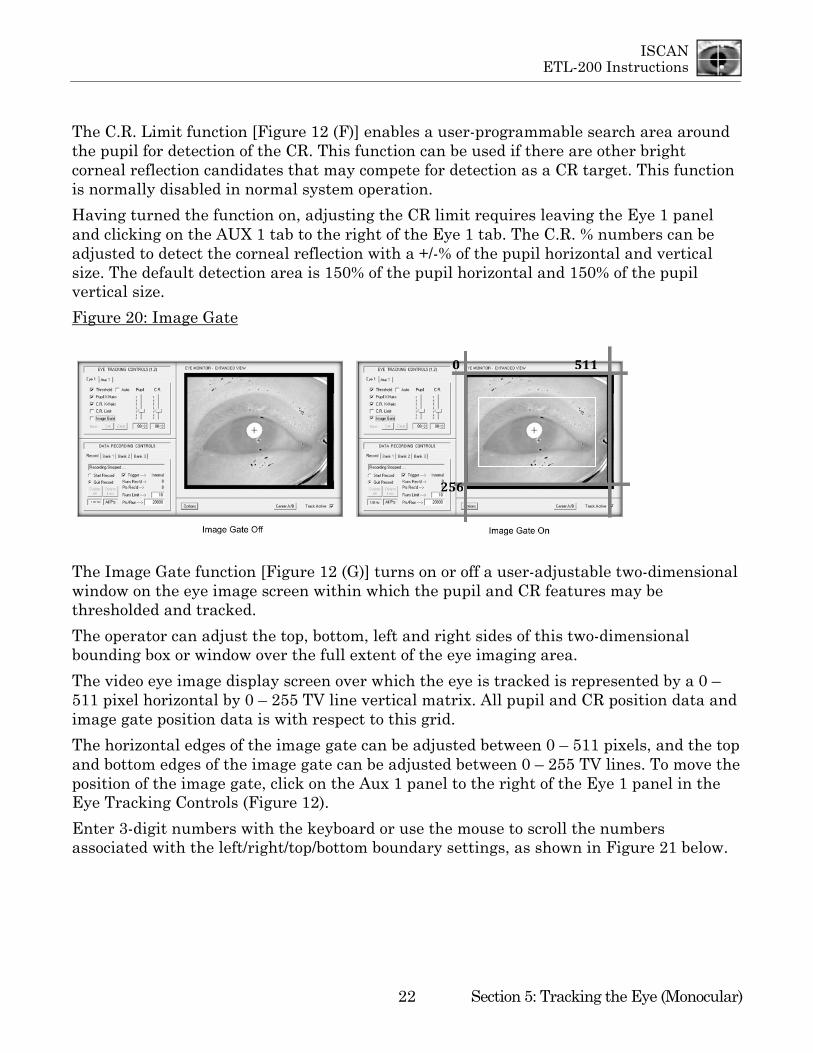
Figure 20: Image Gate
The Image Gate function [Figure 12 (G)] turns on or off a user-adjustable two-dimensional window on the eye image screen within which the pupil and CR features may be thresholded and tracked.
The operator can adjust the top, bottom, left and right sides of this two-dimensional bounding box or window over the full extent of the eye imaging area.
The video eye image display screen over which the eye is tracked is represented by a 0 – 511 pixel horizontal by 0 – 255 TV line vertical matrix. All pupil and CR position data and image gate position data is with respect to this grid.
The horizontal edges of the image gate can be adjusted between 0 – 511 pixels, and the top and bottom edges of the image gate can be adjusted between 0 – 255 TV lines. To move the position of the image gate, click on the Aux 1 panel to the right of the Eye 1 panel in the Eye Tracking Controls (Figure 12).
Enter 3-digit numbers with the keyboard or use the mouse to scroll the numbers associated with the left/right/top/bottom boundary settings, as shown in Figure 21 below.
ISCAN ETL-200 Instructions
Section 5: Tracking the Eye (Monocular) 23
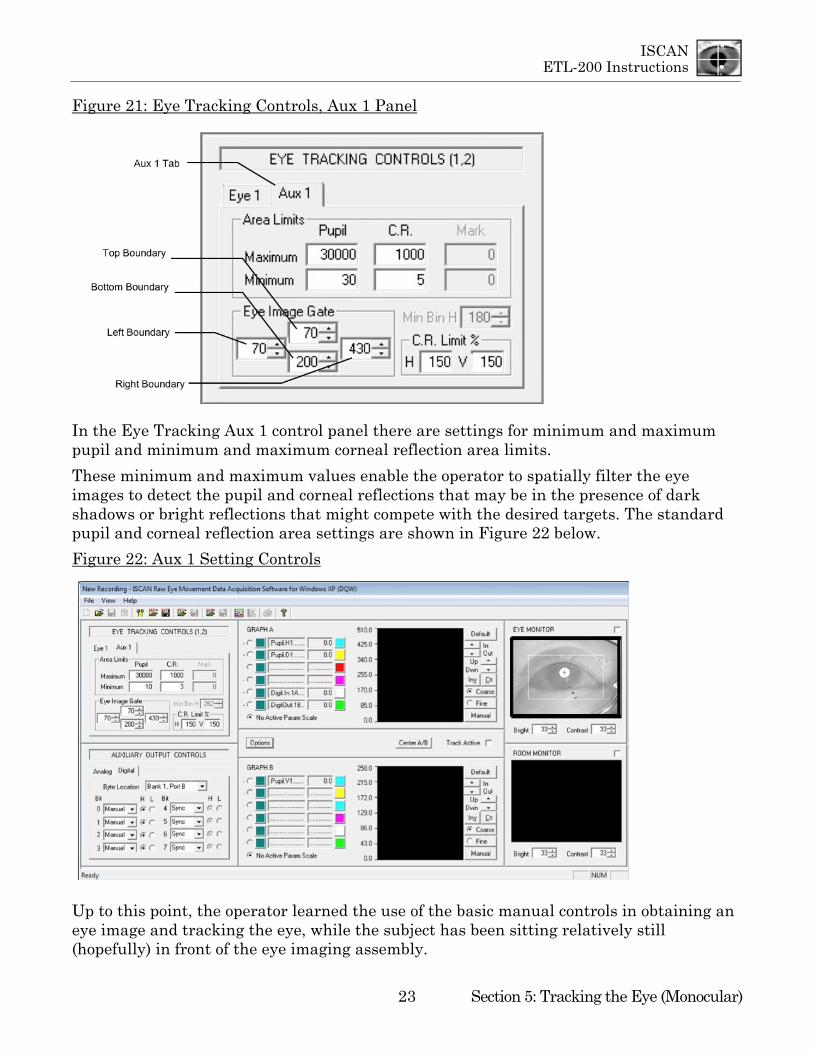
Figure 21: Eye Tracking Controls, Aux 1 Panel
In the Eye Tracking Aux 1 control panel there are settings for minimum and maximum pupil and minimum and maximum corneal reflection area limits.
These minimum and maximum values enable the operator to spatially filter the eye images to detect the pupil and corneal reflections that may be in the presence of dark shadows or bright reflections that might compete with the desired targets. The standard pupil and corneal reflection area settings are shown in Figure 22 below.
Figure 22: Aux 1 Setting Controls
Up to this point, the operator learned the use of the basic manual controls in obtaining an eye image and tracking the eye, while the subject has been sitting relatively still (hopefully) in front of the eye imaging assembly.
ISCAN ETL-200 Instructions
Section 5: Tracking the Eye (Monocular) 24
Subjects Wearing Eyeglasses
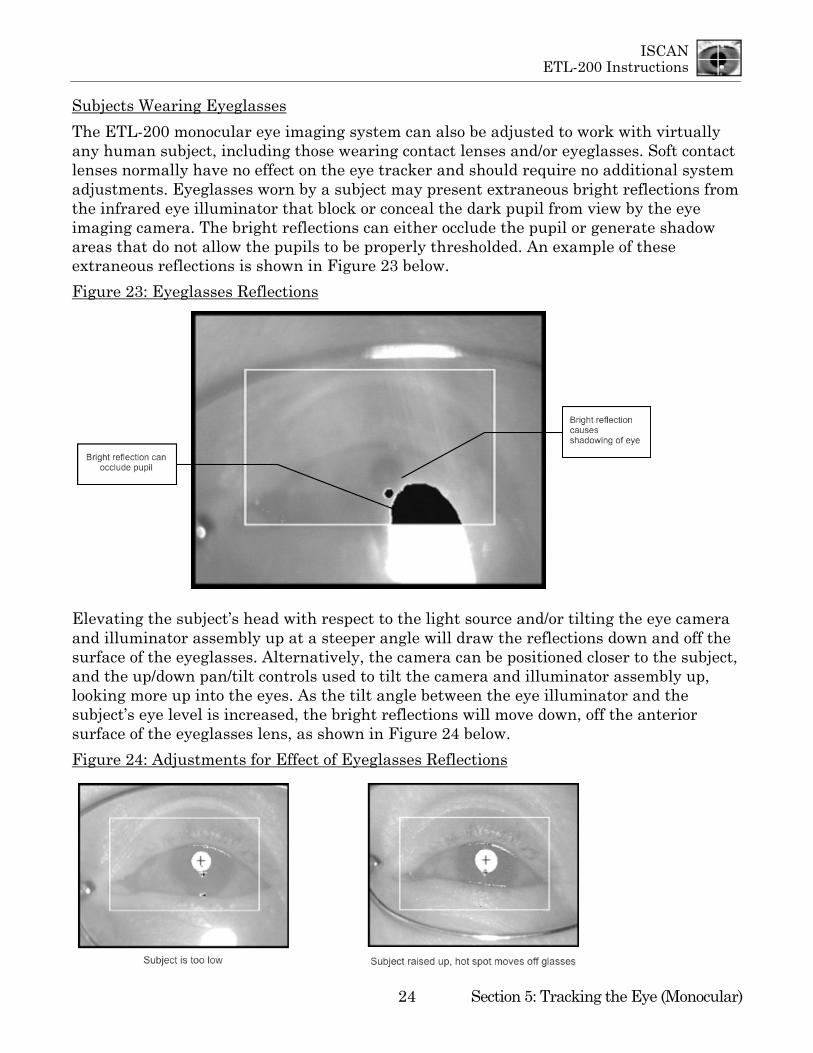
The ETL-200 monocular eye imaging system can also be adjusted to work with virtually any human subject, including those wearing contact lenses and/or eyeglasses. Soft contact lenses normally have no effect on the eye tracker and should require no additional system adjustments. Eyeglasses worn by a subject may present extraneous bright reflections from the infrared eye illuminator that block or conceal the dark pupil from view by the eye imaging camera. The bright reflections can either occlude the pupil or generate shadow areas that do not allow the pupils to be properly thresholded. An example of these extraneous reflections is shown in Figure 23 below.
Figure 23: Eyeglasses Reflections
Elevating the subject’s head with respect to the light source and/or tilting the eye camera and illuminator assembly up at a steeper angle will draw the reflections down and off the surface of the eyeglasses. Alternatively, the camera can be positioned closer to the subject, and the up/down pan/tilt controls used to tilt the camera and illuminator assembly up, looking more up into the eyes. As the tilt angle between the eye illuminator and the subject’s eye level is increased, the bright reflections will move down, off the anterior surface of the eyeglasses lens, as shown in Figure 24 below.
Figure 24: Adjustments for Effect of Eyeglasses Reflections

ISCAN ETL-200 Instructions
Section 5: Tracking the Eye (Monocular) 25
Tracking the Pupil vs. Tracking the Pupil and Corneal Reflection
Tracking the Pupil
The ETL-200 has the capability to track both the X,Y position of the subject’s dark pupil and the X,Y position of the bright corneal reflection. The corneal reflection is generated by the reflection of the infrared light source used to illuminate the eye area, off of the anterior portion of the cornea.
With the subject’s head fixed, and the eye camera also mechanically fixed with respect to the subject’s head, the pupil position will give an accurate representation of the subject’s eye position, and hence point of gaze.
Tracking only pupil position might result in an erroneous eye position measurement if there is any mechanical movement between the eye imaging camera and the subject’s head. When only tracking pupil horizontal and vertical position, make sure that the eye camera is securely fastened and that there is no mechanical motion between the subject’s head and the eye imaging camera assembly.
Tracking the Pupil and Corneal Reflection
In the event that the subject’s head restraint system is loose, or if there is any vibration of the eye camera mount or any other mechanical reason that can introduce movements between the subject’s head and the eye camera, the ETL-200 has a Pupil Minus Corneal Reflection tracking mode that eliminates small translational movements between the head and eye camera. (“Translational movement” is mechanical engineering jargon, meaning movement of an object that causes elements of that object to move as well. Eye movement doesn’t make the head move, but head movement always “translates” into eye movement.)
The Pupil – CR mode automatically calculates the difference between the horizontal and vertical position of the pupil center and the center of the corneal reflection. With the light source positioned “at infinity” [farther than about ten inches (26 cm)] from the eye area, the bright corneal reflection, off the roughly spherical cornea, can act as a reference point where its position changes with pupil position but its relationship with the pupil is unaffected by small translational head movements.
The range of the raw Pupil – CR values for a given eye excursion is smaller than the range of raw pupil values, but in cases where there is any movement between the head and the eye camera, the Pupil – CR data will be more accurate than tracking the pupil alone.
Use the PH1 & PV1 parameters for tracking pupil horizontal and vertical positions. Also remember to set the PH1 & PV1 parameters in the analog outputs as well. See Section 7(D) for more discussion of analog outputs.
Use the P – CRH1 and P – CRV1 parameters for tracking the horizontal and vertical Pupil – Corneal Reflection positions. Also remember to set the P – CRH1 and P – CRV1 parameters into the analog outputs as well. See Section 7(D) for more discussion of analog outputs.
ISCAN ETL-200 Instructions
Section 5: Tracking the Eye (Monocular) 26
Example of Differing Results with Pupil Alone vs. Pupil Minus Corneal Reflection
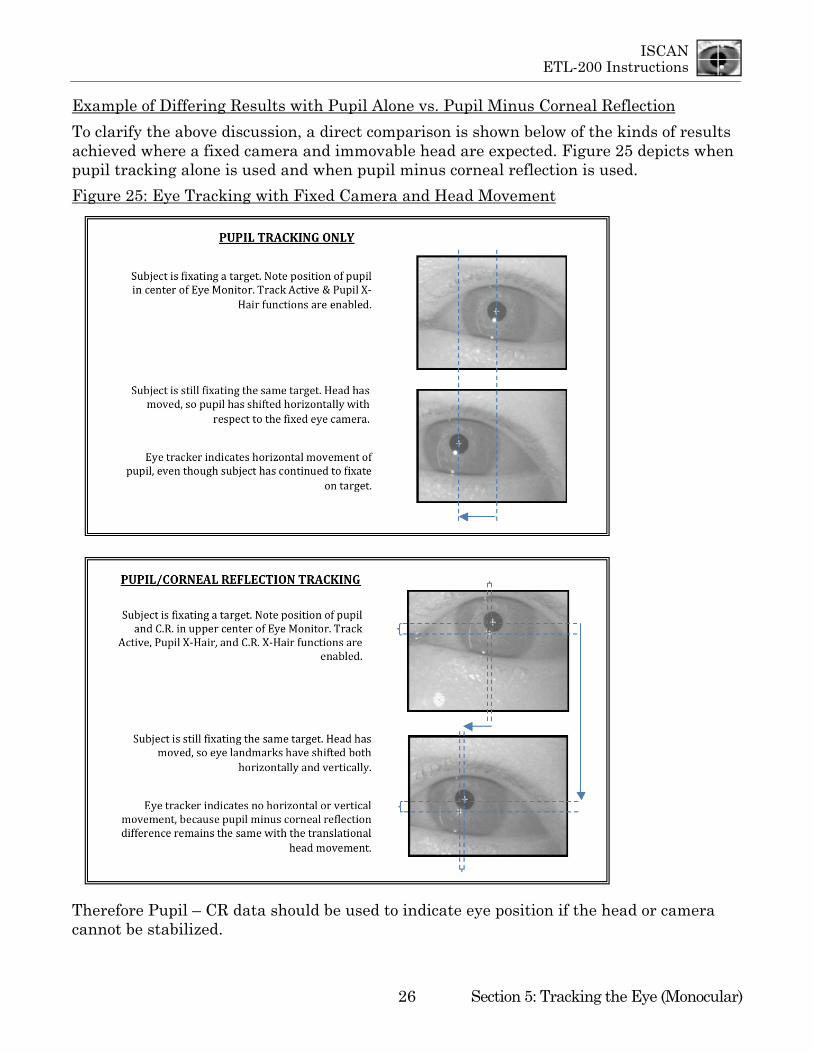
To clarify the above discussion, a direct comparison is shown below of the kinds of results achieved where a fixed camera and immovable head are expected. Figure 25 depicts when pupil tracking alone is used and when pupil minus corneal reflection is used.
Figure 25: Eye Tracking with Fixed Camera and Head Movement
Therefore Pupil – CR data should be used to indicate eye position if the head or camera cannot be stabilized.

ISCAN ETL-200 Instructions
Section 6: Graph Display Controls
27
Section 6: Graph Display Controls
The graph displays are located in the center of the DQW software window. The graphs allow the operator to display and view any of the parameters associated with eye tracking, input/output operations, or other auxiliary functions.
Any of the signals displayed in the graphs can be manipulated by the controls on the right hand side of the graph displays to adjust their scale and position.
The main features of the graph display and control panel can be seen in Figure 26 below. Please note that Track Active must be enabled for display of graph data.
Figure 26: Graph Control & Display Area
The parameter list box shows the parameter selected by the operator for display. Clicking the green box to the left of the parameter display brings up a list of all parameters that can be shown in the graphs. The list of allowable graph parameters depends on what auxiliary functions might have already been selected by the operator running in the DQW software.

ISCAN ETL-200 Instructions
Section 6: Graph Display Controls
28
For example, if the DQW software has been configured to monitor blinks [Section 7(B)], then parameters relating to blink count and blink state will be available for graph display.
If the blink monitoring subsystem has not been enabled, these parameters will not be included in the graph parameter selection list.
Double-click on the desired parameter to load it into the parameter display box.
To the right of the graph parameter display box is a numerical representation of the parameter value. Further to the right is the graph color selection control panel. Clicking on the colored box brings up a color panel display. Clicking on any of the color boxes will change the color of the graph to the selected color.
The activation button for the graph scaling functions is located to the left of the green parameter selectable button. Clicking on the activation button enables all graph scaling control functions for this selected graph parameter.
The scaling controls include a default button that automatically scales the graph to a default value. For example, if the pupil horizontal position (PupilH1) is activated and the default button is clicked, the scale of the graph defaults to the full screen range of the horizontal pupil position matrix, 0 – 511.
- Gain Controls: The in and out buttons amplify or reduce the gain of the signal as shown on the graph, with a corresponding increase or decrease of graph resolution as shown on the scale on the left hand side of the graph display.
- Offset Controls: The up and down buttons shift the position of the signal up or down with a corresponding shift in the position numbers (scale) on the left hand side of the graph display.
- Invert Control: Clicking on the INV button inverts the polarity of the signal on the graph.
- Center Control: Clicking the CTR button automatically centers the signal on the graph display.
- Center Control for Two Signals simultaneously: Clicking the Center A/B button, positioned between the two graphs, centers two signals, each one that is activated in each graph.
After the scaling of the graphs has been completed, the scaling controls for the graph parameter can be de-activated by clicking the No Active Param Scale button. The analog output signals remain scaled with the values loaded into the scaling controls.
Note that the range of an analog output signal is represented full-scale over the entire height of the graph. For example, the +/- 5-volt range of the analog output signal will encompass the full scale from top to bottom of the graph.
ISCAN ETL-200 Instructions
Section 6: Graph Display Controls
29
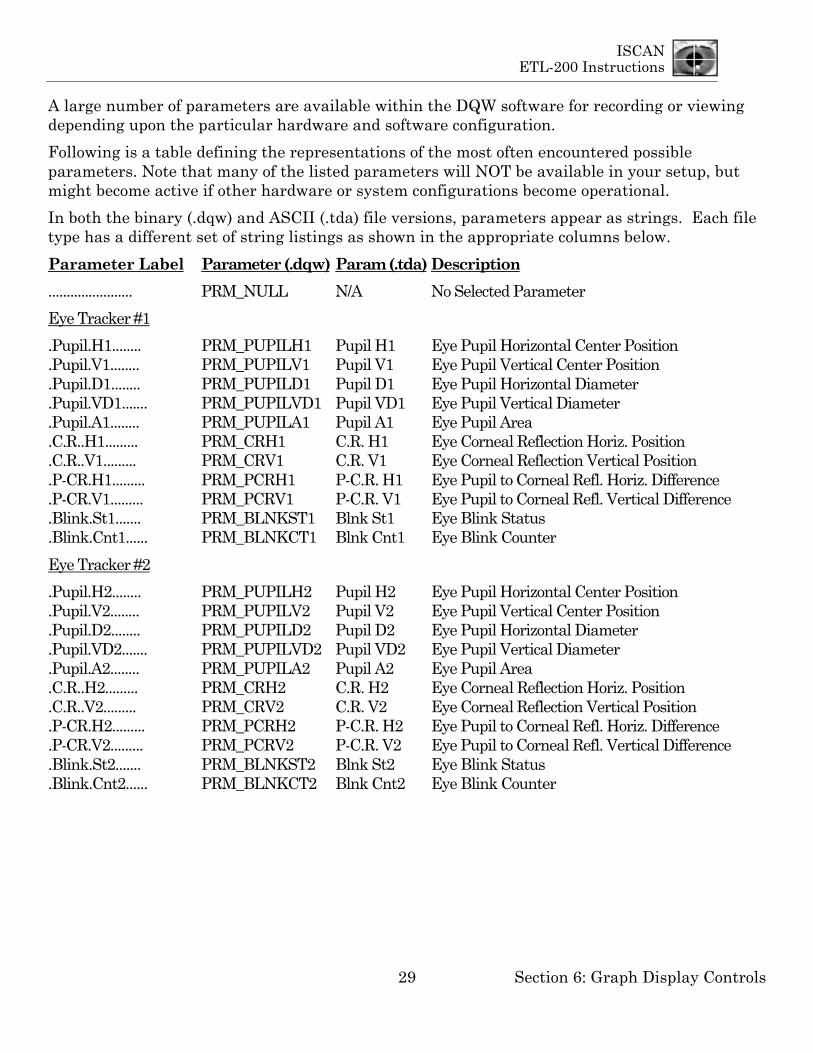
A large number of parameters are available within the DQW software for recording or viewing depending upon the particular hardware and software configuration.
Following is a table defining the representations of the most often encountered possible parameters. Note that many of the listed parameters will NOT be available in your setup, but might become active if other hardware or system configurations become operational.
In both the binary (.dqw) and ASCII (.tda) file versions, parameters appear as strings. Each file type has a different set of string listings as shown in the appropriate columns below.
Parameter Label Parameter (.dqw) Param (.tda) Description
....................... PRM_NULL N/A No Selected Parameter
Eye Tracker #1
.Pupil.H1........ PRM_PUPILH1 Pupil H1 Eye Pupil Horizontal Center Position
.Pupil.V1........ PRM_PUPILV1 Pupil V1 Eye Pupil Vertical Center Position
.Pupil.D1........ PRM_PUPILD1 Pupil D1 Eye Pupil Horizontal Diameter
.Pupil.VD1....... PRM_PUPILVD1 Pupil VD1 Eye Pupil Vertical Diameter
.Pupil.A1........ PRM_PUPILA1 Pupil A1 Eye Pupil Area
.C.R..H1......... PRM_CRH1 C.R. H1 Eye Corneal Reflection Horiz. Position
.C.R..V1......... PRM_CRV1 C.R. V1 Eye Corneal Reflection Vertical Position
.P-CR.H1......... PRM_PCRH1 P-C.R. H1 Eye Pupil to Corneal Refl. Horiz. Difference
.P-CR.V1......... PRM_PCRV1 P-C.R. V1 Eye Pupil to Corneal Refl. Vertical Difference
.Blink.St1....... PRM_BLNKST1 Blnk St1 Eye Blink Status
.Blink.Cnt1...... PRM_BLNKCT1 Blnk Cnt1 Eye Blink Counter
Eye Tracker #2
.Pupil.H2........ PRM_PUPILH2 Pupil H2 Eye Pupil Horizontal Center Position
.Pupil.V2........ PRM_PUPILV2 Pupil V2 Eye Pupil Vertical Center Position
.Pupil.D2........ PRM_PUPILD2 Pupil D2 Eye Pupil Horizontal Diameter
.Pupil.VD2....... PRM_PUPILVD2 Pupil VD2 Eye Pupil Vertical Diameter
.Pupil.A2........ PRM_PUPILA2 Pupil A2 Eye Pupil Area
.C.R..H2......... PRM_CRH2 C.R. H2 Eye Corneal Reflection Horiz. Position
.C.R..V2......... PRM_CRV2 C.R. V2 Eye Corneal Reflection Vertical Position
.P-CR.H2......... PRM_PCRH2 P-C.R. H2 Eye Pupil to Corneal Refl. Horiz. Difference
.P-CR.V2......... PRM_PCRV2 P-C.R. V2 Eye Pupil to Corneal Refl. Vertical Difference
.Blink.St2....... PRM_BLNKST2 Blnk St2 Eye Blink Status
.Blink.Cnt2...... PRM_BLNKCT2 Blnk Cnt2 Eye Blink Counter
ISCAN ETL-200 Instructions
Section 6: Graph Display Controls
30
Parameter Label Parameter (.dqw) Param (.tda) Description
Eye Tracker #3
.Pupil.H3........ PRM_PUPILH3 Pupil H3 Eye Pupil Horizontal Center Position
.Pupil.V3........ PRM_PUPILV3 Pupil V3 Eye Pupil Vertical Center Position
.Pupil.D3........ PRM_PUPILD3 Pupil D3 Eye Pupil Horizontal Diameter
.Pupil.VD3....... PRM_PUPILVD3 Pupil VD3 Eye Pupil Vertical Diameter
.Pupil.A3........ PRM_PUPILA3 Pupil A3 Eye Pupil Area
.C.R..H3......... PRM_CRH3 C.R. H3 Eye Corneal Reflection Horiz. Position
.C.R..V3......... PRM_CRV3 C.R. V3 Eye Corneal Reflection Vertical Position
.P-CR.H3......... PRM_PCRH3 P-C.R. H3 Eye Pupil to Corneal Refl. Horiz. Difference
.P-CR.V3......... PRM_PCRV3 P-C.R. V3 Eye Pupil to Corneal Refl. Vertical Difference
Eye Tracker #4
.Pupil.H4........ PRM_PUPILH4 Pupil H4 Eye Pupil Horizontal Center Position
.Pupil.V4........ PRM_PUPILV4 Pupil V4 Eye Pupil Vertical Center Position
.Pupil.D4........ PRM_PUPILD4 Pupil D4 Eye Pupil Horizontal Diameter
.Pupil.VD4....... PRM_PUPILVD4 Pupil VD4 Eye Pupil Vertical Diameter
.Pupil.A4........ PRM_PUPILA4 Pupil A4 Eye Pupil Area
.C.R..H4......... PRM_CRH4 C.R. H4 Eye Corneal Reflection Horiz. Position
.C.R..V4......... PRM_CRV4 C.R. V4 Eye Corneal Reflection Vertical Position
.P-CR.H4......... PRM_PCRH4 P-C.R. H4 Eye Pupil to Corneal Refl. Horiz. Difference
.P-CR.V4......... PRM_PCRV4 P-C.R. V4 Eye Pupil to Corneal Refl. Vertical Difference
Eye Trigger State
.Eye.Trig.0...... PRM_EYETRIG0 EyeTrig 0 Eye Trigger Status (Each Bit = 1 Trig State)
Point-of-Regard (P.O.R.) Calibrator #1
.POR.H1A......... PRM_PORH1A POR H1A Eye P.O.R. Horiz. Position (Source A)
.POR.V1A......... PRM_PORV1A POR V1A Eye P.O.R. Vertical Position (Source A)
.POR.RH1A....... PRM_POR_RH1A POR RwH1A Eye P.O.R. Raw Horiz. Position (Source A)
.POR.RV1A....... PRM_POR_RV1A POR RwV1A Eye P.O.R. Raw Vertical Position (Source A)
.POR.H1B......... PRM_PORH1B POR H1B Eye P.O.R. Horiz. Position (Source B)
.POR.V1B......... PRM_PORV1B POR V1B Eye P.O.R. Vertical Position (Source B)
.POR.RV1B....... PRM_POR_RH1B POR RwH1B Eye P.O.R. Raw Horiz. Position (Source B)
.POR.RV1B....... PRM_POR_RV1B POR RwV1B Eye P.O.R. Raw Vertical Position (Source B)
.POR.Mode1...... PRM_PORMODE1 POR Mode1 POR Mode of Operation (Reset/Calib/Output)
.POR.Hrs.1....... PRM_PORHRS1 POR Hrs1 Calibrator Video Data Display - Hours Value
.POR.Mins1...... PRM_PORMINS1 POR Mins1 Calibrator Video Data Display - Minutes Value
.POR.Secs1...... PRM_PORSECS1 POR Secs1 Calibrator Video Data Display - Seconds Value
.POR.Frms1...... PRM_PORFRMS1 POR Frms1 Calibrator Video Data Display - Frames Value

ISCAN ETL-200 Instructions
Section 6: Graph Display Controls
31
Parameter Label Parameter (.dqw) Param (.tda) Description
Point-of-Regard (P.O.R.) Calibrator #2
.POR.H2A......... PRM_PORH2A POR H2A Eye P.O.R. Horiz. Position (Source A)
.POR.V2A......... PRM_PORV2A POR V2A Eye P.O.R. Vertical Position (Source A)
.POR.RH2A....... PRM_POR_RH2A POR RwH2A Eye P.O.R. Raw Horiz. Position (Source A)
.POR.RV2A....... PRM_POR_RV2A POR RwV2A Eye P.O.R. Raw Vertical Position (Source A)
.POR.H2B......... PRM_PORH2B POR H2B Eye P.O.R. Horiz. Position (Source B)
.POR.V2B......... PRM_PORV2B POR V2B Eye P.O.R. Vertical Position (Source B)
.POR.RH2B....... PRM_POR_RH2B POR RwH2B Eye P.O.R. Raw Horiz. Position (Source B)
.POR.RV2B....... PRM_POR_RV2B POR RwV2B Eye P.O.R. Raw Vertical Position (Source B)
.POR.Mode2...... PRM_PORMODE2 POR Mode2 POR Mode of Operation (Reset/Calib/Output)
.POR.Hrs.2....... PRM_PORHRS2 POR Hrs2 Calibrator Video Data Display - Hours Value
.POR.Mins2...... PRM_PORMINS2 POR Mins2 Calibrator Video Data Display - Minutes Value
.POR.Secs2...... PRM_PORSECS2 POR Secs2 Calibrator Video Data Display - Seconds Value
.POR.Frms2...... PRM_PORFRMS2 POR Frms2 Calibrator Video Data Display - Frames Value
Head Tracker Input Parameters
.Head.X......... PRM_HEAD_X Head X Head X Position (in.)
.Head.Y......... PRM_HEAD_Y Head Y Head Y Position (in.)
.Head.Z......... PRM_HEAD_Z Head Z Head Z Position (in.)
.Head.Azim...... PRM_HEAD_AZ Head Azim Head Azimuth Angle (deg.)
.Head.Elev...... PRM_HEAD_EL Head Elev Head Elevation Angle (deg.)
.Head.Roll...... PRM_HEAD_RO Head Roll Head Roll Angle (deg.)
Auxiliary Serial Input Parameters
.Serial.In.0..... PRM_SERINP0 Ser Inp 0 Auxiliary Serial Input Byte
Auxiliary Digital Input Parameters
.Digit.In.1A.... PRM_DIGIN1A Dig Inp 1A Auxiliary Digital Input Byte (Card 1, Port A)
.Digit.In.1B.... PRM_DIGIN1B Dig Inp 1B Auxiliary Digital Input Byte (Card 1, Port B)
.Digit.In.1C.... PRM_DIGIN1C Dig Inp 1C Auxiliary Digital Input Byte (Card 1, Port C)
.Digit.In.2A.... PRM_DIGIN2A Dig Inp 2A Auxiliary Digital Input Byte (Card 2, Port A)
.Digit.In.2B.... PRM_DIGIN2B Dig Inp 2B Auxiliary Digital Input Byte (Card 2, Port B)
.Digit.In.2C.... PRM_DIGIN2C Dig Inp 2C Auxiliary Digital Input Byte (Card 2, Port C)
.Digit.In.3A.... PRM_DIGIN3A Dig Inp 3A Auxiliary Digital Input Byte (Card 3, Port A)
.Digit.In.3B.... PRM_DIGIN3B Dig Inp 3B Auxiliary Digital Input Byte (Card 3, Port B)
.Digit.In.3C.... PRM_DIGIN3C Dig Inp 3C Auxiliary Digital Input Byte (Card 3, Port C)
.Digit.In.4A.... PRM_DIGIN4A Dig Inp 4A Auxiliary Digital Input Byte (Card 4, Port A)
.Digit.In.4B.... PRM_DIGIN4B Dig Inp 4B Auxiliary Digital Input Byte (Card 4, Port B)
.Digit.In.4C.... PRM_DIGIN4C Dig Inp 4C Auxiliary Digital Input Byte (Card 4, Port C)

ISCAN ETL-200 Instructions
Section 6: Graph Display Controls
32
Parameter Label Parameter (.dqw) Param (.tda) Description
Auxiliary Digital Output Parameters
.DigitOut.1A.... PRM_DIGOUT1A DigOut 1A Auxiliary Digital Output Byte (Card 1, Port A)
.DigitOut.1B.... PRM_DIGOUT1B DigOut 1B Auxiliary Digital Output Byte (Card 1, Port B)
.DigitOut.1C.... PRM_DIGOUT1C DigOut 1C Auxiliary Digital Output Byte (Card 1, Port C)
.DigitOut.2A.... PRM_DIGOUT2A DigOut 2A Auxiliary Digital Output Byte (Card 2, Port A)
.DigitOut.2B.... PRM_DIGOUT2B DigOut 2B Auxiliary Digital Output Byte (Card 2, Port B)
.DigitOut.2C.... PRM_DIGOUT2C DigOut 2C Auxiliary Digital Output Byte (Card 2, Port C)
.DigitOut.3A.... PRM_DIGOUT3A DigOut 3A Auxiliary Digital Output Byte (Card 3, Port A)
.DigitOut.3B.... PRM_DIGOUT3B DigOut 3B Auxiliary Digital Output Byte (Card 3, Port B)
.DigitOut.3C.... PRM_DIGOUT3C DigOut 3C Auxiliary Digital Output Byte (Card 3, Port C)
.DigitOut.4A.... PRM_DIGOUT4A DigOut 4A Auxiliary Digital Output Byte (Card 4, Port A)
.DigitOut.4B.... PRM_DIGOUT4B DigOut 4B Auxiliary Digital Output Byte (Card 4, Port B)
.DigitOut.4C.... PRM_DIGOUT4C DigOut 4C Auxiliary Digital Output Byte (Card 4, Port C)
Auxiliary Analog Input Parameters
.Anlg.In.1...... PRM_ANLGIN1 Anlg Inp 1 Auxiliary Analog Input #1 - Value
.Anlg.In.2...... PRM_ANLGIN2 Anlg Inp 2 Auxiliary Analog Input #2 - Value
.Anlg.In.3...... PRM_ANLGIN3 Anlg Inp 3 Auxiliary Analog Input #3 - Value
.Anlg.In.4...... PRM_ANLGIN4 Anlg Inp 4 Auxiliary Analog Input #4 - Value
.Anlg.In.5...... PRM_ANLGIN5 Anlg Inp 5 Auxiliary Analog Input #5 - Value
.Anlg.In.6...... PRM_ANLGIN6 Anlg Inp 6 Auxiliary Analog Input #6 - Value
.Anlg.In.7...... PRM_ANLGIN7 Anlg Inp 7 Auxiliary Analog Input #7 - Value
.Anlg.In.8...... PRM_ANLGIN8 Anlg Inp 8 Auxiliary Analog Input #8 - Value
Eye Tracker #1 - Eye Angle Output Parameters (After Eye Angle Calibration)
.Eye.Azim.1....... PRM_EYE_AZ1 Eye AZ1 Eye Azimuth Angle (deg.)
.Eye.Elev.1....... PRM_EYE_EL1 Eye EL1 Eye Elevation Angle (deg.)
Eye Tracker #2 - Eye Angle Output Parameters (After Eye Angle Calibration)
.Eye.Azim.2....... PRM_EYE_AZ2 Eye AZ2 Eye Azimuth Angle (deg.)
.Eye.Elev.2....... PRM_EYE_EL2 Eye EL2 Eye Elevation Angle (deg.)
ISCAN ETL-200 Instructions
Section 7: DQW Features 33
Section 7: DQW Software Features and Functions
No description of ISCAN’s DQW software can be quite complete, as ISCAN continuously works to add functions and improvements requested by researchers and system users. The basic DQW software incorporates many different eye tracking functions, with the most frequently used discussed in this section, as outlined below:
(A) Eye angle calibration, in which the raw Pupil or Pupil – CR data is transformed into degrees of visual angle;
(B) A blink monitoring subsystem that registers and outputs blinks and can count the number of blinks over a specified period of time;
(C) A fixation monitoring subsystem that automatically detects and outputs the fixation state of up to 4 different locations in the subject’s field of view;
(D) Analog outputs, consisting of three ±5VDC analog output channels with the capability to expand to six analog output channels;
(E) Serial I/O, consisting of three serial ports for data input and output in real time; (F) Digital I/O, consisting of four TTL digital inputs and four TTL digital outputs that
can be operator-configured for recording control, output of fixation signals, input of marker pulses, and synchronization signals;
(G) Data recording capability to record up to two hours of 240 Hz or four hours of 120 Hz eye position data for post processing via Matlab or Excel.
Detailed descriptions of these functions follow.
A: Eye Angle Calibration
The ETL-200 has a built-in calibration system for automatic conversion of pupil or pupil-minus-corneal reflection data to degrees of visual angle.
To select between pupil only and pupil-minus-corneal reflection data as inputs to the eye angle calibration, set the corneal reflection threshold level to zero for the pupil only mode. Raise the corneal reflection threshold level until the corneal reflection is tracked, along with the pupil, for the pupil-minus-corneal reflection mode.
The subject must be presented with 4 calibration points of known degree of visual angle from a center calibration point. The calibration points must be arranged as shown below, where d is equidistant from the center and the resulting points are all at the same degree of visual angle:
ISCAN ETL-200 Instructions
Section 7: DQW Features 34
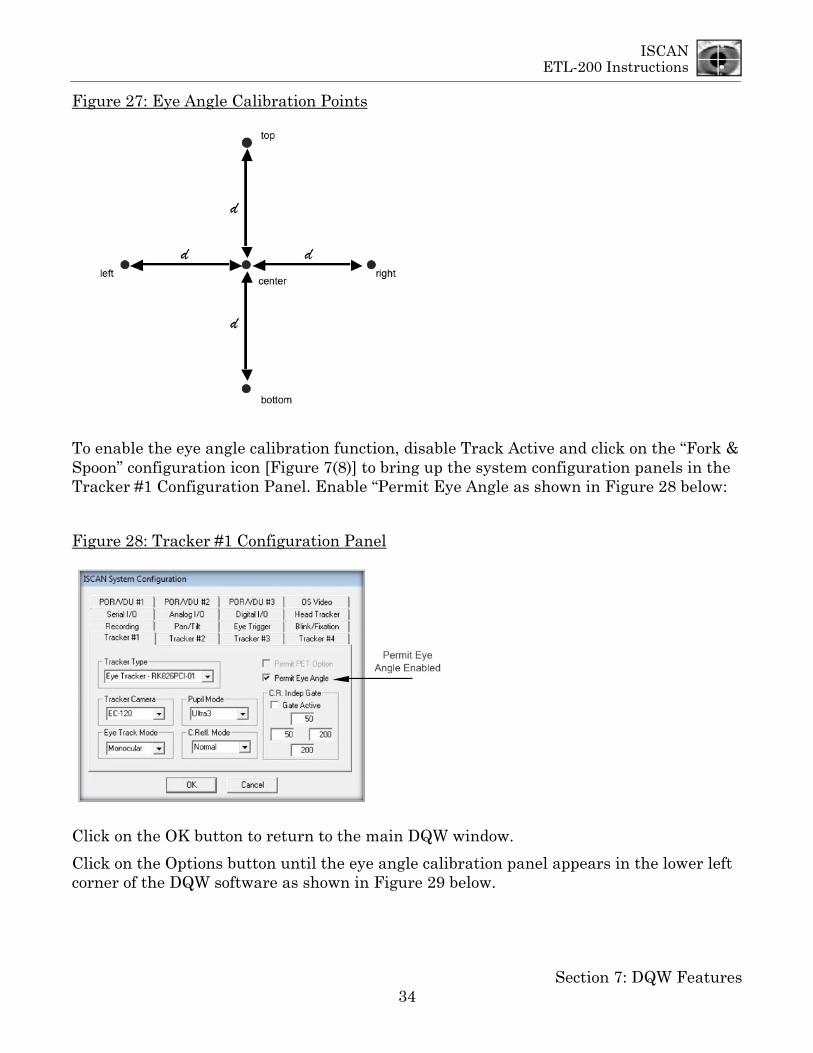
Figure 27: Eye Angle Calibration Points
To enable the eye angle calibration function, disable Track Active and click on the “Fork & Spoon” configuration icon [Figure 7(8)] to bring up the system configuration panels in the Tracker #1 Configuration Panel. Enable “Permit Eye Angle as shown in Figure 28 below:
Figure 28: Tracker #1 Configuration Panel
Click on the OK button to return to the main DQW window.
Click on the Options button until the eye angle calibration panel appears in the lower left corner of the DQW software as shown in Figure 29 below.

ISCAN ETL-200 Instructions
Section 7: DQW Features 35
Figure 29: Eye Angle Calibration Controls
With the Calibration Controls in Reset mode, adjust the value of the calibration angle to match that of the calibration points presented to the animal or human subject. In the example of Figure 29, the angle of the left, right, up and down points, with respect to the center will be set to ±6° of visual angle.
At this point, the system is ready for the eye angle calibration procedure.
Figure 30: Eye Angle Calibration DQW Window

ISCAN ETL-200 Instructions
Section 7: DQW Features 36
Make sure that the parameters EyeAzim1 and EyeElev1 are loaded into the graphs for display and subsequent scaling. In addition, load EyeAzim1 and EyeElev1 into the analog outputs if this calibrated data is to be used in place of the pupil horizontal and pupil vertical data.
Click on the box at the upper right of the eye monitor display to enlarge the eye image so it can be clearly viewed by the operator.
Figure 31: Eye Angle Center Point Calibration
Click the Calibrate button to start the 5-point calibration procedure. The center calibration target will be circled in the gray pseudo-screen showing the representation of the five calibration points. Using the mouse, position the cursor inside the gray pseudo-screen, and when the subject is viewing the center point, right click on the mouse to enter the data point. Right clicking on the mouse when the cursor is in the gray box enters the raw pupil or pupil-CR values determined by the eye tracker for that particular point into the calibration algorithm. Make sure that the eye landmarks are being properly tracked during the data entry. If the subject blinks or looks away, click on Reset and start over, by clicking Calibrate again.
When the center calibration data has been entered, the circle will surround the representation of the left calibration target in the gray pseudo-screen, as shown in Figure 32 below:

ISCAN ETL-200 Instructions
Section 7: DQW Features 37
Figure 32: Eye Angle Left Point Calibration
Instruct the subject to fixate the left calibration target, position the cursor inside the gray pseudo-screen, and right click on the mouse. Again ensure that the eye landmarks are being robustly tracked and that the subject is indeed looking at the left calibration target.
Repeat the procedure for the right, up, and down calibration targets. Figure 33, below, shows what each eye image and eye angle calibration control panel should look like at each subsequent point in the calibration procedure.
Figure 33: Eye Angle Calibration of Right, Up, and Down Points
ISCAN ETL-200 Instructions
Section 7: DQW Features 38
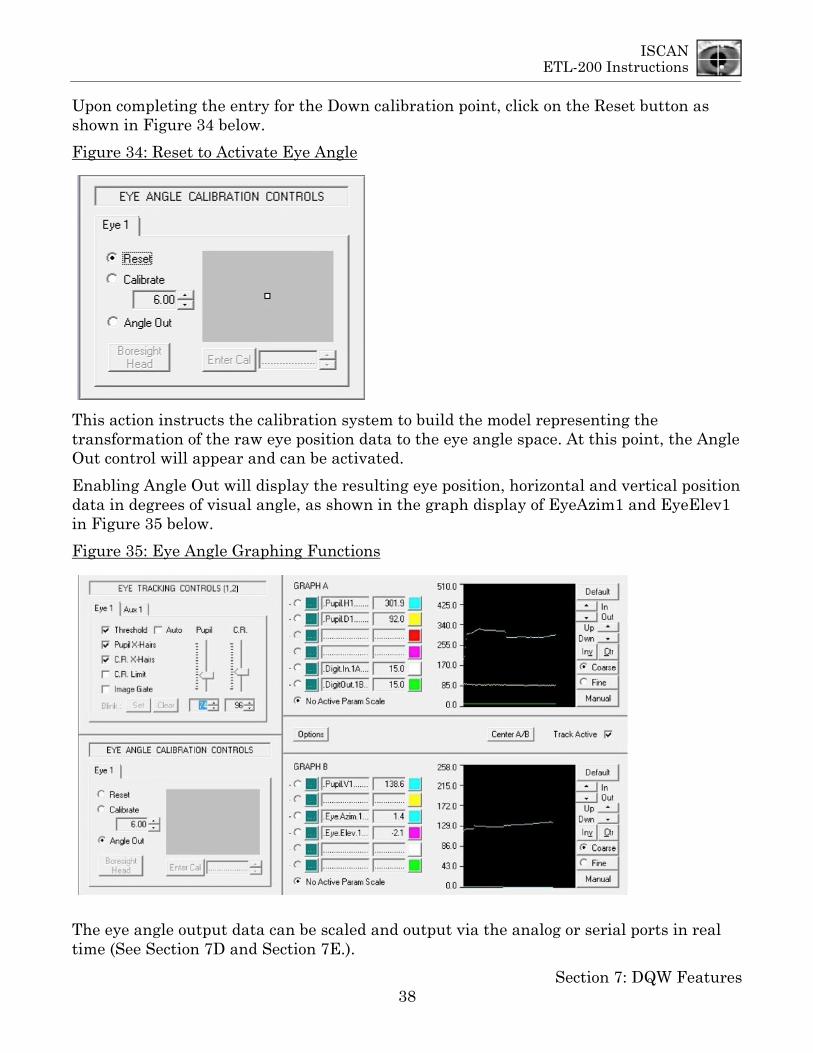
Upon completing the entry for the Down calibration point, click on the Reset button as shown in Figure 34 below.
Figure 34: Reset to Activate Eye Angle
This action instructs the calibration system to build the model representing the transformation of the raw eye position data to the eye angle space. At this point, the Angle Out control will appear and can be activated.
Enabling Angle Out will display the resulting eye position, horizontal and vertical position data in degrees of visual angle, as shown in the graph display of EyeAzim1 and EyeElev1 in Figure 35 below.
Figure 35: Eye Angle Graphing Functions
The eye angle output data can be scaled and output via the analog or serial ports in real time (See Section 7D and Section 7E.).

ISCAN ETL-200 Instructions
Section 7: DQW Features 39
B: Blink Monitoring
The ETL-200 has a built-in blink detection and counting feature. The detection algorithm requires that the system operator set a template of the eye with the pupil fully visible to the eye camera and the pupil position clearly tracked by the eye tracker.
The blink monitor subsystem continuously compares the incoming real time pupil extent information to that of the template initially set by the operator. It then registers and counts blinks based on a percentage of eye closure parameter, also operator selectable.
The blink state is represented by the graph parameter BlinkSt1 and is a digital “0” when the eye is open and a digital “1” when the eye is closed (beyond the percentage of eye closure setting).
The blink count is represented by the graph parameter BlinkCnt1 and is a real time integer representing the number of blinks that have occurred since the template was set. The operator can clear the blink count at any time manually or can enable a feature that automatically clears the blink count at the start of a data recording episode.
To enable blink monitoring, disable Track Active in the DQW software and click on the “Fork & Spoon” configuration icon [Figure 7(8)] to display the ISCAN system configuration panel. Click on the Blink/Fixation tab, and set the blink criteria in that panel as shown in Figure 36 below:
Figure 36: Blink Monitor Configuration Panel
Enable the blink monitor, and set the percentage of eye closure to the desired level. In this example it is set to 80%. This means that if 80% of the pupil size is obscured or has

ISCAN ETL-200 Instructions
Section 7: DQW Features 40
disappeared, the subject has blinked. Enabling Clear Blink Count w/Record will reset the blink count automatically to zero at the beginning of a recording event.
Click OK to return to the DQW window. Enable Track Active, and note the blink controls that are now highlighted at the bottom of the eye tracker controls panel in the upper left hand side of the DQW window.
Figure 37: Blink Controls Enabled
Have the subject fixate straight ahead and ensure that the eye landmarks are properly tracked. Click on the Set button in the blink control panel.
Figure 38: Blink Control Panel
This captures a pupil extent template, based on the pupil size parameters calculated by the eye tracking processor. Load the BlinkSt1 and BlinkCnt1 parameters into the graph display, if desired. At the subject’s eye closes during a blink, the BlinkSt1 will change from a “0” to a “1,” and the BlinkCnt1 number will increment by one integer.
Clicking on the Clear button in the blink control panel will set the blink count number to zero.
The blink state and blink count monitoring can be selected for recording and/or real time output via the digital outputs (See Section 7F), analog outputs (See Section 7D), or serial ports outputs (See Section 7E).

ISCAN ETL-200 Instructions
Section 7: DQW Features 41
C: Fixation Monitoring
The ETL-200 includes a fixation monitoring subsystem that generates a digital, analog, or serial output signal when the subject is fixating a particular solid angle in space. The width of the allowable fixation angle is operator-adjustable, and the initial fixation position can be easily set.
The fixation monitoring subsystem can use the raw Pupil position or raw Pupil – Corneal Reflection position data for fixation calculation. The pupil horizontal and vertical position data is sensitive to movements of the subject’s head with respect to the eye imaging camera, so it is recommended only for use with a subject with a head bolt or in a bite bar.
The Pupil – Corneal Reflection data is not sensitive to (or affected by) small head movements by the subject, and should be used to automatically determine fixation in non-fixed animals or subjects with unrestrained heads, using only a chin rest.
To enable the fixation monitoring subsystem, click on the “Fork & Spoon” configuration icon [Figure 7(8)]. When the ISCAN System Configuration panel appears, click on the Eye Trigger tab, and adjust the settings to look like those in Figure 39 below:
Figure 39: Fixation Trigger Configuration Panel
There are two trigger control areas available. Each control area, Trigger 1 and Trigger 2, has four independent fixation monitors that can be enabled, for a total of eight discrete fixation locations that can be automatically monitored.
In the Trigger 1 controls, set the Trigger Type for Position. This enables the X,Y eye movements to be channeled into the fixation monitor subsystem. Set Trigger Source for Eye1 if the ETL-200 is a monocular set-up. In most applications this is the case.
Set Source Data for Pupil or Pupil – CR. If the lower primate or human subject’s head is not fixed with respect to the eye imaging camera, either by head bolt or bite bar, select Pupil – CR. The Pupil – Corneal Reflection horizontal and vertical difference data will be input to the fixation monitor subsystem.

ISCAN ETL-200 Instructions
Section 7: DQW Features 42
Click on OK to close the Configuration Panel. Next, click on the Options button until the Eye Trigger Output Controls panel appears on the lower left side of the DQW software window as shown in Figure 40 below:
Figure 40: Eye Trigger Output Controls
Note that there are four fixation trigger channels available to be enabled under the Trigger1 tab: Trigger1A, Trigger1B, Trigger1C, and Trigger1D. Each channel can be used to set an individual fixation point for automatic fixation monitoring.
To set a fixation point, Track Active must be enabled. When the subject is fixating, click the Set button on the Trigger panel and the raw Pupil or Pupil – CR position data captured for that fixation point appears in the Fix Pt H and V boxes. To the right side of the controls, adjustment can be made to the horizontal and vertical size of a fixation window in extent of + or – pixels from the captured fixation point. Any subsequent eye position data that falls within the operator adjustable window is designated a fixation and can be output via the digital port as a TTL signal. [See Section 7 (F).]
In summary, to output the fixation signal, click the Options button until the Auxiliary Output Controls panel appears. Click on the Digital tab and load Triger1A into the digital output. When Track Active is enabled, the first digital output D0 on Pin 5 of the 9-pin digital I/O D-Sub connector will have a low level digital ‘0” when the subject is fixating the Set position and a digital “1” a high TTL voltage level when not fixating within the Set window.

ISCAN ETL-200 Instructions
Section 7: DQW Features 43
D: ISCAN Analog Outputs
The ETL-200 normally has three analog outputs. The outputs are generally assigned to Pupil or Pupil – Corneal Reflection horizontal position, Pupil or Pupil – C.R. vertical position, and pupil size, either horizontal or vertical diameter or pupil area. The output range of the analog outputs is ±5 volts DC.
Selecting Analog Outputs
The ETL-200 is shipped with the three analog outputs enabled. Clicking through the Options button will bring up the Auxiliary Output Control panel in the lower left hand corner of the DQW Control Window.
The analog folder should be configured as shown in Figure 41 below:
Figure 41: Analog Output Control Panel
Clicking on the Parameter Control box to the right of the parameter selects and loads a desired analog output parameter.
Double-clicking on the highlighted parameter selects that parameter as an analog output.
Figure 42: Select Analog Output Parameters

ISCAN ETL-200 Instructions
Section 7: DQW Features 44
It is also important to add the same analog output parameters to the graph displays. For example, if you have selected PupilH1, the pupil horizontal position, as an analog output, make sure to add PupilH1 into one of the graph displays. This will allow for scaling of the selected analog outputs over the ±5VDC range. See this example in Figure 43 below.
Figure 43: Analog Output Parameters & Graph Displays
See Section 6 for a detailed discussion of scaling the analog outputs.

ISCAN ETL-200 Instructions
Section 7: DQW Features 45
Configuring the Analog Outputs
With Track Active disabled, click on the “Fork & Spoon” configuration icon [Figure 7(8)], then click on the Analog I/O tab to show the Analog Inputs and Outputs control panel as shown in Figure 44 below.
Figure 44: Analog Inputs & Outputs Control Panel
Set the Analog Outputs so Output Active is checked, the Card Type is RK8X6PCI-0, and the Volt Range is ±5VDC.
Click on OK to exit from the System Configuration window display.

ISCAN ETL-200 Instructions
Section 7: DQW Features 46
E: Serial I/O
The ETL-200 eye tracking computer has three RS-232 serial ports labeled COM1, COM2 and COM3. These serial ports can receive and transmit RS-232 format data at rates up to 115K bytes/second (baud).
IMPORTANT: always use a null modem serial cable when using the serial ports to transfer data. A null modem cable has the data transmit pin on one end connected to the data receive pin on the other so serial data transfer can be performed. The biggest problem associated with a serial port data transmission is the failure to use a null modem cable.
Example of How to Use Serial Port
Connect a null modem serial cable into the COM1 port of the ISCAN eye tracking computer.
Open the ISCAN DQW software, and with Track Active disabled click on the “Fork & Spoon” configuration icon [Figure 7(8)]. When the ISCAN System Configuration panel appears, click on the Serial I/O tab. The Serial I/O configuration panel will appear as shown in Figure 45 below.
Figure 45: Serial I/O Configuration Panel
Select Data I/O-0 in the COM1 port, a Baud rate of 57,600 or 115,200, and Output Active for data output only. Enable Input Active only if data is being sent to the ISCAN eye tracker computer.
Click OK to close the System Configuration panel.
Click on the Options button until the Serial controls appear in the Auxiliary Output Controls panel, as in Figure 46 below.

ISCAN ETL-200 Instructions
Section 7: DQW Features 47
Figure 46: Serial Output Controls Panel
Set the Data parameter to Raw…ASCII or Raw…Binary, depending on the type of output data format required. See Section 10 Appendix C for more detail regarding the ASCII/binary formats.
The data may also be selected as Scaled…ASCII or Scaled…Binary. These settings allow for the serial output to be scaled just like the analog outputs, under graph control. See Section 6 for a detailed discussion of scaling the analog outputs
Load the desired eye parameters to be output into the data boxes labeled 01 to 06. Note that there are two available parameter banks that can be loaded with up to twelve parameters in total. In the example shown in Figure 46, PupilH1, PupilV1 and PupilD1 are loaded into Banks 01, 02, and 03 respectively.
Click on Track Active to enable serial output. With the other end of the null modem cable hooked up to a data acquisition computer running a standard serial interface program such as Hyperterminal or TeraTerm, the serial link can be confirmed and any transmission or data format problems resolved. Make sure that the baud rate of the receiving program matches the baud rate set in the ISCAN serial configuration panel. Make sure that the data format in the receiving program is set to ASCII or binary, the same as in the ISCAN data output format, and that a null modem cable is used.
For a more technically detailed discussion of serial data formats and ISCAN software controls, see Section 10 Appendix C.

ISCAN ETL-200 Instructions
Section 7: DQW Features 48
F: Digital I/O
The ETL-200 comes with a digital interface that contains four TTL inputs and four TTL outputs. The TTL signal is OVDC digital low or “0” or +5 digital high or “1.”
The four TTL inputs and outputs are located on the 9-pin D-sub female connector on the 3-analog output card, installed in the eye tracker PC. See Figure 4.
The pin-out of the digital I/O connector is shown in Figure 47 below.
Figure 47: ISCAN Digital I/O Connector
For normal ETL-200 applications, the digital I/O is configured for four separate input and four separate output TTL lines.

ISCAN ETL-200 Instructions
Section 7: DQW Features 49
With the Track Active disabled, click on the “Fork & Spoon” configuration icon [Figure 7(8)]. When the ISCAN System Configuration panel appears, click on the Digital I/O tab. The Digital I/O configuration panel will appear as shown in Figure 48 below.
Figure 48: Digital I/O Configuration Panel
These are the default settings for ISCAN’s digital I/O card. Click on OK to return to the main DQW software window.
Click on the Options button to bring up the Auxiliary Output Controls panel as shown in Figure 49 below.
Figure 49: Digital Output Controls Panel
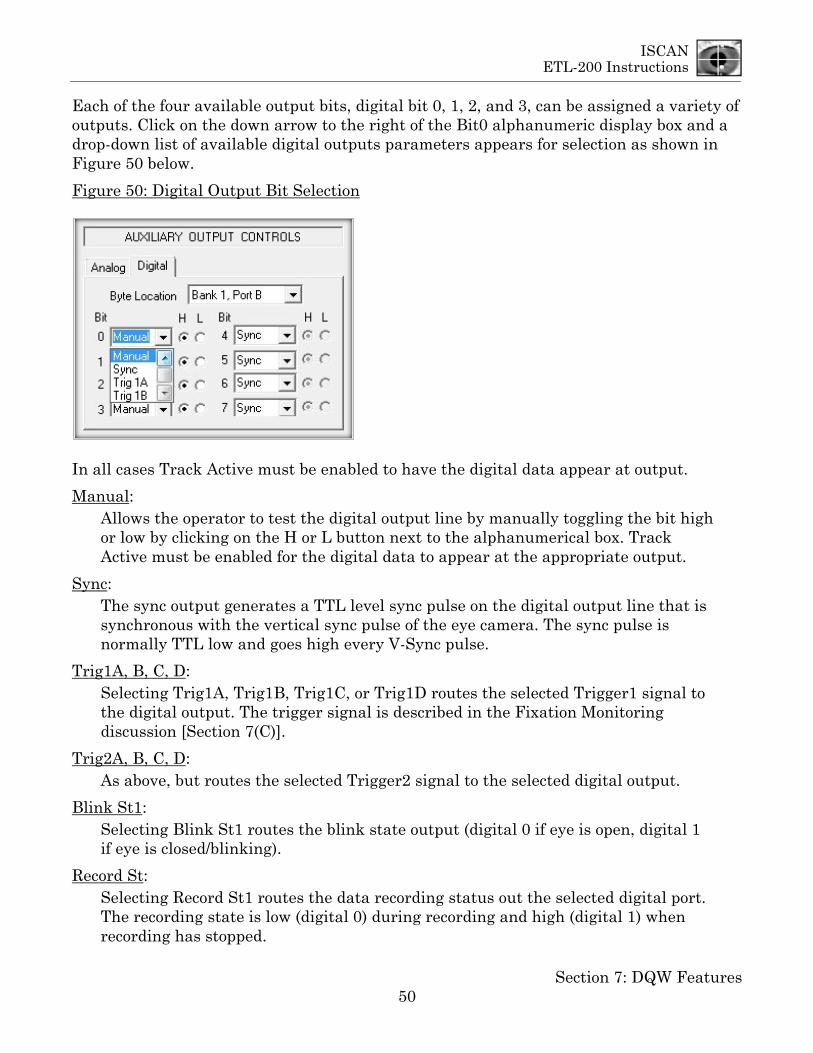
ISCAN ETL-200 Instructions
Section 7: DQW Features 50
Each of the four available output bits, digital bit 0, 1, 2, and 3, can be assigned a variety of outputs. Click on the down arrow to the right of the Bit0 alphanumeric display box and a drop-down list of available digital outputs parameters appears for selection as shown in Figure 50 below.
Figure 50: Digital Output Bit Selection
In all cases Track Active must be enabled to have the digital data appear at output.
Manual: Allows the operator to test the digital output line by manually toggling the bit high or low by clicking on the H or L button next to the alphanumerical box. Track Active must be enabled for the digital data to appear at the appropriate output.
Sync: The sync output generates a TTL level sync pulse on the digital output line that is synchronous with the vertical sync pulse of the eye camera. The sync pulse is normally TTL low and goes high every V-Sync pulse.
Trig1A, B, C, D: Selecting Trig1A, Trig1B, Trig1C, or Trig1D routes the selected Trigger1 signal to the digital output. The trigger signal is described in the Fixation Monitoring discussion [Section 7(C)].
Trig2A, B, C, D: As above, but routes the selected Trigger2 signal to the selected digital output.
Blink St1: Selecting Blink St1 routes the blink state output (digital 0 if eye is open, digital 1 if eye is closed/blinking).
Record St: Selecting Record St1 routes the data recording status out the selected digital port. The recording state is low (digital 0) during recording and high (digital 1) when recording has stopped.

ISCAN ETL-200 Instructions
Section 7: DQW Features 51
G: Recording Data
The ETL-200 is configured to record up to 24 digital eye parameters simultaneously. The recording function can be controlled by the PC mouse, serial commands, an external switch, or via a TTL digital input.
A single data run is defined as one cycle of starting and stopping recording. The system operator can set a limit to the number of runs that can be consecutively recorded and also set a number of data points that can be recorded in a single run. The number of data points depends upon the sample speed of the eye position data.
At 120 Hz, 120 data points are recorded every second, resulting in 7200 data points each minute. If the number of points per run is set at 7200 with a Runs limit of 10, this results in ten one-minute recordings.
At 240 Hz, 240 data points are recorded every second, resulting in 14,400 data points each minute. If the number of points per run remains set at 7200, with a runs limit of 10, this results in ten 30-second recordings.
It is important to calculate a priori the expected length of time for recording and the expected number of data points, and take into account the 120 or 240 Hz sampling frequency.
The maximum number of data points that can be recorded by the standard ETL-200 is 2,000,000. This would result in a maximum continuous recording of just over 2 hours at 240 Hz or about 4½ hours at 120 Hz.
The Data Recording controls are in the lower left hand side of the DQW window, as shown in Figure 51 below.
Figure 51: Data Recording Control Panel
In the example above, the sampling rate of the eye tracker is 120 Hz, and recording is set for Internal, meaning a mouse click can be used to start recording. The Runs Limit is set to 10, and the number of Points per Run is set to 20,800.
Clicking on the Bank 1 tab in the Data Recording Controls panel brings up the display of the parameters that the operator has loaded for recording.
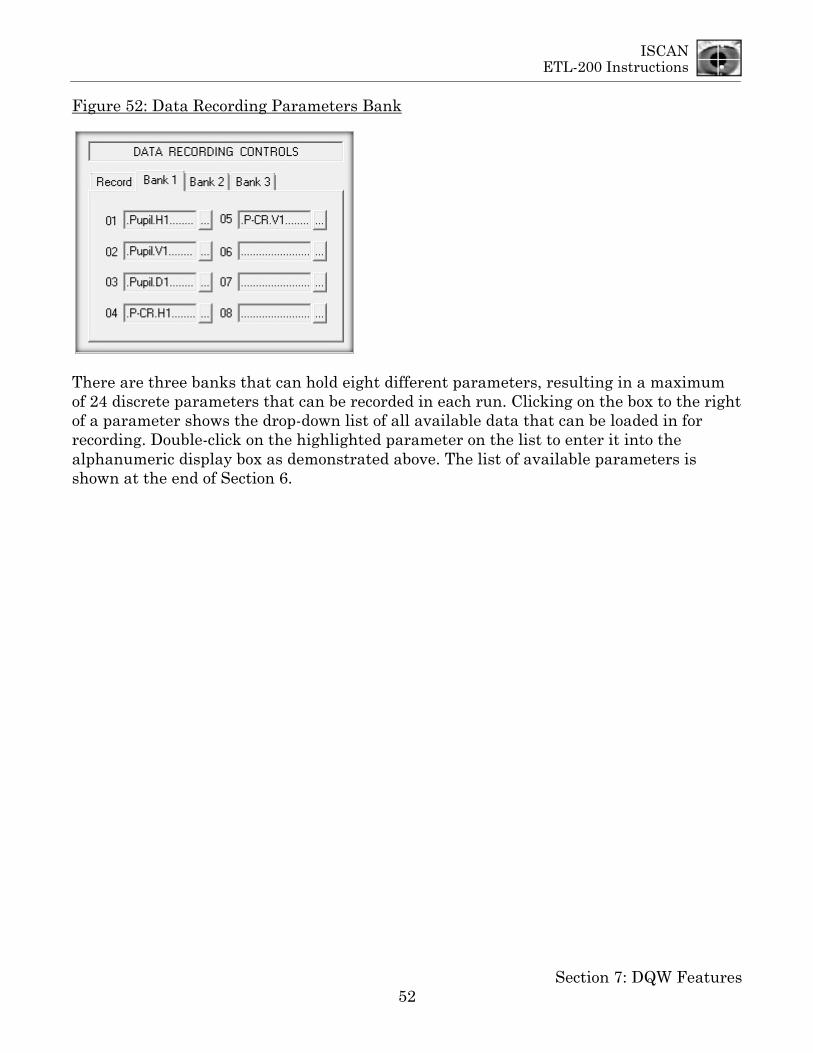
ISCAN ETL-200 Instructions
Section 7: DQW Features 52
Figure 52: Data Recording Parameters Bank
There are three banks that can hold eight different parameters, resulting in a maximum of 24 discrete parameters that can be recorded in each run. Clicking on the box to the right of a parameter shows the drop-down list of all available data that can be loaded in for recording. Double-click on the highlighted parameter on the list to enter it into the alphanumeric display box as demonstrated above. The list of available parameters is shown at the end of Section 6.

ISCAN ETL-200 Instructions
Section 7: DQW Features 53
Recording Configuration Panel
To customize the recording for a specific application, disable Track Active and click on the “Fork & Spoon” configuration icon [Figure 7(8)] to bring up the system configuration panels, then click on the Recording tab to display the Recording Configuration panel as shown in Figure 53 below:
Figure 53: Recording Configuration Panel
(1) Recording Trigger: Internal, Serial, Switch, or Digital
(2) Sample Mode: All Points or ½ Points
(3) Source: None, RK-8x6PCI-0, RK-632-PCI-0, or Par Port-0
(4) Lockout Samples:
(5) Trigger Edge: Leading or Trailing
(6) Points/Run Action: Stop Recording or Start New Run
(7) Points Run Limit
(8) Maximum Data Runs
(9) Maximum Data Points
(10) Toggle Data Bar
The Recording Trigger (1) is normally set to Internal. Internal allows for the starting and stopping of data recording via the PC mouse.
Set the Recording Trigger to Serial mode for starting and stopping the recording via the hex serial commands (Section 10, Appendix C).

ISCAN ETL-200 Instructions
Section 7: DQW Features 54
Set the Recording Trigger to Switch mode if a pushbutton switch is used to enable recording. Hook the switch up between Pins 1 and 9 on the ISCAN digital I/O 9-pin D-SUB connector. Pin 1 is the switch input and Pin 9 is Ground (Figure 47).
Set the Recording Trigger to Digital if an external TTL digital signal is required to start and stop recording. Recording starts with an active “low” (digital 0) TTL signal and stops when it turns “high” (digital 1). Hook the digital TTL signal to Pin 1 of the 9-pin D-SUB I/O connector and ground to Pin 9 (Figure 47).
The Sample Mode (2) is normally set to record all Points, but allows the operator to record Half Points. In the ½ Points mode, every other data point is recorded.
The Switch Trigger configurations are only used if the Switch mode has been enabled as the Recording Trigger. Switch Trigger Source (3) may be any of the three active sources listed above, and each is described in detail below:
Setting the Switch Trigger Source to RK-8xPCI-0 allows a switch to be connected on Pin 1 of the 9-pin D-Sub female digital input connector on the back of the eye tracker PC. Pin 9 of the 9-pin D-Sub connector is ground.
Setting the Switch Trigger Source to RK-632PCI-0 can only be done if an ISCAN RK-630PCI calibration card has been installed in the ETL-200.
Setting the Switch Trigger Source to Par Port-0 allows a switch to be connected to the PC parallel printer port on the back of the eye tracker PC between Pin 10 and Pin 25. Pin 10 is the switch signal input, and Pin 25 is ground on the PC parallel printer port.
Lockout Samples (4) is the amount of video fields during which a second switch slick is ignored.
Trigger Edge (5) can be selected for the leading or trailing edge of the switch pulse to start or stop recording.
The Points/Run Action (6) can be configured to Stop Recording or set to Start New Run.
The Points Run Limit (7) can be set to the maximum number of points expected in a single run. After the limit has been reached, the recording automatically stops. This number also is displayed in the DQW data recording control display.
The maximum number of data runs (8) is set at 400, and the maximum number of data points (9) is set at 2 million. The system operator cannot change either of these limits.
The Toggle Data Bar (10) function is normally disabled.
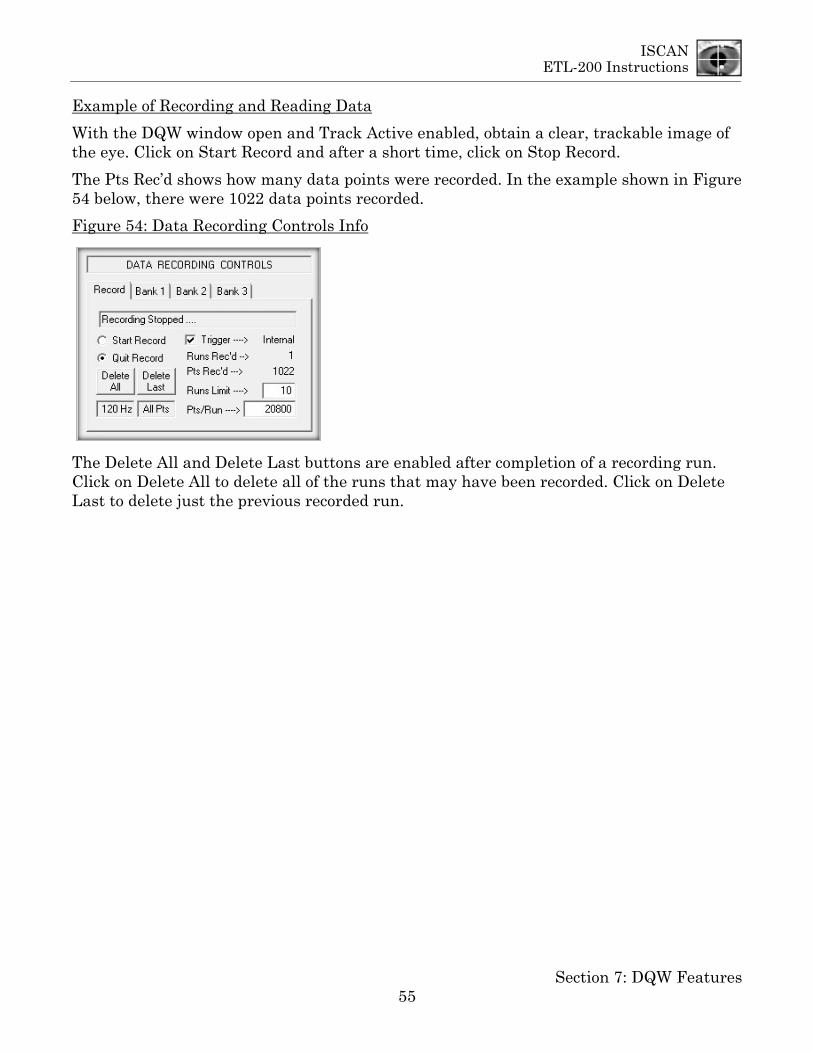
ISCAN ETL-200 Instructions
Section 7: DQW Features 55
Example of Recording and Reading Data
With the DQW window open and Track Active enabled, obtain a clear, trackable image of the eye. Click on Start Record and after a short time, click on Stop Record.
The Pts Rec’d shows how many data points were recorded. In the example shown in Figure 54 below, there were 1022 data points recorded.
Figure 54: Data Recording Controls Info
The Delete All and Delete Last buttons are enabled after completion of a recording run. Click on Delete All to delete all of the runs that may have been recorded. Click on Delete Last to delete just the previous recorded run.

ISCAN ETL-200 Instructions
Section 7: DQW Features 56
Disable Track Active. Click on File [Figure 7(14)] in the DQW software window, and scroll down to select Save ISCAN ASCII Data File as tab-delimited ASCII (TDA), as shown in Figure 55 below.
Figure 55: Save TDA Data in File
The recorded data run will automatically be saved to the Documents folder in the PC. Make sure to label the run as a .TDA file. In this example it is called Test.TDA, as shown in Figure 56 below.
Figure 56: Saving Data as Test.TDA
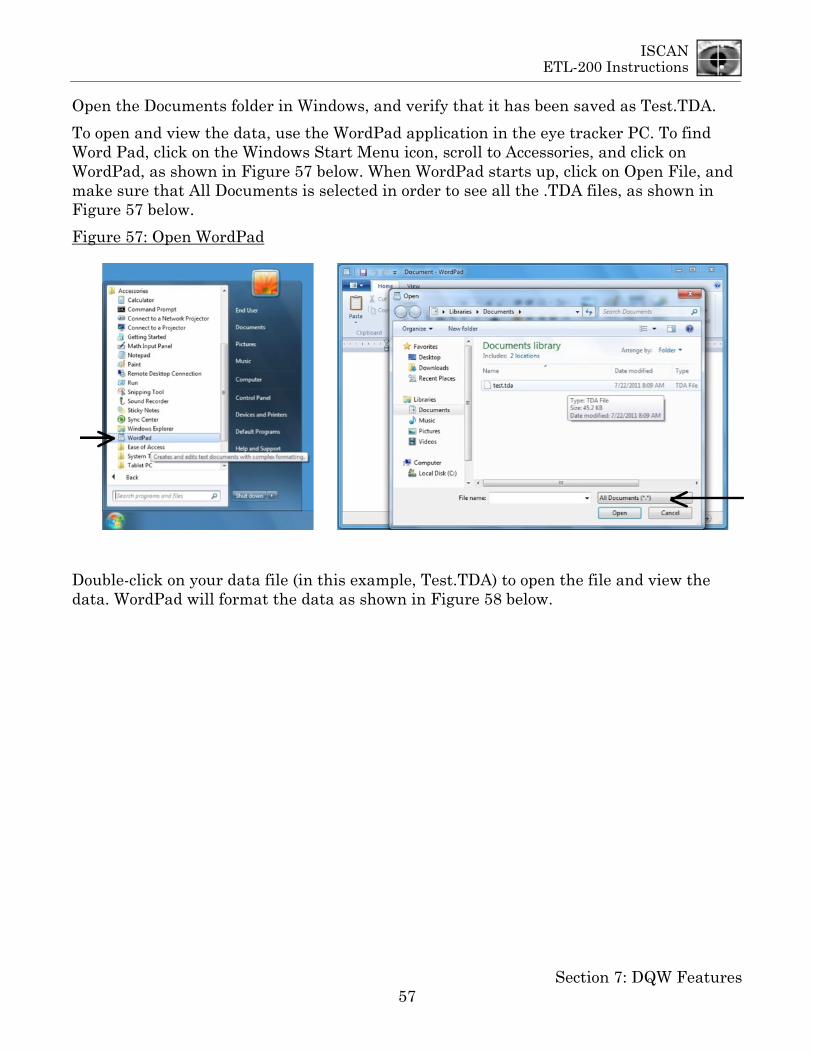
ISCAN ETL-200 Instructions
Section 7: DQW Features 57
Open the Documents folder in Windows, and verify that it has been saved as Test.TDA.
To open and view the data, use the WordPad application in the eye tracker PC. To find Word Pad, click on the Windows Start Menu icon, scroll to Accessories, and click on WordPad, as shown in Figure 57 below. When WordPad starts up, click on Open File, and make sure that All Documents is selected in order to see all the .TDA files, as shown in Figure 57 below.
Figure 57: Open WordPad
Double-click on your data file (in this example, Test.TDA) to open the file and view the data. WordPad will format the data as shown in Figure 58 below.

ISCAN ETL-200 Instructions
Section 7: DQW Features 58
Figure 58: Test.TDA Data
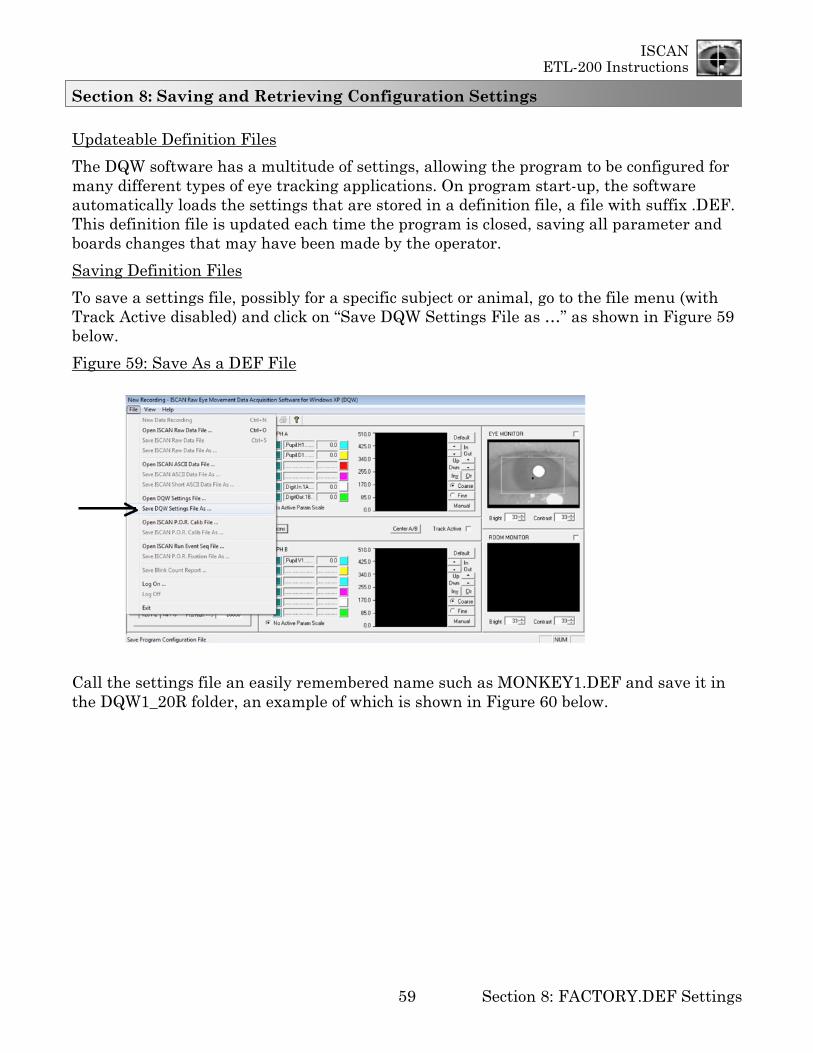
ISCAN ETL-200 Instructions
Section 8: FACTORY.DEF Settings 59
Section 8: Saving and Retrieving Configuration Settings
Updateable Definition Files
The DQW software has a multitude of settings, allowing the program to be configured for many different types of eye tracking applications. On program start-up, the software automatically loads the settings that are stored in a definition file, a file with suffix .DEF. This definition file is updated each time the program is closed, saving all parameter and boards changes that may have been made by the operator.
Saving Definition Files
To save a settings file, possibly for a specific subject or animal, go to the file menu (with Track Active disabled) and click on “Save DQW Settings File as …” as shown in Figure 59 below.
Figure 59: Save As a DEF File
Call the settings file an easily remembered name such as MONKEY1.DEF and save it in the DQW1_20R folder, an example of which is shown in Figure 60 below.

ISCAN ETL-200 Instructions
Section 8: FACTORY.DEF Settings 60
Figure 60: Save a Unique DEF File
Retrieving DQW Settings Via Definition Files
To restore DQW software settings you have previously saved (i.e., to open a settings file), disable Track Active, click on File, and scroll down to Open DQW Settings File as shown in Figure 61 below.
Figure 61: Retrieve a DEF File
When the DQW folder opens, double-click on the desired .DEF file, in this example MONKEY1.DEF, as shown in Figure 62 below.

ISCAN ETL-200 Instructions
Section 8: FACTORY.DEF Settings 61
Figure 62: Restore DQW Settings with a DEF File
The DQW program will now open with all the settings previously saved in the selected MONKEY1.DEF file.
Factory Definition File
There also will be a FACTORY.DEF backup file present in this Open Settings File window. The FACTORY.DEF file contains all the factory settings, when the ETL-200 was shipped. Double-clicking on the FACTORY.DEF file icon opens the DQW program with these initial settings. Note that as in Figure 62 above, FACTORY.DEF file is always one of the definition files that can be selected to open the DQW software.
Very occasionally, something could occur in the operating system that can corrupt the definition file. If the program is opened, with no eye tracker or on-screen video card present in the computer chassis, and then closed again – the DQW 1_20R.DEF file will save information indicating no eye tracker or video monitor display is enabled. In this case, open the FACTORY.DEF settings.
In a more extreme case, if both definition files are corrupted, the factory settings are presented on the next two pages, so the proper parameters can be manually entered into each of the 16 ISCAN system configuration panels. The system configuration panel can be opened by going to View and selecting System Configuration or by clicking on the “Fork & Spoon” configuration icon.

ISCAN ETL-200 Instructions
Section 8: FACTORY.DEF Settings 62
FACTORY.DEF System Configuration Settings
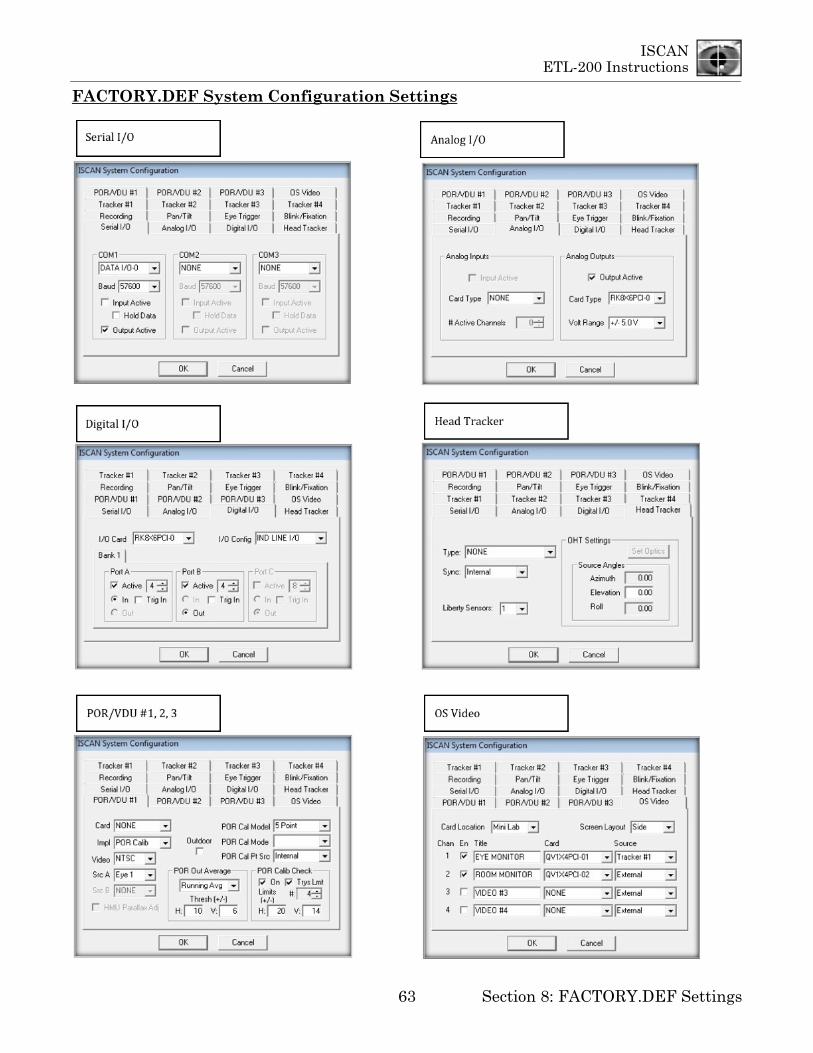
ISCAN ETL-200 Instructions
Section 8: FACTORY.DEF Settings 63
FACTORY.DEF System Configuration Settings
ISCAN ETL-200 Instructions
Section 9: IR Irradiance 64
Section 9: IR Irradiance and Safety
Eye-to-Illuminator Distances
Eye to Illuminator Distance IR Irradiance mW/cm2
5” or 13 cm 4.9
10” or 26 cm 2.35
15” or 39 cm 1.26
20” or 51 cm 0.86
25” or 64 cm 0.62
OSHA’s standard for safe levels of near-infrared radiation on the lens of 10 mW/cm2. The IR LED illuminator has a total radiant output of 1.2 mW. The peak of this output is at 880 nm, and the half-power points are approximately 60 nm above and below this value. Even if the entire output of the illuminator falls on the lens of the eye, the radiant flux striking the lens or the retina cannot and does not exceed 1.2 mW/cm2 (0.29 mcal/sec/cm2). This value is only 12% of the OSHA maximum radiation standard.
As to thermal levels, according to OSHA recommendations, white light of less than 1 cd/cm2 may be regarded of safe. A retinal exposure of 1.2 mW/cm2 of 940-nm light is the equivalent of 0.06 cd/cm2 of white light. Therefore the IR LED illuminator exposes the retina to only 6% of the OSHA maximum standard for thermal safety standard.
ISCAN thus certifies that the radiation and thermal levels of the IR LED illuminators used in the Eye Tracking Laboratories fall well within OSHA recommendations.

ISCAN ETL-200 Instructions
Section 10: ETL-200 Appendices 65
Section 10: ETL-200 Appendices
Appendix A: ETL-200 High-speed Operation
The ETL-200 is designed to operate at both 120 Hz and 240 Hz temporal speeds. The speed selection is operator selectable. The ETL-200 is shipped with all controls set for 120 Hz operation.
120 Hz Operation
At 120 Hz, the eye camera cable must be plugged into the eye camera control card port labeled 120 Hz. With Track Active disabled, click on the “Fork & Spoon” Configuration settings icon [Figure 7(8)]. This will open the ISCAN configuration control panel as shown in Figure A.1 below:
Figure A.1: 120 Hz System Configuration
In the Eye Tracker #1 configuration panel, the Tracker Camera should be set to EC-120 as shown in Figure A.2 below:
Figure A.2: Camera Set to 120 Hz
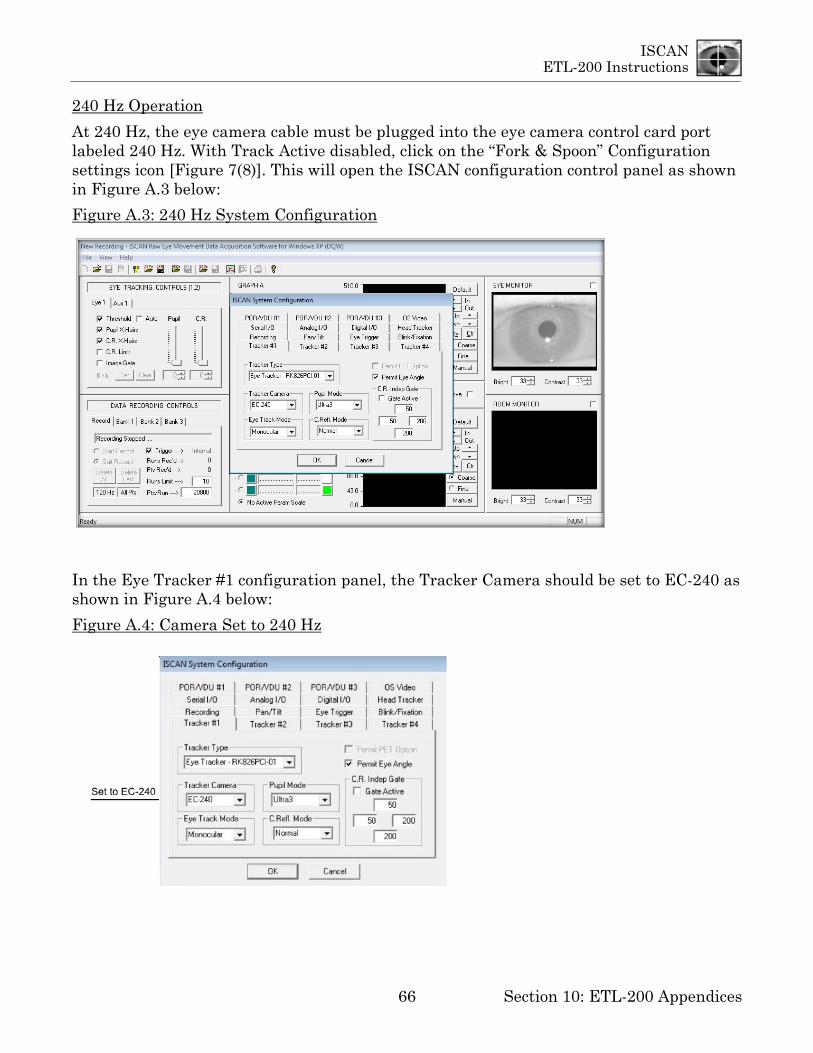
ISCAN ETL-200 Instructions
Section 10: ETL-200 Appendices 66
240 Hz Operation
At 240 Hz, the eye camera cable must be plugged into the eye camera control card port labeled 240 Hz. With Track Active disabled, click on the “Fork & Spoon” Configuration settings icon [Figure 7(8)]. This will open the ISCAN configuration control panel as shown in Figure A.3 below:
Figure A.3: 240 Hz System Configuration
In the Eye Tracker #1 configuration panel, the Tracker Camera should be set to EC-240 as shown in Figure A.4 below:
Figure A.4: Camera Set to 240 Hz
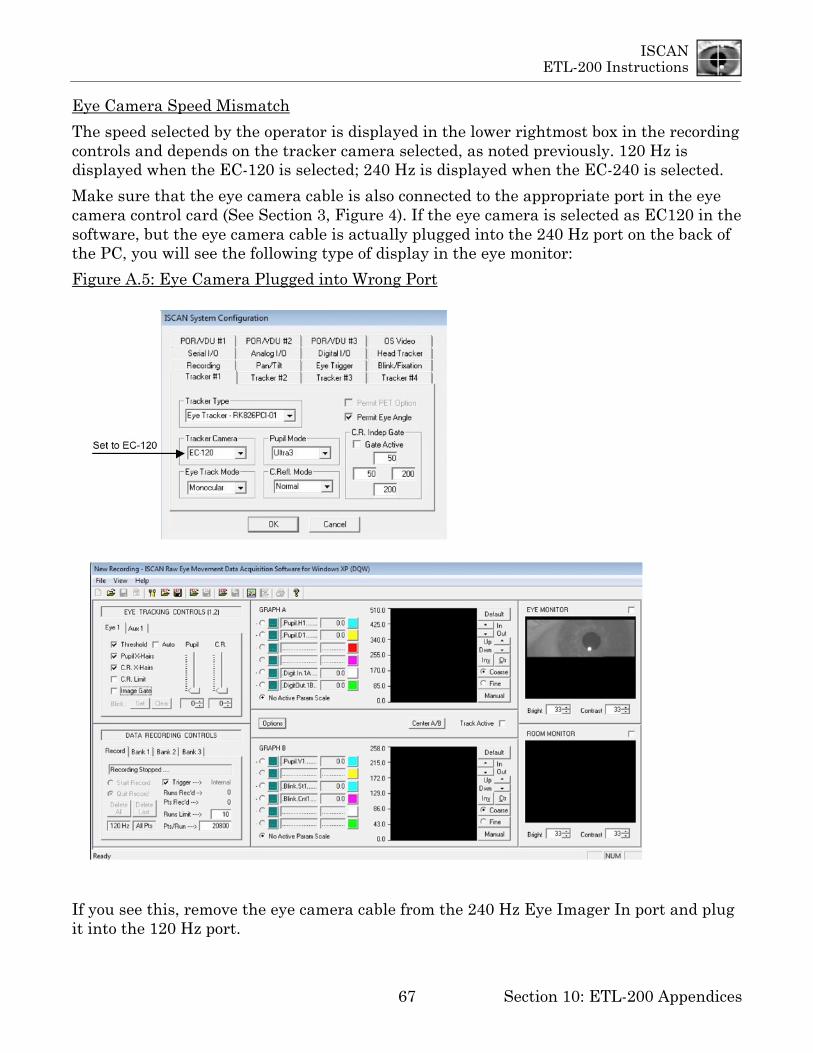
ISCAN ETL-200 Instructions
Section 10: ETL-200 Appendices 67
Eye Camera Speed Mismatch
The speed selected by the operator is displayed in the lower rightmost box in the recording controls and depends on the tracker camera selected, as noted previously. 120 Hz is displayed when the EC-120 is selected; 240 Hz is displayed when the EC-240 is selected.
Make sure that the eye camera cable is also connected to the appropriate port in the eye camera control card (See Section 3, Figure 4). If the eye camera is selected as EC120 in the software, but the eye camera cable is actually plugged into the 240 Hz port on the back of the PC, you will see the following type of display in the eye monitor:
Figure A.5: Eye Camera Plugged into Wrong Port
If you see this, remove the eye camera cable from the 240 Hz Eye Imager In port and plug it into the 120 Hz port.

ISCAN ETL-200 Instructions
Section 10: ETL-200 Appendices 68
Appendix B: Eye and Room Monitor
The ETL-200 includes capability for two on-screen video displays to show live video within the DQW software data acquisition and control window.
The ETL-200 is configured with an eye monitor display standard that shows the real time image of the lower animal or human subject’s eye movements. Directly beneath the eye monitor display is another display area labeled “Room Monitor.”
If a video feed is available from a camera viewing the animal or human subject during the experiments, it can be easily interfaced with the on-screen video display card in the eye tracker computer to appear simultaneously with the eye image. This feature saves the experimenter from mounting an additional video monitor for viewing the animal or experiment room environment.
Both the eye and room video displays have controls beneath the images, if needed, to adjust the brightness and contrast levels over a range of 0 – 63.
Adding a Room Monitor
Attaching an additional video feed to the DQW window display requires an NTSC monochrome or color video source. Attach the video source to the BNC labeled “Room Monitor” on the on-screen video display card in the third slot in the back of the eye tracker computer chassis. (See Figure 4.) When the video source is connected to the BNC labeled “Room Monitor Video In,” the DQW window will show a representation of this video input as shown in Figure B.1 below.
Figure B.1: Room Monitor Connected

ISCAN ETL-200 Instructions
Section 10: ETL-200 Appendices 69
Clicking on the box to the upper right of the display will enlarge the image as shown in Figure B.2 below.
Figure B.2: Room Monitor Enlarged
Eye & Room Monitor Settings
The title of the second video display can be customized to represent the type of imagery viewed on the monitor. The positions of the monitor displays can be moved to suit the system operator.
With Track Active disabled, click on the “Fork & Spoon” configuration icon [Figure 7 (8)] to display the ISCAN system configuration panels. Select the OS Video configuration panel and it will appear as shown in Figure B.3 below:
Figure B.3: On-Screen Video Display Monitor Configuration Panel
The title of either monitor can be changed to describe the image content, by typing the desired information into the respective title box. The monitor position layout can be moved from the side of the DQW window to the bottom if preferred.

ISCAN ETL-200 Instructions
Section 10: ETL-200 Appendices 70
In almost all ETL-200 systems, the Card Location should be set for “Mini Lab.” In the “Mini Lab” configuration, the PCI bus data transfer is at its maximum for internal data recording. The “Mini Lab” setting reverts all on-screen display monitor images to their small size during data recording, even if the session begins with one or the other image enlarged. The smaller-sized monitor displays do not require as much data transfer over the PCI card bus as when the images are filling up the graph display area. If the Card Location is set to “Computer” the monitor displays will remain in the large or small mode, as decided by the operator, during data recording. At 240 Hz, this configuration might negatively impact the internal data recording, potentially causing loss or skipping of recorded data, so leave the card location set to “Mini Lab.”

ISCAN ETL-200 Instructions
Section 10: ETL-200 Appendices 71
Appendix C: Serial I/O
Auxiliary Serial Output Formats
ISCAN Serial Output Format (ASCII)
When the ASCII format is specified, the serial output data packet consists of a single line of ASCII character bytes terminated by /r/n bytes (carriage return/line feed characters). Each data byte is 8 bits with 1 start bit, 1 stop bit and no parity. Data is streamed out with no active handshaking. Each data value is separated by a /t (tab) character. Each data value will appear in the format XXXX.X, where each X represents the ASCII representation of numerals 0 -> 9. This data format can be read by any terminal emulation program (e.g. "Hyperterminal").
Standard Point-of-Regard output will consist of one data packet for each sample at 60 samples per second. Each packet will consist of two (2) data values POR_H and POR_V that are the horizontal and vertical coordinates of the eye point-of-regard. Each of the POR data values varies from 0 to 511 with (0,0) being the upper left corner of the viewed scene.
When the ASCII format is specified, the serial output data packet consists of a single line of ASCII character bytes terminated by /r/n bytes (carriage return/line feed characters). Each data byte is 8 bits with 1 start bit, 1 stop bit and no parity. Each data value is separated by a /t (tab) character. Each data value will appear in the format XXXX.X, where each X represents the ASCII representation of numerals 0 -> 9. This data format can be read by any terminal emulation program (e.g. "Hyperterminal") but the number of data bytes transmitted will be significantly greater than when using the binary format (see below).
Binary Output Format
When the binary format is selected, the serial output data packet consists of a set of data bytes in a specific packet format. Each data byte is 8 bits with 1 start bit, 1 stop bit and no parity. Each data value is multiplied by 10 and encoded as 2 integer bytes (LSB/MSB) in the packet. The packet format is shown below:
Byte Value (Hex)
0 0X 44 - Header Byte 1 1 0X 44 - Header Byte 2 2 0X ?? - Ch1 Parameter x 10 (LSB) 3 0X ?? - Ch1 Parameter x 10 (MSB) 4 0X ?? - Ch2 Parameter x 10 (LSB) 5 0X ?? - Ch2 Parameter x 10 (MSB) . . (Repeated for each parameter) .

ISCAN ETL-200 Instructions
Section 10: ETL-200 Appendices 72
Remote Serial Controls
The DQW software also allows the user to remotely control data recording and send synchronizing bytes to be incorporated in recorded data files.
To enable the serial input capability in DQW [see also Section 7((E)]:
• In the DQW "System Configuration" dialog, select the "Serial I/O" tab.
• Of the available COM channels, specify the COM port to be used as "Data I/O", the baud rate to match the remote data sending system, and select "Input" as active.
• Click on "OK" to register changes to the system configuration.
• With the above steps completed, the DQW system is ready to receive serial commands from a remote source. All DQW remote serial commands are single bytes between 128 and 255 (80 -> FF Hex).
• Whenever "Track Active" is enabled, the DQW system can receive and record any single serial byte between 0 and 127 (00 and 7F Hex) as a synchronizing data marker. These bytes are represented as parameter "SerIn0" wherever parameter selections are made for display or recording in the DQW program.
• To trigger data recording via the serial port, in the DQW "System Configuration" dialog, select the “Recording” tab and set the recording “Trigger” to “Serial.”
Remote Serial Command Bytes
Description of Data Recording Command Byte (Hex)
Start Recording 84 = 132 decimal
Quit Recording 88 = 136 decimal

ISCAN ETL-200 Instructions
Section 10: ETL-200 Appendices 73
Appendix D: Optional 24-bit Digital I/O
The ETL-200 can be upgraded to include a 24-bit TTL PCI I/O card. This card is normally installed in the fifth PCI slot from the bottom of the tower PC chassis. If the 24-bit PCI digital card is installed, an additional I/O card selection appears in the ISCAN Digital I/O Configuration panel that reads DIO24PCI-0, as shown in Figure D.1 below.
Figure D.1: DIO24 Configuration Panel
When the I/O Config is set to IND Line I/O as shown above, this allows all 24 of the digital bits to be configured as independent digital inputs or outputs. When the DIO24PCI-0 card is selected, the digital Bank1 displays panels for three 8-bit digital ports: PortA, PortB, and PortC. The bits of each port can be designated as either inputs or outputs.
Click OK to return to the main DQW window, and then click the Options button until the Auxiliary Output Control panel appears. Click on the Digital tab, and select from any of the three byte locations (Bank1-PortA, Bank1-PortB, and Bank1-PortC) as shown in Figure D.2 below, to load in any of the digital output selections as described above in the 4-bit digital output instructions [Section 7(F)].
Figure D.2: Digital Output Controls using 24-bit Card

ISCAN ETL-200 Instructions
Section 10: ETL-200 Appendices 74
The 24-bit digital I/O card also supports output of two 12-bit digital parameters in real time. When the I/O card is selected for DIO24PCI-0 in the ISCAN Digital Configuration panel and the I/O Config is set for Params Out, the Bank1 display is disabled and only indicates three digital banks of data out available, as shown in Figure D.3 below.
Figure D.3: Digital IO Configuration Panel
Once again click on OK in the Digital configuration panel to return to the DQW main window, toggle through the Options until the Auxiliary Output Controls panel appears, and click on the Digital tab. Bank1 is displayed below, in which two 12-bit digital parameters can be selected for output, as shown in Figure D.4.
Figure D.4: Digital Output Controls for Params Out

ISCAN ETL-200 Instructions
Section 10: ETL-200 Appendices 75
These two 12-bit parallel TTL words are split between Ports A, B, and C as shown in the following pin out diagram.
A0 PIN 37 B0 PIN 10 (LSB) A1 PIN 36 B1 PIN 9 A2 PIN 35 B2 PIN 8 A3 PIN 34 B3 PIN 7 A4 PIN 33 B4 PIN 6 A5 PIN 32 B5 PIN 5 A6 PIN 31 B6 PIN 4 A7 PIN 30 B7 PIN 3 C0 PIN 29 C4 PIN 25 C1 PIN 28 C5 PIN 24 C2 PIN 27 C6 PIN 23 C3 PIN 26 C7 PIN 22 (MSB)
Figure D.5: 37-pin D-sub Connector Pin-Out Diagram


![Muqaddimah Ibn Khaldun [ first 200 pages ]](https://static.fdocuments.in/doc/165x107/5872f2ac1a28ab8c718b4e0d/muqaddimah-ibn-khaldun-first-200-pages-.jpg)