
ETIP PV conference: 'Photovoltaics: centre-stage in the power system
324
OPENING SESSION Chair: Marko Topič, University of Ljubljana, Chair of ETIP PV • Welcome by the organisers • Pierre-Jean Alet and Venizelos Efthymiou, Leaders of the Grid Integration working group of ETIP PV • Policy keynote: European Energy Union, EU strategy • Jeroen Schuppers, EC DG Research & Innovation • Technology/industry keynote: PV as major electricity source • Eicke Weber, Fraunhofer ISE, EUREC President REPOWERING EUROPE Photovoltaics: centre-stage in the power system
-
Upload
clustertweed -
Category
Environment
-
view
1.163 -
download
0
Transcript of ETIP PV conference: 'Photovoltaics: centre-stage in the power system
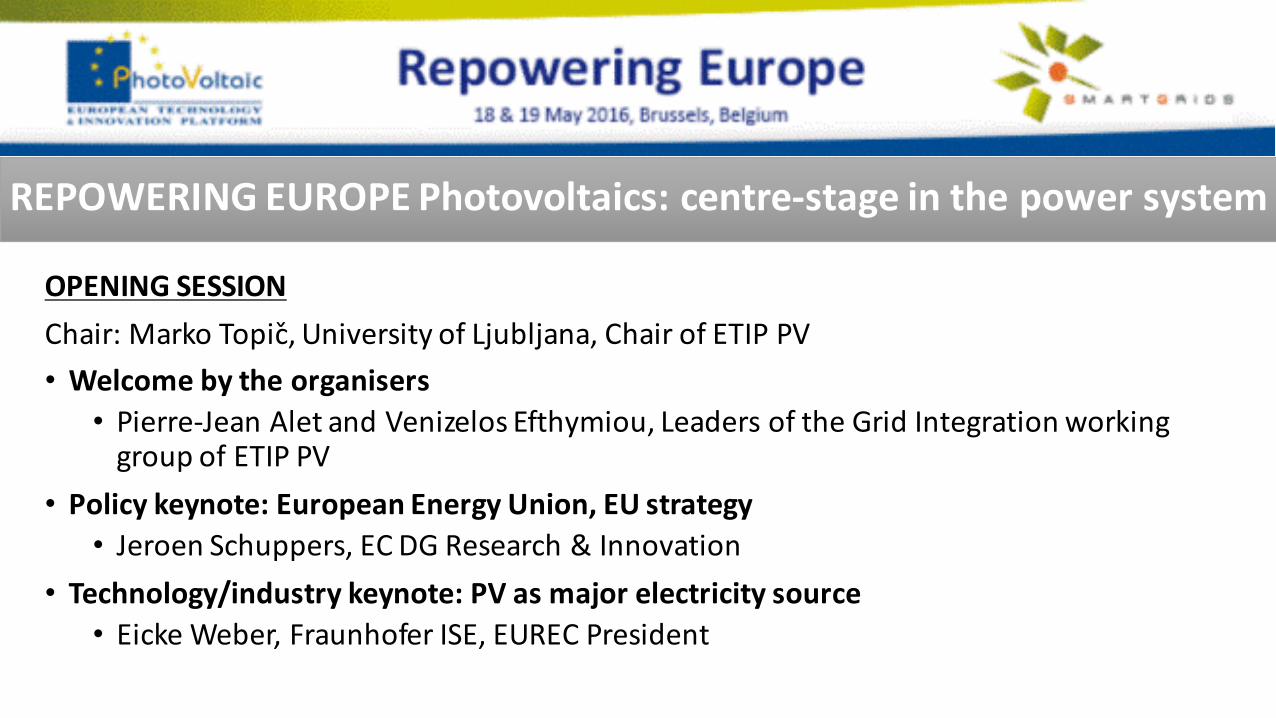
OPENINGSESSIONChair:MarkoTopic,University ofLjubljana,ChairofETIPPV• Welcome bytheorganisers
• Pierre-JeanAletandVenizelos Efthymiou,LeadersoftheGrid Integration workinggroupofETIPPV
• Policykeynote:European Energy Union,EUstrategy• JeroenSchuppers,ECDGResearch &Innovation
• Technology/industry keynote:PVasmajorelectricity source• Eicke Weber,FraunhoferISE,EURECPresident
REPOWERINGEUROPEPhotovoltaics:centre-stageinthepowersystem
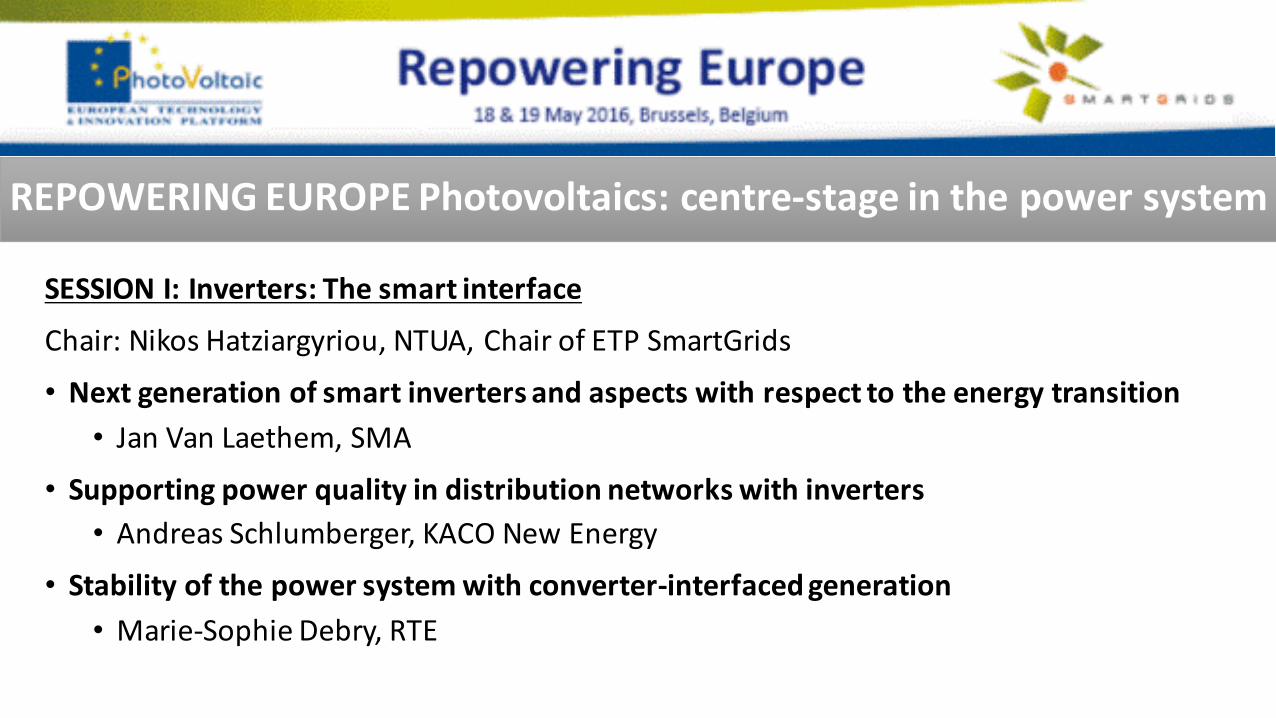
SESSIONI:Inverters:Thesmartinterface
Chair:NikosHatziargyriou,NTUA,ChairofETPSmartGrids
• Next generation ofsmartinverters andaspectswith respecttotheenergy transition• JanVanLaethem,SMA
• Supporting powerquality indistributionnetworkswith inverters• AndreasSchlumberger,KACONewEnergy
• Stability ofthepowersystemwith converter-interfacedgeneration• Marie-SophieDebry,RTE
REPOWERINGEUROPEPhotovoltaics:centre-stageinthepowersystem
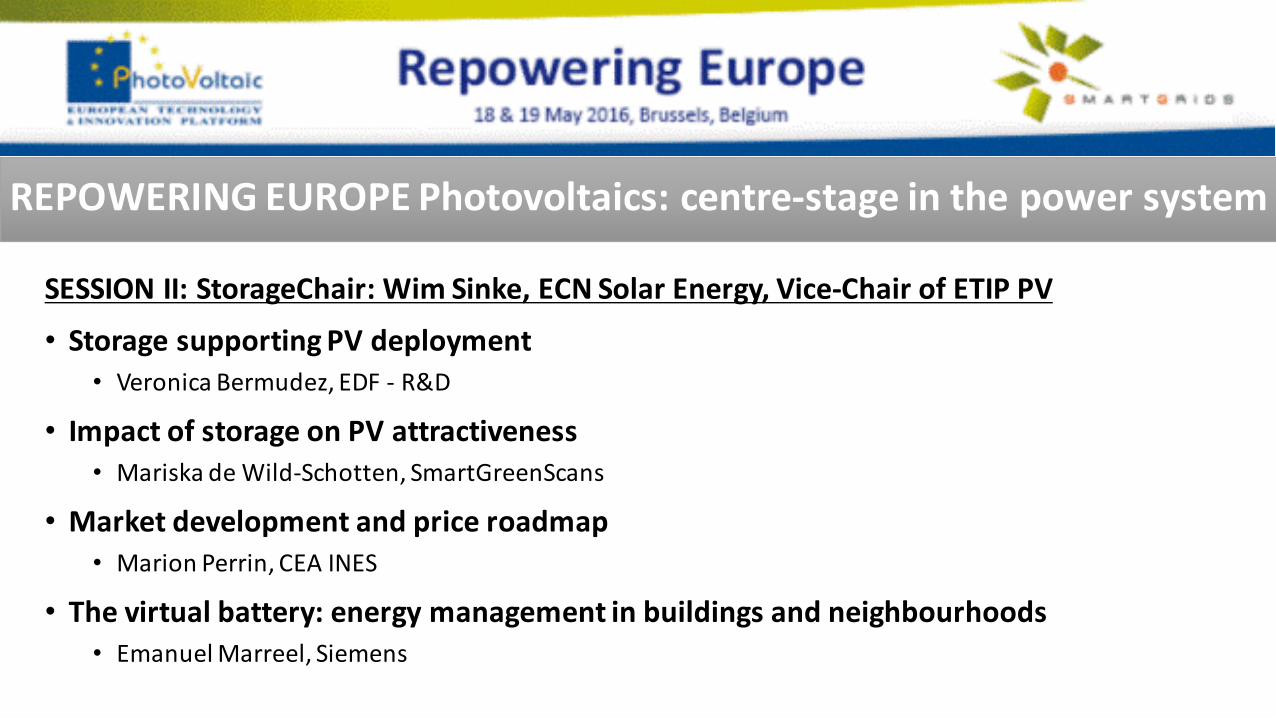
SESSIONII:StorageChair:WimSinke,ECNSolarEnergy,Vice-ChairofETIPPV
• Storagesupporting PVdeployment• VeronicaBermudez,EDF- R&D
• Impactofstorage onPVattractiveness• Mariska deWild-Schotten,SmartGreenScans
• Market development andprice roadmap• MarionPerrin,CEAINES
• Thevirtual battery:energy managementinbuildingsandneighbourhoods• EmanuelMarreel,Siemens
REPOWERINGEUROPEPhotovoltaics:centre-stageinthepowersystem
SESSIONIII:Electricity market andsystemoperations
Chair:Venizelos Efthymiou,University ofCyprus,Vice-LeaderoftheGrid Integrationworking groupofETIPPV
• Real-timemonitoring• NikosHatziargyriou,NTUA,ChairofETPSmartGrids
• Forecasting usecases• MarionLafuma,Reuniwatt
• Market access• MaherChebbo,SAP
REPOWERINGEUROPEPhotovoltaics:centre-stageinthepowersystem
SESSIONIV:PVchanging thepowerbusiness
Chair:Pierre-JeanAlet,CSEM,LeaderoftheGrid Integration working groupofETIPPV
• Changing roles:businessmodels• Johannesvon Clary,E.On
• PVvalueforEuropebeyond electrons• JamesWatson,SolarPower Europe
REPOWERINGEUROPEPhotovoltaics:centre-stageinthepowersystem
Jeroen SCHUPPERS
European Commission,
DG Research and Innovation
An Energy Union for Research, Innovation and Competitiveness
Repowering Europe Brussels, 18 May 2016
1
Towards an Energy Union
● The Energy Union is a top priority for this
Commission
● More cooperation/coordination among MS is
expected in order to better face current
challenges, in particular as regards energy
security and climate
● More cooperation/coordination among MS is the
foundation of the European Research Area 2
1. Energy security, solidarity and trust
2. A fully integrated European energy market
3. Energy efficiency contributing to moderation of demand
4. Decarbonising the economy
5. Research, Innovation and Competitiveness
Energy Union (5 pillars):
5
The new Strategic Energy Technology Plan (SET Plan)
3
4
Strategic Energy Technology (SET) Plan
● The technology pillar of EU energy and climate change policy
● In force since 2010/11
● Objective: to accelerate the development of a portfolio of low carbon technologies leading to their market take-off
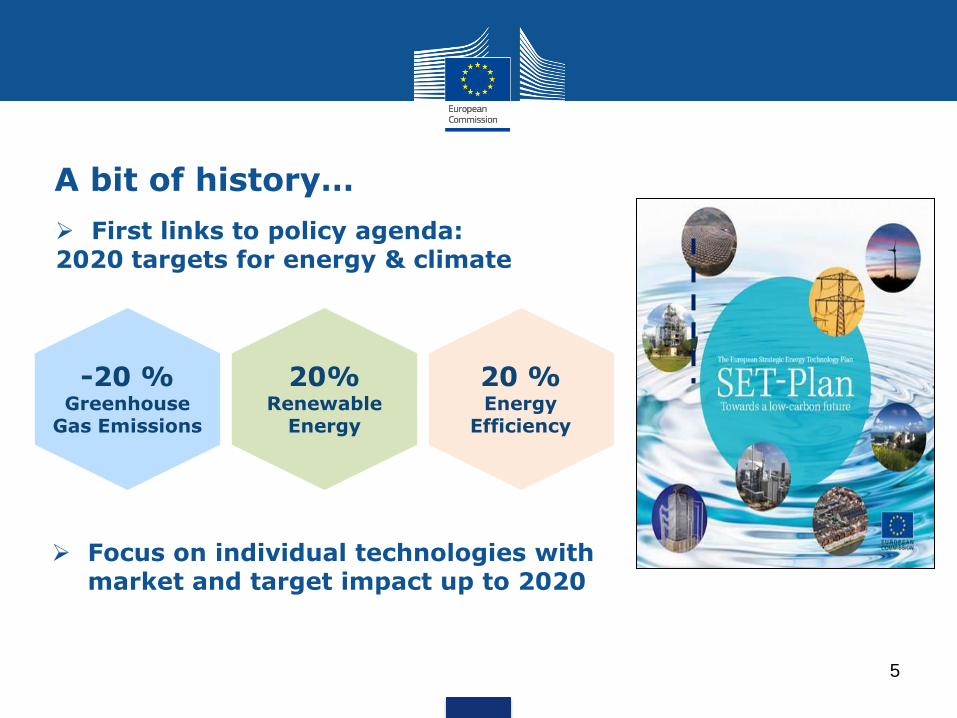
First links to policy agenda: 2020 targets for energy & climate
Focus on individual technologies with market and target impact up to 2020
A bit of history…
-20 % Greenhouse
Gas Emissions
20% Renewable
Energy
20 % Energy
Efficiency
5
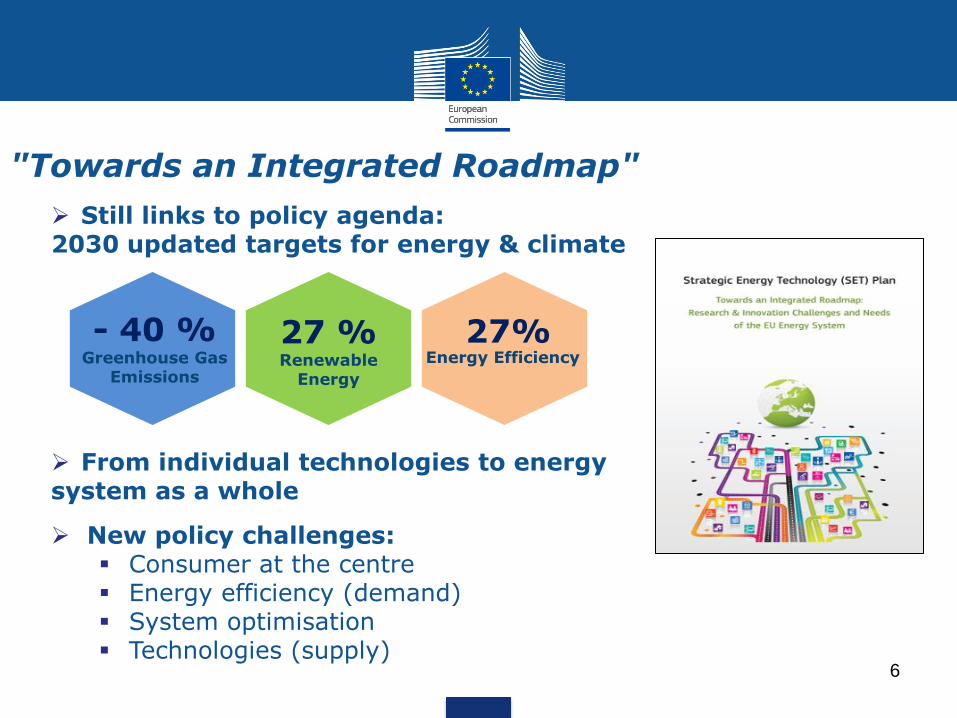
"Towards an Integrated Roadmap"
- 40 % Greenhouse Gas
Emissions
27 % Renewable
Energy
27% Energy Efficiency
Still links to policy agenda: 2030 updated targets for energy & climate
From individual technologies to energy system as a whole
New policy challenges: Consumer at the centre Energy efficiency (demand) System optimisation Technologies (supply)
6
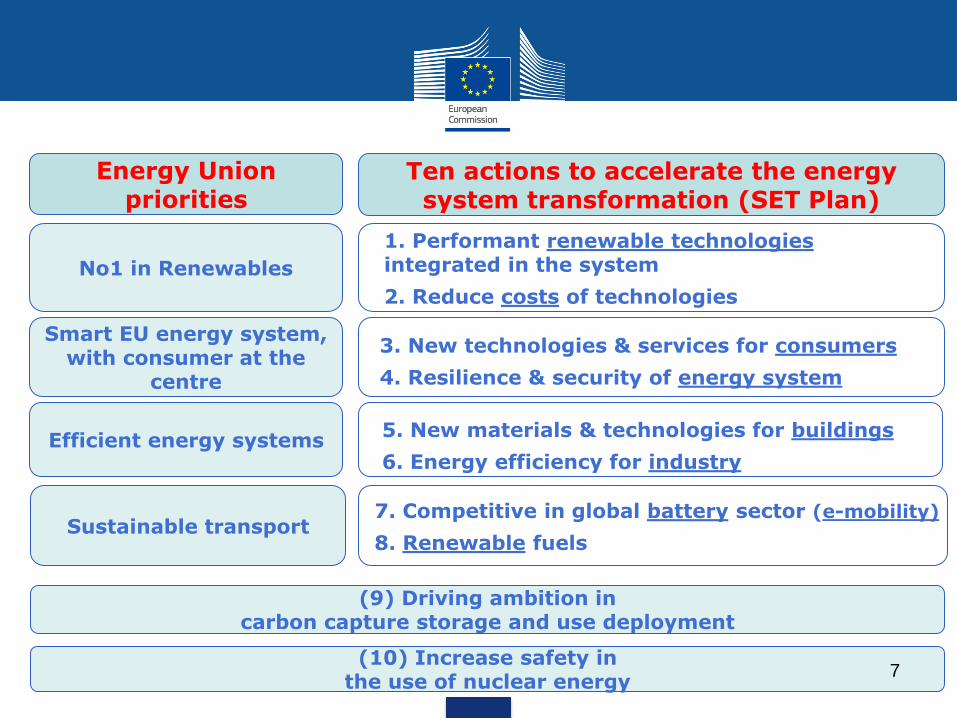
Energy Union priorities
Ten actions to accelerate the energy system transformation (SET Plan)
No1 in Renewables
1. Performant renewable technologies integrated in the system
2. Reduce costs of technologies
Smart EU energy system, with consumer at the
centre
3. New technologies & services for consumers
4. Resilience & security of energy system
Efficient energy systems 5. New materials & technologies for buildings
6. Energy efficiency for industry
Sustainable transport 7. Competitive in global battery sector (e-mobility)
8. Renewable fuels
(9) Driving ambition in carbon capture storage and use deployment
(10) Increase safety in the use of nuclear energy
7
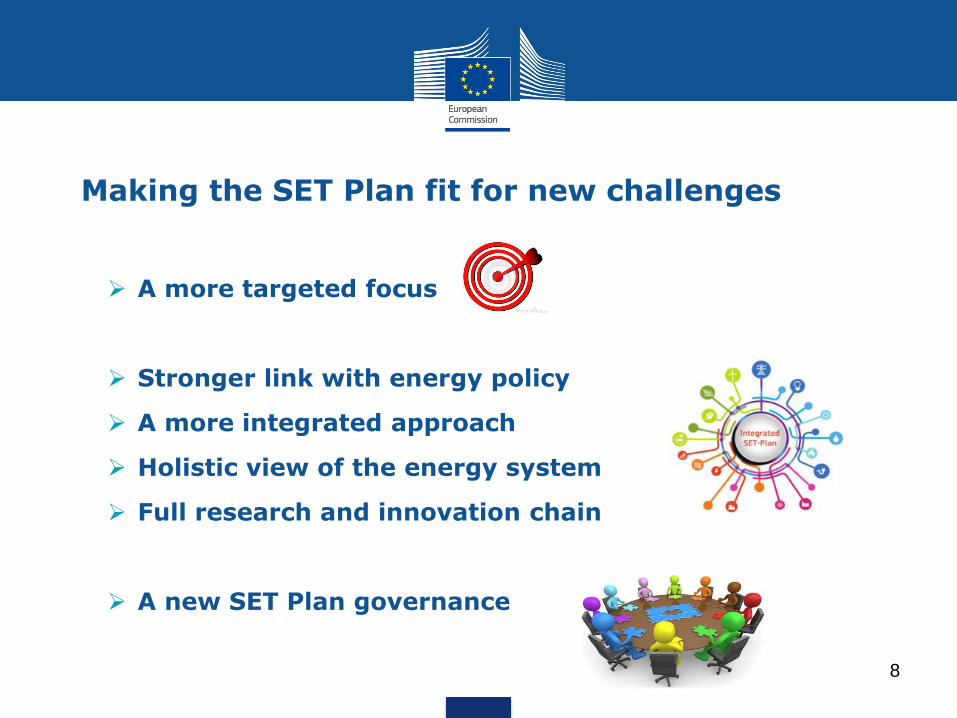
Making the SET Plan fit for new challenges
A more targeted focus
Stronger link with energy policy
A more integrated approach
Holistic view of the energy system
Full research and innovation chain
A new SET Plan governance
8
A new SET Plan governance model
1. Strengthened cooperation
With Members States [EU 28 + Iceland, Norway, Switzerland and Turkey]
With Stakeholders
o Opening and widening to new actors
o Bringing together all relevant stakeholders including, e.g. ETIPs, EERA, PPPs, JTIs, KET stakeholders, stakeholders from funding instruments under the Emissions Trading System…
2. More coordination between Members States:
More joint actions
9
3. Transparency, indicators and periodic reporting
Annual KPIs:
o Level of investments – public and private sector
o Trends in patents
o Number of researchers active in the sector
Every 2 years, progress should be measured on:
o Technology developments
o Cost reduction
o Systemic integration of new technologies
State of the Energy Union Report
4. Monitoring and knowledge sharing
A new SET Plan governance model
10
The SET Plan Actors
• European Commission
• Member States
• Stakeholder platforms
11
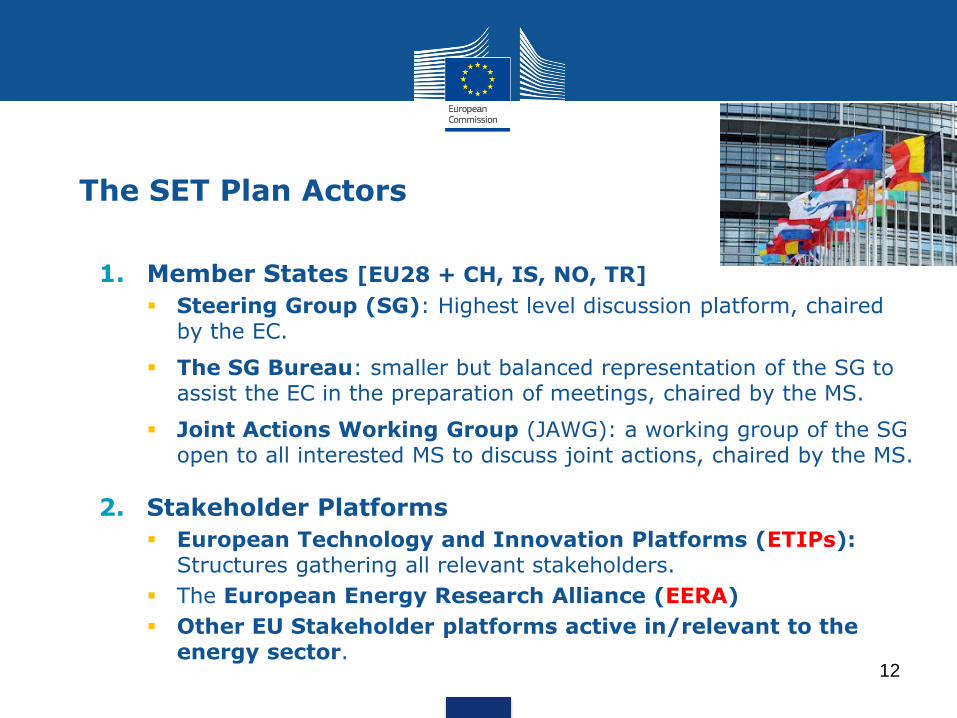
The SET Plan Actors
1. Member States [EU28 + CH, IS, NO, TR]
Steering Group (SG): Highest level discussion platform, chaired by the EC.
The SG Bureau: smaller but balanced representation of the SG to assist the EC in the preparation of meetings, chaired by the MS.
Joint Actions Working Group (JAWG): a working group of the SG open to all interested MS to discuss joint actions, chaired by the MS.
2. Stakeholder Platforms
European Technology and Innovation Platforms (ETIPs): Structures gathering all relevant stakeholders.
The European Energy Research Alliance (EERA)
Other EU Stakeholder platforms active in/relevant to the energy sector.
• 12
European Technology and Innovation Platforms (ETIPs)
Participants
● Continuation of existing ETPs and EIIs in unified Platforms per technology.
● Recognised interlocutors about sector specific R&I needs
● Composition – covering the whole innovation chain: industrial stakeholders (incl. SMEs), research organisations and academic stakeholders, business associations, regulators, civil society and NGOs, representatives of MS
Freedom to organise yourselves as you see fit.
13
European Technology and Innovation Platforms (ETIPs)
Main Role: strategic advice to the EC and the Steering Group based on consensus
● Prioritisation within the 10 key actions both on objectives and implementation;
● Implementation: what best at EU/national/regional/industrial level;
● Prepare and update Strategic Research and Innovation Agendas;
● Identify innovation barriers, notably related to regulation and financing;
● Report on the implementation of R&I activities at European, national/regional and industrial levels;
● Develop knowledge-sharing mechanisms that help bringing R&I results to deployment.
14
SET Plan implementation in a nutshell
1. Setting targets
2. Select and monitor specific R&I actions
3. Identify and agree on Joint Actions
4. Identify Flagship Actions (at European and national levels)
15
1. Setting targets
● 'Issues Papers' drafted by the Commission (RTD, ENER, JRC), setting the scene and proposing targets
● Publication on SETIS
● Broad stakeholder consultation
● Stakeholders submit position through 'Input Papers'
● Commission drafts 'Declaration of Intent'
● Discussion in meeting of the SET Plan Steering Group with invited stakeholders
● Agreement on targets and agree to develop an implementation plan
16
2. Select & monitor specific R&I actions
• Goals
• Detail what needs to be done over the next years to achieve the targets at European and national level
• Limited set of actions (technological + non-technological)
• Resources + timeline for each R&I action
• Putting a monitoring system in place
• Work to be done in temporary Working Groups
• within ETIP when there is one
• Timeline: ~2-3 months
17
3. Identify/agree on Joint Actions
• Goal • Identify and decide on Joint Actions
• Strategy to be developed for the SET 10 Key Actions • Joint Actions with EU (ERA-Nets) & non-EU funds
• Joint Programming beyond ERA Net
• Joining EU risk financing facility
• Joint policy actions
• Work to be done by the JAWG
• Countries engaged in ERA-Nets
• Results reported to SG and feed Implementation Plan
18
4. Identify Flagship Actions
• Goal
• Identify Flagship Actions (at European or national levels) and specify to which actions they contribute and who implements them
• When no Joint Actions are possible, Flagship Actions can fill the gap
• What is a Flagship Action?
A Flagship action is considered the best example of what R&I can produce in a given sector or with a specific technology in order to reach the SET Plan targets. The innovation potential and the "leading by example" features are key. A flagship action is meant to make a real change in the low-carbon energy technologies landscape.
• Work to be done by the Working Groups
19
Working Groups
• Mission
• To develop the Implementation Plans
• Aligned with Declaration of Intent
• Composition (~ 30)
• Experts from ETIPs
• Input from SET Plan countries (= government representatives) & EC
• Chaired by a champion country + champion industrial stakeholder
• Which countries?
• High policy interest in the sector and committed to engage in Joint Actions
20
● WGs will join the 3 pieces together and finalize the Implementation Plans
● Plans are then reviewed by the SG and adopted when there is consensus
● "On the ground" implementation should follow
Working Groups
21
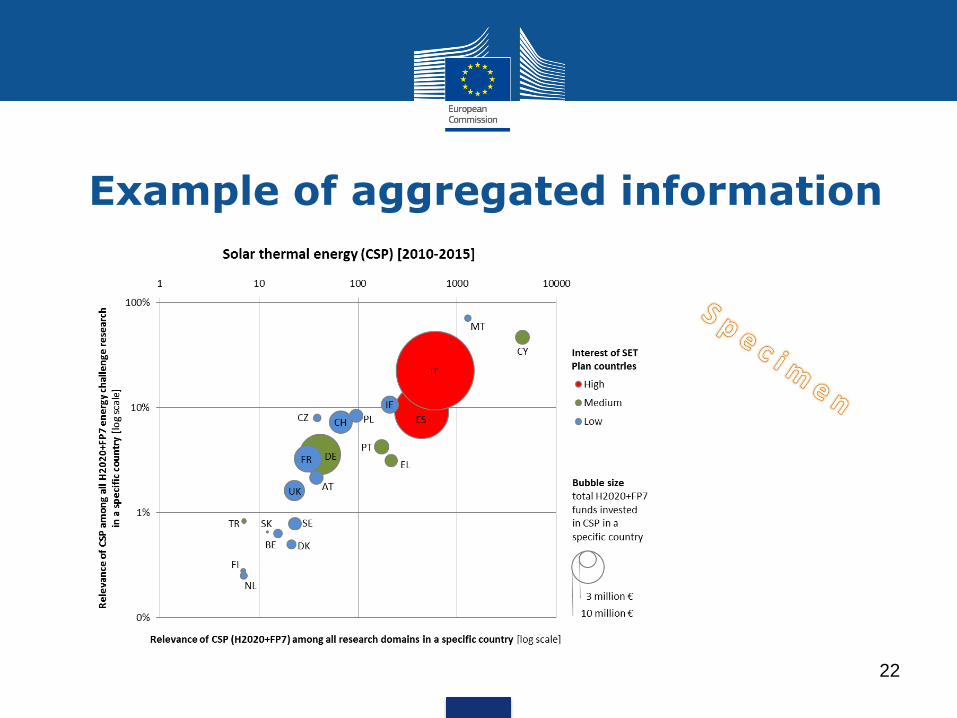
Example of aggregated information
22
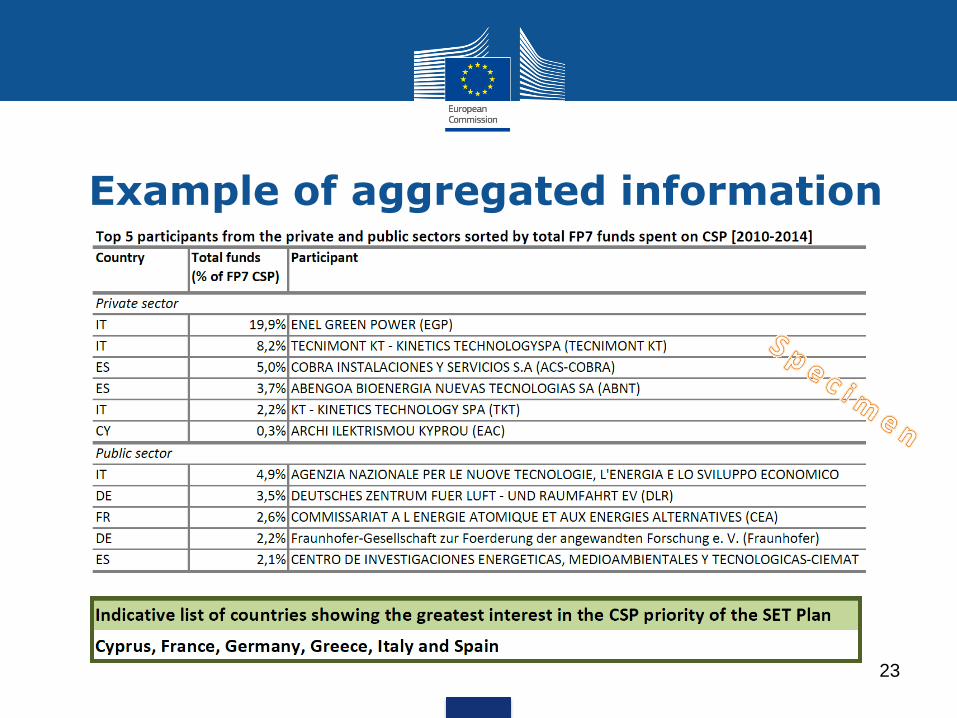
Example of aggregated information
23
24
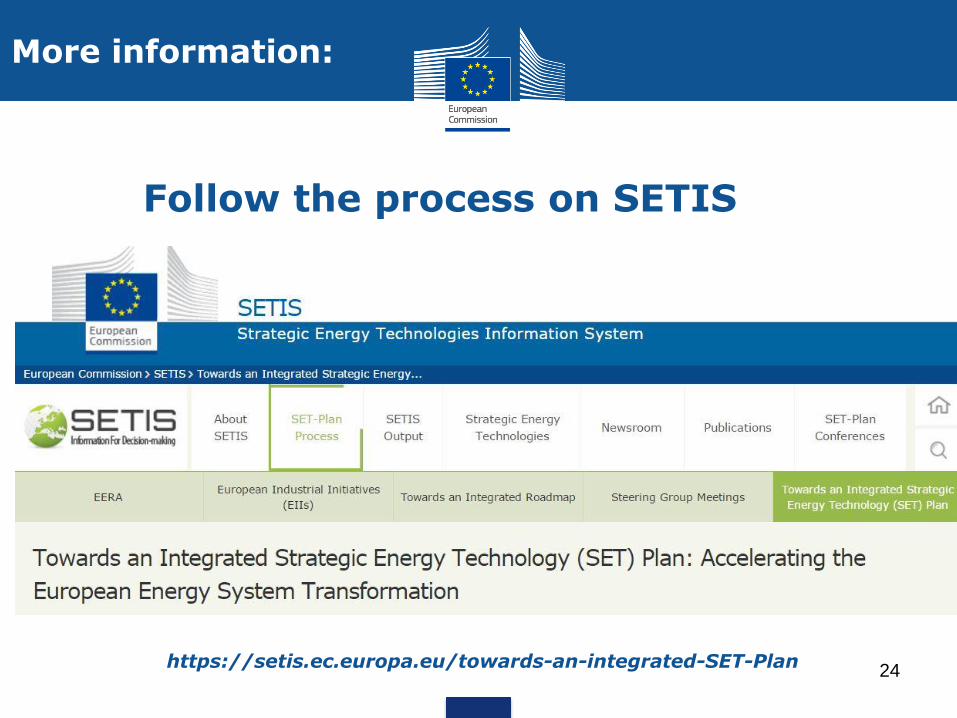
Follow the process on SETIS
https://setis.ec.europa.eu/towards-an-integrated-SET-Plan
More information:
Thank you for your attention
25
© Fraunhofer ISE
PHOTOVOLTAICS AS MAJOR ELECTRICITY
SOURCE
Eicke R. Weber
Fraunhofer Institute for Solar Energy
Systems ISE and
University of Freiburg, Germany
REPOWERING EUROPE
PV European Technology & Innovation
Platform
Brussels, Belgium, May 18, 2016
© Fraunhofer ISE
2
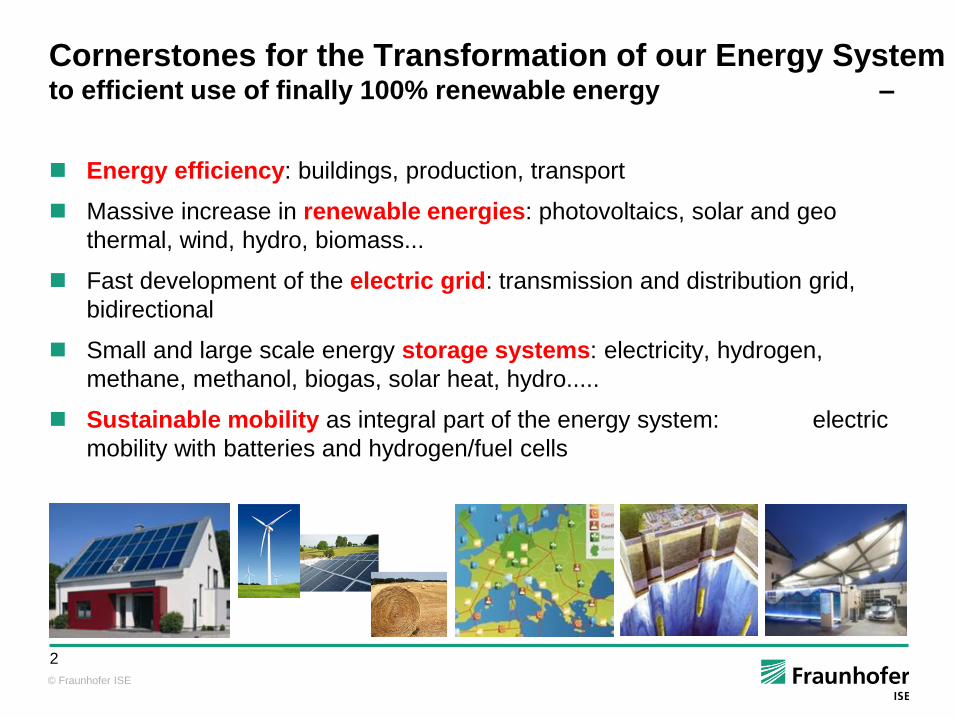
Cornerstones for the Transformation of our Energy System to efficient use of finally 100% renewable energy –
Energy efficiency: buildings, production, transport
Massive increase in renewable energies: photovoltaics, solar and geo
thermal, wind, hydro, biomass...
Fast development of the electric grid: transmission and distribution grid,
bidirectional
Small and large scale energy storage systems: electricity, hydrogen,
methane, methanol, biogas, solar heat, hydro.....
Sustainable mobility as integral part of the energy system: electric
mobility with batteries and hydrogen/fuel cells
© Fraunhofer ISE
3
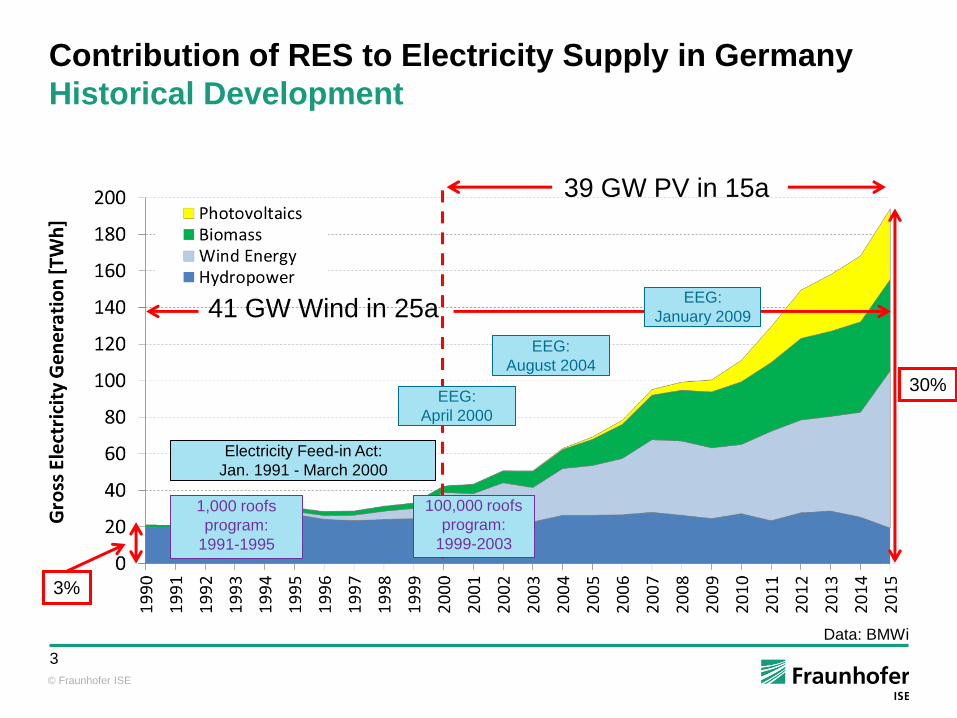
Contribution of RES to Electricity Supply in Germany
Historical Development
Data: BMWi
3%
30%
41 GW Wind in 25a
39 GW PV in 15a
Electricity Feed-in Act:
Jan. 1991 - March 2000
EEG:
January 2009
1,000 roofs
program:
1991-1995
100,000 roofs
program:
1999-2003
EEG:
August 2004
EEG:
April 2000
© Fraunhofer ISE
4
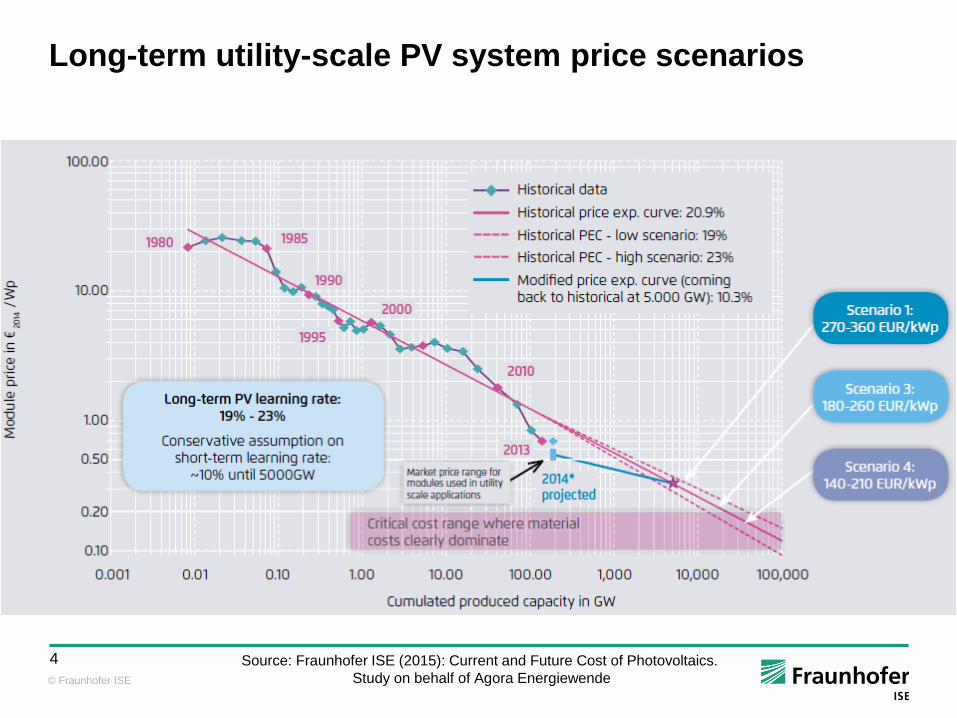
Long-term utility-scale PV system price scenarios
Source: Fraunhofer ISE (2015): Current and Future Cost of Photovoltaics.
Study on behalf of Agora Energiewende
© Fraunhofer ISE
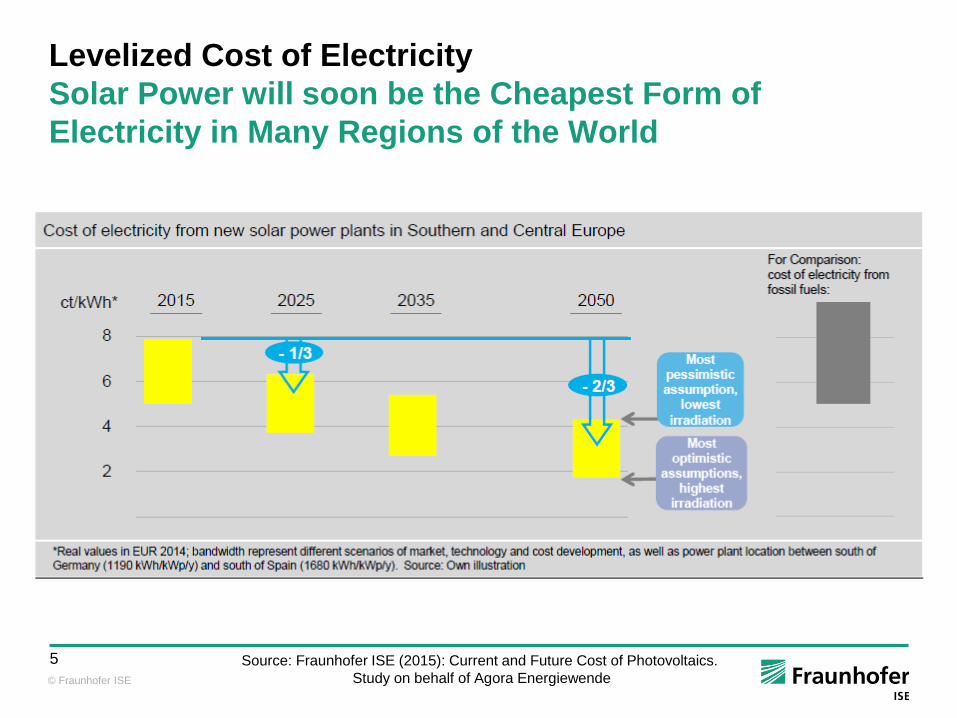
5 Source: Fraunhofer ISE (2015): Current and Future Cost of Photovoltaics.
Study on behalf of Agora Energiewende
Levelized Cost of Electricity
Solar Power will soon be the Cheapest Form of
Electricity in Many Regions of the World
© Fraunhofer ISE
6
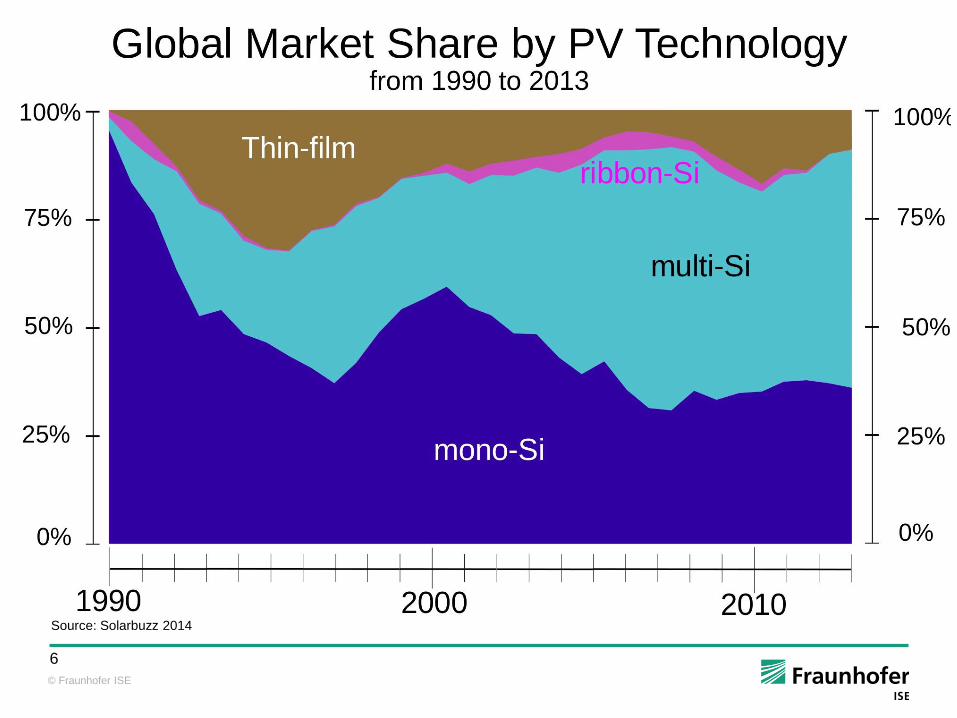
Source: Solarbuzz 2014

© Fraunhofer ISE
7
Crystalline Silicon Technology Portfolio
c-Si PV is not a Commodity, but a High-Tech Product!
material quality
diffusion length
base conductivity
device quality
passivation of surfaces
low series resistance
light confinement
cell structures
PERC: Passivated Emitter
and Rear Cell
MWT: Metal Wrap Through
IBC-BJ: Interdigitated Back
Contact – Back Junction
HJT: Hetero Junction Technology
Adapted from Preu et al., EU-PVSEC 2009
material
quality module
efficiency
Industry
Standard
IBC-BJ
HJT
PERC
MWT- PERC
20%
19%
18%
17%
16%
15% 14%
21%
device quality
BC- HJT
© Fraunhofer ISE
8
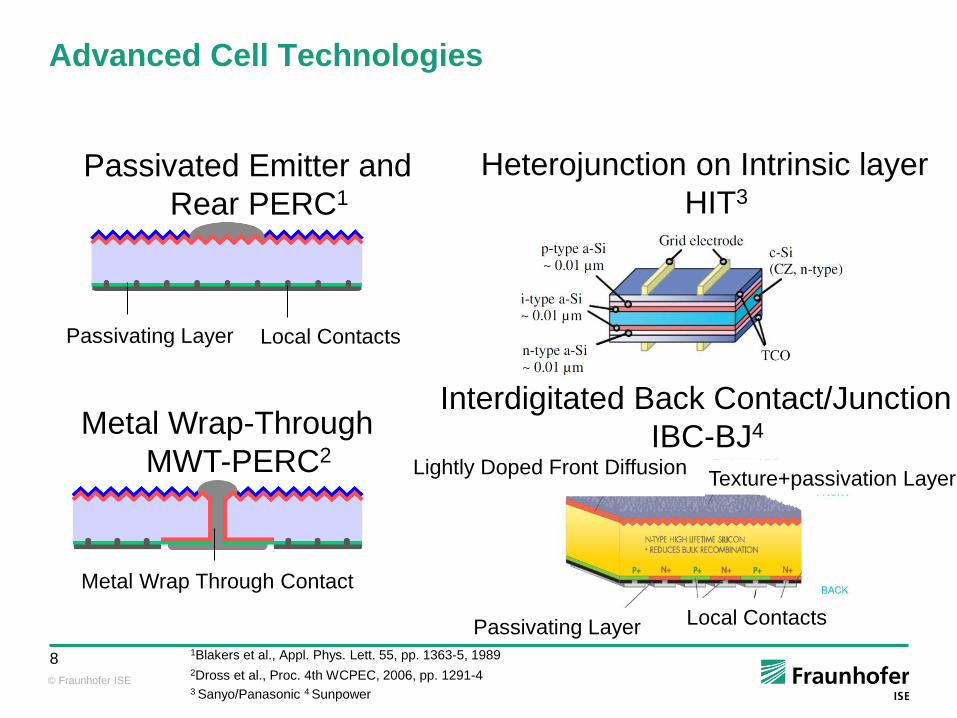
Advanced Cell Technologies
Passivated Emitter and
Rear PERC1
Metal Wrap-Through
MWT-PERC2
2Dross et al., Proc. 4th WCPEC, 2006, pp. 1291-4
1Blakers et al., Appl. Phys. Lett. 55, pp. 1363-5, 1989
Heterojunction on Intrinsic layer
HIT3
Interdigitated Back Contact/Junction
IBC-BJ4
Passivating Layer Local Contacts
Metal Wrap Through Contact Passivating Layer
Local Contacts
Lightly Doped Front Diffusion Texture+passivation Layer
3 Sanyo/Panasonic 4 Sunpower
© Fraunhofer ISE
9
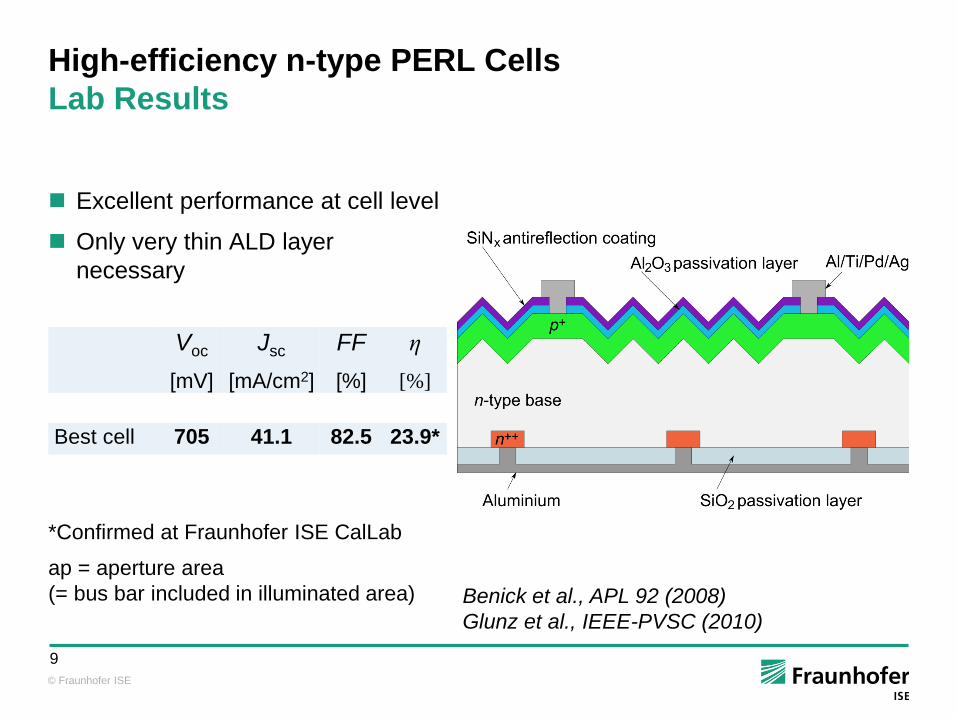
High-efficiency n-type PERL Cells
Lab Results
Excellent performance at cell level
Only very thin ALD layer
necessary
Best cell 705 41.1 82.5 23.9*
Voc
[mV]
Jsc
[mA/cm2]
FF
[%]
η
[%]
Benick et al., APL 92 (2008)
Glunz et al., IEEE-PVSC (2010)
*Confirmed at Fraunhofer ISE CalLab
ap = aperture area
(= bus bar included in illuminated area)
© Fraunhofer ISE
10
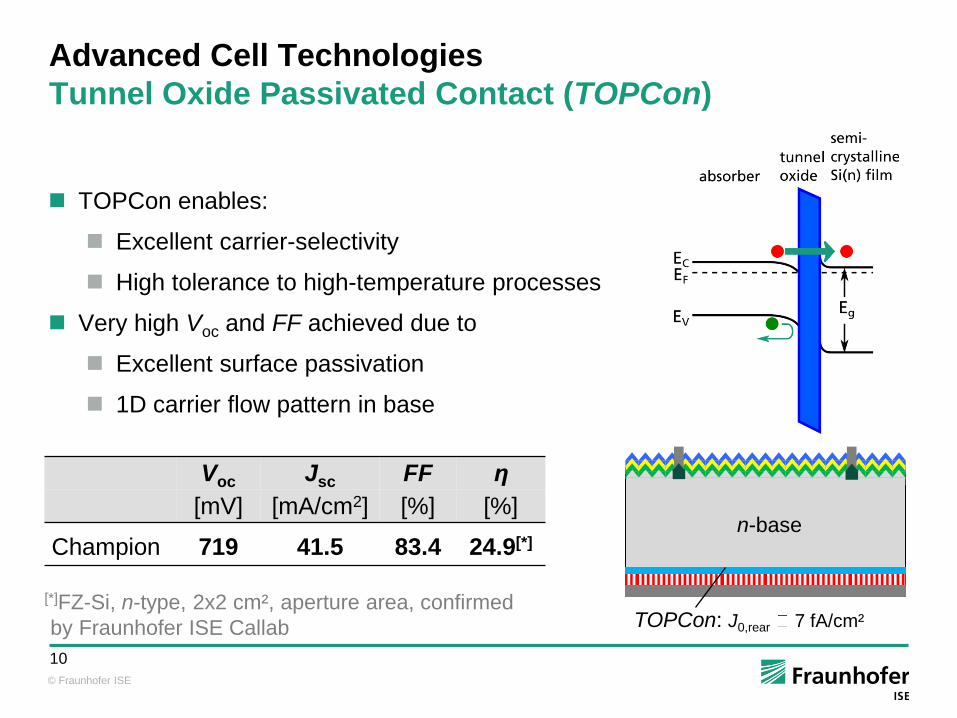
Advanced Cell Technologies
Tunnel Oxide Passivated Contact (TOPCon)
TOPCon enables:
Excellent carrier-selectivity
High tolerance to high-temperature processes
Very high Voc and FF achieved due to
Excellent surface passivation
1D carrier flow pattern in base
Voc Jsc FF η
[mV] [mA/cm2] [%] [%]
Champion 719 41.5 83.4 24.9[*]
TOPCon: J0,rear 7 fA/cm²
n-base
[*]FZ-Si, n-type, 2x2 cm², aperture area, confirmed
by Fraunhofer ISE Callab
© Fraunhofer ISE
11
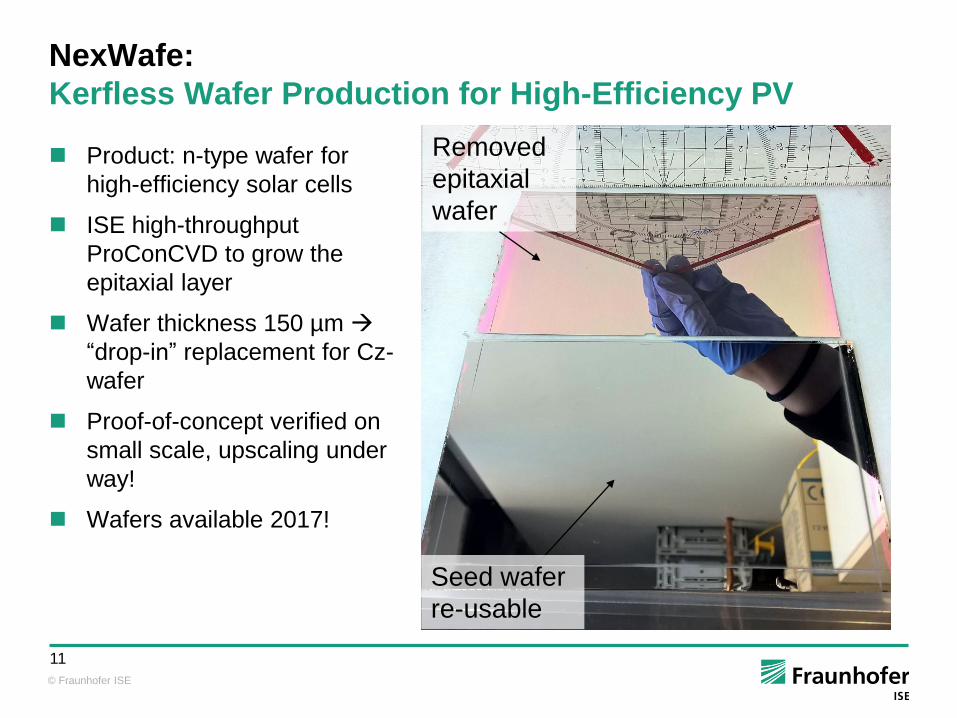
NexWafe:
Kerfless Wafer Production for High-Efficiency PV
Product: n-type wafer for
high-efficiency solar cells
ISE high-throughput
ProConCVD to grow the
epitaxial layer
Wafer thickness 150 µm
“drop-in” replacement for Cz-
wafer
Proof-of-concept verified on
small scale, upscaling under
way!
Wafers available 2017!
Removed
epitaxial
wafer
Seed wafer
re-usable
© Fraunhofer ISE
12
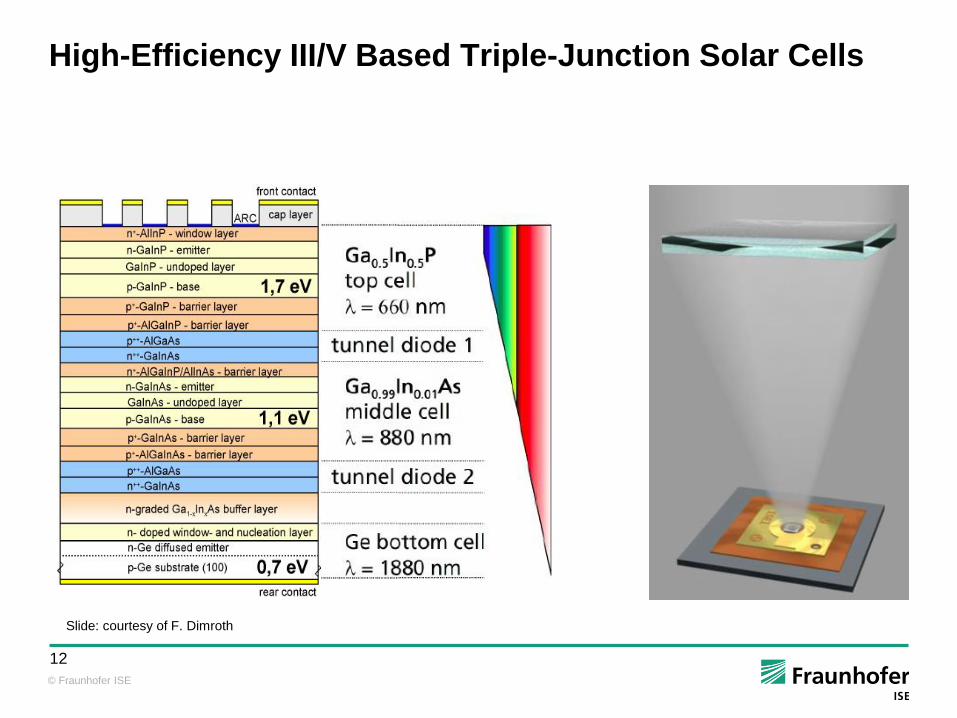
High-Efficiency III/V Based Triple-Junction Solar Cells
Slide: courtesy of F. Dimroth
© Fraunhofer ISE
13
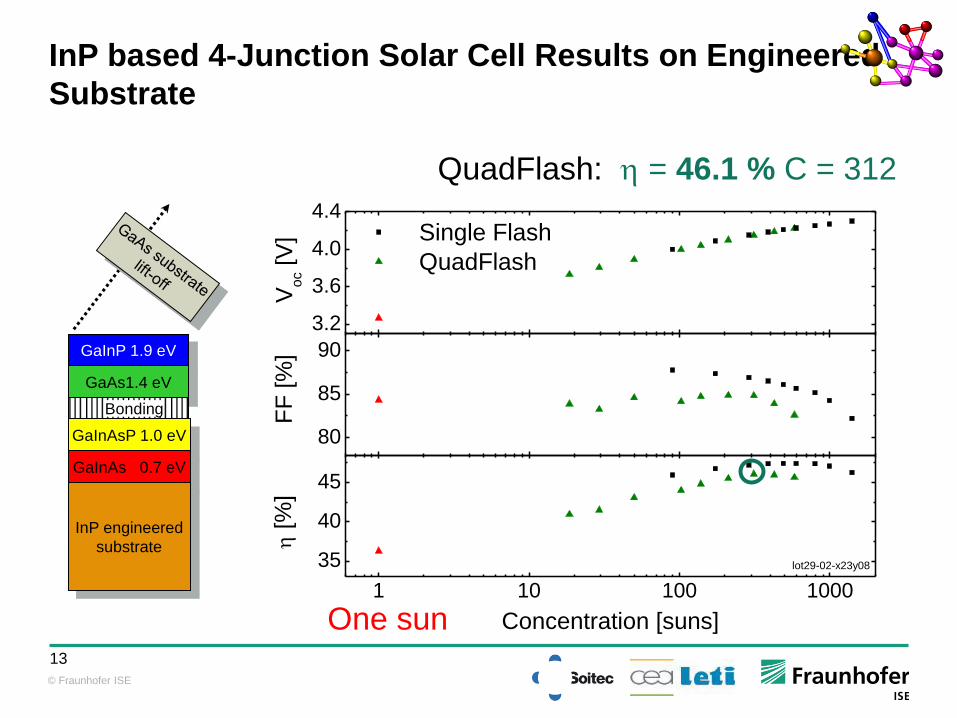
GaInP 1.9 eV
GaAs1.4 eV
GaInAsP 1.0 eV
GaInAs 0.7 eV
Bonding
InP engineered
substrate
InP based 4-Junction Solar Cell Results on Engineered
Substrate
One sun
QuadFlash: h = 46.1 % C = 312
3.2
3.6
4.0
4.4
80
85
90
1 10 100 1000
35
40
45
Vo
c [V
]F
F [%
]
lot29-02-x23y08
Single Flash
QuadFlashh [%
]
Concentration [suns]
© Fraunhofer ISE
14
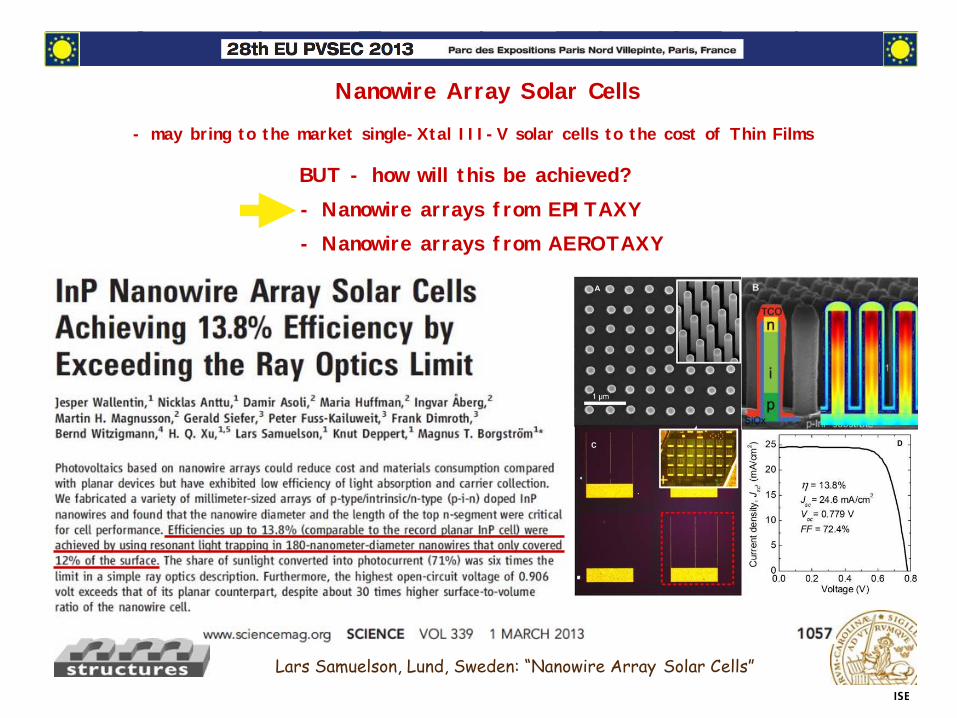
BUT - how will this be achieved?
- Nanowire arrays f rom EPI TAXY
- Nanowire arrays f rom AEROTAXY
- may bring to the market single- Xtal I I I - V solar cells to the cost of Thin Films
Lars Samuelson, Lund, Sweden: “Nanowire Array Solar Cells”
!
Nanowire Array Solar Cells
© Fraunhofer ISE
15
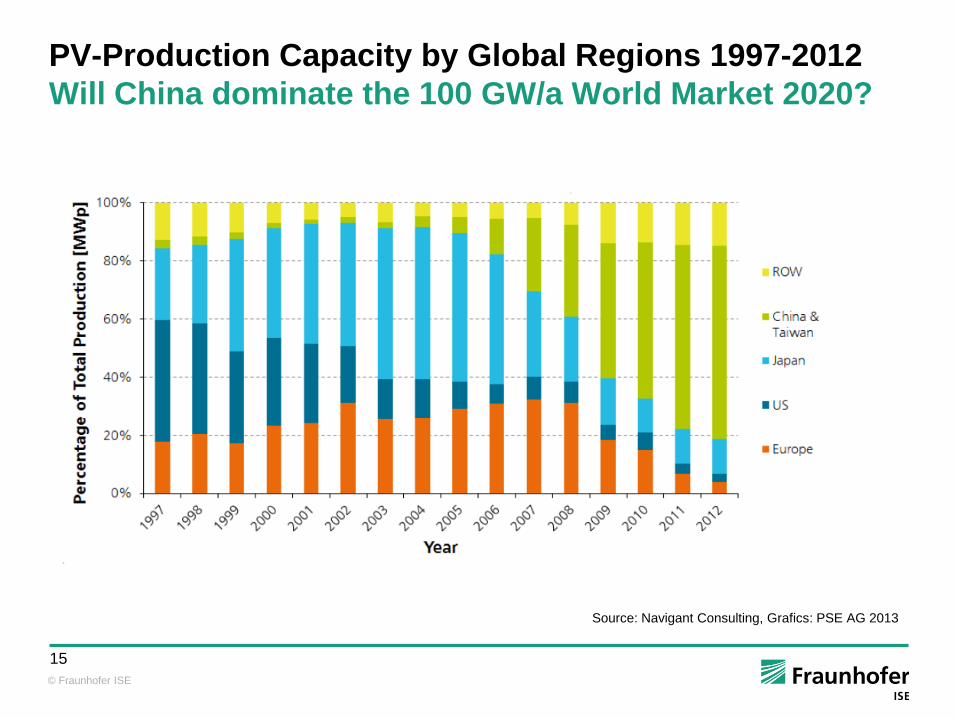
PV-Production Capacity by Global Regions 1997-2012
Will China dominate the 100 GW/a World Market 2020?
Source: Navigant Consulting, Grafics: PSE AG 2013
© Fraunhofer ISE
16
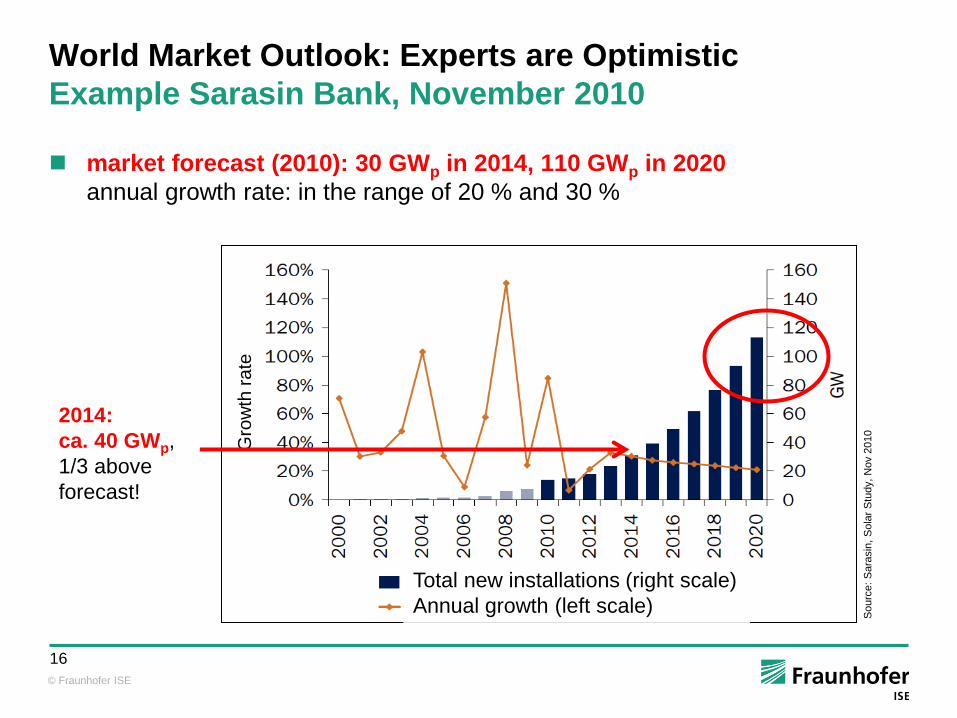
World Market Outlook: Experts are Optimistic
Example Sarasin Bank, November 2010
market forecast (2010): 30 GWp in 2014, 110 GWp in 2020
annual growth rate: in the range of 20 % and 30 %
Newly installed (right)
Annual growth rate (left)
Sourc
e:
Sara
sin
, S
ola
r S
tudy,
Nov 2
010
Gro
wth
ra
te
2014:
ca. 40 GWp,
1/3 above
forecast!
Total new installations (right scale)
Annual growth (left scale)
© Fraunhofer ISE
17
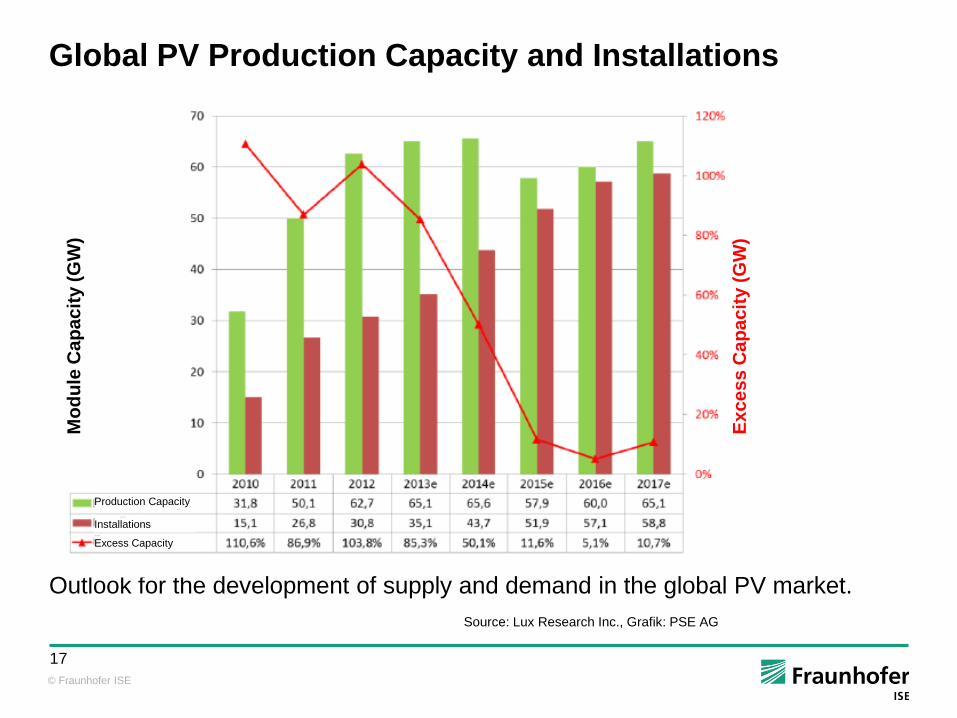
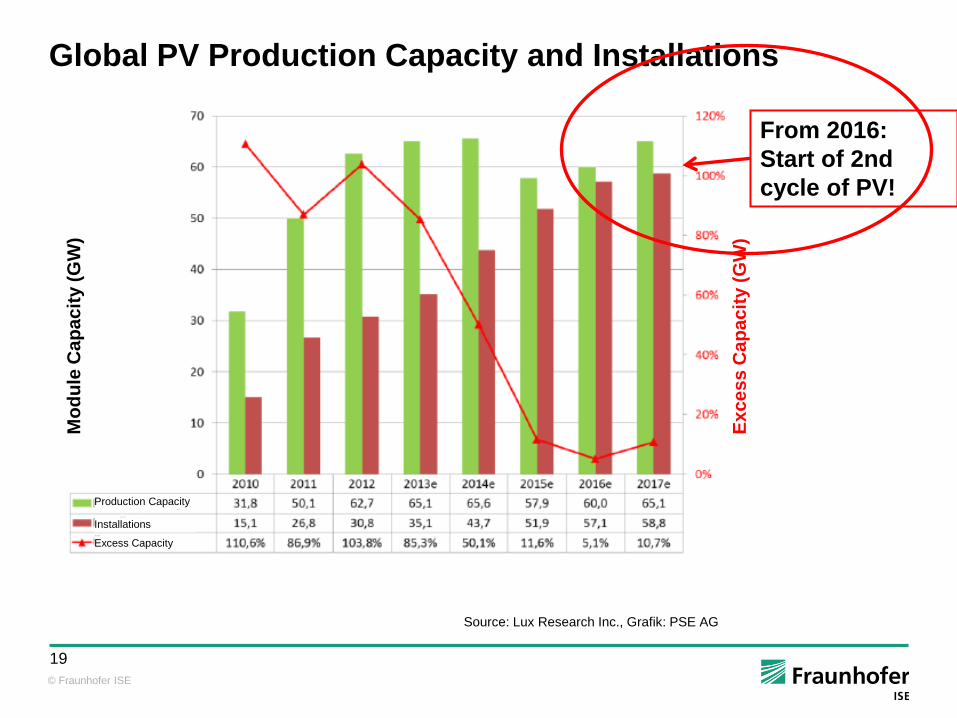
Global PV Production Capacity and Installations
Source: Lux Research Inc., Grafik: PSE AG
Outlook for the development of supply and demand in the global PV market.
Production Capacity
Installations
Excess Capacity
Mo
du
le C
ap
ac
ity (
GW
)
Ex
ce
ss
Ca
pa
cit
y (
GW
)
© Fraunhofer ISE
18
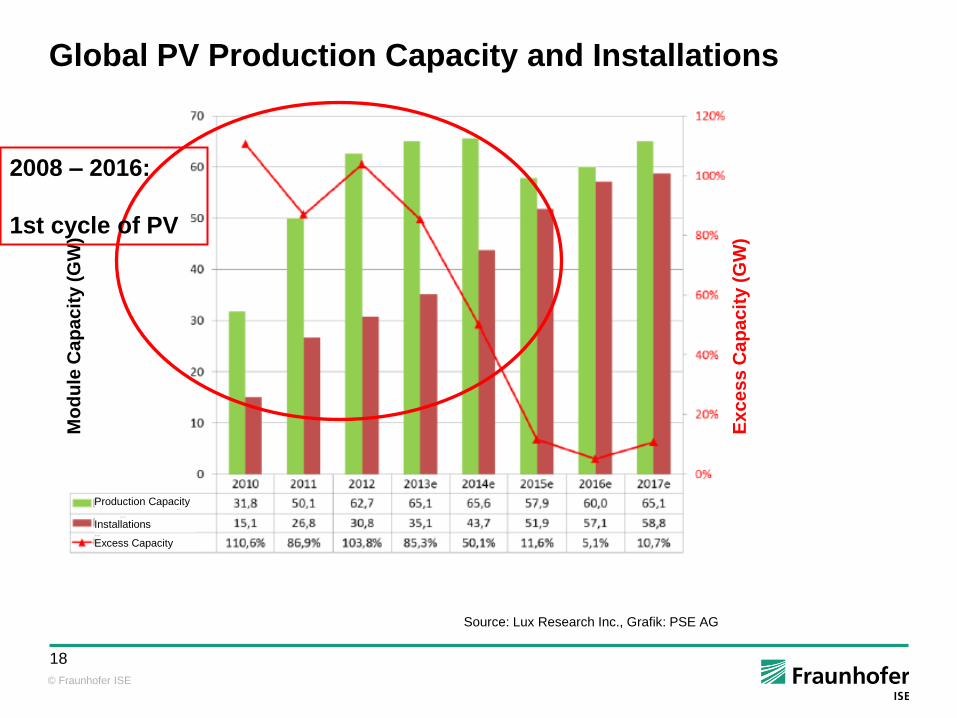
Global PV Production Capacity and Installations
Source: Lux Research Inc., Grafik: PSE AG
Production Capacity
Installations
Excess Capacity
Mo
du
le C
ap
ac
ity (
GW
)
Ex
ce
ss
Ca
pa
cit
y (
GW
)
2008 – 2016:
1st cycle of PV
© Fraunhofer ISE
19
Global PV Production Capacity and Installations
Source: Lux Research Inc., Grafik: PSE AG
Production Capacity
Installations
Excess Capacity
Mo
du
le C
ap
ac
ity (
GW
)
Ex
ce
ss
Ca
pa
cit
y (
GW
)
From 2016:
Start of 2nd
cycle of PV!
© Fraunhofer ISE
20
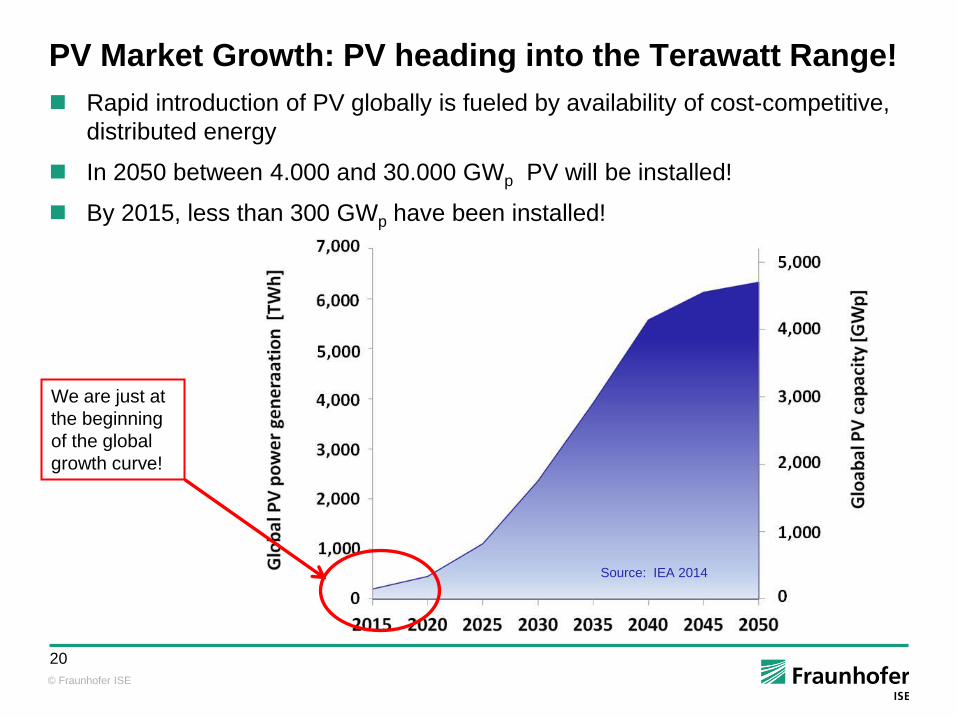
PV Market Growth: PV heading into the Terawatt Range!
Source: IEA 2014
Rapid introduction of PV globally is fueled by availability of cost-competitive,
distributed energy
In 2050 between 4.000 and 30.000 GWp PV will be installed!
By 2015, less than 300 GWp have been installed!
We are just at
the beginning
of the global
growth curve!
© Fraunhofer ISE
21
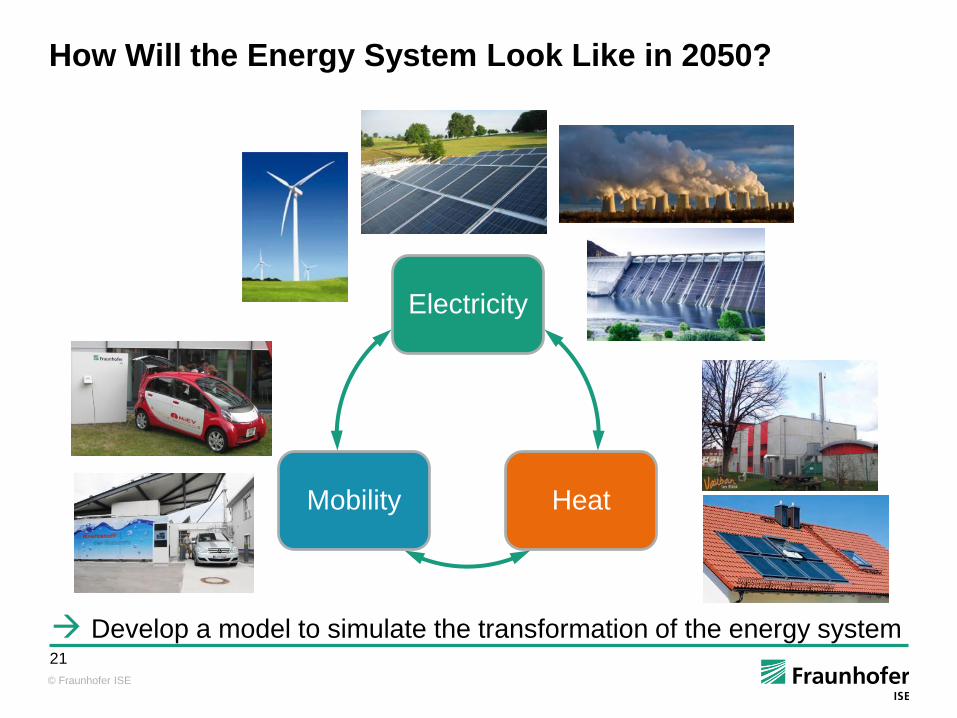
How Will the Energy System Look Like in 2050?
Electricity
Heat Mobility
Develop a model to simulate the transformation of the energy system
© Fraunhofer ISE
22
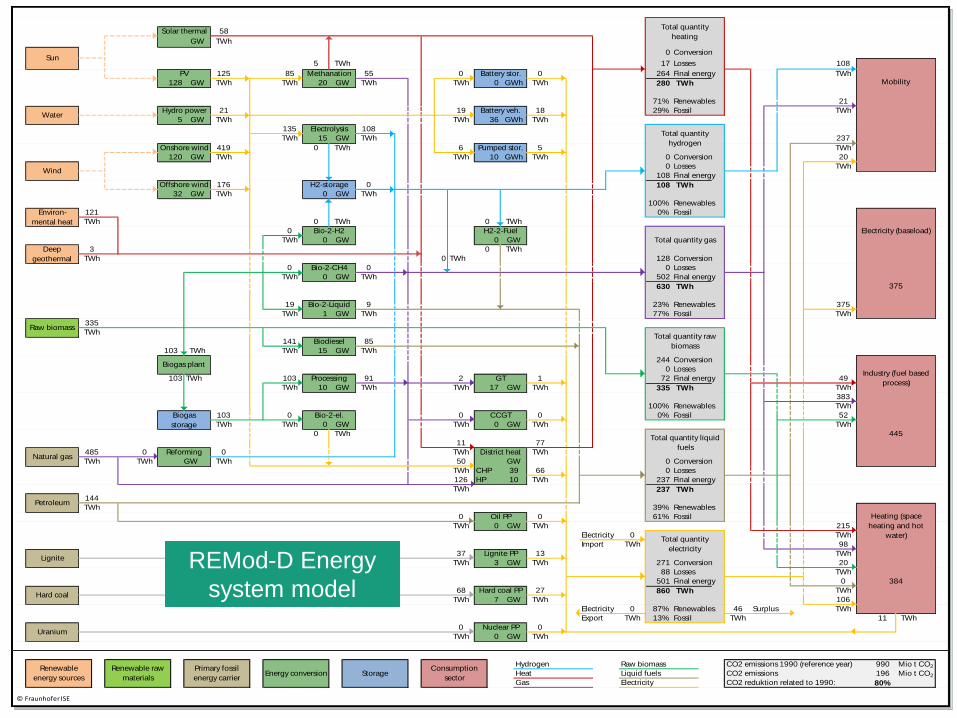
© Fraunhofer ISE
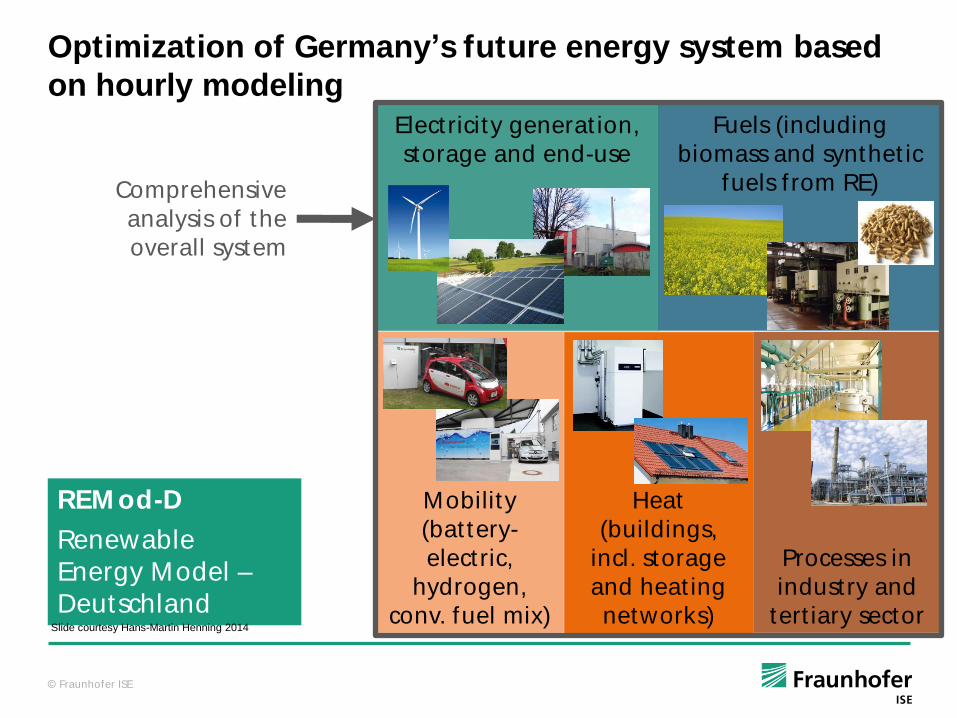
Optimization of Germany’s future energy system based
on hourly modeling
REM od-D
Renewable
Energy Model –
Deutschland
Electricity generat ion,
storage and end-use
Fuels (including
biomass and synthet ic
fuels f rom RE)
Mobility
(bat tery-
elect ric,
hydrogen,
conv. fuel mix)
Processes in
industry and
tert iary sector
Heat
(buildings,
incl. storage
and heat ing
networks)
Comprehensive
analysis of the
overall system
Slide courtesy Hans-Martin Henning 2014
© Fraunhofer ISE
23
Renewables
Fossil
Renewables
Fossil
Renewables
Fossil
Renewables
Fossil
GW
CHP
HP
Renewables
Fossil
Electricity
Import
Electricity Renewables Surplus
Export Fossil
Hydrogen Raw biomass
Heat Liquid fuels
Gas Electricity
Hard coal PP
Nuclear PP
Reforming
Battery stor.
Pumped stor.
H2-2-Fuel
GT
CCGT
District heat
Oil PP
Lignite PP
Processing
Bio-2-el.
H2-storage
Electrolysis
Methanation
TWh
GW
0
108
TWh
TWh
GW
GW
Solar thermal
PV
Hydro power
Onshore wind
Offshore wind
Raw biomass
0
0 0
103
Biogas
storage
0
TWh 36 TWh
18
1
85
Bio-2-Liquid 9
1 TWh
TWh
TWh
Hard coal
Lignite
Petroleum
TWh
144
TWh
0 0
Natural gas
37 13
7 TWh
68 27
TWh 3 TWh
485 0 0
39
10
CO2 emissions 1990 (reference year) 990 Mio t CO2
CO2 emissions 196 Mio t CO2
CO2 reduktion related to 1990:
TWh
TWh 0 TWh
TWh
Uranium0 0
10
Primary fossil
energy carrier
445
384
Industry (fuel based
process)
Electricity (baseload)
80%
TWh
TWh TWh TWh GW
GW 215
237 Final energy
237 TWh
TWh 0
0 Conversion
0 Losses
375
Bio-2-CH4 0
0 TWh
TWh
TWh
TWh
103
77%
15 TWhTWh
0 Losses
502 Final energy
630 TWh
GW
GW
125
128 TWh
120 TWh
6 5
19 Battery veh.
TWh 0 TWhTWh
TWh
TWh
TWh
TWh
GWh
GWh
0 0
GWh
21
Consumption
sector
121
TWh
3
TWh
Deep
geothermal
Environ-
mental heat
Renewable
energy sources
Renewable raw
materials
Water
Sun
Bio-2-H2
0
176
32 TWh
0
Wind
335
TWh
Biodiesel
5 TWh
Energy conversion Storage
10
375
383
52
49
TWh
TWh
0
0
501 Final energy
860 TWh
TWh
TWh
TWh
GW
GW
GW
100%
GW
TWh
TWh
TWh
TWh
TWh
TWh
11
106
20
98
0
Heating (space
heating and hot
water)
237
20
Total quantity gas
TWh
TWh
TWh
TWh
TWh
GW
GW
66
TWh
TWh 17 TWh
TWh
0
0
50
126
Final energy
0%
11
GW
GW
GW
GW
GW
GW
20
15
GW0
TWh
TWh
419
21
135
85
TWh5
0
TWh
TWh
TWh
TWh
TWh
TWh
TWh
23%
108
100%
Conversion
Losses
0
0
29%
128 Conversion
Total quantity
hydrogen
108 TWh
0%
Total quantity raw
biomass
244
TWh
TWh
GW
GW
Biogas plant
2
58
77
55
103 0
103
0
91
141
TWh0
TWh0
0
0
19
Total quantity
heating
0 Conversion
17 Losses
264 Final energy
280 TWh Mobility
108
71%
Conversion
0 Losses
72 Final energy
335 TWh
46
TWh
87%
13%
Total quantity
electricity
39%
61%
Total quantity liquid
fuels
271 Conversion
88 Losses
© Fraunhofer ISE
REMod-D Energy
system model
© Fraunhofer ISE
24
© Fraunhofer ISE
TWh
Traktion
H2-Bedarf
45
11
TWh
TWh
39
TWh
14
TWh
Einzelgebäude mit Sole-Wärmepumpe
Solarthermie
11
Solarthermie 8 Gebäude
9
TWh
el. WP Luft 43
TWh
TWh
44
4
Einzelgebäude mit Gas-Wärmepumpe
13
TWh
14 4
W-Speicher
GWth TWh 60 TWh
82
TWh
220
TWh
420
22 GWth TWh 103 GWh
51 W-Speicher14el. WP Sole
Biomasse
TWh
0
TWh
15
KWK-BHKW
Solarthermie 13
TWh
Strombedarf gesamt (ohne
Strom für Wärme und MIV)
375
TWh
TWh
3
GWgas 0
220
0
TWh
0Sabatier Methan-Sp.
H2-Speicher
7 GWth TWh
TWh 41
3
GWth
Gas-WP
W-Speicher
25
20
40
TWh
388 TWh
20 GWth TWh Wärmenetze mit
GuD-KWK
7 GWth TWh
W-Speicher
TWh Wärmenetze mit
BHKW-KWK
Wärmebedarf gesamt
TWh
26
TWh
TWh
217
TWh
82
16
TWh
GWel
TWh 23
4
TWh
9 Pump-Sp-KW 7
TWh
TWh
6
TWh
Gasturbine
W-Speicher
Steink.-KW Braunk.-KW Öl-KW
3 GW 0 GW5 GW 0 GW 7 GW
Atom-KWPV Wind On Wind Off Wasserkraft
112
TWh
103
TWh
147
Batterien
24 GWh
GW 120 GW 32 GW
143
TWh
5
TWh 60 GWh TWh
TWh
Einzelgebäude mit Luft-Wärmepumpe
GWth
Gebäude
8
TWh
7
TWh 50
14
4 TWh
TWh
19 GWth TWh GWh
Einzelgebäude mit Gaskessel
TWh
Gaskessel 71 Gebäude
32 GWth
0
4
Gebäude
59
0.0
TWh
3734
Solarthermie 6 W-Speicher
Gebäude
15
27 GWh
23
TWh
TWh
TWh 173 GWh
3
TWh
ungenutzter Strom (Abregelung)
TWh
0
TWh
26
TWh
12
TWh
TWh
5
TWh
TWh
241 TWh
Gebäude
4
87
TWh 6 TWh
Gebäude
59
7 GWth TWh
3
TWh
WP zentral 20
KWK-GuD 27
35 GWel TWh
20
60
TWh
7
GW
Einzelgebäude mit Mini-BHKW
6 46
WP zentral 23
4
8
TWh
TWh
Verkehr (ohne
Schienenverkehr/Strom)
Brennstoff-basierter Verkehr
Batterie-basierter Verkehr
Wasserstoff-basierter Verkehr
137
TWh
TWh
TWh
TWh
TWh
TWh
TWhTraktion gesamt
Brennstoffe
Traktion
erneuerbare Energien primäre Stromerzeugung fossil-nukleare Energien
14 GWth TWh 56 GWh
86 TWh
Geothermie 6 Gebäude
2 GWth
10
TWh
TWh108 TWh
57 TWh
0
TWh
3
TWh
TWh 173
Wärmenetze mit Tiefen-Geothermie
TWh
Brennstoffe
TWhErdgas
394
TWh
4
TWh
22
TWh
Elektrolyse
82
33 GWel
4
21
TWh
0
TWh
TWh 26
1 GW
GuD-KW
ungenutztWarmwasserRaumheizung
290 TWh 98 TWh 2
Solarthermie
GWh
Mini-BHKW 23
GWh
TWh
Solarthermie 13
20 GWth
GWel TWh
TWh
0.6
GWth TWh
TWh
W-Speicher
TWh
TWh
76
6
41
82
Strombedarf
Traktion
Solarthermie 12 6
TWh
73
TWh
25 TWh
Brennstoffe
55
220
100% Wert 2010
335
TWh
TWh
Treibstoff
Verkehr
55
TWh
420 TWh
Brennstoff-basierte Prozesse in
Industrie und Gewerbe
gesamt 445 TWh
Solarthermie
%
41
55
© F
rau
nh
ofe
r ISE
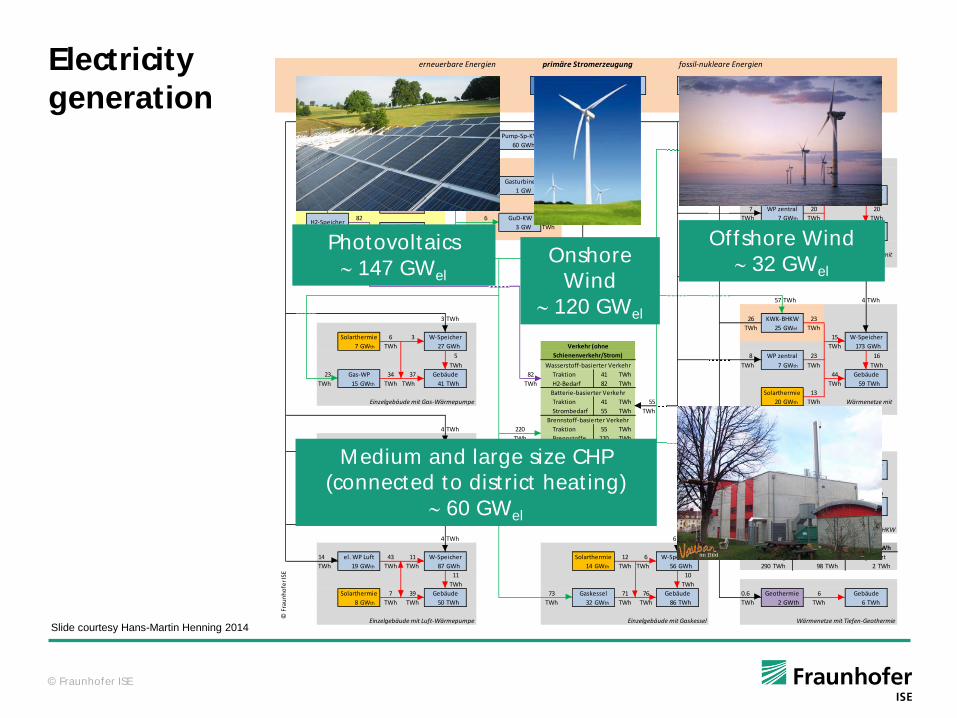
Electricity
generation
Photovoltaics
147 GWel
Medium and large size CHP
(connected to dist rict heat ing)
60 GWel
Onshore
Wind
120 GWel
Offshore Wind
32 GWel
Slide courtesy Hans-Martin Henning 2014
© Fraunhofer ISE
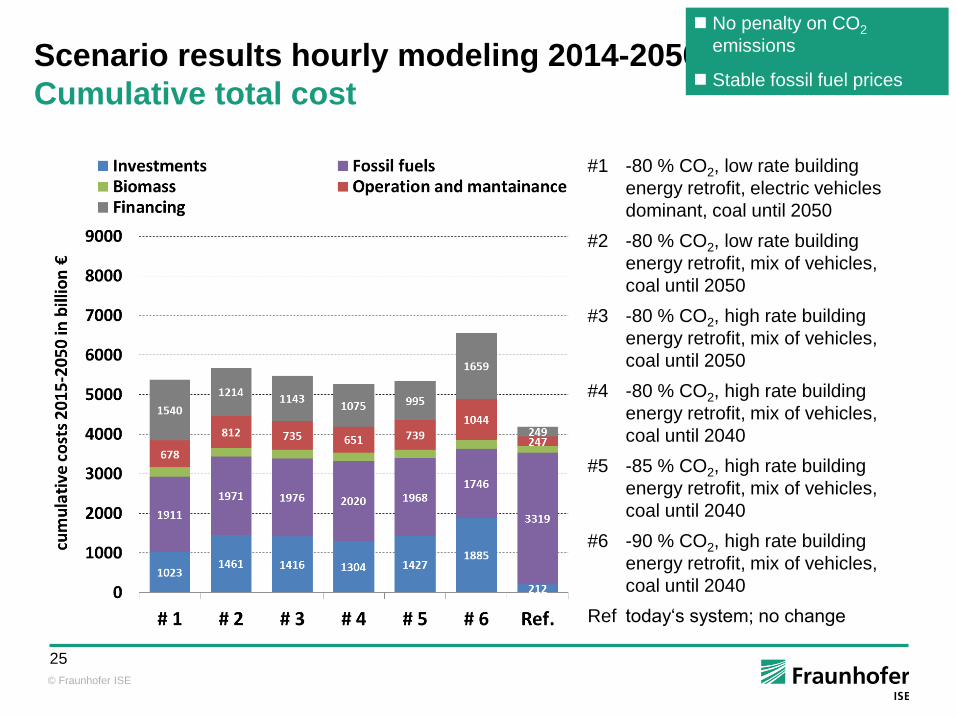
25
Scenario results hourly modeling 2014-2050
Cumulative total cost
No penalty on CO2
emissions
Stable fossil fuel prices
#1 -80 % CO2, low rate building
energy retrofit, electric vehicles
dominant, coal until 2050
#2 -80 % CO2, low rate building
energy retrofit, mix of vehicles,
coal until 2050
#3 -80 % CO2, high rate building
energy retrofit, mix of vehicles,
coal until 2050
#4 -80 % CO2, high rate building
energy retrofit, mix of vehicles,
coal until 2040
#5 -85 % CO2, high rate building
energy retrofit, mix of vehicles,
coal until 2040
#6 -90 % CO2, high rate building
energy retrofit, mix of vehicles,
coal until 2040
Ref today‘s system; no change
© Fraunhofer ISE
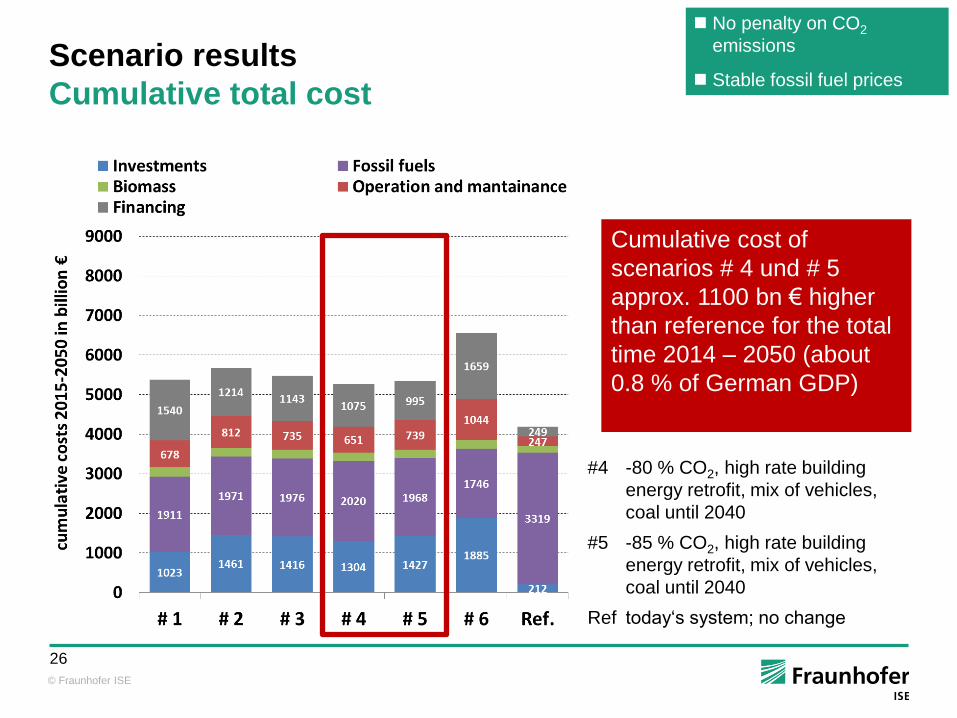
26
Scenario results
Cumulative total cost
No penalty on CO2
emissions
Stable fossil fuel prices
#4 -80 % CO2, high rate building
energy retrofit, mix of vehicles,
coal until 2040
#5 -85 % CO2, high rate building
energy retrofit, mix of vehicles,
coal until 2040
Ref today‘s system; no change
Cumulative cost of
scenarios # 4 und # 5
approx. 1100 bn € higher
than reference for the total
time 2014 – 2050 (about
0.8 % of German GDP)
© Fraunhofer ISE
27
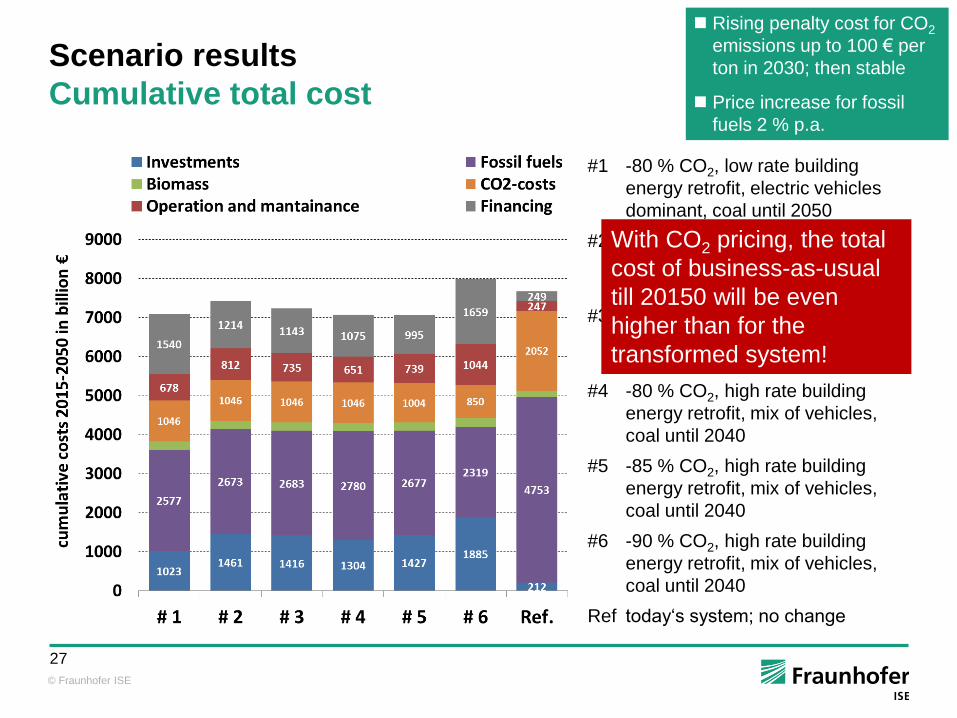
Scenario results
Cumulative total cost
Rising penalty cost for CO2
emissions up to 100 € per
ton in 2030; then stable
Price increase for fossil
fuels 2 % p.a.
#1 -80 % CO2, low rate building
energy retrofit, electric vehicles
dominant, coal until 2050
#2 -80 % CO2, low rate building
energy retrofit, mix of vehicles,
coal until 2050
#3 -80 % CO2, high rate building
energy retrofit, mix of vehicles,
coal until 2050
#4 -80 % CO2, high rate building
energy retrofit, mix of vehicles,
coal until 2040
#5 -85 % CO2, high rate building
energy retrofit, mix of vehicles,
coal until 2040
#6 -90 % CO2, high rate building
energy retrofit, mix of vehicles,
coal until 2040
Ref today‘s system; no change
With CO2 pricing, the total
cost of business-as-usual
till 20150 will be even
higher than for the
transformed system!
© Fraunhofer ISE
28
How Will the Energy System Look Like in 2050?
Electricity
Heat Mobility
Essential messages out of the model:
The cost of the new Energy System is not higher than
the cost for the current system!
The cost for transformation is in the same order as
maintaining the current system!
© Fraunhofer ISE
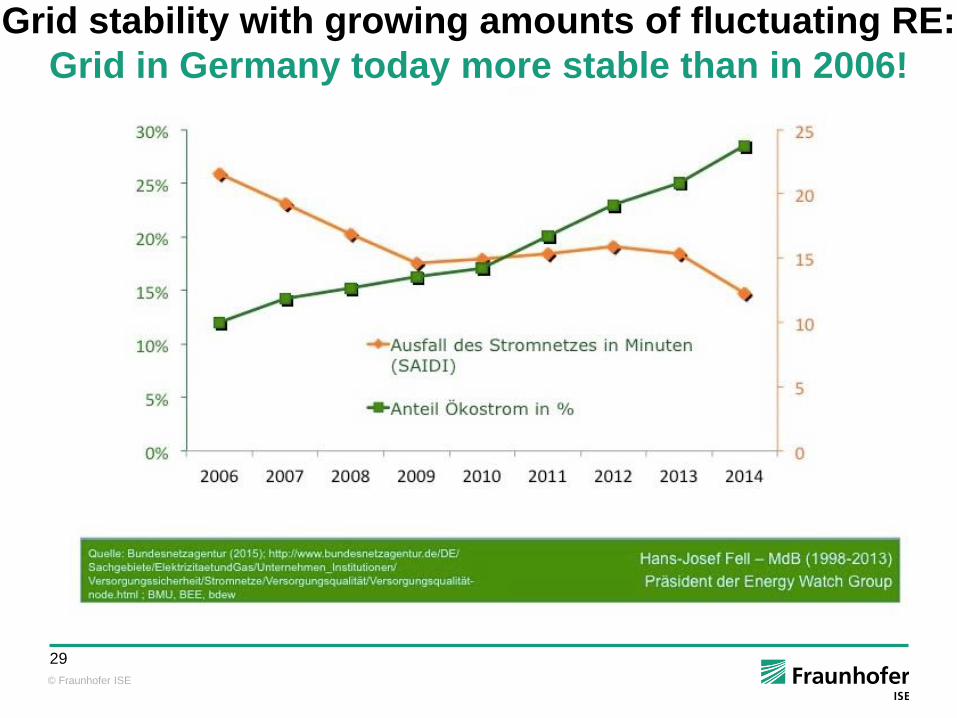
29
Grid stability with growing amounts of fluctuating RE:
Grid in Germany today more stable than in 2006!
© Fraunhofer ISE
30
Technology development combined with rapid growth of production volumes
resulted in an unprecedented reduction in PV production cost and prices, by
more than an order of magnitude in the last decades!
The market is dominated by crystalline-Si technologies; a multitude of further
technology advances, allowing higher efficiencies at lower production costs, are
ready to be implemented in c-Si PV cells and modules.
The cost of PV systems will decrease further, driven by technology
developments, accompanied by supportive financial and regulatory
environments.
PV will grow soon into the Terawatt range, making it the cheapest form of
electricity in many regions of the world 2-4 ct/kWh.
The key for a stable energy system based on RE is to link the electricity, heat
and transport sectors.
The challenge for the EU will be to maintain the current technological
leadership position, by keeping a stable market, combined with local PV
production along the whole food chain, from research to deployment!
Photovoltaics as Major Electricity Source
© Fraunhofer ISE
31
Thank you
For your attention!
The European
Inverter Industry
Dr Krzysztof Puczko
Repowering Europe
May 2016
2
About PV Markets… Can Europe sustain industrial leadership in this area?
3 Delta Confidential
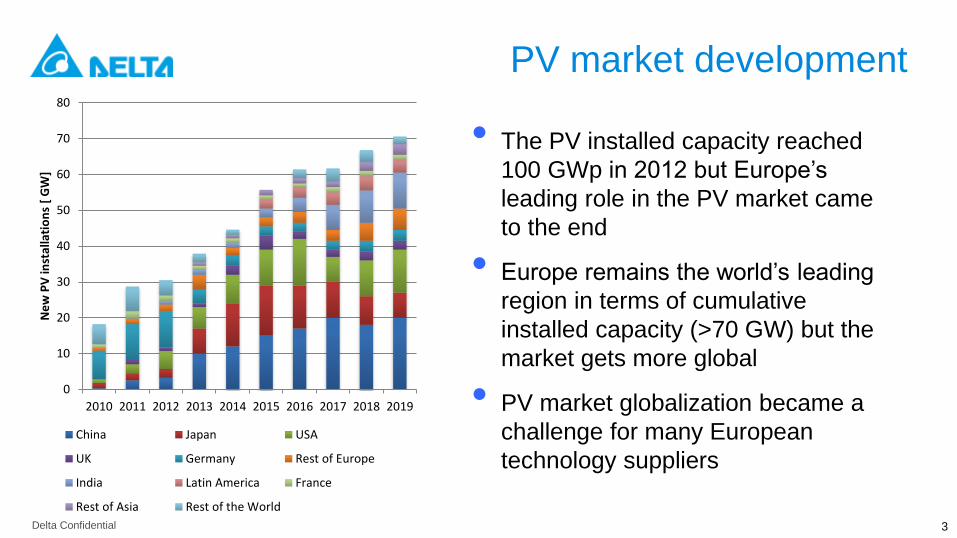
PV market development
• The PV installed capacity reached
100 GWp in 2012 but Europe’s
leading role in the PV market came
to the end
• Europe remains the world’s leading
region in terms of cumulative
installed capacity (>70 GW) but the
market gets more global
• PV market globalization became a
challenge for many European
technology suppliers
0
10
20
30
40
50
60
70
80
2010 2011 2012 2013 2014 2015 2016 2017 2018 2019
Ne
w P
V in
stal
lati
on
s [
GW
]
China Japan USA
UK Germany Rest of Europe
India Latin America France
Rest of Asia Rest of the World
4 Delta Confidential
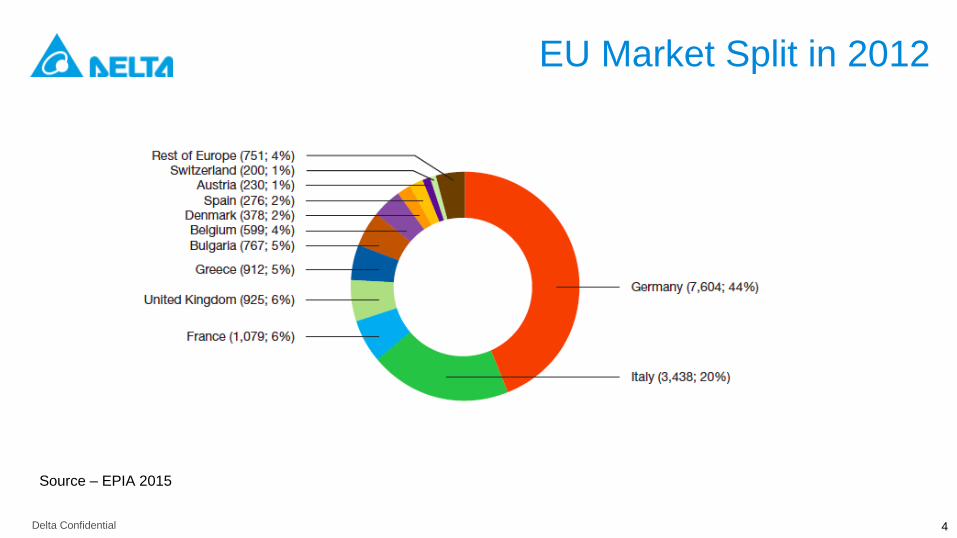
EU Market Split in 2012
Source – EPIA 2015
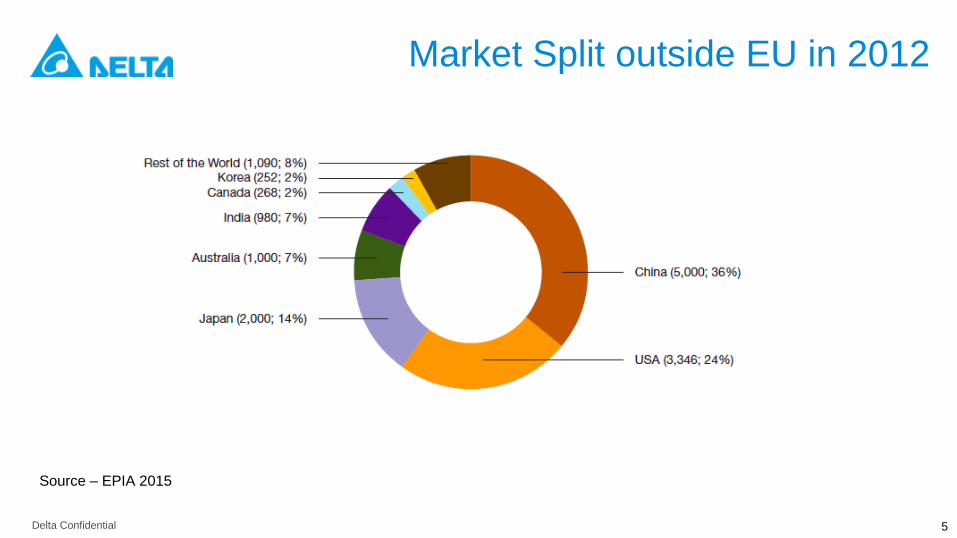
5 Delta Confidential
Market Split outside EU in 2012
Source – EPIA 2015
6 Delta Confidential
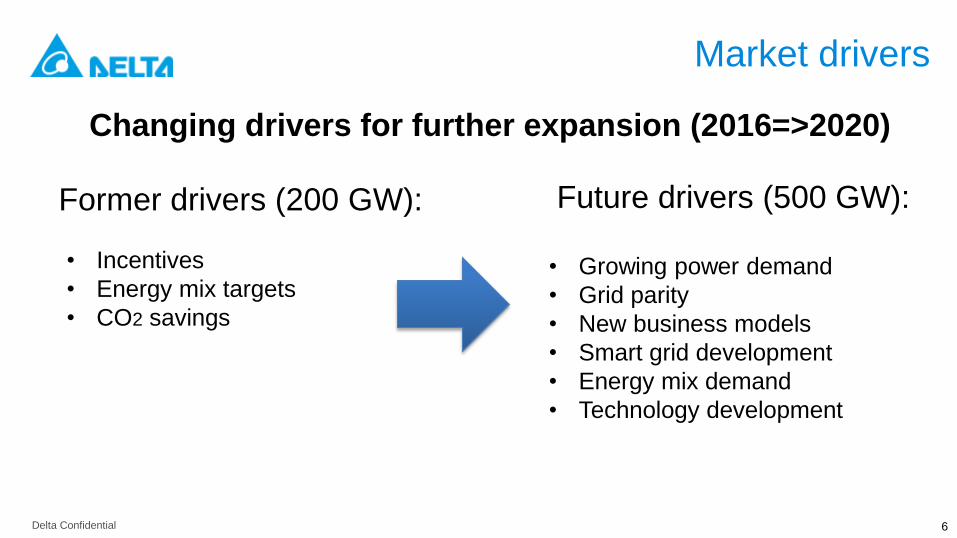
Market drivers
• Incentives
• Energy mix targets
• CO2 savings
• Growing power demand
• Grid parity
• New business models
• Smart grid development
• Energy mix demand
• Technology development
Changing drivers for further expansion (2016=>2020)
Former drivers (200 GW): Future drivers (500 GW):
7
Are regional variations in grid codes an
opportunity or a threat to European
manufacturers?
8 Delta Confidential
8
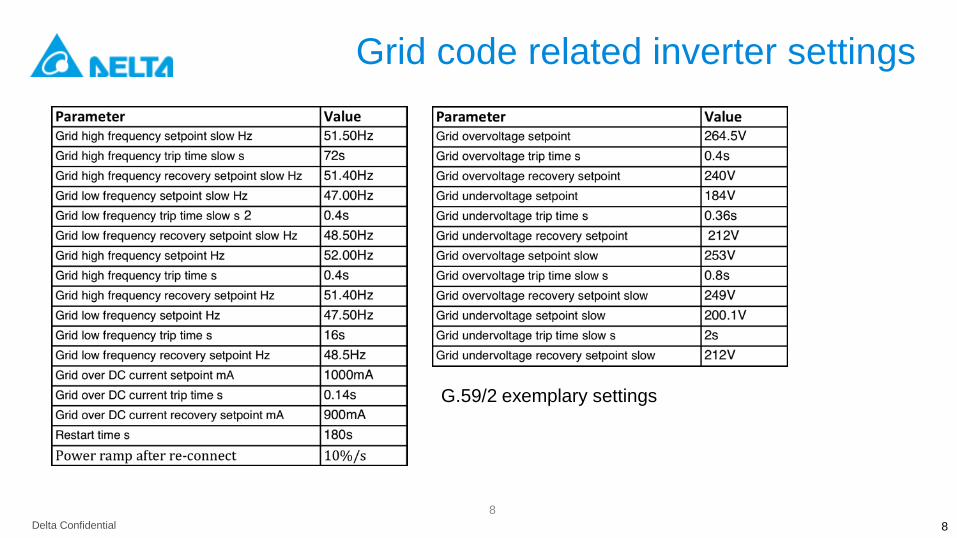
Grid code related inverter settings
G.59/2 exemplary settings
9 Delta Confidential
9
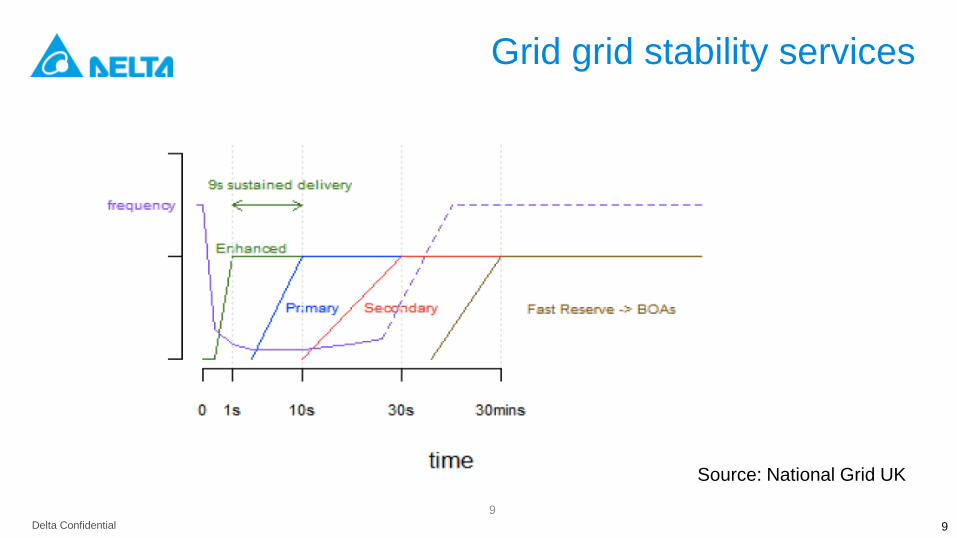
Grid grid stability services
Source: National Grid UK
10 Delta Confidential
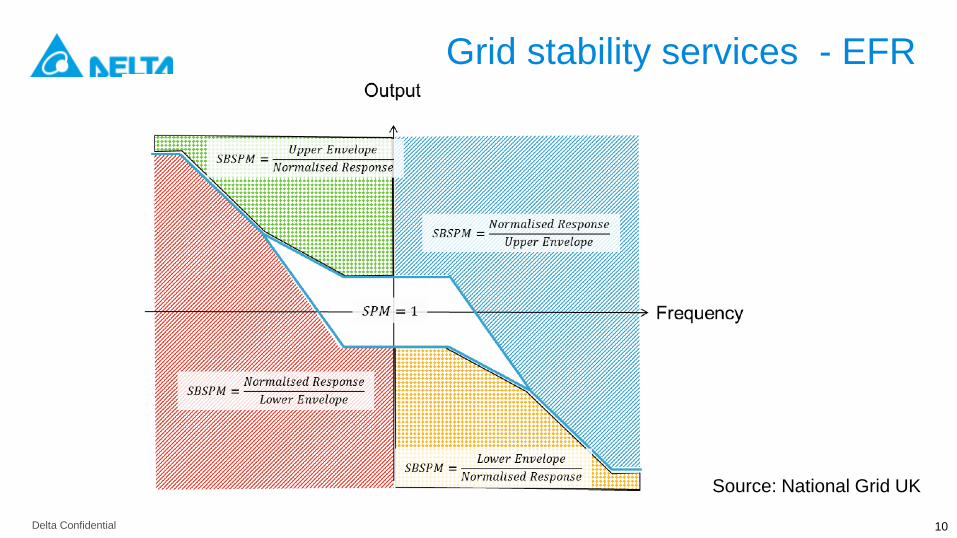
Grid stability services - EFR
Source: National Grid UK
11 Delta Confidential
Advanced inverter features- summary
• Improved efficiency (>98,5%)
• Country grid code compliance with new advanced features
• Reactive power generation
• Local utility customization still needed
• Integration with smart grid environment
• Virtual power plant integration to participate in energy
exchange market
• Most of top class inverters can deliver all required services

12
About key drivers to future growth…
13 Delta Confidential
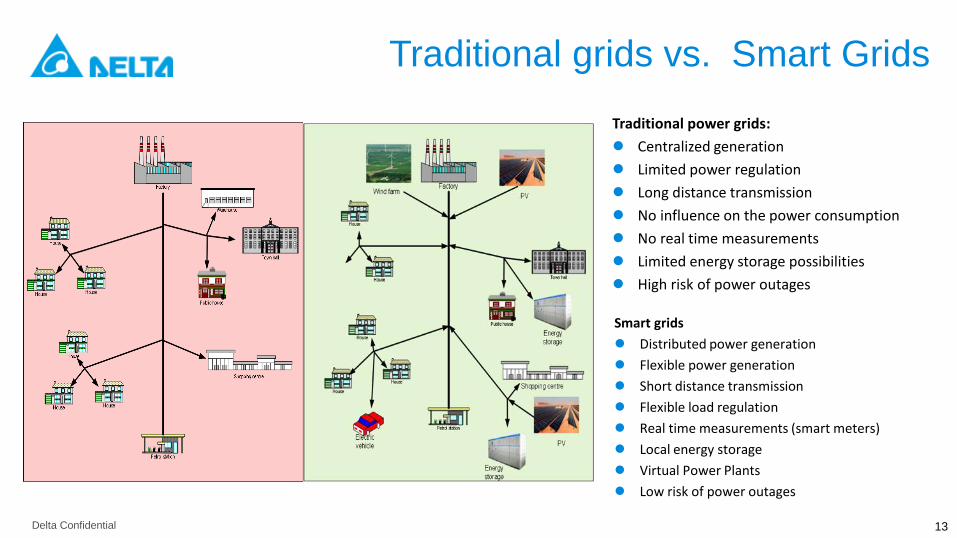
Traditional grids vs. Smart Grids
Traditional power grids:
Centralized generation
Limited power regulation
Long distance transmission
No influence on the power consumption
No real time measurements
Limited energy storage possibilities
High risk of power outages
Smart grids
Distributed power generation
Flexible power generation
Short distance transmission
Flexible load regulation
Real time measurements (smart meters)
Local energy storage
Virtual Power Plants
Low risk of power outages
14 Delta Confidential
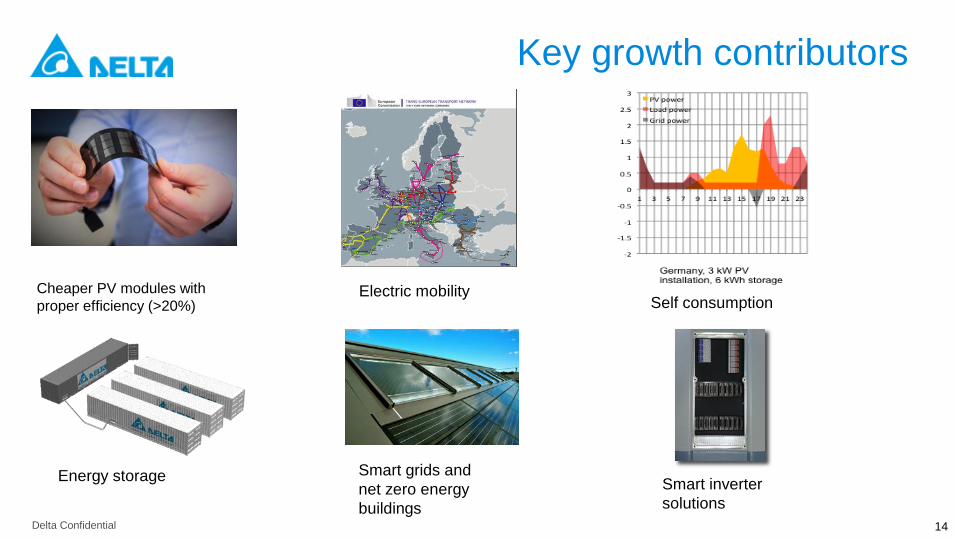
Key growth contributors
Cheaper PV modules with
proper efficiency (>20%)
Energy storage
Electric mobility Self consumption
Smart grids and
net zero energy
buildings
Smart inverter
solutions
15
How to provide increasingly "smart" inverters
while reducing costs?
16 Delta Confidential
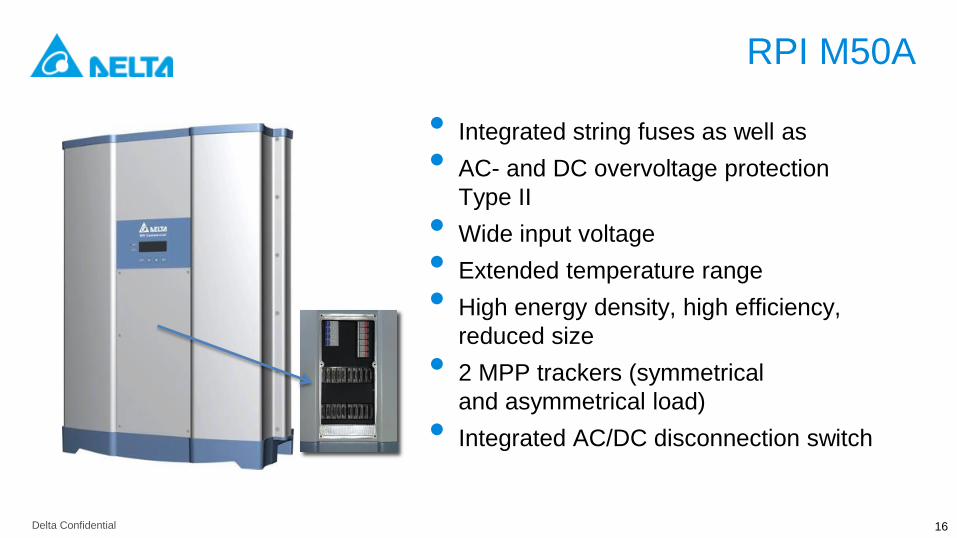
RPI M50A
• Integrated string fuses as well as
• AC- and DC overvoltage protection
Type II
• Wide input voltage
• Extended temperature range
• High energy density, high efficiency,
reduced size
• 2 MPP trackers (symmetrical
and asymmetrical load)
• Integrated AC/DC disconnection switch
17
Conclusions…
18 Delta Confidential
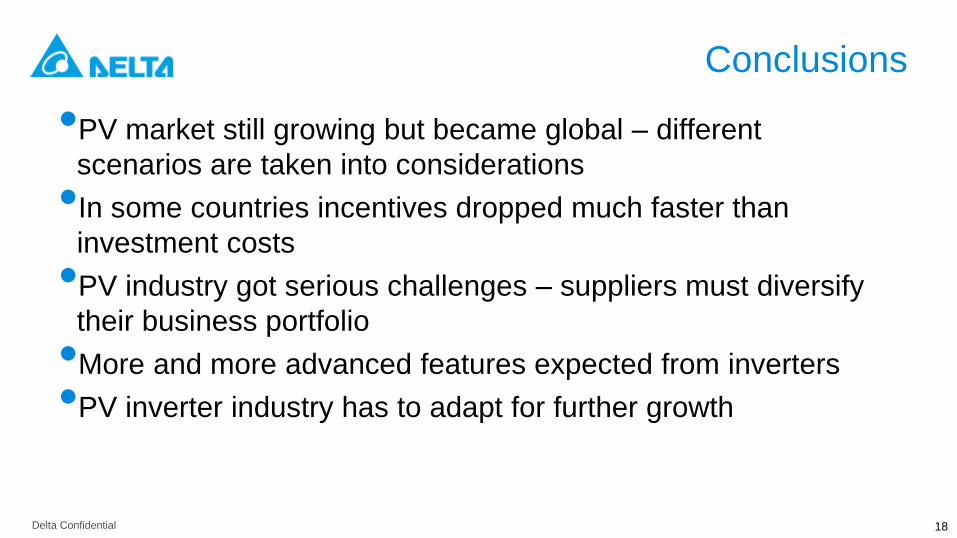
Conclusions
•PV market still growing but became global – different
scenarios are taken into considerations
•In some countries incentives dropped much faster than
investment costs
•PV industry got serious challenges – suppliers must diversify
their business portfolio
•More and more advanced features expected from inverters
•PV inverter industry has to adapt for further growth

19
About Delta Electronics….
20 Delta Confidential
20
We are experts in power conversion
21 Delta Confidential
21
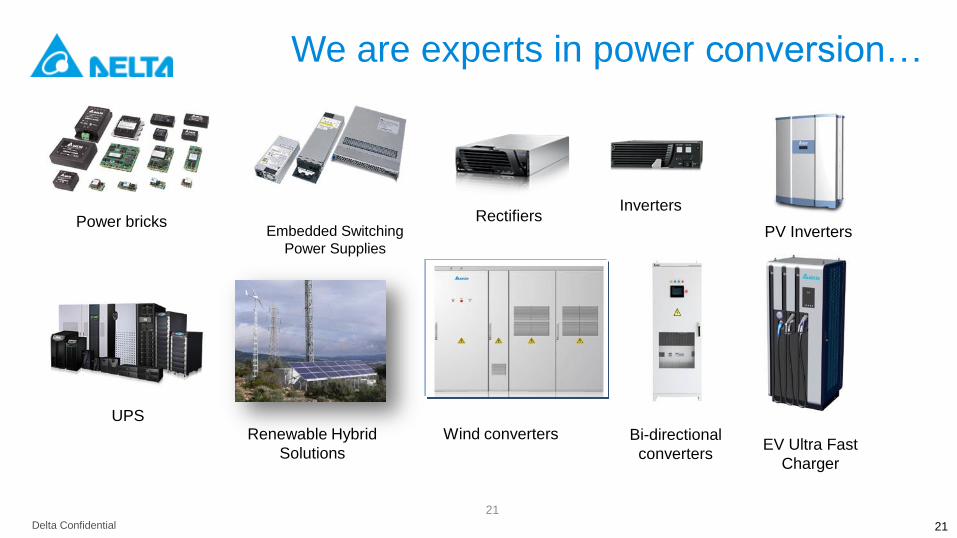
We are experts in power conversion…
Power bricks Embedded Switching
Power Supplies
Rectifiers
Inverters
PV Inverters
UPS Renewable Hybrid
Solutions EV Ultra Fast
Charger
Wind converters Bi-directional
converters
22 Delta Confidential
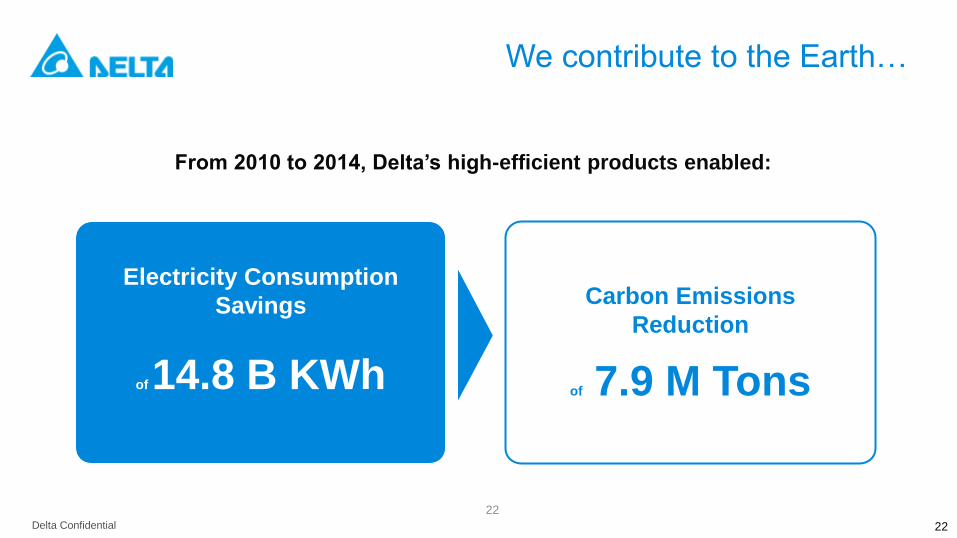
We contribute to the Earth…
22
From 2010 to 2014, Delta’s high-efficient products enabled:
Electricity Consumption
Savings
of 14.8 B KWh
Carbon Emissions
Reduction
of 7.9 M Tons

Smarter. Greener. Together.
To learn more about Delta, please visit www.deltaww.com
May 18th, Jan Van Laethem
NEXT GENERATION OF SMART INVERTERS AND ASPECTS WITH RESPECT TO THE ENERGY TRANSITION
SMA Solar Technology AG ETIP PV - Photovoltaics: centre-stage in the power system
DISCLAIMER
IMPORTANT LEGAL NOTICE
This presentation does not constitute or form part of, and should not be construed as, an offer or invitation to subscribe for,
underwrite
or otherwise acquire, any securities of SMA Solar Technology AG (the "Company") or any present or future subsidiary of
the Company (together with the Company, the "SMA Group") nor should it or any part of it form the basis of, or be relied
upon in connection with,
any contract to purchase or subscribe for any securities in the Company or any member of the SMA Group or commitment
whatsoever.
All information contained herein has been carefully prepared. Nevertheless, we do not guarantee its accuracy or
completeness
and nothing herein shall be construed to be a representation of such guarantee.
The information contained in this presentation is subject to amendment, revision and updating. Certain statements
contained in this
presentation may be statements of future expectations and other forward-looking statements that are based on the
management's current
views and assumptions and involve known and unknown risks and uncertainties. Actual results, performance or events
may differ materially from those in such statements as a result of, among others, factors, changing business or other
market conditions and the prospects for growth anticipated by the management of the Company. These and other factors
could adversely affect the outcome and financial effects of the plans and events described herein. The Company does not
undertake any obligation to update or revise any forward-looking statements, whether as a result of new information, future
events or otherwise. You should not place undue reliance on forward-looking statements which speak only as of the date of
this presentation.
This presentation is for information purposes only and may not be further distributed or passed on to any party which is not
the addressee
of this presentation. No part of this presentation must be copied, reproduced or cited by the addressees hereof other than
for the purpose
for which it has been provided to the addressee.
This document is not an offer of securities for sale in the United States of America. Securities may not be offered
or sold
in the United States of America absent registration or an exemption from registration under the U.S. Securities Act
of 1933
as amended.
2
NEXT GENERATION OF SMART INVERTER SYSTEMS AND ASPECTS WITH RESPECT TO THE ENERGY TRANSITION
May 18th, Jan Van Laethem SMA Solar Technology AG ETIP PV - Photovoltaics: centre-stage in the power system
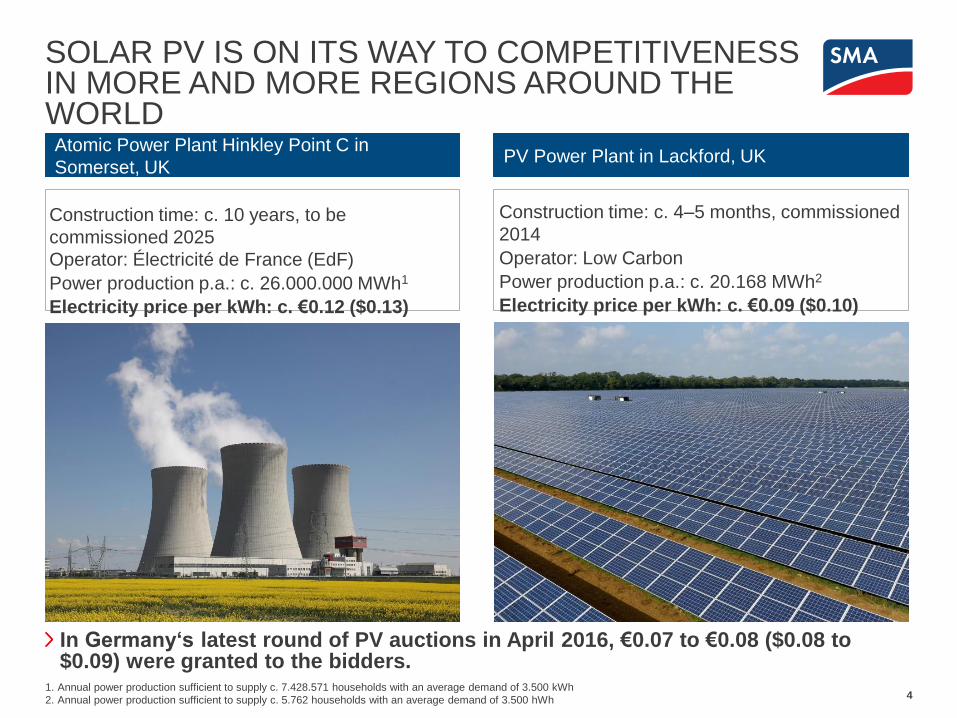
SOLAR PV IS ON ITS WAY TO COMPETITIVENESS IN MORE AND MORE REGIONS AROUND THE WORLD
4
Atomic Power Plant Hinkley Point C in
Somerset, UK PV Power Plant in Lackford, UK
1. Annual power production sufficient to supply c. 7.428.571 households with an average demand of 3.500 kWh
2. Annual power production sufficient to supply c. 5.762 households with an average demand of 3.500 hWh
Construction time: c. 4–5 months, commissioned
2014
Operator: Low Carbon
Power production p.a.: c. 20.168 MWh2
Electricity price per kWh: c. €0.09 ($0.10)
Construction time: c. 10 years, to be
commissioned 2025
Operator: Électricité de France (EdF)
Power production p.a.: c. 26.000.000 MWh1
Electricity price per kWh: c. €0.12 ($0.13)
In Germany‘s latest round of PV auctions in April 2016, €0.07 to €0.08 ($0.08 to $0.09) were granted to the bidders.
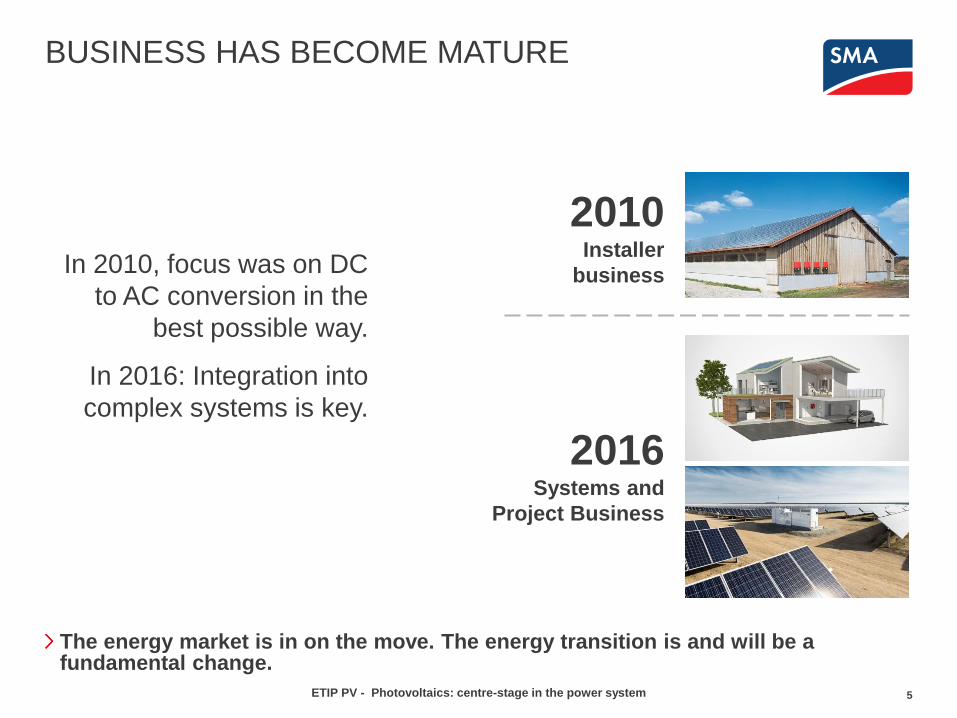
BUSINESS HAS BECOME MATURE
5
In 2010, focus was on DC
to AC conversion in the
best possible way.
In 2016: Integration into
complex systems is key.
The energy market is in on the move. The energy transition is and will be a fundamental change.
2010 Installer
business
2016 Systems and
Project Business
ETIP PV - Photovoltaics: centre-stage in the power system
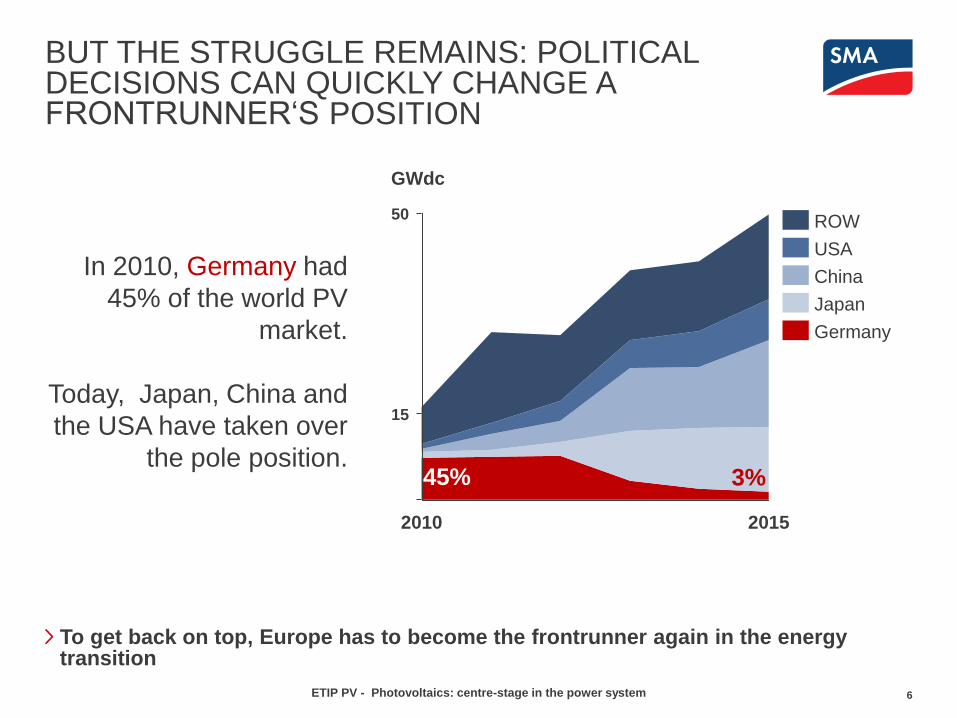
BUT THE STRUGGLE REMAINS: POLITICAL DECISIONS CAN QUICKLY CHANGE A FRONTRUNNER‘S POSITION
6
In 2010, Germany had
45% of the world PV
market.
Today, Japan, China and
the USA have taken over
the pole position.
50
15
GWdc
2015 2010
To get back on top, Europe has to become the frontrunner again in the energy transition
China
Japan
Germany
USA
ROW
45% 3%
ETIP PV - Photovoltaics: centre-stage in the power system
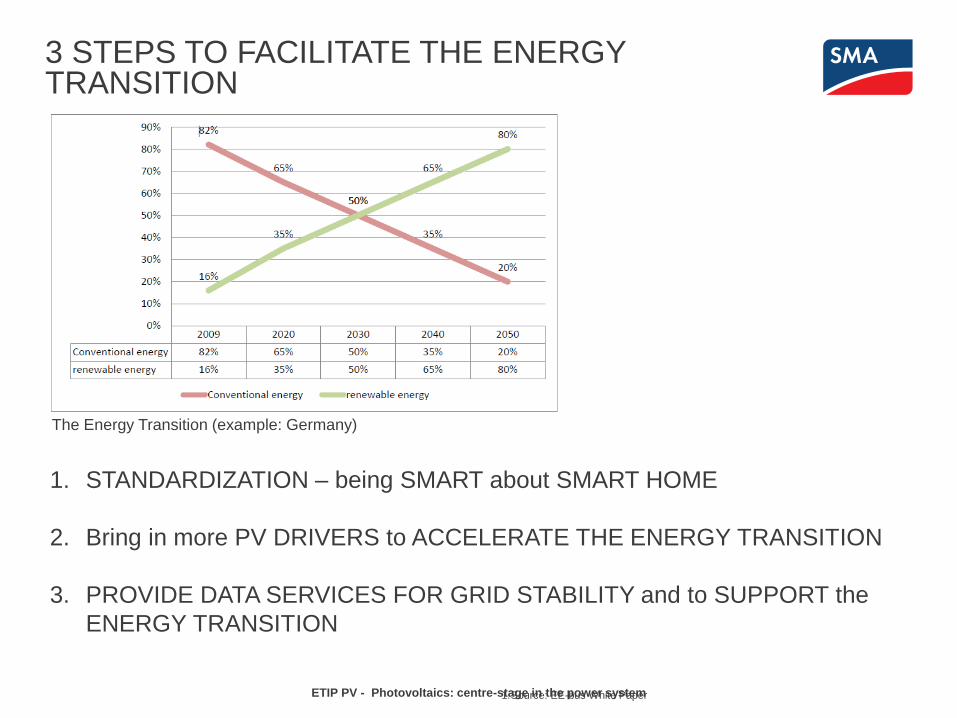
3 STEPS TO FACILITATE THE ENERGY TRANSITION
1.Source: EE-bus White Paper
The Energy Transition (example: Germany)
1. STANDARDIZATION – being SMART about SMART HOME
2. Bring in more PV DRIVERS to ACCELERATE THE ENERGY TRANSITION
3. PROVIDE DATA SERVICES FOR GRID STABILITY and to SUPPORT the
ENERGY TRANSITION
ETIP PV - Photovoltaics: centre-stage in the power system
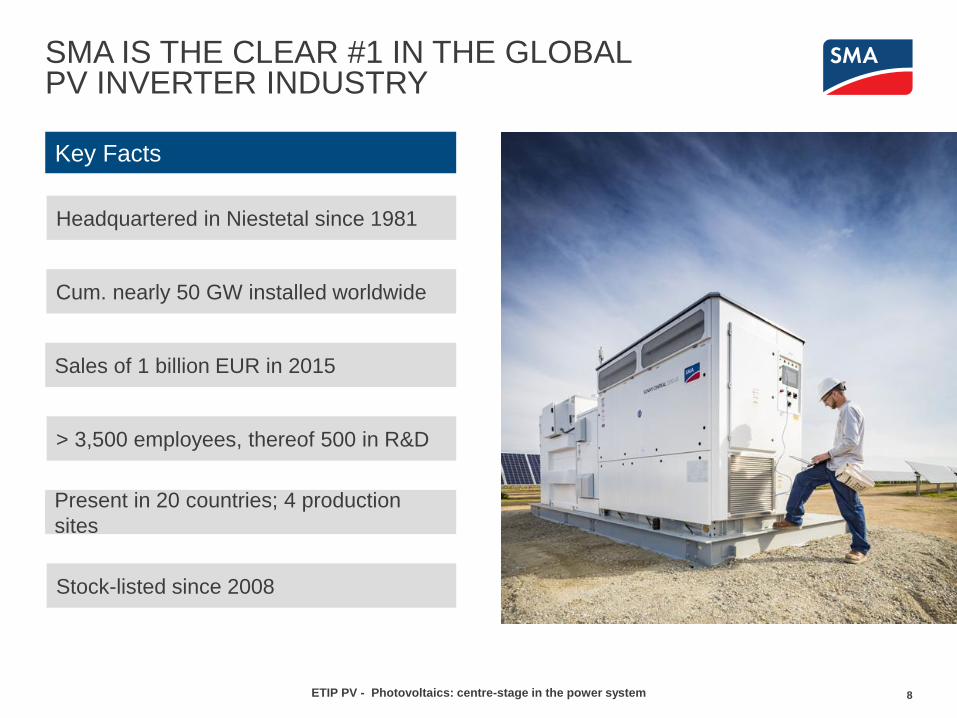
SMA IS THE CLEAR #1 IN THE GLOBAL PV INVERTER INDUSTRY
8
Key Facts
Headquartered in Niestetal since 1981
Cum. nearly 50 GW installed worldwide
Sales of 1 billion EUR in 2015
> 3,500 employees, thereof 500 in R&D
Stock-listed since 2008
Present in 20 countries; 4 production
sites
ETIP PV - Photovoltaics: centre-stage in the power system
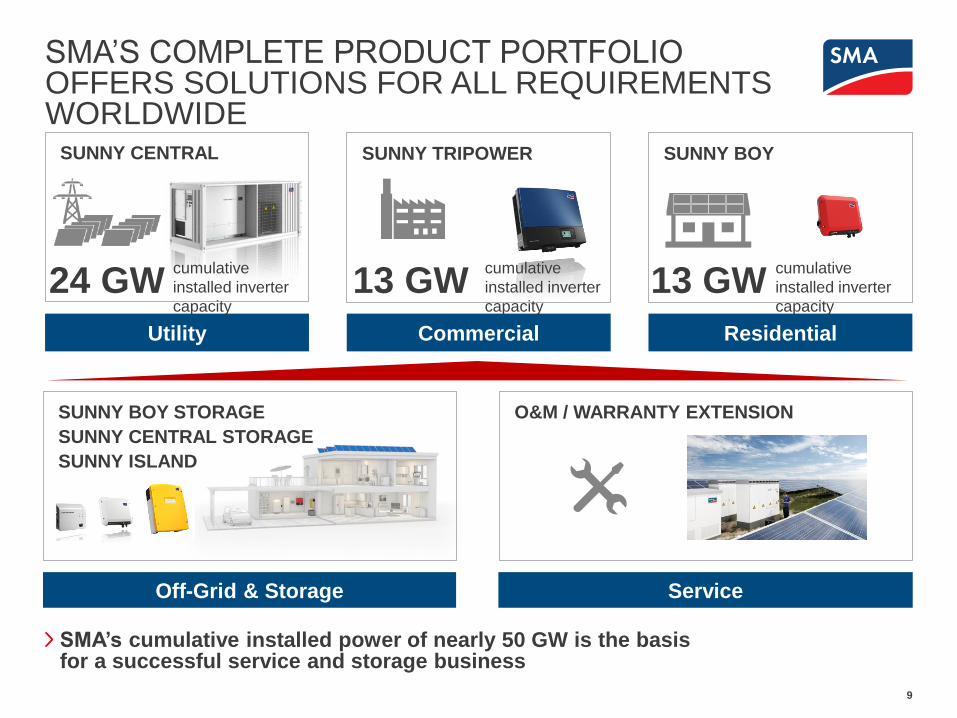
SMA’S COMPLETE PRODUCT PORTFOLIO OFFERS SOLUTIONS FOR ALL REQUIREMENTS WORLDWIDE
9
SMA’s cumulative installed power of nearly 50 GW is the basis for a successful service and storage business
Utility Commercial Residential
SUNNY CENTRAL
SUNNY TRIPOWER
SUNNY BOY
Off-Grid & Storage Service
O&M / WARRANTY EXTENSION
24 GW cumulative
installed inverter
capacity 13 GW 13 GW
cumulative
installed inverter
capacity
cumulative
installed inverter
capacity
SUNNY BOY STORAGE
SUNNY CENTRAL STORAGE
SUNNY ISLAND
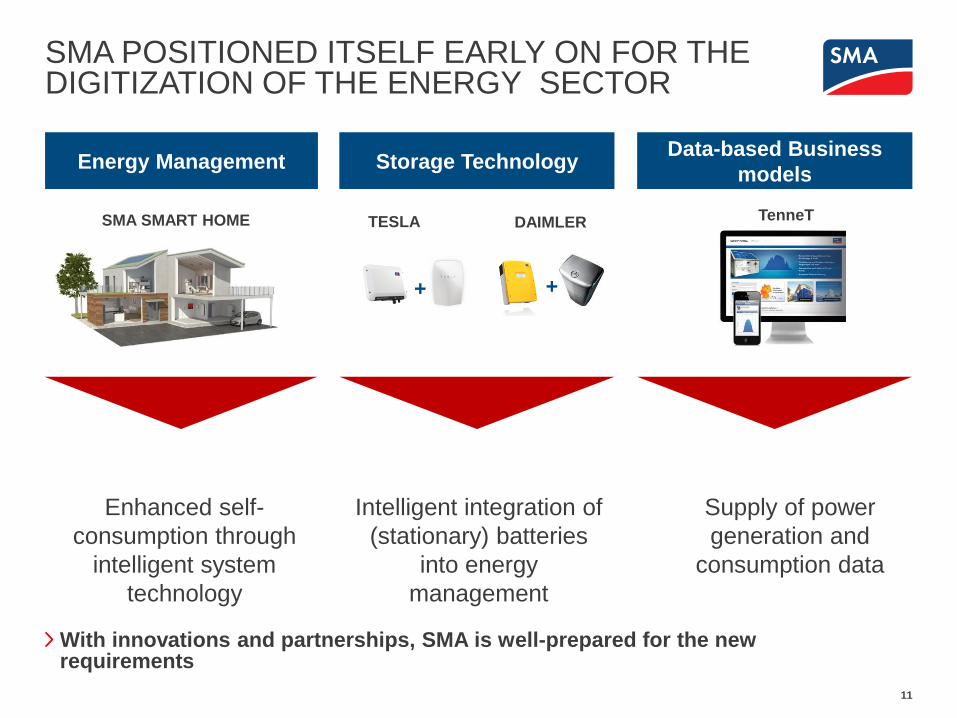
SMA POSITIONED ITSELF EARLY ON FOR THE DIGITIZATION OF THE ENERGY SECTOR
11
With innovations and partnerships, SMA is well-prepared for the new requirements
Energy Management Storage Technology Data-based Business
models
Enhanced self-
consumption through
intelligent system
technology
Intelligent integration of
(stationary) batteries
into energy
management
Supply of power
generation and
consumption data
+ +
TESLA DAIMLER SMA SMART HOME
TenneT
14.01.2016
TDR PGS PM Martin Volkmar SMA Solar Technology AG
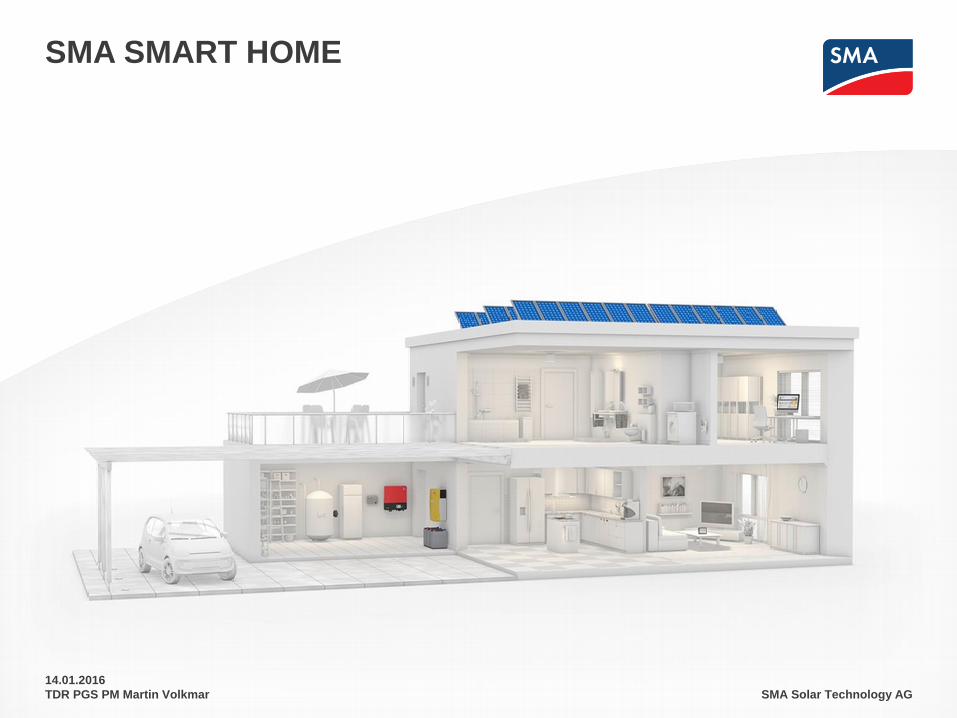
SMA SMART HOME
All devices interconnected in local network and via Internet cloud (IoT*)
13
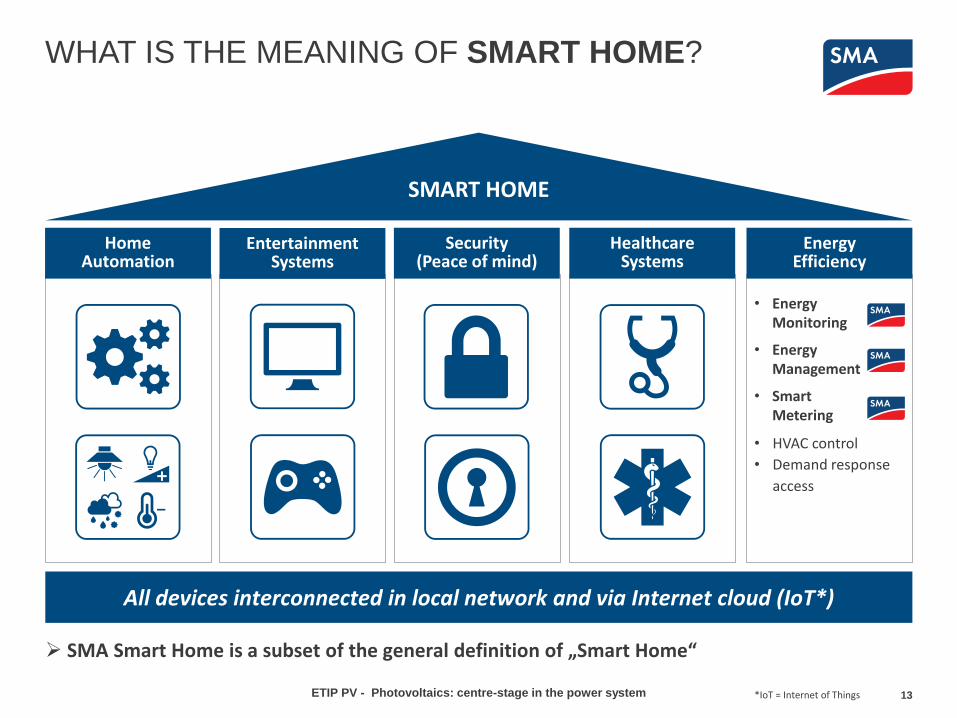
WHAT IS THE MEANING OF SMART HOME?
SMART HOME
SMA Smart Home is a subset of the general definition of „Smart Home“
• Energy Monitoring
• Energy Management
• Smart Metering
• HVAC control
• Demand response
access
Home Automation
Energy Efficiency
Entertainment Systems
Security (Peace of mind)
Healthcare Systems
*IoT = Internet of Things ETIP PV - Photovoltaics: centre-stage in the power system
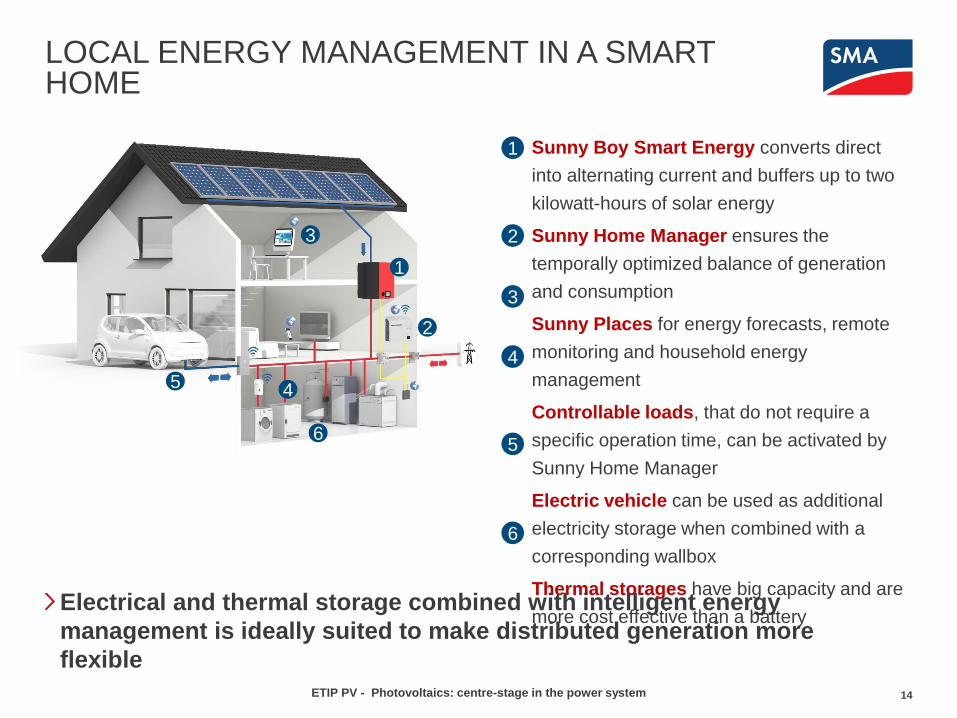
LOCAL ENERGY MANAGEMENT IN A SMART HOME
14
Sunny Boy Smart Energy converts direct
into alternating current and buffers up to two
kilowatt-hours of solar energy
Sunny Home Manager ensures the
temporally optimized balance of generation
and consumption
Sunny Places for energy forecasts, remote
monitoring and household energy
management
Controllable loads, that do not require a
specific operation time, can be activated by
Sunny Home Manager
Electric vehicle can be used as additional
electricity storage when combined with a
corresponding wallbox
Thermal storages have big capacity and are
more cost effective than a battery
1
3
2
4
5
6
3
1
4 5
2
6
Electrical and thermal storage combined with intelligent energy
management is ideally suited to make distributed generation more
flexible
ETIP PV - Photovoltaics: centre-stage in the power system
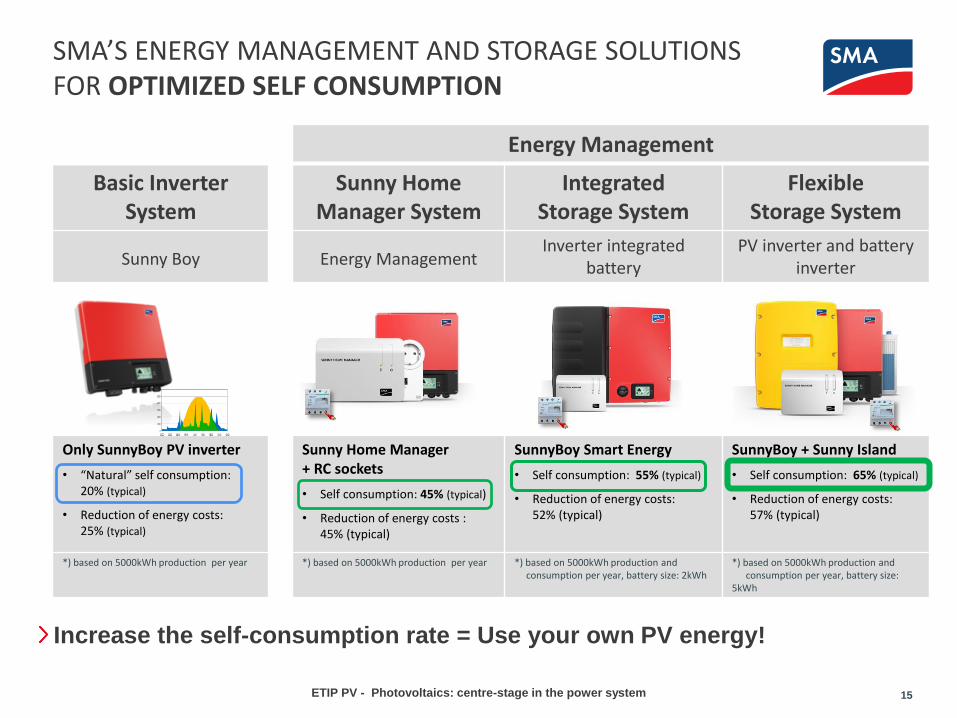
Energy Management
Basic Inverter System
Sunny Home Manager System
Integrated Storage System
Flexible Storage System
Sunny Boy Energy Management Inverter integrated
battery PV inverter and battery
inverter
Only SunnyBoy PV inverter
• “Natural” self consumption: 20% (typical)
• Reduction of energy costs: 25% (typical)
Sunny Home Manager + RC sockets
• Self consumption: 45% (typical)
• Reduction of energy costs : 45% (typical)
SunnyBoy Smart Energy
• Self consumption: 55% (typical)
• Reduction of energy costs: 52% (typical)
SunnyBoy + Sunny Island
• Self consumption: 65% (typical)
• Reduction of energy costs: 57% (typical)
*) based on 5000kWh production per year *) based on 5000kWh production per year *) based on 5000kWh production and consumption per year, battery size: 2kWh
*) based on 5000kWh production and consumption per year, battery size: 5kWh
15
SMA’S ENERGY MANAGEMENT AND STORAGE SOLUTIONS FOR OPTIMIZED SELF CONSUMPTION
Increase the self-consumption rate = Use your own PV energy!
ETIP PV - Photovoltaics: centre-stage in the power system
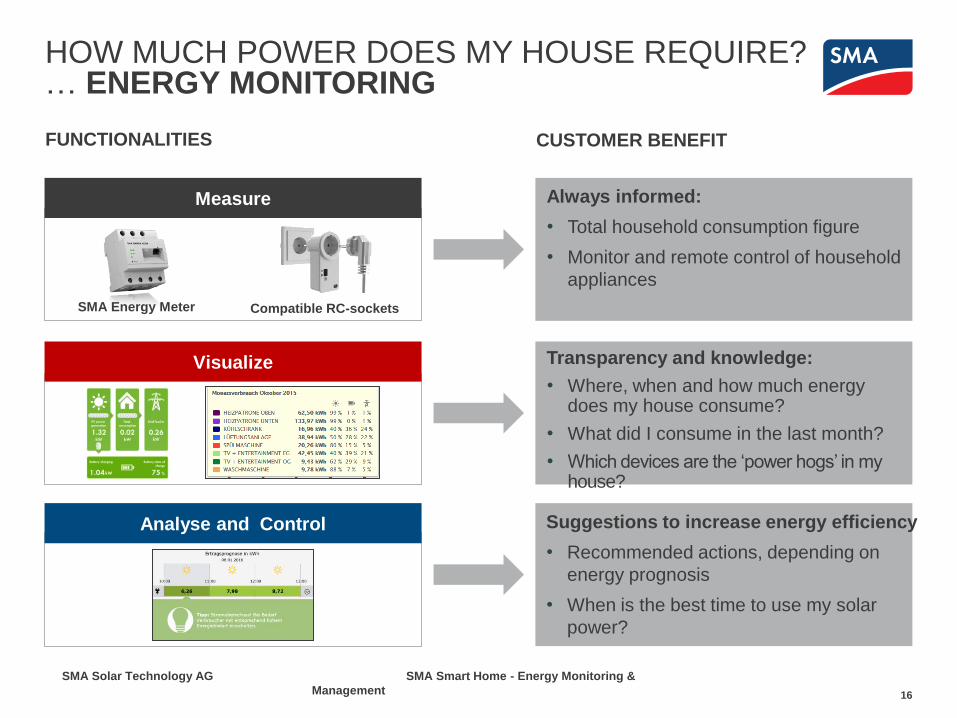
HOW MUCH POWER DOES MY HOUSE REQUIRE? … ENERGY MONITORING
16
FUNCTIONALITIES CUSTOMER BENEFIT
Measure Always informed:
• Total household consumption figure
• Monitor and remote control of household
appliances
SMA Energy Meter Compatible RC-sockets
Transparency and knowledge:
• Where, when and how much energy does my house consume?
• What did I consume in the last month?
• Which devices are the ‘power hogs’ in my house?
Visualize
Analyse and Control Suggestions to increase energy efficiency
• Recommended actions, depending on
energy prognosis
• When is the best time to use my solar
power?
SMA Solar Technology AG SMA Smart Home - Energy Monitoring &
Management
18
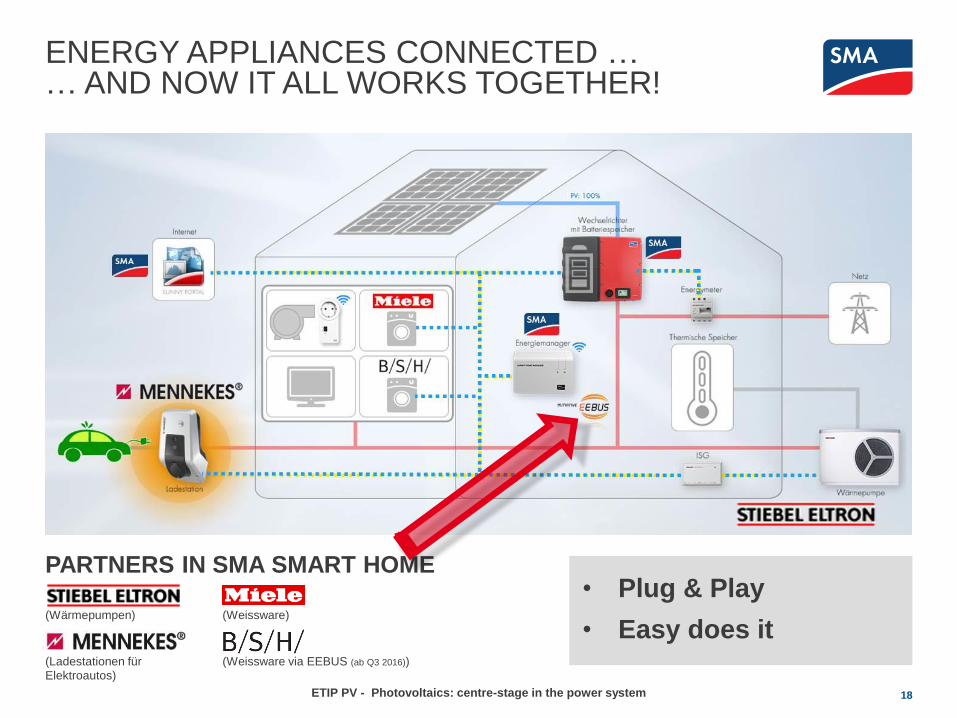
ENERGY APPLIANCES CONNECTED … … AND NOW IT ALL WORKS TOGETHER!
PARTNERS IN SMA SMART HOME
(Ladestationen für
Elektroautos)
(Weissware) (Wärmepumpen)
(Weissware via EEBUS (ab Q3 2016))
• Plug & Play
• Easy does it
ETIP PV - Photovoltaics: centre-stage in the power system
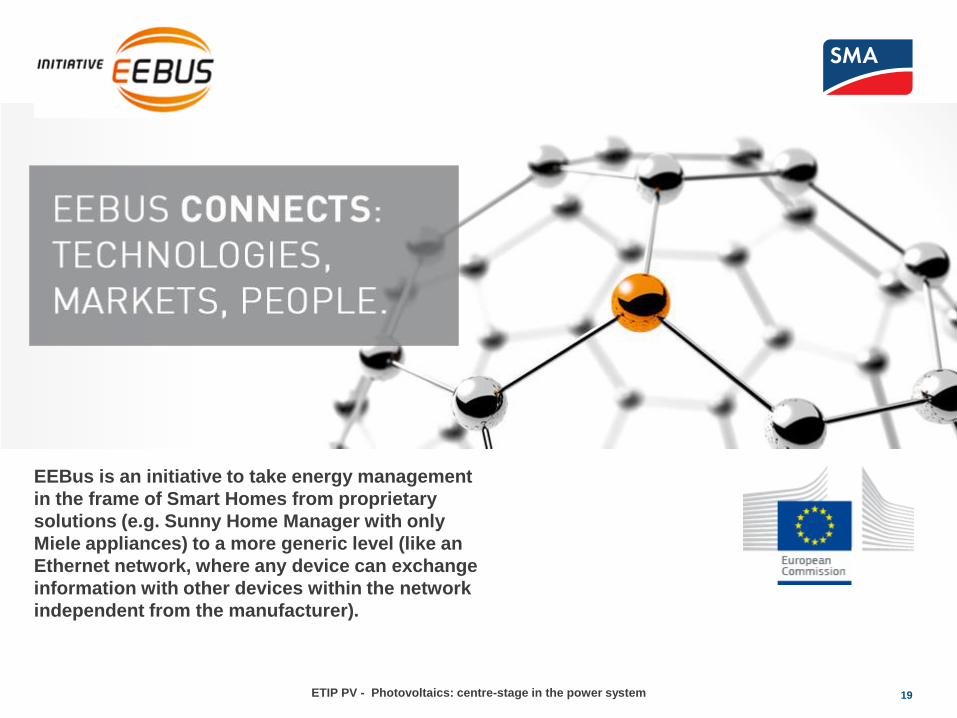
EEBus is an initiative to take energy management
in the frame of Smart Homes from proprietary
solutions (e.g. Sunny Home Manager with only
Miele appliances) to a more generic level (like an
Ethernet network, where any device can exchange
information with other devices within the network
independent from the manufacturer).
19 ETIP PV - Photovoltaics: centre-stage in the power system
20
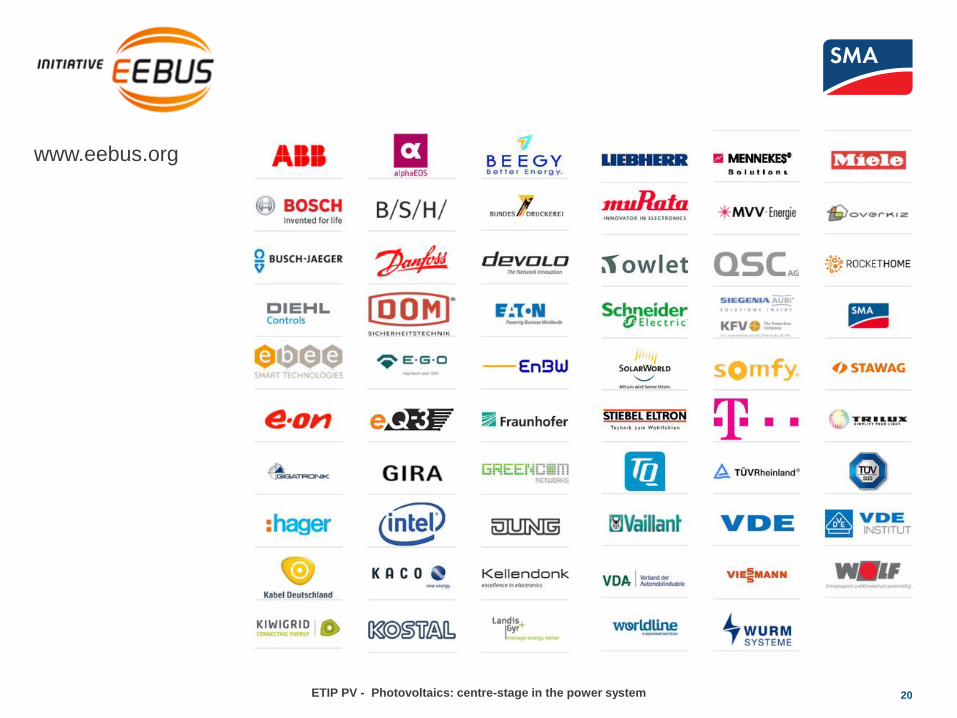
www.eebus.org
ETIP PV - Photovoltaics: centre-stage in the power system
21
E-MOBILITY
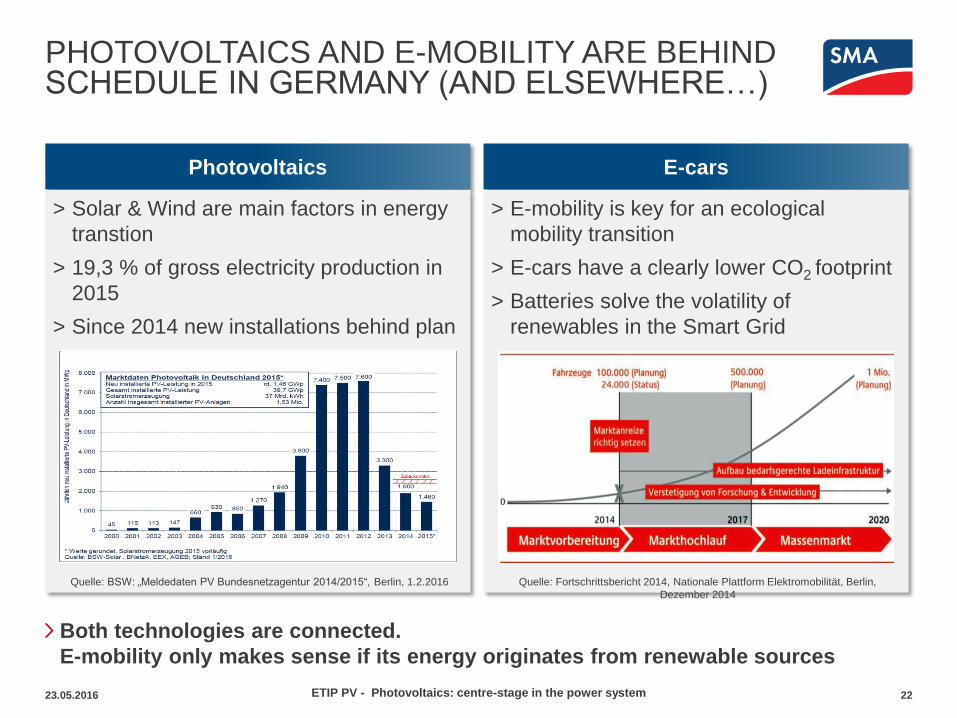
PHOTOVOLTAICS AND E-MOBILITY ARE BEHIND SCHEDULE IN GERMANY (AND ELSEWHERE…)
23.05.2016 22
Both technologies are connected.
E-mobility only makes sense if its energy originates from renewable sources
Photovoltaics
> Solar & Wind are main factors in energy
transtion
> 19,3 % of gross electricity production in
2015
> Since 2014 new installations behind plan
E-cars
> E-mobility is key for an ecological
mobility transition
> E-cars have a clearly lower CO2 footprint
> Batteries solve the volatility of
renewables in the Smart Grid
Quelle: Fortschrittsbericht 2014, Nationale Plattform Elektromobilität, Berlin,
Dezember 2014
Quelle: BSW: „Meldedaten PV Bundesnetzagentur 2014/2015“, Berlin, 1.2.2016
ETIP PV - Photovoltaics: centre-stage in the power system
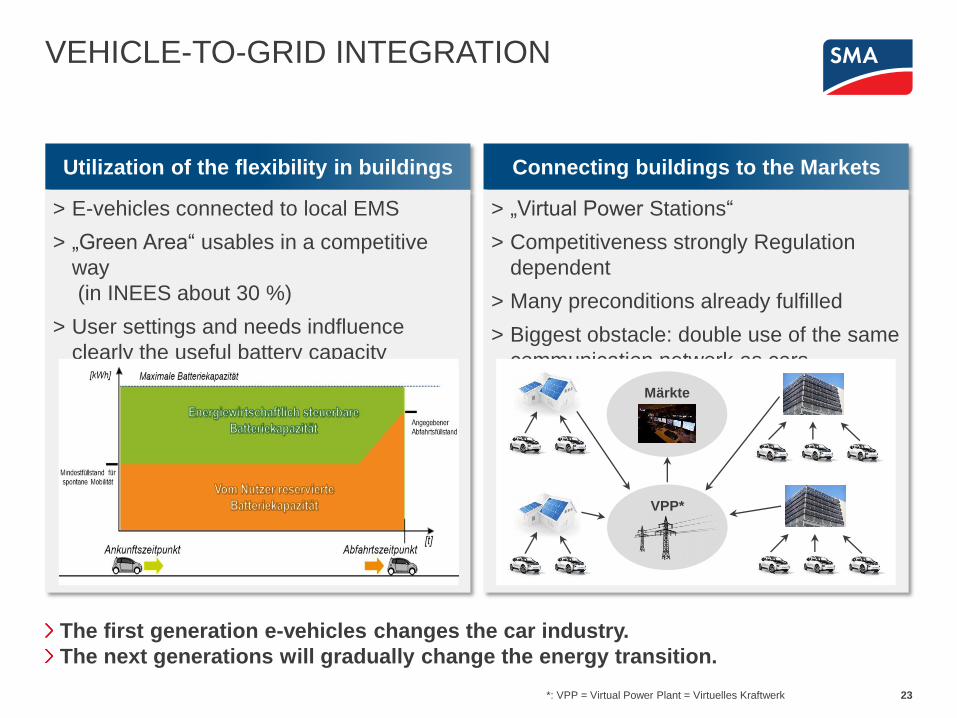
VEHICLE-TO-GRID INTEGRATION
23
The first generation e-vehicles changes the car industry.
The next generations will gradually change the energy transition.
Utilization of the flexibility in buildings
> E-vehicles connected to local EMS
> „Green Area“ usables in a competitive
way
(in INEES about 30 %)
> User settings and needs indfluence
clearly the useful battery capacity
Connecting buildings to the Markets
> „Virtual Power Stations“
> Competitiveness strongly Regulation
dependent
> Many preconditions already fulfilled
> Biggest obstacle: double use of the same
communication network as cars
*: VPP = Virtual Power Plant = Virtuelles Kraftwerk
VPP*
Märkte
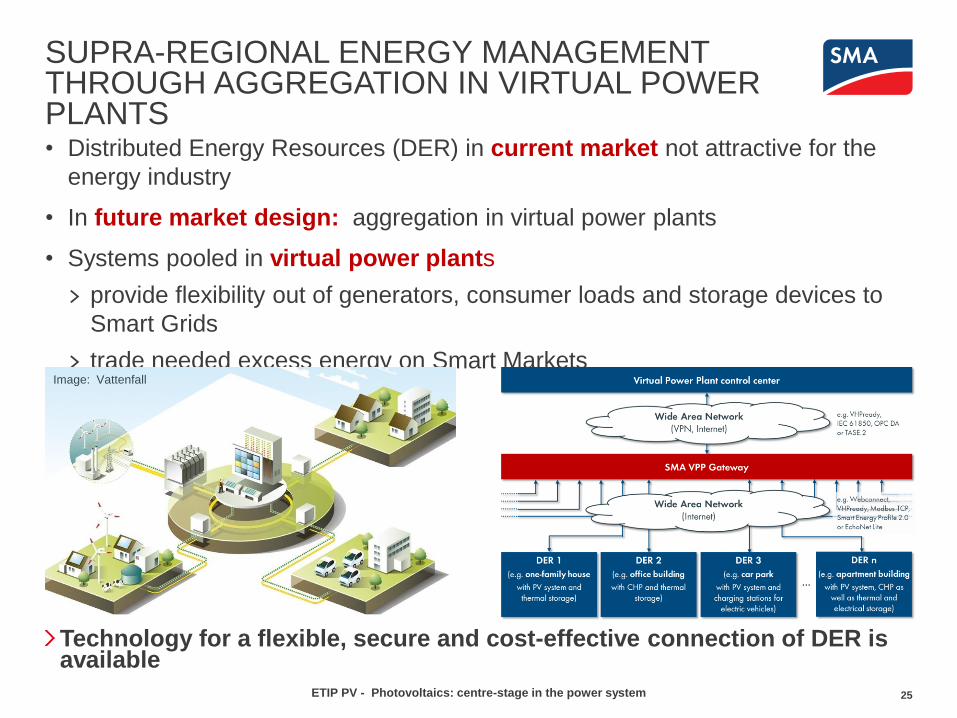
SUPRA-REGIONAL ENERGY MANAGEMENT THROUGH AGGREGATION IN VIRTUAL POWER PLANTS • Distributed Energy Resources (DER) in current market not attractive for the
energy industry
• In future market design: aggregation in virtual power plants
• Systems pooled in virtual power plants
> provide flexibility out of generators, consumer loads and storage devices to
Smart Grids
> trade needed excess energy on Smart Markets Image: Vattenfall
25
Technology for a flexible, secure and cost-effective connection of DER is available
ETIP PV - Photovoltaics: centre-stage in the power system
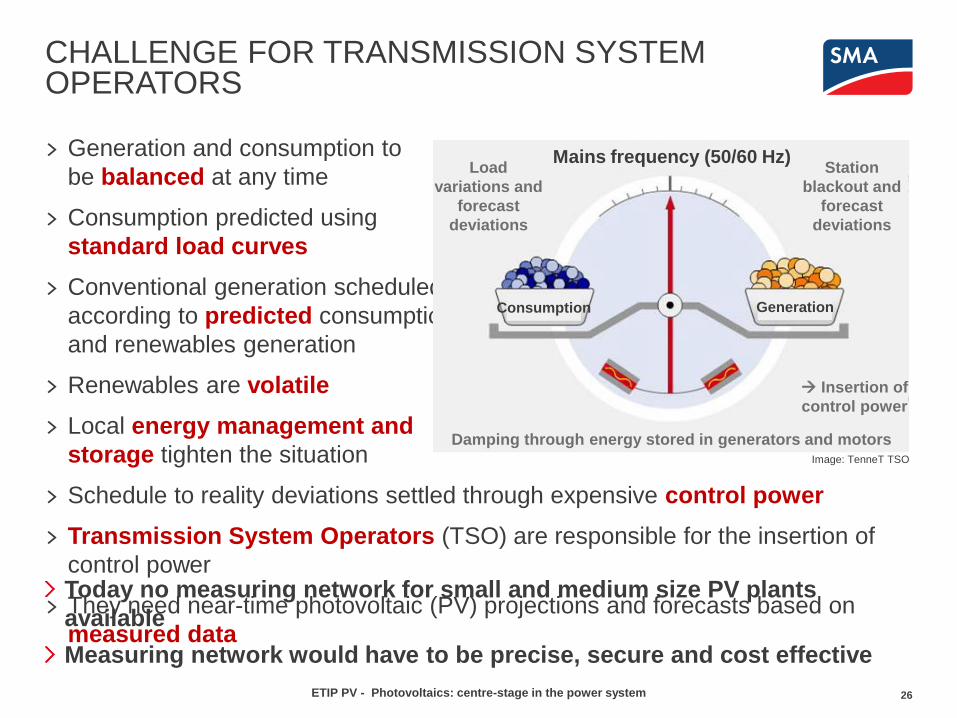
CHALLENGE FOR TRANSMISSION SYSTEM OPERATORS
> Generation and consumption to
be balanced at any time
> Consumption predicted using
standard load curves
> Conventional generation scheduled
according to predicted consumption
and renewables generation
> Renewables are volatile
> Local energy management and
storage tighten the situation
> Schedule to reality deviations settled through expensive control power
> Transmission System Operators (TSO) are responsible for the insertion of
control power
> They need near-time photovoltaic (PV) projections and forecasts based on
measured data
26
Today no measuring network for small and medium size PV plants
available
Measuring network would have to be precise, secure and cost effective
Mains frequency (50/60 Hz)
Consumption Generation
Damping through energy stored in generators and motors
Load
variations and
forecast
deviations
Station
blackout and
forecast
deviations
Insertion of
control power
Image: TenneT TSO
ETIP PV - Photovoltaics: centre-stage in the power system
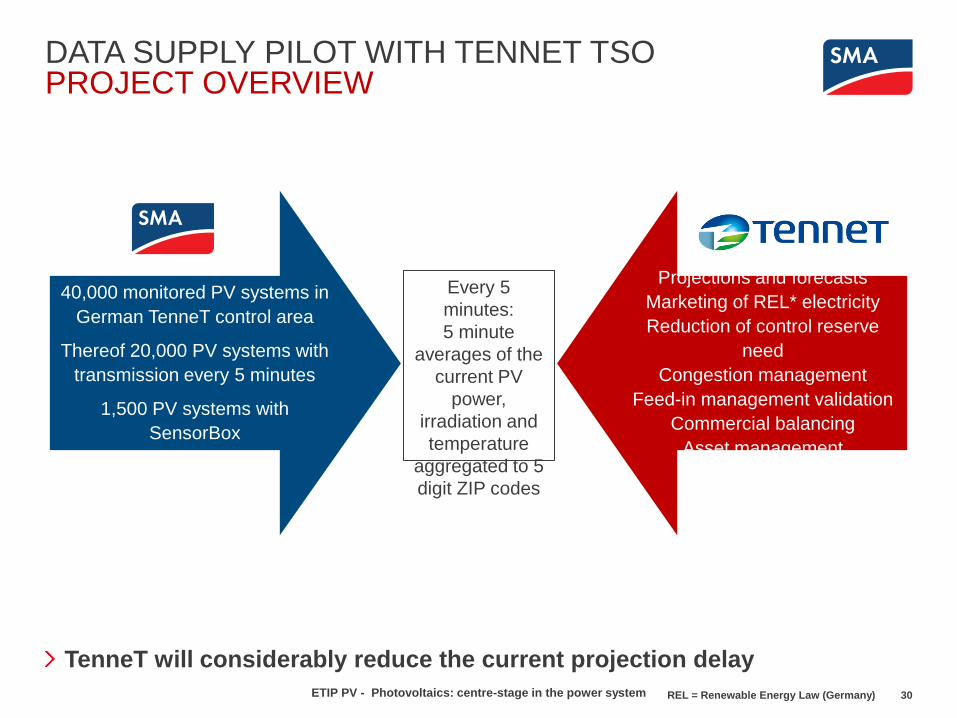
DATA SUPPLY PILOT WITH TENNET TSO PROJECT OVERVIEW
30
40,000 monitored PV systems in
German TenneT control area
Thereof 20,000 PV systems with
transmission every 5 minutes
1,500 PV systems with
SensorBox
Projections and forecasts
Marketing of REL* electricity
Reduction of control reserve
need
Congestion management
Feed-in management validation
Commercial balancing
Asset management
Every 5
minutes:
5 minute
averages of the
current PV
power,
irradiation and
temperature
aggregated to 5
digit ZIP codes
REL = Renewable Energy Law (Germany)
TenneT will considerably reduce the current projection delay
ETIP PV - Photovoltaics: centre-stage in the power system
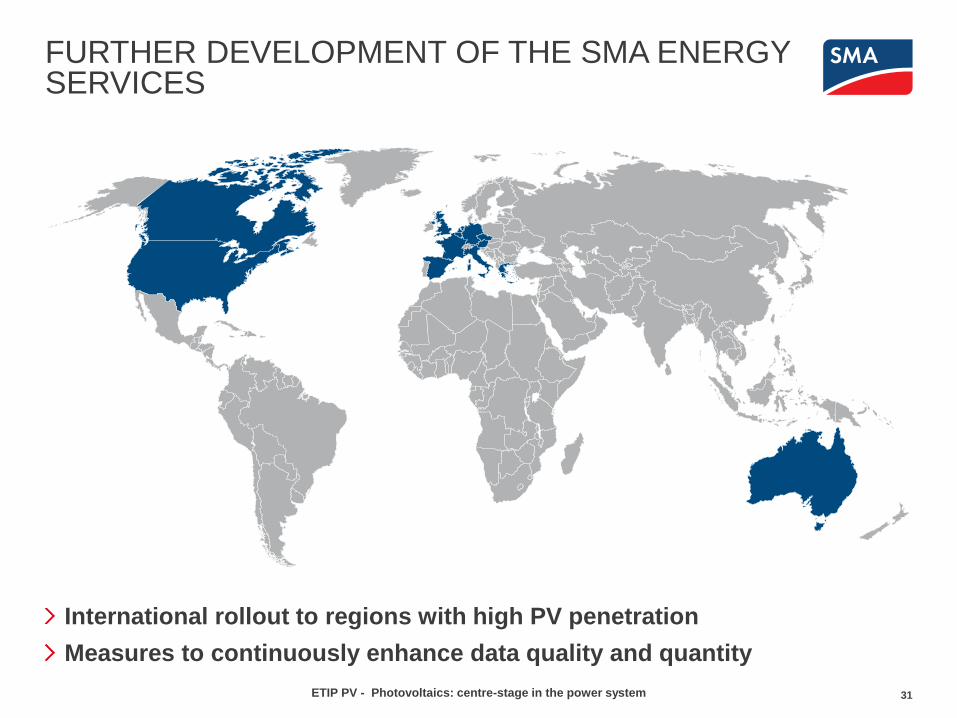
FURTHER DEVELOPMENT OF THE SMA ENERGY SERVICES
31
International rollout to regions with high PV penetration
Measures to continuously enhance data quality and quantity
ETIP PV - Photovoltaics: centre-stage in the power system
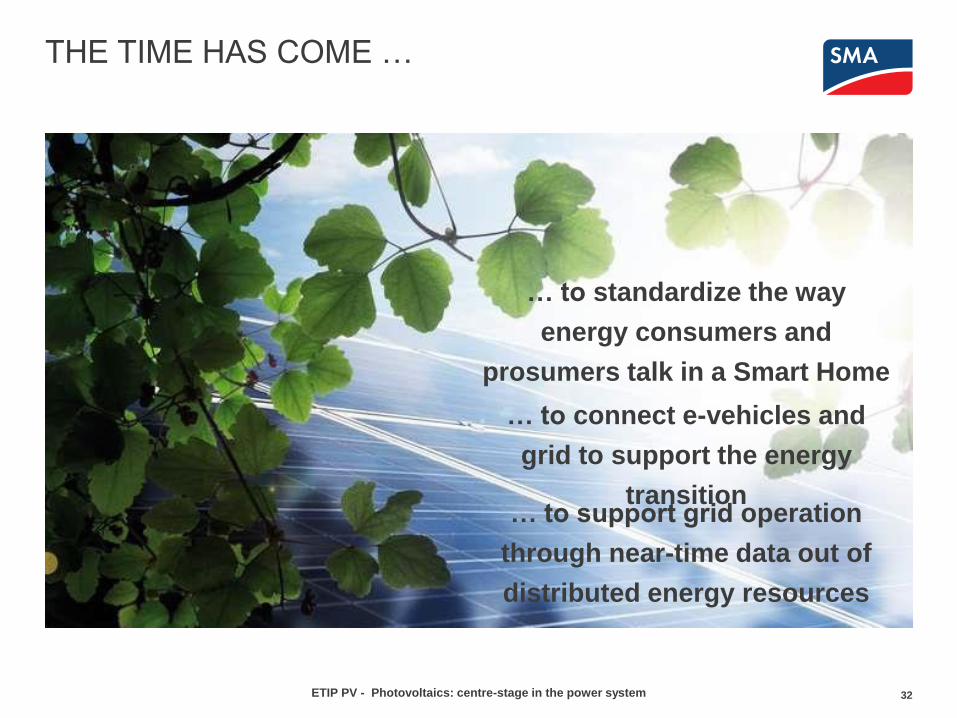
THE TIME HAS COME …
… to support grid operation
through near-time data out of
distributed energy resources
32
… to connect e-vehicles and
grid to support the energy
transition
… to standardize the way
energy consumers and
prosumers talk in a Smart Home
ETIP PV - Photovoltaics: centre-stage in the power system

Thank you for your interest!
Jan Van Laethem
Regional Manager SMA Western
Europe
(Benelux, UK, France)
SMA Solar Technology AG
Sonnenallee 1, 34266 Niestetal,
Germany
+49 561 9522 0
SOCIAL MEDIA
www.SMA.de/Newsroom
Supporting Power Quality in Distribution Networks with Inverters
Andreas Schlumberger / Thomas Schaupp – KACO new energy May 18th, 2016
Topics
1 Installed power today
2 Critical issues
3 Today’s solutions
4 Solutions in standardization
CENELEC TS 50549
5 Looking ahead
Andreas Schlumberger – KACO new energy May 18th, 2016 | 2
Topics
1 Installed power today
2 Critical issues
3 Today’s solutions
4 Solutions in standardization
CENELEC TS 50549
5 Looking ahead
Andreas Schlumberger – KACO new energy May 18th, 2016 | 3
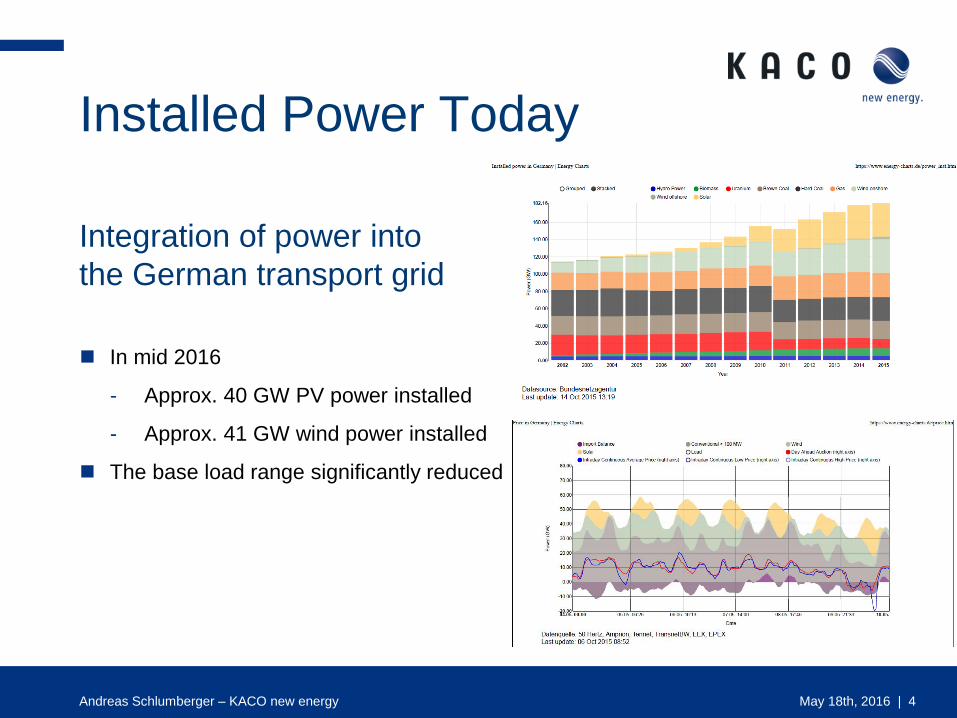
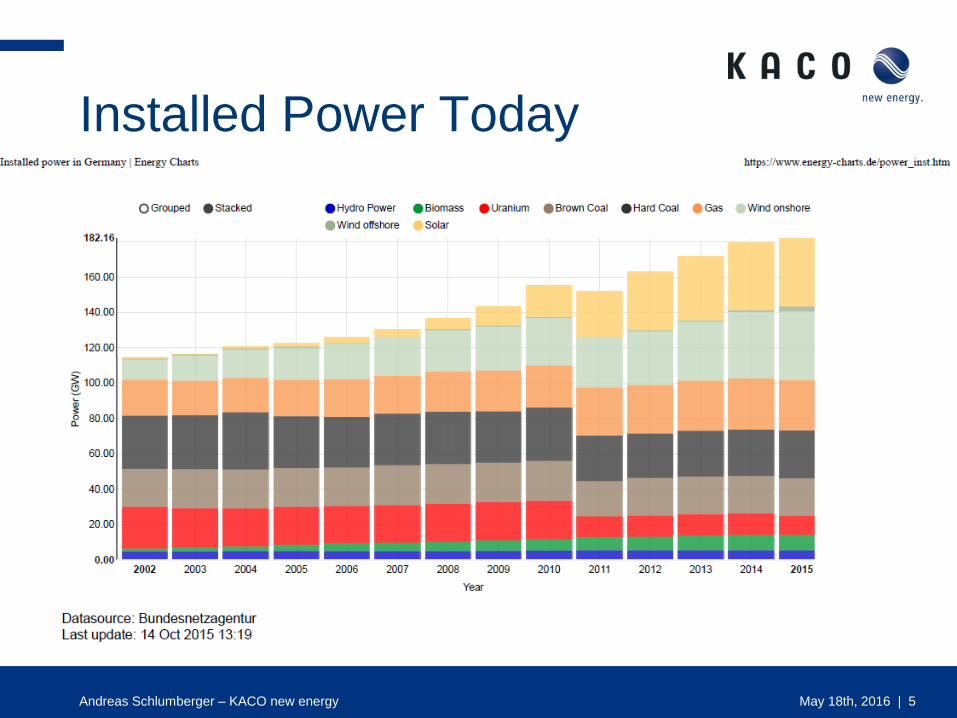
Installed Power Today
Integration of power into
the German transport grid
In mid 2016
- Approx. 40 GW PV power installed
- Approx. 41 GW wind power installed
The base load range significantly reduced
Andreas Schlumberger – KACO new energy May 18th, 2016 | 4
Installed Power Today
Andreas Schlumberger – KACO new energy May 18th, 2016 | 5
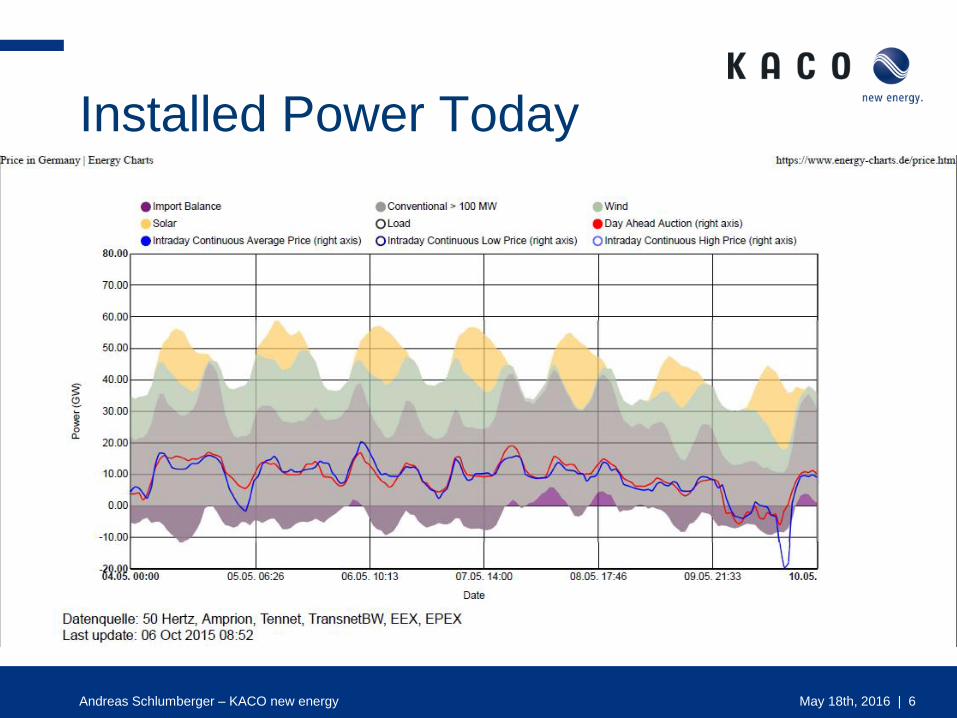
Installed Power Today
Andreas Schlumberger – KACO new energy May 18th, 2016 | 6

Topics
1 Installed power today
2 Critical issues
3 Today’s solutions
4 Solutions in standardization
CENELEC TS 50549
5 Looking ahead
Andreas Schlumberger – KACO new energy May 18th, 2016 | 7
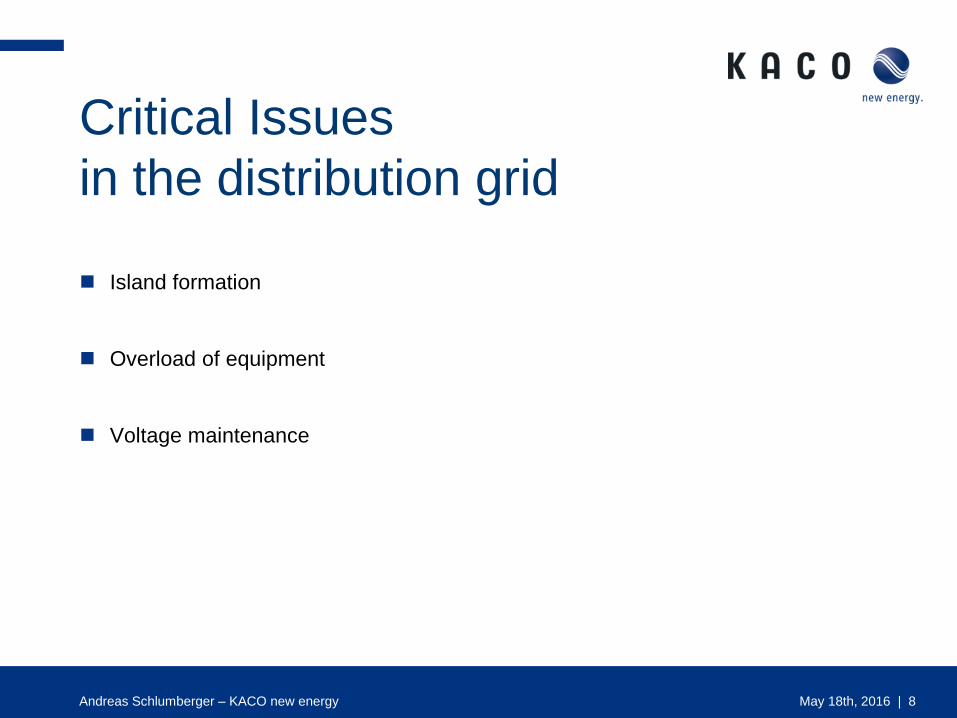
Critical Issues
in the distribution grid
Island formation
Overload of equipment
Voltage maintenance
Andreas Schlumberger – KACO new energy May 18th, 2016 | 8
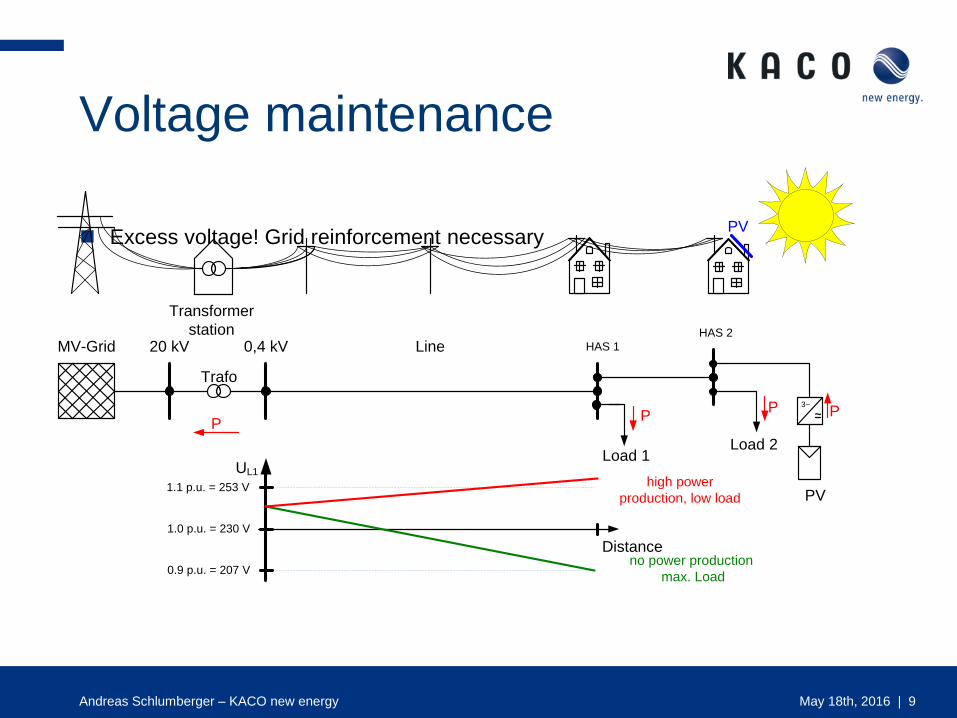
Voltage maintenance
Excess voltage! Grid reinforcement necessary
Andreas Schlumberger – KACO new energy
PV
PP P
MV-Grid 20 kV
Trafo
0,4 kV Line HAS 1
HAS 2
Load 1Load 2
PV
UL1
Distance
P
3~
~
1.1 p.u. = 253 V
1.0 p.u. = 230 V
high power
production, low load
no power production
max. Load0.9 p.u. = 207 V
Transformer
station
May 18th, 2016 | 9
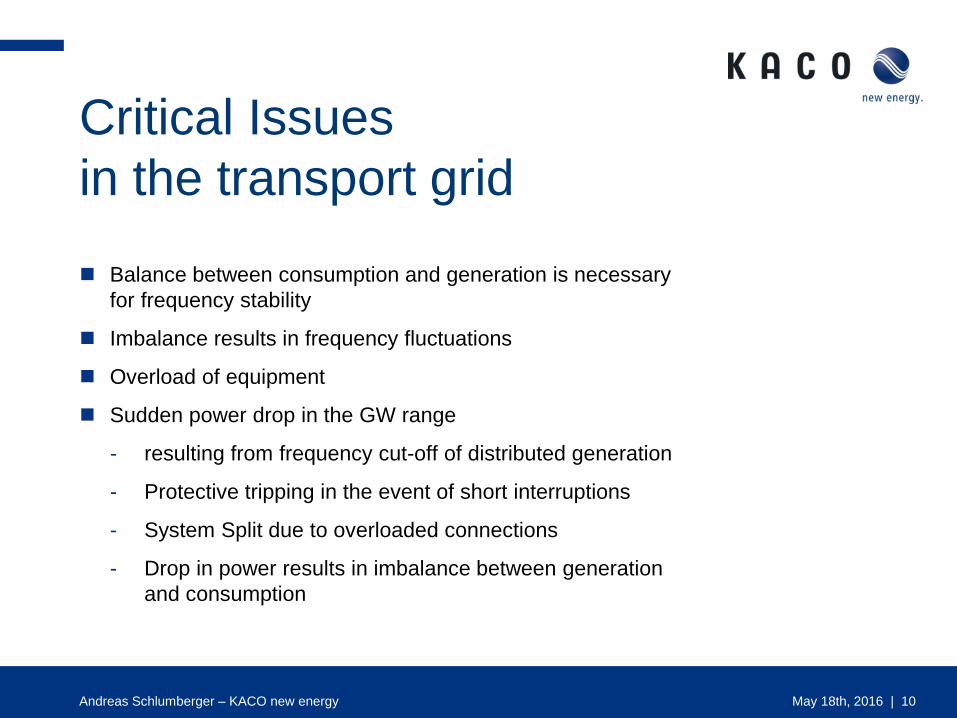
Critical Issues
in the transport grid
Balance between consumption and generation is necessary
for frequency stability
Imbalance results in frequency fluctuations
Overload of equipment
Sudden power drop in the GW range
- resulting from frequency cut-off of distributed generation
- Protective tripping in the event of short interruptions
- System Split due to overloaded connections
- Drop in power results in imbalance between generation
and consumption
Andreas Schlumberger – KACO new energy May 18th, 2016 | 10
Topics
1 Installed power today
2 Critical issues
3 Today’s solutions
4 Solutions in standardization
CENELEC TS 50549
5 Looking ahead
Andreas Schlumberger – KACO new energy May 18th, 2016 |
11
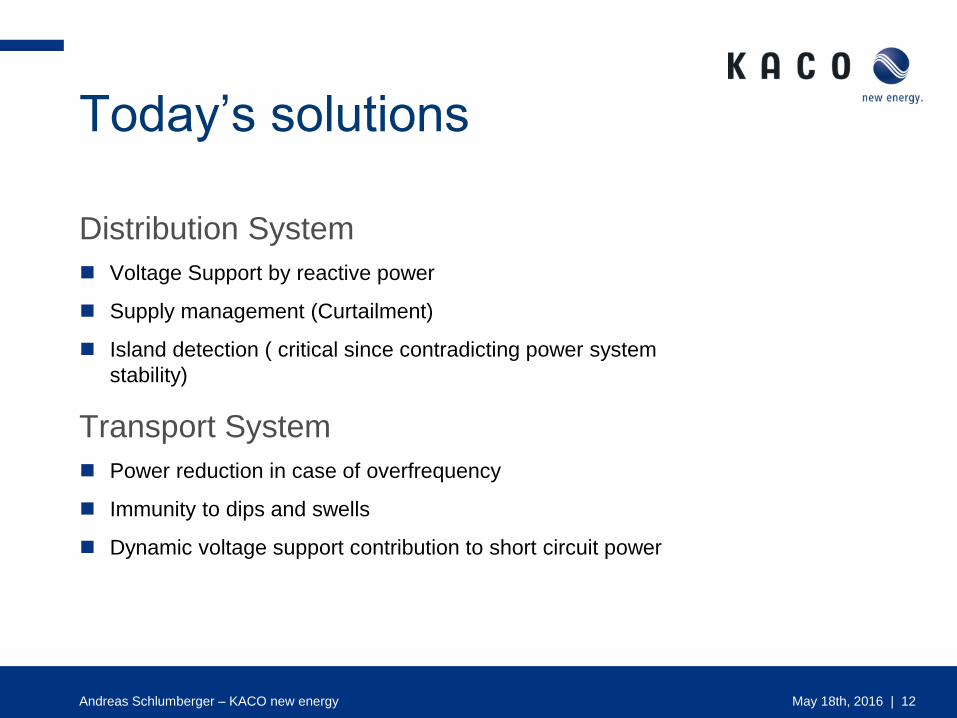
Today’s solutions
Distribution System
Voltage Support by reactive power
Supply management (Curtailment)
Island detection ( critical since contradicting power system
stability)
Transport System
Power reduction in case of overfrequency
Immunity to dips and swells
Dynamic voltage support contribution to short circuit power
Andreas Schlumberger – KACO new energy May 18th, 2016 | 12
Topics
1 Installed power today
2 Critical issues
3 Today’s solutions
4 Solutions in standardization
CENELEC TS 50549
5 Looking ahead
Andreas Schlumberger – KACO new energy May 18th, 2016 |
13
General assumption
Standardization is required to write down state of the art
Manufacturers require standardization to produce unified
equipment for all countries
Due to different network topology network operators have
different needs to integrate dispersed generation
- But the general problems are the same
Andreas Schlumberger – KACO new energy May 18th, 2016 | 14
Solution
Define standard behavior for dispersed generation
Allow adjustment to local needs
Analysis of system impact is very specific to the local
topology of the grid excluded from scope
Andreas Schlumberger – KACO new energy May 18th, 2016 | 15
Included topics
Range of operation (not protection)
Immunity to disturbance
- Voltage dips
- Rate of change of frequency
Reactive power provision
Standard control modes for reactive power
Dynamic grid support
Protection (voltage and frequency)
Communication
Andreas Schlumberger – KACO new energy May 18th, 2016 | 16
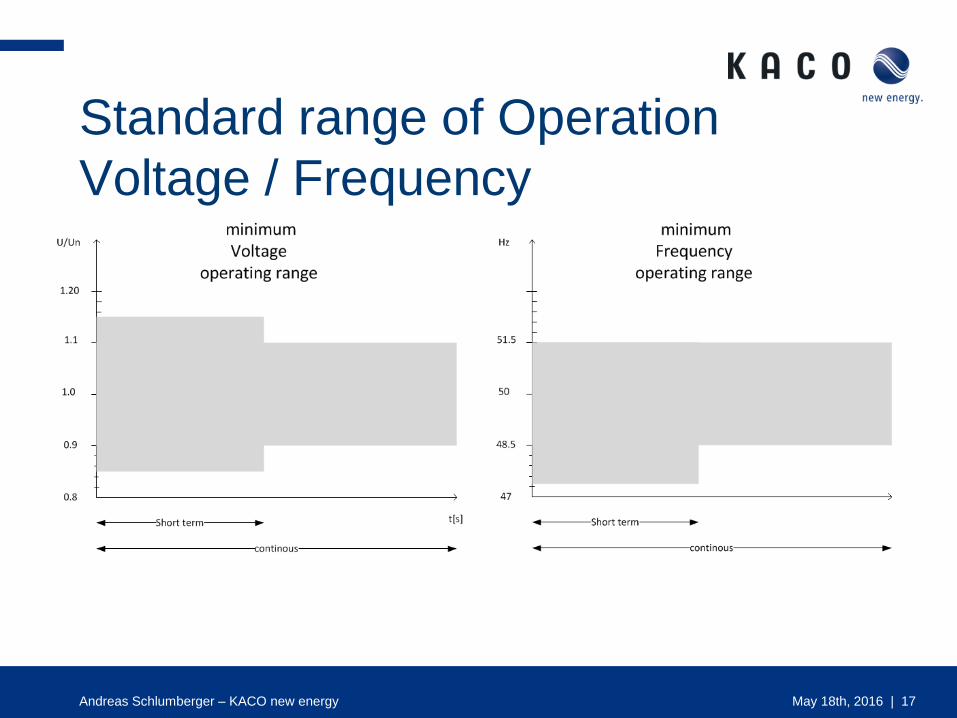
Standard range of Operation
Voltage / Frequency
Andreas Schlumberger – KACO new energy May 18th, 2016 | 17
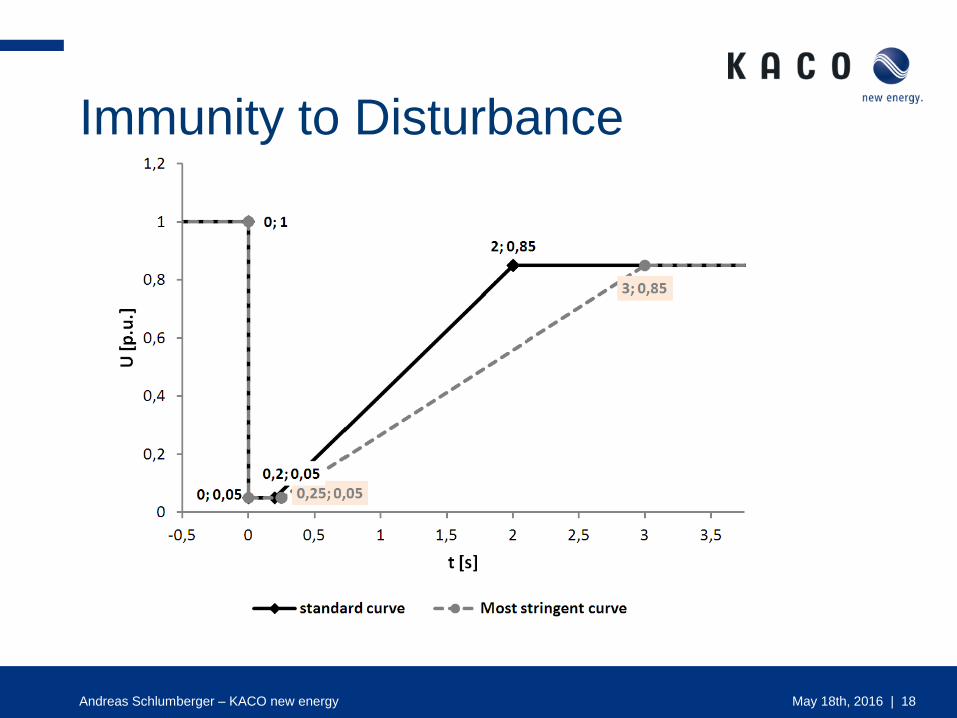
Immunity to Disturbance
Andreas Schlumberger – KACO new energy May 18th, 2016 | 18
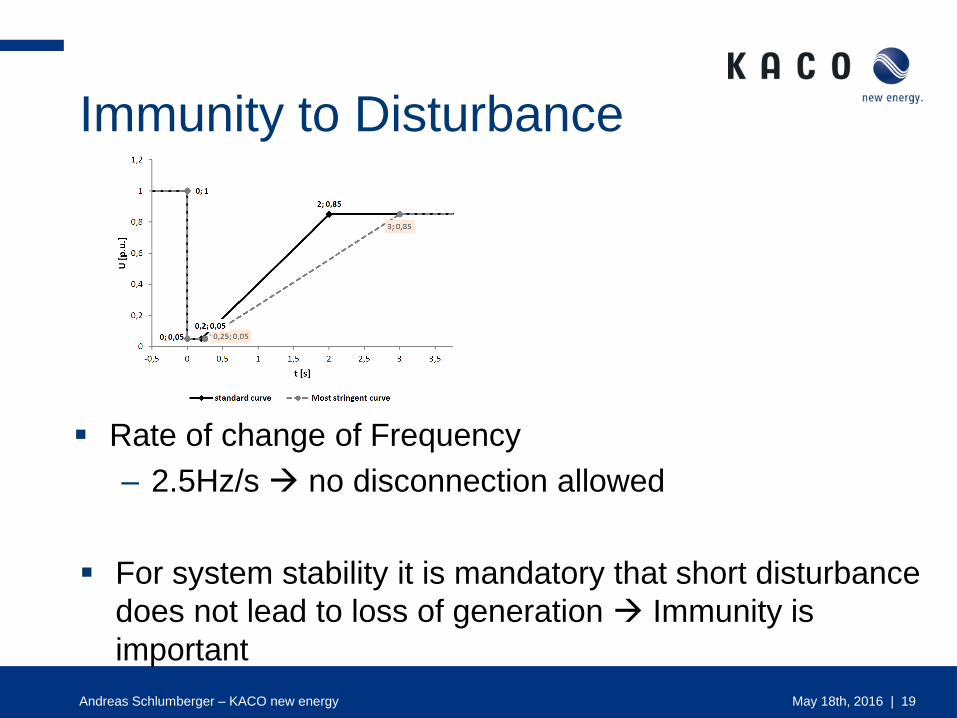
Immunity to Disturbance
Rate of change of Frequency
– 2.5Hz/s no disconnection allowed
For system stability it is mandatory that short disturbance
does not lead to loss of generation Immunity is
important
Andreas Schlumberger – KACO new energy May 18th, 2016 | 19
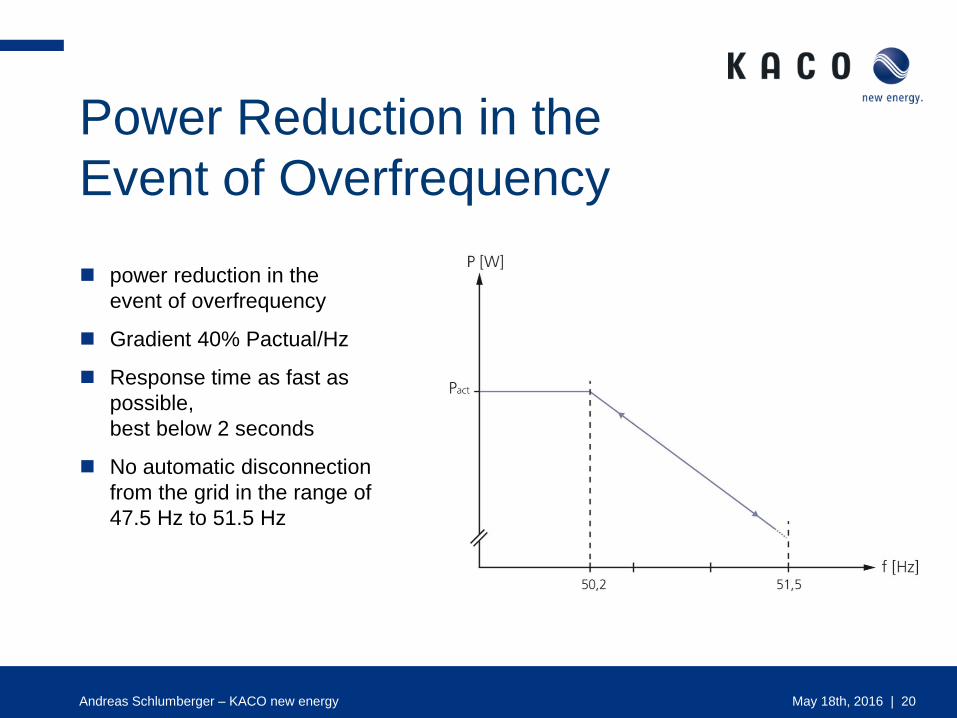
Power Reduction in the
Event of Overfrequency
power reduction in the
event of overfrequency
Gradient 40% Pactual/Hz
Response time as fast as
possible,
best below 2 seconds
No automatic disconnection
from the grid in the range of
47.5 Hz to 51.5 Hz
Andreas Schlumberger – KACO new energy May 18th, 2016 | 20
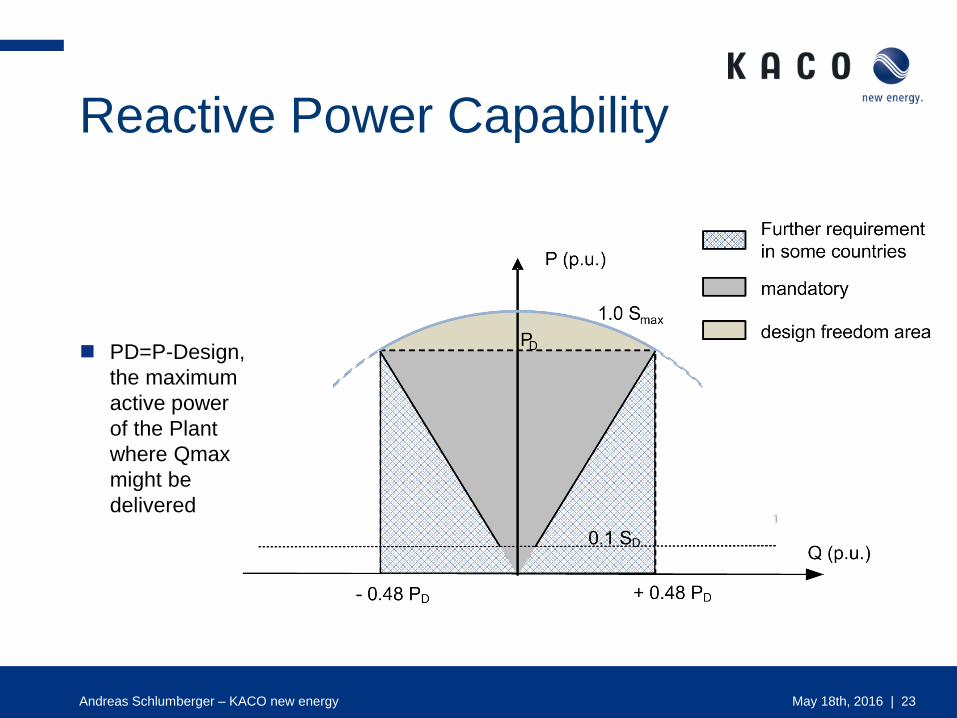
Reactive Power Capability
PD=P-Design,
the maximum
active power
of the Plant
where Qmax
might be
delivered
Andreas Schlumberger – KACO new energy May 18th, 2016 | 23
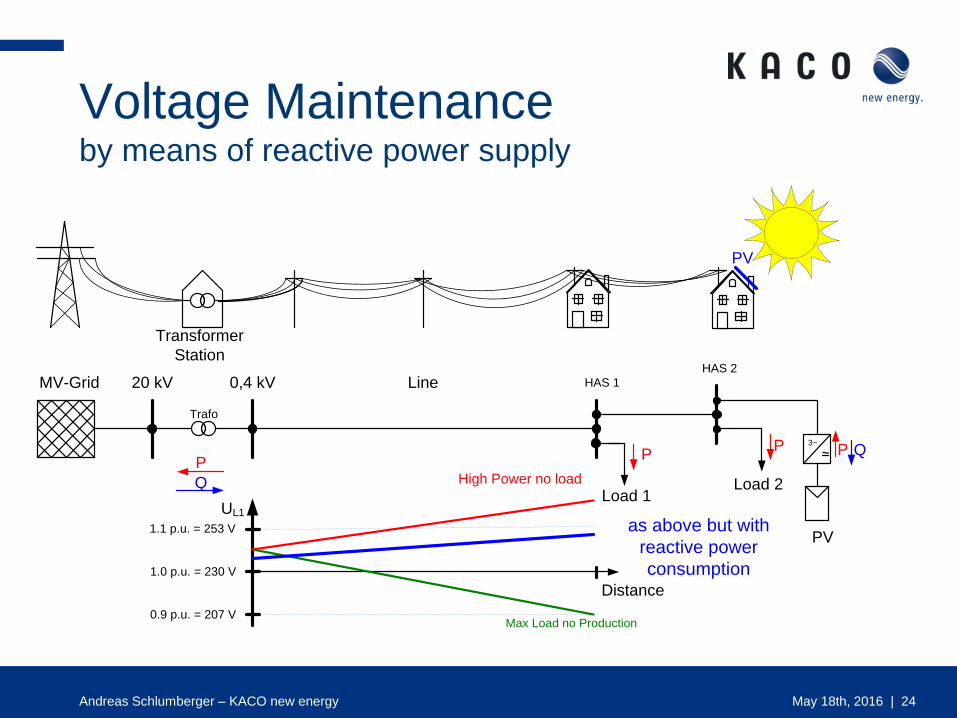
Voltage Maintenance by means of reactive power supply
Andreas Schlumberger – KACO new energy May 18th, 2016 | 24
PV
PP P
20 kV
Trafo
0,4 kV Line HAS 1
HAS 2
Load 1Load 2
PV
UL1
Distance
P
3~
~
1.1 p.u. = 253 V
1.0 p.u. = 230 V
High Power no load
Max Load no Production0.9 p.u. = 207 V
Transformer
Station
Q
Q
as above but with
reactive power
consumption
MV-Grid
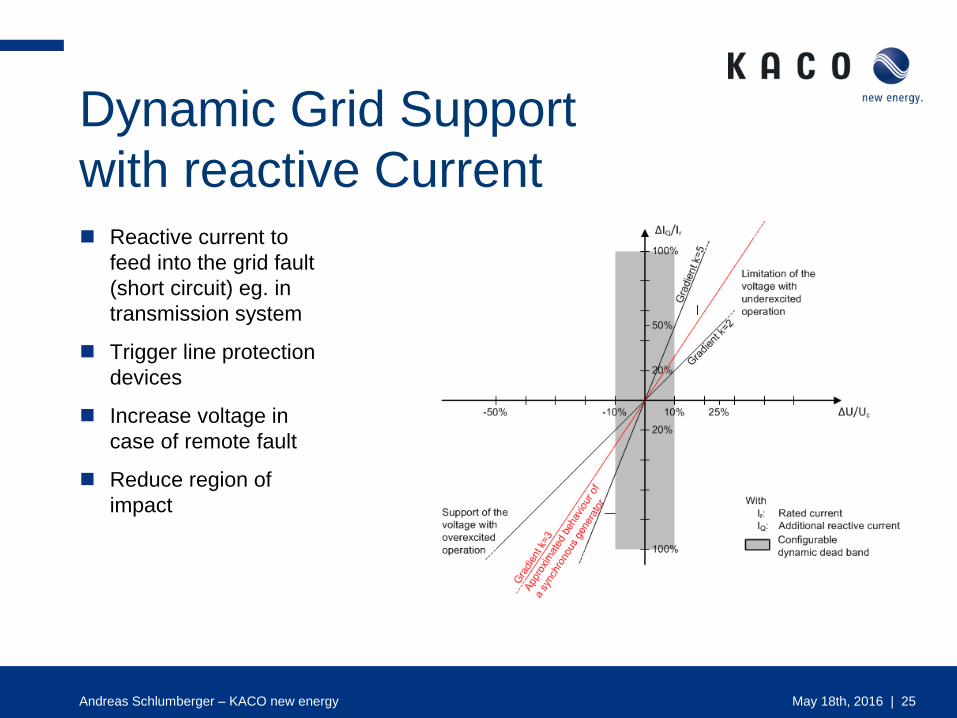
Dynamic Grid Support
with reactive Current Reactive current to
feed into the grid fault
(short circuit) eg. in
transmission system
Trigger line protection
devices
Increase voltage in
case of remote fault
Reduce region of
impact
Andreas Schlumberger – KACO new energy May 18th, 2016 | 25
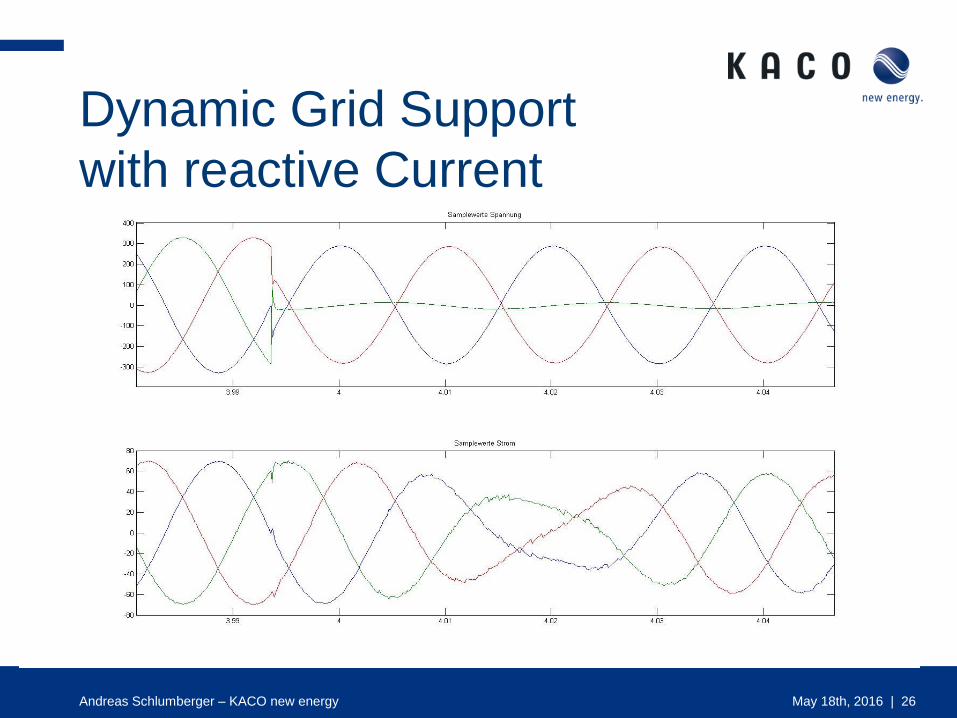
Dynamic Grid Support
with reactive Current
Andreas Schlumberger – KACO new energy May 18th, 2016 | 26
Protection
Available Protection Function
Voltage
- Over/Under-voltage Phase-Phase
- Over/Under-voltage Phase-Neutral
- Over/Under-voltage Positive/Negative/Zero sequence
- Overvoltage Average values (eg. 10 min average RMS)
Over/Under Frequency
Line protection / overcurrent is considered mandatory in
installation standards and is not included in TS50549
Andreas Schlumberger – KACO new energy May 18th, 2016 | 27

Topics
1 Installed power today
2 Critical issues
3 Today’s solutions
4 Solutions in standardization
CENELEC TS 50549
5 Looking ahead
Andreas Schlumberger – KACO new energy May 18th, 2016 |
28
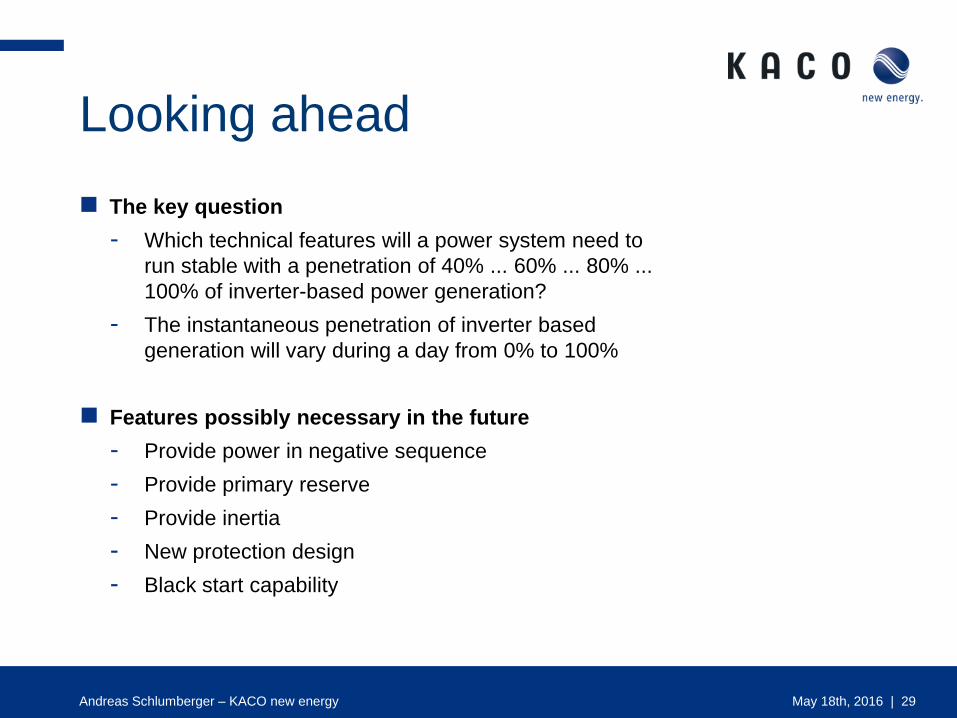
Looking ahead
The key question
- Which technical features will a power system need to
run stable with a penetration of 40% ... 60% ... 80% ...
100% of inverter-based power generation?
- The instantaneous penetration of inverter based
generation will vary during a day from 0% to 100%
Features possibly necessary in the future
- Provide power in negative sequence
- Provide primary reserve
- Provide inertia
- New protection design
- Black start capability
Andreas Schlumberger – KACO new energy May 18th, 2016 | 29
So … How far can we go with inverters only?
100% inverter-based grid is possible
- Already implemented in small scale, e.g. UPS, island
grids
- Research for large scale needed
Andreas Schlumberger – KACO new energy May 18th, 2016 | 30
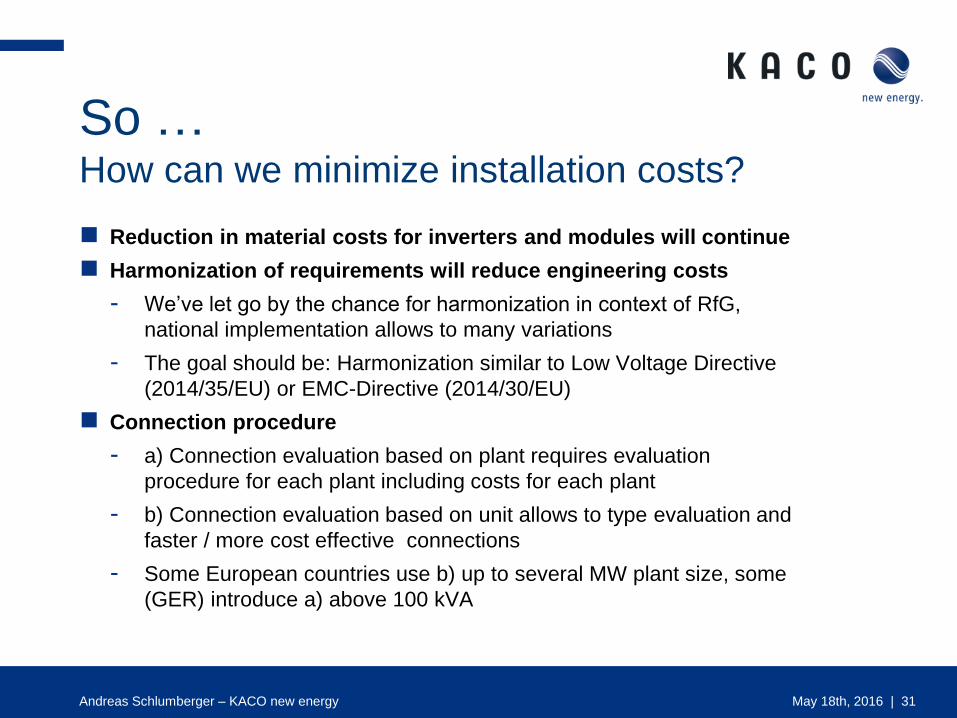
So … How can we minimize installation costs?
Reduction in material costs for inverters and modules will continue
Harmonization of requirements will reduce engineering costs
- We’ve let go by the chance for harmonization in context of RfG,
national implementation allows to many variations
- The goal should be: Harmonization similar to Low Voltage Directive
(2014/35/EU) or EMC-Directive (2014/30/EU)
Connection procedure
- a) Connection evaluation based on plant requires evaluation
procedure for each plant including costs for each plant
- b) Connection evaluation based on unit allows to type evaluation and
faster / more cost effective connections
- Some European countries use b) up to several MW plant size, some
(GER) introduce a) above 100 kVA
Andreas Schlumberger – KACO new energy May 18th, 2016 | 31
Thank for your attention.
KACO new energy GmbH
Carl-Zeiss-Str. 1 . 74172 Neckarsulm . Deutschland
Fon +49 7132 3818 0 . Fax +49 7132 3818 703
[email protected] . www.kaco-newenergy.com
Stability of the power system with converter-interfaced generation Moving from a system based on synchronous machines to a system based on inverters
Marie-Sophie Debry, RTE
Introduction
The decrease of inertia level is a subject that is currently under scrutiny: • Many studies and articles… • Possibility in the grid codes to require « synthetic inertia » from inverters
In the next future, potentially very few synchronous machines connected to grids during certain seasons or certain hours of the day… From inertia to synchrony: • Going from a system driven by physical laws to a system driven by the controls of
inverters • Power Electronics are fully controllable BUT they only do what is in their control
system! • There is no natural behavior of inverters, this is very dependent on manufacturers.
Requirements
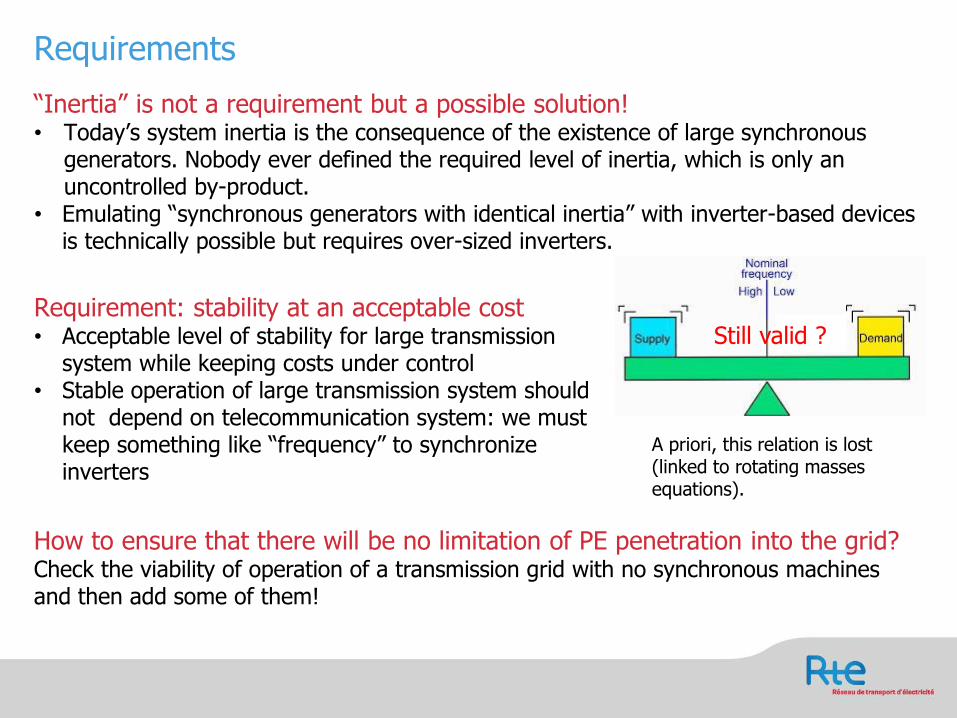
“Inertia” is not a requirement but a possible solution! • Today’s system inertia is the consequence of the existence of large synchronous
generators. Nobody ever defined the required level of inertia, which is only an uncontrolled by-product.
• Emulating “synchronous generators with identical inertia” with inverter-based devices is technically possible but requires over-sized inverters.
Requirement: stability at an acceptable cost • Acceptable level of stability for large transmission
system while keeping costs under control • Stable operation of large transmission system should
not depend on telecommunication system: we must keep something like “frequency” to synchronize inverters
Still valid ?
A priori, this relation is lost (linked to rotating masses equations).
How to ensure that there will be no limitation of PE penetration into the grid? Check the viability of operation of a transmission grid with no synchronous machines and then add some of them!
Challenge: a grid-forming control strategy…
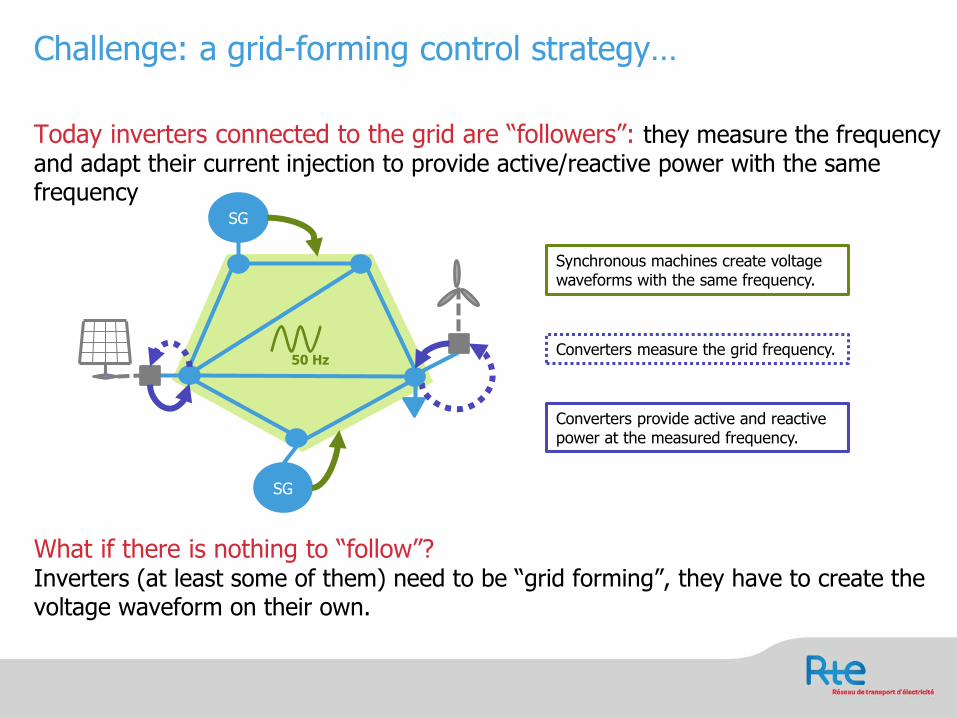
Today inverters connected to the grid are “followers”: they measure the frequency and adapt their current injection to provide active/reactive power with the same frequency
SG
SG
50 Hz
Synchronous machines create voltage waveforms with the same frequency.
Converters measure the grid frequency.
Converters provide active and reactive power at the measured frequency.
What if there is nothing to “follow”? Inverters (at least some of them) need to be “grid forming”, they have to create the voltage waveform on their own.
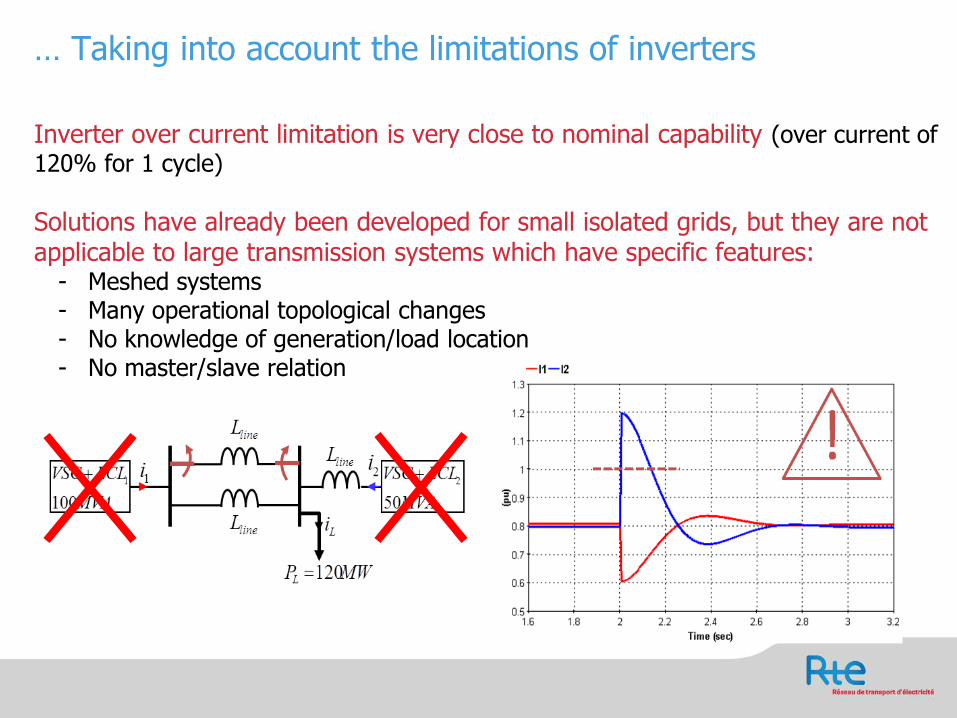
… Taking into account the limitations of inverters
Inverter over current limitation is very close to nominal capability (over current of 120% for 1 cycle)
Solutions have already been developed for small isolated grids, but they are not applicable to large transmission systems which have specific features:
- Meshed systems - Many operational topological changes - No knowledge of generation/load location - No master/slave relation
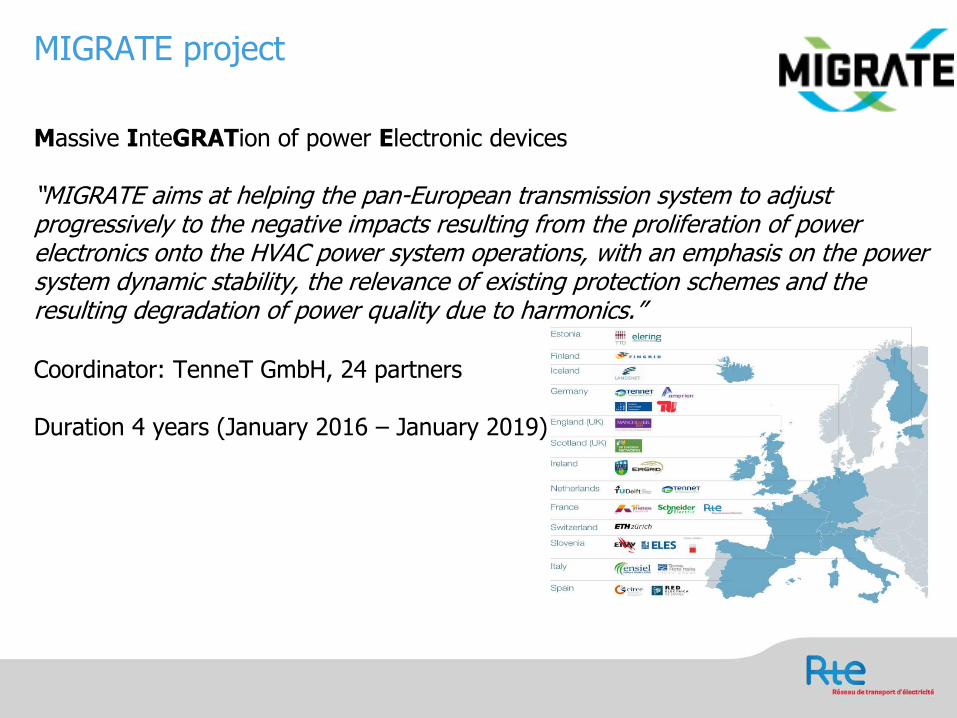
MIGRATE project
Massive InteGRATion of power Electronic devices “MIGRATE aims at helping the pan-European transmission system to adjust progressively to the negative impacts resulting from the proliferation of power electronics onto the HVAC power system operations, with an emphasis on the power system dynamic stability, the relevance of existing protection schemes and the resulting degradation of power quality due to harmonics.” Coordinator: TenneT GmbH, 24 partners Duration 4 years (January 2016 – January 2019)
MIGRATE WP3: Control and operation of a large transmission system with 100% converter-based devices
Objectives: • To propose and develop novel control and management rules for a transmission grid
to which 100 % converter-based devices are connected while keeping the costs under control;
• To check the viability of such new control and management rules within transmission
grids to which some synchronous machines are connected; • To infer a set of requirement guidelines for converter-based generating units (grid
codes), as far as possible set at the connection point and technology-agnostic, which ease the implementation of the above control and management rules.
« STORAGE SUPPORTING
PV DEPLOYMENT »
VERONICA BERMUDEZ
EDF R&D / DPT. EFESE/ SOLAR
TECHNOLOGIES
REPOWERING EUROPE- 18 mai 2016
| 2
OUTLINE
Photovoltaic market
Photovoltaic market. Competivity?
| 3
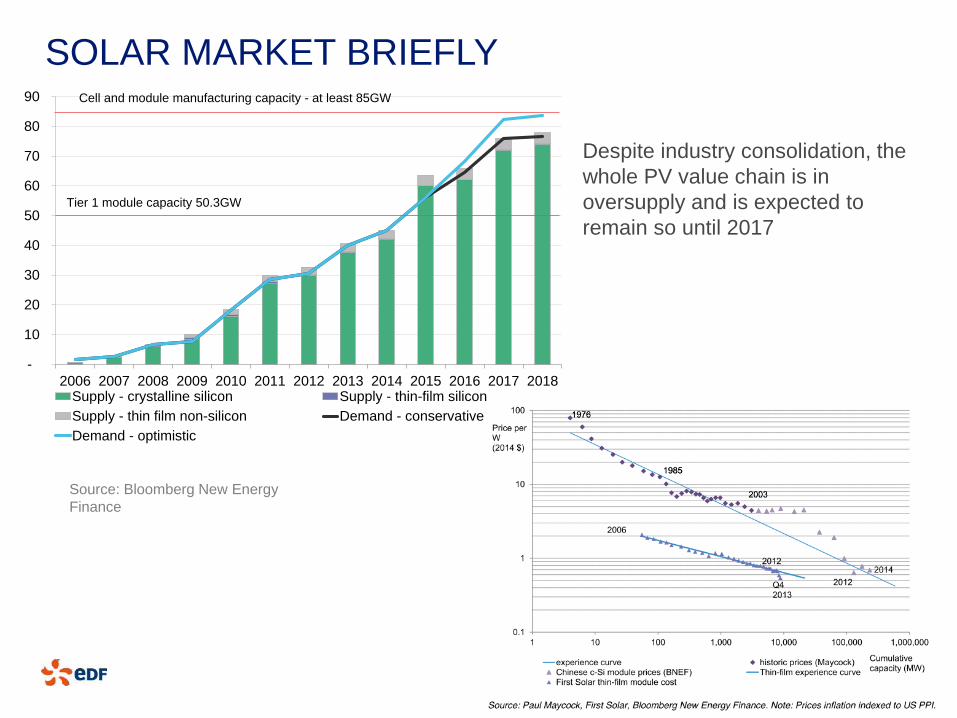
SOLAR MARKET BRIEFLY
-
10
20
30
40
50
60
70
80
90
2006 2007 2008 2009 2010 2011 2012 2013 2014 2015 2016 2017 2018Supply - crystalline silicon Supply - thin-film silicon
Supply - thin film non-silicon Demand - conservative
Demand - optimistic
Tier 1 module capacity 50.3GW
Cell and module manufacturing capacity - at least 85GW
Source: Bloomberg New Energy
Finance
Despite industry consolidation, the
whole PV value chain is in
oversupply and is expected to
remain so until 2017
| 4
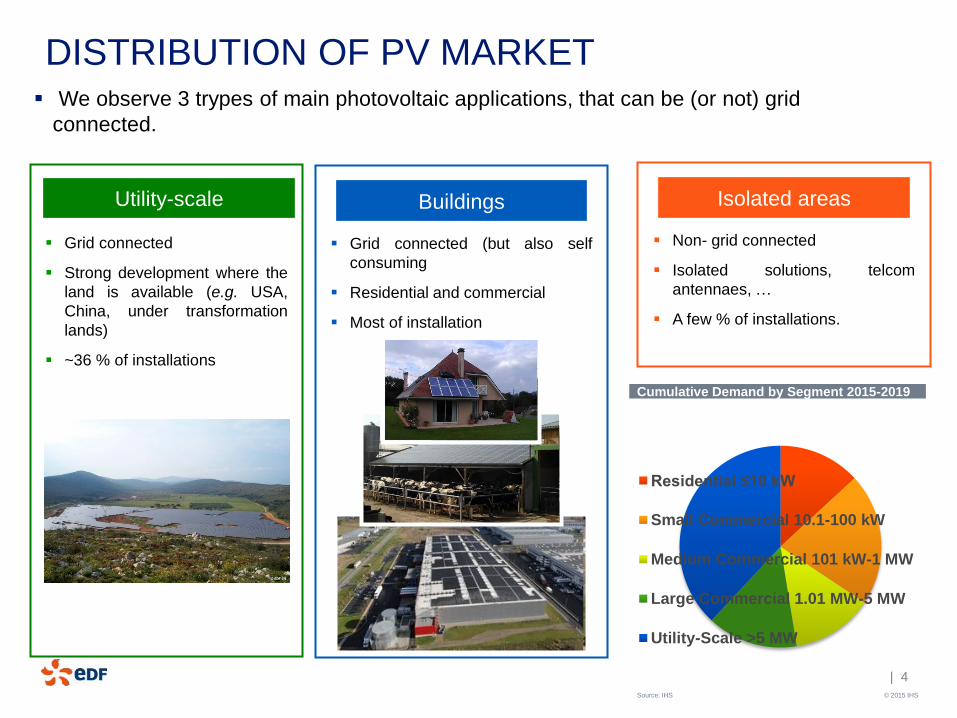
We observe 3 trypes of main photovoltaic applications, that can be (or not) grid
connected.
DISTRIBUTION OF PV MARKET
Grid connected (but also self
consuming
Residential and commercial
Most of installation
Buildings
Non- grid connected
Isolated solutions, telcom
antennaes, …
A few % of installations.
Isolated areas
Grid connected
Strong development where the
land is available (e.g. USA,
China, under transformation
lands)
~36 % of installations
Utility-scale
Residential ≤10 kW
Small Commercial 10.1-100 kW
Medium Commercial 101 kW-1 MW
Large Commercial 1.01 MW-5 MW
Utility-Scale >5 MW
Cumulative Demand by Segment 2015-2019
© 2015 IHS Source: IHS
| 5
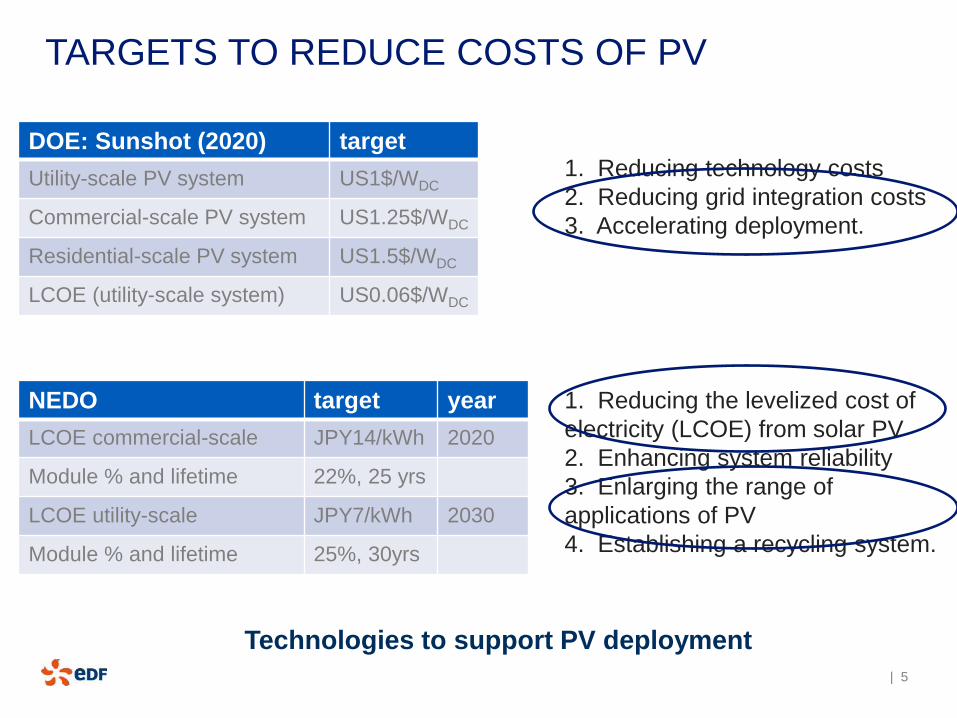
TARGETS TO REDUCE COSTS OF PV
1. Reducing technology costs
2. Reducing grid integration costs
3. Accelerating deployment.
1. Reducing the levelized cost of
electricity (LCOE) from solar PV
2. Enhancing system reliability
3. Enlarging the range of
applications of PV
4. Establishing a recycling system.
DOE: Sunshot (2020) target
Utility-scale PV system US1$/WDC
Commercial-scale PV system US1.25$/WDC
Residential-scale PV system US1.5$/WDC
LCOE (utility-scale system) US0.06$/WDC
NEDO target year
LCOE commercial-scale JPY14/kWh 2020
Module % and lifetime 22%, 25 yrs
LCOE utility-scale JPY7/kWh 2030
Module % and lifetime 25%, 30yrs
Technologies to support PV deployment
| 6
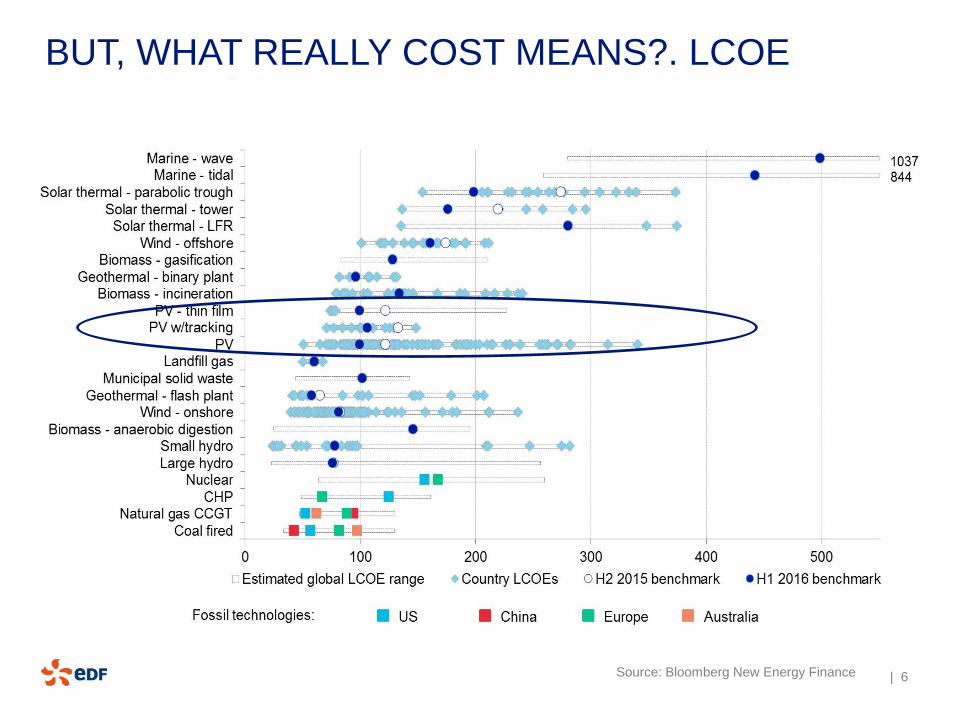
BUT, WHAT REALLY COST MEANS?. LCOE
Source: Bloomberg New Energy Finance
| 7
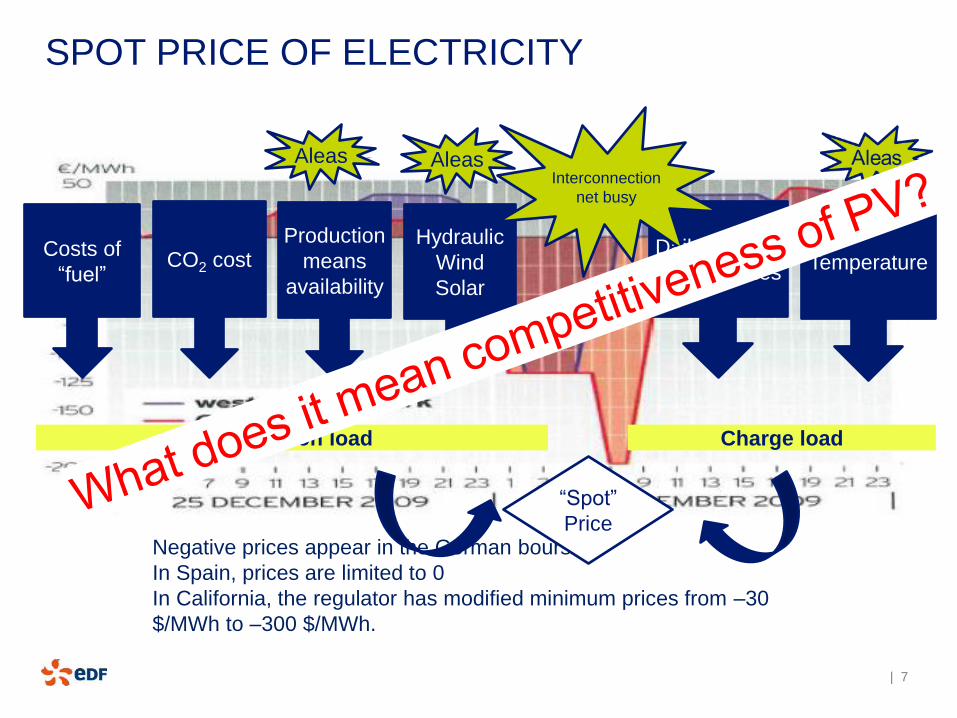
Negative prices appear in the German bourse
In Spain, prices are limited to 0
In California, the regulator has modified minimum prices from –30
$/MWh to –300 $/MWh.
SPOT PRICE OF ELECTRICITY
Costs of
“fuel” CO2 cost
Production
means
availability
Hydraulic
Wind
Solar
Temperature Daily, weekly,
saison cycles
Aleas Aleas Interconnection
net busy
Charge load Production load
“Spot”
Price
| 8
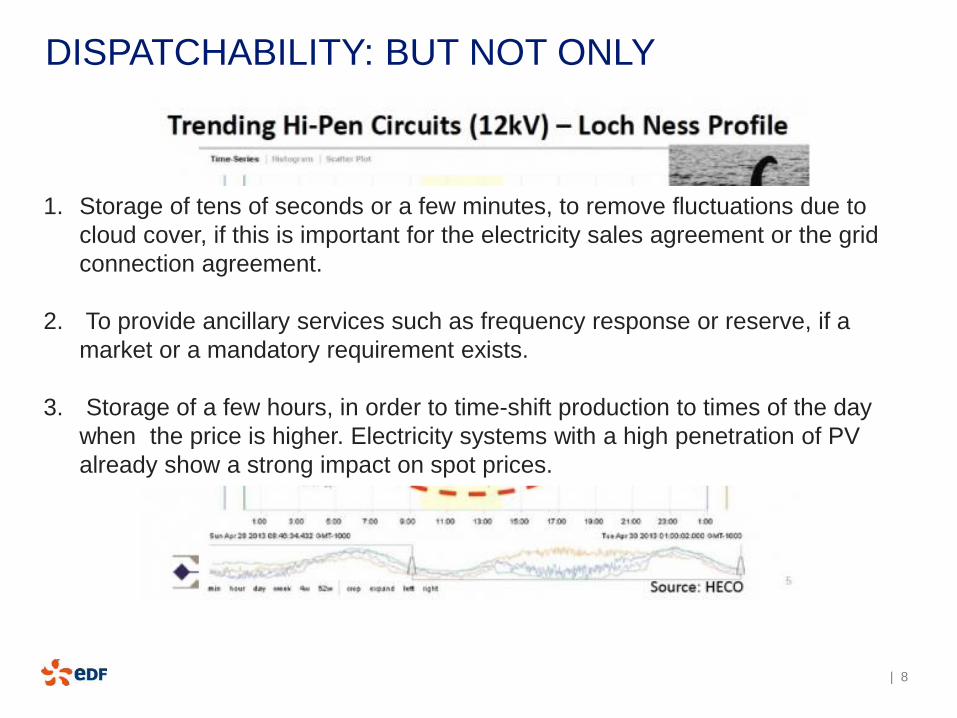
DISPATCHABILITY: BUT NOT ONLY
1. Storage of tens of seconds or a few minutes, to remove fluctuations due to
cloud cover, if this is important for the electricity sales agreement or the grid
connection agreement.
2. To provide ancillary services such as frequency response or reserve, if a
market or a mandatory requirement exists.
3. Storage of a few hours, in order to time-shift production to times of the day
when the price is higher. Electricity systems with a high penetration of PV
already show a strong impact on spot prices.
| 9
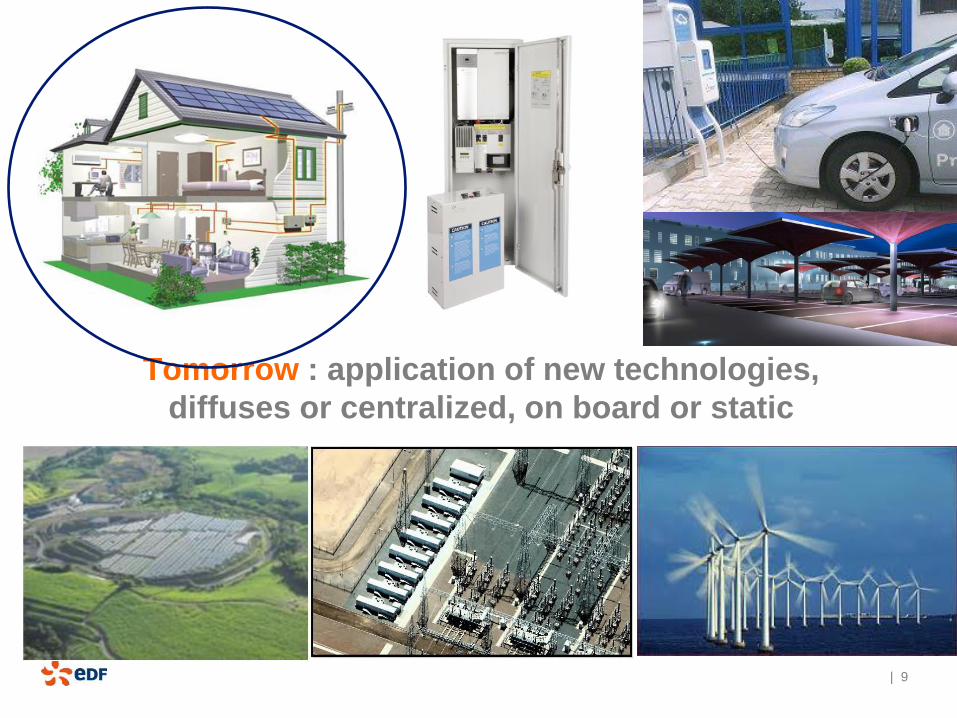
Tomorrow : application of new technologies,
diffuses or centralized, on board or static
| 10
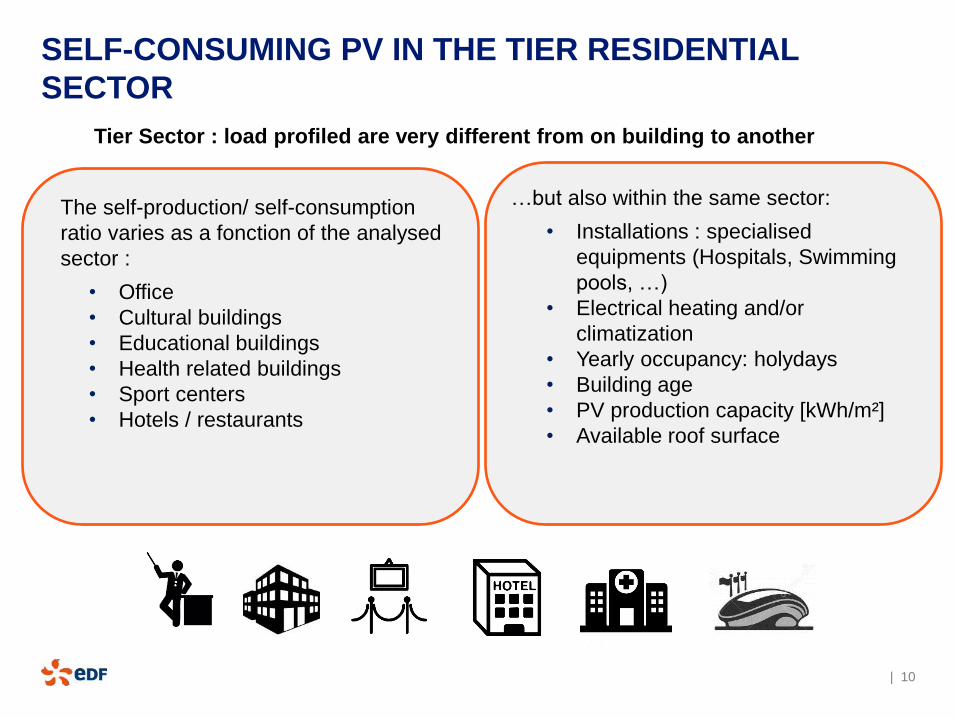
…but also within the same sector:
• Installations : specialised
equipments (Hospitals, Swimming
pools, …)
• Electrical heating and/or
climatization
• Yearly occupancy: holydays
• Building age
• PV production capacity [kWh/m²]
• Available roof surface
The self-production/ self-consumption
ratio varies as a fonction of the analysed
sector :
• Office
• Cultural buildings
• Educational buildings
• Health related buildings
• Sport centers
• Hotels / restaurants
Tier Sector : load profiled are very different from on building to another
SELF-CONSUMING PV IN THE TIER RESIDENTIAL
SECTOR
| 11
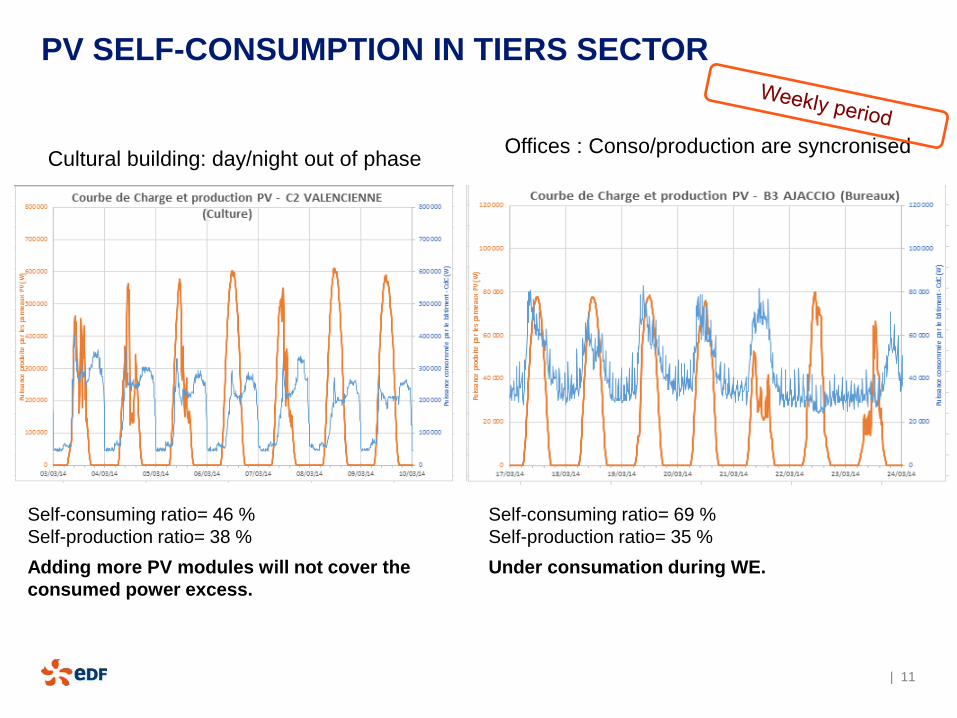
Cultural building: day/night out of phase Offices : Conso/production are syncronised
Self-consuming ratio= 46 %
Self-production ratio= 38 %
Adding more PV modules will not cover the
consumed power excess.
Self-consuming ratio= 69 %
Self-production ratio= 35 %
Under consumation during WE.
PV SELF-CONSUMPTION IN TIERS SECTOR
| 12
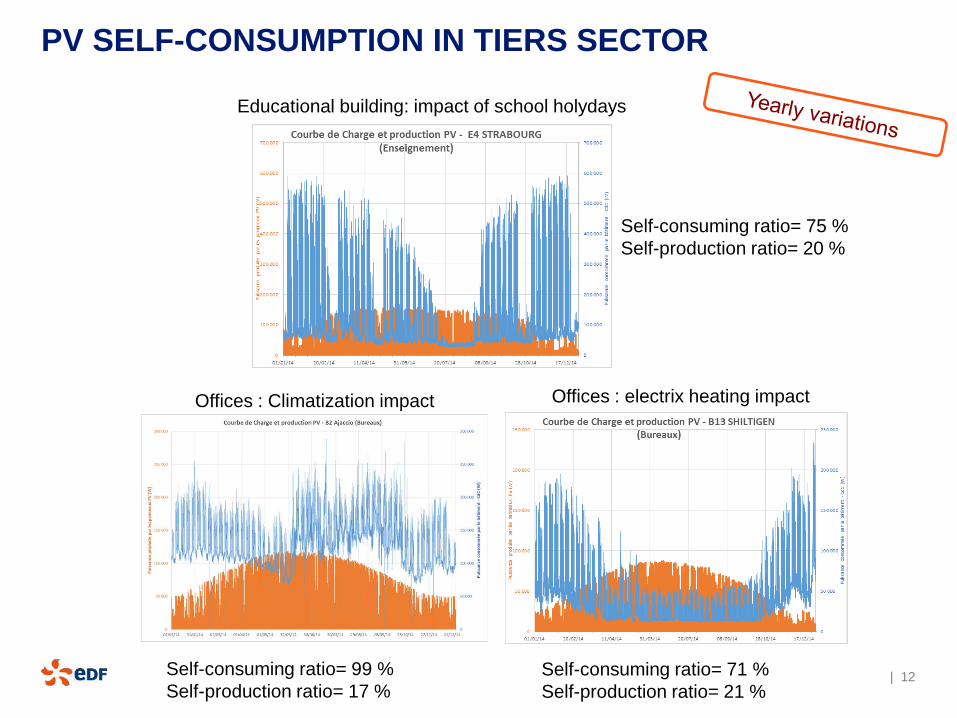
Educational building: impact of school holydays
Offices : Climatization impact Offices : electrix heating impact
Self-consuming ratio= 75 %
Self-production ratio= 20 %
Self-consuming ratio= 99 %
Self-production ratio= 17 %
Self-consuming ratio= 71 %
Self-production ratio= 21 %
PV SELF-CONSUMPTION IN TIERS SECTOR
| 13
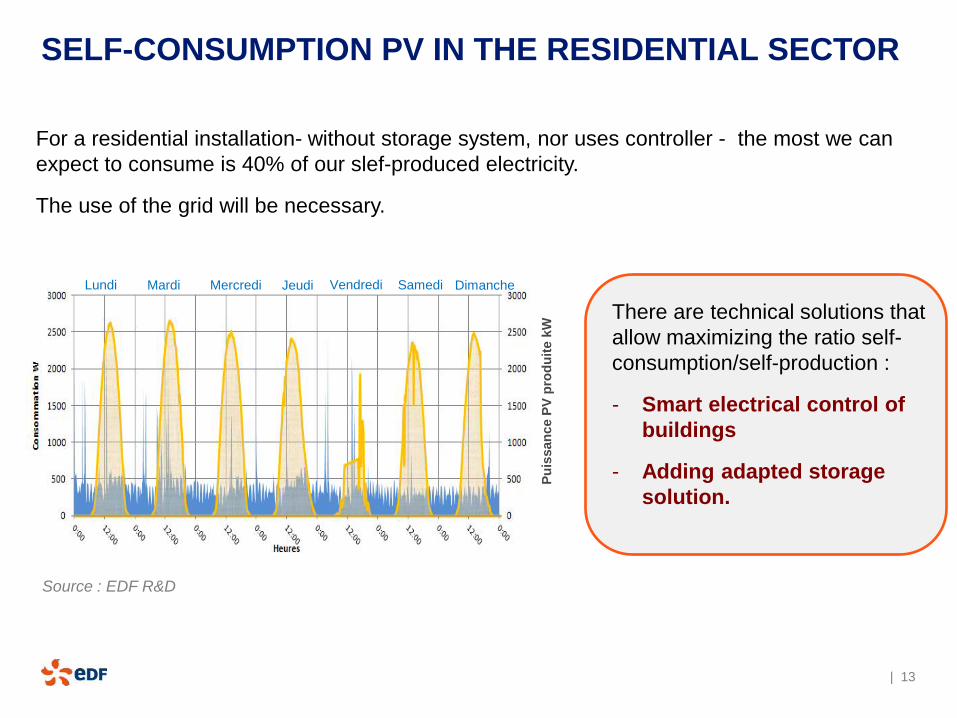
Source : EDF R&D
For a residential installation- without storage system, nor uses controller - the most we can
expect to consume is 40% of our slef-produced electricity.
The use of the grid will be necessary.
Pu
issan
ce P
V p
rod
uit
e k
W
Lundi Mardi Mercredi Jeudi Vendredi Samedi Dimanche
There are technical solutions that
allow maximizing the ratio self-
consumption/self-production :
- Smart electrical control of
buildings
- Adding adapted storage
solution.
SELF-CONSUMPTION PV IN THE RESIDENTIAL SECTOR
| 14
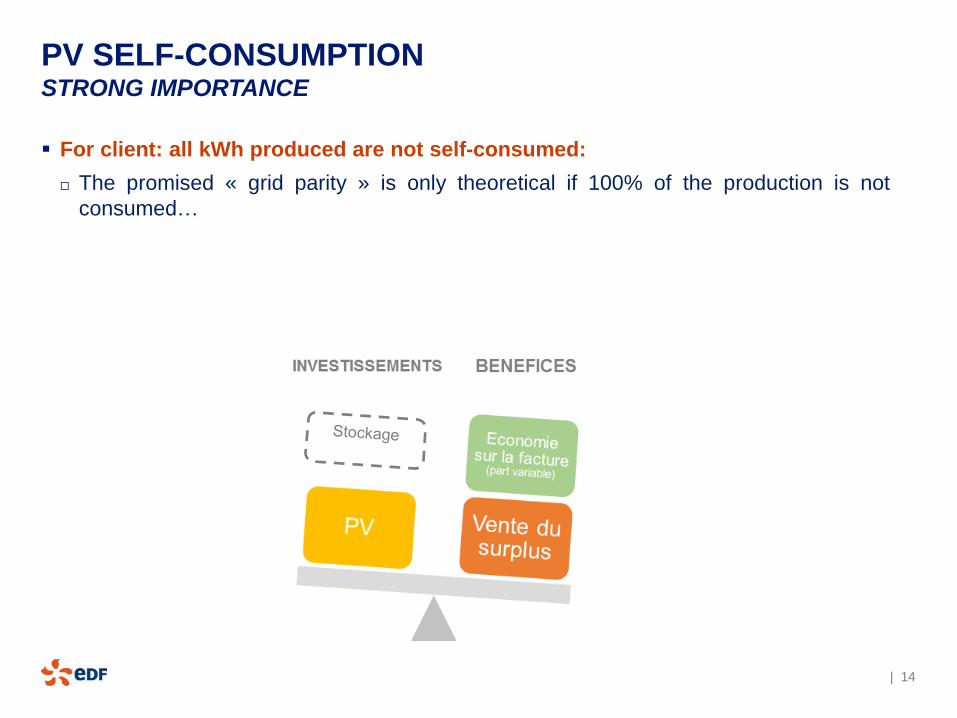
PV SELF-CONSUMPTION STRONG IMPORTANCE
For client: all kWh produced are not self-consumed:
The promised « grid parity » is only theoretical if 100% of the production is not
consumed…
| 15
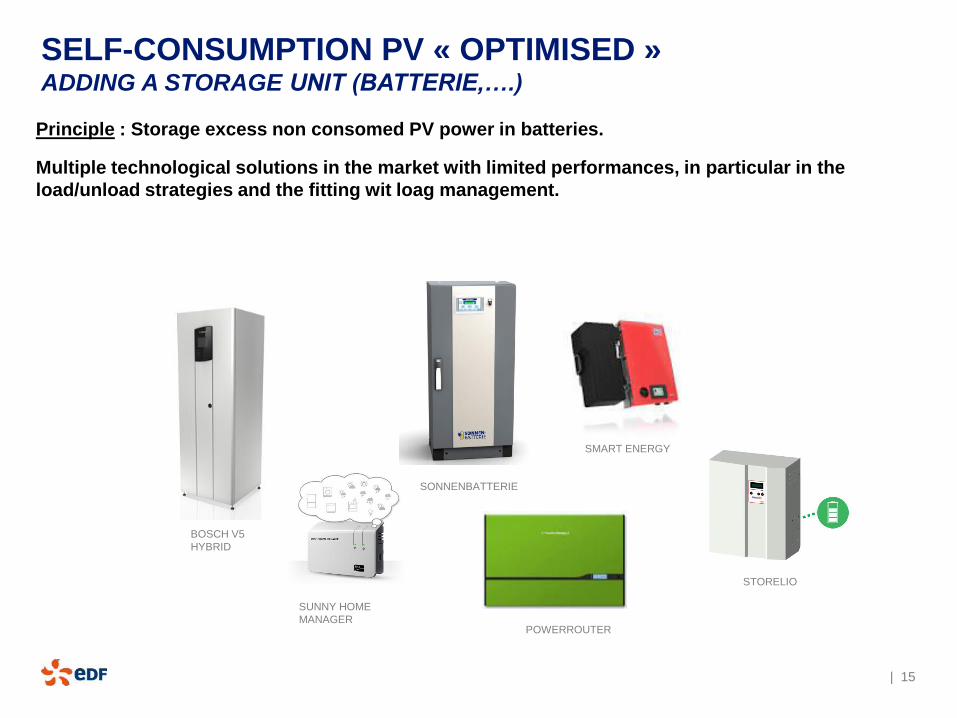
Principle : Storage excess non consomed PV power in batteries.
Multiple technological solutions in the market with limited performances, in particular in the
load/unload strategies and the fitting wit loag management.
SONNENBATTERIE
SUNNY HOME
MANAGER
STORELIO
POWERROUTER
BOSCH V5
HYBRID
SMART ENERGY
SELF-CONSUMPTION PV « OPTIMISED » ADDING A STORAGE UNIT (BATTERIE,….)
| 16
CONCLUSIONS
The increasing contribution of PV to the global and regional power mix has caused
a number of fundamental challenges, which can largely be addressed by the
addition of energy storage.
PV electricity is produced only during the day; energy is often needed during the night.
The ability to store energy during the day for use at night is beneficial.
PV is an intermittent and unpredictable generation source. Storage allows fluctuations in
supply to be reduced.
Off-grid PV is not connected to the grid and therefore the only way to use electricity at
night is through storage.
The development of storage for PV is essential to increase the ability of PV
systems to replace existing energy sources.
Although introducing storage to grid-connected applications is a new development in the
PV market, storage has been used in off-grid PV systems for some time.
New products targeted at the PV industry, technology advances, and the availability of
less expensive storage solutions, will lead to the increased use of energy storage in the
PV industry.
More storage solutions are becoming commercially available. They range from
intelligent management systems which are coupled with a battery to large-scale turn-
key solutions aimed at grid-scale applications.

| 17
Thank you
Impact of storage on PV attractiveness
Mariska de Wild-Scholten
Repowering Europe, 'Photovoltaics: centre-stage in the power system', 18 May 2016, Brussels
Outline
How does storage affect the environmental balance of PV?
Life Cycle Assessment
Greenhouse gas emissions
Toxicity
Depletion
2
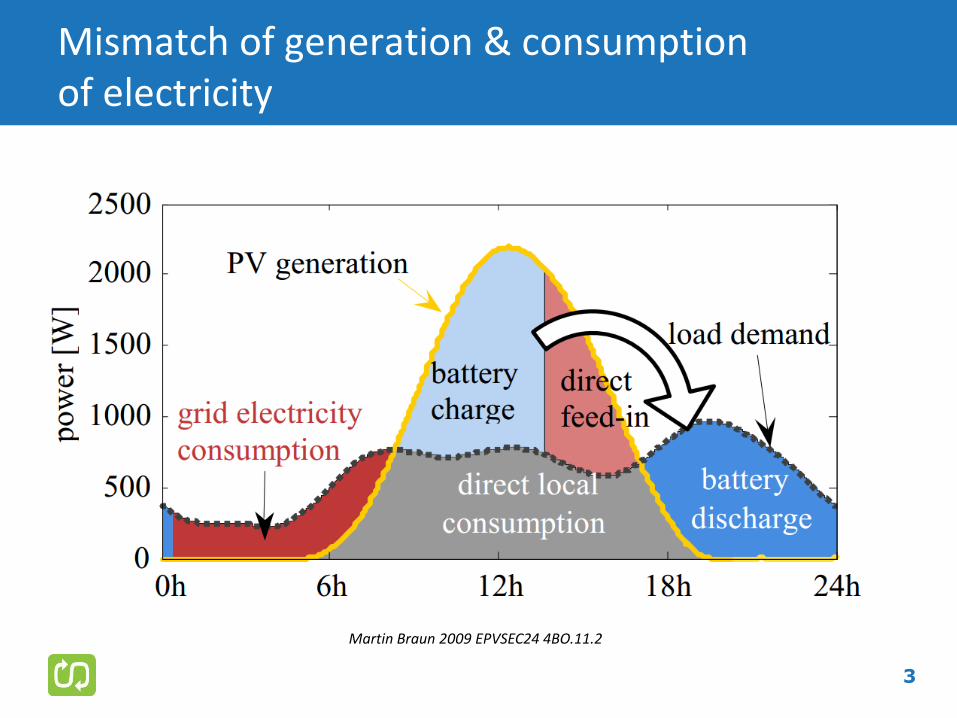
Mismatch of generation & consumption of electricity
3
Martin Braun 2009 EPVSEC24 4BO.11.2
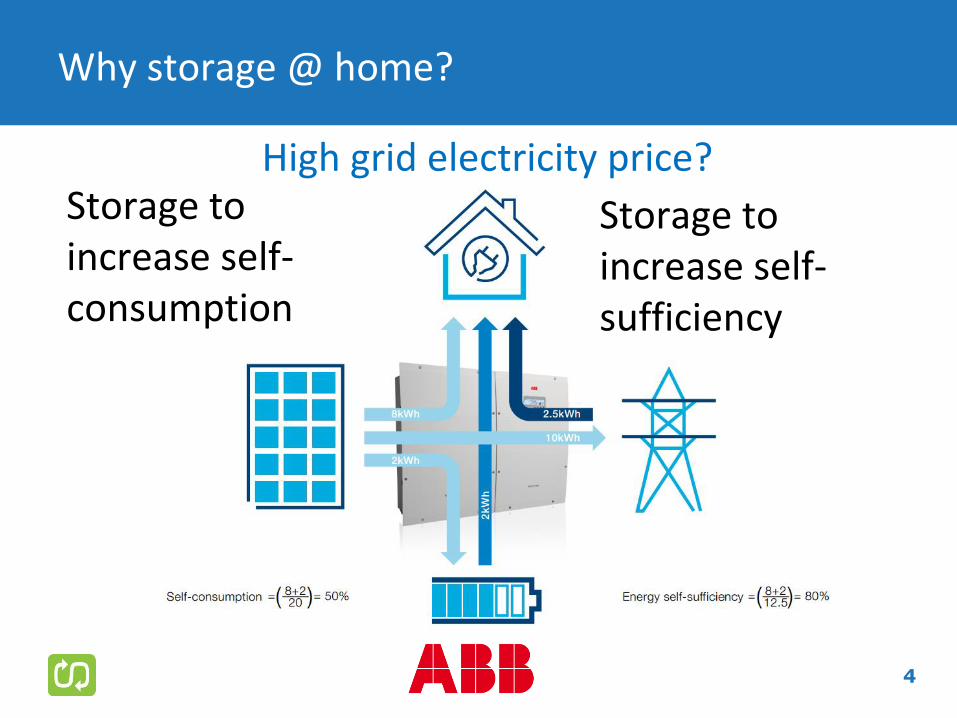
Why storage @ home?
4
Storage to increase self-sufficiency
Storage to increase self-consumption
High grid electricity price?
Storage System
5
Module with battery cells ............... this presentation
Energy management system
Inverter
Etcetera
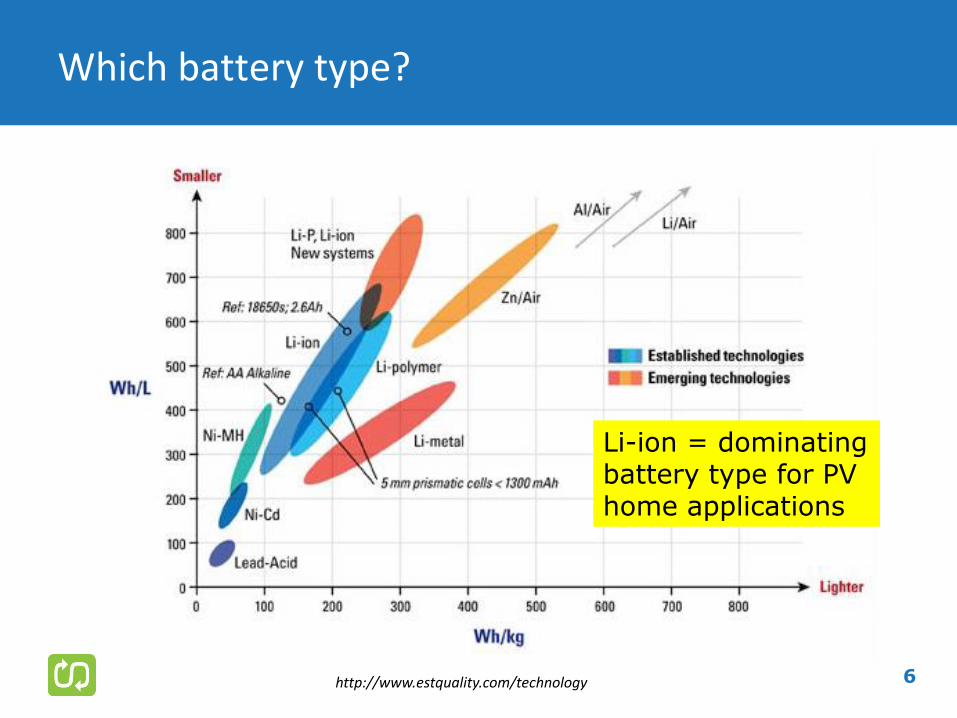
Which battery type?
6 http://www.estquality.com/technology
Li-ion = dominating battery type for PV home applications
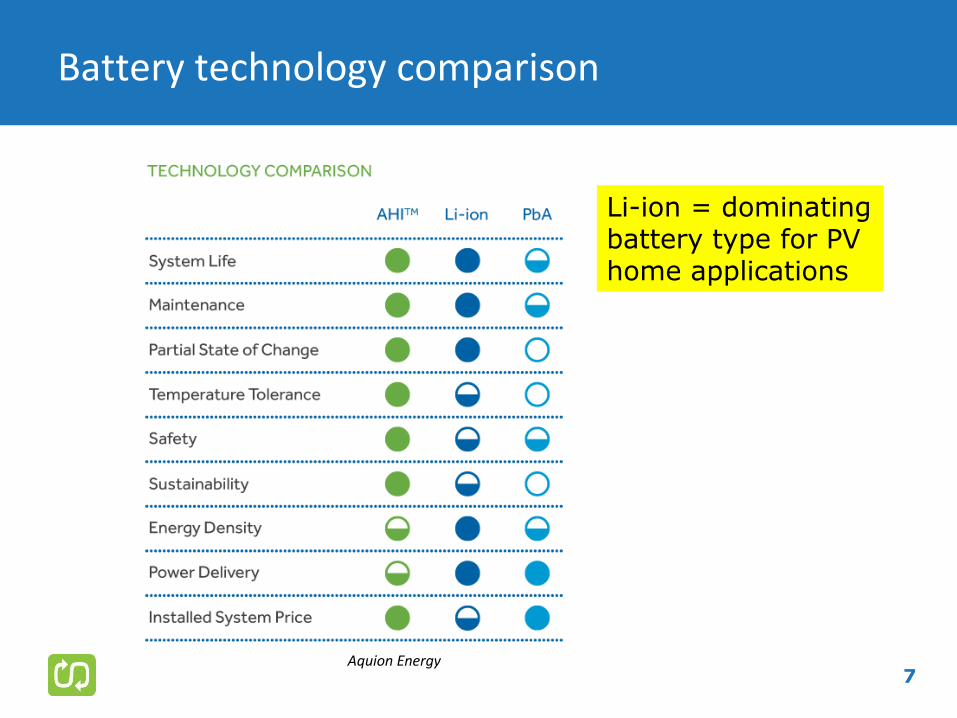
Battery technology comparison
7 Aquion Energy
Li-ion = dominating battery type for PV home applications
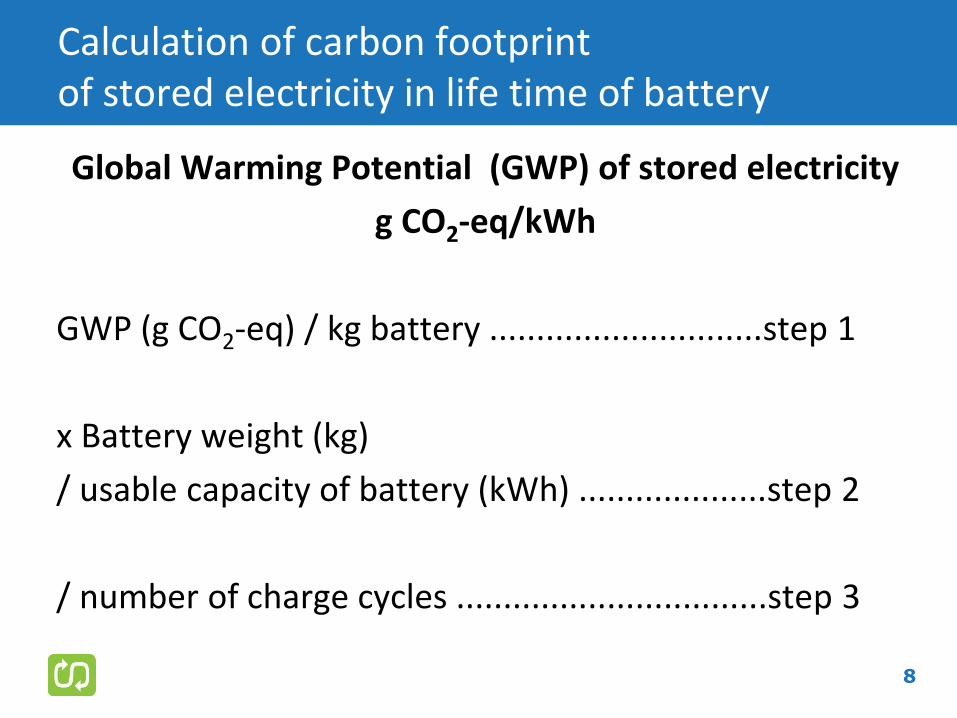
Calculation of carbon footprint of stored electricity in life time of battery
Global Warming Potential (GWP) of stored electricity
g CO2-eq/kWh
GWP (g CO2-eq) / kg battery .............................step 1
x Battery weight (kg)
/ usable capacity of battery (kWh) ....................step 2
/ number of charge cycles .................................step 3
8
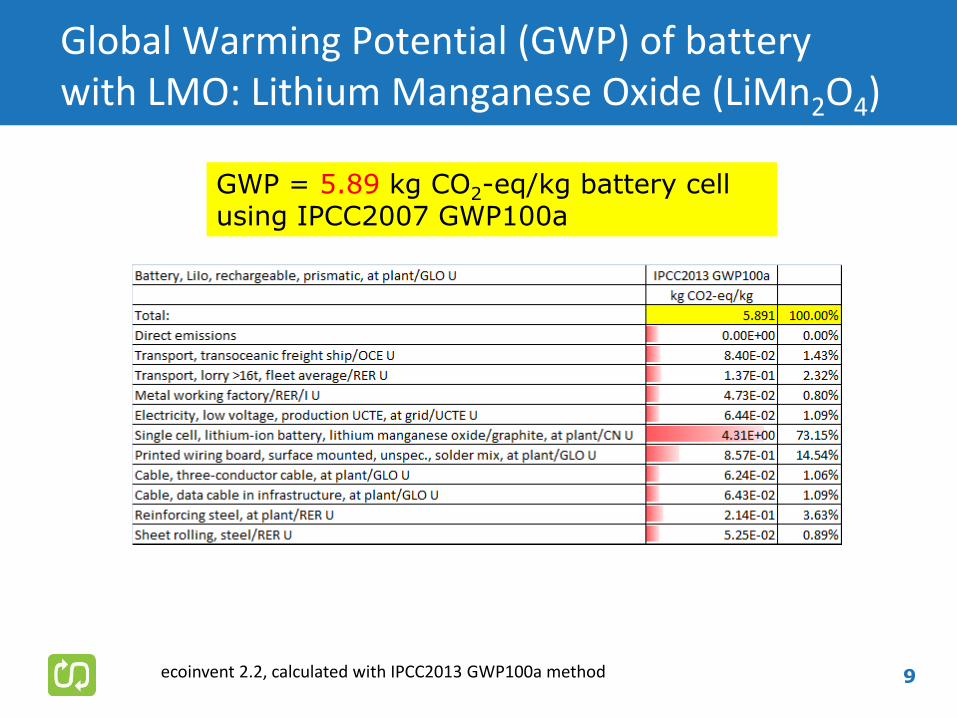
Global Warming Potential (GWP) of battery with LMO: Lithium Manganese Oxide (LiMn2O4)
9 ecoinvent 2.2, calculated with IPCC2013 GWP100a method
GWP = 5.89 kg CO2-eq/kg battery cell using IPCC2007 GWP100a
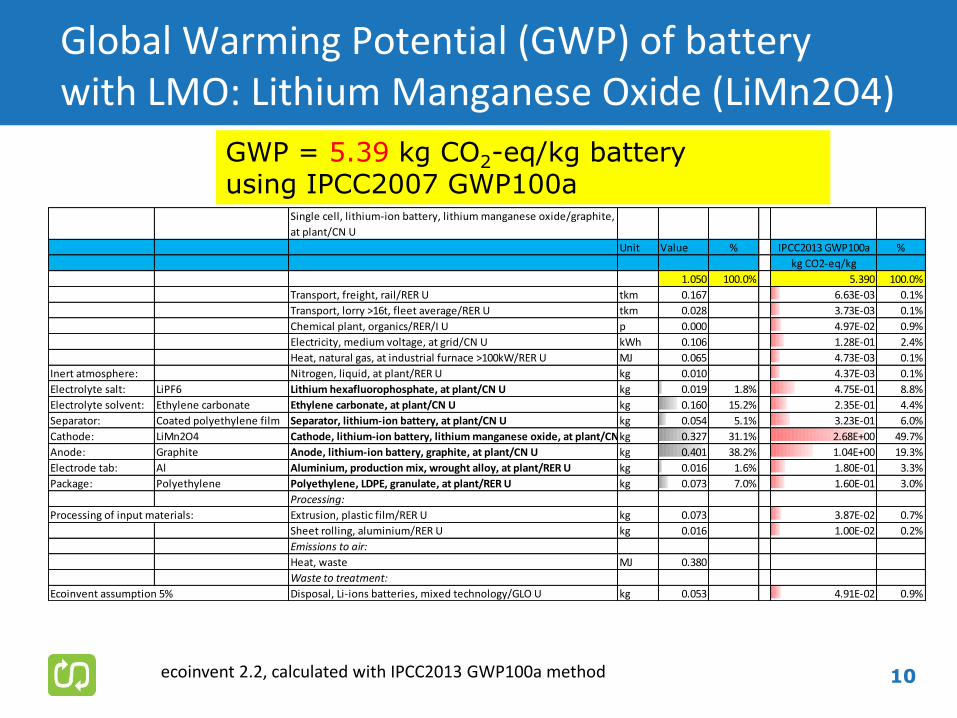
Global Warming Potential (GWP) of battery with LMO: Lithium Manganese Oxide (LiMn2O4)
10 ecoinvent 2.2, calculated with IPCC2013 GWP100a method
GWP = 5.39 kg CO2-eq/kg battery using IPCC2007 GWP100a
Single cell, lithium-ion battery, lithium manganese oxide/graphite,
at plant/CN U
Unit Value % IPCC2013 GWP100a %
kg CO2-eq/kg
1.050 100.0% 5.390 100.0%
Transport, freight, rail/RER U tkm 0.167 6.63E-03 0.1%
Transport, lorry >16t, fleet average/RER U tkm 0.028 3.73E-03 0.1%
Chemical plant, organics/RER/I U p 0.000 4.97E-02 0.9%
Electricity, medium voltage, at grid/CN U kWh 0.106 1.28E-01 2.4%
Heat, natural gas, at industrial furnace >100kW/RER U MJ 0.065 4.73E-03 0.1%
Inert atmosphere: Nitrogen, liquid, at plant/RER U kg 0.010 4.37E-03 0.1%
Electrolyte salt: LiPF6 Lithium hexafluorophosphate, at plant/CN U kg 0.019 1.8% 4.75E-01 8.8%
Electrolyte solvent: Ethylene carbonate Ethylene carbonate, at plant/CN U kg 0.160 15.2% 2.35E-01 4.4%
Separator: Coated polyethylene film Separator, lithium-ion battery, at plant/CN U kg 0.054 5.1% 3.23E-01 6.0%
Cathode: LiMn2O4 Cathode, lithium-ion battery, lithium manganese oxide, at plant/CN Ukg 0.327 31.1% 2.68E+00 49.7%
Anode: Graphite Anode, lithium-ion battery, graphite, at plant/CN U kg 0.401 38.2% 1.04E+00 19.3%
Electrode tab: Al Aluminium, production mix, wrought alloy, at plant/RER U kg 0.016 1.6% 1.80E-01 3.3%
Package: Polyethylene Polyethylene, LDPE, granulate, at plant/RER U kg 0.073 7.0% 1.60E-01 3.0%
Processing:
Processing of input materials: Extrusion, plastic film/RER U kg 0.073 3.87E-02 0.7%
Sheet rolling, aluminium/RER U kg 0.016 1.00E-02 0.2%
Emissions to air:
Heat, waste MJ 0.380
Waste to treatment:
Ecoinvent assumption 5% Disposal, Li-ions batteries, mixed technology/GLO U kg 0.053 4.91E-02 0.9%
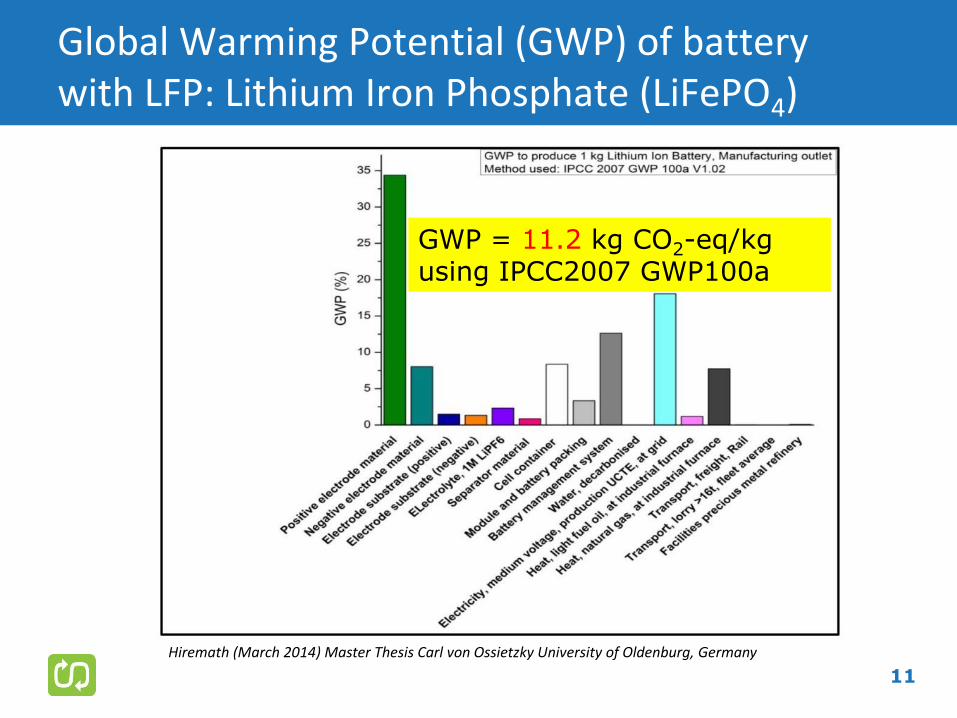
Global Warming Potential (GWP) of battery with LFP: Lithium Iron Phosphate (LiFePO4)
11
Hiremath (March 2014) Master Thesis Carl von Ossietzky University of Oldenburg, Germany
GWP = 11.2 kg CO2-eq/kg using IPCC2007 GWP100a
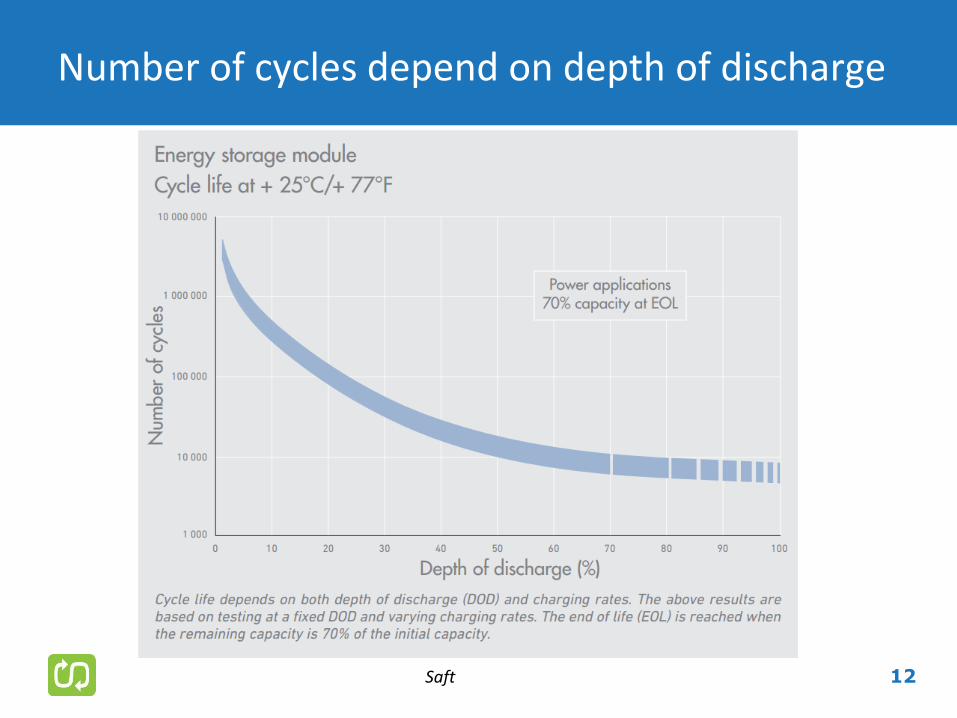
Number of cycles depend on depth of discharge
12 Saft
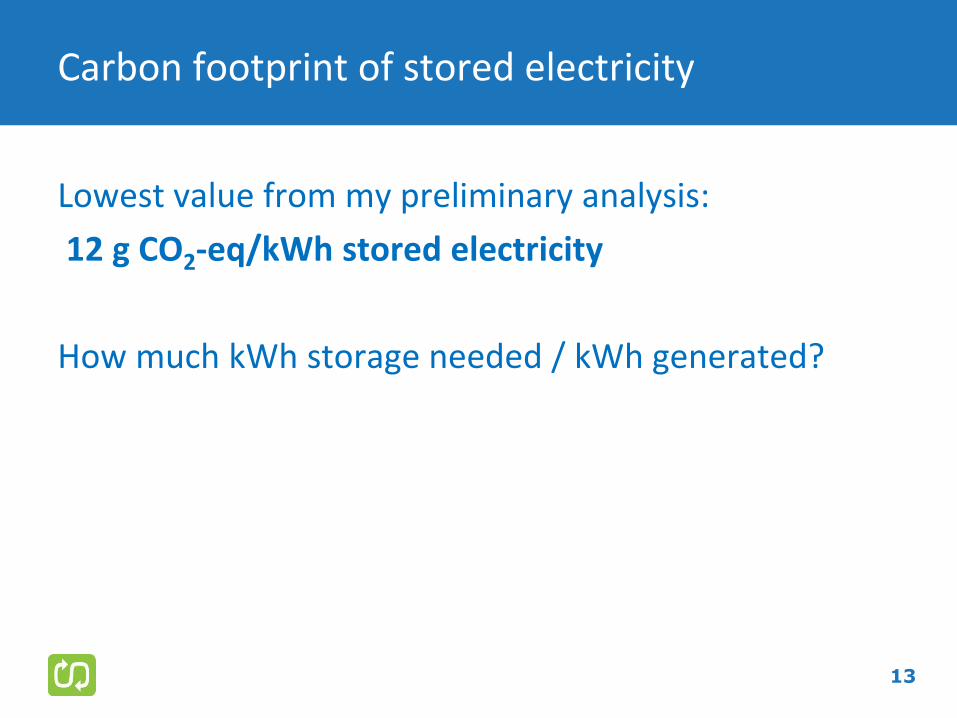
Carbon footprint of stored electricity
Lowest value from my preliminary analysis:
12 g CO2-eq/kWh stored electricity
How much kWh storage needed / kWh generated?
13
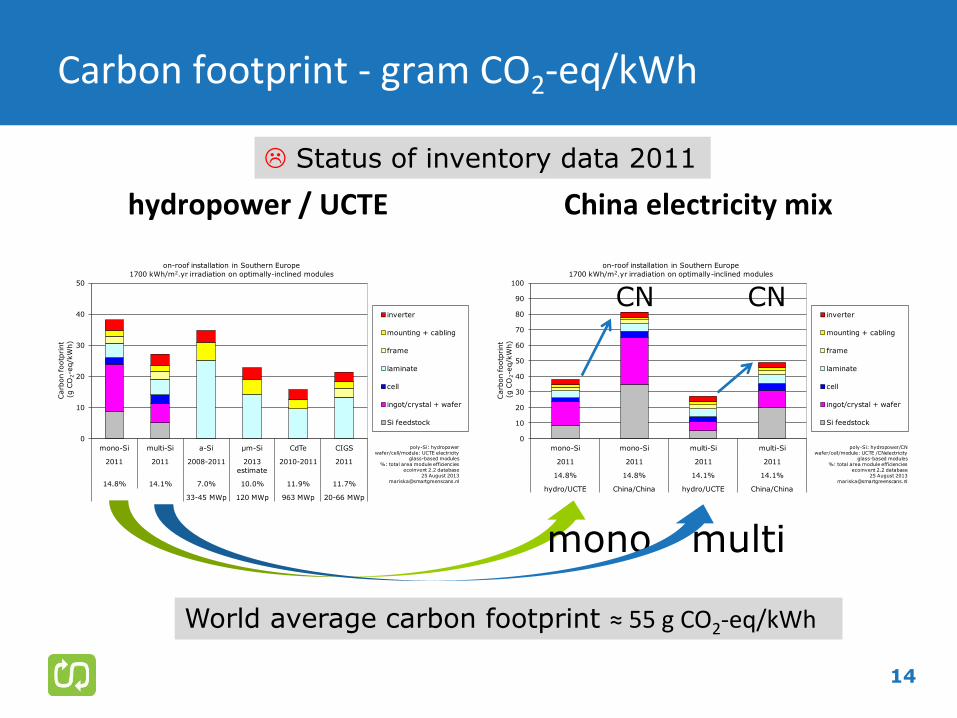
Carbon footprint - gram CO2-eq/kWh
hydropower / UCTE
0
10
20
30
40
50
mono-Si multi-Si a-Si μm-Si CdTe CIGS
2011 2011 2008-2011 2013
estimate
2010-2011 2011
14.8% 14.1% 7.0% 10.0% 11.9% 11.7%
33-45 MWp 120 MWp 963 MWp 20-66 MWp
Carb
on footp
rint
(g C
O2-e
q/k
Wh)
poly-Si: hydropowerwafer/cell/module: UCTE electricity
glass-based modules%: total area module efficiencies
ecoinvent 2.2 database 25 August 2013
on-roof installation in Southern Europe
1700 kWh/m2.yr irradiation on optimally-inclined modules
inverter
mounting + cabling
frame
laminate
cell
ingot/crystal + wafer
Si feedstock
China electricity mix
14
0
10
20
30
40
50
60
70
80
90
100
mono-Si mono-Si multi-Si multi-Si
2011 2011 2011 2011
14.8% 14.8% 14.1% 14.1%
hydro/UCTE China/China hydro/UCTE China/China
Carb
on footp
rint
(g C
O2-e
q/k
Wh)
poly-Si: hydropower/CNwafer/cell/module: UCTE /CNelectricity
glass-based modules%: total area module efficiencies
ecoinvent 2.2 database 25 August 2013
on-roof installation in Southern Europe
1700 kWh/m2.yr irradiation on optimally-inclined modules
inverter
mounting + cabling
frame
laminate
cell
ingot/crystal + wafer
Si feedstock
CN CN
mono multi
Status of inventory data 2011
World average carbon footprint ≈ 55 g CO2-eq/kWh
Many uncertainties
GWP value based on 2010 or older inventory data of the battery
Reliable manufacturer data missing
Number of charging cycles depend on depth of discharge
Only battery calculated, not a complete storage system
How much storage is needed / kWh electricity generated from PV?
15
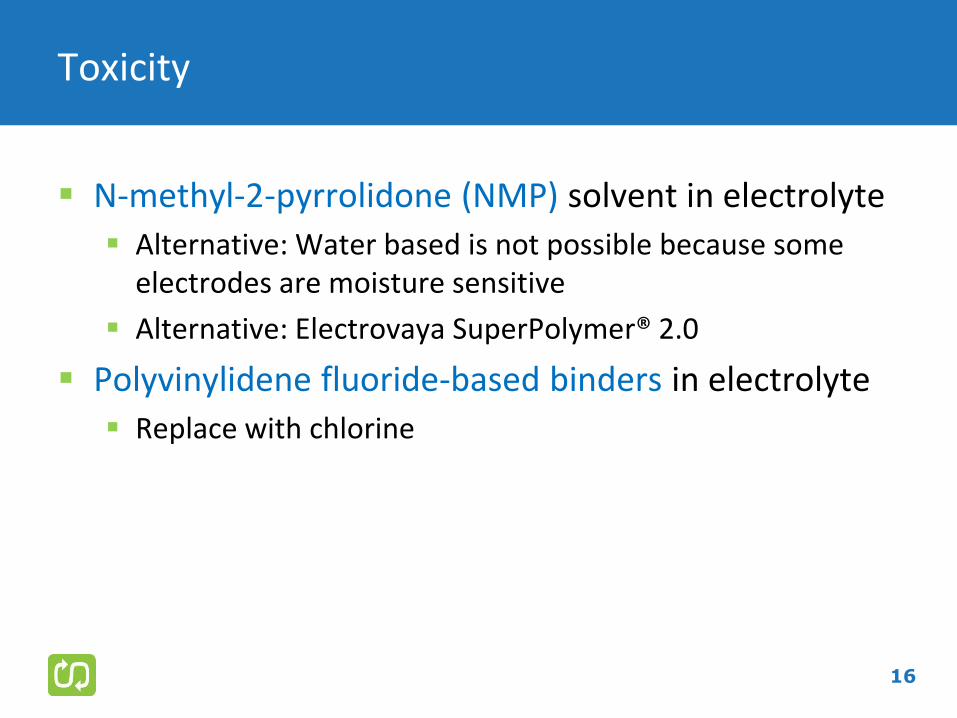
Toxicity
N-methyl-2-pyrrolidone (NMP) solvent in electrolyte
Alternative: Water based is not possible because some electrodes are moisture sensitive
Alternative: Electrovaya SuperPolymer® 2.0
Polyvinylidene fluoride-based binders in electrolyte
Replace with chlorine
16
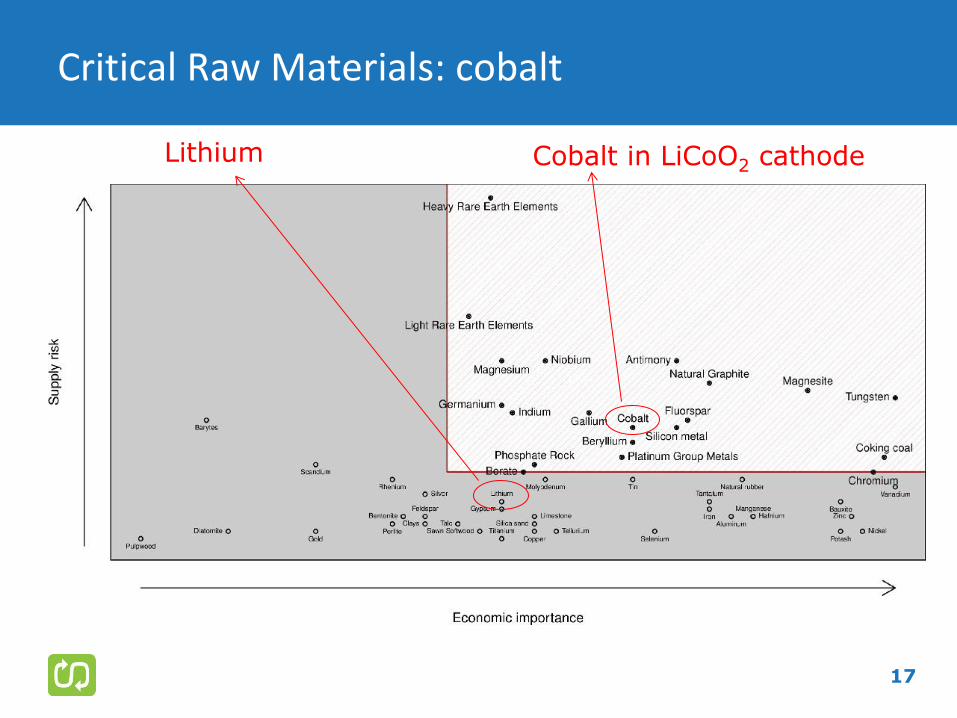
Critical Raw Materials: cobalt
17
Cobalt in LiCoO2 cathode Lithium
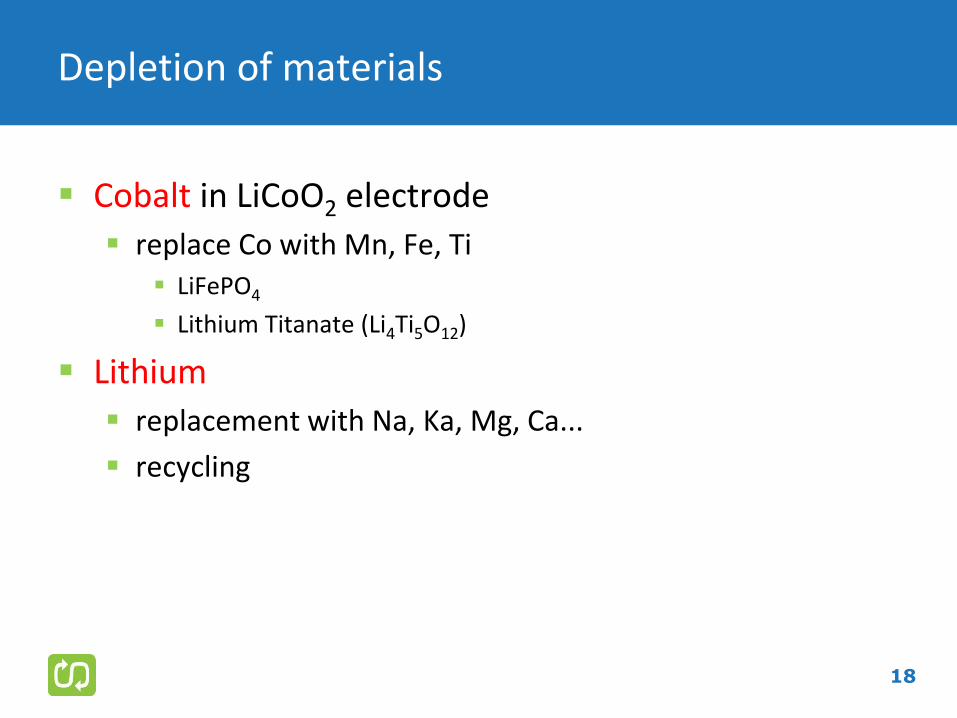
Depletion of materials
Cobalt in LiCoO2 electrode
replace Co with Mn, Fe, Ti LiFePO4
Lithium Titanate (Li4Ti5O12)
Lithium
replacement with Na, Ka, Mg, Ca...
recycling
18
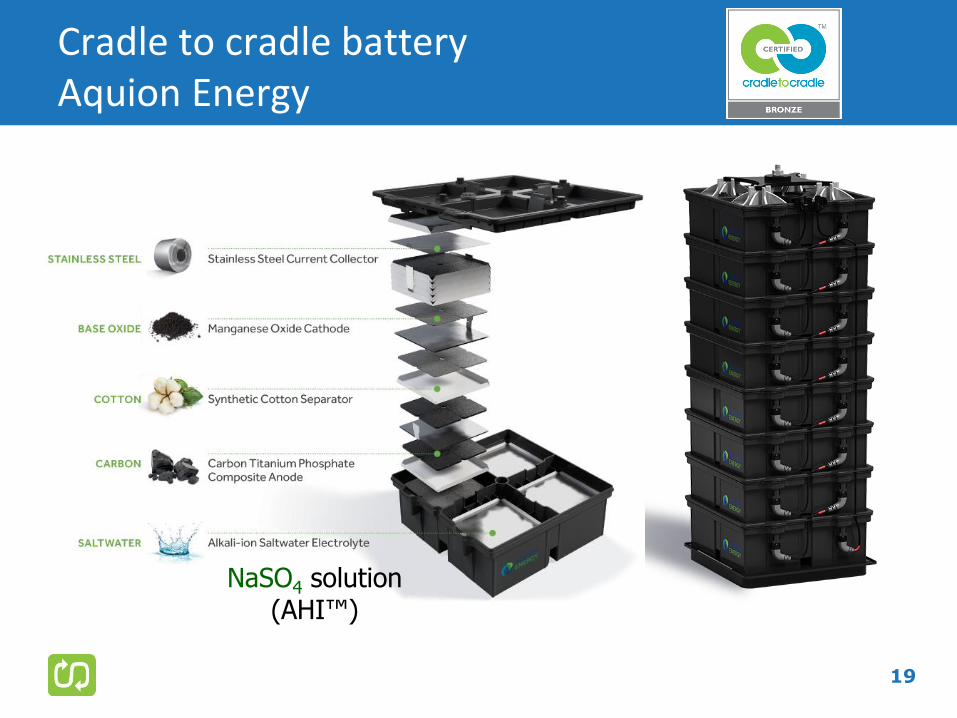
Cradle to cradle battery Aquion Energy
19
NaSO4 solution (AHI™)
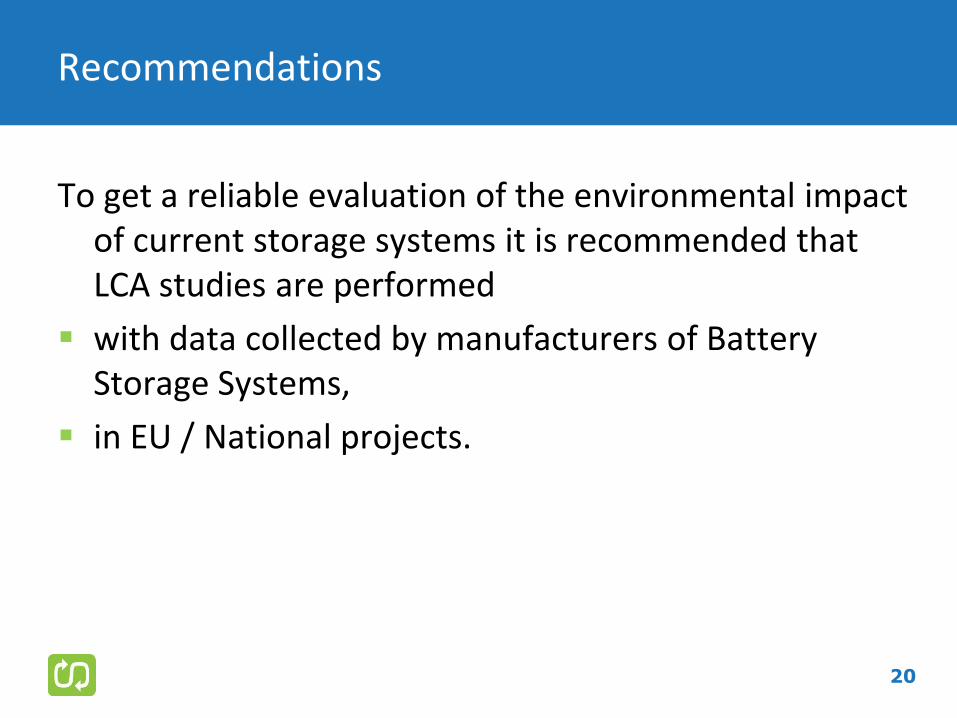
Recommendations
To get a reliable evaluation of the environmental impact of current storage systems it is recommended that LCA studies are performed
with data collected by manufacturers of Battery Storage Systems,
in EU / National projects.
20

References / Funding
References: D. Larcher, J-M. Tarascon (2014) Towards greener and more sustainable
batteries for electrical energy storage, Nature Chemistry 7: 19-29
PV Magazine Storage Special July 2015 with Market Survey of Batteries
Funding: none
21
STORAGE MARKET DEVELOPMENT
AND PRICE ROADMAP
Repowering Europe May 2016 | Marion PERRIN
| 2
• Need for electricity storage: applications
• Market evolution
• Present prices
• Storage learning curve / Price roadmap
• European storage?
AGENDA
LITEN Days 2015 | Marion PERRIN
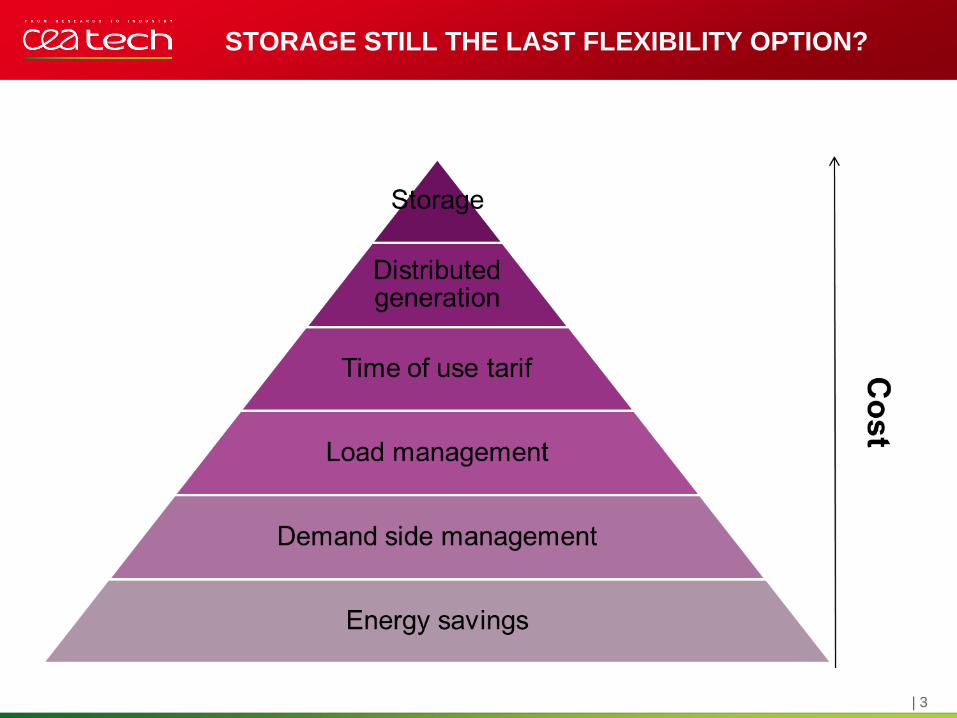
| 3
STORAGE STILL THE LAST FLEXIBILITY OPTION?
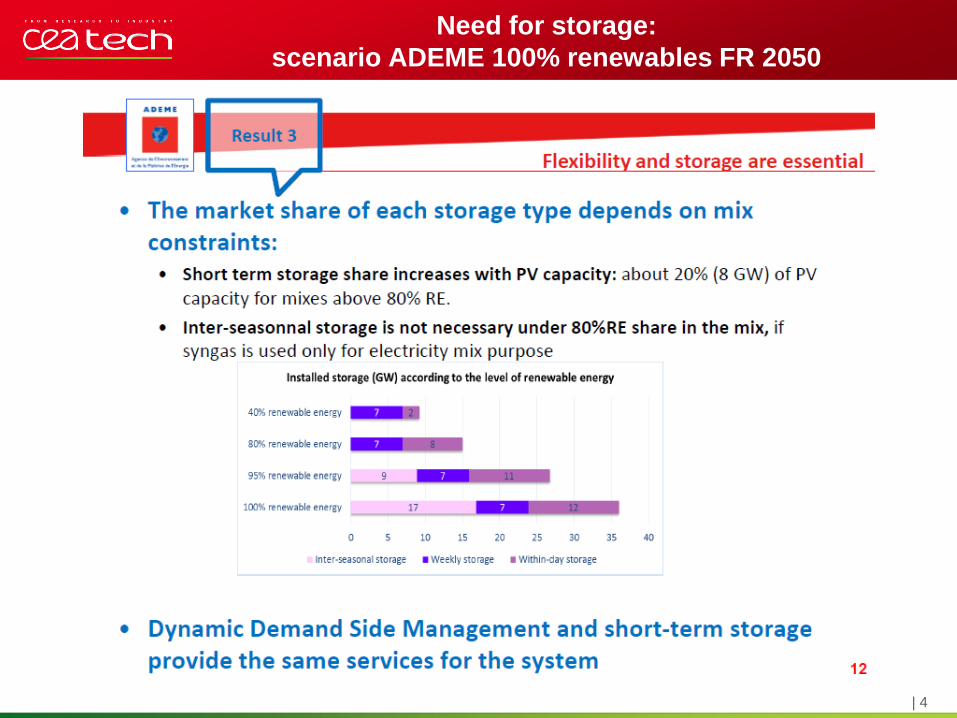
| 4
Need for storage:
scenario ADEME 100% renewables FR 2050
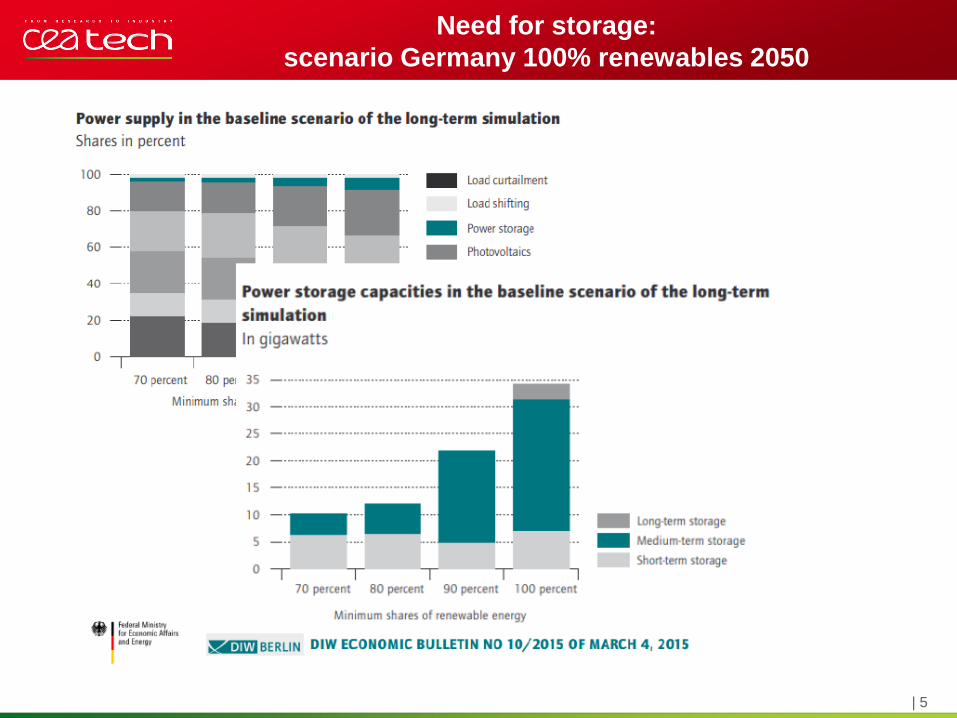
| 5
Need for storage:
scenario Germany 100% renewables 2050
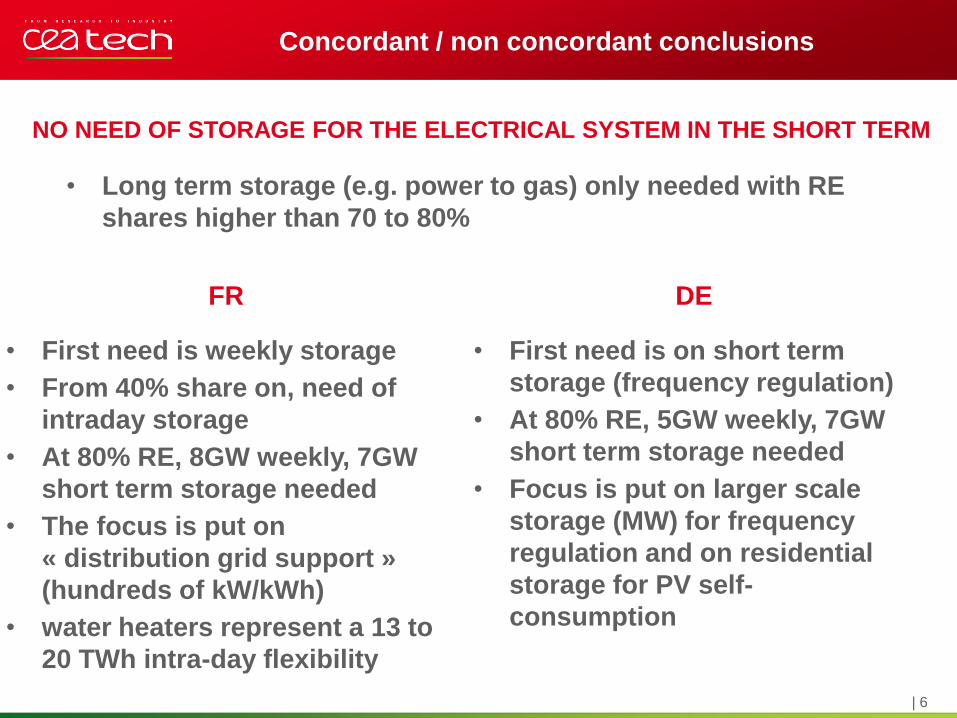
| 6
Concordant / non concordant conclusions
NO NEED OF STORAGE FOR THE ELECTRICAL SYSTEM IN THE SHORT TERM
• Long term storage (e.g. power to gas) only needed with RE
shares higher than 70 to 80%
FR
• First need is weekly storage
• From 40% share on, need of
intraday storage
• At 80% RE, 8GW weekly, 7GW
short term storage needed
• The focus is put on
« distribution grid support »
(hundreds of kW/kWh)
• water heaters represent a 13 to
20 TWh intra-day flexibility
DE
• First need is on short term
storage (frequency regulation)
• At 80% RE, 5GW weekly, 7GW
short term storage needed
• Focus is put on larger scale
storage (MW) for frequency
regulation and on residential
storage for PV self-
consumption
| 7
• Need for electricity storage: applications
• Market evolution
• Present prices
• Storage learning curve
• European storage?
AGENDA
LITEN Days 2015 | Marion PERRIN
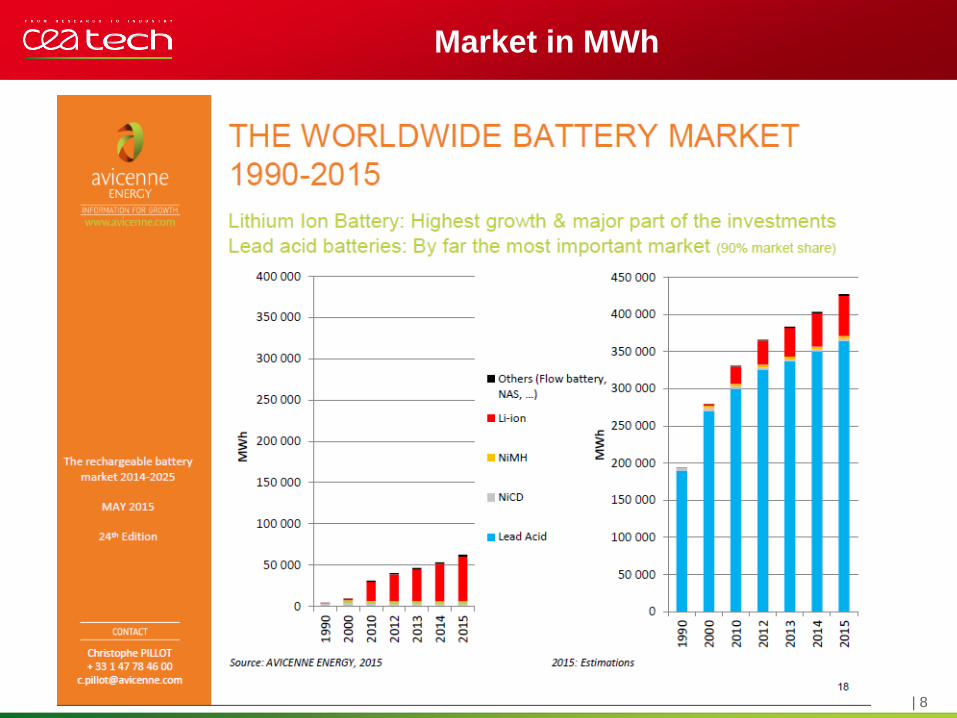
| 8
Market in MWh
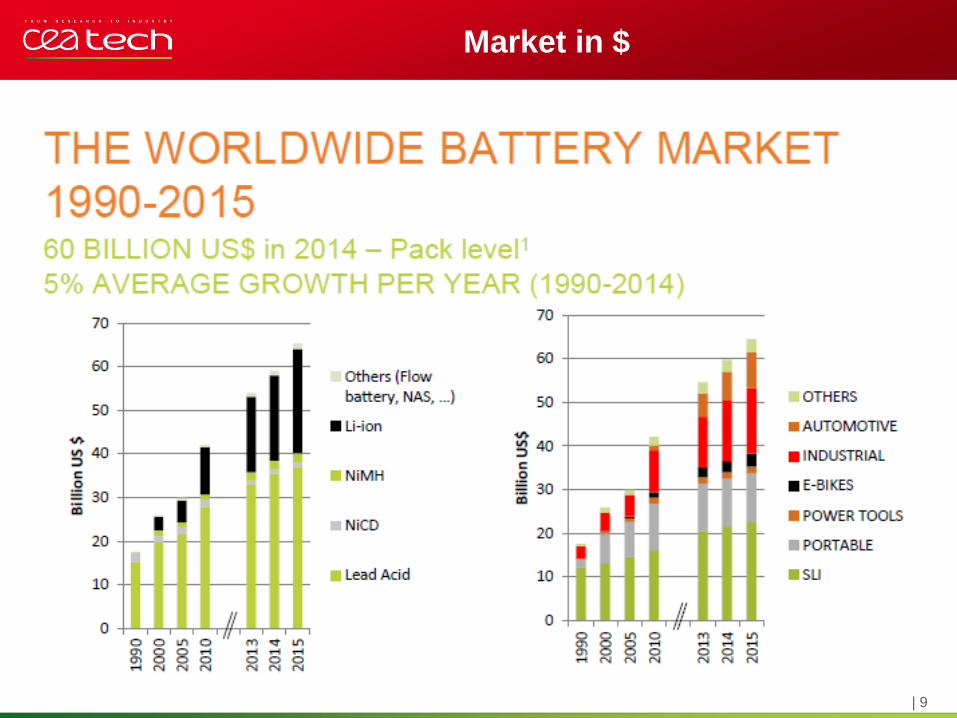
| 9
Market in $
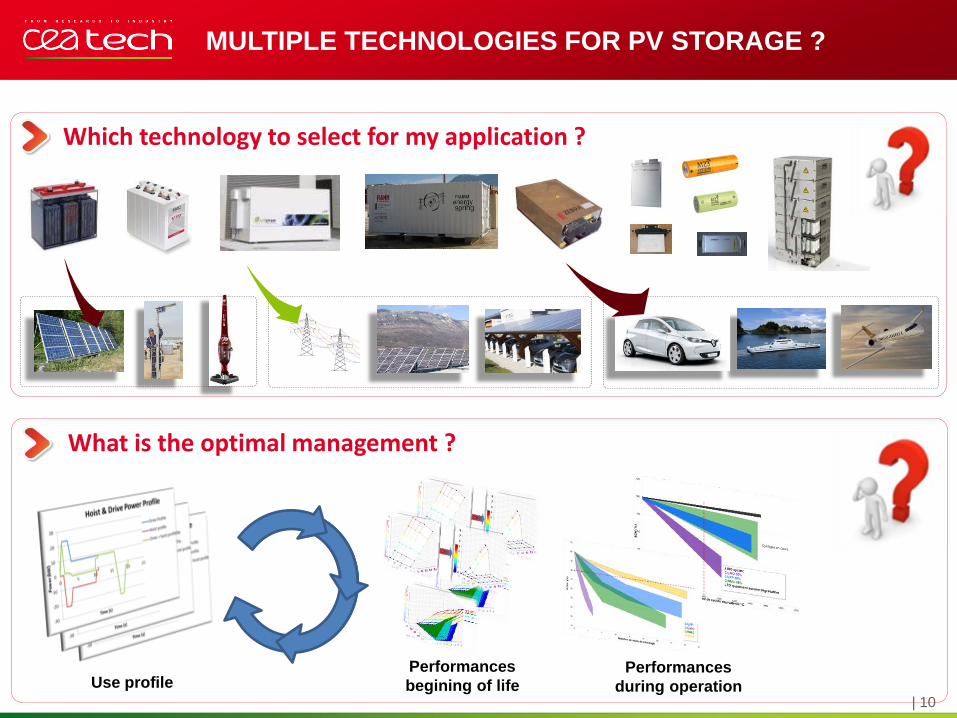
| 10
What is the optimal management ?
Use profile Performances
begining of life Performances
during operation
MULTIPLE TECHNOLOGIES FOR PV STORAGE ?
Which technology to select for my application ?
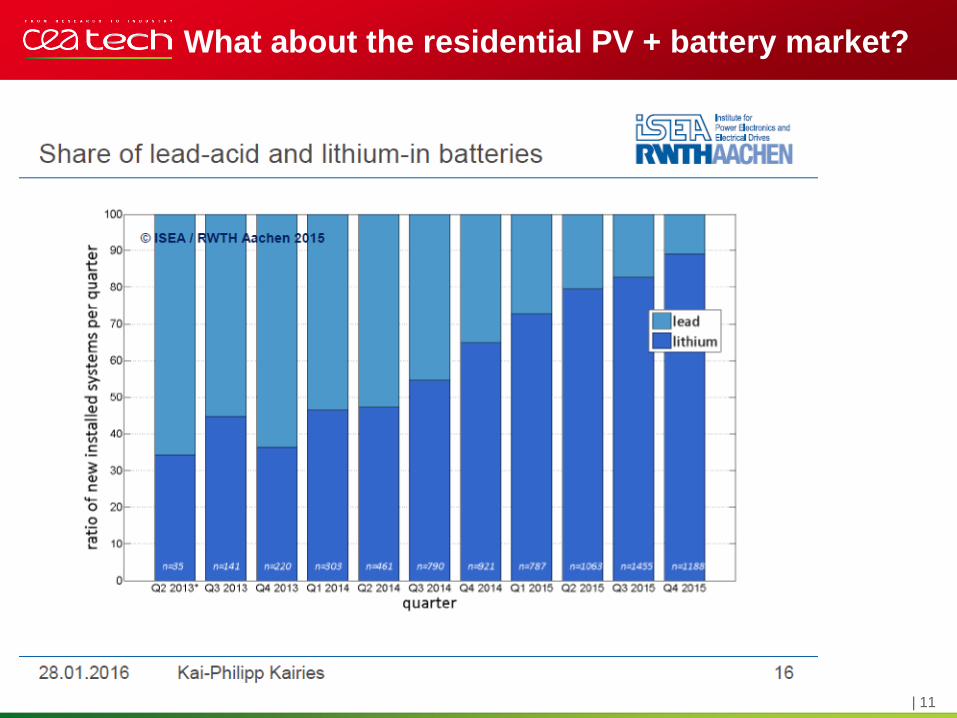
| 11
What about the residential PV + battery market?
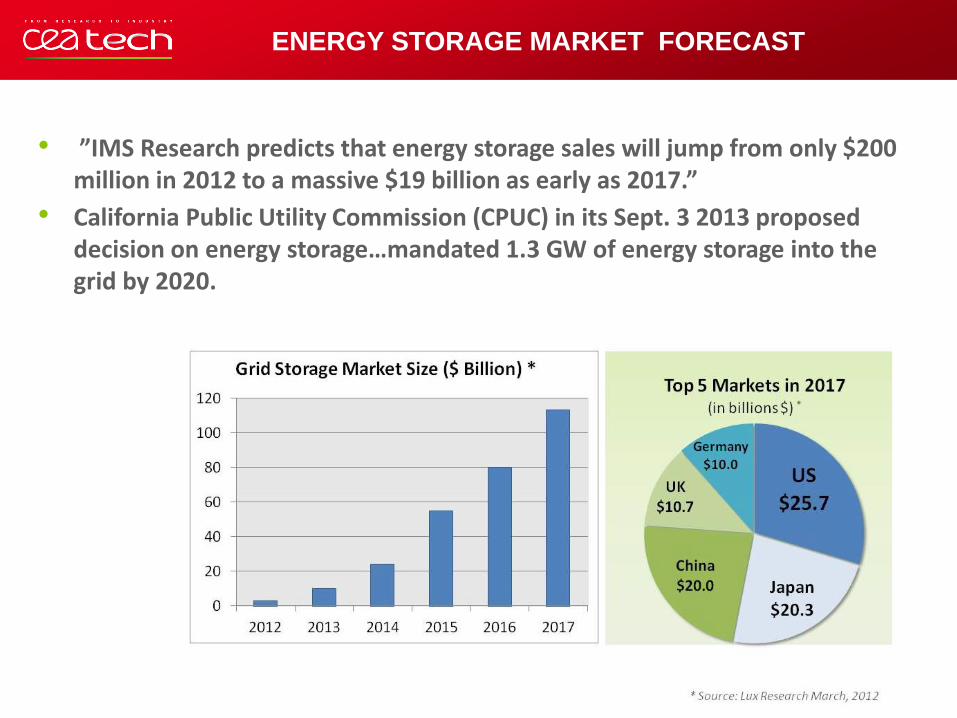
| 13
• ”IMS Research predicts that energy storage sales will jump from only $200 million in 2012 to a massive $19 billion as early as 2017.”
• California Public Utility Commission (CPUC) in its Sept. 3 2013 proposed decision on energy storage…mandated 1.3 GW of energy storage into the grid by 2020.
ENERGY STORAGE MARKET FORECAST
| 14
• Need for electricity storage: applications
• Market evolution
• Present prices
• Storage learning curve
• European storage?
AGENDA
LITEN Days 2015 | Marion PERRIN
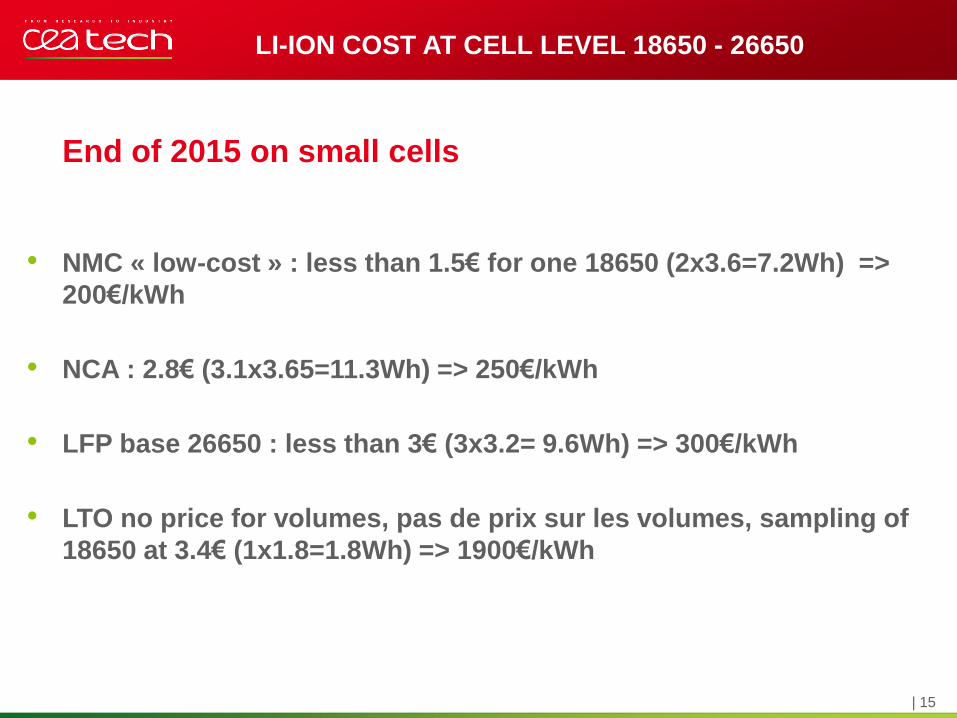
| 15
• NMC « low-cost » : less than 1.5€ for one 18650 (2x3.6=7.2Wh) =>
200€/kWh
• NCA : 2.8€ (3.1x3.65=11.3Wh) => 250€/kWh
• LFP base 26650 : less than 3€ (3x3.2= 9.6Wh) => 300€/kWh
• LTO no price for volumes, pas de prix sur les volumes, sampling of
18650 at 3.4€ (1x1.8=1.8Wh) => 1900€/kWh
End of 2015 on small cells
LI-ION COST AT CELL LEVEL 18650 - 26650
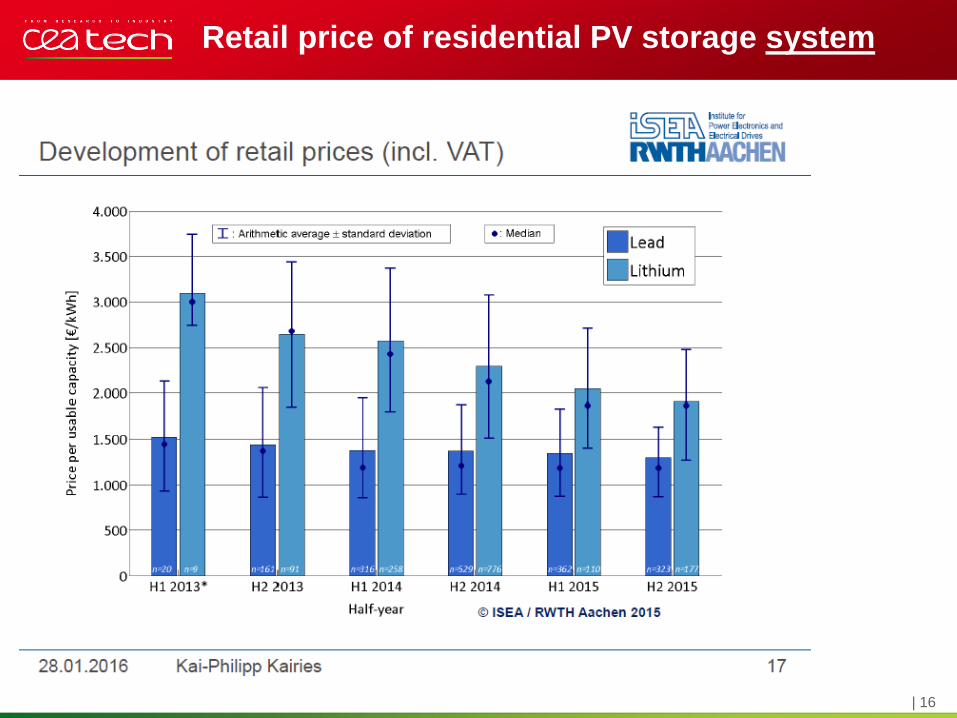
| 16
Retail price of residential PV storage system
| 17
• Need for electricity storage: applications
• Market evolution
• Present prices
• Storage learning curve
• European storage?
AGENDA
LITEN Days 2015 | Marion PERRIN
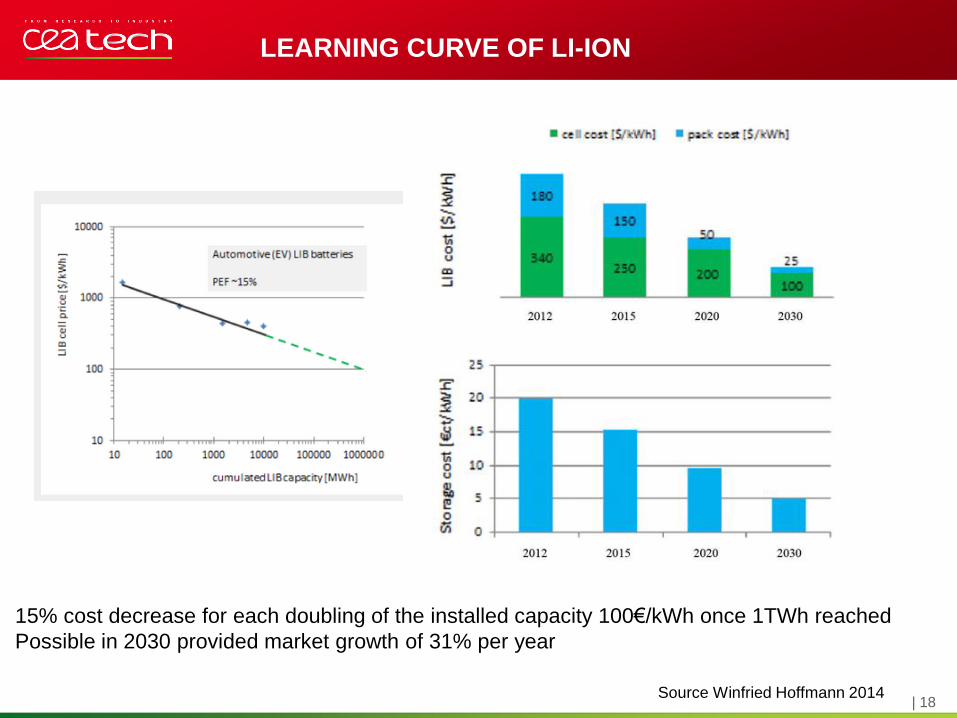
| 18
LEARNING CURVE OF LI-ION
15% cost decrease for each doubling of the installed capacity 100€/kWh once 1TWh reached
Possible in 2030 provided market growth of 31% per year
Source Winfried Hoffmann 2014
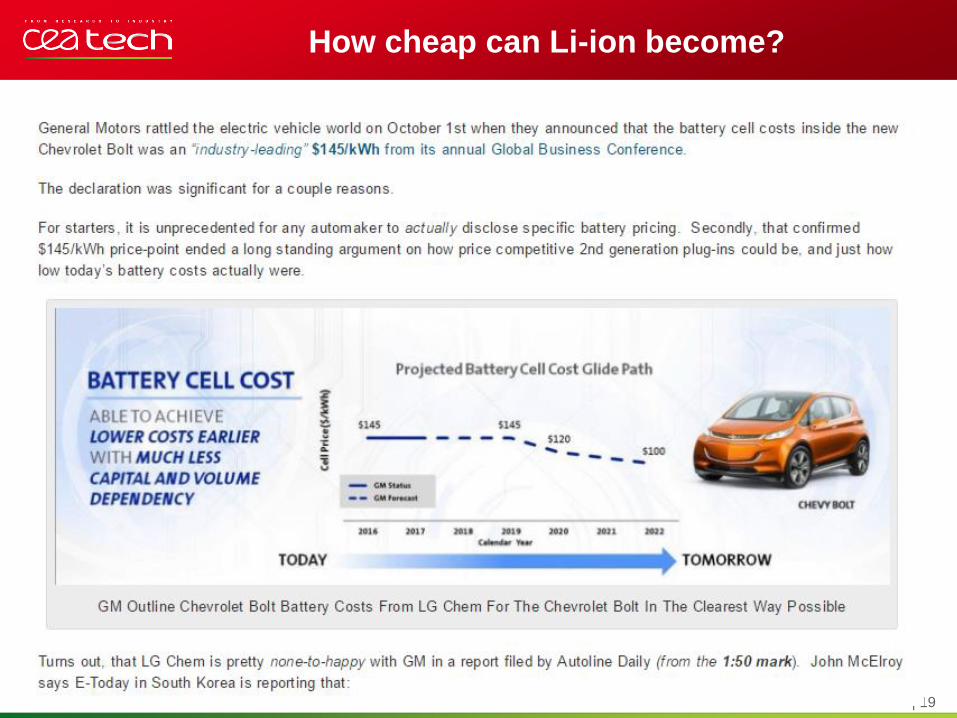
| 19
How cheap can Li-ion become?
| 20
• Need for electricity storage: applications
• Market evolution
• Present prices
• Storage learning curve
• European storage?
AGENDA
LITEN Days 2015 | Marion PERRIN
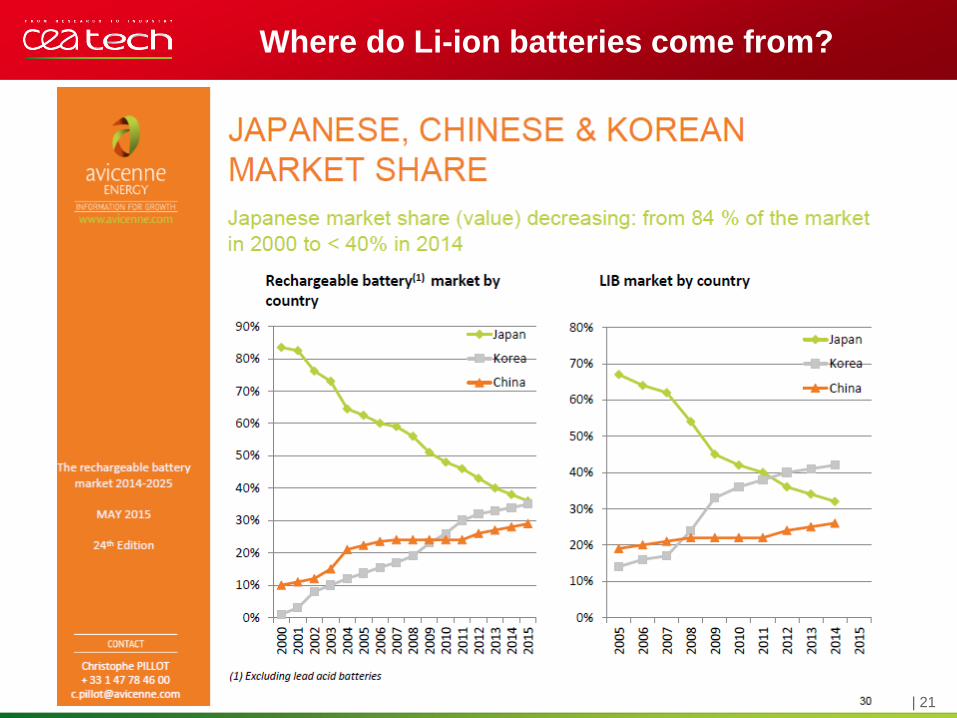
| 21
Where do Li-ion batteries come from?
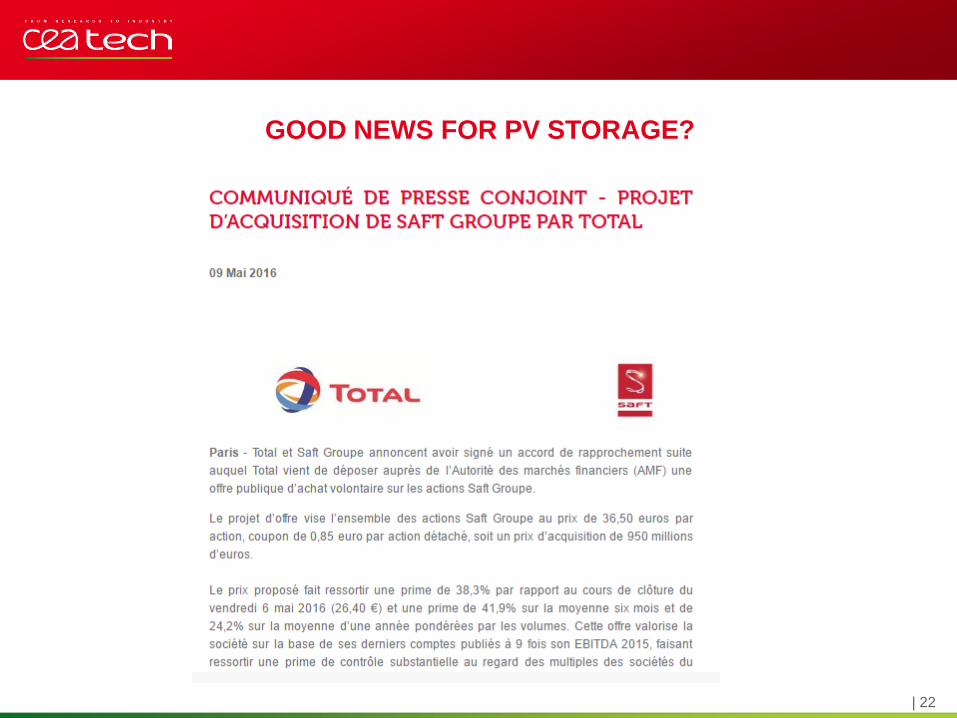
| 22
GOOD NEWS FOR PV STORAGE?
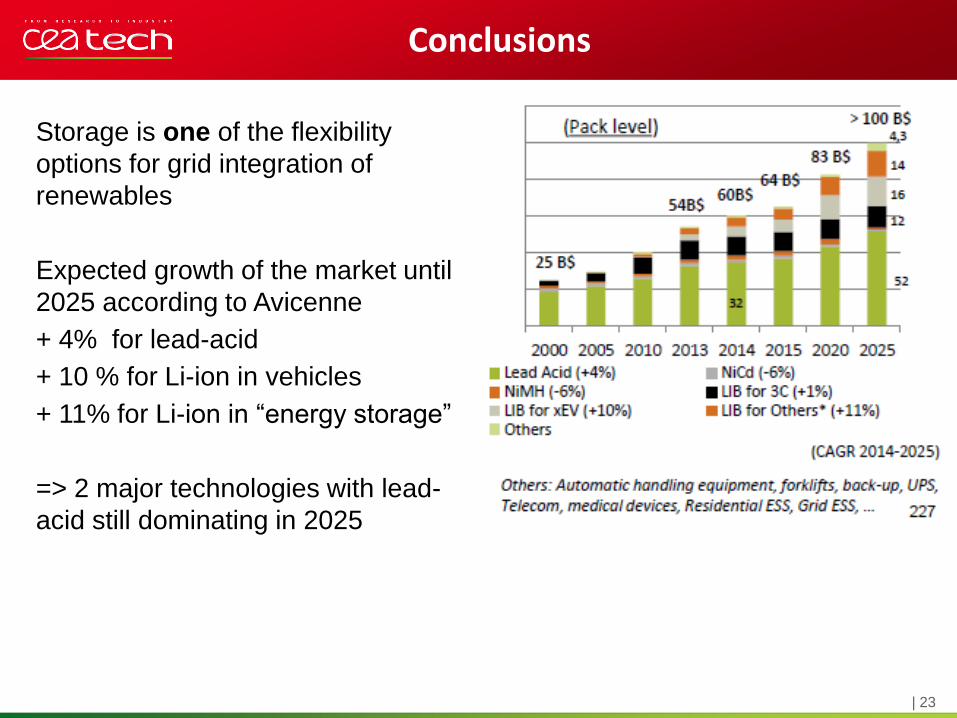
| 23
Conclusions
Storage is one of the flexibility
options for grid integration of
renewables
Expected growth of the market until
2025 according to Avicenne
+ 4% for lead-acid
+ 10 % for Li-ion in vehicles
+ 11% for Li-ion in “energy storage”
=> 2 major technologies with lead-
acid still dominating in 2025

siemens.com 18 May, 2016
The virtual battery: energy management in
buildings and neighbourhoods
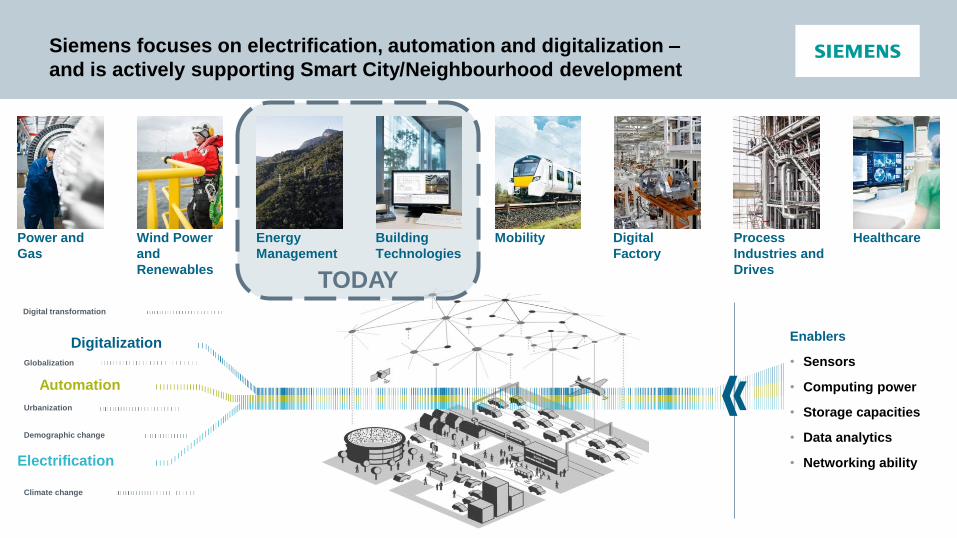
Siemens focuses on electrification, automation and digitalization –
and is actively supporting Smart City/Neighbourhood development
Digital transformation
Digitalization
Globalization
Automation
Urbanization
Demographic change
Climate change
Electrification
Power and
Gas
Wind Power
and
Renewables
Mobility
Digital
Factory
Process
Industries and
Drives
Healthcare
Enablers
• Sensors
• Computing power
• Storage capacities
• Data analytics
• Networking ability
TODAY
Energy
Management
Building
Technologies
Digital Grid
Ahead of the challenge, ahead of the change
The energy systems are changing dramatically

From monopoly power …
From monopoly power … … to deregulated markets.
From downstream power delivery …
From downstream power delivery … … to smart distribution and bidirectional power flows.
From top-down topologies …
From top-down topologies … … to autonomous local structures.
From predictable long-term value streams …
From predictable long-term value streams … … to versatile, value-based transactions.
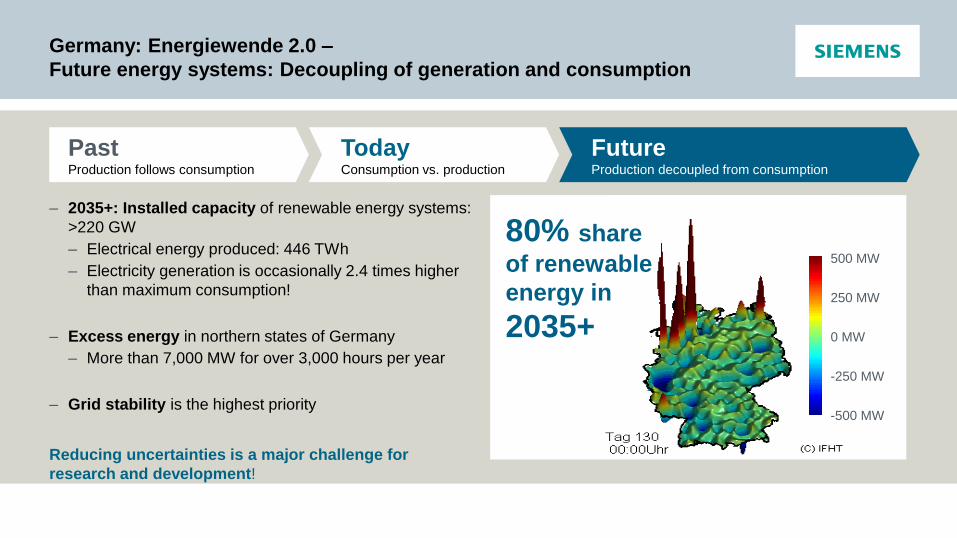
Germany: Energiewende 2.0 –
Future energy systems: Decoupling of generation and consumption
Past Production follows consumption
Today Consumption vs. production
Future Production decoupled from consumption
500 MW
0 MW
-500 MW
250 MW
-250 MW
80% share
of renewable
energy in
2035+
‒ 2035+: Installed capacity of renewable energy systems:
>220 GW
‒ Electrical energy produced: 446 TWh
‒ Electricity generation is occasionally 2.4 times higher
than maximum consumption!
‒ Excess energy in northern states of Germany
‒ More than 7,000 MW for over 3,000 hours per year
‒ Grid stability is the highest priority
Reducing uncertainties is a major challenge for
research and development!
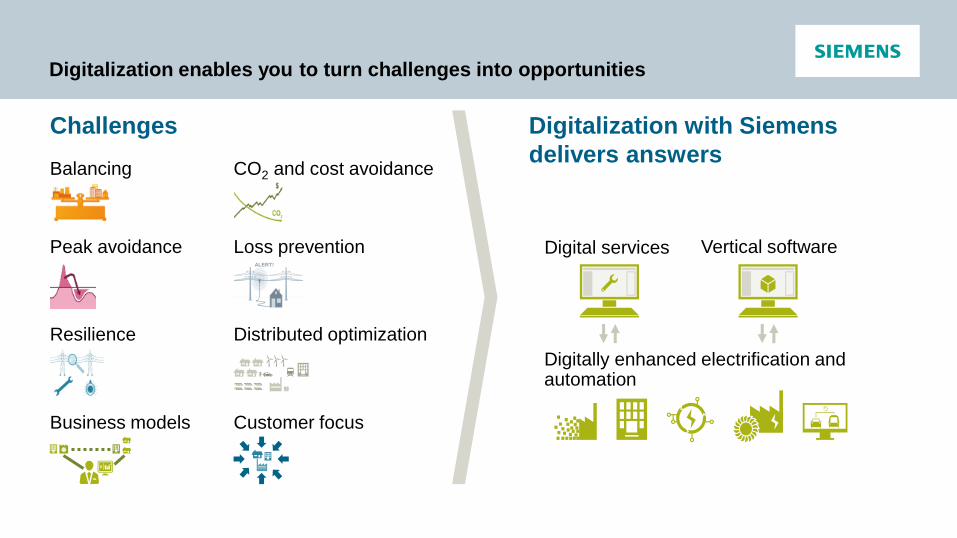
Digitalization enables you to turn challenges into opportunities
Digital services Vertical software
Digitally enhanced electrification and automation
Challenges Digitalization with Siemens
delivers answers
ALERT!
Balancing
Peak avoidance
Resilience
Business models
CO2 and cost avoidance
Loss prevention
Distributed optimization
Customer focus
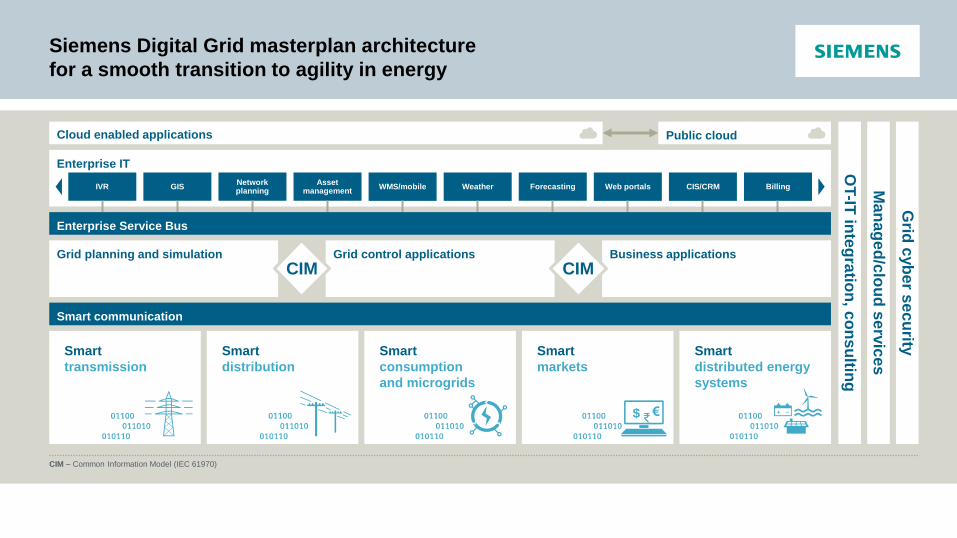
Siemens Digital Grid masterplan architecture
for a smooth transition to agility in energy
CIM – Common Information Model (IEC 61970)
Enterprise IT
IVR GIS Network planning
Asset management
WMS/mobile Weather Forecasting Web portals CIS/CRM Billing
Enterprise Service Bus
Cloud enabled applications Public cloud
Smart communication
Grid
cyb
er s
ec
urity
Ma
nag
ed
/clo
ud
se
rvic
es
OT
-IT in
teg
ratio
n, c
on
su
lting
Smart
transmission
Smart
distribution
Smart
consumption
and microgrids
Smart
distributed energy
systems
Smart
markets
$ € ₹
Business applications Grid control applications Grid planning and simulation
CIM CIM
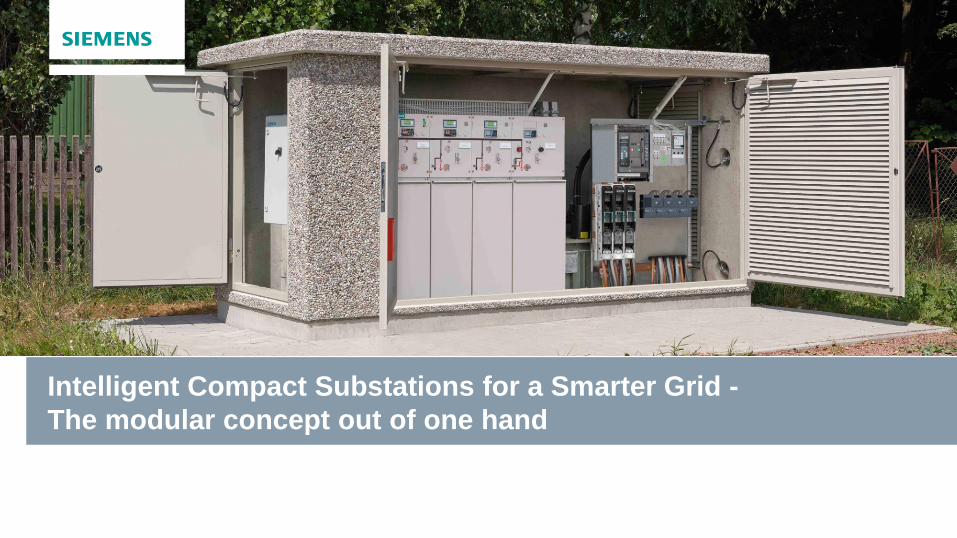
Siemens.com/answers
Intelligent Compact Substations for a Smarter Grid -
The modular concept out of one hand
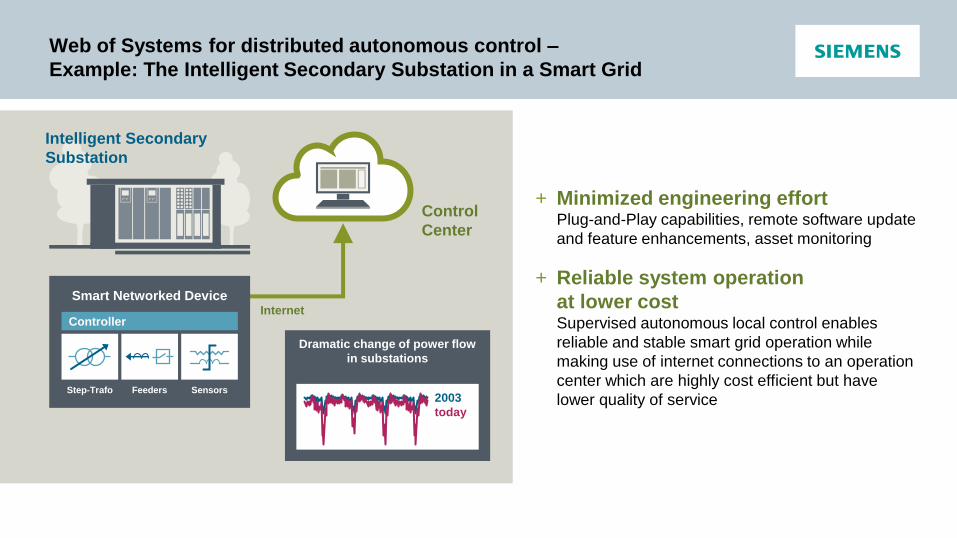
Web of Systems for distributed autonomous control –
Example: The Intelligent Secondary Substation in a Smart Grid
+ Minimized engineering effort Plug-and-Play capabilities, remote software update
and feature enhancements, asset monitoring
+ Reliable system operation
at lower cost Supervised autonomous local control enables
reliable and stable smart grid operation while
making use of internet connections to an operation
center which are highly cost efficient but have
lower quality of service
Internet
Dramatic change of power flow
in substations
2003
today
Sensors Step-Trafo Feeders
Smart Networked Device
Controller
Intelligent Secondary
Substation
Control
Center
The modular energy
storage system for a
reliable power supply
SIESTORAGE
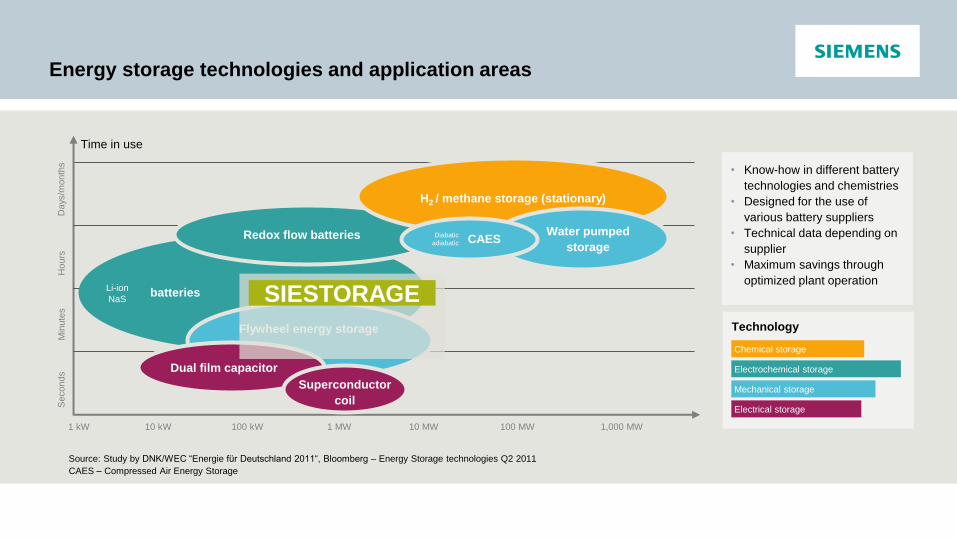
Energy storage technologies and application areas
Electrical storage
Mechanical storage
Electrochemical storage
Chemical storage
Source: Study by DNK/WEC “Energie für Deutschland 2011“, Bloomberg – Energy Storage technologies Q2 2011
CAES – Compressed Air Energy Storage
1 kW 10 kW 100 kW 1 MW 10 MW 100 MW 1,000 MW
Dual film capacitor
Superconductor
coil
Min
ute
s
Seconds
Hours
D
ays
/month
s
Li-ion
NaS batteries
Redox flow batteries
H2 / methane storage (stationary)
Diabatic
adiabatic CAES Water pumped
storage
Technology Flywheel energy storage
SIESTORAGE
Time in use
• Know-how in different battery
technologies and chemistries
• Designed for the use of
various battery suppliers
• Technical data depending on
supplier
• Maximum savings through
optimized plant operation
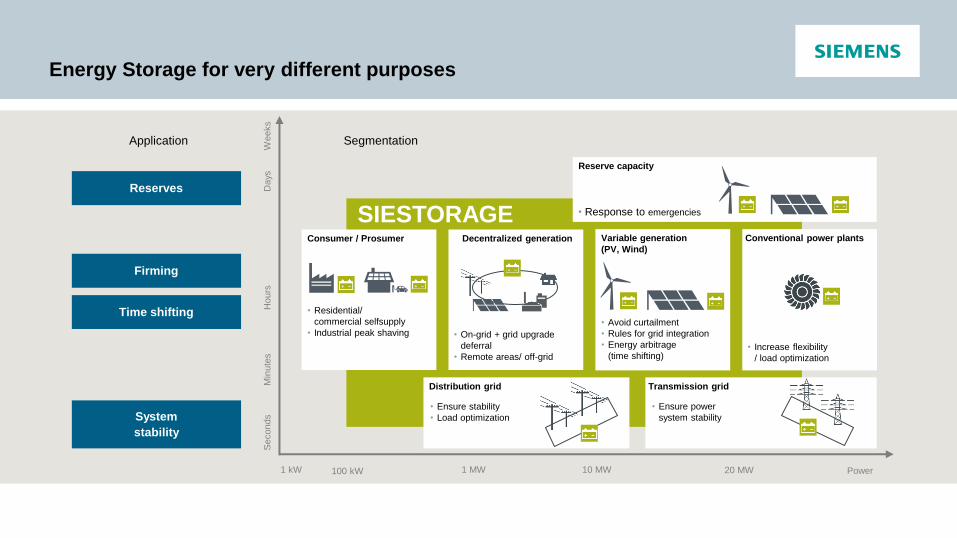
Energy Storage for very different purposes
SIESTORAGE Decentralized generation
Min
ute
s
Seconds
Hours
D
ays
W
eeks
Distribution grid Transmission grid
Reserve capacity
Variable generation
(PV, Wind) Consumer / Prosumer Conventional power plants
Application Segmentation
• Response to emergencies
• Residential/
commercial selfsupply
• Industrial peak shaving • On-grid + grid upgrade
deferral
• Remote areas/ off-grid
• Avoid curtailment
• Rules for grid integration
• Energy arbitrage
(time shifting) • Increase flexibility
/ load optimization
• Ensure stability
• Load optimization
• Ensure power
system stability
1 kW Power 100 kW 1 MW 10 MW 20 MW
Reserves
Time shifting
Firming
System
stability
Siemens.com/answers
Smart buildings: the answer to the increasing complexity of
tomorrow’s energy systems
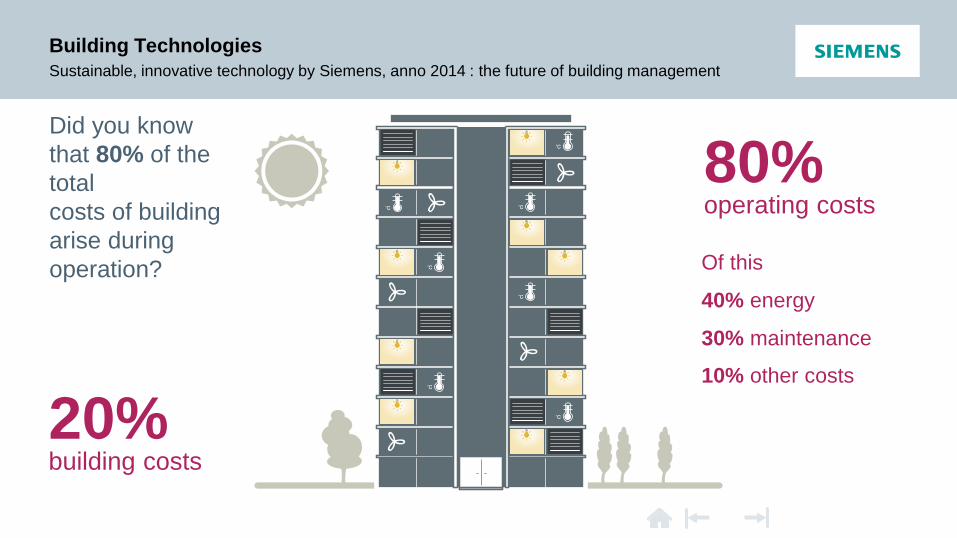
Building Technologies
Sustainable, innovative technology by Siemens, anno 2014 : the future of building management
80% operating costs
40% energy
30% maintenance
10% other costs
Of this
20% building costs
Did you know
that 80% of the
total
costs of building
arise during
operation?
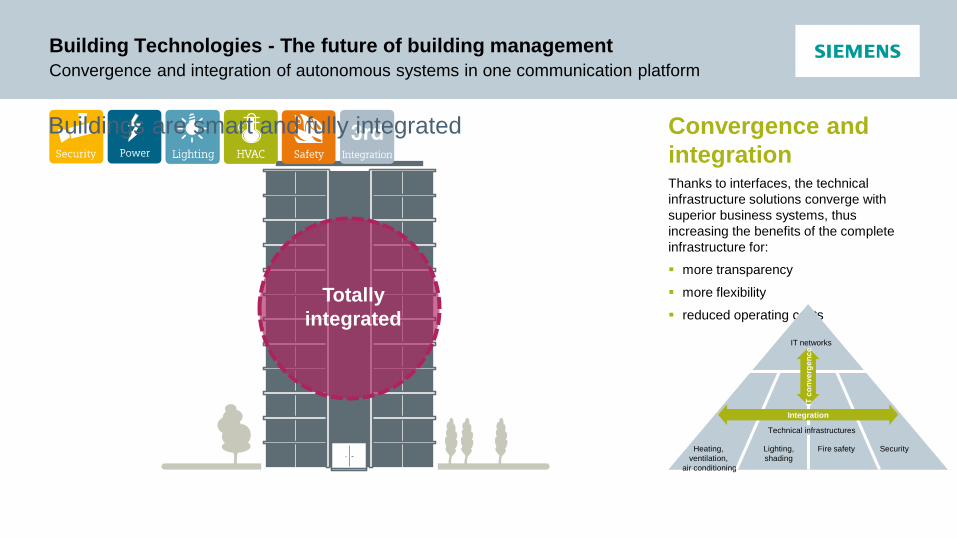
Building Technologies - The future of building management
Convergence and integration of autonomous systems in one communication platform
Totally
integrated
Buildings are smart and fully integrated Convergence and
integration Thanks to interfaces, the technical
infrastructure solutions converge with
superior business systems, thus
increasing the benefits of the complete
infrastructure for:
more transparency
more flexibility
reduced operating costs
Technical infrastructures
IT networks
Heating,
ventilation,
air conditioning
Lighting,
shading
Fire safety Security
Integration
IT c
on
ve
rge
nc
e
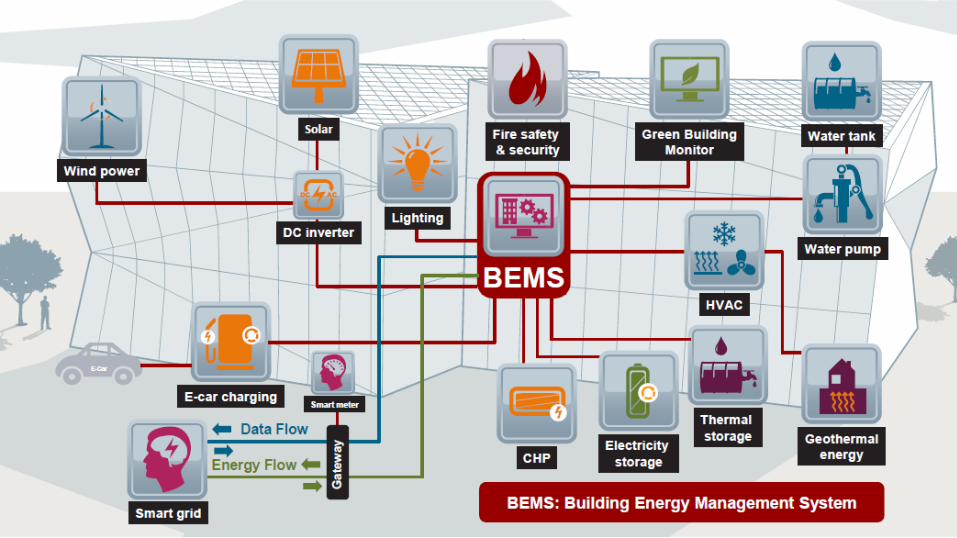
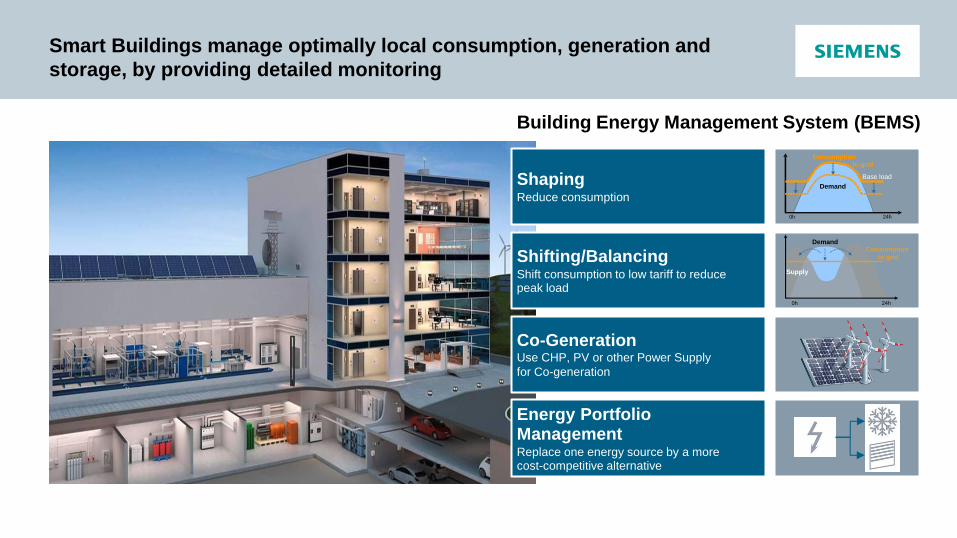
Smart Buildings manage optimally local consumption, generation and
storage, by providing detailed monitoring
Energy Portfolio Management Replace one energy source by a more cost-competitive alternative
Co-Generation Use CHP, PV or other Power Supply
for Co-generation
Shifting/Balancing Shift consumption to low tariff to reduce peak load
Shaping Reduce consumption
24h
Base load
Demand
0h
Consumption to grid
DemandConsumption
to grid
Supply
24h0h
Building Energy Management System (BEMS)

Smart Neighbourhood
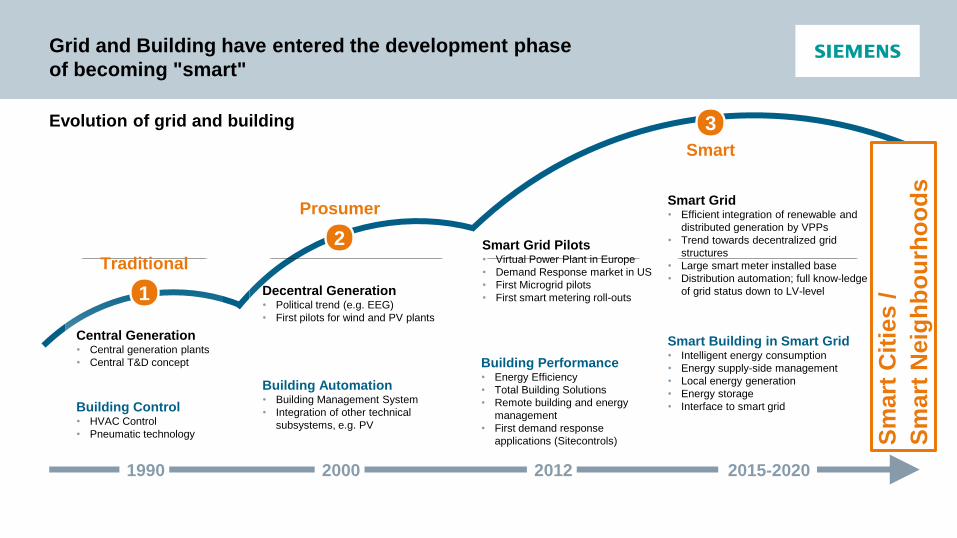
Grid and Building have entered the development phase
of becoming "smart"
Evolution of grid and building
Central Generation • Central generation plants
• Central T&D concept
Building Control • HVAC Control
• Pneumatic technology
Decentral Generation • Political trend (e.g. EEG)
• First pilots for wind and PV plants
Building Automation • Building Management System
• Integration of other technical
subsystems, e.g. PV
Smart Grid Pilots • Virtual Power Plant in Europe
• Demand Response market in US
• First Microgrid pilots
• First smart metering roll-outs
Building Performance • Energy Efficiency
• Total Building Solutions
• Remote building and energy
management
• First demand response
applications (Sitecontrols)
Smart Grid • Efficient integration of renewable and
distributed generation by VPPs
• Trend towards decentralized grid
structures
• Large smart meter installed base
• Distribution automation; full know-ledge
of grid status down to LV-level
Smart Building in Smart Grid • Intelligent energy consumption
• Energy supply-side management
• Local energy generation
• Energy storage
• Interface to smart grid
Traditional
Prosumer
Smart
1
2
3
1990 2000 2015-2020 2012
Sm
art
Cit
ies /
Sm
art
Neig
hb
ou
rho
od
s
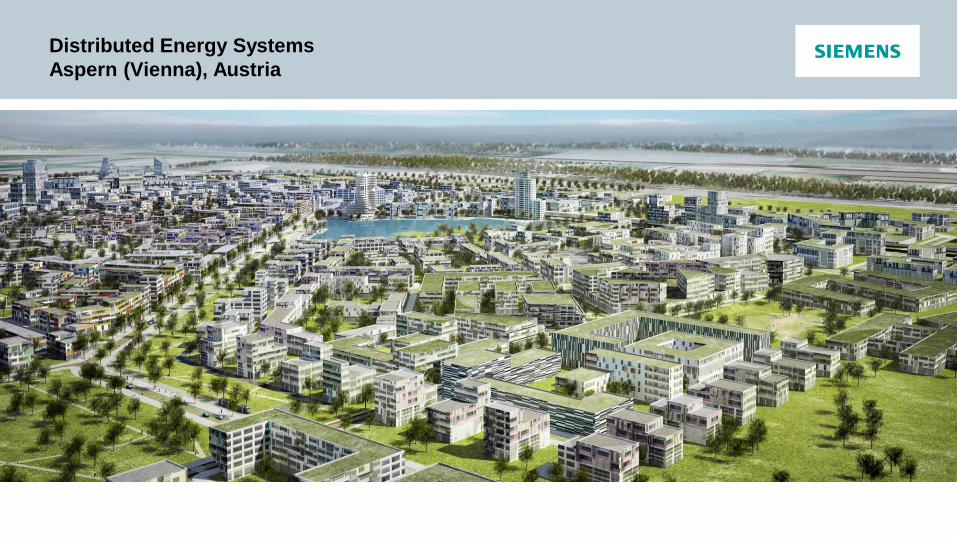
Distributed Energy Systems
Aspern (Vienna), Austria
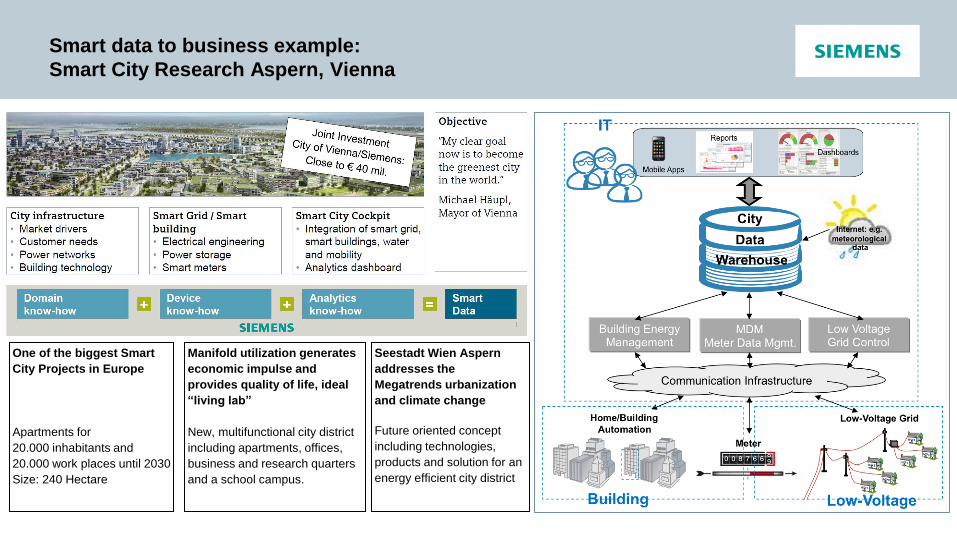
Smart data to business example:
Smart City Research Aspern, Vienna
One of the biggest Smart
City Projects in Europe
Apartments for
20.000 inhabitants and
20.000 work places until 2030
Size: 240 Hectare
Manifold utilization generates
economic impulse and
provides quality of life, ideal
“living lab”
New, multifunctional city district
including apartments, offices,
business and research quarters
and a school campus.
Seestadt Wien Aspern
addresses the
Megatrends urbanization
and climate change
Future oriented concept
including technologies,
products and solution for an
energy efficient city district

Digitalization changes everything
Nikos Hatziargyriou,
HEDNO, BoD Chairman & CEO
Chair of ETP SmartGrids
REPOWERING EUROPE Photovoltaics: centre-stage in the power system
Brussels, 18 May 2016
Challenges and opportunities in the integration of PV in the electricity
distribution networks
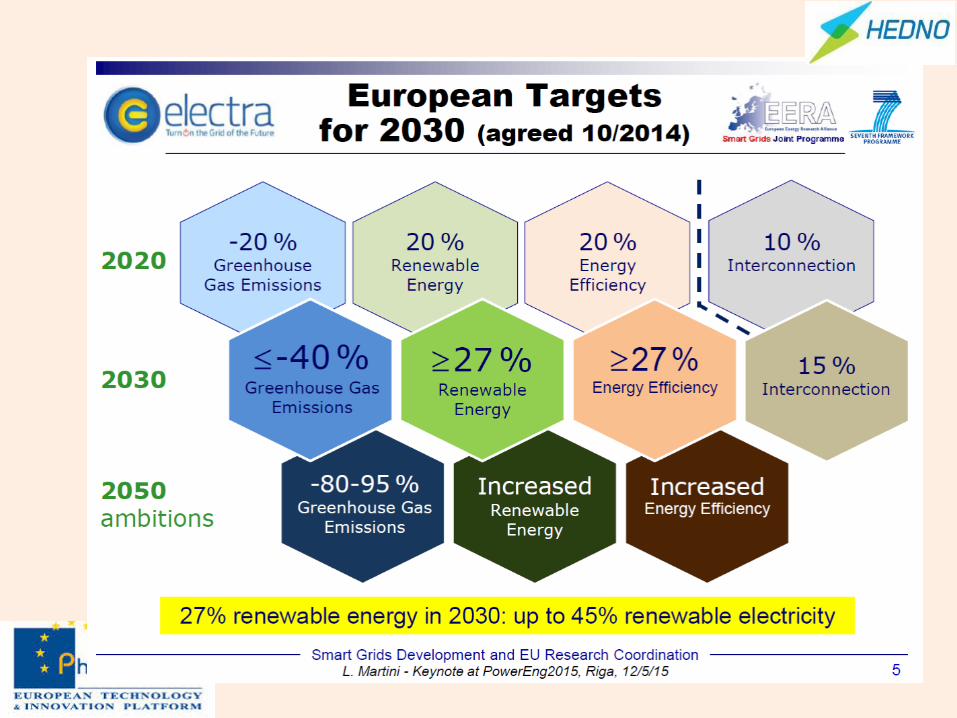
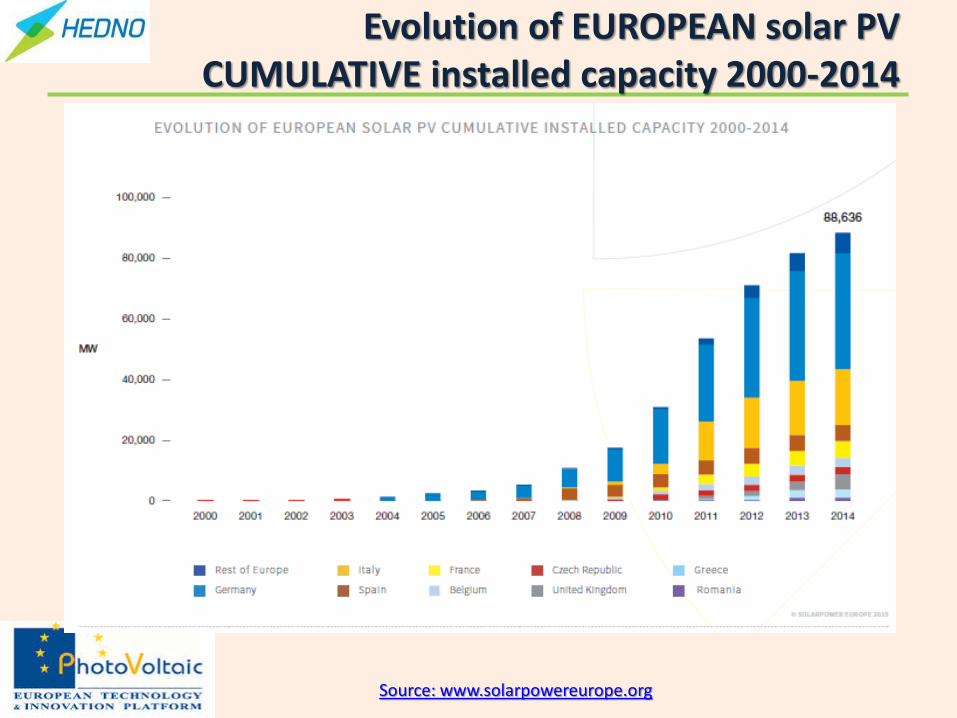
Evolution of EUROPEAN solar PV CUMULATIVE installed capacity 2000-2014
Source: www.solarpowereurope.org
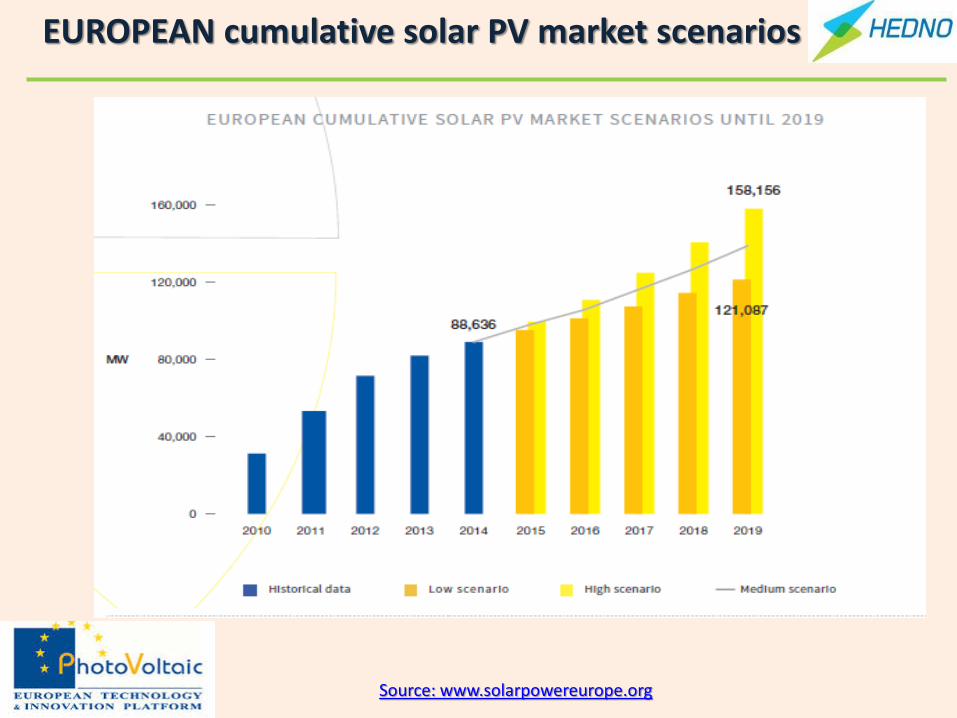
EUROPEAN cumulative solar PV market scenarios
Source: www.solarpowereurope.org
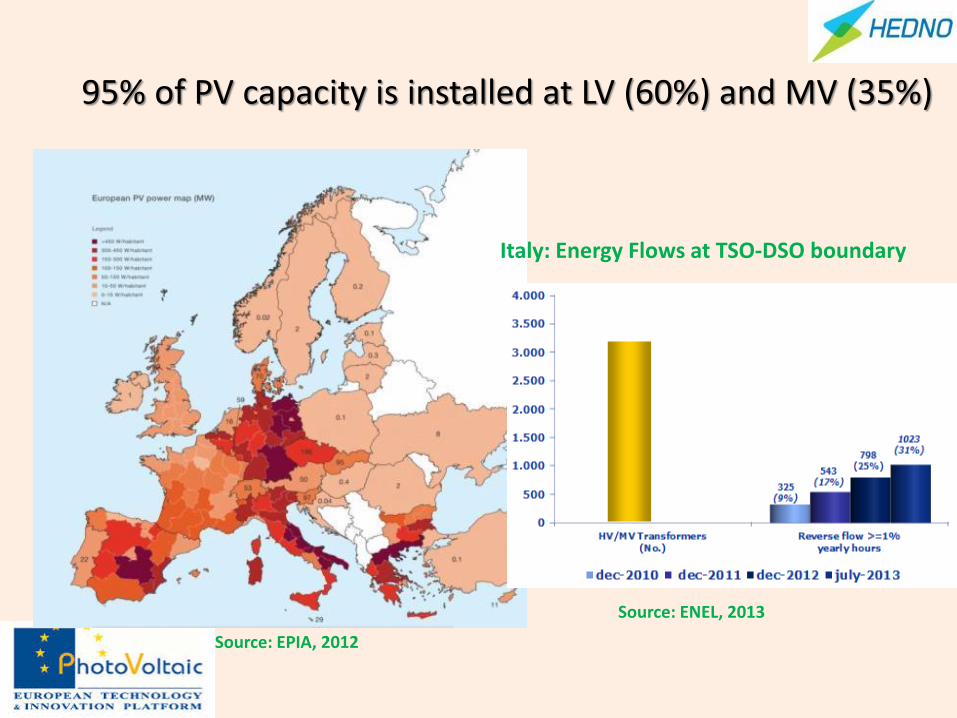
95% of PV capacity is installed at LV (60%) and MV (35%)
Source: EPIA, 2012
Source: ENEL, 2013
Italy: Energy Flows at TSO-DSO boundary
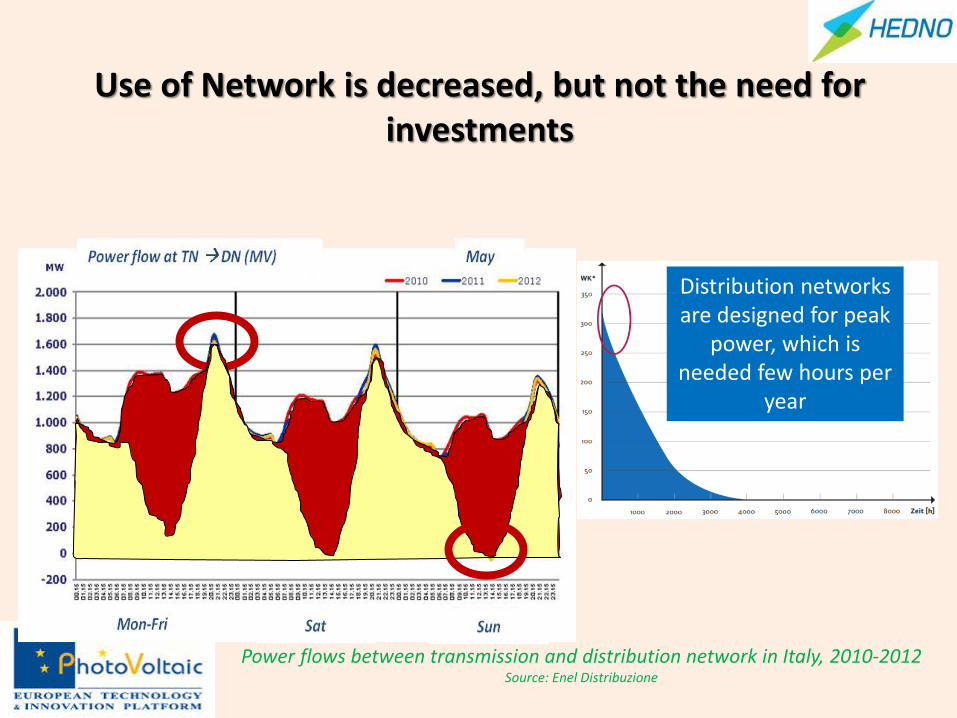
Use of Network is decreased, but not the need for investments
Power flows between transmission and distribution network in Italy, 2010-2012 Source: Enel Distribuzione
Distribution networks are designed for peak
power, which is needed few hours per
year
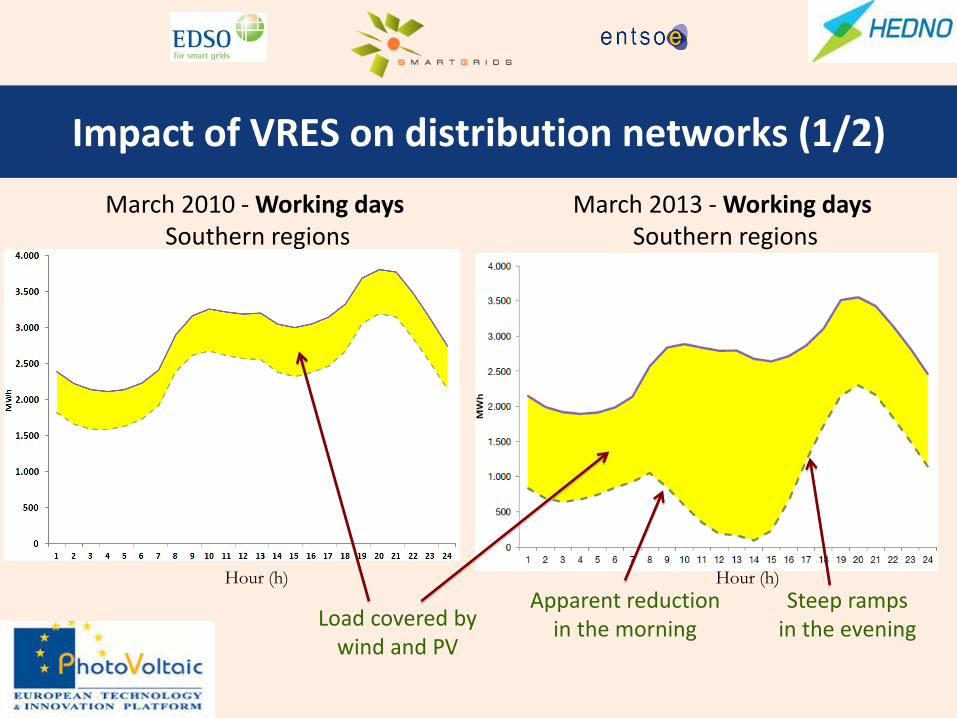
Impact of VRES on distribution networks (1/2)
March 2013 - Working days Southern regions
March 2010 - Working days Southern regions
Hour (h) Hour (h)
Steep ramps in the evening
Apparent reduction in the morning Load covered by
wind and PV
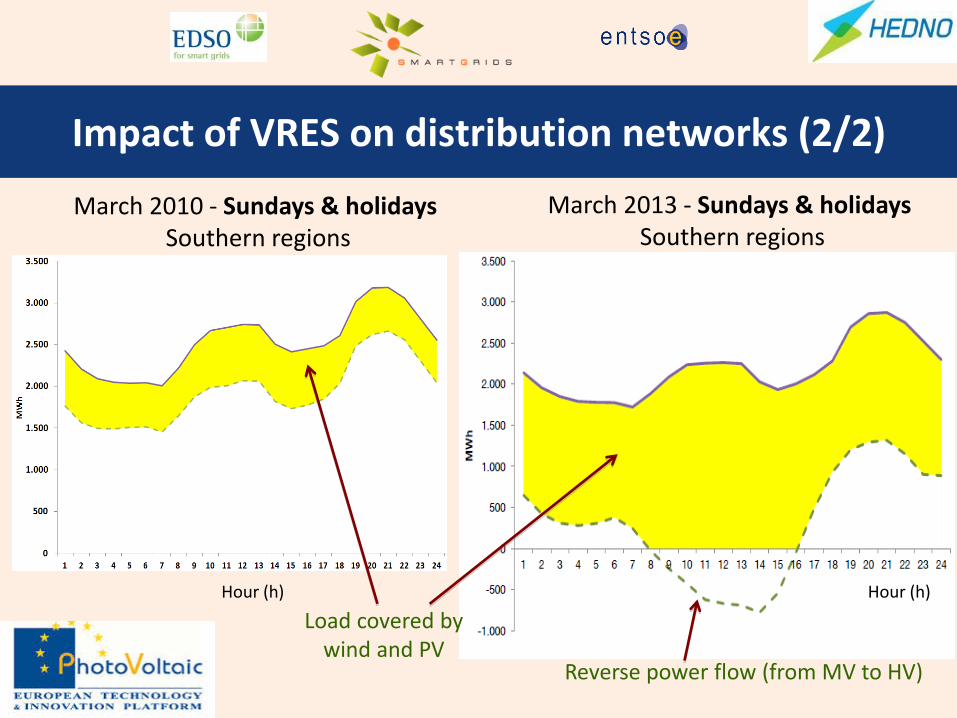
Impact of VRES on distribution networks (2/2)
Hour (h) Hour (h)
March 2013 - Sundays & holidays Southern regions
March 2010 - Sundays & holidays Southern regions
Reverse power flow (from MV to HV)
Load covered by wind and PV
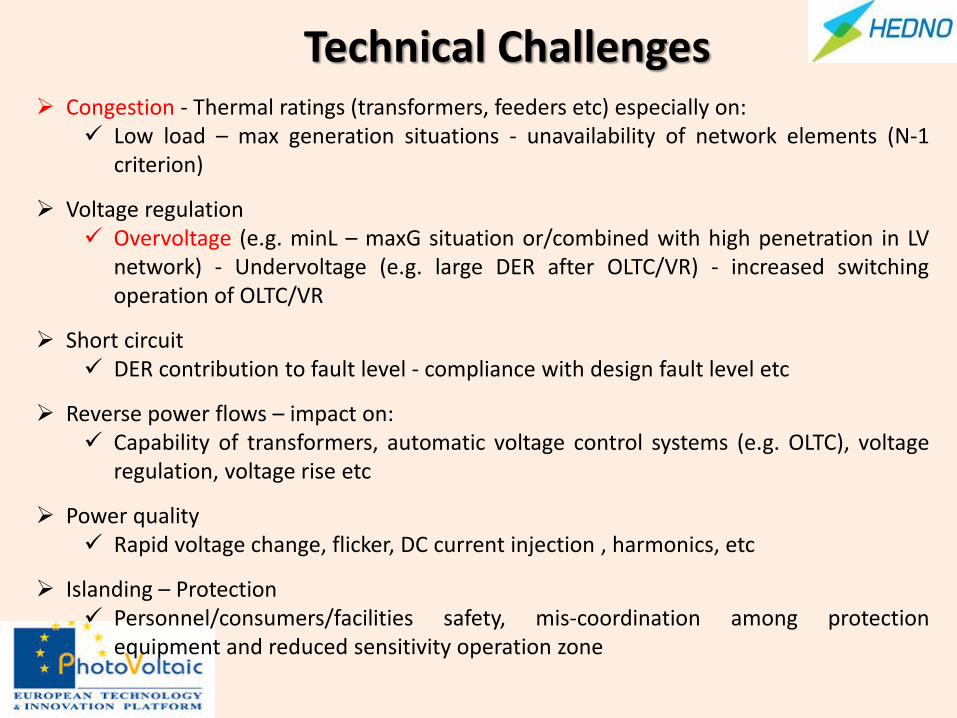
Congestion - Thermal ratings (transformers, feeders etc) especially on: Low load – max generation situations - unavailability of network elements (Ν-1
criterion)
Voltage regulation Overvoltage (e.g. minL – maxG situation or/combined with high penetration in LV
network) - Undervoltage (e.g. large DER after OLTC/VR) - increased switching operation of OLTC/VR
Short circuit DER contribution to fault level - compliance with design fault level etc
Reverse power flows – impact on: Capability of transformers, automatic voltage control systems (e.g. OLTC), voltage
regulation, voltage rise etc
Power quality Rapid voltage change, flicker, DC current injection , harmonics, etc
Islanding – Protection Personnel/consumers/facilities safety, mis-coordination among protection
equipment and reduced sensitivity operation zone
Technical Challenges
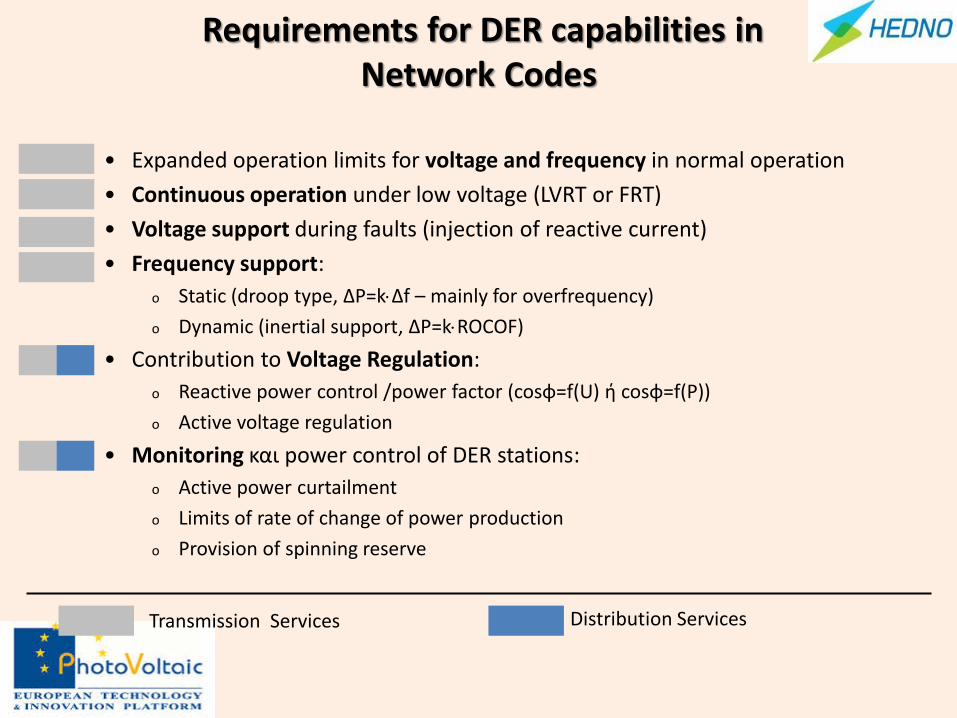
Requirements for DER capabilities in Network Codes
• Expanded operation limits for voltage and frequency in normal operation
• Continuous operation under low voltage (LVRT or FRT)
• Voltage support during faults (injection of reactive current)
• Frequency support:
o Static (droop type, ΔP=kΔf – mainly for overfrequency)
o Dynamic (inertial support, ΔP=kROCOF)
• Contribution to Voltage Regulation:
o Reactive power control /power factor (cosφ=f(U) ή cosφ=f(P))
o Active voltage regulation
• Monitoring και power control of DER stations:
o Active power curtailment
o Limits of rate of change of power production
o Provision of spinning reserve
Transmission Services Distribution Services
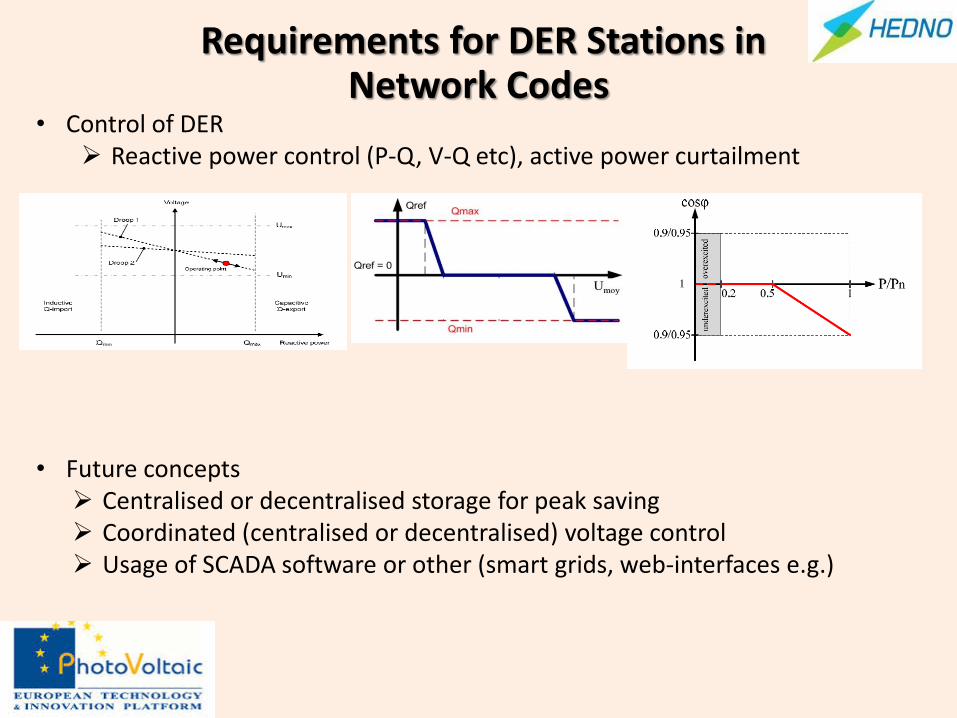
• Control of DER Reactive power control (P-Q, V-Q etc), active power curtailment
• Future concepts Centralised or decentralised storage for peak saving Coordinated (centralised or decentralised) voltage control Usage of SCADA software or other (smart grids, web-interfaces e.g.)
Requirements for DER Stations in Network Codes
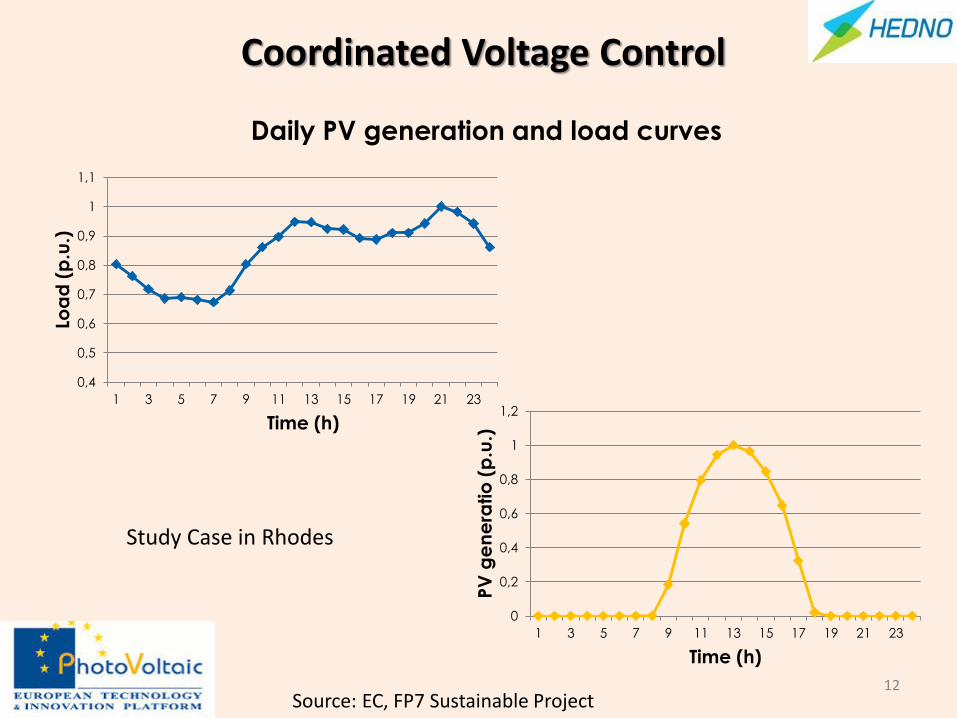
12
0
0,2
0,4
0,6
0,8
1
1,2
1 3 5 7 9 11 13 15 17 19 21 23
PV
ge
ne
ratio
(p
.u.)
Time (h)
0,4
0,5
0,6
0,7
0,8
0,9
1
1,1
1 3 5 7 9 11 13 15 17 19 21 23
Loa
d (
p.u
.)
Time (h)
Daily PV generation and load curves
Source: EC, FP7 Sustainable Project
Coordinated Voltage Control
Study Case in Rhodes
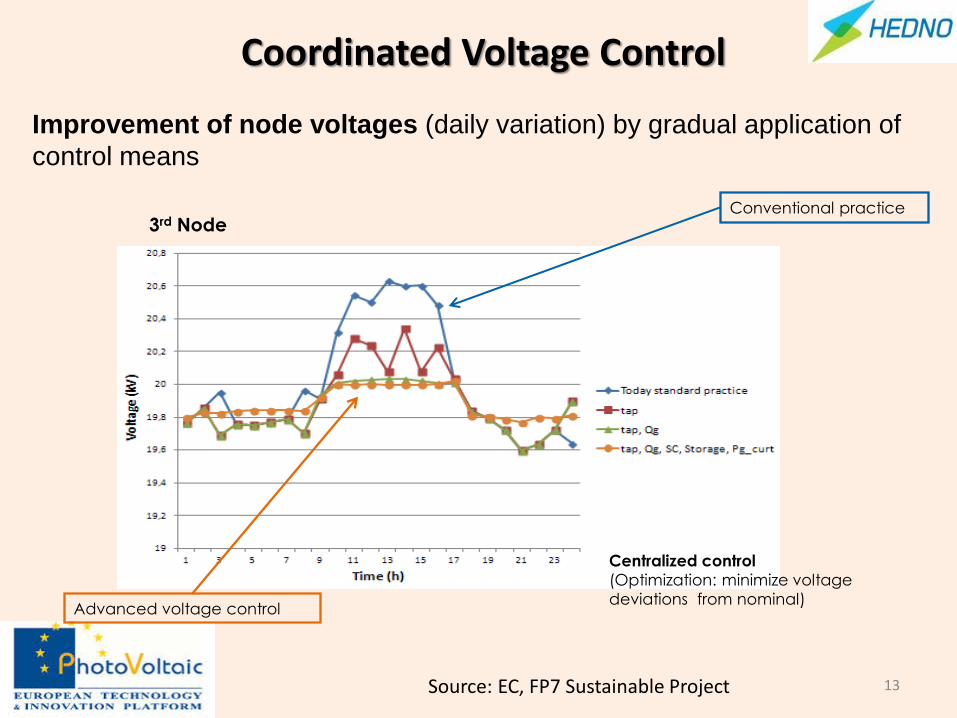
13
Conventional practice
Advanced voltage control
Improvement of node voltages (daily variation) by gradual application of
control means
3rd Node
Centralized control
(Optimization: minimize voltage
deviations from nominal)
Coordinated Voltage Control
Source: EC, FP7 Sustainable Project
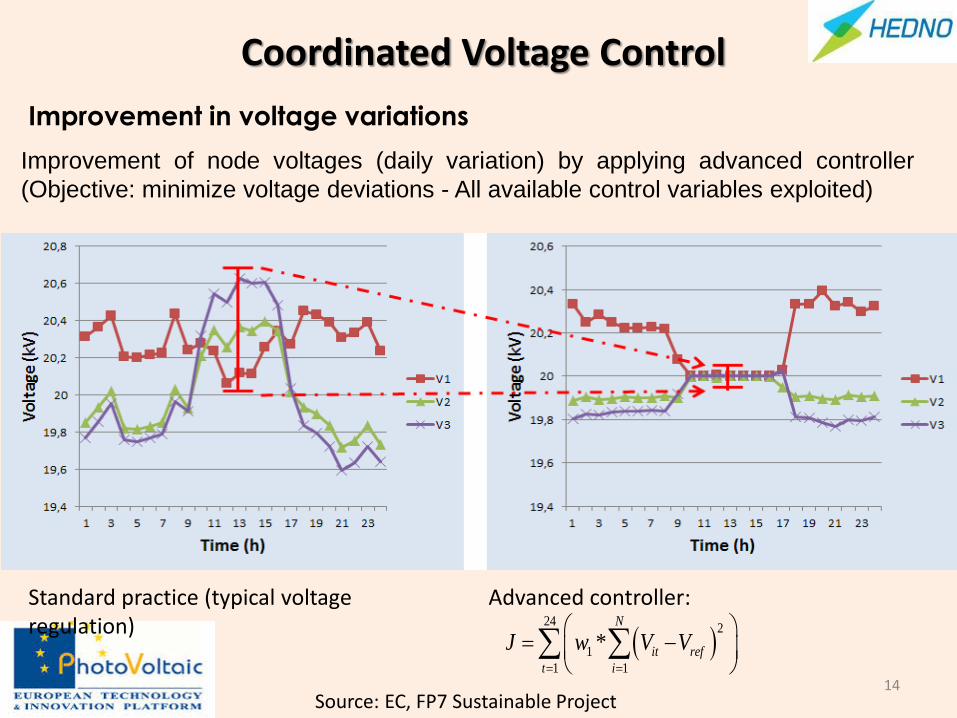
24
2
1
1 1
*N
it ref
t i
J w V V
Standard practice (typical voltage regulation)
Advanced controller:
14
Improvement in voltage variations
Improvement of node voltages (daily variation) by applying advanced controller
(Objective: minimize voltage deviations - All available control variables exploited)
Coordinated Voltage Control
Source: EC, FP7 Sustainable Project
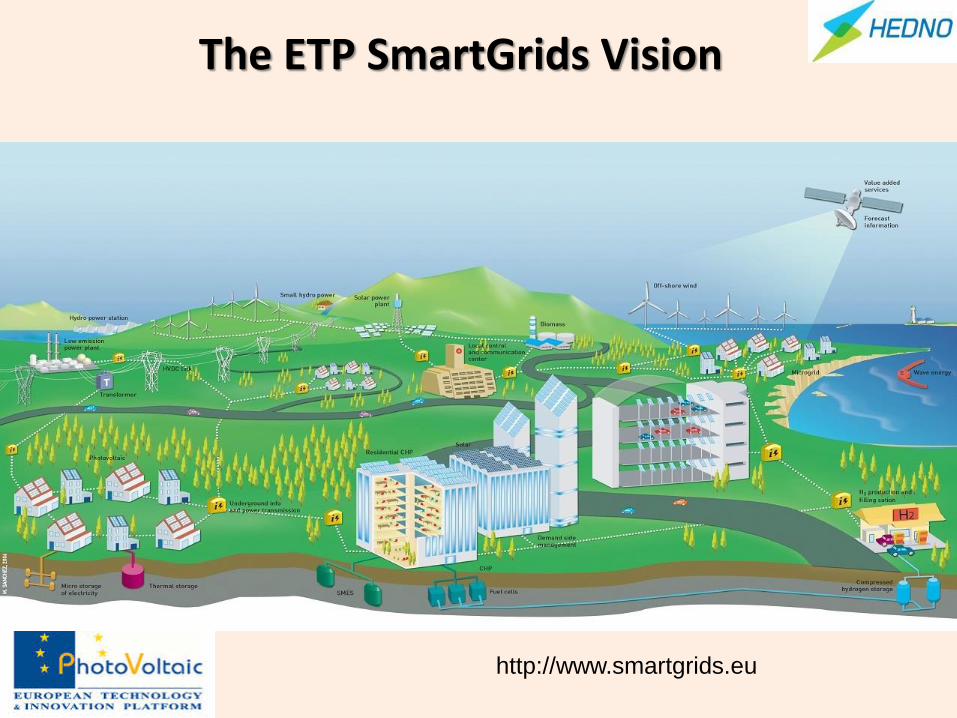
The ETP SmartGrids Vision
http://www.smartgrids.eu
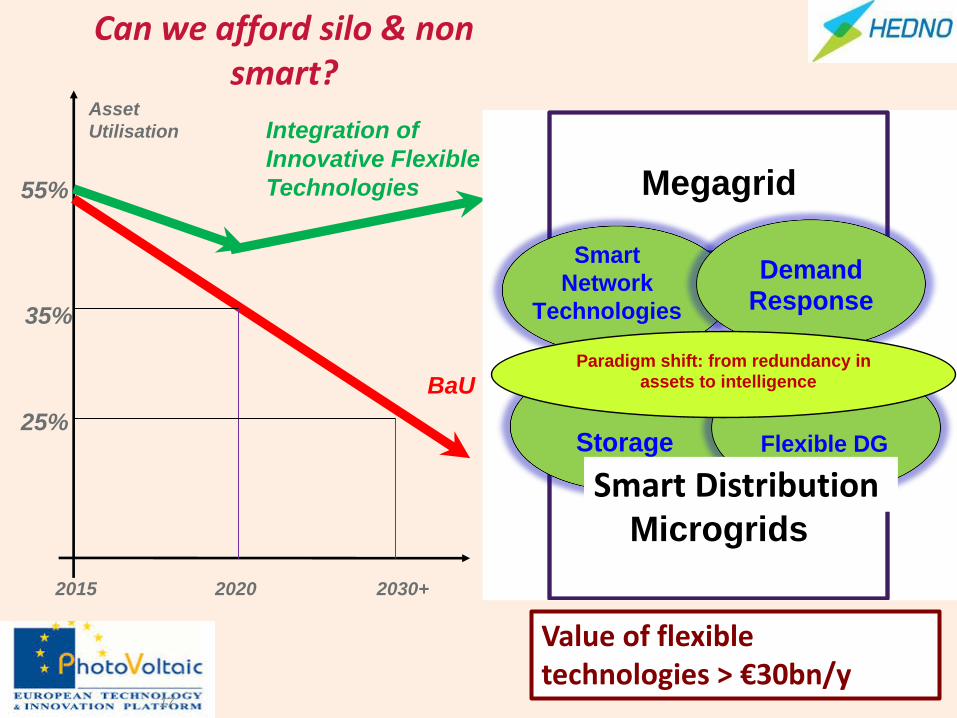
55%
2015
Asset
Utilisation
BaU
Integration of
Innovative Flexible
Technologies
2020 2030+
35%
25%
17
Can we afford silo & non smart?
Megagrid
Microgrids
Smart
Network
Technologies
Demand Response
Storage Flexible DG
Paradigm shift: from redundancy in assets to intelligence
Value of flexible technologies > €30bn/y
Smart Distribution
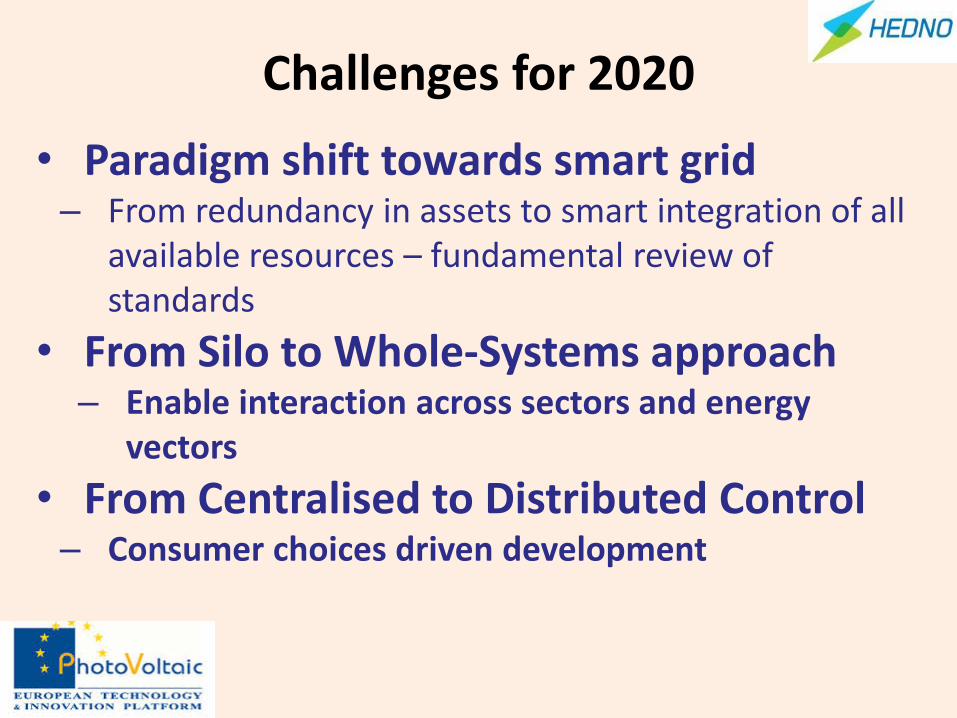
Challenges for 2020
• Paradigm shift towards smart grid – From redundancy in assets to smart integration of all
available resources – fundamental review of standards
• From Silo to Whole-Systems approach – Enable interaction across sectors and energy
vectors
• From Centralised to Distributed Control – Consumer choices driven development
They support us:
Reuniwatt – Forecasting Use Cases
Marion Lafuma – Marketing Manager
18/05/2016 1
Our company
18/05/2016 2
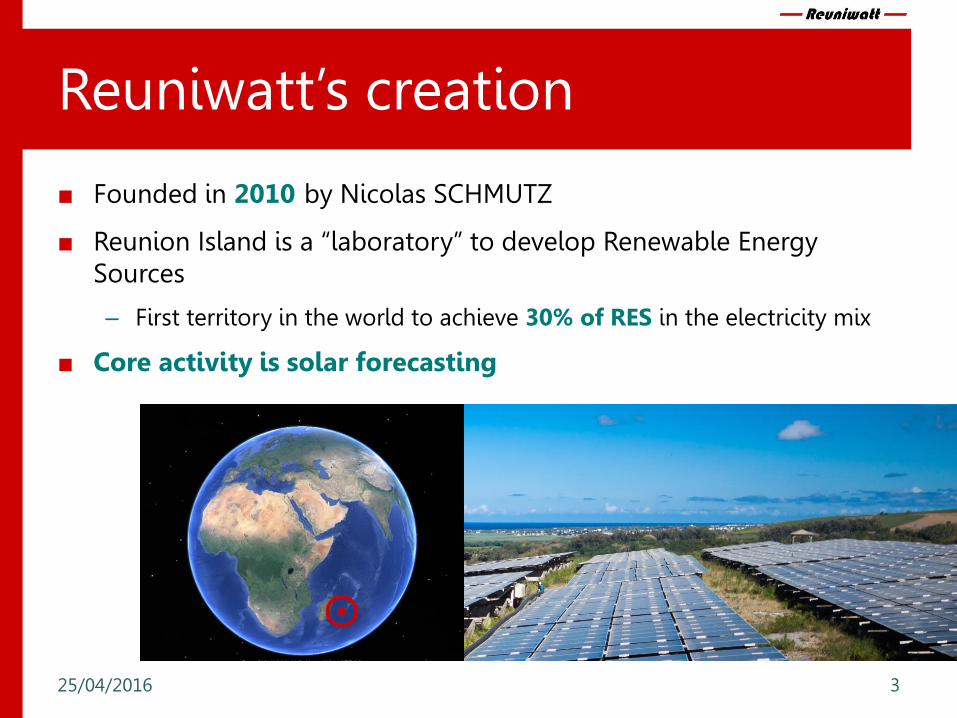
Reuniwatt’s creation
■ Founded in 2010 by Nicolas SCHMUTZ
■ Reunion Island is a “laboratory” to develop Renewable Energy Sources
– First territory in the world to achieve 30% of RES in the electricity mix
■ Core activity is solar forecasting
25/04/2016 3
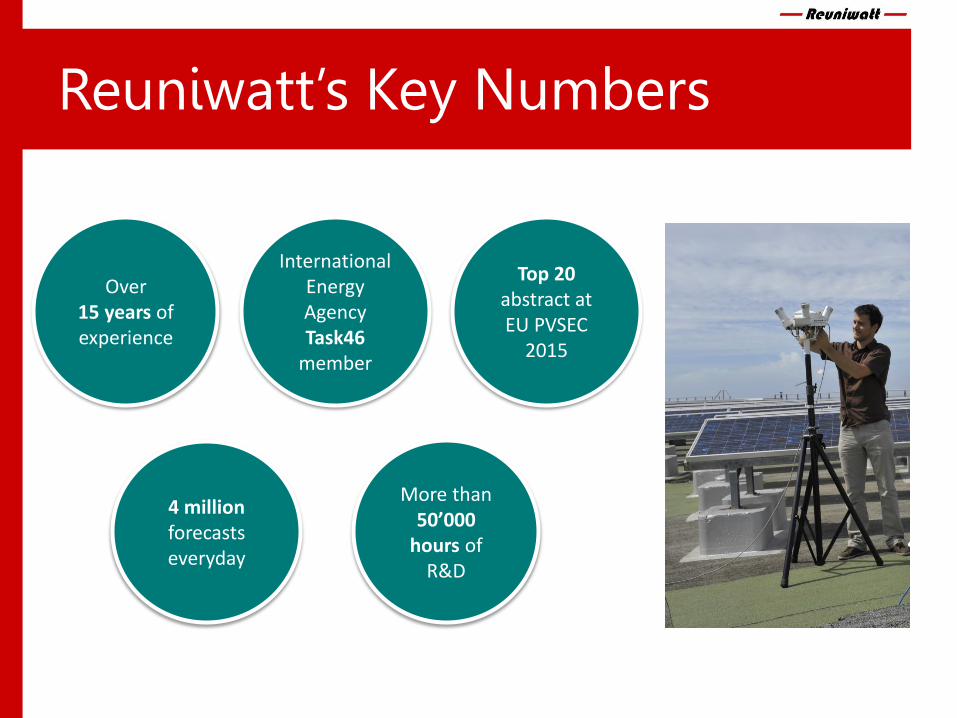
Reuniwatt’s Key Numbers
Over 15 years of experience
International Energy Agency Task46
member
Top 20 abstract at EU PVSEC
2015
4 million forecasts everyday
More than 50’000
hours of R&D
Solar Forecasting
18/05/2016 5
The intermittence of solar power
25/04/2016 6 solar power
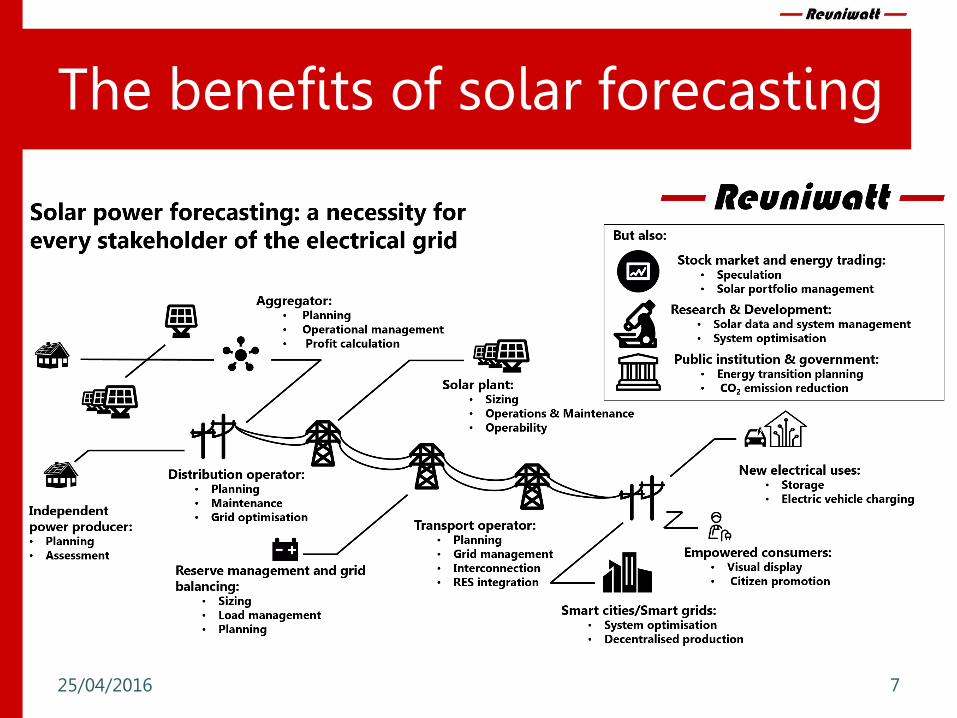
The benefits of solar forecasting
25/04/2016 7
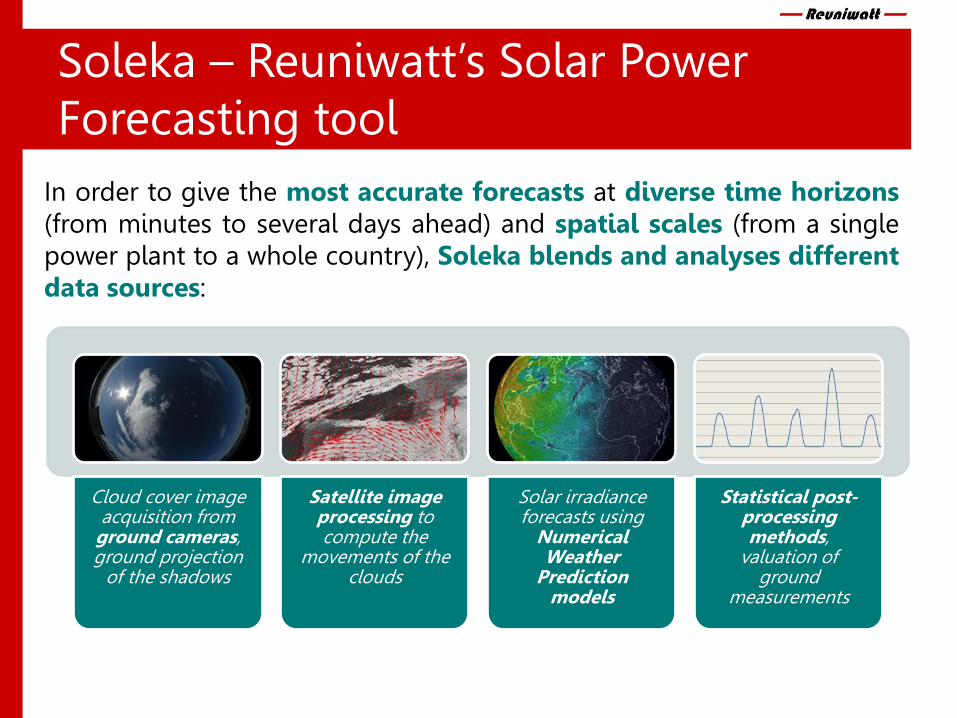
Soleka – Reuniwatt’s Solar Power Forecasting tool
Cloud cover image acquisition from
ground cameras, ground projection
of the shadows
Satellite image processing to compute the
movements of the clouds
Solar irradiance forecasts using
Numerical Weather
Prediction models
Statistical post-processing methods,
valuation of ground
measurements
In order to give the most accurate forecasts at diverse time horizons (from minutes to several days ahead) and spatial scales (from a single power plant to a whole country), Soleka blends and analyses different data sources:
Forecasting Use Cases
18/05/2016 9
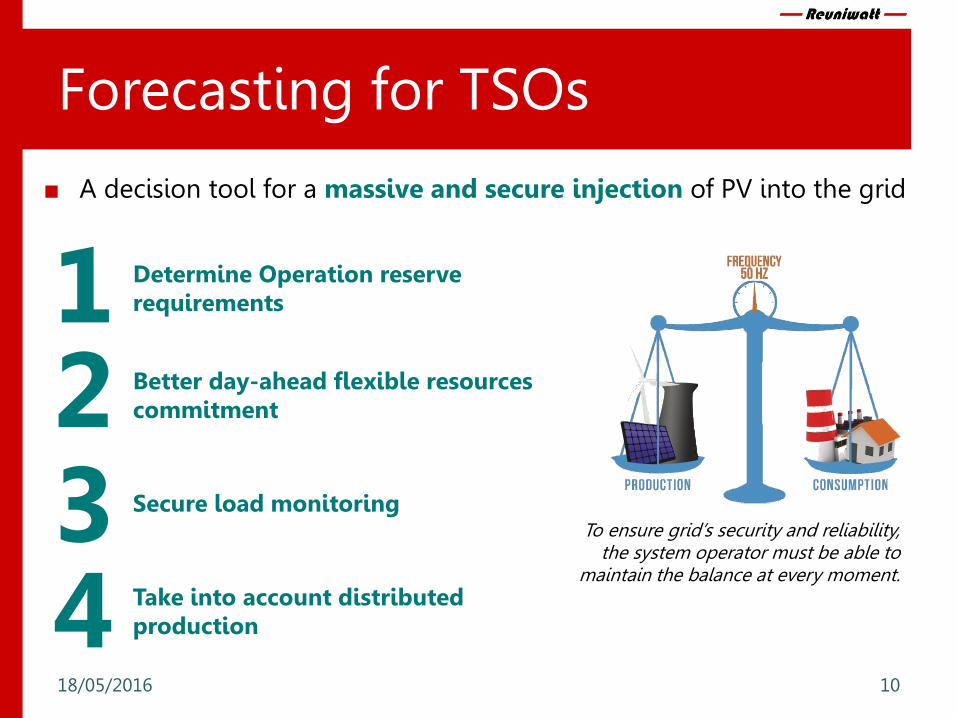
Forecasting for TSOs
■ A decision tool for a massive and secure injection of PV into the grid
18/05/2016 10
To ensure grid’s security and reliability, the system operator must be able to
maintain the balance at every moment.
3
Determine Operation reserve requirements
Better day-ahead flexible resources commitment
Secure load monitoring
Take into account distributed production
2 1
4
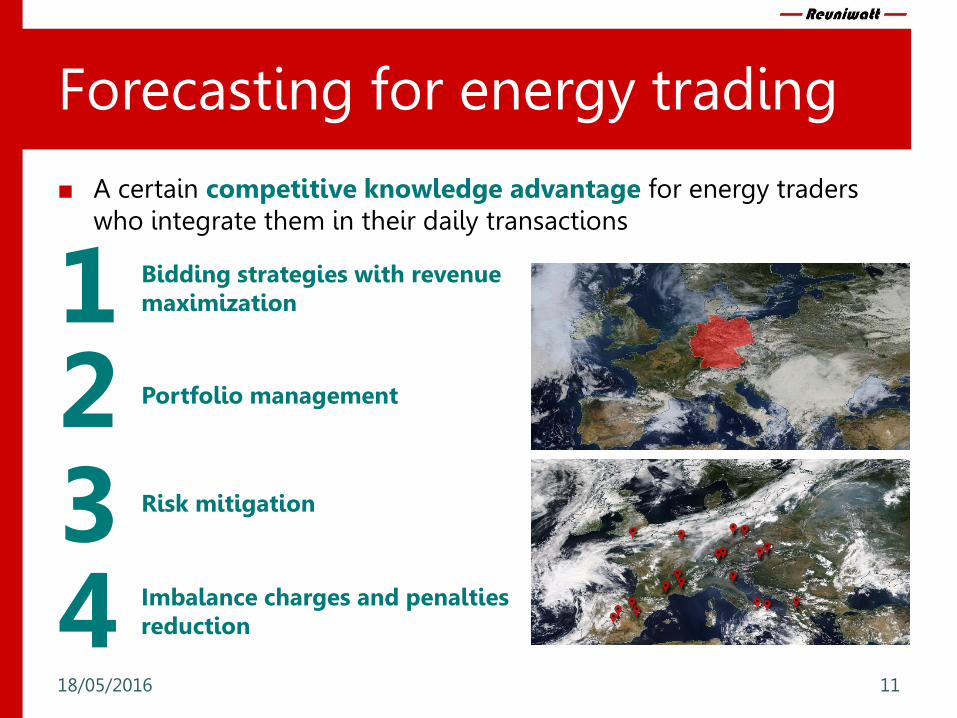
Forecasting for energy trading
■ A certain competitive knowledge advantage for energy traders who integrate them in their daily transactions
18/05/2016 11
3
Bidding strategies with revenue maximization
Portfolio management
Risk mitigation
Imbalance charges and penalties reduction
2 1
4
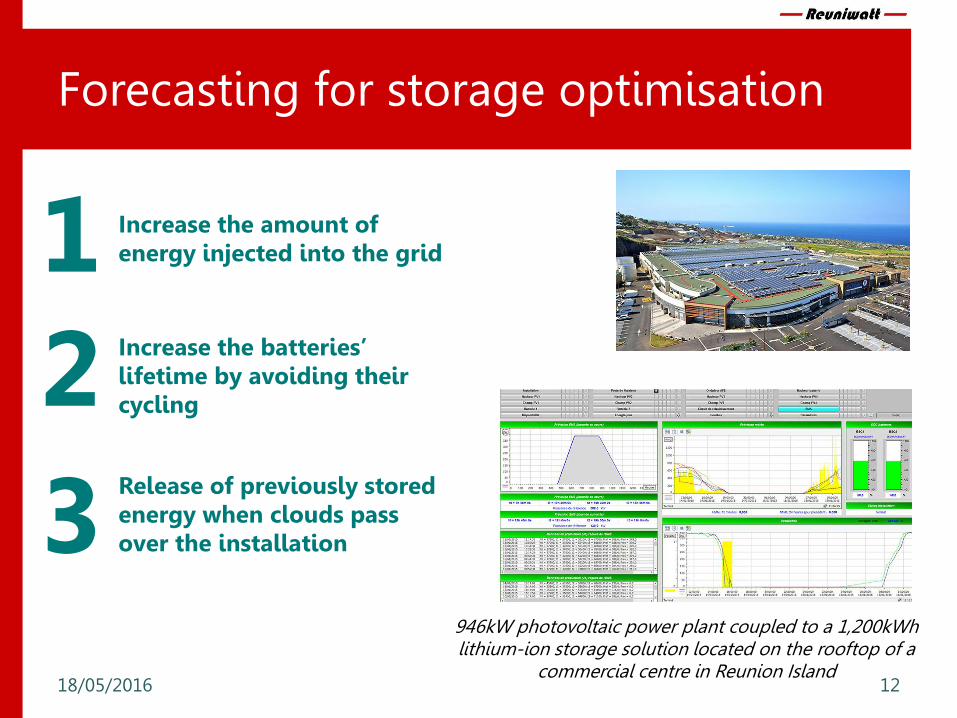
Forecasting for storage optimisation
18/05/2016 12
3
Increase the amount of energy injected into the grid
Increase the batteries’ lifetime by avoiding their cycling
Release of previously stored energy when clouds pass over the installation
2 1
946kW photovoltaic power plant coupled to a 1,200kWh lithium-ion storage solution located on the rooftop of a
commercial centre in Reunion Island
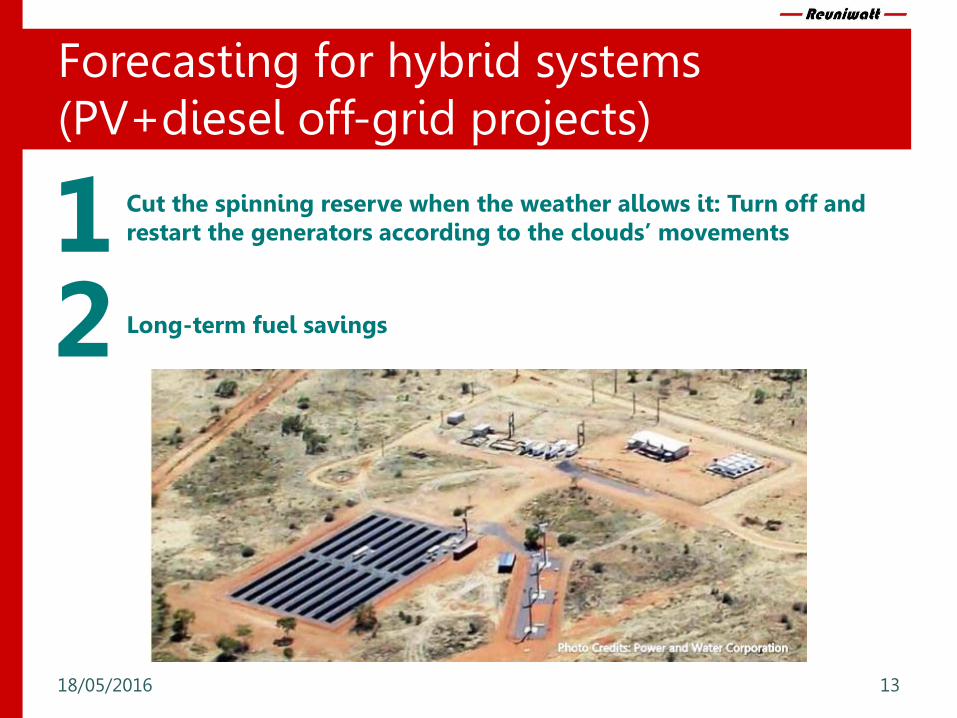
Forecasting for hybrid systems (PV+diesel off-grid projects)
18/05/2016 13
Cut the spinning reserve when the weather allows it: Turn off and restart the generators according to the clouds’ movements
Long-term fuel savings 2 1
They support us
Find more information on our website www.reuniwatt.com
18/05/2016 14
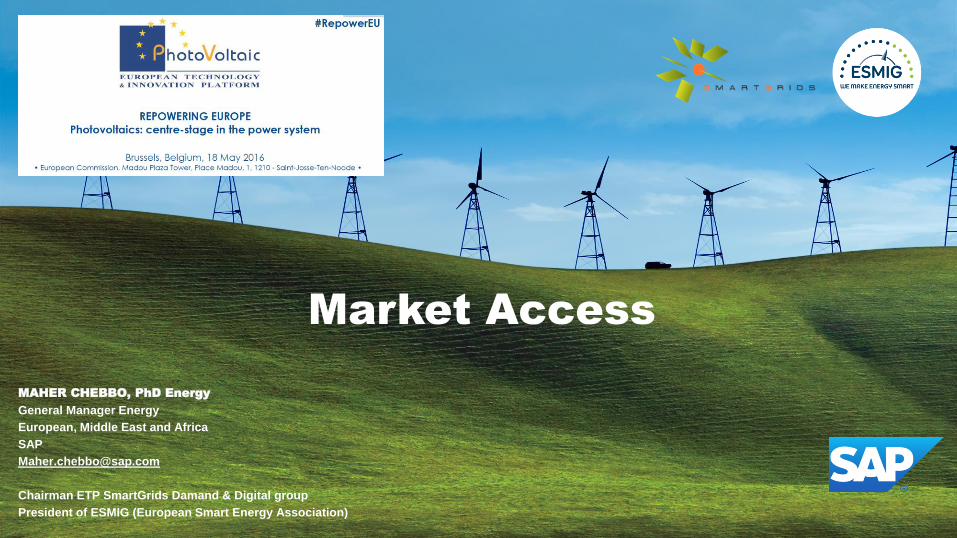
© 2015 SAP SE or an SAP affiliate company. All rights reserved. 1 Customer
Market Access
MAHER CHEBBO, PhD Energy
General Manager Energy
European, Middle East and Africa
SAP
Chairman ETP SmartGrids Damand & Digital group
President of ESMIG (European Smart Energy Association)
© 2015 SAP SE or an SAP affiliate company. All rights reserved. 2 Customer
3
Exchange
Platforms
1
Market
Trends
2
Market
Structure
4
Way
forward
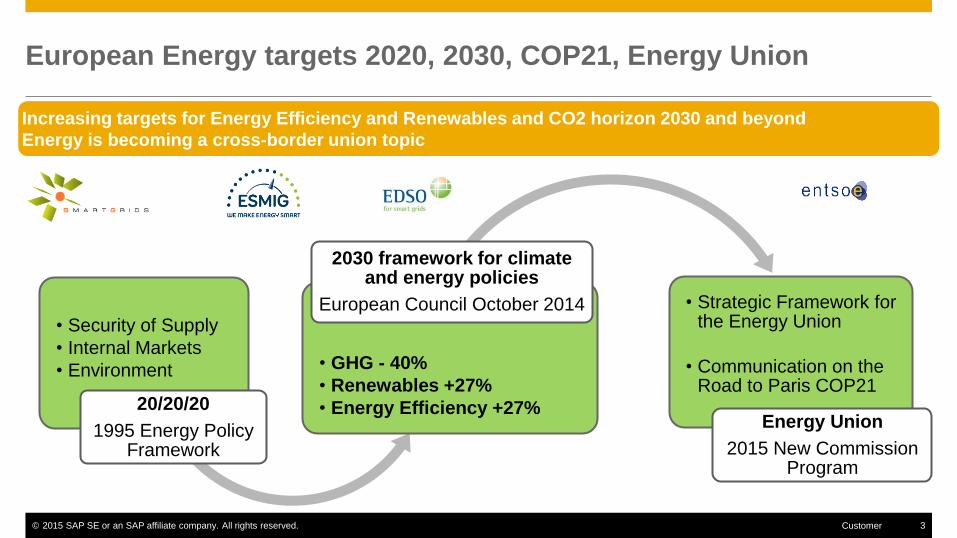
© 2015 SAP SE or an SAP affiliate company. All rights reserved. 3 Customer
European Energy targets 2020, 2030, COP21, Energy Union
• Security of Supply
• Internal Markets
• Environment
20/20/20
1995 Energy Policy Framework
• GHG - 40%
• Renewables +27%
• Energy Efficiency +27%
2030 framework for climate and energy policies
European Council October 2014 • Strategic Framework for the Energy Union
• Communication on the Road to Paris COP21
Energy Union
2015 New Commission Program
Increasing targets for Energy Efficiency and Renewables and CO2 horizon 2030 and beyond
Energy is becoming a cross-border union topic
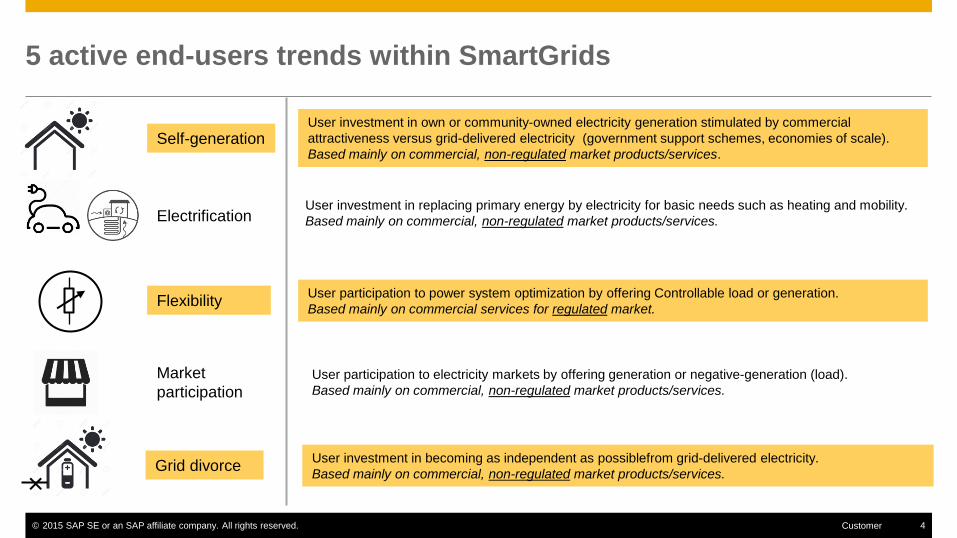
© 2015 SAP SE or an SAP affiliate company. All rights reserved. 4 Customer
5 active end-users trends within SmartGrids
Self-generation
Electrification
Flexibility
Market
participation
Grid divorce
User investment in own or community-owned electricity generation stimulated by commercial
attractiveness versus grid-delivered electricity (government support schemes, economies of scale).
Based mainly on commercial, non-regulated market products/services.
User investment in replacing primary energy by electricity for basic needs such as heating and mobility.
Based mainly on commercial, non-regulated market products/services.
User participation to power system optimization by offering Controllable load or generation.
Based mainly on commercial services for regulated market.
User participation to electricity markets by offering generation or negative-generation (load).
Based mainly on commercial, non-regulated market products/services.
User investment in becoming as independent as possiblefrom grid-delivered electricity.
Based mainly on commercial, non-regulated market products/services. ×
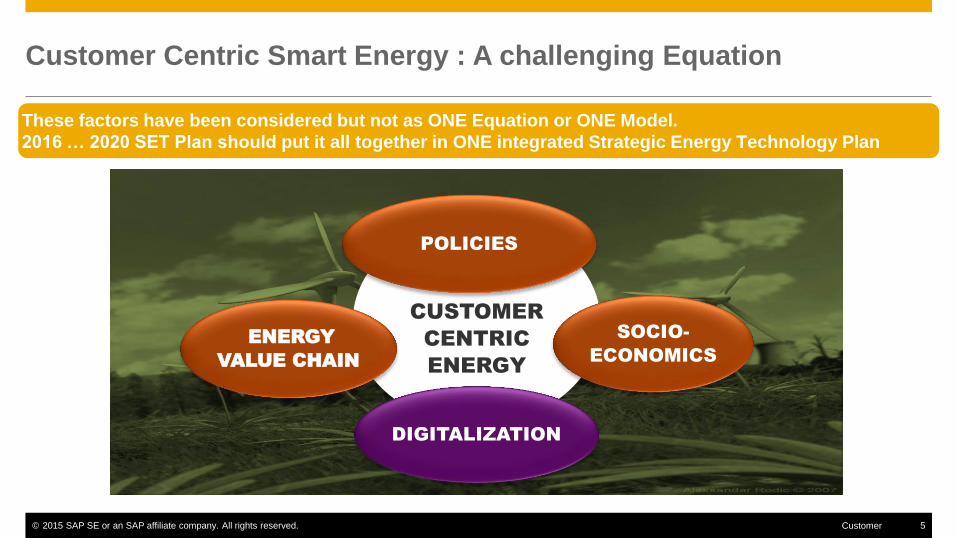
© 2015 SAP SE or an SAP affiliate company. All rights reserved. 5 Customer
Customer Centric Smart Energy : A challenging Equation
These factors have been considered but not as ONE Equation or ONE Model.
2016 … 2020 SET Plan should put it all together in ONE integrated Strategic Energy Technology Plan
CUSTOMER
CENTRIC
ENERGY
POLICIES
SOCIO-
ECONOMICS
DIGITALIZATION
ENERGY
VALUE CHAIN
© 2015 SAP SE or an SAP affiliate company. All rights reserved. 6 Customer
As a well-informed consumer is crucial to achieve our goals,
ESMIG and EDSO for Smart Grids have developed a consumer
information portal,
www.My-Smart-Energy.eu.
6
My Smart Energy Portal for European Consumers
© 2015 SAP SE or an SAP affiliate company. All rights reserved. 7 Customer
3
Exchange
Platforms
1
Market
Trends
2
Market
Structure
4
Way
forward
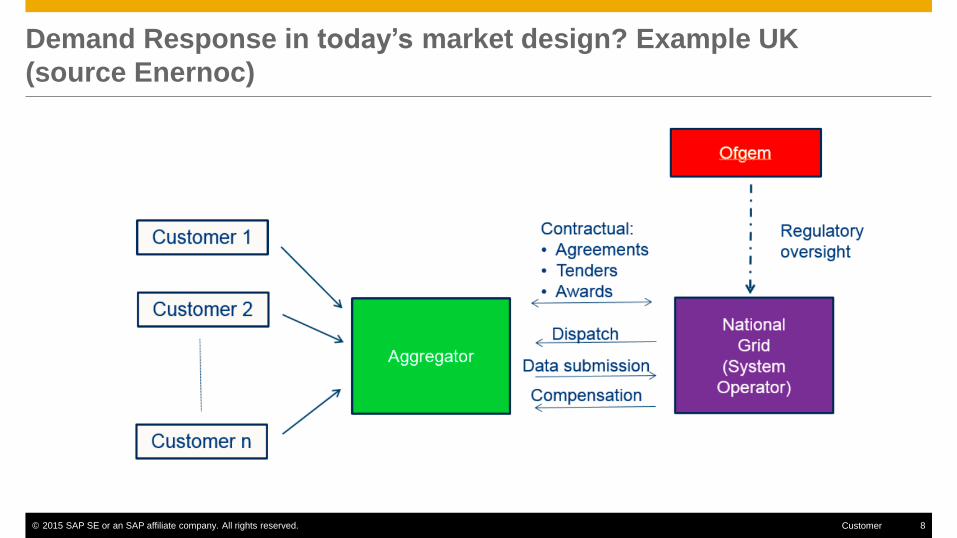
© 2015 SAP SE or an SAP affiliate company. All rights reserved. 8 Customer
Demand Response in today’s market design? Example UK
(source Enernoc)
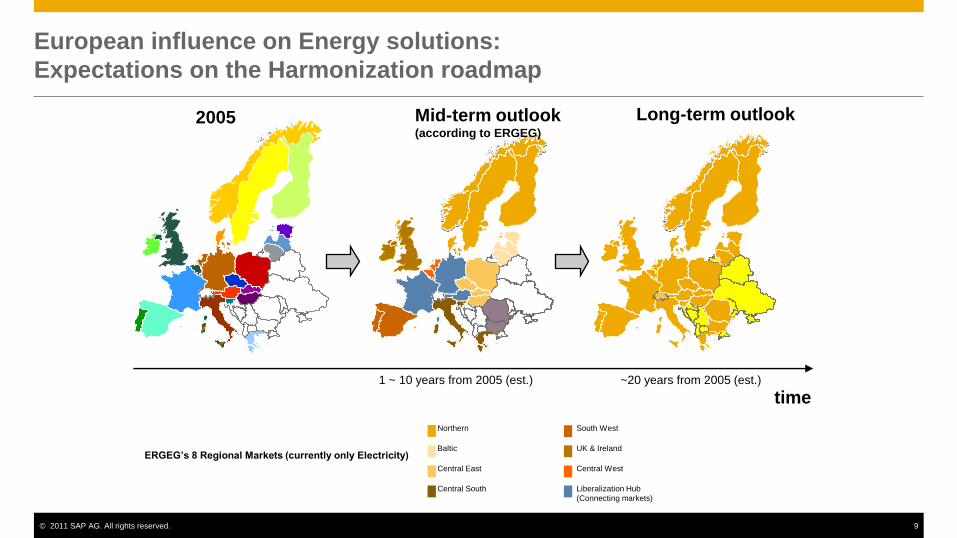
© 2011 SAP AG. All rights reserved. 9
European influence on Energy solutions:
Expectations on the Harmonization roadmap
Central South Liberalization Hub
(Connecting markets)
Central East Central West
Baltic UK & Ireland
Northern South West
ERGEG’s 8 Regional Markets (currently only Electricity)
time
2005 Mid-term outlook (according to ERGEG)
1 ~ 10 years from 2005 (est.)
Long-term outlook
~20 years from 2005 (est.)
© 2011 SAP AG. All rights reserved. 10
Strong forces challenge the century old business model of Utilities
DE-CARBONIZATION DE-REGULATION
§§
DE-CENTRALIZATION DIGITIZATION
Climate and Energy regulations
change faster than traditional
business models and business
operations can adjust...
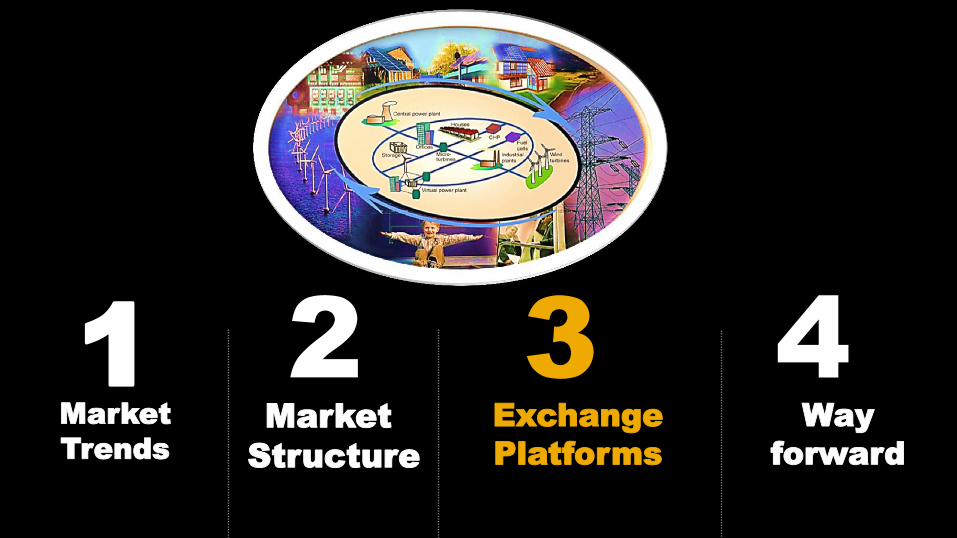
© 2011 SAP AG. All rights reserved. 11
3
Exchange
Platforms
1
Market
Trends
2
Market
Structure
4
Way
forward
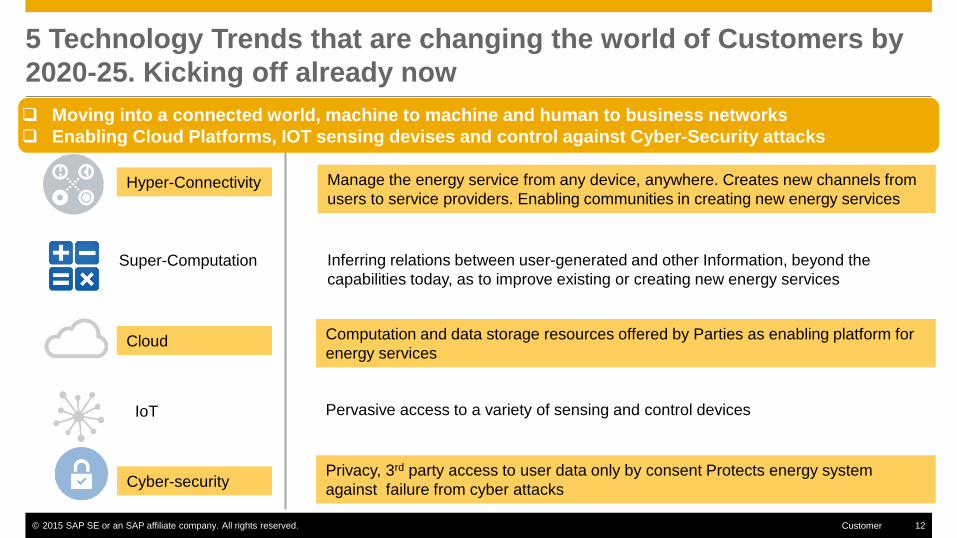
© 2015 SAP SE or an SAP affiliate company. All rights reserved. 12 Customer
5 Technology Trends that are changing the world of Customers by
2020-25. Kicking off already now
Hyper-Connectivity
Super-Computation
Cloud
IoT
Cyber-security
Manage the energy service from any device, anywhere. Creates new channels from
users to service providers. Enabling communities in creating new energy services
Pervasive access to a variety of sensing and control devices
Computation and data storage resources offered by Parties as enabling platform for
energy services
Privacy, 3rd party access to user data only by consent Protects energy system
against failure from cyber attacks
Inferring relations between user-generated and other Information, beyond the
capabilities today, as to improve existing or creating new energy services
Moving into a connected world, machine to machine and human to business networks
Enabling Cloud Platforms, IOT sensing devises and control against Cyber-Security attacks
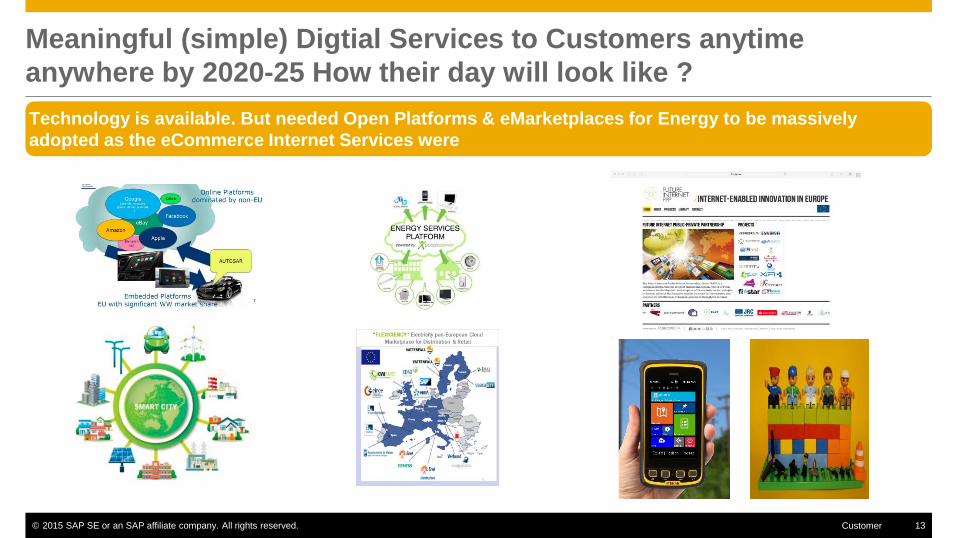
© 2015 SAP SE or an SAP affiliate company. All rights reserved. 13 Customer
Meaningful (simple) Digtial Services to Customers anytime
anywhere by 2020-25 How their day will look like ?
Technology is available. But needed Open Platforms & eMarketplaces for Energy to be massively
adopted as the eCommerce Internet Services were
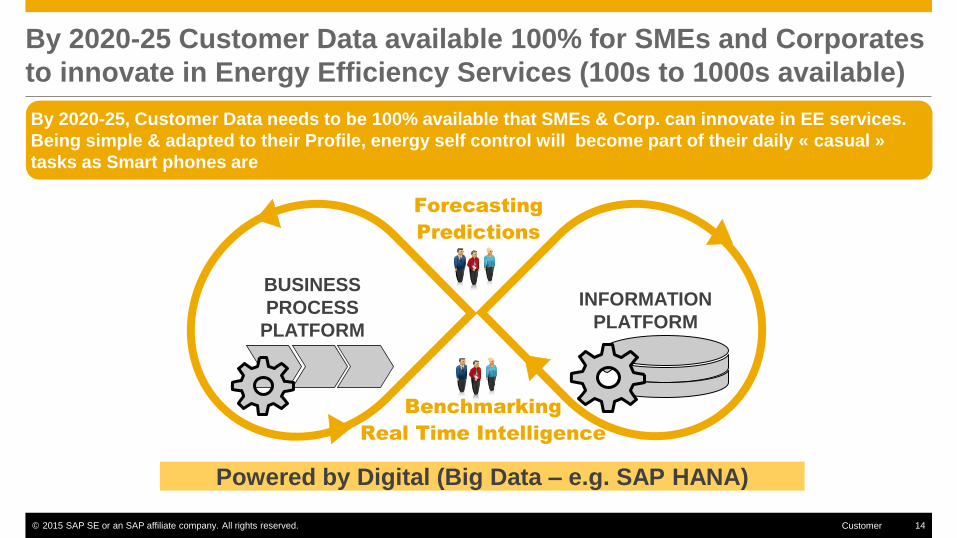
© 2015 SAP SE or an SAP affiliate company. All rights reserved. 14 Customer
By 2020-25 Customer Data available 100% for SMEs and Corporates
to innovate in Energy Efficiency Services (100s to 1000s available)
BUSINESS
PROCESS
PLATFORM
Forecasting
Predictions
Benchmarking
Real Time Intelligence
INFORMATION
PLATFORM
Powered by Digital (Big Data – e.g. SAP HANA)
By 2020-25, Customer Data needs to be 100% available that SMEs & Corp. can innovate in EE services.
Being simple & adapted to their Profile, energy self control will become part of their daily « casual »
tasks as Smart phones are
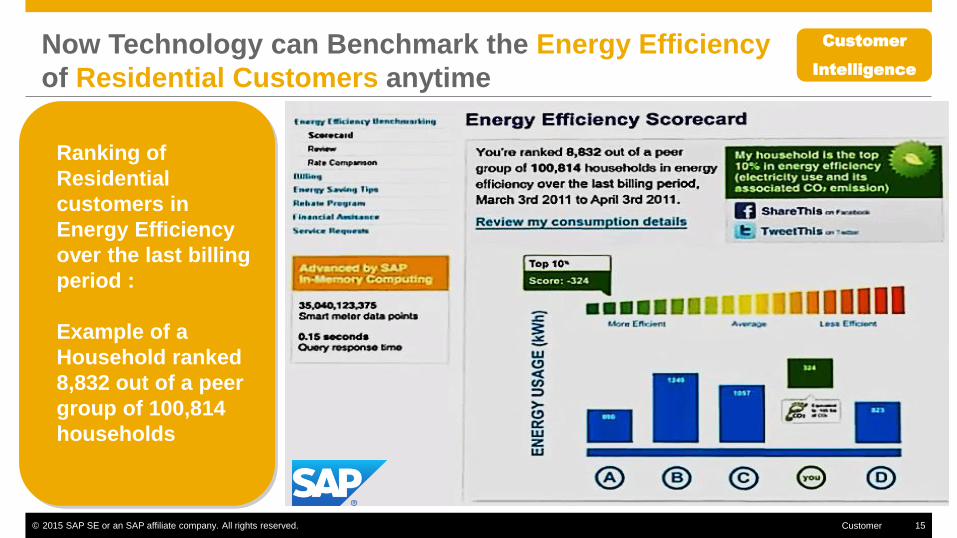
© 2015 SAP SE or an SAP affiliate company. All rights reserved. 15 Customer
Now Technology can Benchmark the Energy Efficiency
of Residential Customers anytime
Ranking of
Residential
customers in
Energy Efficiency
over the last billing
period :
Example of a
Household ranked
8,832 out of a peer
group of 100,814
households
Customer
Intelligence
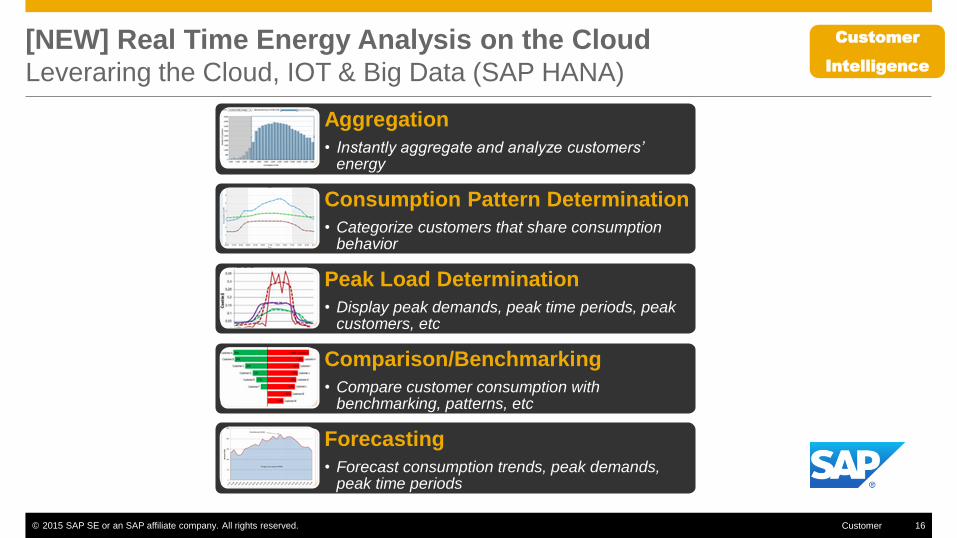
© 2015 SAP SE or an SAP affiliate company. All rights reserved. 16 Customer
Aggregation
• Instantly aggregate and analyze customers’ energy
Consumption Pattern Determination
• Categorize customers that share consumption behavior
Peak Load Determination
• Display peak demands, peak time periods, peak customers, etc
Comparison/Benchmarking
• Compare customer consumption with benchmarking, patterns, etc
Forecasting
• Forecast consumption trends, peak demands, peak time periods
[NEW] Real Time Energy Analysis on the Cloud Leveraring the Cloud, IOT & Big Data (SAP HANA)
Customer
Intelligence
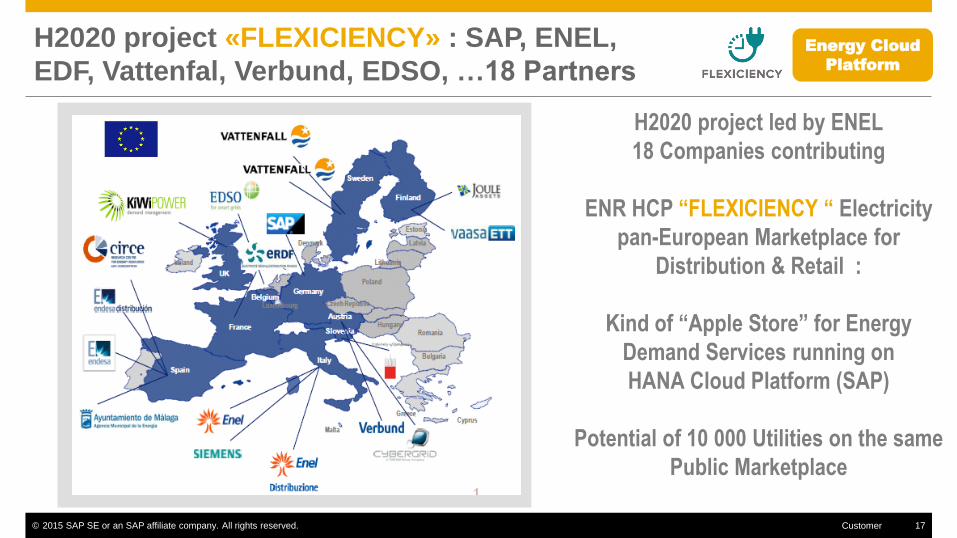
© 2015 SAP SE or an SAP affiliate company. All rights reserved. 17 Customer
H2020 project «FLEXICIENCY» : SAP, ENEL,
EDF, Vattenfal, Verbund, EDSO, …18 Partners
H2020 project led by ENEL
18 Companies contributing
ENR HCP “FLEXICIENCY “ Electricity
pan-European Marketplace for
Distribution & Retail :
Kind of “Apple Store” for Energy
Demand Services running on
HANA Cloud Platform (SAP)
Potential of 10 000 Utilities on the same
Public Marketplace
Energy Cloud
Platform
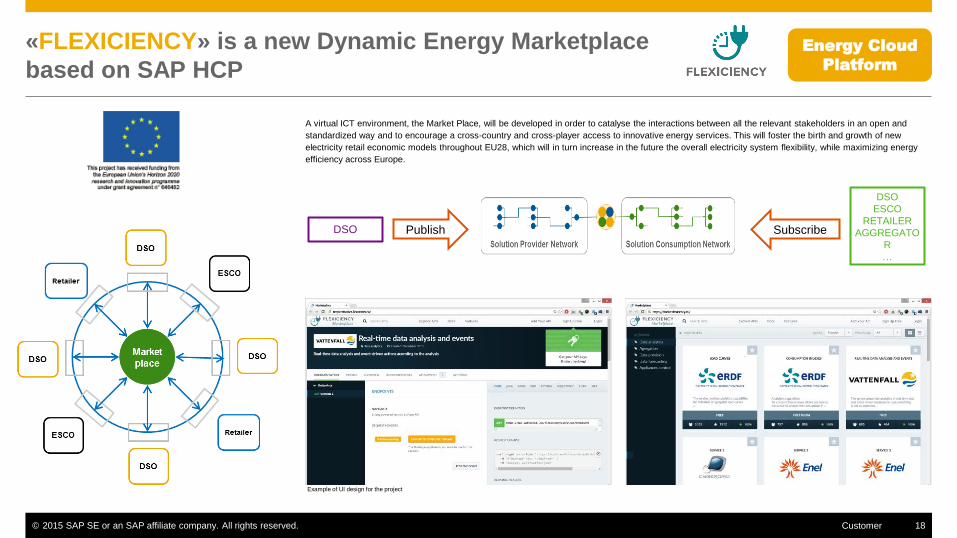
© 2015 SAP SE or an SAP affiliate company. All rights reserved. 18 Customer
«FLEXICIENCY» is a new Dynamic Energy Marketplace
based on SAP HCP
Publish Subscribe
DSO
ESCO
RETAILER
AGGREGATO
R
…
DSO
A virtual ICT environment, the Market Place, will be developed in order to catalyse the interactions between all the relevant stakeholders in an open and
standardized way and to encourage a cross-country and cross-player access to innovative energy services. This will foster the birth and growth of new
electricity retail economic models throughout EU28, which will in turn increase in the future the overall electricity system flexibility, while maximizing energy
efficiency across Europe.
Example of UI design for the project
Energy Cloud
Platform
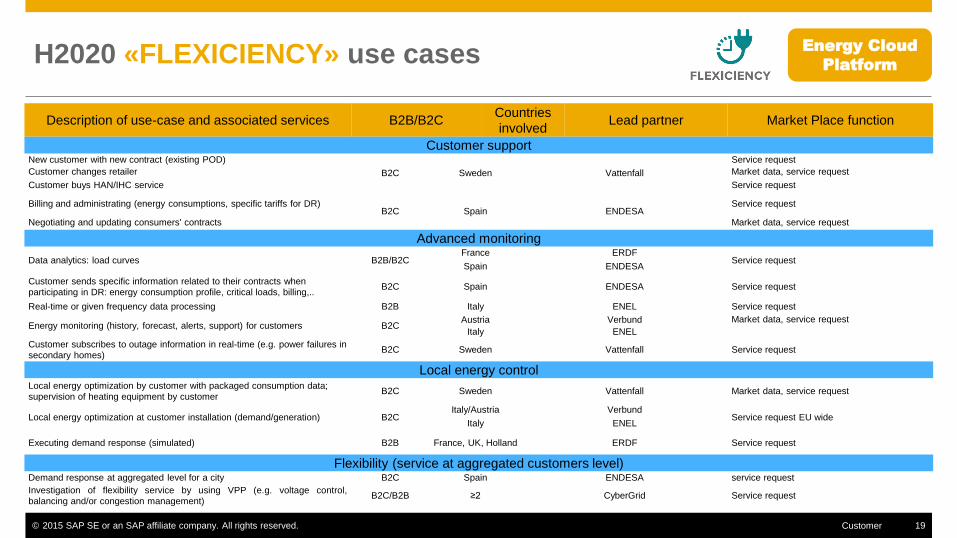
© 2015 SAP SE or an SAP affiliate company. All rights reserved. 19 Customer
H2020 «FLEXICIENCY» use cases
Description of use-case and associated services B2B/B2C Countries
involved Lead partner Market Place function
Customer support New customer with new contract (existing POD)
B2C Sweden Vattenfall
Service request
Customer changes retailer Market data, service request
Customer buys HAN/IHC service Service request
Billing and administrating (energy consumptions, specific tariffs for DR) B2C Spain ENDESA
Service request
Negotiating and updating consumers' contracts Market data, service request
Advanced monitoring
Data analytics: load curves B2B/B2C France ERDF
Service request Spain ENDESA
Customer sends specific information related to their contracts when participating in DR: energy consumption profile, critical loads, billing,..
B2C Spain ENDESA Service request
Real-time or given frequency data processing B2B Italy ENEL Service request
Energy monitoring (history, forecast, alerts, support) for customers B2C Austria Verbund Market data, service request
Italy ENEL
Customer subscribes to outage information in real-time (e.g. power failures in secondary homes)
B2C Sweden Vattenfall Service request
Local energy control Local energy optimization by customer with packaged consumption data;
supervision of heating equipment by customer B2C Sweden Vattenfall Market data, service request
Local energy optimization at customer installation (demand/generation) B2C Italy/Austria Verbund
Service request EU wide Italy ENEL
Executing demand response (simulated) B2B France, UK, Holland ERDF Service request
Flexibility (service at aggregated customers level) Demand response at aggregated level for a city B2C Spain ENDESA service request
Investigation of flexibility service by using VPP (e.g. voltage control, balancing and/or congestion management)
B2C/B2B ≥2 CyberGrid Service request
Energy Cloud
Platform
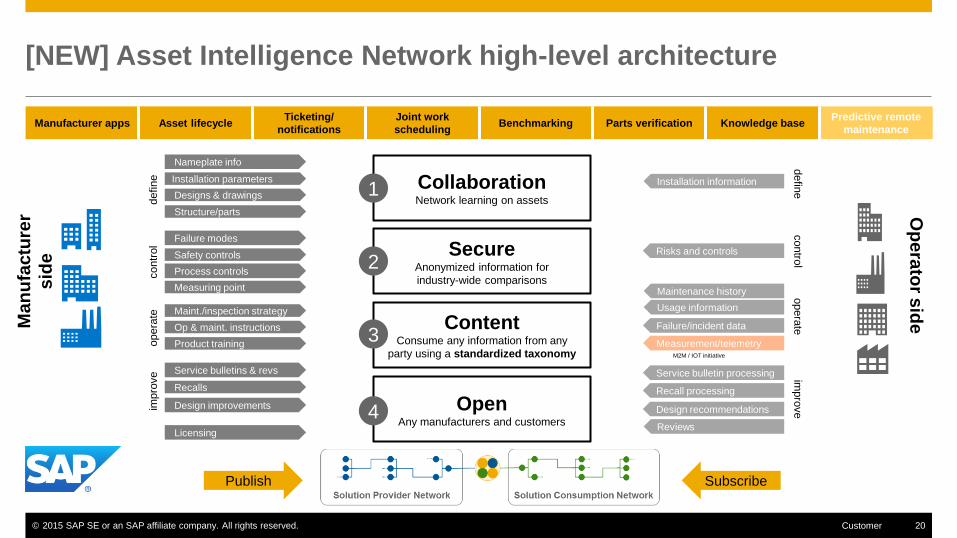
© 2015 SAP SE or an SAP affiliate company. All rights reserved. 20 Customer
[NEW] Asset Intelligence Network high-level architecture
Manufacturer apps Asset lifecycle Ticketing/
notifications
Joint work
scheduling Benchmarking Parts verification Knowledge base
Predictive remote
maintenance
Ma
nu
factu
rer
sid
e
Nameplate info
Service bulletins & revs
Maint./inspection strategy
Structure/parts
Recalls
Op & maint. instructions
Failure modes
Safety controls
Process controls
Designs & drawings
Measuring point
Product training
Licensing
Design improvements
Installation parameters
define
contr
ol
opera
te
impro
ve
Collaboration Network learning on assets
Secure Anonymized information for
industry-wide comparisons
Content Consume any information from any
party using a standardized taxonomy
Open Any manufacturers and customers
1
2
3
4
Publish Subscribe
Measurement/telemetry
Usage information
Installation information
Failure/incident data
Service bulletin processing
Risks and controls
Design recommendations
Recall processing
M2M / IOT initiative
Maintenance history
defin
e
contro
l opera
te
impro
ve
Reviews
Op
era
tor s
ide
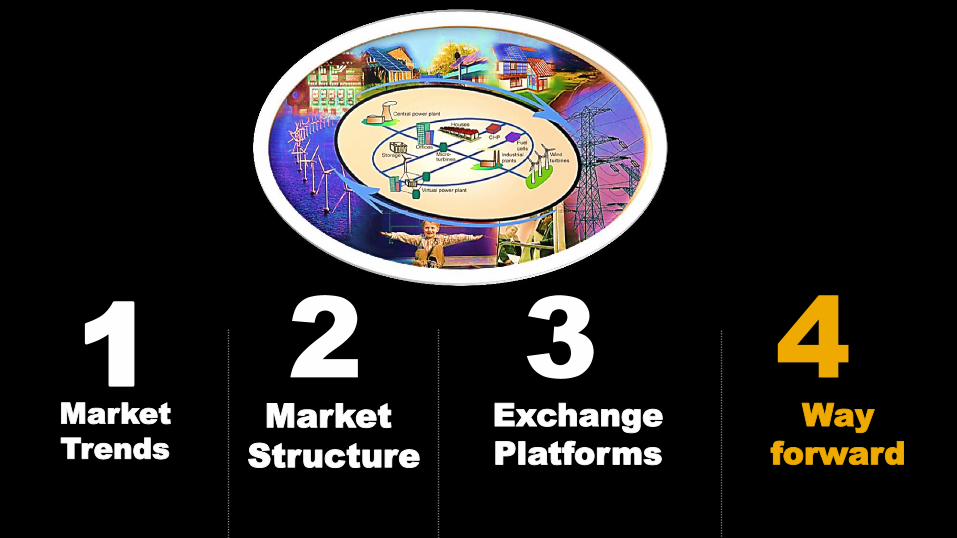
© 2015 SAP SE or an SAP affiliate company. All rights reserved. 21 Customer
3
Exchange
Platforms
1
Market
Trends
2
Market
Structure
4
Way
forward
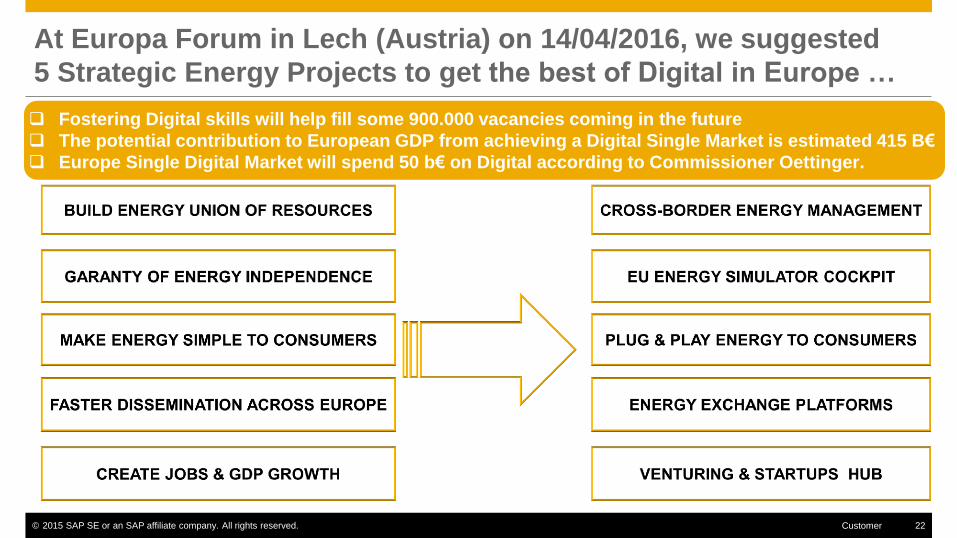
© 2015 SAP SE or an SAP affiliate company. All rights reserved. 22 Customer
At Europa Forum in Lech (Austria) on 14/04/2016, we suggested
5 Strategic Energy Projects to get the best of Digital in Europe …
Fostering Digital skills will help fill some 900.000 vacancies coming in the future
The potential contribution to European GDP from achieving a Digital Single Market is estimated 415 B€
Europe Single Digital Market will spend 50 b€ on Digital according to Commissioner Oettinger.
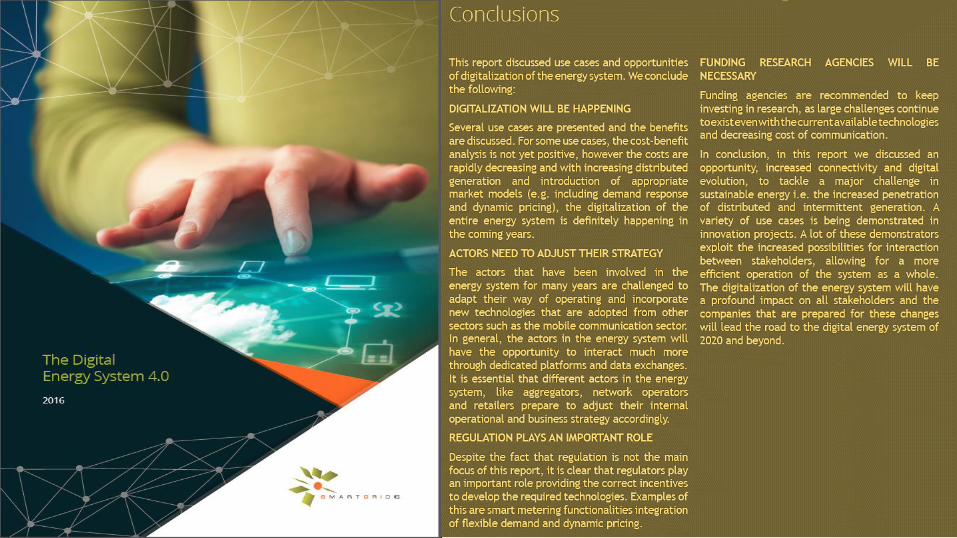
© 2015 SAP SE or an SAP affiliate company. All rights reserved. 23 Customer
© 2015 SAP SE or an SAP affiliate company. All rights reserved. 24 Customer
© 2015 SAP SE or an SAP affiliate company. All rights reserved.
No part of this publication may be reproduced or transmitted in any form or for any purpose without the express permission of SAP SE or an SAP affiliate company.
SAP and other SAP products and services mentioned herein as well as their respective logos are trademarks or registered trademarks of SAP SE (or an SAP affiliate
company) in Germany and other countries. Please see http://global12.sap.com/corporate-en/legal/copyright/index.epx for additional trademark information and notices.
Some software products marketed by SAP SE and its distributors contain proprietary software components of other software vendors.
National product specifications may vary.
These materials are provided by SAP SE or an SAP affiliate company for informational purposes only, without representation or warranty of any kind, and SAP SE or its
affiliated companies shall not be liable for errors or omissions with respect to the materials. The only warranties for SAP SE or SAP affiliate company products and
services are those that are set forth in the express warranty statements accompanying such products and services, if any. Nothing herein should be construed as
constituting an additional warranty.
In particular, SAP SE or its affiliated companies have no obligation to pursue any course of business outlined in this document or any related presentation, or to develop
or release any functionality mentioned therein. This document, or any related presentation, and SAP SE’s or its affiliated companies’ strategy and possible future
developments, products, and/or platform directions and functionality are all subject to change and may be changed by SAP SE or its affiliated companies at any time
for any reason without notice. The information in this document is not a commitment, promise, or legal obligation to deliver any material, code, or functionality. All forward-
looking statements are subject to various risks and uncertainties that could cause actual results to differ materially from expectations. Readers are cautioned not to place
undue reliance on these forward-looking statements, which speak only as of their dates, and they should not be relied upon in making purchasing decisions.
Changing roles: new business models for utilities
Repowering Europe – Photovoltaics: centre-stage in the power system 18 May 2016, Brussels
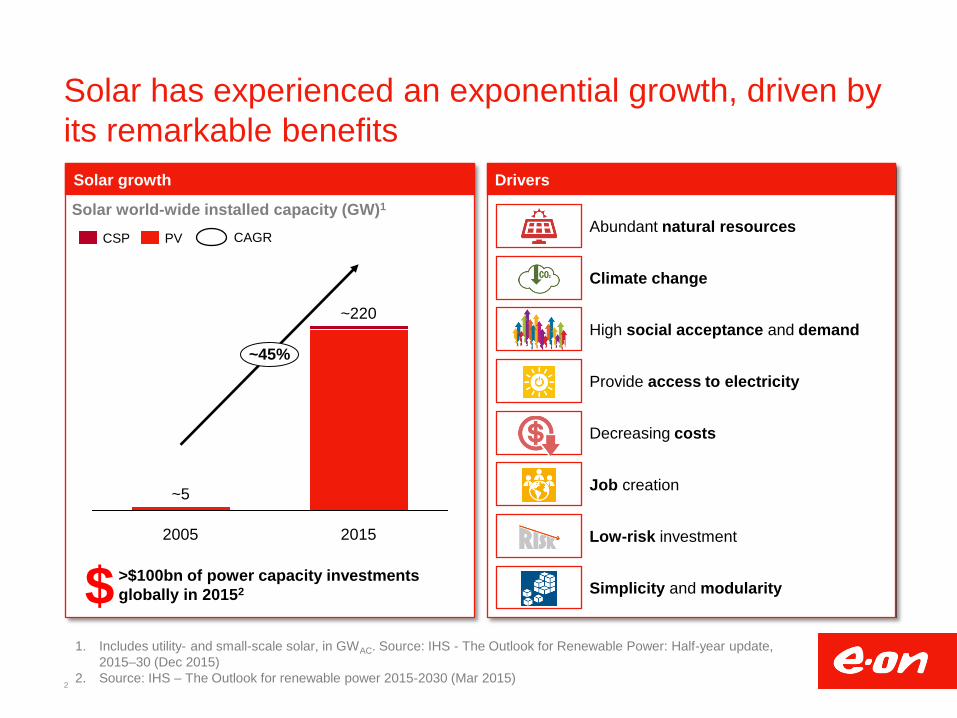
Solar has experienced an exponential growth, driven by
its remarkable benefits
2
1. Includes utility- and small-scale solar, in GWAC. Source: IHS - The Outlook for Renewable Power: Half-year update,
2015–30 (Dec 2015)
2. Source: IHS – The Outlook for renewable power 2015-2030 (Mar 2015)
Solar growth Drivers
Solar world-wide installed capacity (GW)1
2005
~5
~45%
2015
~220
PV CSP CAGR
>$100bn of power capacity investments
globally in 20152 $
Abundant natural resources
Climate change
High social acceptance and demand
Provide access to electricity
Decreasing costs
Job creation
Low-risk investment
Simplicity and modularity
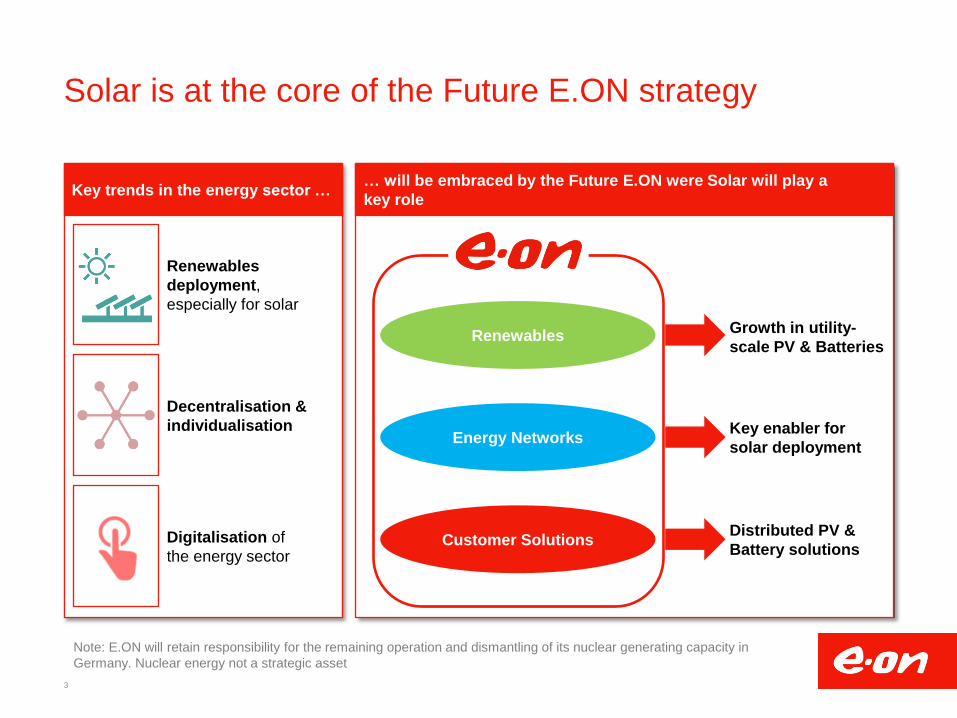
Solar is at the core of the Future E.ON strategy
3
Note: E.ON will retain responsibility for the remaining operation and dismantling of its nuclear generating capacity in
Germany. Nuclear energy not a strategic asset
Key trends in the energy sector … … will be embraced by the Future E.ON were Solar will play a
key role
Renewables
deployment,
especially for solar
Decentralisation &
individualisation
Digitalisation of
the energy sector
Renewables
Energy Networks
Customer Solutions
Growth in utility-
scale PV & Batteries
Key enabler for
solar deployment
Distributed PV &
Battery solutions
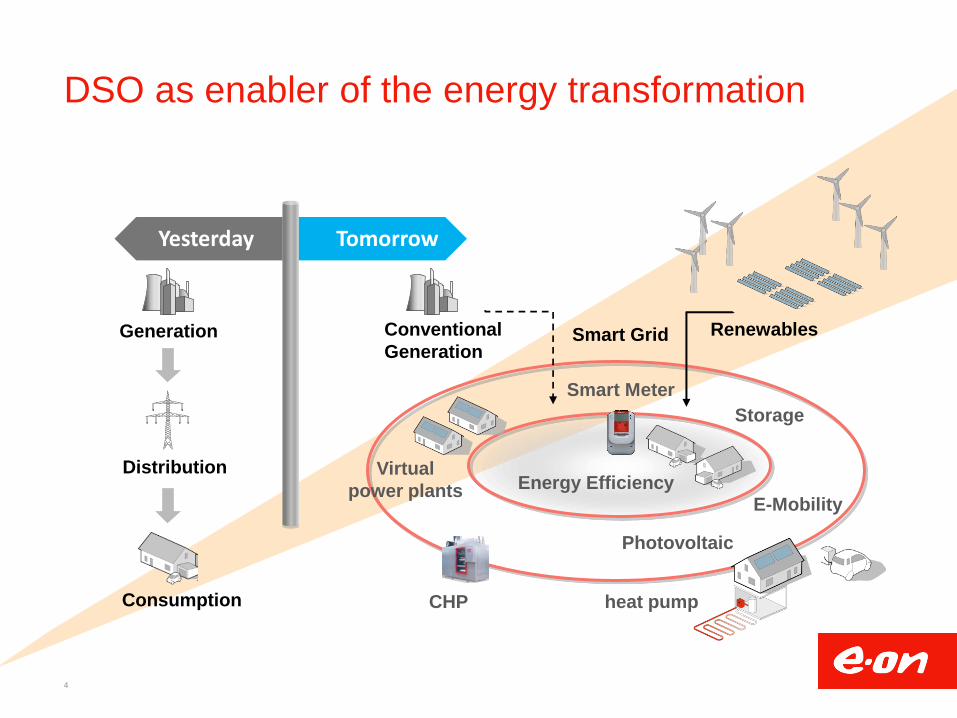
DSO as enabler of the energy transformation
4
Tomorrow Yesterday
Generation
Distribution
Consumption
Conventional
Generation
Renewables Smart Grid
Storage
Virtual
power plants
CHP
Photovoltaic
E-Mobility
Smart Meter
heat pump
Energy Efficiency
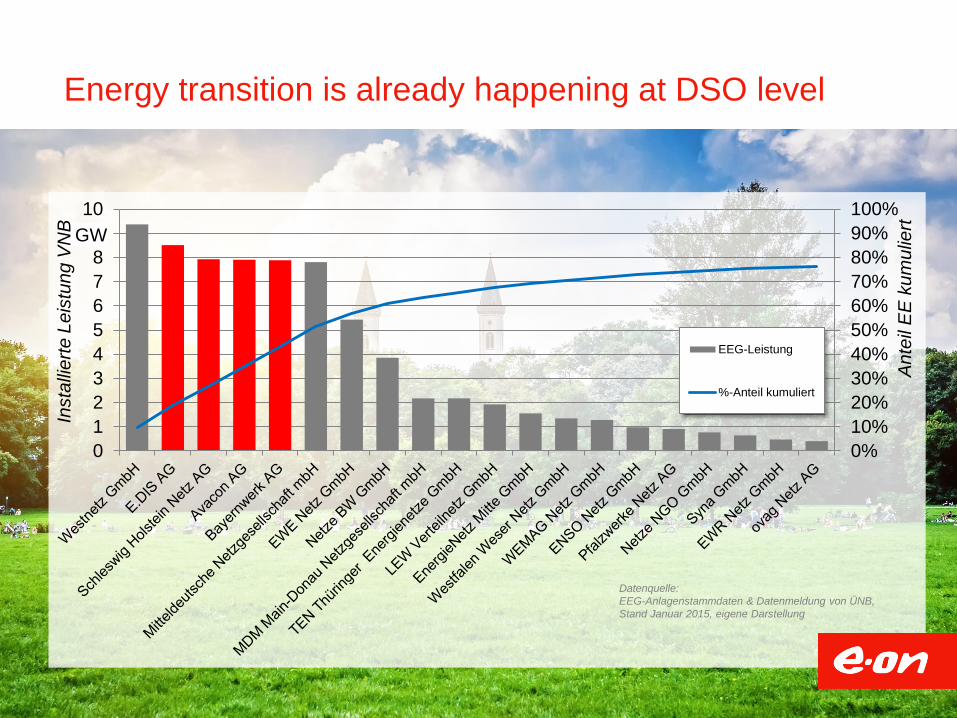
Energy transition is already happening at DSO level
0%
10%
20%
30%
40%
50%
60%
70%
80%
90%
100%
0
1
2
3
4
5
6
7
8
9
10
EEG-Leistung
%-Anteil kumuliert
An
teil
EE
ku
mu
liert
Datenquelle:
EEG-Anlagenstammdaten & Datenmeldung von ÜNB,
Stand Januar 2015, eigene Darstellung
GW
Insta
llie
rte L
eis
tun
g V
NB
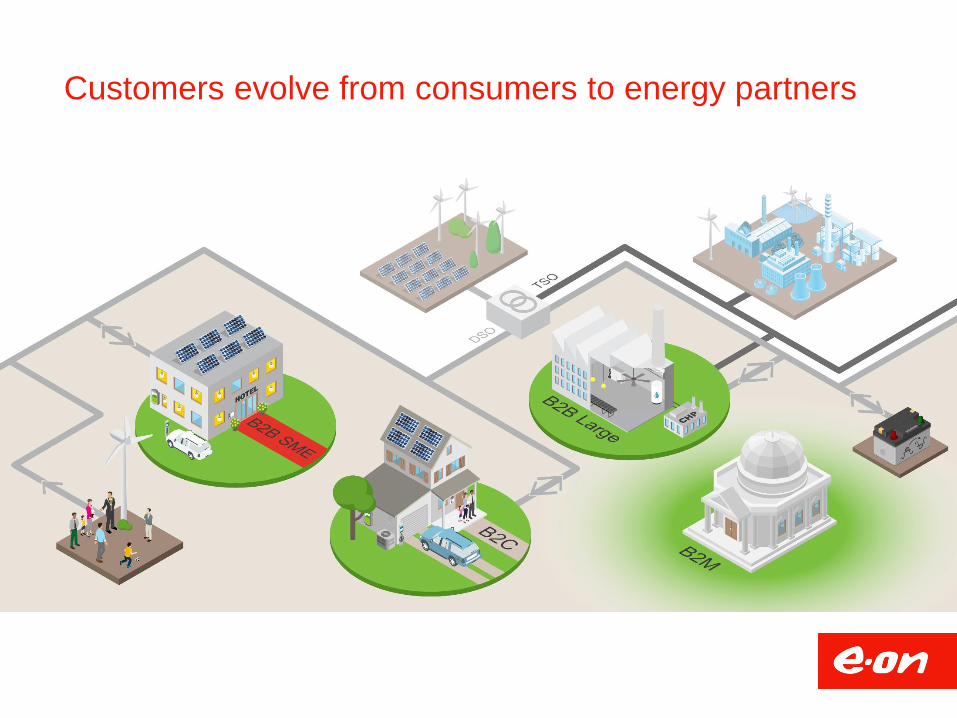
Customers evolve from consumers to energy partners
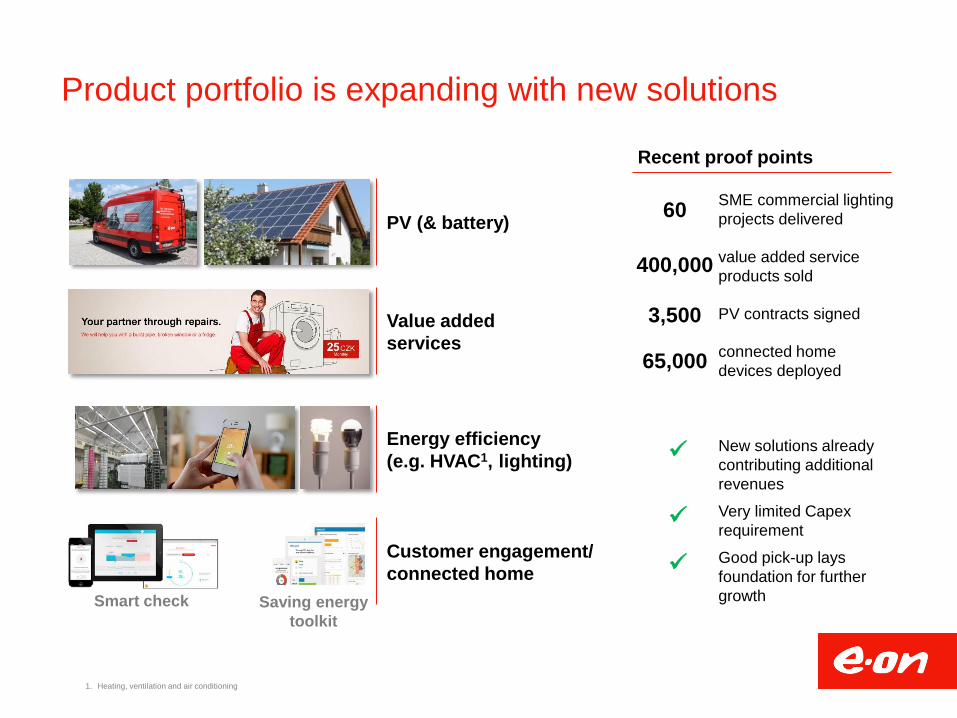
Product portfolio is expanding with new solutions
Recent proof points
1. Heating, ventilation and air conditioning
New solutions already
contributing additional
revenues
Very limited Capex
requirement
Good pick-up lays
foundation for further
growth
SME commercial lighting
projects delivered
value added service
products sold
PV contracts signed
connected home
devices deployed
400,000
65,000
60
3,500
PV (& battery)
Energy efficiency
(e.g. HVAC1, lighting)
Value added
services
Customer engagement/
connected home
Smart check Saving energy
toolkit
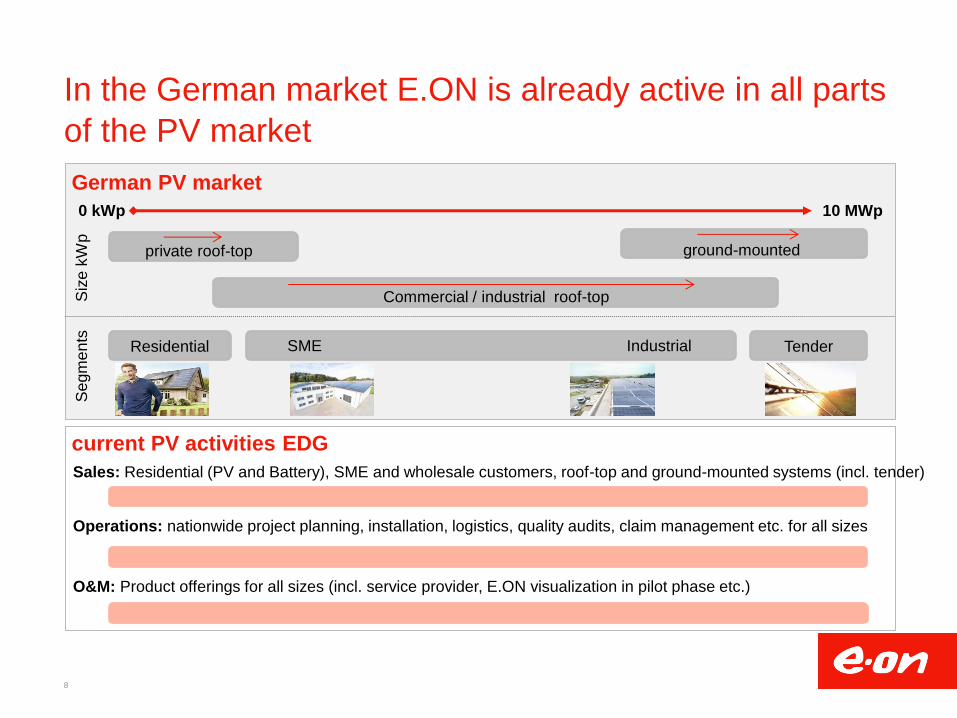
In the German market E.ON is already active in all parts
of the PV market
8
German PV market
current PV activities EDG
10 MWp
Sales: Residential (PV and Battery), SME and wholesale customers, roof-top and ground-mounted systems (incl. tender)
Operations: nationwide project planning, installation, logistics, quality audits, claim management etc. for all sizes
O&M: Product offerings for all sizes (incl. service provider, E.ON visualization in pilot phase etc.)
Siz
e k
Wp
Se
gm
en
ts
0 kWp
Residential Tender
private roof-top
SME Industrial
ground-mounted
Commercial / industrial roof-top
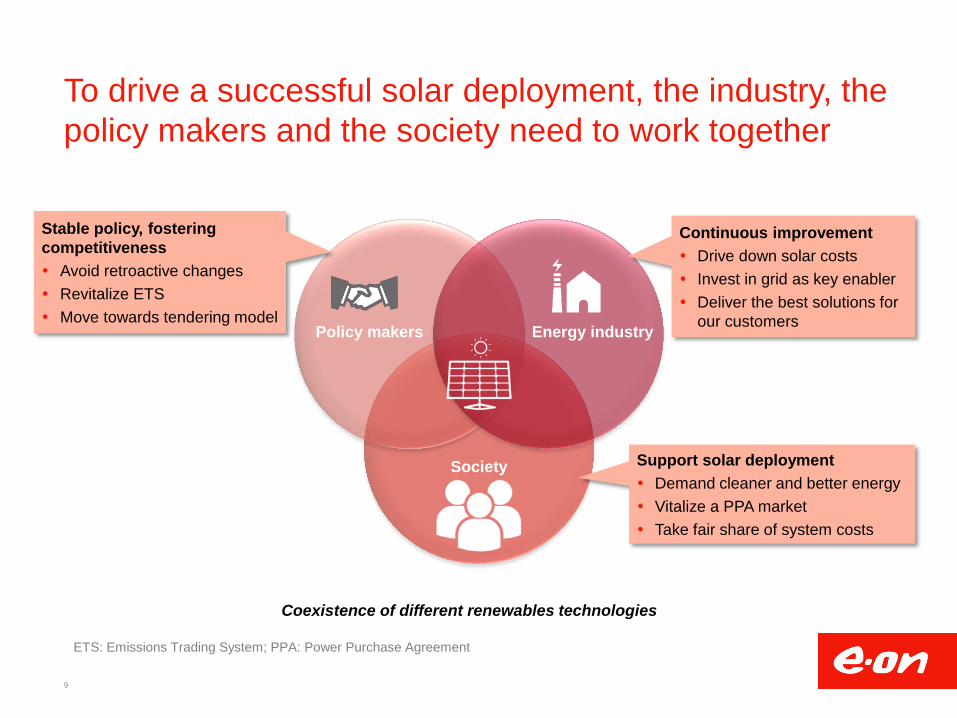
To drive a successful solar deployment, the industry, the
policy makers and the society need to work together
9
Coexistence of different renewables technologies
Policy makers Energy industry
Society
Continuous improvement
Drive down solar costs
Invest in grid as key enabler
Deliver the best solutions for
our customers
Stable policy, fostering
competitiveness
Avoid retroactive changes
Revitalize ETS
Move towards tendering model
Support solar deployment
Demand cleaner and better energy
Vitalize a PPA market
Take fair share of system costs
ETS: Emissions Trading System; PPA: Power Purchase Agreement

10
THANK YOU!
PV VALUE BEYOND ELECTRONS
James Watson, CEO, SolarPower Europe
Repowering Europe conference, 18 May 2016
2
SolarPower Europe
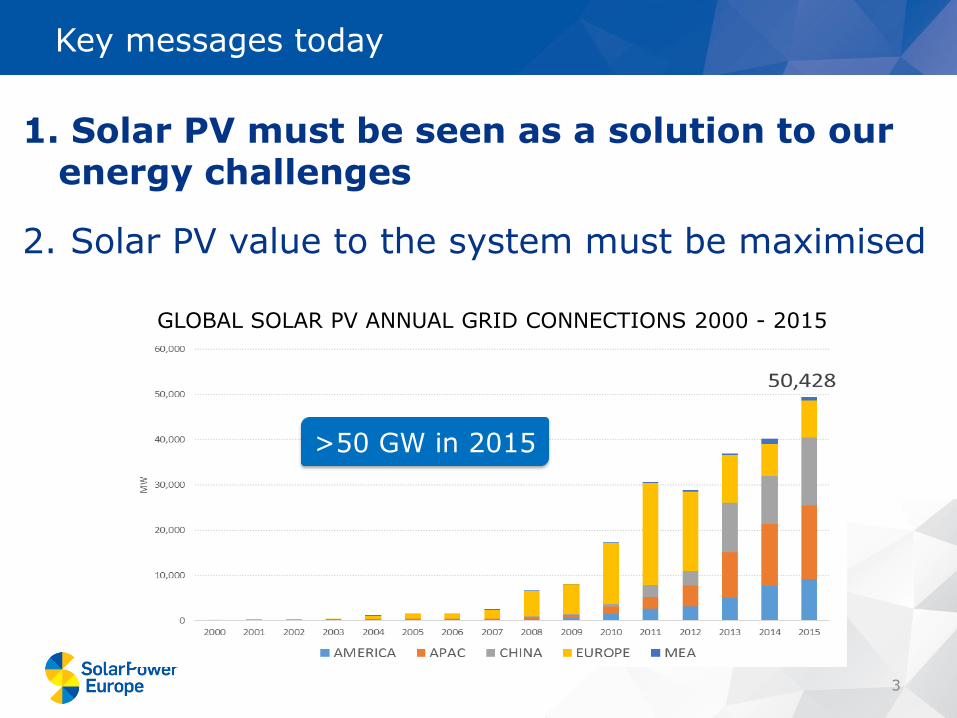
3
1. Solar PV must be seen as a solution to our energy challenges
2. Solar PV value to the system must be maximised
Key messages today
GLOBAL SOLAR PV ANNUAL GRID CONNECTIONS 2000 - 2015
>50 GW in 2015
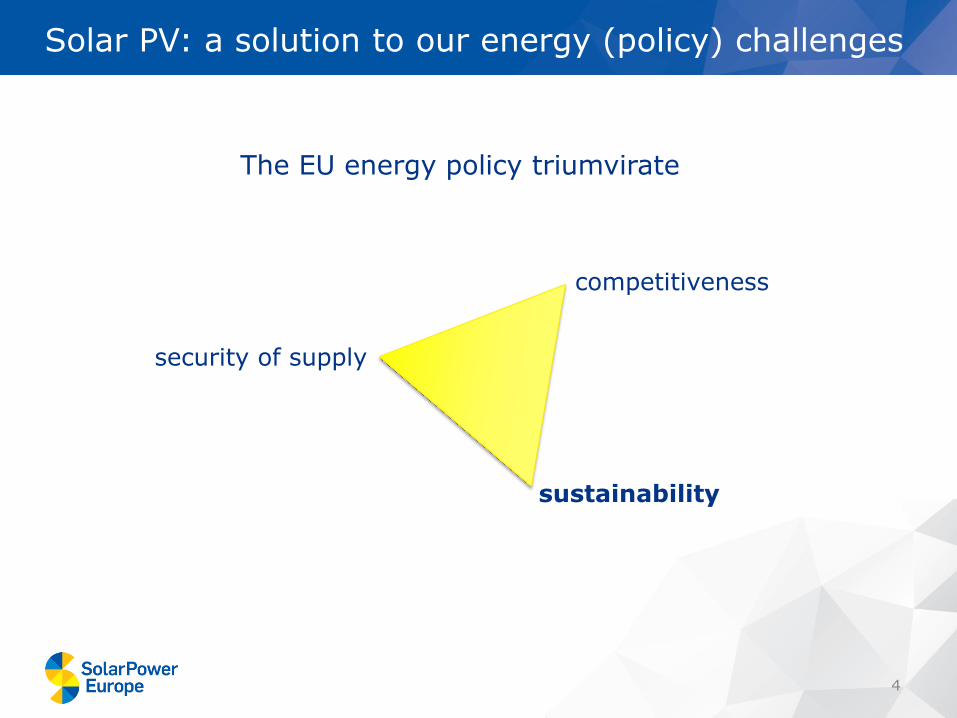
The EU energy policy triumvirate
4
Solar PV: a solution to our energy (policy) challenges
competitiveness
security of supply
sustainability
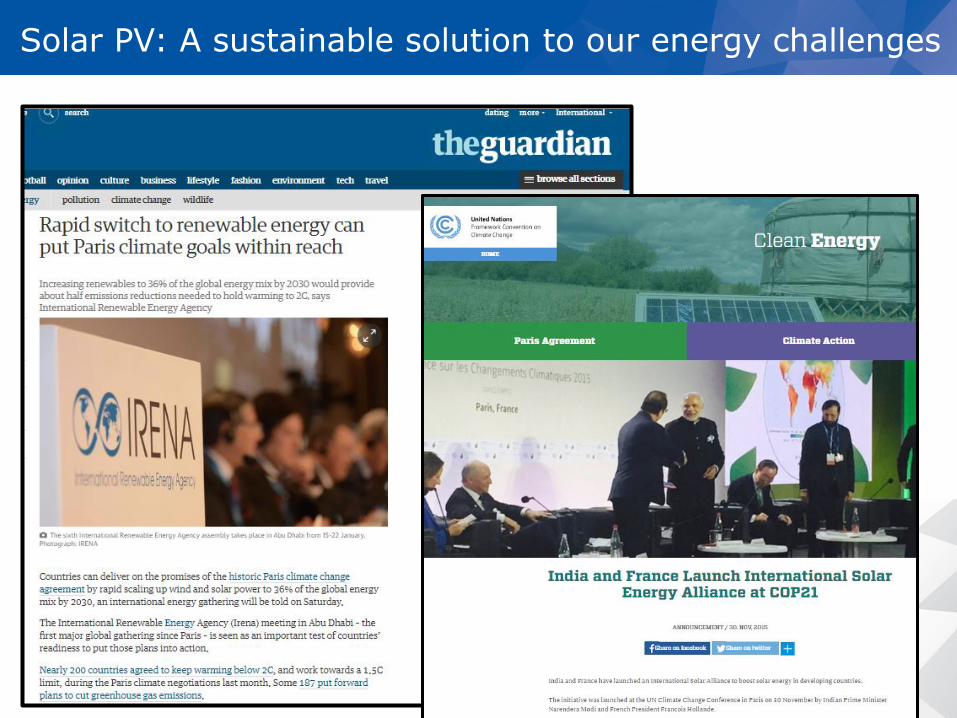
5
Solar PV: A sustainable solution to our energy challenges
Title and date
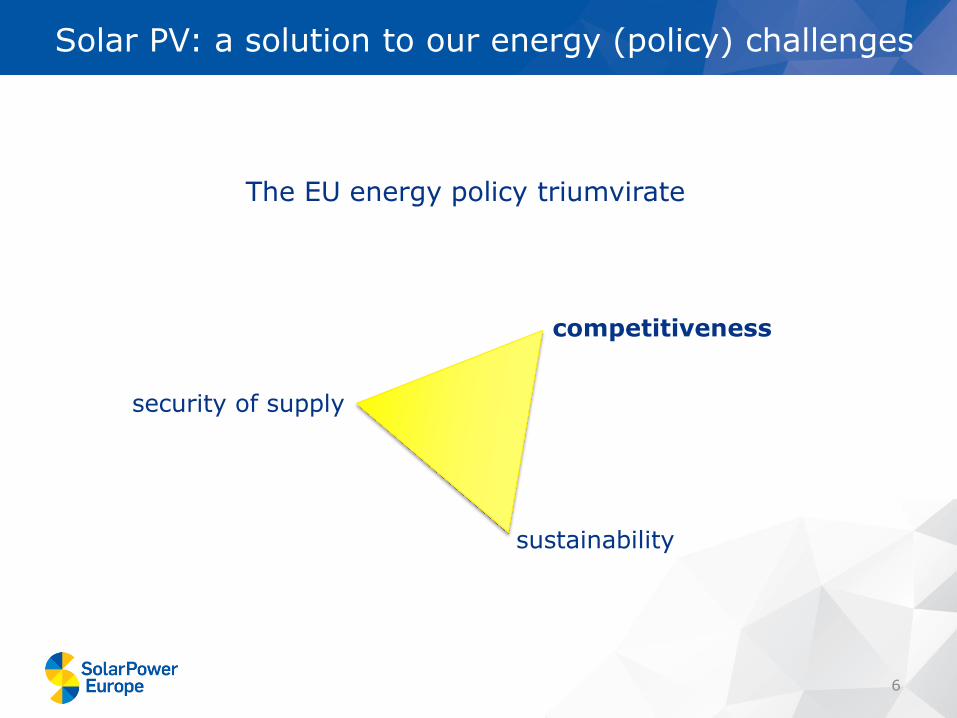
The EU energy policy triumvirate
6
Solar PV: a solution to our energy (policy) challenges
competitiveness
security of supply
sustainability
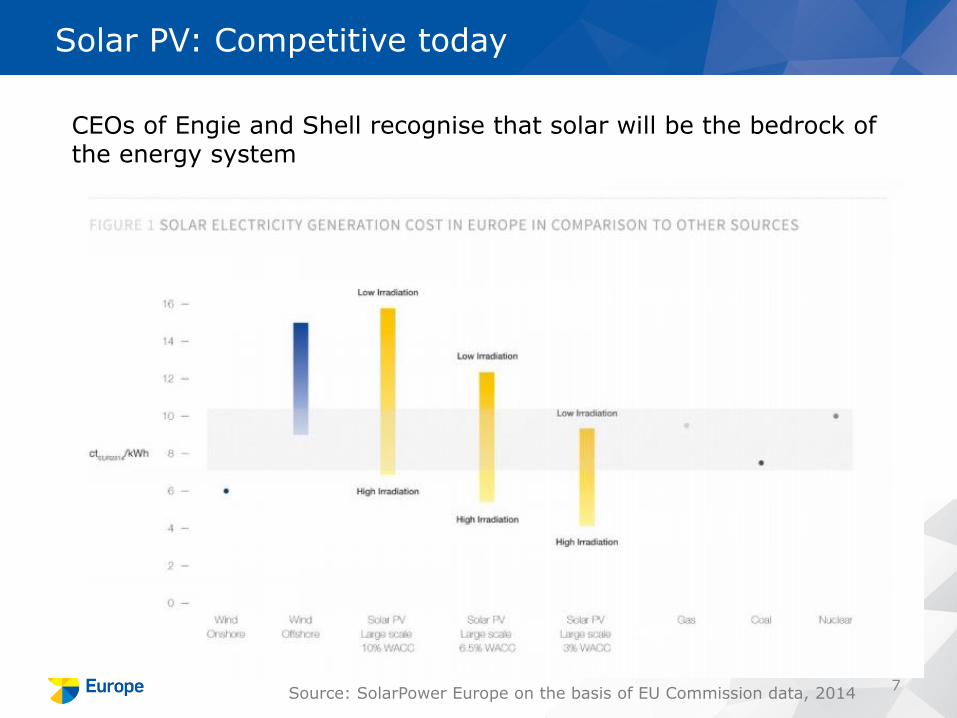
7
Solar PV: Competitive today
Source: SolarPower Europe on the basis of EU Commission data, 2014
CEOs of Engie and Shell recognise that solar will be the bedrock of the energy system
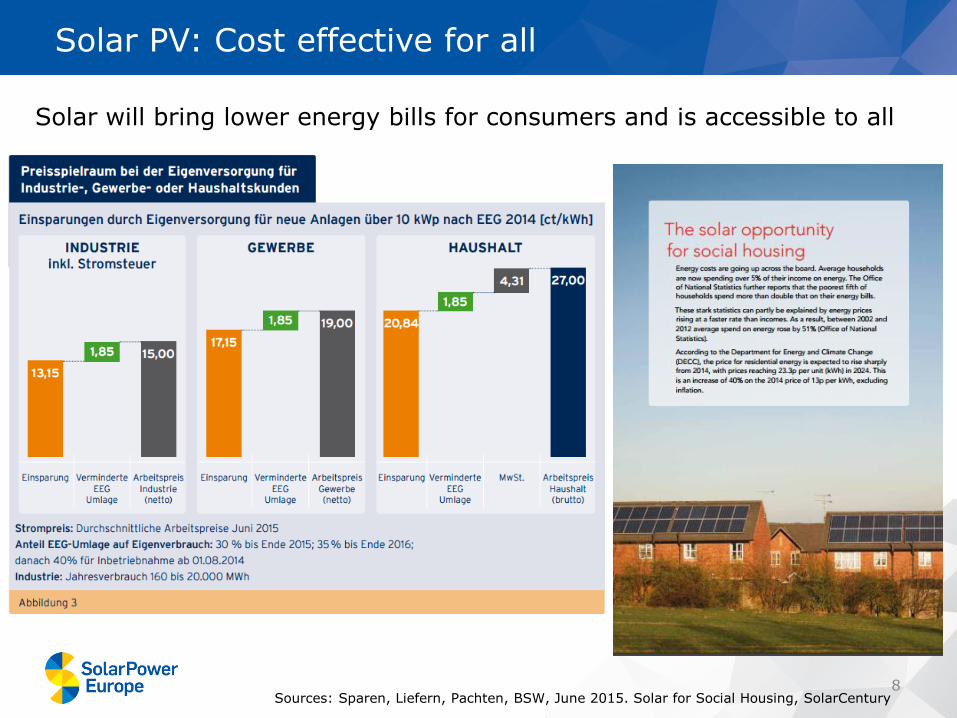
8
Solar PV: Cost effective for all
Sources: Sparen, Liefern, Pachten, BSW, June 2015. Solar for Social Housing, SolarCentury
Solar will bring lower energy bills for consumers and is accessible to all
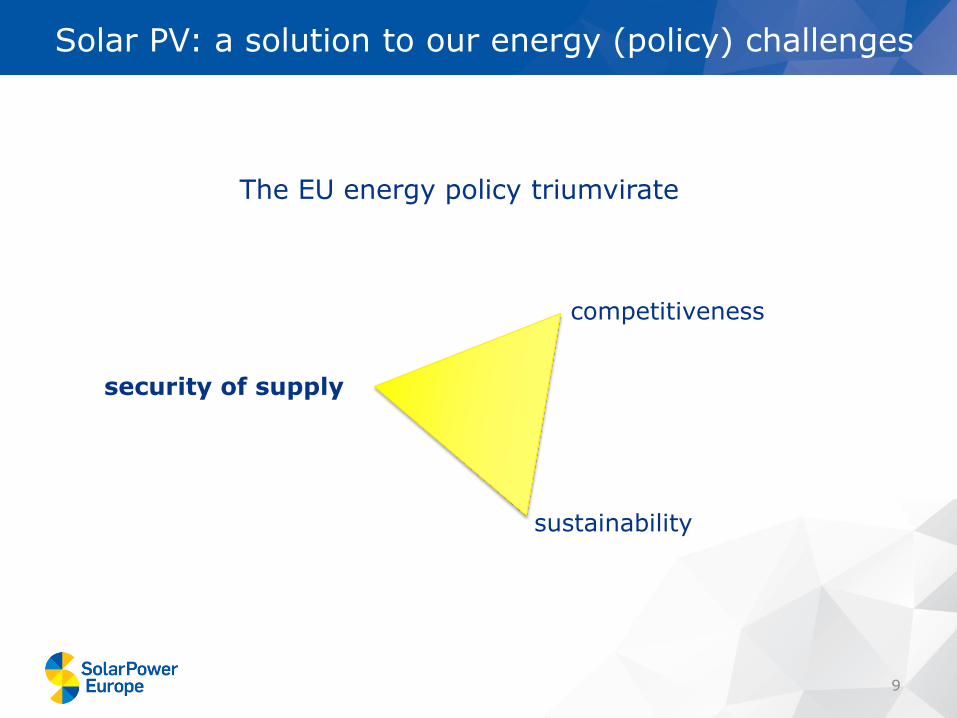
The EU energy policy triumvirate
9
Solar PV: a solution to our energy (policy) challenges
competitiveness
security of supply
sustainability
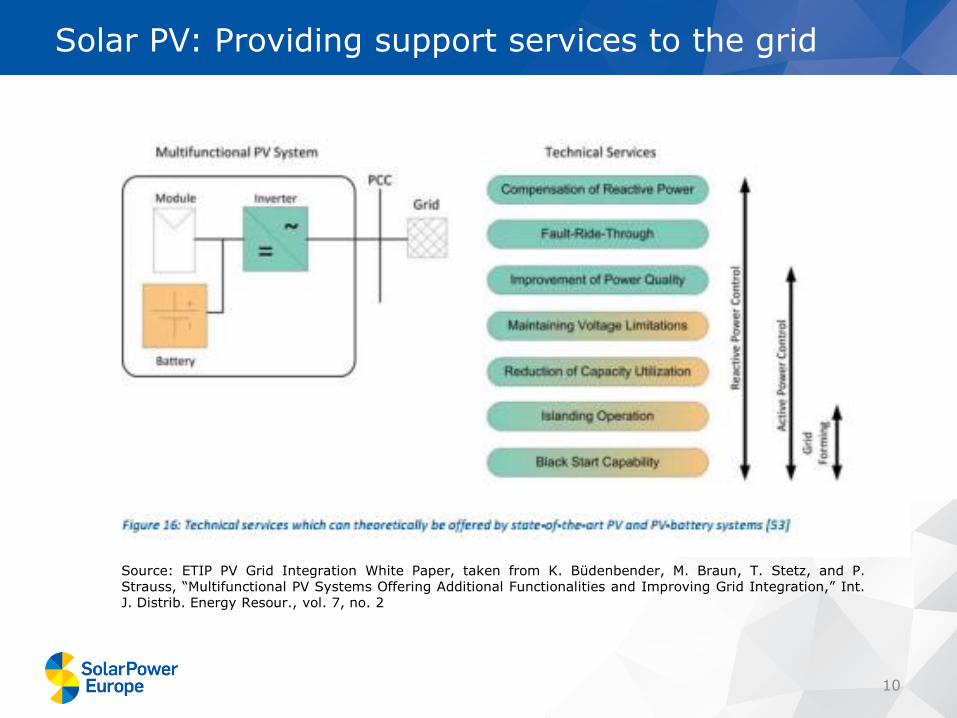
10
Solar PV: Providing support services to the grid
Source: ETIP PV Grid Integration White Paper, taken from K. Büdenbender, M. Braun, T. Stetz, and P. Strauss, “Multifunctional PV Systems Offering Additional Functionalities and Improving Grid Integration,” Int. J. Distrib. Energy Resour., vol. 7, no. 2
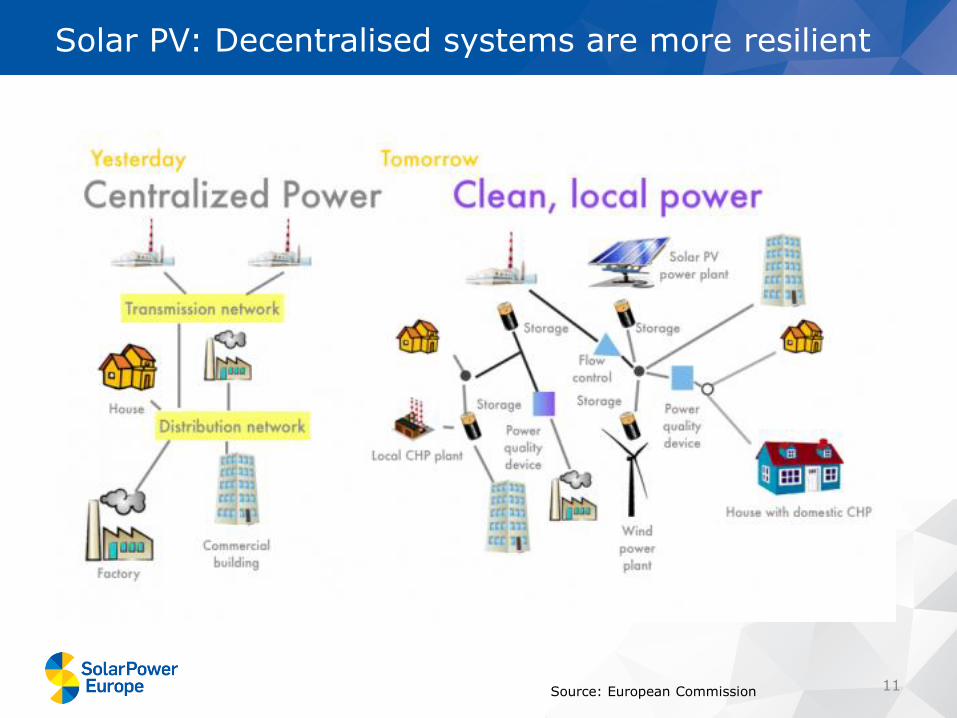
11
Solar PV: Decentralised systems are more resilient
Source: European Commission
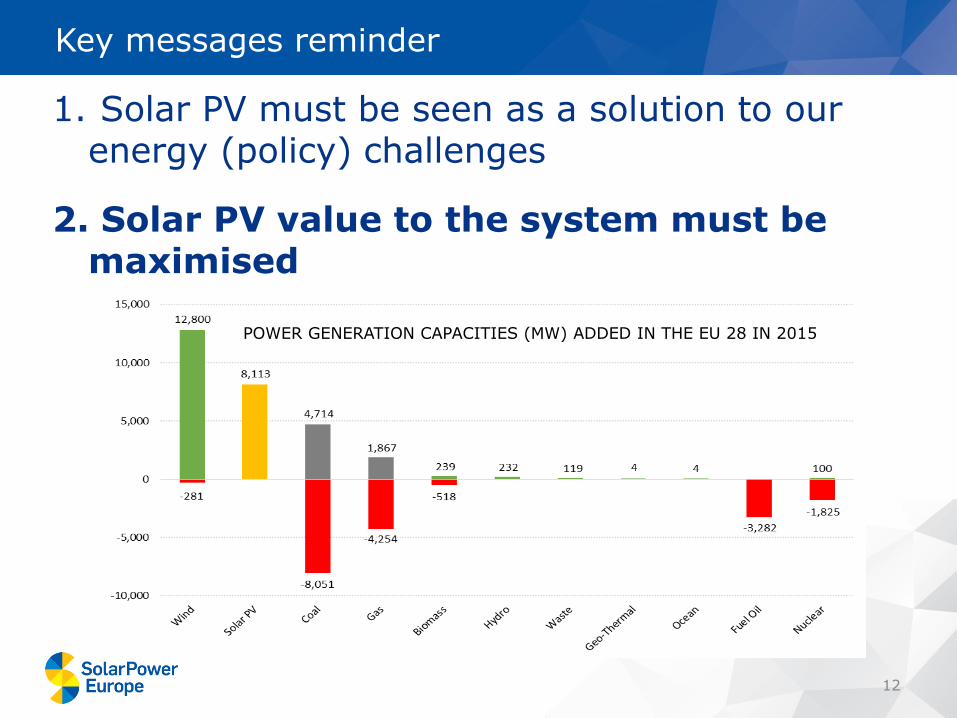
12
1. Solar PV must be seen as a solution to our energy (policy) challenges
2. Solar PV value to the system must be maximised
Key messages reminder
POWER GENERATION CAPACITIES (MW) ADDED IN THE EU 28 IN 2015
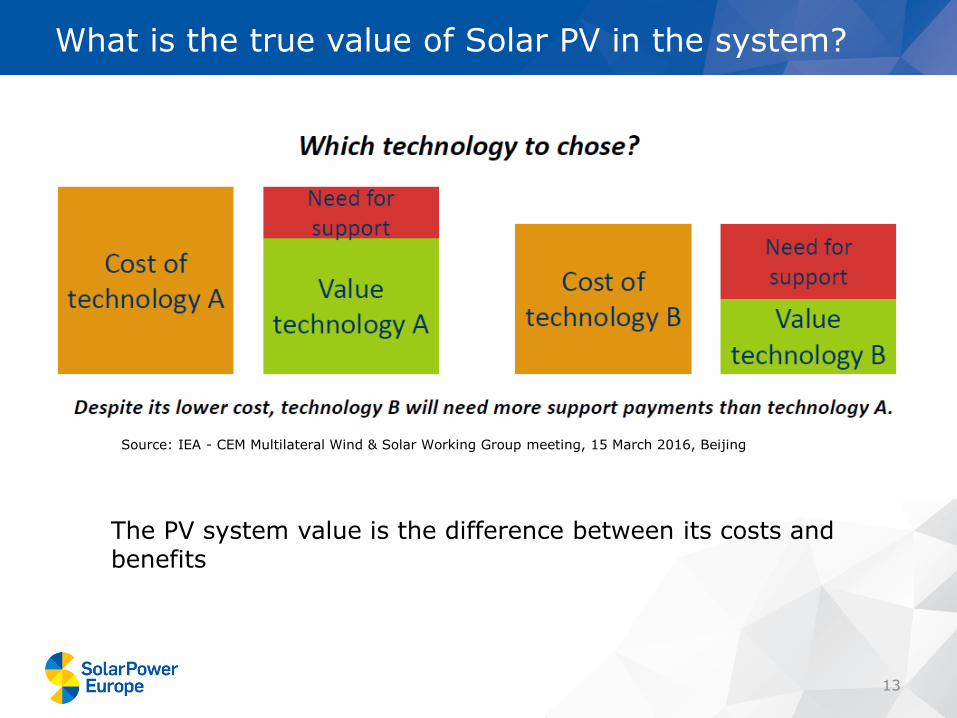
13
What is the true value of Solar PV in the system?
Source: IEA - CEM Multilateral Wind & Solar Working Group meeting, 15 March 2016, Beijing
The PV system value is the difference between its costs and benefits
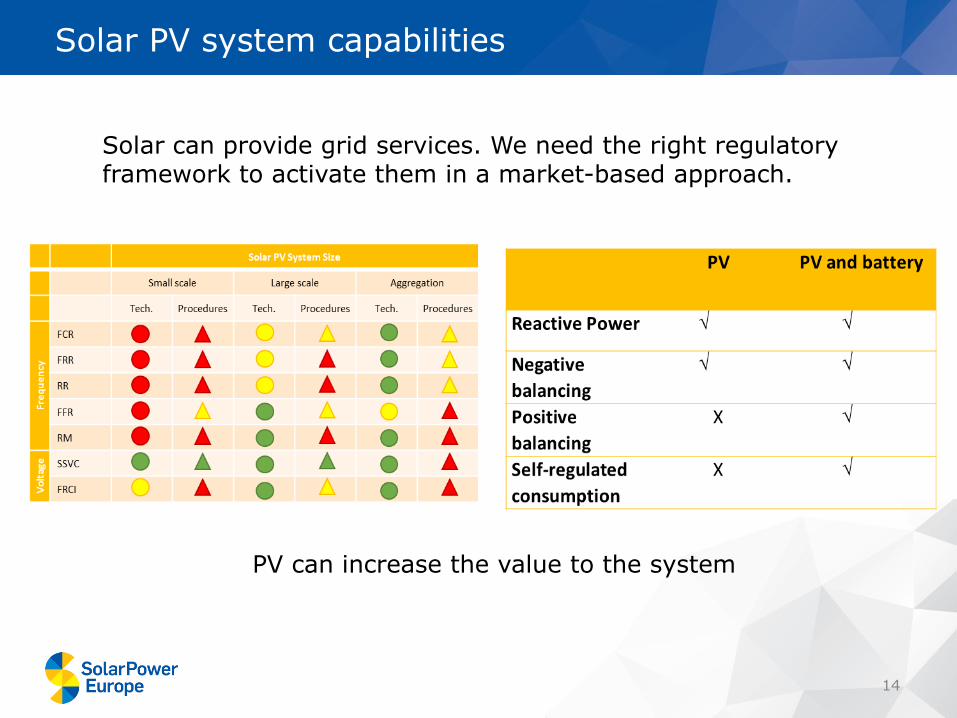
14
Solar PV system capabilities
Solar can provide grid services. We need the right regulatory framework to activate them in a market-based approach.
PV can increase the value to the system
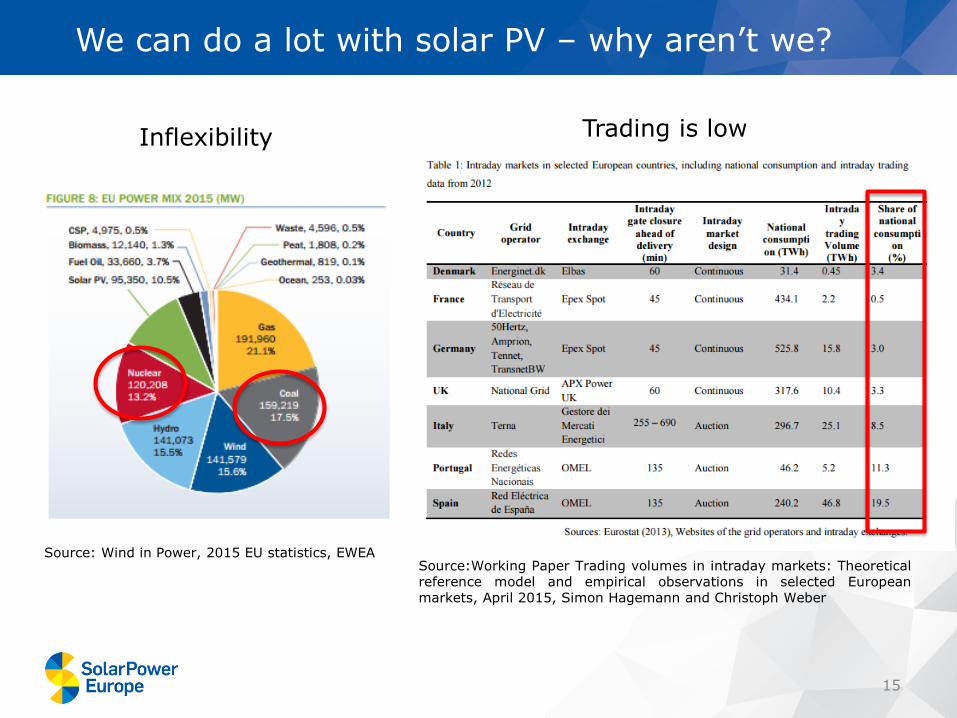
15
We can do a lot with solar PV – why aren’t we?
Source: Wind in Power, 2015 EU statistics, EWEA Source:Working Paper Trading volumes in intraday markets: Theoretical reference model and empirical observations in selected European markets, April 2015, Simon Hagemann and Christoph Weber
Inflexibility Trading is low
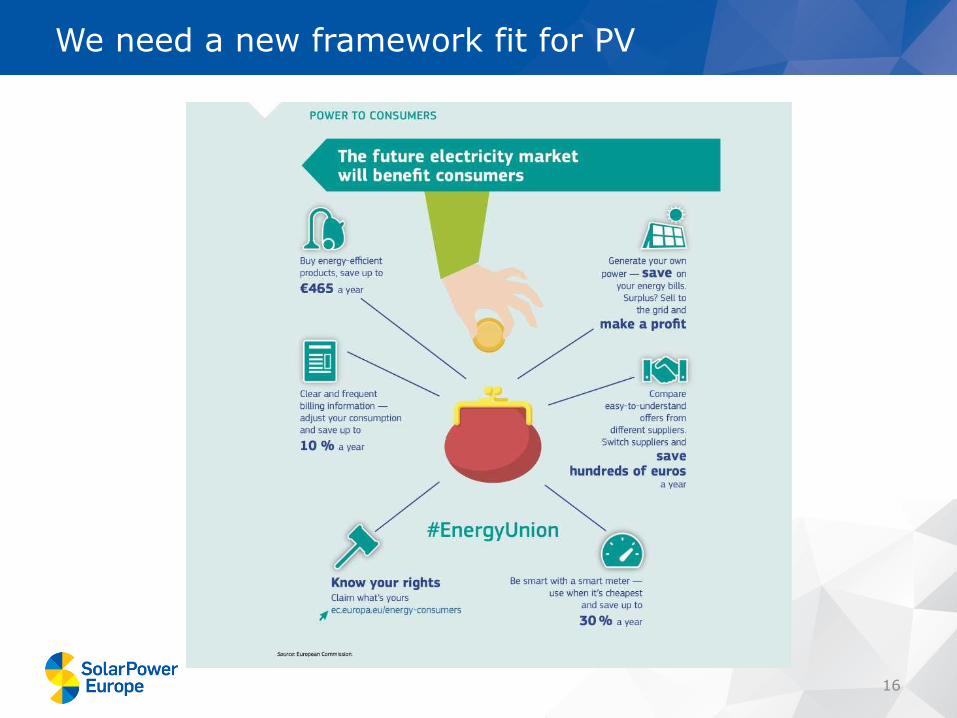
16
We need a new framework fit for PV
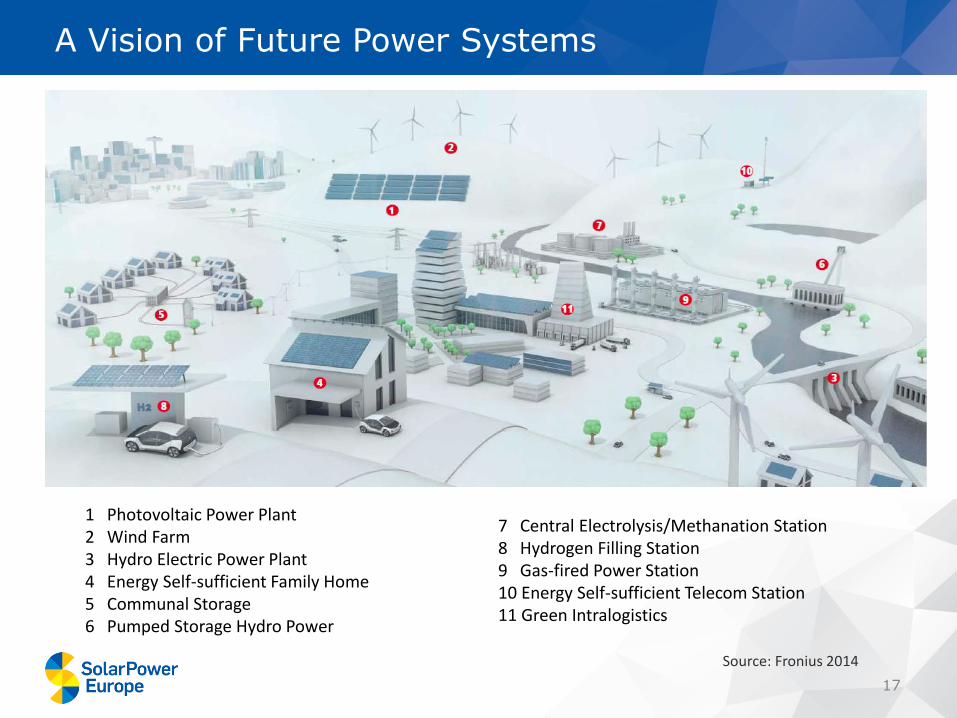
17
A Vision of Future Power Systems
1 Photovoltaic Power Plant 2 Wind Farm 3 Hydro Electric Power Plant 4 Energy Self-sufficient Family Home 5 Communal Storage 6 Pumped Storage Hydro Power
7 Central Electrolysis/Methanation Station 8 Hydrogen Filling Station 9 Gas-fired Power Station 10 Energy Self-sufficient Telecom Station 11 Green Intralogistics
Source: Fronius 2014
23/05/2016
presentation title, Verdana, 8pt 18
Delivering solar power for Europe
For further information, please contact:
James Watson| [email protected]
Rue d’Arlon 69-71
B-1040 Brussels - Belgium
Tel.: +32-2-709.55.20
Fax: +32-2-725.32.50
This presentation and its content, including graphical images, where applicable, are subject to the copyright of SolarPowerEurope. Reproduction is authorised, except for commercial purposes, provided that the source is
mentioned and acknowledged, save where otherwise stated. Pictures contained in this presentation are subject to the copyright of SolarPowereurope Members companies, which name is mentioned on each picture.
Reproduction authorization requests should be directly addressed to the relevant company. Where prior permission must be obtained for the reproduction or use of textual and multimedia information (images, text, layout),
such permission shall cancel the above mentioned general permission and shall clearly indicate any restrictions of use. SolarPowerEurope claims no copyright on any official document or document in the public domain.
Copyright, if any, of third party material found in this site must also be respected.