ETHNICITY AND CONFLICT: THEORY AND FACTS ... AND CONFLICT: THEORY AND FACTS BY JOAN ESTEBAN, LAURA...
19
ETHNICITY AND CONFLICT: THEORY AND FACTS BY J OAN ESTEBAN,LAURA MAYORAL AND DEBRAJ RAY 1 April 2012 Abstract Over the second half of the twentieth century, conflicts within national boundaries have become increasingly dominant. One third of all countries have experienced civil conflict. Many (if not most) such conflicts involve violence along ethnic lines. Based on recent theoretical and empirical research, this paper provides evidence that pre-existing ethnic divisions do influence social conflict. The analysis also points to particular channels of influence. Specifically, it is shown that two different measures of ethnic division — polarization and fractionalization — jointly influence conflict, the former more so when the winners enjoy a “public” prize (such as political power or religious hegemony), the latter more so when the prize is “private” (such as looted resources, government subsidies or infrastructures). The available data appear to stand in strong support of existing theories of inter-group conflict. Our argument also provides indirect evidence that ethnic conflicts are likely to be instrumental, rather than driven by primordial hatreds. The Ubiquity of Internal Conflict There are two remarkable facts about social conflict that deserve notice. First, within-country conflicts account for an enormous share of deaths and hardship in the world today. Figure 1 depicts global trends in inter- and intra-state conflict. After the second World War there have been 22 inter-state conflicts with more than 25 battle-related deaths per year, and 9 of them have killed at least 1000 over the entire history of conflict (1). The total number of attendant battle deaths in these conflicts is estimated to be around 3 to 8 million (2). The very same period witnessed 240 civil conflicts with more than 25 battle-related deaths per year, and almost half of them killed more than 1000 (1). Estimates of the total number of battle deaths are in the range of 5 to 10 million (2). To the direct count of battle deaths one would do well to add the mass assassination of up to 25 million non-combatant civilians (3) and indirect deaths due to disease and malnutrition which have been estimated to be at least four times as high as violent deaths (4), not to mention the forced displacements of more than forty million individuals by 2010 (5). In 2010 there were thirty ongoing civil conflicts (6). Second, internal conflicts often appear to be ethnic in nature. More than half of the civil conflicts recorded since the end of WW II have been classified as ethnic or religious (3, 7). One criterion for a conflict to be classified as ethnic is that it involves a rebellion against the State on behalf of some ethnic group; see (8). Such conflicts involved 14% of the 709 ethnic groups categorized worldwide; see (9). R. Brubaker and D. Laitin, examining the history of internal conflicts in 1 Esteban: Institut d’An` alisi Econ´ omica, CSIC and Barcelona GSE; [email protected]. Mayoral: Institut d’An` alisi Econ´ omica, CSIC and Barcelona GSE; [email protected]. Ray: New York University and Institut d’An` alisi Econ ´ omica, CSIC; [email protected].
Transcript of ETHNICITY AND CONFLICT: THEORY AND FACTS ... AND CONFLICT: THEORY AND FACTS BY JOAN ESTEBAN, LAURA...

ETHNICITY AND CONFLICT: THEORY AND FACTS
BY JOAN ESTEBAN, LAURA MAYORAL AND DEBRAJ RAY1
April 2012
Abstract
Over the second half of the twentieth century, conflicts within national boundaries have becomeincreasingly dominant. One third of all countries have experienced civil conflict. Many (ifnot most) such conflicts involve violence along ethnic lines. Based on recent theoretical andempirical research, this paper provides evidence that pre-existing ethnic divisions do influencesocial conflict. The analysis also points to particular channels of influence. Specifically, it isshown that two different measures of ethnic division — polarization and fractionalization —jointly influence conflict, the former more so when the winners enjoy a “public” prize (such aspolitical power or religious hegemony), the latter more so when the prize is “private” (such aslooted resources, government subsidies or infrastructures). The available data appear to stand instrong support of existing theories of inter-group conflict. Our argument also provides indirectevidence that ethnic conflicts are likely to be instrumental, rather than driven by primordialhatreds.
The Ubiquity of Internal Conflict
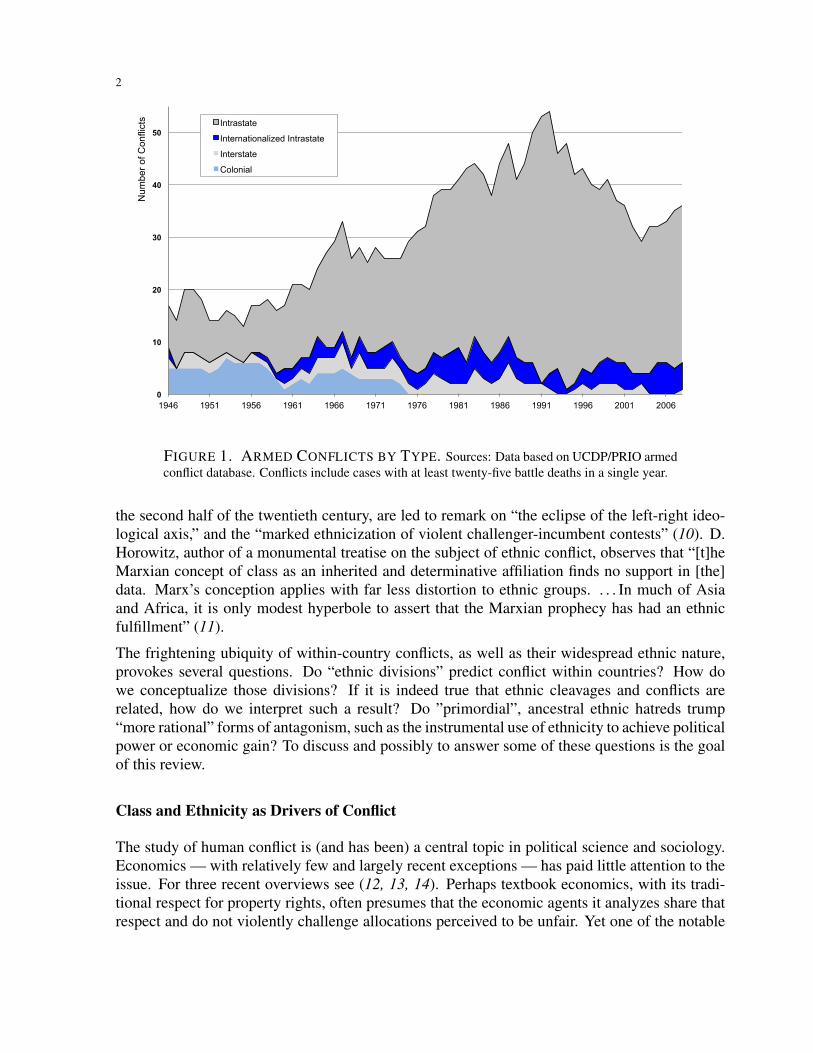
There are two remarkable facts about social conflict that deserve notice. First, within-countryconflicts account for an enormous share of deaths and hardship in the world today. Figure 1depicts global trends in inter- and intra-state conflict. After the second World War there havebeen 22 inter-state conflicts with more than 25 battle-related deaths per year, and 9 of them havekilled at least 1000 over the entire history of conflict (1). The total number of attendant battledeaths in these conflicts is estimated to be around 3 to 8 million (2). The very same periodwitnessed 240 civil conflicts with more than 25 battle-related deaths per year, and almost half ofthem killed more than 1000 (1). Estimates of the total number of battle deaths are in the rangeof 5 to 10 million (2). To the direct count of battle deaths one would do well to add the massassassination of up to 25 million non-combatant civilians (3) and indirect deaths due to diseaseand malnutrition which have been estimated to be at least four times as high as violent deaths(4), not to mention the forced displacements of more than forty million individuals by 2010 (5).In 2010 there were thirty ongoing civil conflicts (6).
Second, internal conflicts often appear to be ethnic in nature. More than half of the civil conflictsrecorded since the end of WW II have been classified as ethnic or religious (3, 7). One criterionfor a conflict to be classified as ethnic is that it involves a rebellion against the State on behalfof some ethnic group; see (8). Such conflicts involved 14% of the 709 ethnic groups categorizedworldwide; see (9). R. Brubaker and D. Laitin, examining the history of internal conflicts in
1Esteban: Institut d’Analisi Economica, CSIC and Barcelona GSE; [email protected]. Mayoral: Institutd’Analisi Economica, CSIC and Barcelona GSE; [email protected]. Ray: New York University and Institutd’Analisi Economica, CSIC; [email protected].
2
0
10
20
30
40
50
1946 1951 1956 1961 1966 1971 1976 1981 1986 1991 1996 2001 2006
Intrastate
Internationalized Intrastate
Interstate
Colonial
Num
ber o
f Con
flict
s
FIGURE 1. ARMED CONFLICTS BY TYPE. Sources: Data based on UCDP/PRIO armedconflict database. Conflicts include cases with at least twenty-five battle deaths in a single year.
the second half of the twentieth century, are led to remark on “the eclipse of the left-right ideo-logical axis,” and the “marked ethnicization of violent challenger-incumbent contests” (10). D.Horowitz, author of a monumental treatise on the subject of ethnic conflict, observes that “[t]heMarxian concept of class as an inherited and determinative affiliation finds no support in [the]data. Marx’s conception applies with far less distortion to ethnic groups. . . . In much of Asiaand Africa, it is only modest hyperbole to assert that the Marxian prophecy has had an ethnicfulfillment” (11).
The frightening ubiquity of within-country conflicts, as well as their widespread ethnic nature,provokes several questions. Do “ethnic divisions” predict conflict within countries? How dowe conceptualize those divisions? If it is indeed true that ethnic cleavages and conflicts arerelated, how do we interpret such a result? Do ”primordial”, ancestral ethnic hatreds trump“more rational” forms of antagonism, such as the instrumental use of ethnicity to achieve politicalpower or economic gain? To discuss and possibly to answer some of these questions is the goalof this review.
Class and Ethnicity as Drivers of Conflict
The study of human conflict is (and has been) a central topic in political science and sociology.Economics — with relatively few and largely recent exceptions — has paid little attention to theissue. For three recent overviews see (12, 13, 14). Perhaps textbook economics, with its tradi-tional respect for property rights, often presumes that the economic agents it analyzes share thatrespect and do not violently challenge allocations perceived to be unfair. Yet one of the notable
3
exceptions in economics — Marx — directly or indirectly dominates the analytical landscape onconflict in the rest of the social sciences. Class struggle, or more generally, economic inequalityhas been viewed as the main driver of social conflict in industrial or semi-industrial society (15).In A. Sen’s words, “the relationship between inequality and rebellion is indeed a close one” (16).
Yet, intuitive as it might seem, this relationship doesn’t receive emphatic empirical endorsement.In a detailed survey paper on the many attempts to link income inequality and social conflictempirically, M. I. Lichbach mentions 43 papers on the subject, some “best forgotten” (17). Theevidence is thoroughly mixed, concludes Lichbach, as he cites a variety of studies to supporteach possible relationship between the two, and others that show no relationship at all. M.I. Midlarsky remarks on the “fairly typical finding of a weak, barely significant relationshipbetween inequality and political violence . . . rarely is there a robust relationship between the twovariables” (18).
The emphasis on economic inequality as a causal correlate of conflict seems natural, and thereis little doubt that carefully implemented theory will teach us how to better read the data; moreon this below. Yet it is worth speculating on why there is no clear-cut correlation. Certainly,economic demarcation across classes is a two-edged sword: while it breeds resentment, the verypoverty of the have-nots separates them from the means for a successful insurrection. In addition,redistribution across classes is invariably an indirect and complex process.
The use of non-economic “markers” such as ethnicity or religion addresses both these issues.Individuals on either side of the ethnic divide will be economically similar, so that the gainsfrom such conflict are immediate: the losing group can be excluded from the sector in whichit directly competes with the winners; see, for instance, (11, 19, 20). In addition, each groupwill have both poor and rich members, with the former supplying conflict labor and the lattersupplying conflict finances (21). This suggests an interesting interaction between inequalityand ethnicity, by which ethnic groups with a higher degree of within-group inequality will bemore effective in conflict (22). Moreover, it has been suggested that “horizontal” inequality (i.e.,inequality across ethnic groups) is an important correlate of conflict (23, 24, 25, 26).
There are two broad views on the ethnicity-conflict nexus; see, e.g., (10, 27). The “primordialist”view (28, 29) takes the position that ethnic differences are ancestral, deep, and irreconcilable, andfor these reasons invariably salient. In contrast, the “instrumental” approach pioneered by (19)and discussed in (10) sees ethnicity as an strategic basis for coalitions that seek a larger shareof economic or political power. Under this view, ethnicity is a device for restricting the spoilsto a smaller set of individuals. Certainly, the two views interact. Exclusion is easier if ethnicgroups are geographically concentrated (34,35). Strategic ethnic conflict could be exacerbatedby hatreds and resentments — perhaps ancestral, perhaps owing to a recent clash of interests— that are attached to the markers themselves. Finally, under both these views, in ethnicallydivided societies democratic agreements are hard to reach and once reached, fragile (30), thegovernment will supply fewer goods and services and redistribute less (32, 33), and society willface recurrent violent conflict (11).
Either approach raises the fundamental question of whether there is an empirical, potentiallypredictive connection between ethnic divisions and conflict. To address that question, we mustfirst define what an “ethnic division” is. Various measures of ethnic division or dominance (36,

4
37, 38) have been proposed. The best known off-the-shelf measure of ethnic division is thefractionalization index, first introduced in the 1964 edition of the Soviet Atlas Narodov Mira,to measure ethno-linguistic fragmentation. It equals the probability that two individuals drawnat random from the society will belong to two different groups; see technical box for a precisedefinition. Ethnic fractionalization has indeed been usefully connected to per-capita GDP (31),economic growth (39), or governance (40). But (7, 36, 41, 42) do not succeed in finding a con-nection between ethnic or religious fractionalization and conflict, though it has been suggestedthat fractionalization appears to work better for smaller scale conflicts, such as ethnic riots (43).On the other hand, variables such as low GDP per capita, natural resources, environmental condi-tions favoring insurgency or weak government are often significant correlates of conflict (12, 44).Fearon and Laitin conclude that the observed “pattern is thus inconsistent with . . . the commonexpectation that ethnic diversity is a major and direct cause of civil violence” (7).
But the notion of “ethnic division” is complex, and not so easily reduced to a measure of diversity.The discussion that follows will introduce a different measure — polarization — that bettercaptures inter-group antagonism. As we shall see, polarization will be closely connected to theincidence of conflict, and what is more, with a measure of polarization in place and controlledfor, fractionalization too will matter for conflict.
Fractionalization and Polarization
As already discussed, the index of fractionalization is commonly used to describe the ethnicstructure of a society (see our technical box for a formal presentation). This index essentiallyreflects the degree of ethnic diversity. When groups are of equal size, the index increases withthe number of groups. It reaches a maximum when everyone belongs to a different group.
When one is interested in social conflict, this measure does not seem appropriate on at least twocounts. First, as social diversity increases beyond a point, intuition suggests that the likelihood ofconflict would come down rather than go up. After all, group size matters. The fact that “manyare in this together” provides a sense of group identity in times of conflict. Moreover, groupsneed a minimum size to be credible aggressors or opponents. Secondly, not all groups are sym-metrically positioned with respect to other groups, though the measure implicitly assumes theyare. A Pushtun saying is illustrative: “Me against my brothers, me and my brothers against mycousins, me and my cousins against the world.” The fractionalization measure can be interpretedas saying that every pair of groups is “equally different”. Often, they are not.
Consider now the notion of polarization as introduced in (45, 46, 47). Polarization is designedto measure social “antagonism”, which is assumed to be fueled by two factors: the “alienation”felt between members of different groups and the sense of “identification” with one’s own group.This index is defined as the aggregation of all interpersonal antagonisms. Its key ingredients areintergroup distances (how alien groups are from each other) and group size (an indicator of thelevel of the group identification). Using an axiomatic approach (45, 50) we obtain the specificform used in this article; see the technical box for the precise formula.
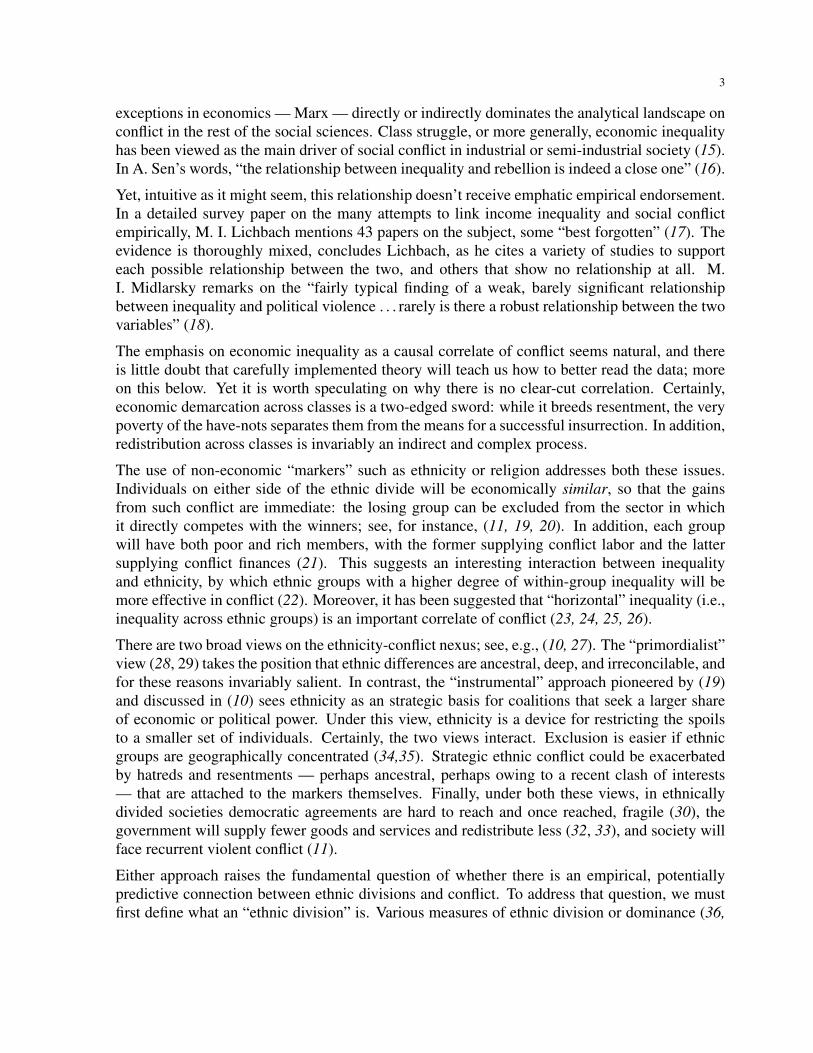
In any society with three or more ethnic groups, the polarization measure behaves very differ-ently from fractionalization. Unlike fractionalization, polarization declines with the continuedsplintering of groups, and is globally maximized for a bimodal distribution of population. This

5
!"
!#$"
!#%"
!#&"
!#'"
!#("
!#)"
!#*"
!#+"
!#,"
$"
$" %" &" '" (" )" *" +" ," $!" $$" $%" $&" $'" $(" $)" $*" $+" $," %!"
-./012"34"523.67"
829:;3<9=>?9;3<"
@3=92>?9;3<"
FIGURE 2. POLARIZATION, FRACTIONALIZATION AND THE NUMBER OFGROUPS. Note: In this illustration, all groups are of equal size, and intergroup distancesare set equal to 1.
is shown in Figure 2 where groups are always of equal size and intergroup distances are equal to1. Rather than being two different (but broadly related) ways of measuring the same thing, thetwo measures emphasize different aspects of a fundamentally multidimensional phenomenon.As we shall soon see, the differences have both conceptual and empirical bite. For instance, J.Montalvo and M. Reynal-Querol (48), using a simplified version of the index of polarization,show that ethnic polarization is a significant correlate of civil conflict while fractionalization isnot. Their contribution provides the first piece of serious econometric support for the propositionthat “ethnic divisions” might affect conflict.
In spite of their divergent performance in empirical work, the two measures are linked. In fact,they are even identical if (i) group identity does not play a role, and (ii) individuals feel equallyalienated from members of all other groups. Which index is best to use is therefore determined bythe nature of the problem at hand: on whether the sense of identity, of intergroup differentiation,or both are relevant. Group identification matters when we face problems of public import, inwhich the payoffs to the entire community jointly matter. Intergroup differentiation is relevantwhenever the specific cultural characteristics of the other groups affect the policies that theychoose, and therefore create implications for any one group. In contrast, if social groups competefor narrow economic gains that accrue to the winners and are excludable from the losers, noopponent’s victory means more or less than any other. In the theory that we outline below, theseare precisely the factors that receive greatest emphasis.
Marrying Theory and Facts
A systematic econometric exploration of the links between ethnic divisions and conflict will gen-erally take the form of a multivariate regression. The “dependent variable” we seek to explain

6
is some measure of conflict. On the other side of the regression is our main “independent vari-able”, which is a particular measure of “ethnic divisions”, as well as a host of “control variables”that are included to capture other influences on conflict that we seek to filter out. This much isevident. The problem is (and this is true of empirical research more generally) that little dis-cipline is often imposed on the specification of that regression. Much of that research involvesthe kitchen-sink approach of including all variables — usually linearly — that could possiblyplay a role in ethnic conflict. Such an approach is problematic on at least three counts. First, thenumber of plausible variables is unbounded, not just in principle but apparently also in practice:eighty five different variables have been used in the literature (49). Trying them out in varioushopeful combinations smacks uncomfortably of data-mining. Second, even if we could narrowdown the set of contenders, there are many ways to specify the empirical equation that links thosevariables to conflict. Finally, the absence of a theory hinders the interpretation of the results.
From a statistical perspective, fractionalization and polarization are just two, seemingly equallyreasonable, ways of measuring ethnic divisions. Yet they yield very different results in connect-ing ethnicity to conflict. Do we chalk up this inconsistency as yet another illustration of thattime-worn phrase, “measurement error”? Or is there something deeply conceptual buried here?
The results we are going to present are obtained from an explicit game-theoretic model of con-flict. We then bring the predicted equilibrium of this model to data. This allows us both to testthe theory and to suitably interpret the results. Perhaps the most important contribution of thetheory is that it finds room for both polarization and fractionalization as joint drivers of conflict,and explains precisely when one measure acquires more explanatory salience than the other.
We begin by presenting the recent analysis that links polarization and fractionalization to equi-librium conflict (50). We then describe some of the empirical findings obtained in (51) whenconfronting the predictions of the model with data.
Polarization, Fractionalization and Conflict: Theory
A situation of open civil conflict arises when an existing social, political or economic arrange-ment is challenged by an ethnic group. Whether the ethnic marker is focal for instrumental orprimordial reasons is an issue that we’ve remarked on earlier, but at this stage it is irrelevant forour purpose. (For more on ethnic salience, see (52, 53, 54).) In such a situation, the groupsinvolved will undertake costly actions (demonstrations, provocations, bombs, guerrilla or openwarfare) in order to increase their probability of success. We view the aggregate of all suchactions as the extent of conflict.
More precisely, suppose that there arem groups engaged in conflict. Think of two types of stakesor prizes in case of victory. One kind of prize is “public”, the individual payoff from which isundiluted by one’s own group size. For instance, the winning group might impose its preferrednorms or culture: a religious state, the abolition of certain rights or privileges, the repression ofa language, the banning of political parties, and so on. Or it might enjoy political power, or thesatisfaction of seeing one’s own group vindicated or previous defeats avenged. Let uij be thepayoff experienced by an individual member of group i in the case in which group j wins andimposes its preferred policy; we presume that uii > uij which is true almost by definition. Thisinduces a notion of “distance” across groups i and j: dij ≡ uii−uij , which can be interpreted as
7
the loss to i of living under the policy implemented by j. Note that a member of group i mightprefer j rather than k to be in power, and that will happen precisely when dij < dik.
The money-equivalent value of the public payoffs — call it π — tells us how much moneyindividuals are ready to give up to bring the implement policy “one unit” closer to one’s ownideal policy. Its value depends in part on the extent to which the group in power can imposepolicies or values on the rest of society. Thus a member of group i assigns a money value of uijπto the ideal policy of group j.
The other type of prize is “private”. Examples include the material benefits obtained from ad-ministrative or political positions, specific tax breaks, directed subsidies, bias in the allocation ofpublic expenditure and infrastructures, access to rents from natural resources, or just plain loot.Private payoffs have two essential properties. First, group size dilutes individual benefits: thelarger the group, the smaller is the return from a private prize for any one group member. Second,the identity of the winner is irrelevant to the loser since, in contrast to the “public” case, the loseris not going to extract any payoff from that fact. (If there are differential degrees of resentmentover the identity of the winner, simply include this component under the public prize.) Let µ bethe per-capita money value of the private prize at stake.
Individuals in each group expend costly resources (time, effort, risk) to influence the probabilityof success. Conflict is defined to be the sum of all these resources over all individuals andall groups. The winners share the private prize and get to implement their favorite policies(the public prize). The losers have to live with the policies chosen by the winners. A conflictequilibrium describes the resulting outcome. (“Conflict equilibrium” perhaps abuses semanticsto an unacceptable degree, our excuse being that we observe the game-theoretic tradition ofdescribing the noncooperative solution to a game as a Nash “equilibrium”.) It is a vector ofindividual actions such that each agent’s behavior maximizes expected payoffs in the conflict,given the choices made by all other individuals. Note well that by the word “payoff” we don’tmean some narrow monetary amount, but also non-economic returns, such as political power orreligious hegemony.
But what does the maximization of payoffs entail? Individuals are individuals, but they alsohave a group identity. To some extent an individual will act selfishly, and to some extent he willact in the interest of the ethnic group. The weight placed on the group versus the individualwill depend on several factors (some idiosyncratic to the individual), but a large component willdepend on the degree of group-based cohesion in the society; we return to this below. Formally,we presume that an individual places a weight of α on the total payoff of his group, in additionto his own payoff.
Let us measure the intensity of conflict —call it C— by the money value of the average, percapita level of resources expended in conflict. In (50) we argue that in equilibrium the eventualacross-group variation in the per capita resources expended has a minor effect on the aggre-gate level of conflict. It turns out that the population-normalized intensity of conflict C canbe approximated well by ignoring this variation, and this simplification yields the approximateformula
(1)C
π + µ' α
[λP + (1− λ)F
],

8
for large populations, where λ ≡ π/(π + µ) is the relative publicness of the prize, F is thefractionalization index, and P is a particular member of the family of polarization measuresdescribed earlier, constructed using inter-group distances dij derived from “public” payoff losses.(The technical box describes these measures more formally, and also provides a more generalversion of equation (1).) Thus it is the theory that tells us precisely which notions of ethnicdivision need to be considered. But more than that, the relationship has a particular form whichinforms the empirical analysis.
This result highlights the essential role of theory for meaningful empirical work. The exogenousdata of the model — individual preferences, group size, the nature and the size of the prize,and the level of group cohesion — all interact in a very special way to determine equilibriumconflict intensity. The theory shows, first, that it suffices to aggregate all the information onpreferences and group sizes into just two indices — F and P — capturing different aspects ofthe ethnic composition of a country. Second, the weights on the two distributional measuresdepend on the composition of the prize and on the level of group commitment. In particular, thepublicness of the prize (reflected in a high value of λ) reinforces the effect of polarization, whilehigh privateness of the prize (low λ) reinforces the effect of fractionalization. Not surprisingly,high group cohesion α enhances the effect of both measures on conflict.
The publicness of the prize is naturally connected to both identification and alienation, and there-fore to polarization. With public payoffs group size counts twice; once, because the payoffsaccrue to a larger number, and again, because a larger number of individuals internalize that ac-crual, and therefore contribute more to the conflict. Inter-group distances matter too: the precisepolicies interpreted by the eventual winner continue to be a cause of concern for the loser. Boththese features — the “double emphasis” on group size and the use of distances — are capturedby the polarization measure P ; see the technical box for more details. On the other hand, whengroups fight for a private payoff — say money — one winner is as bad as another as long as mygroup doesn’t win, and measures based on differences in intergroup alienation become useless.Moreover, with private payoffs, group identification counts for less than it does with public pay-offs, as group size erodes the per-capita gain from the prize. The resulting index that is connectedto this scenario is one of fractionalization (again, see the technical box).
In short, the theory tells us to obtain data on P and F , and combine them in a particular way. Ittells us that when available, we should attempt to obtain society-level data for group cohesionα and relative publicness λ and enter them in the way prescribed by equation (1). With this inmind, we now bring the theory to the data.
[TECHNICAL BOX ABOUT HERE. NOW LOCATED AT THE END]
Taking the Theory to Data
We study 138 countries over 1960–2008, with the time period divided into five-year intervals.That yields a total of 1125 observations (in most cases). Some of the variables in the theory arenot directly observable and we will use proxies. For a complete set of results see (51) and theaccompanying Web Appendix.

9
We measure conflict intensity in two ways. The first is the death toll. Using data from the jointlymaintained database under the Uppsala Conflict Data Program and the Peace Research Instituteof Oslo (UCDP/PRIO) (1), we construct a discrete measure of conflict — PRIO-C — for everyfive-year period and every country as follows: PRIO-C is equal to 0 if the country is at peacein those five years; to 1 if it has experienced low-intensity conflict (more than 25 battle relateddeaths but less than 1000) in any of these years, or to 2 if the country has been in high-levelconflict (more than 1000 casualties) in any of the five years. Despite the overall popularity ofUCDP/PRIO, this is an admittedly coarse measure of deaths, based on only three categories(peace, low conflict and high conflict) defined according to ad hoc thresholds, and only reportsconflicts when one of the involved parties is the State. To overcome these two problems, we usea second measure of intensity: the Index of Social Conflict, ISC, computed by the Cross-NationalTime-Series Data Archive (55). It provides a continuous measure of several manifestations ofsocial unrest with no threshold dividing “peace” from “war”. The index ISC is formed by takinga weighted average over eight different manifestations of internal conflict, such as politicallymotivated assassinations, riots, guerrilla warfare, etc.
Our core independent variables are the indices F and P . In order to compute these indiceswe need the population size of different ethnic groups for every country, and a proxy for inter-group distances. For demographic information on groups we use the dataset provided by (9),which identifies over 800 “ethnic and ethno-religious” groups in 160 countries. For inter-groupdistances, we follow (9, 56, 57), and employ the linguistic distance between two groups as aproxy for group “cultural” distances in the space of public policy.
Linguistic distance is defined on a universal language tree that captures the genealogy of alllanguages (58). All Indo-European languages, for instance, will belong to a common subtree.Subsequent splits create further “sub-subtrees”, down to the current language map. For instance,Spanish and Basque diverge at the first branch, since they come from structurally unrelated lan-guage families. By contrast, the Spanish and Catalan branches share their first seven nodes:Indo-European, Italic, Romance, Italo-Western, Western, Gallo-Iberian and Ibero-Romance lan-guages. We measure the distance between two languages as a function of the number of stepswe must retrace to find a common node. The results are robust to alternative ways of mappinglinguistic differences into distances.
Linguistic divisions arise because of population splits. Languages with very different originsreveal a history of separation of populations going back several thousand years. For instance,the separation between Indo-European languages and all others occurred around 9000 years ago(59). In contrast, finer divisions, such as those between Spanish and Catalan, tend to be theresult of more recent splits, implying a longer history of common evolution. Consistent with thisview, there is evidence showing a link between the major language families and the main humangenetic clusters (60, 61).
The implicit theory behind our formulation is that linguistic distance is associated with cul-tural distance, stemming from the fact that language trees are chronologically related to groupsplittings and, therefore, to independent cultural (and even genetic) evolution. That argumentundoubtedly takes us out on a limb, but reflects a common tradeoff. The disadvantage is obvi-ous: linguistic distances are at best an imperfect proxy for the unobserved “true distances”. But

10
something closer to the unobserved truth — say, answers to survey questions about the degreeof intergroup antagonism, or perhaps a history of conflict — have the profound drawback ofbeing themselves affected by the very outcomes they seek to explain, or being commonly driven(along with the outcome of interest) by some other omitted variable. In a word, such variablesare endogenous to the problem at hand. The great advantage of linguistic distances is that asimilar charge cannot be easily leveled against them. Whether the tradeoff is made well here issomething that a mixture of good intuition and final results must judge.
In our specifications we also control for other variables that have been shown to be relevant in ex-plaining civil conflict; see (12): population size [POP], because conflict is population-normalizedin the theory, gross domestic product per capita [GDPPC], which raises the opportunity cost ofsupplying conflict resources, natural resources [NR], measured by the presence of oil or dia-monds, which affects the total prize, the percentage of mountainous terrain [MOUNT], whichfacilitates guerrilla warfare, non-contiguity [NCONT], referring to countries with territory sepa-rated from the land area containing the capital city either by another territory or by 100 kilometersof water, measures of the extent of democracy [DEMOC], the degree of power [PUB] afforded tothose who run the country, which is a proxy for the size of the public prize (more on this below),time dummies to capture possible global trends, and regional dummies to capture patterns affect-ing entire world regions. Finally, because current conflict is deeply affected by past conflict, weuse lagged conflict as an additional control in all our specifications.
Our exercise implements equation (1) in three ways. First, we run a cross-section regression ofconflict on the two measures of ethnic division. Second, we independently compute a degreeof relative publicness of payoffs for each country and include this in the regression. Third,we add separate proxies of group cohesion for all the countries. Each of these steps takes usprogressively closer to the full power of equation (1), but with the potential drawback that weneed proxies for an increasing number of variables.
To form a relative publicness index by country, we proxy π and µ for every country. Beginwith a proxy for the private payoff µ. It seems natural to associate µ with rents that are easilyappropriable. Because appropriability is closely connected to the presence of resources, weapproximate the degree of “privateness” in the prize by asking if the country is rich in naturalresources. Typically, oil and diamonds are the two commodities most frequently associated withthe “resource curse” (62, 63). Data on the quantity of diamonds produced is available (64) but,unfortunately, information on quality (and associated price) is scarce, making it very difficultto estimate the monetary value of diamond production. Diamond prices per carat can vary by afactor of eight or more, from industrial diamonds ($25 a carat in 2001) to high-quality gemstones($215 per carat in 2001), see (63). For this reason, we focus exclusively on oil in this exercise.We use the value of oil reserves per-capita, OILRSVPC, as a a proxy for µ.
Next, we create an index of “publicness”, PUB, by measuring the degree of power afforded tothose who run the country, “more democratic” being regarded as correlated with “less power”and consequently a lower valuation of the public payoff to conflict. We use four different proxiesto construct the index: (i) the lack of executive constraints, (ii) the level of autocracy, (iii) thedegree to which political rights are flouted, and (iv) the extent of suppression of civil liberties.

11
We use time-invariant dummies of these variables based on averages over the sample, sinceshort-run changes are likely to be correlated with the incidence of conflict.
Our proxy for the relative publicness of the prize is given by
(2) Λ ≡ (γPUB*GDPPC)/(γPUB*GDPPC + OILRSVPC),
where we multiply the PUB indicator by per-capita GDP to convert the “poor governance” vari-ables into monetary equivalents. The “conversion factor” γ makes the privateness and publicnessvariables comparable, and allows us to combine them to arrive at the ratio Λ. In the empiricalexercise we present here, we set γ equal to 1. But the results are robust to the precise choice ofthis parameter; see the Web Appendix to (51).
Finally, we proxy the level of group cohesion α by exploiting the answers to a set of questionsin the 2005 wave of the World Values Survey (65). We use the latest wave available because itcovers the largest number of countries. One could argue that the answers might be conditionedby the existence of previous or contemporary conflict. For this reason, the questions we haveselected do not ask about commitment to specific groups, but address issues like adherence tosocial norms, identification with the local community, the importance of helping others, and soon. We compute the country average of individual scores on this set of questions, and denote thisby A; see (51) for a list of the questions.
What the Data Say
As already mentioned, we proceed in three steps. First, we examine the strength of the cross-country relationship between conflict intensity and the two indices of ethnic division, with allcontrols in place, including time and regional dummies. The estimated coefficients will speakto the importance of the two independent variables as determinants of conflict intensity. Inthe second stage, we step closer to the full model and interact the distributional indices withcountry-specific measures of the relative publicness λ of payoffs, just as in equation (1). Finally,we test the full model by adding to the previous specification the extent of group cohesion αindependently computed for each country. In both the second and third stages we also retain thetwo distributional indices without interaction in order to verify whether the significance comespurely from the ethnic structure of the different countries or because this structure interacts withλ and α in the way predicted by the theory.
In stage 1, then, we regress conflict linearly on the two distributional indices and all other con-trols. Columns 1 and 2 in Table 1 record the results for each specification of the conflict intensityvariable — PRIO-C and ISC—. Ethnicity turns out to be a significant correlate of conflict, insharp contrast to the findings of the previous studies mentioned above. Throughout, P is highlysignificant and positively related to conflict. F also has a positive and significant coefficient.
Quite apart from statistical significance, the effect of these variables is quantitatively important.Taking Column 1 as reference, if we move from the median polarized country (Germany) tothe country in the 90th percentile of polarization (Niger), while changing no other institutionalor economic variable in the process and evaluating those variables at their means, the predictedprobability of experiencing conflict (i.e, the probability of observing strictly positive values ofPRIO-C) rises from approximately 16% to 27%, which implies an increase of 69%. Performing

12
[1] [2] [3] [4] [5] [6]Variable PRIO-C ISC PRIO-C ISC PRIO-C ISC
P ∗∗∗ 5.16(0.001)
∗∗∗19.50(0.002)
- 1.48(0.606)
-16.33(0.227)
- 1.47(0.701)
-23.80(0.212)
F ∗ 0.93(0.070)
∗ 3.56(0.061)
0.76(0.196)
0.31(0.878)
0.87(0.403)
- 0.16(0.710)
PΛ ∗∗∗11.174(0.003)
∗∗∗61.89(0.001)
F (1− Λ) ∗ 1.19(0.097)
∗∗∗10.40(0.000)
PΛA ∗12.65(0.087)
∗∗∗90.32(0.010)
F (1− Λ)A 2.54(0.164)
∗∗13.15(0.018)
GDPPC ∗∗- 0.34(0.047)
∗∗∗- 2.26(0.004)
∗- 0.36(0.080)
∗∗∗- 3.02(0.001)
- 0.25(0.375)
∗∗∗- 3.68(0.007)
POP ∗∗∗ 0.24(0.000)
∗∗∗ 1.14(0.000)
∗∗∗ 0.21(0.001)
∗∗∗ 1.30(0.000)
∗ 0.09(0.166)
∗∗ 1.29(0.013)
NR - 0.27(0.178)
- 0.53(0.497)
- 0.00(0.570)
0.00(0.432)
∗∗ 0.00(0.011)
∗ 0.00(0.090)
MOUNT 0.00(0.537)
0.02(0.186)
0.00(0.362)
∗ 0.03(0.061)
∗ 0.01(0.060)
∗∗ 0.05(0.020)
NCONT ∗∗∗ 1.06(0.001)
∗∗∗ 4.55(0.001)
∗∗ 0.77(0.026)
∗∗∗ 4.28(0.001)
∗∗∗ 1.37(0.004)
∗∗∗ 5.89(0.000)
POLITICS 0.18(0.498)
0.29(0.789)
- 0.00(0.328)
∗∗- 0.00(0.026)
0.00(0.886)
- 0.00(0.374)
LAG ∗∗∗ 1.99(0.000)
∗∗∗ 0.46(0.000)
∗∗∗ 1.94(0.000)
∗∗∗ 0.44(0.000)
∗∗∗ 1.84(0.000)
∗∗∗ 0.40(0.000)
CONST - 0.90(0.915)
- 9.19(0.398)
- 15.40(0.328)
(Pseudo)-R2 0.35 0.43 0.36 0.44 0.40 0.43Observations 1125 1111 1104 1090 447 443Countries 138 138 138 138 53 53
TABLE 1. Ethnicity and Conflict.Notes. All specifications employ region and time dummies, not shown explicitly. p-values arereported in brackets. Robust standard errors adjusted for clustering have been employed to com-pute z-statistics. Columns [1], [3] and [5] are estimated by maximum likelihood in an orderedlogit specification, and columns [2], [4] and [6] by OLS. GDPPC: log of gross domestic productper-capita; POP: log of population; NR: a dummy for oil and/or diamonds in Columns 1 and 2and oil reserves per-capita (OILRSVPC) for columns [3]–[6]; MOUNT: percentage of mountainousterritory; NCONT: non-contiguous territory, see text; POLITICS is DEMOC in columns [1] and [2]and the index PUB times GDPPC (the numerator of λ) for the remaining columns; LAG: laggedconflict in previous five-year interval.
the same exercise for F (countries at the median and at the 90th percentile of F are Moroccoand Cameroon, respectively) takes us from 0.19% to 0.25% (an increase of 31%). These are

13
(A) Polarization and Conflict
(B) Fractionalization and Conflict
FIGURE 3. ETHNICITY AND CONFLICT. Dots represent the maximum yearly conflictintensity that each country has experienced over the period; smaller dots meet the 25-death PRIOcriterion, while larger dots satisfy the 1000-death criterion. A darker country color signifies higherdegrees of polarization (in panel A) or fractionalization (in panel B). Countries for which no dataare available are depicted in grey.
remarkably strong effects, not least because in the thought experiment we change only the levelof polarization or fractionalization, keeping all other variables the same.

14
Figure 3 depicts two world maps. The dots in each map show the maximum yearly conflictintensity experienced by each countries; smaller dots meet the 25-death PRIO criterion, whilelarger dots satisfy the 1000-death criterion. The upper panel color-codes countries accordingto polarization: darker colors signify higher degrees of polarization. The lower panel does thesame for fractionalization. While these maps cannot hope to replicate the deeper findings of thestatistical analysis, the positive relationship between conflict and ethnic divisions should be clearthroughout.
In stage 2, we take on board the cross-country variation in relative publicness; recall our proxyindex Λ from (2). In Columns 3 and 4 in Table 1 the main independent variables are P ∗ Λ andF ∗ (1 − Λ), just as specified by the theory; see equation (1). This allows to test whether theinteracted indices of ethnic fractionalization and polarization are significant. We also includethe non-interacted indices in order to examine whether their significance truly comes from theinteraction term. Indeed, polarization interacted with Λ is positive and highly significant, andthe same is true of fractionalization interacted with 1 − Λ. These results confirm the relevanceof both polarization and fractionalization in predicting conflict once the variables are interactedwith relative publicness in the way suggested by the theory.
It is of interest to note that the level terms P and F are now no longer significant. Indeed,assuming that our proxy for relative publicness accurately captures all these issues at stake, thisis precisely what the model would predict. For instance, polarization should have no furthereffect over and beyond the “λ-channel”: its influence should dip to zero when there are no publicgoods at stake. The fact that our estimate Λ happens to generate exactly this outcome is ofinterest. But the public component of that estimate is built solely on the basis of governancevariables. If this wipes out all extraneous effects of polarization (as it indeed appears to do), itpossibly suggests that primordial factors such as pure ethnic differences per se have little to dowith ethnic conflict.
Finally, in our third stage, we allow group cohesion to vary across countries. Unfortunately, weare able to proxy A for just 53 countries, and this restricts the number of our observations to 447.Columns 5 and 6 of Table 1 examine this variant. In this specification the independent variablesare exactly in line with those described by the model, though we’ve had to sacrifice data. Weuse precisely the combinations asked for by the theory: polarization is weighted both by Λ andby A, and fractionalization by (1 − Λ) and by A again. We continue to employ the direct termsP and F , as well as the controls. The results continue to be striking. The composite terms forpolarization are significant while the levels are not. The composite term for fractionalization ishighly significant when we focus on smaller-scale social unrest, as measured by ISC, but it ismarginally non-significant in Column 5. The level terms of F continue to be insignificant. Thisbehavior of fractionalization mirrors previous results that showed the non-robust association ofF and different manifestations of conflict (7, 36).
What Have We Learned?
Existing ethnographic literature makes it clear that the majority of within-country social conflictshave a strong ethnic or religious component. But the ubiquity of ethnic conflict is a differentproposition from the assertion of an empirical link between existing ethnic divisions and conflict

15
intensity. We’ve argued in this article that such a link can indeed be unearthed, provided thatwe’re willing to write down a theory that tells us what the appropriate notion of an “ethnicdivision” is. The theory we discuss points to one particular measure — polarization — whenthe conflict is over public payoffs such as political power. It also points to a different measure— fractionalization — when the conflict is over private payoffs such as access to resource rents.Indeed, the theory also tells us how to combine the measures when there are elements of bothpublicness and privateness in the prize. With these considerations kept squarely in mind, theempirical links between ethnicity and conflict are significant and strong.
The theory and empirical strategy together allow us to draw additional interesting inferences. Inthe first place, we find conclusive evidence that civil conflict is associated with (and possiblydriven by) public payoffs, such as political power, and not just by the quest for private payoffsor monetary gain. Otherwise only fractionalization would matter, and not polarization. In thesecond place, the disappearance of the level effects of P and F once interactions with relativepublicness are introduced (as specified by the theory) strongly suggests that ethnicity matters, notintrinsically as the primordialists would claim, but rather instrumentally when ethnic markers areused as a means of restricting political power or economic benefits to a subset of the population.
One might object that the results are driven by the peculiarities of some regions that exhibit bothhighly polarized ethnicities and frequent and intense conflicts. Africa is a natural candidate thatcomes to mind. However, if we use regional controls or repeat the exercise by removing onecontinent at a time from the dataset, we obtain exactly the same results; see (51).
That said, it is too much to assert that every conflict in our dataset is ethnic in nature, and thatour ethnic variables describe them fully. Consider, for instance, China or Haiti or undividedKorea, which have experienced conflict and yet have low polarization and fractionalization. Allconflict is surely not ethnic, but what is remarkable is that so many of them are, and that theethnic characteristics of countries are so strongly connected with the likelihood of conflict. Yetwe must end by calling for a deeper exploration of the links between economics, ethnicity andconflict.
This paper takes a step towards the establishment of a strong empirical relationship between con-flict and certain indicators of ethnic group distribution, one that is firmly grounded in theory. Inno case did we use income-based groups or income-based measures, and in this sense our studyis perfectly orthogonal to those that attempt to find a relationship between economic inequalityand conflict, such as those surveyed in (17). Might that elusive empirical project benefit fromtheoretical discipline as well, just as the ethnicity exercise here appears to? It well might, andsuch an endeavor should be part of the research agenda. But with ethnicity and economics jointlyin the picture, it is no longer a question of one or the other as far as empirical analysis is con-cerned. The interaction between these two themes now takes center stage. As we have alreadyargued, there is a real possibility that the economics of conflict finds expression across groupsthat are demarcated on other grounds: religion, caste, geography or language. Such markers canprofitably be exploited for economic and political ends, even when the markers themselves havenothing to do with economics. A study of this requires an extension of the theory to include theeconomic characteristics of ethnic groups, and how such characteristics influence the supply ofresources to conflict. It also requires the gathering of group data at a finer level that we do not

16
currently possess. In short, a more nuanced study of the relative importance of economic versusprimordial antagonisms must await future research.
References and Notes
(1) N. P. Gleditsch, P. Wallensteen, M. Eriksson, M. Sollenberg, and H. Strand, J. of Pce.Res. 39, 615 (2002). Data accessed October, 2010.
(2) L. Bethany, N. P. Gleditsch, Eur. J. of Pop. 21, 145 (2005). Data accessed March, 2012.(3) Political Instability Task Force, http://globalpolicy.gmu.edu/pitf/pitfcode.htm. Data accessed
March, 2012.(4) Global Burden of Armed Violence, Geneva Declaration (2008),
http://www.genevadeclaration.org/. Data accessed March, 2012.(5) UN website http://ochaonline.un.org/. Data accessed March, 2012.(6) Upsala Conflict Data Program, http://www.pcr.uu.se/research/UCDP/. Data accessed March,
2012.(7) J. Fearon and D. Laitin, Am. Pol. Sc. Rev. 97, 75 (2003).(8) J. D. Fearon in The Oxford Handbook of Political Economy, ed. B. R. Weingast and D.
A. Wittman, Oxford: Oxford University Press, 852.(9) J. D. Fearon J. of Econ. Growth 8, 195.
(10) R. Brubaker and D. D. Laitin Annu. Rev. Sociol 24, 423 (1998).(11) D. Horowitz, Ethnic Groups in Conflict. (University of California Press, Berkeley, 1985).(12) C. Blattman and E. Miguel, J. Econ. Lit. 48, 3 (2010).(13) M. Garfinkel and S. Skaperdas (eds), Oxford Handbook of the Economics of Peace and
Conflict, Oxford University Press (2011).(14) M. Garfinkel and S. Skaperdas, “Economics of Conflict: An Overview” in T. Sandler and
K. Hartley (eds.), Handbook of Defense Economics, Vol. 2 (Amsterdam, North Holland,2007)
(15) R. Dahrendorf, Class and Class Conflict in Industrial Society. (Stanford Univ. Press,California, 1959).
(16) A. Sen, On Economic Inequality. (Clarendon Press, Oxford, 1973).(17) M.I. Lichbach, World Pol. 4, 431 (1989).(18) M. I. Midlarsky, Am. Pol. Sc. Rev. 82, 492 (1988).(19) R. H. Bates, “Modernization, Ethnic Competition, and the Rationality of Politics in Con-
temporary Africa”. In State versus Ethnic Claims: African Policy Dilemmas, ed. D.Rothchild and V. A. Olunsorola. Boulder, CO: Westview Press, (1983).
(20) A. Varshney, Ethnic Conflict and Civic Life: Hindus and Muslims in India. (Yale Uni-versity Press, New Haven, 2002.)
(21) J. Esteban and D. Ray, American Economic Review, 98, 2185 (2008).(22) J. Esteban and D. Ray, J. Eur. Econ. Assoc. 9, 496 (2011).(23) N. Sambanis, “Theory of Civil War. In Understanding Civil War: Evidence and Analysis,
Volume 1: Africa, ed. Paul Collier and Nicholas Sambanis. Washington, D.C.: WorldBank (2005)
(24) F. Stewart, “Horizontal Inequalities: A Neglected Dimension of Development”. Helsinki:UNU-WIDER Working Paper, http://www.wider.unu.edu/publications/annual-lectures/en GB/AL5/(2002).

17
(25) L. E. Cederman, N. B. Weidmann, and K. S. Gleditsch, Am. Pol. Sc. Rev. 105, 478(2011).
(26) G. Østby, J. of Pce. Res. 45, 143 (2008).(27) J. Fearon “Ethnic Mobilization and Ethnic Violence” In B. R. Weingast and D. Wittman,
eds.,Oxford Handbook of Political Economy. Oxford: Oxford University Press, 2006.(28) S. Huntington The Clash of Civilizations and the Remaking of World Order. New York:
Simon and Shuster (1996).(29) M. Ignatieff, Blood and Belonging. London: Noonday Press (1993).(30) A. Rabushka, and K. A. Shepsle, Politics in Plural Societies: A Theory of Democratic
Instability. Columbus, OH:Merrill (1972).(31) A. Alesina, R. Baqir and W. Easterly, Quart. J. of Econ. 114,1243 (1999).(32) Alesina, A., A. Devleeschauwer, W. Easterly, S. Kurlat, and R. Wacziarg, J. Econ.
Growth 8, 155 (2003).(33) A. Alesina and E. La Ferrara, J. of Econ. Lit. 43 762 (2005).(34) J. Matuszeski and F. Schneider “Patterns of Ethnic Group Segregation and Civil Con-
flict”, http://www.cgdev.org/doc/events/02.09.07/Matuszeski-JMP.pdf (2006).(35) N. B. Weidmann, J.K. Rød, and L.-E. Cederman (2010) J. of Pce. Res. 47 491 (2010).(36) P. Collier and A. Hoeffler Oxford Econ. Papers 56, 563 (2004).(37) K. Desmet, I. Ortuno-Ortın, and S. Weber, Journal of the European Economic Associa-
tion, 7, 1291 (2010).(38) L-E. Cederman and L. Girardin, Am. Pol. Sc. Rev. 101, 173 (2007).(39) W. Easterly and R. Levine, Quart. J. of Econ. 111, 1203 (1997).(40) P. Mauro, Quart. J. of Econ. 110, 681 (1995).(41) P. Collier and A. Hoeffler Oxford Econ. Papers 50, 563 (1998).(42) N. Sambanis J. Cnfl. Res. 48, 814 (2004).(43) C. Tilly, Politics of Collective Violence. Cambridge: Cambridge University Press, (2003).(44) E. Miguel, E., Satyanath, S. and E. Sergenti, J. Pol. Econ. 112, 725 (2004).(45) J. Esteban and D. Ray, Econometrica 62, 819 (1994).(46) J-Y Duclos, J. Esteban and D. Ray, Econometrica 72, 1737 (2004).(47) Wolfson M.C., Am. Econ. Rev. P&P 84, 353 (1994).(48) J. Montalvo and M. Reynal-Querol Am. Econ. Rev. 95, 796 (2005).(49) H. Hegre and N. Sambanis, J. Cnfl. Res. 50, 508 (2006).(50) J. Esteban and D. Ray, Am. Econ. Rev. 101, 1345 (2011).(51) J. Esteban, L. Mayoral, and D. Ray, Am. Econ. Rev. 102 (2012), in press,
http://www.econ.nyu.edu/user/debraj/.(52) F. Caselli and W. J. Coleman, “On the Theory of Ethnic Conflict”, http://personal.lse.ac.uk/casellif/.(53) J. Robinson, Econ. of Gov. 2, 85 (2001).(54) J. Esteban and D. Ray, J. Econ. Th. 87, 379 (1999).(55) A. Banks, Databanks International, Jerusalem, (2008), http://www.databanksinternational.com/.(56) Laitin, D. D. Am. J. Pol. Sci. 44, 142 (2000).(57) Desmet, Klaus, Ignacio Ortuno-Ortın, and Romain Wacziarg,, J. Dev. Econ. 97, 322
(2012).(58) Ethnologue, http://www.ethnologue.com/.(59) R. D., Gray, Q. D. Atkinson, Nature 426, 435 (2003).

18
(60) L.L. Cavalli-Sforza, A. Piazza, P. Menozzi, J. Mountain, P. Natl. Acad. Sci. USA 85,6002 (1988).
(61) E.M.S. Belle, G. Barbujani, Am. J. of Phys. Anthr. 133, 1137 (2007).(62) M. Ross, J. of Pea. Res. 42, 337 (2004).(63) M. Ross, Annu. Rev. of Pol. Sc. 9, 265 (2006).(64) M. Humphreys, J. Confl. Resolut. 49, 508 (2005).(65) http://www.worldvaluessurvey.org/
Acknowledgements. Esteban, Mayoral, and Ray gratefully acknowledge financial support fromCICYT project ECO2011-25293 and from Recercaixa. Esteban and Mayoral acknowledge fi-nancial support from the AXA Research Fund. Ray’s research was funded by National Sci-ence Foundation Grant SES-0962124. We thank a Senior Editor and two referees for valuablecomments. We are particularly grateful to Raji Jayaraman for specific suggestions that greatlyimproved the exposition of the paper.
Technical Box
A MODEL OF CONFLICT AND DISTRIBUTION
The two measures of ethnic divisions discussed in this article are both based on the same under-lying parameters: the number of groups m and total population N , the population Ni of eachgroup, and the intergroup distances dij . Polarization and fractionalization are given by:
P =m∑i=1
m∑j=1
n2injdij and F =
m∑i=1
m∑j 6=i
ninj,
where ni = Ni/N is the population share of group i. The distinction between P and F issuperficial at first sight but it is of great conceptual importance. The squaring of populationshares in P means that group size matters over and above the mere counting of individual headsimplicit in F . In addition, fractionalization F discards inter-group distances and replaces themwith 0-1 variables.
The theory developed in (50) and summarized below links these measures to conflict incidence.There are m groups engaged in conflict. The winner enjoys two sorts of prizes: one is “private”and the other is “public”. Let µ be the per-capita value of the private prize at stake. Let uij be theutility to an individual member of group i from the policy implemented by group j. For any i theutility from the ideal policy is strictly higher than any other policy, that is, uii > uij . Then, the“distance” between i and j is dij ≡ uii − uij , so that the loss to i from j’s ideal policy is dij . Letπ be the amount of money an individual is willing to give up in order to bring the implementedpolicy one unit towards her ideal policy. Then, we can say that the monetary value to a memberof group i of policy j is πuij and the loss relative to the ideal policy is πdij . Individuals ineach group expend resources r to influence the probability of success of their own group. Writethe income equivalent cost to such expenditure as c(r) and assume that c is increasing, smooth,and strictly convex, with c′(0) = 0. Add individual contributions in group i to obtain groupcontribution Ri. Assume that the probability of success for group i is given by pi = Ri/RN ,where RN ≡
∑iRi. Measure conflict intensity in population-normalized form by ρ = RN/N .

19
The direct payoff to a person in group i who expends resources r is given by πuii + piµ/ni −∑mj=1 pjπdij − c(r). Individuals also care about the payoff to the other group members. When
deciding on how much r to contribute individuals seek to maximize the sum of their direct payoffand the total of the other group members, weighted by a group commitment factor α. Note thatthe optimal contribution ri by a member of group i depends on the contributions made by allother individuals. We focus on the Nash equilibrium of this strategic game: the vector of actionswith the property that all are the best response to each other. We prove that such an equilibriumalways exists and that it is unique.
Note now that c′(r) is the implicit “price” in sacrificed income than an individual is willing topay for an extra unit of effort contributed to conflict. We then define the per capita normalizedintensity of conflict C as the value of the resources expended C = c′(ρ)ρ. Hence, C
π+µis the ratio
of the resources waisted in conflict relative to the stakes, all expressed in monetary terms. Propo-sition 2 in (50) shows that the equilibrium intensity of conflict C is approximately determined asfollows:
C
π + µ' α
[λP + (1− λ)F
]+ λ(1− α)
G
N+
(1− λ)(1− α)(m− 1)
N,
where λ ≡ π/(π + µ) is the relative publicness of the prize, and where G is a third measure ofethnic distribution, the Greenberg-Gini index: G =
∑mi=1
∑mj=1 ninjdij . Its influence wanes with
population size and we’ve ignored it in this essay, though (50, 51) contain a detailed discussionof all three measures.
For large populations the expression above reduces to the one in the main text.