Ethnic hierarchy and public attitudes towards immigrants ...
46
Ethnic hierarchy and public attitudes towards immigrants in Russia Alexey Bessudnov (University of Exeter, [email protected]) December 2015 This is a pre-copyedited, author-produced PDF of an article accepted for publication in the European Sociological Review. The version of record (published online on 13 February 2016, DOI: 10.1093/esr/jcw002) is available online at: http://esr.oxfordjournals.org/content/early/ 2016/02/12/esr.jcw002. 1
Transcript of Ethnic hierarchy and public attitudes towards immigrants ...

Ethnic hierarchy and public attitudes towards
immigrants in Russia
Alexey Bessudnov
(University of Exeter, [email protected])
December 2015
This is a pre-copyedited, author-produced PDF of an article accepted
for publication in the European Sociological Review. The version of
record (published online on 13 February 2016, DOI: 10.1093/esr/jcw002)
is available online at: http://esr.oxfordjournals.org/content/early/
2016/02/12/esr.jcw002.
1

Abstract
Explanations of anti-immigrant attitudes in Europe have been
centred around the labour market competition and group threat
theories. The paper tests these theories with the data from Rus-
sia and finds some support for the group threat theory. Attitudes
towards several immigrant ethnic groups are analysed separately.
While Russians generally accept Ukrainians and Moldovans as their
potential neighbours, they are more hostile to immigrants from the
Caucasus and Central Asia. This ethnic hierarchy is shared by all
large ethnic groups populating Russia. The analysis of regional
level covariates of anti-immigrant sentiment shows that higher con-
centration of immigrants is associated with more negative attitudes
towards most immigrant groups, except Ukrainians. Poorer regions
are more xenophobic. The predictive power of statistical models
explaining anti-immigrant prejudice is considerably lower in Russia
compared to Western European countries. The paper discusses to
what extent standard explanations of anti-immigrant attitudes in
Europe can be applied in Russia.
2

A large inflow of immigrants to Western Europe and the USA in the
last decade raises a question about the association between the size of the
immigrant population and anti-immigrant attitudes. The group threat
theory predicts that the increase in the number of immigrants may lead to
more xenophobia. Empirical studies conducted in Europe so far produced
contradictory results. Most studies found that there is a positive corre-
lation between immigrant population size and anti-immigrant attitudes,
but some studies did not detect any effects. There is an increasing un-
derstanding in the literature that attitudes to immigrants from different
regions vary and some immigrant groups may trigger negative reactions
of the natives to a larger extent than others.
In this paper we explore these ideas looking at the attitudes towards
immigrants in Russia. Despite having one of the largest immigrant pop-
ulations in the world, Russia has rarely been in the focus when it comes
to studies of attitudes to immigrants. We use a survey of 24,500 individ-
uals conducted in 2011 to investigate whether anti-immigrant attitudes
in Russia can be better explained by economic competition at the in-
dividual level or the group threat theory. The sample size and design
of the survey allow us to compare attitudes towards immigrants across
Russian regions and identify regional level correlates of xenophobic atti-
tudes. This analysis contributes to testing the group threat theory and to
the discussion of macro-level contextual determinants of anti-immigrant
prejudice. In addition, the paper presents an analysis of the attitudes to-
wards different immigrant ethnic groups and explores an ethnic hierarchy
in the attitudes towards immigrants.
3

The group threat theory receives some support from the data. At-
titudes towards immigrants in regions with a higher immigrant concen-
tration are more negative. At the same time, poorer regions are also
more xenophobic. Not all immigrants are equally unwelcome. Ukraini-
ans and Moldovans are more acceptable to Russians than immigrants
from the Caucasus and Central Asia. Interestingly, this perceived ethnic
hierarchy is shared by all large ethnic groups populating Russia.
The paper is structured as follows. Section 1 provides a review of
the main theories that explain anti-immigrant attitudes and formulates
research questions. Section 2 presents main facts about international
migration in Russia and reviews previous studies of anti-immigrant atti-
tudes in this country. Section 4 discusses the data and modelling strat-
egy, section 5 presents results of the analysis and section 6 discusses the
findings.
1 Determinants of the attitudes to immigrants.
Research questions
One of the central theoretical questions in the study of anti-immigrant
attitudes is whether they can be better explained by individuals’ eco-
nomic circumstances or concerns about cultural and economic effects of
immigration at the group level. Two main theories have been proposed.
According to the labour market competition theory, immigrants may
constitute an economic threat to native workers, especially in low paid
unskilled occupations. Since the reservation wage of many immigrants
is lower than for natives they may push local workers out of the labour
4

market and increase unemployment. This also intensifies competition
over housing. In response, natives may form negative attitudes about
immigrants and immigration (see, for example, Mayda, 2006). Accord-
ing to this theory, individuals form their attitudes on the basis of their
personal economic interests.
The group threat theory suggests that negative views about immi-
grants are mostly driven by concerns about the effect of immigration on
society at large (see a review in Ceobanu and Escandell, 2010). These
concerns may be cultural (such as the fear of losing natives’ collective
identity) or economic (such as worries about the fiscal contribution of
immigrants). Thus, people may perceive immigrants as a threat irre-
spective of their personal economic status.
Most research conducted to date suggests that the perceived cul-
tural and economic threat at the societal level is more important for
determining attitudes towards immigrants than personal economic cir-
cumstances (Hainmueller and Hopkins, 2014). Hainmueller and Hiscox
(2007) showed that individual cultural values and beliefs explained at-
titudes towards immigrants better than economic concerns. Dustmann
and Preston (2007) demonstrated that for the British public, welfare and
cultural concerns about immigration outweighed concerns related to the
labour market competition.
One of the ways to test the economic competition theory empirically
is simply to look at the individual level correlates of attitudes towards
immigrants. If people’s attitudes are driven by their personal economic
circumstances we may expect the unemployed and members of occu-
5

pations where competition with the immigrants is stronger to be more
xenophobic. To test the group threat theory researchers usually looked
at the macro-level correlates of anti-immigrant views, often with data
from the European Social Survey (ESS), the Eurobarometer, and other
cross-national surveys. We may expect that a higher concentration of
immigrants will activate the group threat mechanism and will be asso-
ciated with more negative attitudes. Economic conditions may also be
important if group threat is mostly perceived as related to the economy:
in countries with lower incomes and higher unemployment the impact of
immigration may be viewed as mostly negative.
A number of studies, starting with the pioneering work by Quillian
(1995), empirically assessed the association between the proportion of
immigrants in the population and anti-immigrant views. In European
countries with more immigrants attitudes towards them were generally
more negative (Meuleman et al., 2009; Scheepers et al., 2002; Semyonov
et al., 2006, 2008; Schneider, 2008). However, most studies were cross-
sectional and it is unclear if the observed statistical association can be
interpreted as causal. (See Hainmueller and Hopkins (2014) on the recent
research aimed to strengthen causal inference in studies of the attitudes
towards immigrants). More recently, several studies looked at the macro-
level predictors of xenophobic views at a regional rather than national
level. Hjerm (2009) studied attitudes towards immigrants at the munic-
ipal level in Sweden and concluded that the proportion of immigrants
was not associated with the attitudes towards them. Evidence from the
UK suggested that attitudes towards immigrants in London where many
6

foreigners resided were better than in other parts of the country, even
among white Britons (Blinder, 2011). Rustenbach (2010) used the ESS
data and did not find an effect of the number of immigrants on attitudes
either at the regional or national levels. Contrary to this, in the regional-
level analysis based on the ESS data Markaki and Longhi (2013) found a
positive association between the proportion of immigrants born outside
the EU and the anti-immigrant views.
The literature in this field has often treated immigrants as a homoge-
neous group. However, the countries of origin of immigrants are different
from one European country to another and public attitudes are likely to
vary depending on immigrants’ ethnicity. Ford (2011) provided evidence
that in Britain immigration from Australia and Western Europe faced
weaker public opposition than immigration from Africa, South Asia and
the Caribbean. In Switzerland immigrants from former Yugoslavia and
Turkey were perceived more negatively than immigrants from northern
and western European countries (Hainmueller and Hangartner, 2013).
Bridges and Mateut (2014) showed that Europeans were more likely to
oppose immigration of racially different groups. Incorporating ethnic
heterogeneity of immigrant populations is important for a more nuanced
understanding of public attitudes towards them.
Some ideas from social psychology may be helpful in this regard.
Hagendoorn (1995) reviewed the studies of ethnic hierarchies based on
various measures of social distance between ethnic groups (mostly sur-
vey questions about ethnic preferences in personal relationships). He
identified three main components of ethnic hierarchies. First, almost
7

all ethnic groups prefer social contacts within their own group (ingroup
preference). Second, when it comes to contacts with members of other
ethnic groups, there is a hierarchy of preferences that is shared within
the same group (ingroup consensus). A number of studies in Europe, the
USA and Canada demonstrated that people of Northern European origin
were usually placed at the top of the hierarchy, followed by South and
Eastern Europeans, while Asians and Africans were at the bottom of the
hierarchy. Finally and perhaps most surprisingly, members of different
ethnic groups, including those that are placed rather low in the ethnic
hierarchy, seem to accept it (intergroup consensus).
Following this literature, this paper seeks to answer three research
questions. First, does the labour market competition theory explain anti-
immigrant attitudes in Russia? The paper tests this by looking at the
association between personal socio-economic position and attitudes to-
wards immigrants. Second, is there a significant regional variation in
views on immigrants and do regional level covariates such as the immi-
grant concentration and state of economy contribute to explaining it?
This question seeks to test the group threat theory. Finally, is there any
heterogeneity in attitudes to different immigrant ethnic groups? Do they
form an ethnic hierarchy and if yes, is it shared across ethnic groups
populating Russia?
2 Immigration to Russia
Russia is a country with one of the largest immigrant populations in the
world. According to the OECD estimates (OECD, 2013), in 2010 there
8

were 11.2 million foreign-born residents in Russia (7.9% of its total pop-
ulation), second only to the USA with their foreign-born population of
40.4 million. This estimate is based on the 2010 Russian census and may
be somewhat misleading, as ethnic Russians born outside Russia in the
Soviet time (in Ukraine, Central Asia, etc.) were also counted as foreign-
born. Another estimate comes from the Russian Federal Migration Office
(FMO) that regularly publishes data on the number of foreign passport
holders present in Russia. The data come from registering people enter-
ing and leaving Russia at border checkpoints. As of 14 December 2012,
this number was 10.3 million (Bessudnov, 2012). Clearly, there is a dif-
ference between the FMO data counting foreign nationals and the census
data on ethnicity and migration status. FMO data include temporary
visitors, but not naturalised immigrants. On the other hand, census data
are particularly unreliable when it comes to the number of immigrants
as many of them were not surveyed.
History of immigration in post-Soviet Russia comprises of several
waves. After the collapse of the USSR in 1991, ethnic Russians living
in former Soviet republics (particularly Kazakhstan) started to return to
Russia. At the same time, there was a significant migrant influx to Rus-
sia of ethnic Armenians, Azerbaijanis and Georgians who were trying to
escape violent ethnic conflicts and severe economic problems in the Cau-
casus. According to the 2010 census, there were 1.2 million Armenians in
Russia, which made them the seventh largest ethnic group in the country
(after Russians, Tatars, Ukrainians, Bashkirs, Chuvashes and Chechens).
Azerbaijanis numbered 0.6 million.
9
Economic recovery that began in the 2000s brought in a new wave of
immigrants, mostly attracted by new opportunities in the labour mar-
ket. They mostly came from Ukraine, Moldova and Central Asian states,
particularly Uzbekistan, Tajikistan, and Kyrgyzstan. Legal obstacles for
mass immigration have been low since Russia has a visa free regime with
most former Soviet republics except the Baltic states, Georgia and Turk-
menistan. The FMO data showed that there were 2.3 million Uzbek
nationals in Russia in December 2012 while the number of Uzbeks ac-
counted for in the 2010 census was only 0.3 million. The number of
Tajiks was 1.1 million in the FMO data and 0.2 million in the census.
The FMO reported 1.4 million Ukrainian passport holders and Ukraini-
ans numbered 1.9 million in the census. Many of them moved to Russia
long ago and naturalised so these two groups are likely to only partially
overlap. Among the other large groups reported in the FMO data there
were nationals of Kazakhstan, Kyrgyzstan and Moldova, each of these
countries having 0.5 million citizens in Russia. Many immigrants in this
more recent wave were employed in low-skilled manual jobs in the service
sector, construction, industry and agriculture (Lokshin and Chernina,
2013).1
As follows from these data, most immigrants came to Russia from
the former Soviet states. Immigration from outside the former USSR
was limited. The largest community was the Chinese whose number is
1The 2014-15 conflict in Eastern Ukraine brought in to Russia a large number ofrefugees and forced migrants and changed the relative proportions of immigrants fromdifferent countries. As of 2 July 2015, there were 2.6 million Ukrainian, 2.2 millionUzbek and 1 million Tajik nationals in the country. By comparing these figures to the2012 data we can roughly estimate the number of Ukrainian citizens moving to Russiaafter the beginning of the military conflict at about one million.
10

often exaggerated in the media. In reality, the 2010 census counted only
30,000 Chinese, and the FMO data had about 200,000 Chinese nationals.
Apart from immigration from outside of Russia, there were signifi-
cant internal migration flows. Some of them consisted of ethnic Russians
moving from one region to another whereas others included other eth-
nic groups. In particular, there was a significant out-migration from
the North Caucasus, one of the poorest regions in the country with a
high unemployment rate, populated by various Dagestani ethnic groups,
Chechens, Ingushes, Ossetians, Kabardins, Karachays, and other ethnic
groups. Members of these groups are mostly Russian citizens, but may
speak Russian with an accent, are culturally different from ethnic Rus-
sians and are often perceived as strangers in ethnically Russian regions
and metropolitan centres. On the other hand, Ukrainian and Belaru-
sian migrants blend in much more easily, usually being indistinguishable
from ethnic Russians in appearance and often speaking Russian as their
mother tongue.
3 Attitudes to immigrants in Russia
Attitudes to immigrants in Russia are far from welcoming. The ESS in
2012 included a question on whether a country was made a better or
worse place to live by people coming from other countries, measured on
an 11-point scale where 0 was a “worse place to live” and 10 was a “better
place to live”. The average response for Russia was 3.3. This made Rus-
sia together with Cyprus two countries with the strongest anti-immigrant
attitudes in the ESS sample of 29 European states. The Levada Centre,
11

a Russian polling firm, regularly conducts a survey on the social and eco-
nomic issues Russians are most concerned with. In 2013 27% said that
they were concerned with the inflow of immigrants (compared to 7% in
2005) making it the eighth most pressing issue out of 24 (far behind infla-
tion and poverty that were the most popular responses) (LevadaCentre,
2013). According to a Public Opinion Foundation survey, in Moscow im-
migration was considered by respondents to be the second most pressing
issue, after transportation problems and traffic jams (FOM, 2013).
As space is limited, we do not discuss here all of the existing liter-
ature on ethnic prejudice and immigration in Russia, but rather focus
on the studies that assessed xenophobic attitudes quantitatively with
survey data. Using data from a student survey conducted in 1991-92,
Hraba et al. (1997) compared ethnic prejudice among Russians, Tatars
and Ukrainians in several locations in the former USSR. The results
showed that Russian students were more prejudiced when they had a
majority rather than a minority status, but there was no difference across
locations for Ukrainians and Tatars. With the data from the same sur-
vey, Hagendoorn et al. (1998) studied perceived ethnic hierarchies in the
former USSR. In most ethnic groups and locations in-groups were placed
on the top of the social distance hierarchy. Interestingly, the remaining
part of the ethnic hierarchy was quite stable across groups and locations,
with ethnically Slavic groups generally preferred to Asian groups, even
by non-Slavic groups.
Alexseev (2010) analysed data from surveys of about 3,000 individu-
als conducted in 2005-07 by the Levada Centre across four regions in the
12

Russian South, with a particular focus on mutual attitudes among Rus-
sia’s ethnic groups. He found that ethnic Russians were generally more
hostile towards immigrants than non-Russians and among native ethnic
minorities groups who had titular status in their ethnic republics were
more negative towards immigrants than non-titular groups. Gorodzeisky
et al. (2014) looked at predictors of anti-immigrant attitudes in the Rus-
sian sample of the ESS 2006 (about 2,000 individuals). The theoretical
ambition of the study was to test if the competition and cultural mod-
els applied to the study of anti-immigrant attitudes in Western Europe
could be used in Russia. Their results showed that neither the socio-
economic position of individuals nor their level of political conservatism
predicted anti-immigrant sentiment. Herrera and Kraus (2013a) put for-
ward several theoretical hypotheses regarding the association between
national identity and xenophobia and discussed the opportunities for re-
gional analysis of xenophobic attitudes. In a separate paper Herrera and
Kraus (2013b) tested whether stronger national identity was associated
with increased xenophobia using data from a survey conducted in 2003-
04 by Gerber and Mendelson (11,000 individuals, 43 regions).Different
types of national identity had different effects on xenophobia, and the
intensity of anti-minority views depended on the minority in question
(Roma and Chechens being the least acceptable while Azerbaijanis and
Muslims somewhat more acceptable). The analysis was conducted at
the individual level, without testing the effects of macro-level regional
predictors.
13

4 Data and modelling strategy
The data for this study come from a survey conducted by the Public
Opinion Foundation (FOM) in 2011. FOM is a Russian polling firm that
was founded in 1992 and has an extensive experience of conducting na-
tionally representative surveys. The sample consists of 24,500 individuals
surveyed in 49 Russian regions (out of 83). Missing regions include ethnic
republics in the North Caucasus and Siberia and some regions in central
Russia and the Russian North (see the map in Figure 1). Although,
strictly speaking, the sample was not designed to be representative at
the national level and the selection of regions was largely dictated by
convenience and was not random, the regions in the sample represent
about 77% of Russia’s population.
Multistage stratified sampling was used to sample 500 individuals
aged over 17 in each region so that the design of the survey is suitable for
cross-regional comparisons. To get descriptive statistics at the national
level (or rather at the level representing 77% of Russia’s population) we
apply weight coefficients inversely proportional to the regional population
size. All the interviews were conducted using the face-to-face method at
the respondents’ homes. Table A1 in the Appendix presents descriptive
statistics (both unweighted and weighted) for the variables used in the
analysis and compares them with the data from the 2010 census.
The survey questionnaire was designed specifically to address the
problem of immigration. To operationalize attitudes towards immigrants
we used the questions about how a respondent would feel if an ordi-
nary immigrant family had settled near their place. Six separate ques-
14

tions were asked about immigrants from Ukraine, Moldova, the Caucasus
(Azerbaijanis, Armenians, Georgians), the North Caucasus (Dagestanis,
Chechens, Cherkessians, etc.), Central Asia (Kyrgyz, Uzbeks, Tajiks) and
South-East Asia (Chinese, Vietnamese, Koreans). The ethnic groups in
the parentheses above are the ones that were specified in the survey ques-
tionnaire. The answers were recorded on a scale from one (very positive)
to five (very negative). Note that immigrants from the North Caucasus
who are Russian nationals were listed along with immigrants from outside
of Russia. The survey question about attitudes to potential neighbours is
standard in social distance research and in our case it allows us to study
attitudes to different immigrant ethnic groups separately.
There were 3,110 people (13% of the sample) who did not answer the
question about at least one of the six ethnic groups. This response was
least popular in case of immigrants from Ukraine (3%) and most popular
for immigrants from South-East Asia (6%) with whom people in many
Russian regions have little or no contact. To avoid dropping these cases
we fill in missing values applying multiple imputation (as implemented
in the Amelia package in R (Honaker et al., 2011)). The results reported
below are based on the analysis of imputed datasets.
The variables measuring attitudes towards different groups of immi-
grants correlate well and produce an index with Cronbach’s alpha 0.89.
For ethnically non-Russian respondents we exclude the items measuring
attitudes to their own or close ethnic groups (for example, for Chechens
attitudes to immigrants from the North Caucasus, etc.). The final index
was calculated as an average response to the items measuring attitudes
15

to the ethnic groups different from the respondent’s ethnic group. The
index ranges from one (least xenophobic) to five (most xenophobic).
The statistical analysis presented below is based on the following
logic. Since the data have a two-level structure (individuals in regions)
we employ linear mixed effects (multilevel) modelling. First, we estimate
a model with individual-level predictors only. Some of the predictors
(such as employment status) aim to test the labour market competition
theory. Others are included to investigate the association between other
socio-demographic characteristics and attitudes towards immigrants and
compare the results with the findings from previous studies conducted
mostly in Western Europe. Individual level predictors include sex, age,
education, individual monthly income, employment status and occupa-
tion, ethnicity, type of residence, religious denomination, personal expe-
rience of immigration and experience of hiring an immigrant.
Next, we add to the model regional level predictors. We use two in-
dependent measures of immigrant population density: the regional pro-
portion of legally employed immigrants and the number of international
money transfers in the region. These variables test the group threat the-
ory. According to the official data, in 2011 1.76 million foreign nationals
had either a work permit or a patent that allowed them to be legally
employed. It is more difficult to estimate the number of those employed
illegally, but it was likely to be at least just as many. Work permit and
patent quotas were assigned at the regional level, and we use the num-
ber of legally employed foreign nationals in the region (divided by the
size of the regional population aged over 16) as a proxy for immigrant
16

concentration.
To check robustness of our findings, we employ another measure of
immigrant concentration. The Bank of Russia keeps statistics on the
number of international money transfers made by individuals without
opening a bank account. While these data include all the payments made
by Russian citizens and immigrants, in practice this type of payment is
typical for the money transfer systems that immigrants often use for
sending remittances. We only use the data for the payments made to
individuals (not organisations) outside of Russia. The earliest year for
which these data are available is 2013. As we are mostly interested in
the regional differences, we assume that the geographical distribution of
immigrants did not change significantly in 2013 compared to 2011. For
the analysis we use the data on the number of money transfers divided
by the size of the regional population aged over 16.
To test a hypothesis that regional economic conditions may be associ-
ated with attitudes to immigrants we employ two measures: the regional
unemployment rate and monthly income-to-subsistence ratio (to account
for regional differences in the consumer price index) in 2011. The data for
both variables come from the official surveys conducted by the Russian
Statistical Office. We hypothesize that education may have a liberalizing
effect on attitudes towards immigrants not only at the individual, but
also at the group level and to test this we introduce a variable measuring
the proportion of people with a higher education in the regions. Finally,
ethnic composition of the region may have an effect on attitudes towards
immigrants even after controlling for ethnicity of individual respondents.
17
More specifically, more ethnically diverse regions may be less xenophobic.
To test this, we use the proportion of ethnic Russians in the regions as a
measure of ethnic diversity. The data for the proportion of people with a
higher education and proportion of ethnic Russians come from the 2010
census.
Finally, to explore the ethnic hierarchy in attitudes to immigrants we
conduct an analysis of mean attitudes towards different immigrant ethnic
groups by ethnicity.
5 Results
Russians are sceptical about immigration and immigrants. 53% of the re-
spondents said that they would support banning permanent immigration
from outside of Russia. Answering the question about their attitudes to-
wards potential immigrant neighbours, only 15% of the respondents said
they would be ‘rather’ or ‘completely negative’ about Ukrainians (the
survey was conducted three years before the Russian-Ukrainian conflict
in 2014-15). For immigrants from Moldova this figure goes up to 25%
while for the Caucasus it was 53%, for South-East Asia 54%, for Central
Asia 56%, and for the North Caucasus 61%. A clear ethnic hierarchy
emerges from these numbers as Russians seem to be more welcoming
to Ukrainians and Moldovans and more hostile towards the other four
groups. Note that, despite the North Caucasus being part of Russia the
attitudes towards people from this region are most negative.
The first step in the analysis is to look at the individual level correlates
of anti-immigrant attitudes, with a particular focus on the socio-economic
18

characteristics of individuals. Table 1 presents a random-intercept model
with all the individual predictors of xenophobic attitudes. The bivariate
associations are similar in direction and size so the coefficients from the
model with multiple predictors may be given a straightforward descrip-
tive interpretation.
(Table 1 about here)
Men and women are not significantly different on their attitudes to
immigrants. Older people are slightly less xenophobic than younger,
but the effect size is very small. People with a higher education are
less hostile to immigrants than people with a secondary and vocational
education, but the difference is not large. Controlling for other factors,
the difference between people with higher and secondary education is
0.12, or about 13% of the standard deviation of the dependent variable.
Importantly for our research question, the effects of employment sta-
tus and occupation are also small and often not statistically significant.
Non-manual employees are somewhat less xenophobic than manual work-
ers, but the difference between them is just 0.08. There is no statistically
significant difference between blue collar workers and the unemployed,
and between the unemployed and those not in the labour force. Income
differences do not contribute to explaining the outcome variance either.
Interestingly, people living in the countryside are least xenophobic
while the population of big cities is most xenophobic. This effect is
opposite to what was previously found in Europe. The experience of
immigration has an expected effect: those who have immigrated them-
selves, especially recently, are on average more tolerant. People who have
19
had an experience of hiring immigrants to conduct some work for them
are somewhat less negative towards newcomers. Two interpretations are
possible: contact with the immigrants in a work context could improve
attitudes, or less xenophobic people are more likely to hire foreigners in
the first place.
Religion is not very important as there is no significant difference
in the attitudes of Orthodox Christians and atheists. Smaller groups
of Buddhists, religious Jews and non-Orthodox Christians exhibit less
negative attitudes. There is not much difference between the attitudes
of Orthodox Christians and Muslims, although in this case the effect is
hard to separate from ethnicity. The effects of ethnicity are explored in
more detail below.
The predictive power of the model with all the individual level covari-
ates is very low. All individual level predictors jointly account for only
3% of the outcome variance (R2 was calculated with a method suggested
by Snijders and Bosker (2012, ch.7)). Decomposition of R2 using hierar-
chical partitioning (Gromping, 2006) suggests that ethnicity is by far the
most important predictor, followed by immigration experience, location,
religion and education (in this order).
(Table 2 about here)
Next, we consider regional variation in anti-immigrant attitudes and
the effects of contextual regional level covariates. Figure 1 presents a
map that plots regional mean values of the index of anti-immigrant at-
titudes. The darker colours show more xenophobic regions (Moscow,
Leningrad region, Nizhny Novgorod and Kaluga regions) and the lighter
20

colours mark the less xenophobic regions (Krasnodar kray, Omsk and
Khabarovsk regions, Tatarstan). The general pattern is that regions in
Central Russia are somewhat more xenophobic than in the South, the
Urals, Siberia and the Far East.
(Figure 1 about here)
Regional contribution to explaining the total outcome variance is
small. The intraclass correlation in an empty random-intercept model
is 0.02 that suggests that only 2% of the total outcome variance can be
accounted for by regional differences. However, the likelihood ratio test
comparing the linear model with all the individual level predictors and
the model with a regional random intercept added shows that incorpo-
rating the regional level of analysis improved the model fit (L2 = 377,
df = 1, p < 0.01).
Figure 1: Regional means of the index of anti-immigrant attitudes
21

Figure 2 presents the scatter plots of regional intercepts predicted
from the model in Table 1 (i.e., after accounting for all the individual
level differences between the regions 2) and six regional level covariates:
income, unemployment, education, the proportion of ethnic Russians and
immigrant concentration measured in two alternative ways as described
above. Solid lines show linear regression estimates while dashed lines
represent regression with a possible outlier, Moscow, excluded from the
analysis.
(Figure 2 about here)
The association between regional unemployment and anti-immigrant
attitudes is negative (when unemployment is high ethnic prejudice is
weaker), although it is not statistically significant at the 95% level. There
is virtually no association between regional income and ethnic prejudice.
However, once Moscow (an outlier) is taken out from the analysis, a neg-
ative association appears: poorer regions are more xenophobic. Both
measures of immigrant concentration (correlated with r = 0.52) show a
significant positive association with anti-immigrant attitudes. The pro-
portion of people with a higher education is not statistically significantly
associated with ethnic prejudice; the association disappears completely is
Moscow is taken out from the analysis. Finally, in more ethnically Rus-
sian regions the attitudes to immigrants are somewhat more negative.
(Table 3 about here)
2After adding the individual level predictors to the empty model with regionalintercepts the regional level outcome variance diminishes by 5%. This suggests thatonly about 5% of the regional outcome variance can be explained by the differences inthe socio-demographic composition of the population across the regions.
22

Figure 2: Regional level predictors of anti-immigrant attitudes
23
At the next stage we build a model with several regional level pre-
dictors. Variables that were not statistically significant in the bivariate
analysis (education and unemployment) were excluded from the model.
We start with a model with immigrant concentration using the percent-
age of immigrants with work permits as its measure (model 1 in table 3).
At the next stage, we add a variable for income and also a dummy vari-
able for Moscow to account for Moscow being an outlier (model 2). Both
income and immigrant concentration are statistically significant predic-
tors of anti-immigrant attitudes once they are included in the model
together. Finally, once controlled for these two variables, adding the
percent of ethnic Russians does not improve the model (model 3).
(Table 4 about here)
We estimate separate models for the attitudes towards immigrants
from different regions (see table 4). Immigrant concentration is only
associated with attitudes towards immigrants from the Caucasus and
Central and South-East Asia, but not Ukraine or Moldova. The effect of
income is also weaker in case of immigrants from Ukraine and Moldova,
and for the former it does not reach the conventional level of statistical
significance.
As a robustness check, we re-estimate all the models with an alter-
native measure of immigrant concentration (the number of international
money transfers). The results are very similar (see tables A3 and A4 in
the appendix). The only noteworthy difference is that the alternative
measure of immigrant concentration is statistically significantly associ-
ated with the attitudes towards immigrants from Moldova (but not from
24

Ukraine).
The next analytic step is to consider ethnic heterogeneity in the atti-
tudes towards immigrants from different regions. Table 2 presents mean
attitudes of different ethnic groups towards immigrants from six different
regions. To simplify the presentation we do not report confidence inter-
vals, but only include the ethnic groups with more than 30 respondents
in the sample.3 The most interesting finding from this analysis is that
the preference order across all ethnic groups is quite similar. It is not
surprising that Russians prefer more culturally similar Ukrainians to im-
migrants from the Caucasus and Central Asia. However, Ukrainians are
the most preferred immigrant group across all the ethnic groups, includ-
ing respondents from Central Asia and the Caucasus. The preferences of
Tatars and Bashkirs are ordered in almost exactly the same way as the
preferences of Russians and Ukrainians. Azerbaijanis, Armenians and
Tajiks are more positive about Ukrainians and Moldovans than about
immigrants from Central Asia and the North Caucasus.
There is not much difference in the effects of other individual level
predictors on xenophobic attitudes towards immigrants from different
regions. The results from six separate models testing this are available
in table A2 in the appendix.
3We include ethnic groups from former Soviet republics (Ukrainians, Belarussians,etc.) as in our survey most of them are either second (or more) generation immigrantsor arrived to Russia more than 10 years before the survey.
25

6 Discussion
Are determinants of anti-immigrant attitudes in Russia different from
Western Europe? The individual level analysis shows that some predic-
tors have similar patterns of association with anti-immigrant prejudice
as reported in the analyses with European data (Ceobanu and Escandell,
2010). People with higher education are more tolerant to immigrants
while gender, age and income appear to be less important. An important
difference between Russia and Western Europe is the effect of location.
While in Europe people living in cities are more cosmopolitan and toler-
ant than those who populate the countryside, in Russia the effect is the
opposite. London, New York and Moscow all attract a significant num-
ber of immigrants, but while the former two generally welcome diversity
Moscow remains one of the most xenophobic places in Russia.
The results presented above show that in Russia individual economic
circumstances are only weakly associated with anti-immigrant sentiments.
The unemployed and manual workers hold only marginally more negative
views on immigrants than non-manual employees. Personal income is not
associated with ethnic prejudice. Thus, answering the first research ques-
tion, we may conclude that the theory that explains negative attitudes
towards immigrants by the natives’ fear of economic competition does
not find much support in our data. It is hard to make definite conclu-
sions with cross-sectional data though, and longitudinal data would be
better suited to explore whether personal economic trajectories have any
effect on ethnic prejudice.
The group threat theory seems to be more relevant to explaining anti-
26
immigrant prejudice in Russia. If the theory is correct, a higher concen-
tration of immigrants should lead to more negative attitudes toward them
(although in many cases natives overestimate the size of immigrant pop-
ulations and this can still trigger the group threat mechanism). We do
indeed observe a positive correlation between immigrant concentration at
the regional level (measured in two alternative ways) and anti-immigrant
attitudes. As usual in cross-sectional analysis, causality is hard to prove
here. We can exclude reverse causation as it is unlikely that immigrants
are attracted to the regions where locals are particularly negative about
them. It is possible, of course, that the regions with a high immigrant
concentration may have other characteristics that affect anti-immigrant
attitudes. However, in our data immigrant concentration is associated
with the attitudes towards immigrants from the Caucasus and Central
Asia, but not Ukrainians who are generally not seen as a threat by the
native population. The effect of the immigrant groups size seems to be
stronger for the groups that are placed lower in the ethnic hierarchy.
This strengthens the claim that the association between immigrant con-
centration and the views of natives is causal. Let us assume that there are
exogenous confounders at the regional level that explain the association
between immigrant concentration and attitudes to immigrants. It is hard
to see then why this association exists for the attitudes to immigrants
from the Caucasus and Central Asia, but not from Ukraine.
While individual income is not a significant predictor of anti-immigrant
views we do find some effect of income at the regional level (controlling
for immigrant concentration and after excluding Moscow as an outlier).
27

Poorer regions are more xenophobic, although the effect size is quite
small. Perhaps people in these regions are more worried about the effect
of immigration on the state of economy. This is what Hainmueller and
Hopkins (2014) called “sociotropic” economic concerns that should not
be confused with the effect of personal economic circumstances. Interest-
ingly, these results (both for the relative size of the immigrant population
and the contextual level economic conditions) are consistent with what
was previously reported for European countries in the analysis at the na-
tional (Quillian, 1995) and regional (Markaki and Longhi, 2013) levels.
In respect to our third research question, we find that attitudes to-
wards immigrants depend on their country of origin. Not all immigrants
are equally unwelcome. Most Russians have little aversive prejudice to-
wards Ukrainians and, to a lesser extent, Moldovans, while immigrants
from the Caucasus and Central Asia face a much stronger opposition.
Respondents’ ethnicity also affects their views. Ethnic Russians are not
very different in their anti-immigrant views from Turkic and Finno-Ugric
ethnic groups from the Urals and Volga region. However, respondents
from former Soviet republics, especially in the Caucasus and Central
Asia, many of them first- or second generation immigrants themselves,
are more tolerant to newcomers.
Perhaps the most surprising finding in this study is a high degree
of inter-group consensus on the ethnic hierarchy of immigrant groups.
The preferences of all the ethnic groups in the sample are remarkably
similar when it comes to ethnicity of their potential neighbours. It may
be tempting to think that ethnic Russians generally accept Ukrainian
28

immigrants because of the cultural and linguistic proximity between these
two ethnic groups. However, Tatars, Azerbaijanis or Kazakhs also prefer
Ukrainian and Moldovan neighbours to immigrants from Central Asia
and the Caucasus who may be closer to them culturally and religiously.
The phenomenon of inter-group consensus on ethnic hierarchy is well
known in social psychology and was reported previously for Russia by Ha-
gendoorn et al. (1998). Hagendoorn et al. noted that it was also found in
other countries and that “a common element in these hierarchies is that
North Europeans are placed at the top, in the middle are Southern and
Eastern Europeans, while Asians and Africans generally occupy positions
at the lower end of the scale”. The survey instrument in our study does
not include questions about attitudes to North and Western Europeans,
but the relative positions of other groups confirm Hagendoorn et al.’s
conclusions. Hagendoorn (1995) explains this consensus by status con-
siderations: ethnic groups that are perceived as having lower status do
not want to further endanger it by association with other groups with
lower status.
A more fundamental difference between Russia and Western Europe
is that in Russia statistical models explain only a tiny part of the total
variance of attitudes. While the direction of some effects is the same as in
Western Europe, their size and predictive power are considerably smaller.
After incorporating all the individual level predictors and accounting for
regional heterogeneity our models leave about 95% of the outcome vari-
ance unexplained. This is consistent with the results reported previ-
ously by Gorodzeisky et al. (2014) who noticed a much weaker predictive
29

power of the models explaining attitudes towards immigrants in Russia
compared to other European countries. Individual socio-economic char-
acteristics that are standard in sociological research fail to structure the
attitudes of Russians, and knowing a person’s sex, age, level of education,
occupation, ethnicity and location provides us with very little informa-
tion about their views on immigration. Other, unobserved factors seem
to be more important. These can be the effects of exposure to the media,
personal psychological characteristics (such as social dominance orienta-
tion) or more idiosyncratic personal trajectories and attitudes. We leave
the exploration of these factors for future research.
30

References
Alexseev, M.A. 2010. “Majority and minority xenophobia in Russia: The
importance of being titulars.” Post-Soviet Affairs 26:89–120.
Bessudnov, A. 2012. “Skolko gastarbaiterov v Rossii? [How many guest
workers are there in Russia?].” Slon.ru, http://slon.ru/russia/
skolko_gastarbayterov_v_rossii-870263.xhtml. Accessed on 30
July 2015.
Blinder, S. 2011. “UK public opinion toward immigration: Determinants
of attitudes.” The Migration Observatory Briefing, University of Ox-
ford.
Bridges, S. and S. Mateut. 2014. “Should they stay or should they go?
Attitudes towards immigration in Europe.” Scottish Journal of Polit-
ical Economy 61:397–429.
Ceobanu, A.M. and X. Escandell. 2010. “Comparative analyses of pub-
lic attitudes toward immigrants and immigration using multinational
survey data: A review of theories and research.” Annual Review of
Sociology 36:309–328.
Dustmann, C. and I.P. Preston. 2007. “Racial and economic factors in
attitudes to immigration.” The B.E. Journal of Economic Analysis &
Policy 7:Article 62.
FOM. 2013. “A survey of Muscovites. City’s problems: successes and
failures. [Opros moskvichey. Gorodskie problemy: uspehi i neudachi].”
http://fom.ru/Nastroeniya/10817. Accessed on 4 September 2014.
31

Ford, R. 2011. “Acceptable and unacceptable immigrants: the ethnic
hierarchy in British immigration preferences.” Journal of Ethnic and
Migration Studies 37:1017–1037.
Gorodzeisky, A., A. Glikman, and D. Maskileyson. 2014. “The nature of
anti-immigrant sentiment in post-socialist Russia.” Post-Soviet Affairs
31:115–135.
Gromping, U. 2006. “Relative importance for linear regression in R: The
package relaimpo.” Journal of Statistical Software 17:1–27.
Hagendoorn, L. 1995. “Intergroup biases in multiple group systems: The
perception of ethnic hierarchies.” European Review of Social Psychol-
ogy 6:199–228.
Hagendoorn, L., R. Drogendijk, S. Tumanov, and J. Hraba. 1998. “Inter-
ethnic preferences and ethnic hierarchies in the former Soviet Union.”
International Journal of Intercultural Relations 22:483–503.
Hainmueller, J. and D. Hangartner. 2013. “Who gets a Swiss passport? A
natural experiment in immigrant discrimination.” American Political
Science Review 107:159–187.
Hainmueller, J. and M.J. Hiscox. 2007. “Educated preferences: Explain-
ing attitudes toward immigration in Europe.” International Organiza-
tion 61:399–442.
Hainmueller, J. and D.J. Hopkins. 2014. “Public attitudes toward immi-
gration.” Annual Review of Political Science 17:225–249.
32

Herrera, Y.M. and N.B. Kraus. 2013a. “National identity and xenophobia
in Russia: Opportunities for regional analysis.” In Russia’s Regions
and Comparative Subnational Politics, edited by W.M. Reisinger, pp.
102–119. Routledge.
Herrera, Y.M. and N.B. Kraus. 2013b. “Pride vs. prejudice: Xenophobia
and national identity in Russia.” Unpublished paper.
Hjerm, M. 2009. “Anti-immigrant attitudes and cross-municipal variation
in the proportion of immigrants.” Acta Sociologica 52:47–62.
Honaker, J., G. King, and M. Blackwell. 2011. “Amelia II: A Program
for Missing Data.” Journal of Statistical Software 45:1–47.
Hraba, J., C.S. Dunham, S. Tumanov, and L. Hagendoorn. 1997. “Prej-
udice in the former Soviet Union.” Ethnic and Racial Studies 20:613–
627.
LevadaCentre. 2013. “Problems and concern of Russians. [Prob-
lemy i trevogi rossiyan].” http://www.levada.ru/03-09-2013/
problemy-i-trevogi-rossiyan. Accessed on 4 September 2014.
Lokshin, M. and E. Chernina. 2013. “Migranty na rossiyskom rynke
truda: Portret i zarabotnaya plata. [Migrants in the Russian labor
market: Profile and earnings].” HSE Economic Journal 1:44–80.
Markaki, Y. and S. Longhi. 2013. “What determines attitudes to im-
migration in European countries? An analysis at the regional level.”
Migration Studies 1:311–337.
33
Mayda, A.M. 2006. “Who is against immigration? A cross-country in-
vestigation of individual attitudes toward immigrants.” The Review of
Economics and Statistics 88:510–530.
Meuleman, B., E. Davidov, and J. Billiet. 2009. “Changing attitudes
toward immigration in Europe, 2002–2007: A dynamic group conflict
theory approach.” Social Science Research 38:352–365.
OECD. 2013. International Migration Outlook 2013 . OECD Publishing.
Quillian, L. 1995. “Prejudice as a response to perceived group threat:
Population composition and anti-immigrant and racial prejudice in Eu-
rope.” American Sociological Review 60:586–611.
Rustenbach, E. 2010. “Sources of negative attitudes toward immigrants
in Europe: A multi-level analysis.” International Migration Review
44:53–77.
Scheepers, P., M. Gijsberts, and M. Coenders. 2002. “Ethnic exclusion-
ism in European countries. Public opposition to civil rights for legal
migrants as a response to perceived ethnic threat.” European Socio-
logical Review 18:17–34.
Schneider, S.L. 2008. “Anti-immigrant attitudes in Europe: Outgroup
size and perceived ethnic threat.” European Sociological Review 24:53–
67.
Semyonov, M., R. Raijman, and A. Gorodzeisky. 2006. “The rise of
anti-foreigner sentiment in European societies, 1988-2000.” American
Sociological Review 71:426–449.
34

Semyonov, M., R. Raijman, and A. Gorodzeisky. 2008. “Foreigners’ im-
pact on European societies. Public views and perceptions in a cross-
national comparative perspective.” International Journal of Compar-
ative Sociology 49:5–29.
Snijders, T.A.B. and R.J. Bosker. 2012. Multilevel Analysis. An Intro-
duction to Basic and Advanced Multilevel Modeling . Sage.
35

Table 1: Individual-level predictors of xenophobic attitudes
coef. s.e.
Intercept 3.60∗∗∗ (0.04)Male 0.004 (0.01)Age (centred around the mean) −0.002∗∗∗ (0.0005)Education (ref. Secondary or less)
Lower vocational 0.06∗∗ (0.02)Secondary specialized −0.04∗∗ (0.01)Higher incomplete −0.08∗∗ (0.04)Higher or PhD −0.12∗∗∗ (0.02)
Ethnicity (ref. Russian)Bashkir/Chuvash 0.16∗∗∗ (0.05)Belorussian −0.23∗∗∗ (0.09)Georgian/Armenian/Azerbaijani −0.83∗∗∗ (0.07)Kazakh −0.19∗∗ (0.09)Kyrgyz/Tajik/Uzbek −0.90∗∗∗ (0.12)Mari/Mordva/Udmurt 0.15∗∗∗ (0.05)from the North Caucasus −0.41∗∗∗ (0.11)Tatar −0.06 (0.05)Ukrainian −0.02 (0.05)Other −0.21∗∗∗ (0.05)No data −0.11 (0.12)
Employment status / occupation (ref. Manual)Non-manual −0.08∗∗∗ (0.02)Unemployed 0.02 (0.03)Not working and not looking for a job −0.02 (0.04)Retired −0.02 (0.02)Student −0.11∗∗∗ (0.04)Other or NA −0.07∗ (0.04)
Income (ref. < 8, 000 rub.)8,000 to 15,000 rub. −0.01 (0.02)15,000 to 30,000 rub. 0.02 (0.02)> 30, 000 rub. −0.05 (0.04)No income 0.05∗∗ (0.03)No answer 0.07∗∗∗ (0.02)
Religion (ref. Orthodox Christian)Buddhist −0.53∗∗∗ (0.19)Judaist −0.66∗∗∗ (0.26)Muslim −0.06 (0.05)Not religious −0.01 (0.02)Other Christian −0.27∗∗∗ (0.06)No answer −0.05 (0.04)
Location (ref. City > 1 million)Small city (100,000 to 1 million) −0.15∗∗∗ (0.03)Town (<100,000) −0.19∗∗∗ (0.03)Countryside −0.23∗∗∗ (0.03)
Continued on next page
36

Table 1 – continued from previous page
coef. s.e.
Migration status (ref.: Always lived there)Moved more than 10 years ago −0.08∗∗∗ (0.01)Moved less than 10 years ago −0.14∗∗∗ (0.02)No answer 0.06 (0.1)
Hired an immigrant (ref.: Did not hire) −0.15∗∗∗ (0.02)
No obs. 24500No regions 49Variance: intercept 0.02Variance: residual 0.84R2 0.03L2 65364df 44∗∗∗p < 0.01, ∗∗p < 0.05, ∗p < 0.1
The random intercept model. The dependent variable varies from one(least xenophobic) to five (most xenophobic).The model was fitted using residual maximum likelihood (REML).However, the deviance reported is from the model fitted with maximumlikelihood (ML), so that it can be used to construct likelihood ratio tests.R2 calculated according to the method in Snijders and Bosker (2012, ch.7).
37

Table 2: Mean attitudes to immigrants from different regions by ethnic groupethnicity (n) Ukraine Moldova Caucasus Central Asia South-East Asia North Caucasus mean
Mordvin (87) 2.9 3.1 3.9 3.8 4.0 3.9 3.6Mari (234) 2.8 3.0 3.7 3.8 4.0 3.9 3.5Chuvash (455) 2.7 2.9 3.7 3.6 3.8 3.8 3.4Russian (21211) 2.6 2.9 3.6 3.7 3.8 3.8 3.4Bashkir (126) 2.8 2.9 3.6 3.6 3.8 3.7 3.4Udmurt (147) 2.8 3.0 3.5 3.6 3.7 3.7 3.4Khakas (77) 2.7 2.9 3.5 3.4 3.6 3.7 3.3Tatar (765) 2.6 2.8 3.3 3.3 3.5 3.5 3.2Ukrainian (375) 1.9 2.5 3.5 3.5 3.7 3.7 3.1Belorussian (113) 2.2 2.5 3.4 3.5 3.5 3.6 3.1German (67) 2.3 2.6 3.2 3.2 3.5 3.5 3.0Kazakh (166) 2.4 2.4 3.2 3.1 3.5 3.4 3.0Azerbaijani (58) 2.1 2.2 2.5 2.9 3.2 2.7 2.6Armenian (136) 2.0 2.1 2.1 2.7 2.8 2.5 2.4Tajik (32) 1.9 2.2 2.4 2.3 2.5 2.5 2.3
All (24500) 2.5 2.8 3.6 3.7 3.8 3.8Only ethnic groups with n > 30 included. The scale ranges from 1 to 5 where 1 is the mostpositive and 5 is the most negative attitude. Ethnic groups in rows and regions of origin incolumns ordered according to the mean attitude. All the values were averaged across fiveimputed data sets. Weight coefficients applied.
38

Table 3: Models with regional-level predictorsModel 1 Model 2 Model 3
coef. s.e. coef. s.e. coef. s.e.
Constant 3.6∗∗∗ (0.05) 3.9∗∗∗ (0.12) 3.8∗∗∗ (0.16)% immigrants 0.06∗∗ (0.02) 0.07∗∗∗ (0.02) 0.06∗∗ (0.02)income-to-subsistence ratio −0.11∗∗∗ (0.03) −0.10∗∗∗ (0.03)Moscow 0.48∗∗∗ (0.15) 0.47∗∗∗ (0.15)% ethnically Russian ≈ 0.01 (≈ 0.01)
n obs. 24500 24500 24500n regions 49 49 49R2 0.03 0.04 0.04L2 65358 65344 65342df 45 47 48∗∗∗p < 0.01, ∗∗p < 0.05, ∗p < 0.1
The random-intercept models account for all individual-level predictors from Table 1,but the coefficients are not shown. Standard errors in the parentheses.The dependent variable varies from one (least xenophobic) to five (most xenophobic).The models were fitted using residual maximum likelihood (REML). However, the deviancereported is from the model fitted with maximum likelihood (ML), so that it can be usedto construct likelihood ratio tests. First imputation was used to report L2.
39
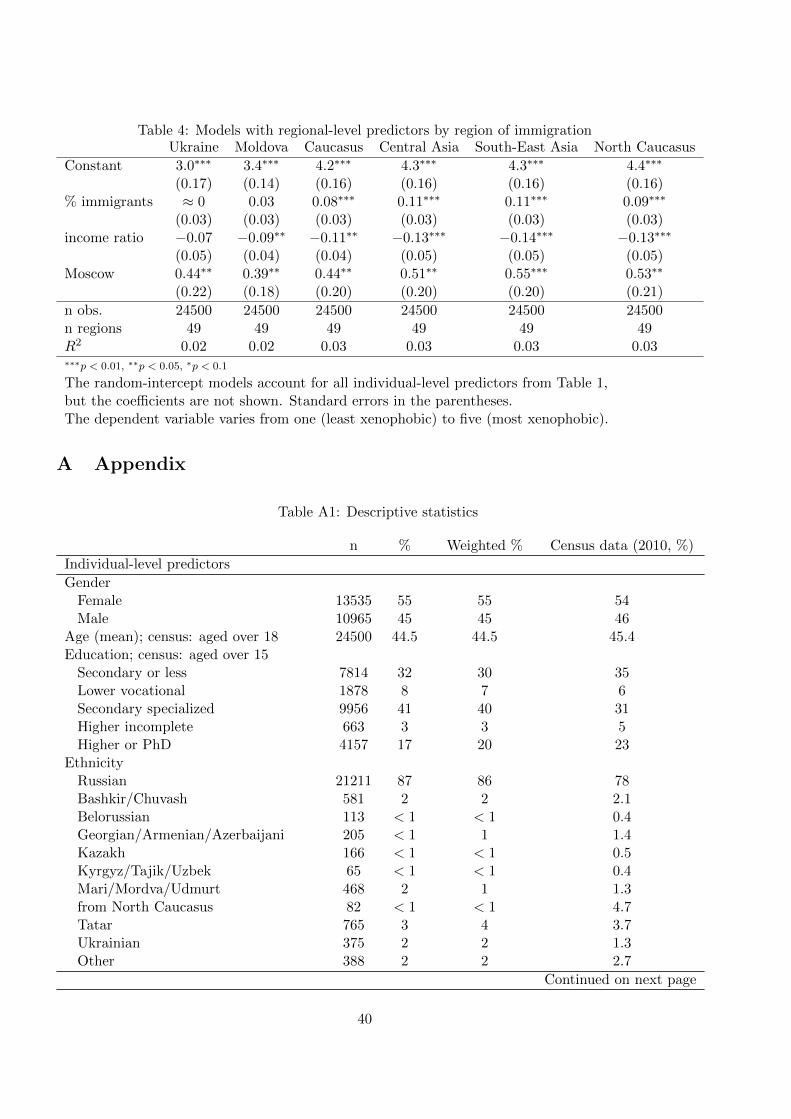
Table 4: Models with regional-level predictors by region of immigrationUkraine Moldova Caucasus Central Asia South-East Asia North Caucasus
Constant 3.0∗∗∗ 3.4∗∗∗ 4.2∗∗∗ 4.3∗∗∗ 4.3∗∗∗ 4.4∗∗∗
(0.17) (0.14) (0.16) (0.16) (0.16) (0.16)% immigrants ≈ 0 0.03 0.08∗∗∗ 0.11∗∗∗ 0.11∗∗∗ 0.09∗∗∗
(0.03) (0.03) (0.03) (0.03) (0.03) (0.03)income ratio −0.07 −0.09∗∗ −0.11∗∗ −0.13∗∗∗ −0.14∗∗∗ −0.13∗∗∗
(0.05) (0.04) (0.04) (0.05) (0.05) (0.05)Moscow 0.44∗∗ 0.39∗∗ 0.44∗∗ 0.51∗∗ 0.55∗∗∗ 0.53∗∗
(0.22) (0.18) (0.20) (0.20) (0.20) (0.21)
n obs. 24500 24500 24500 24500 24500 24500n regions 49 49 49 49 49 49R2 0.02 0.02 0.03 0.03 0.03 0.03∗∗∗p < 0.01, ∗∗p < 0.05, ∗p < 0.1
The random-intercept models account for all individual-level predictors from Table 1,but the coefficients are not shown. Standard errors in the parentheses.The dependent variable varies from one (least xenophobic) to five (most xenophobic).
A Appendix
Table A1: Descriptive statistics
n % Weighted % Census data (2010, %)
Individual-level predictors
GenderFemale 13535 55 55 54Male 10965 45 45 46
Age (mean); census: aged over 18 24500 44.5 44.5 45.4Education; census: aged over 15
Secondary or less 7814 32 30 35Lower vocational 1878 8 7 6Secondary specialized 9956 41 40 31Higher incomplete 663 3 3 5Higher or PhD 4157 17 20 23
EthnicityRussian 21211 87 86 78Bashkir/Chuvash 581 2 2 2.1Belorussian 113 < 1 < 1 0.4Georgian/Armenian/Azerbaijani 205 < 1 1 1.4Kazakh 166 < 1 < 1 0.5Kyrgyz/Tajik/Uzbek 65 < 1 < 1 0.4Mari/Mordva/Udmurt 468 2 1 1.3from North Caucasus 82 < 1 < 1 4.7Tatar 765 3 4 3.7Ukrainian 375 2 2 1.3Other 388 2 2 2.7
Continued on next page
40

Table A1 – continued from previous page
No data 81 < 1 < 1 3.5Employment status / occupation
Manual 5985 24 23Non-manual 7846 32 35Not working and not looking for a job 928 4 4Retired 6316 26 25Student 1140 5 5Unemployed 1461 6 6Other or no answer 824 3 3
Monthly personal income (rubles)< 8, 000 7249 30 258,000-15,000 8099 33 3215,000-30,000 3447 14 17> 30, 000 517 2 4No income 2297 9 10No answer 2891 12 13
Religious denominationOrthodox Christian 18669 76 76Buddhist 25 < 1 < 1Judaist 13 < 1 < 1Muslim 951 4 5Other Christian 271 1 1Not religious 4046 17 16No answer 534 2 2
LocationCity (> 1 million) 2584 11 25 20Small city (100,000 to 1 million) 8405 34 28 29Town (<100,000) 6611 27 23 25Countryside 6900 28 24 26
Migration statusAlways lived there 14021 57 58Moved more than 10 yrs ago 8196 33 32Moved less than 10 yrs ago 2177 9 9No answer 106 < 1 < 1
Ever hired an immigrantYes 1864 8 11No or no answer 22636 92 89
Dependent variables n mean weighted mean
“What would have been your attitude if an ordinary family from ... had become your neighbours?”(On a five-point scale: 1 most positive, 5 most negative)
Ukraine 23671 2.5 2.5After imputation 24500 2.5
Moldova 23167 2.8 2.8After imputation 24500 2.8
Caucasus 23424 3.5 3.6
Continued on next page
41

Table A1 – continued from previous page
After imputation 24500 3.5Central Asia 23343 3.6 3.7
After imputation 24500 3.6South-East Asia 23068 3.7 3.8
After imputation 24500 3.7North Caucasus 22964 3.8 3.8
After imputation 24500 3.8Composite index 21390 3.3 3.4
After imputation 24500 3.3
Regional-level predictors n mean min max
Average income-to-subsistence ratio 49 3.4 2.5 6.1% unemployed 49 6.6 1.4 10.3% with higher education 49 21 15 42% ethnic Russian 49 86 27 97% immigrants 49 1.1 0.1 4.1n of international money transfers 49 0.06 0.01 0.34per person
42

Table A2: Individual-level predictors of xenophobic attitudes(by region of origin of immigrants)
Ukraine Moldova Caucasus North Central South-EastCaucasus Asia Asia
Intercept 2.8∗∗∗ 3.1∗∗∗ 3.9∗∗∗ 4.1∗∗∗ 4.0∗∗∗ 4.0∗∗∗
(0.05) (0.05) (0.05) (0.05) (0.05) (0.05)Male 0.03∗ 0.04∗∗ 0.01 −0.02 −0.02 −0.01
(0.02) (0.02) (0.02) (0.02) (0.02) (0.02)Age (centred around the mean) −0.002∗∗∗ −0.002∗∗∗ −0.002∗∗∗ −0.002∗∗∗ −0.002∗∗∗ < −0.001
(0.001) (0.001) (0.001) (0.001) (0.001) (0.001)Education (ref. Secondary or less)
Lower vocational −0.02 0.02 0.08∗∗ 0.10∗∗∗ 0.07∗∗ 0.10∗∗∗
(0.03) (0.03) (0.03) (0.03) (0.03) (0.03)Secondary specialised −0.07∗∗∗ −0.06∗∗∗ −0.04∗ < 0.01 −0.03 −0.02
(0.02) (0.02) (0.02) (0.02) (0.02) (0.02)Higher incomplete −0.08∗ −0.09∗ −0.06 −0.06 −0.06 −0.12∗∗
(0.05) (0.05) (0.05) (0.05) (0.05) (0.05)Higher or PhD −0.15∗∗∗ −0.12∗∗∗ −0.10∗∗∗ −0.09∗∗∗ −0.13∗∗∗ −0.11∗∗∗
(0.02) (0.02) (0.03) (0.03) (0.03) (0.03)Ethnicity (ref. Russian)
Bashkir/Chuvash 0.18∗∗∗ 0.14∗∗ 0.18∗∗∗ 0.12∗ 0.16∗∗ 0.20∗∗∗
(0.06) (0.06) (0.07) (0.07) (0.06) (0.06)Belorussian −0.27∗∗ −0.27∗∗ −0.15 −0.21∗ −0.18∗ −0.28∗∗
(0.11) (0.11) (0.11) (0.11) (0.11) (0.11)Georgian/Armenian/Azerbaijani −0.46∗∗∗ −0.63∗∗∗ −1.28∗∗∗ −1.16∗∗∗ −0.92∗∗∗ −0.80∗∗∗
(0.08) (0.08) (0.08) (0.09) (0.08) (0.09)Kazakh −0.01 −0.17 −0.19∗ −0.20∗ −0.35∗∗∗ −0.10
(0.1) (0.11) (0.11) (0.11) (0.11) (0.11)Kyrgyz/Tajik/Uzbek −0.62∗∗∗ −0.61∗∗∗ −0.99∗∗∗ −1.08∗∗∗ −1.15∗∗∗ −0.92∗∗∗
(0.14) (0.15) (0.15) (0.15) (0.15) (0.15)Mari/Mordva/Udmurt 0.25∗∗∗ 0.19∗∗∗ 0.10 0.09 0.12∗ 0.17∗∗∗
(0.06) (0.06) (0.06) (0.06) (0.06) (0.06)from North Caucasus −0.22∗ −0.38∗∗∗ −0.51∗∗∗ −0.79∗∗∗ −0.31∗∗ −0.24∗
(0.13) (0.13) (0.14) (0.14) (0.14) (0.14)Tatar −0.02 −0.03 −0.10 −0.06 −0.10 −0.04
(0.06) (0.06) (0.07) (0.07) (0.06) (0.07)Ukrainian −0.57∗∗∗ −0.43∗∗∗ −0.16∗∗∗ −0.16∗∗∗ −0.12∗∗ −0.09
(0.06) (0.06) (0.06) (0.06) (0.06) (0.06)Other −0.18∗∗∗ −0.18∗∗∗ −0.24∗∗∗ −0.23∗∗∗ −0.30∗∗∗ −0.17∗∗∗
(0.06) (0.06) (0.06) (0.06) (0.06) (0.06)No data 0.08 < 0.01 −0.17 −0.22 −0.22 −0.11
(0.13) (0.14) (0.15) (0.14) (0.15) (0.16)Employment status / occupation(ref. Manual)
Non-manual −0.05∗∗∗ −0.05∗∗ −0.09∗∗∗ −0.09∗∗∗ −0.09∗∗∗ −0.09∗∗∗
(0.02) (0.02) (0.02) (0.02) (0.02) (0.02)
Continued on next page
43

Table A2 – continued from previous page
Ukraine Moldova Caucasus North Central South-EastCaucasus Asia Asia
Unemployed 0.02 0.06 0.01 0.02 0.02 −0.01(0.04) (0.04) (0.04) (0.04) (0.04) (0.04)
Not working and 0.02 0.02 −0.01 −0.03 −0.06 −0.06not looking for a job (0.05) (0.05) (0.05) (0.05) (0.05) (0.05)Retired −0.03 −0.01 −0.01 −0.01 −0.05∗ −0.03
(0.03) (0.03) (0.03) (0.03) (0.03) (0.03)Student −0.13∗∗∗ −0.12∗∗∗ −0.10∗∗ −0.07 −0.08∗ −0.15∗∗∗
(0.04) (0.05) (0.05) (0.05) (0.05) (0.05)Other or NA −0.03 −0.04 −0.08∗ −0.05 −0.10∗∗ −0.1∗∗
(0.04) (0.04) (0.05) (0.04) (0.05) (0.05)Income (ref. < 8, 000 rub.)
8,000 to 15,000 rub. −0.01 −0.01 < −0.01 < −0.01 < −0.01 −0.01(0.02) (0.02) (0.02) (0.02) (0.02) (0.02)
15,000 to 30,000 rub. −0.01 0.02 0.01 0.03 0.03 0.01(0.03) (0.03) (0.03) (0.03) (0.03) (0.03)
> 30, 000 rub. −0.07 −0.01 −0.05 −0.07 −0.05 −0.09(0.05) (0.06) (0.06) (0.06) (0.06) (0.06)
No income 0.06∗ 0.06∗ 0.04 0.02 0.07∗ 0.08∗∗
(0.03) (0.04) (0.04) (0.04) (0.04) (0.03)No answer 0.13∗∗∗ 0.11∗∗∗ 0.04 0.03 0.08∗∗∗ 0.04
(0.03) (0.03) (0.03) (0.03) (0.03) (0.03)Religion (ref. Orthodox Christian)
Buddhist −0.45∗∗ −0.57∗∗ −0.48∗∗ −0.68∗∗∗ −0.49∗ −0.57∗∗
(0.23) (0.24) (0.24) (0.24) (0.26) (0.24)Judaist −0.23 −0.38 −0.79∗∗ −1.11∗∗∗ −0.82∗∗ −0.67∗∗
(0.30) (0.32) (0.33) (0.32) (0.32) (0.32)Muslim 0.11∗ 0.02 −0.11∗ −0.15∗∗ −0.16∗∗ −0.12∗
(0.06) (0.06) (0.06) (0.07) (0.06) (0.06)Not religious 0.06∗∗∗ 0.04∗ −0.01 −0.05∗∗ −0.03 −0.05∗∗
(0.02) (0.02) (0.02) (0.02) (0.02) (0.02)Other Christian −0.16∗∗ −0.24∗∗∗ −0.33∗∗∗ −0.25∗∗∗ −0.30∗∗∗ −0.32∗∗∗
(0.07) (0.07) (0.07) (0.07) (0.08) (0.07)No answer 0.15∗∗∗ 0.03 −0.07 −0.12 −0.14∗∗∗ −0.10∗
(0.05) (0.06) (0.06) (0.06) (0.05) (0.05)Location (ref. City > 1 million)
Small city (100,000 to 1 million) −0.13∗∗∗ −0.17∗∗∗ −0.21∗∗∗ −0.15∗∗∗ −0.15∗∗∗ −0.12∗∗∗
(0.04) (0.04) (0.04) (0.04) (0.04) (0.04)Town (<100,000) −0.22∗∗∗ −0.24∗∗∗ −0.22∗∗∗ −0.17∗∗∗ −0.19∗∗∗ −0.11∗∗∗
(0.04) (0.04) (0.04) (0.04) (0.04) (0.04)Countryside −0.21∗∗∗ −0.27∗∗∗ −0.27∗∗∗ −0.22∗∗∗ −0.26∗∗∗ −0.13∗∗∗
(0.04) (0.04) (0.04) (0.04) (0.04) (0.04)Migration status(ref.: Always lived there)
Moved more than 10 years ago −0.08∗∗∗ −0.09∗∗∗ −0.07∗∗∗ −0.06∗∗∗ −0.10∗∗∗ −0.08∗∗∗
Continued on next page
44

Table A2 – continued from previous page
Ukraine Moldova Caucasus North Central South-EastCaucasus Asia Asia
(0.02) (0.02) (0.02) (0.02) (0.02) (0.02)Moved less than 10 years ago −0.13∗∗∗ −0.13∗∗∗ −0.14∗∗∗ −0.12∗∗∗ −0.17∗∗∗ −0.17∗∗∗
(0.03) (0.03) (0.03) (0.03) (0.03) (0.03)No answer −0.04 0.05 0.13 0.04 0.11 0.05
(0.11) (0.13) (0.13) (0.12) (0.13) (0.13)Hired an immigrant −0.11∗∗∗ −0.14∗∗∗ −0.18∗∗∗ −0.16∗∗∗ −0.21∗∗∗ −0.12∗∗∗
(ref.: Did not hire) (0.03) (0.03) (0.03) (0.03) (0.03) (0.03)
No obs. 24500 24500 24500 24500 24500 24500No regions 49 49 49 49 49 49Variance: intercept 0.03 0.02 0.03 0.03 0.03 0.03Variance: residual 1.15 1.28 1.37 1.32 1.34 1.32∗∗∗p < 0.01, ∗∗p < 0.05, ∗p < 0.1
The random intercept model. The dependent variables vary from one(least xenophobic) to five (most xenophobic).
Table A3: Models with the alternative measure of immigrant concentrationModel 1 Model 2 Model 3
coef. s.e. coef. s.e. coef. s.e.
Constant 3.6∗∗∗ (0.05) 3.9∗∗∗ (0.12) 3.7∗∗∗ (0.15)international money transfers 0.95∗∗∗ (0.28) 0.92∗∗∗ (0.38) 0.82∗∗∗ (0.33)income-to-subsistence ratio −0.08∗∗∗ (0.03) −0.08∗∗∗ (0.03)Moscow 0.27 (0.18) 0.28 (0.17)% ethnically Russian ≈ 0.01 (≈ 0.01)
n obs. 24500 24500 24500n regions 49 49 49∗∗∗p < 0.01, ∗∗p < 0.05, ∗p < 0.1
The random-intercept models account for all individual-level predictors from Table 1,but the coefficients are not shown.The dependent variable varies from one (least xenophobic) to five (most xenophobic).
45

Table A4: Models with the alternative measure of immigrant concentration by region of immigra-tion
Ukraine Moldova Caucasus Central Asia South-East Asia North Caucasus
Constant 3.0∗∗∗ 3.4∗∗∗ 4.1∗∗∗ 4.2∗∗∗ 4.2∗∗∗ 4.3∗∗∗
(0.16) (0.14) (0.16) (0.17) (0.17) (0.17)international money 0.23 0.98∗∗∗ 1.00∗∗ 1.13∗∗ 1.17∗∗ 0.92∗∗
transfers (0.45) (0.37) (0.43) (0.46) (0.45) (0.46)income ratio −0.07 −0.08∗∗ −0.08∗ −0.09∗ −0.09∗∗ −0.09∗
(0.05) (0.04) (0.04) (0.05) (0.05) (0.05)Moscow 0.39 0.14 0.21 0.26 0.28 0.32
(0.25) (0.20) (0.23) (0.25) (0.24) (0.25)
n obs. 24500 24500 24500 24500 24500 24500n regions 49 49 49 49 49 49∗∗∗p < 0.01, ∗∗p < 0.05, ∗p < 0.1
The random-intercept models account for all individual-level predictors from Table 1,but the coefficients are not shown. Standard errors in the parentheses.The dependent variable varies from one (least xenophobic) to five (most xenophobic).
46