Ethnic disparities in wilms tumor by fatma abdalla
36
ETHNIC DISPARITIES IN WILMS TUMOR Dr F. K. Abdallah
-
Upload
kesho-conference -
Category
Documents
-
view
71 -
download
1
Transcript of Ethnic disparities in wilms tumor by fatma abdalla

ETHNIC DISPARITIES IN WILMS TUMOR
Dr F. K. Abdallah
Wilms Tumor (WT)Wilms Tumor (WT)
Most Common Pediatric Renal MalignancyMost Common Pediatric Renal Malignancy
~ 500 cases per year ~ 500 cases per year USAUSA
1/10,000 children 1/10,000 children < 15 years< 15 years
>90% Survival at 5 >90% Survival at 5 years in developed years in developed nationsnations
Davidoff 2009

9%
65%
56%56% More Children Relapse!
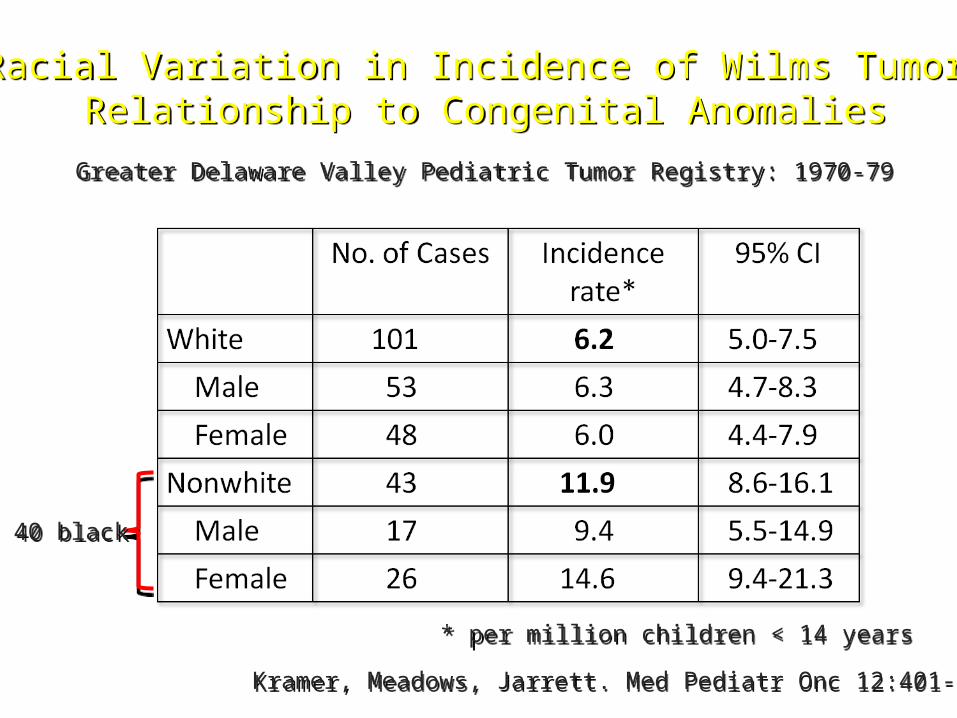
Racial Variation in Incidence of Wilms Tumor:Relationship to Congenital Anomalies
Racial Variation in Incidence of Wilms Tumor:Relationship to Congenital Anomalies
Kramer, Meadows, Jarrett. Med Pediatr Onc 12:401-5, 1984Kramer, Meadows, Jarrett. Med Pediatr Onc 12:401-5, 1984
Greater Delaware Valley Pediatric Tumor Registry: 1970-79Greater Delaware Valley Pediatric Tumor Registry: 1970-79
40 black40 black
* per million children < 14 years* per million children < 14 years
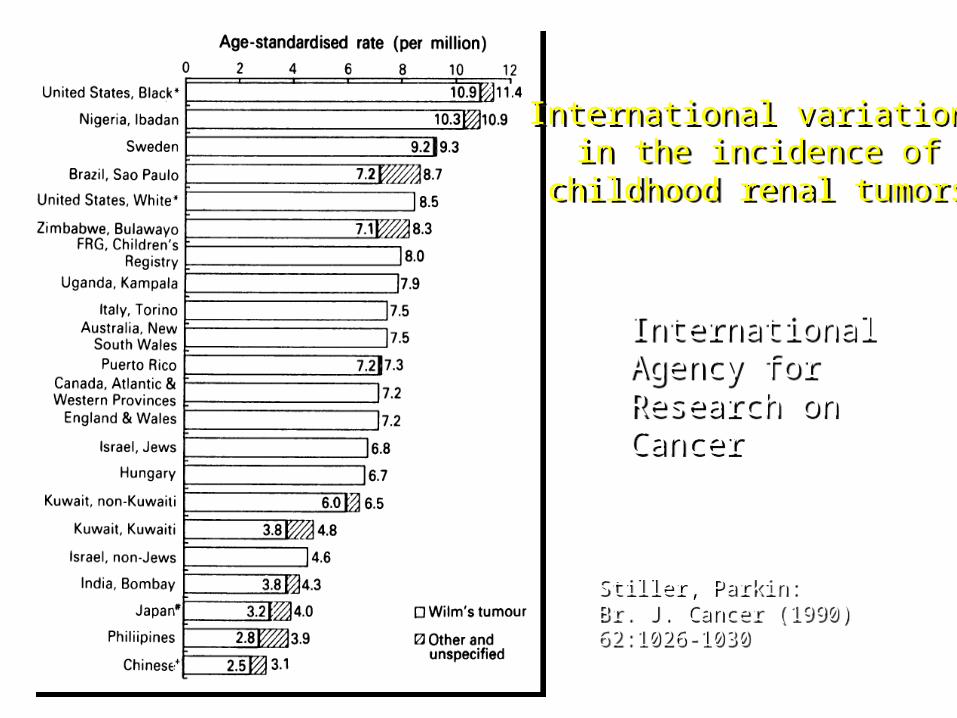
Stiller, Parkin:Br. J. Cancer (1990) 62:1026-1030Stiller, Parkin:Br. J. Cancer (1990) 62:1026-1030
International variationsin the incidence of
childhood renal tumors
International variationsin the incidence of
childhood renal tumors
InternationalAgency forResearch onCancer
InternationalAgency forResearch onCancer
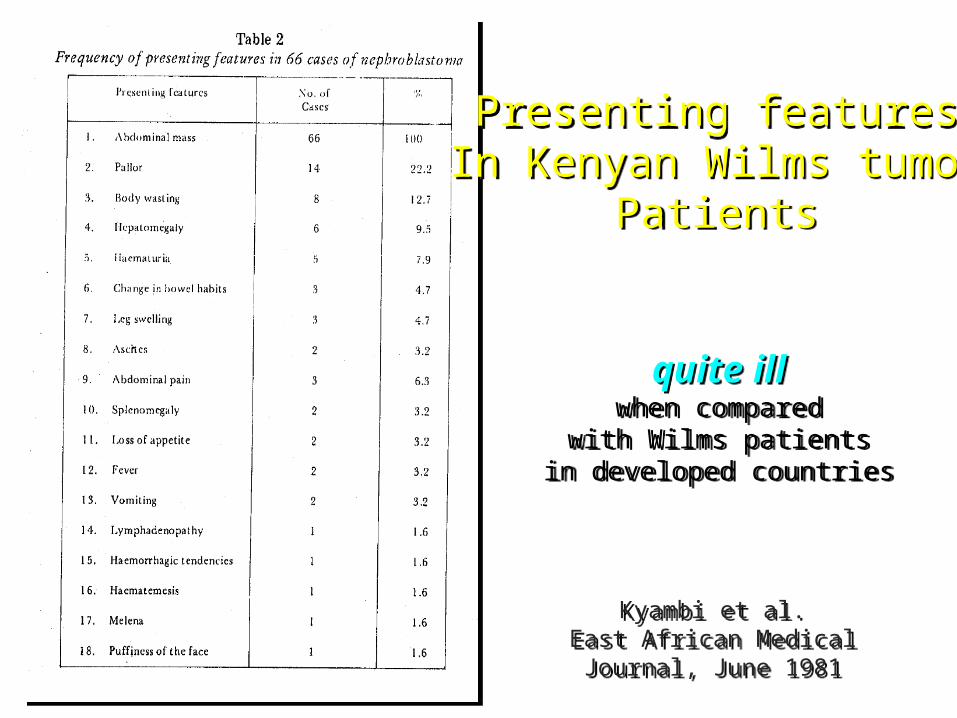
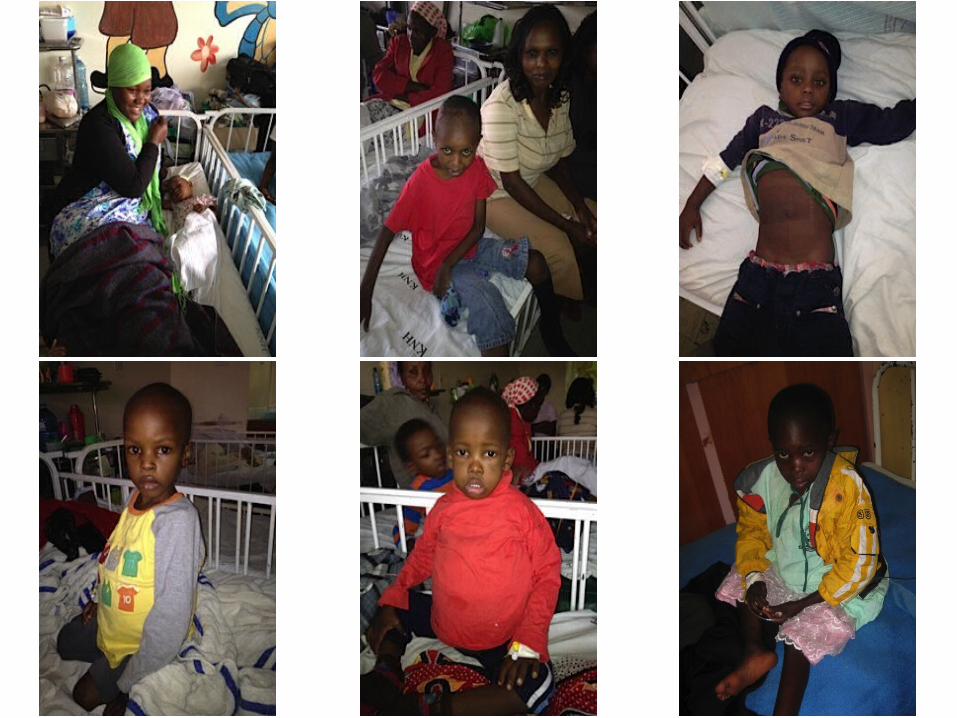
Presenting featuresIn Kenyan Wilms tumor
Patients
Presenting featuresIn Kenyan Wilms tumor
Patients
Kyambi et al.East African Medical Journal, June
1981
Kyambi et al.East African Medical Journal, June
1981
quite illwhen compared
with Wilms patientsin developed countries
quite illwhen compared
with Wilms patientsin developed countries
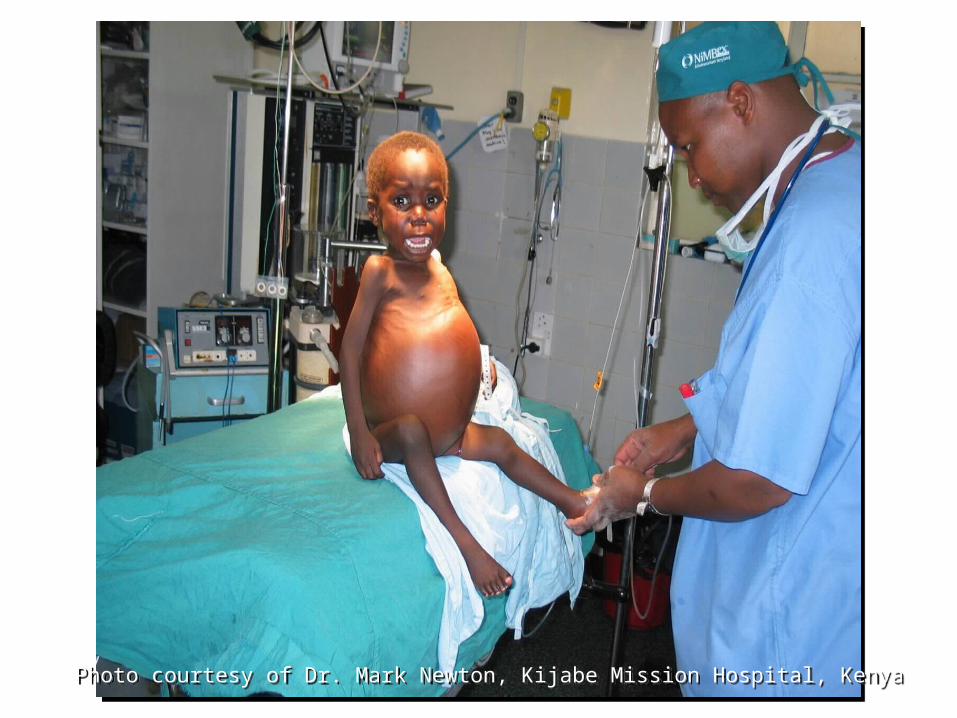
Photo courtesy of Dr. Mark Newton, Kijabe Mission Hospital, KenyaPhoto courtesy of Dr. Mark Newton, Kijabe Mission Hospital, Kenya
“Wilms tumor appears to vary more as a function of ETHNIC GROUP across different countries than it does with country for a given ethnic group.”
“Wilms tumor appears to vary more as a function of ETHNIC GROUP across different countries than it does with country for a given ethnic group.”
Breslow N et al. Epidemiology of Wilms Tumor. Med Pediatr Onc 21:172-181 (1993)Breslow N et al. Epidemiology of Wilms Tumor. Med Pediatr Onc 21:172-181 (1993)

What’s the biological basisfor these observed differences
in Wilms tumorincidence and outcomesbetween ethnic groups?
What’s the biological basisfor these observed differences
in Wilms tumorincidence and outcomesbetween ethnic groups?
But could different biology But could different biology also contribute toalso contribute topoor outcomes?poor outcomes?
But could different biology But could different biology also contribute toalso contribute topoor outcomes?poor outcomes?
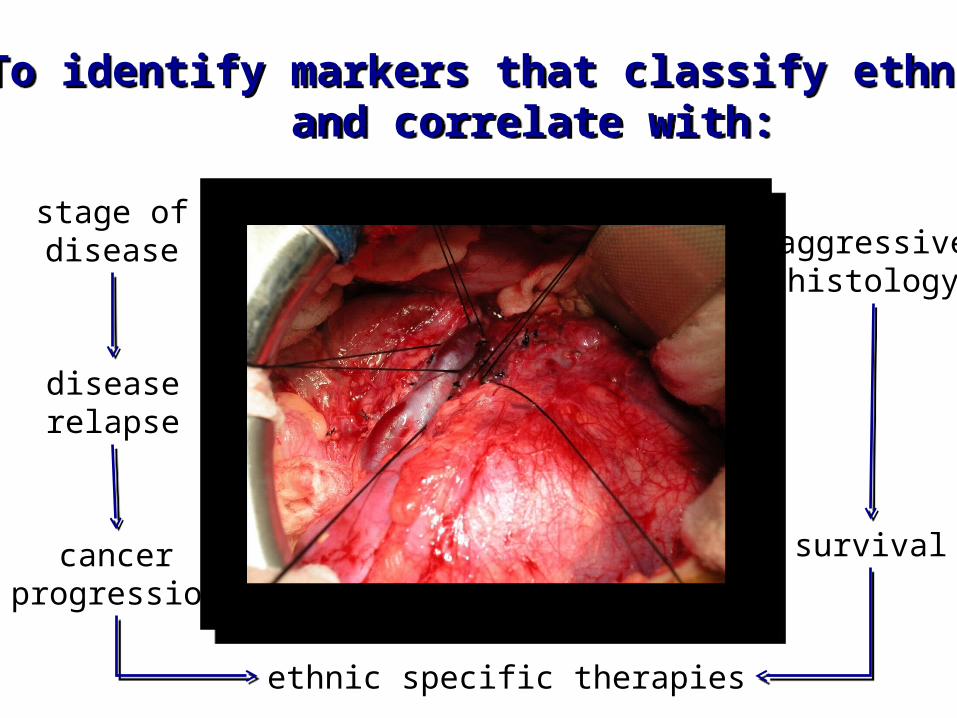
To identify markers that classify ethnicityand correlate with:
To identify markers that classify ethnicityand correlate with:
cancerprogression
stage ofdisease aggressive
histology
survival
ethnic specific therapies
diseaserelapse
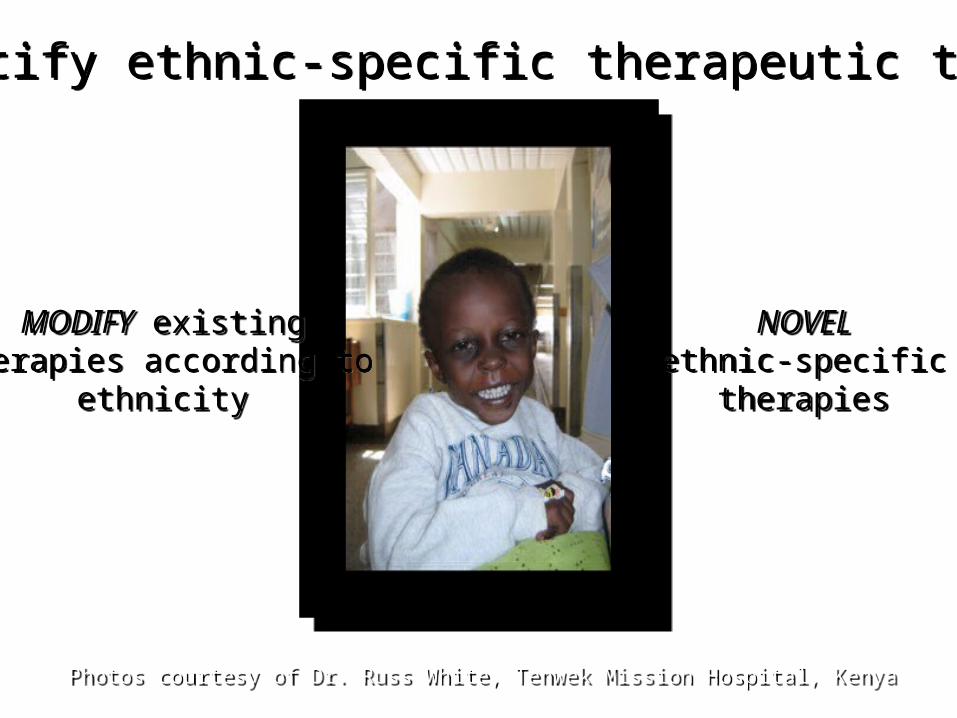
Photos courtesy of Dr. Russ White, Tenwek Mission Hospital, KenyaPhotos courtesy of Dr. Russ White, Tenwek Mission Hospital, Kenya
Identify ethnic-specific therapeutic targetsIdentify ethnic-specific therapeutic targets
MODIFY existingtherapies according to
ethnicity
MODIFY existingtherapies according to
ethnicity
NOVELethnic-specific
therapies
NOVELethnic-specific
therapies

Kenyan Wilms Tumor StudyKenyan Wilms Tumor Study
To assign a molecular signature according to ethnicity for Wilms tumors:a comparison between North American and Kenyan tissues
To assign a molecular signature according to ethnicity for Wilms tumors:a comparison between North American and Kenyan tissues
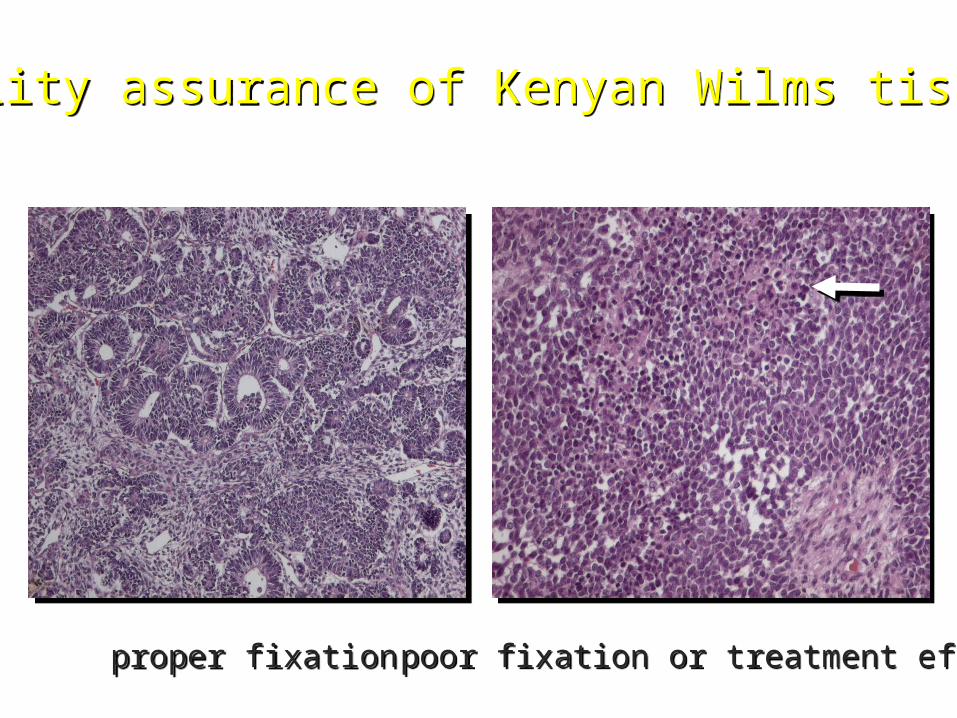
Quality assurance of Kenyan Wilms tissuesQuality assurance of Kenyan Wilms tissues
proper fixationproper fixation poor fixation or treatment effect?poor fixation or treatment effect?
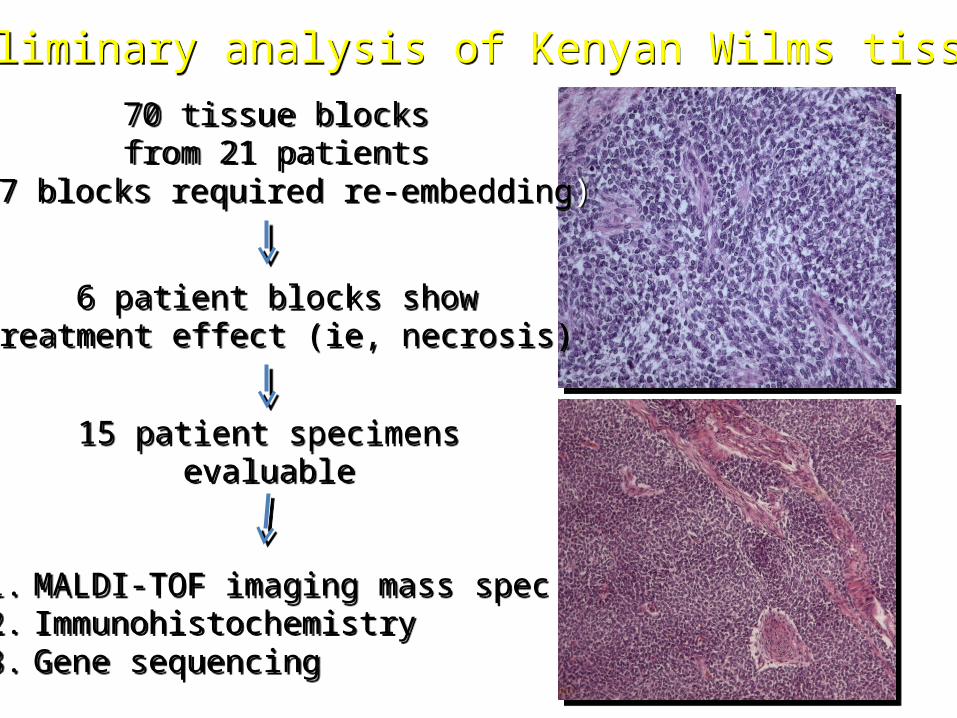
Preliminary analysis of Kenyan Wilms tissuesPreliminary analysis of Kenyan Wilms tissues
70 tissue blocksfrom 21 patients
(67 blocks required re-embedding)
70 tissue blocksfrom 21 patients
(67 blocks required re-embedding)
6 patient blocks showtreatment effect (ie, necrosis)
6 patient blocks showtreatment effect (ie, necrosis)
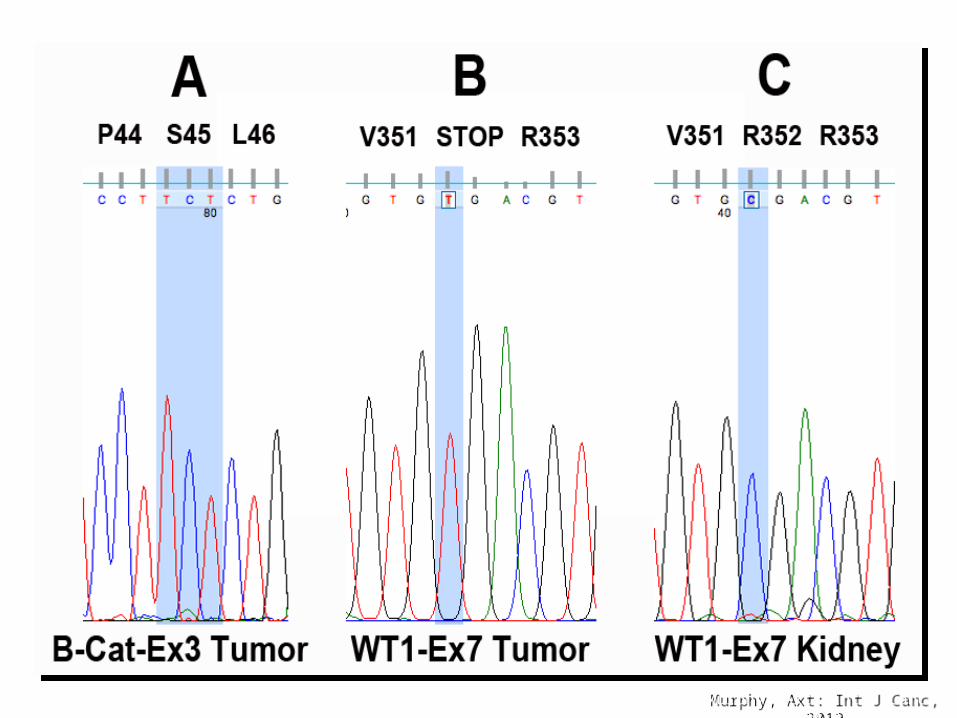
1. MALDI-TOF imaging mass spec2. Immunohistochemistry3. Gene sequencing
1. MALDI-TOF imaging mass spec2. Immunohistochemistry3. Gene sequencing
15 patient specimensevaluable
15 patient specimensevaluable
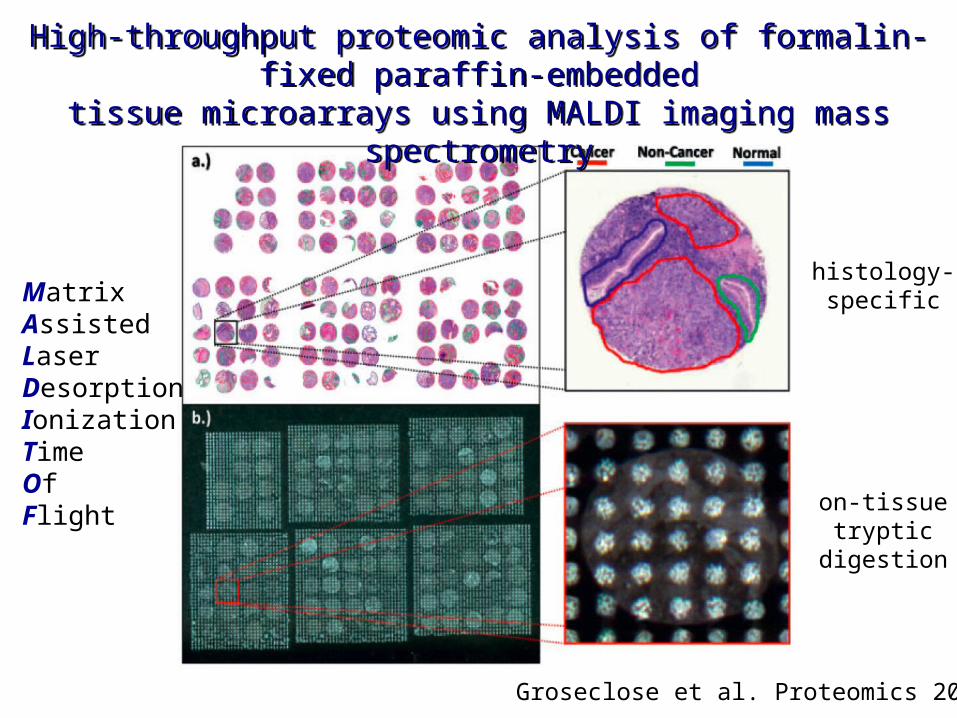
Groseclose et al. Proteomics 2008
High-throughput proteomic analysis of formalin-fixed paraffin-embedded
tissue microarrays using MALDI imaging mass spectrometry
High-throughput proteomic analysis of formalin-fixed paraffin-embedded
tissue microarrays using MALDI imaging mass spectrometry
on-tissuetryptic
digestion
histology-specificMatrix
AssistedLaserDesorptionIonizationTimeOfFlight
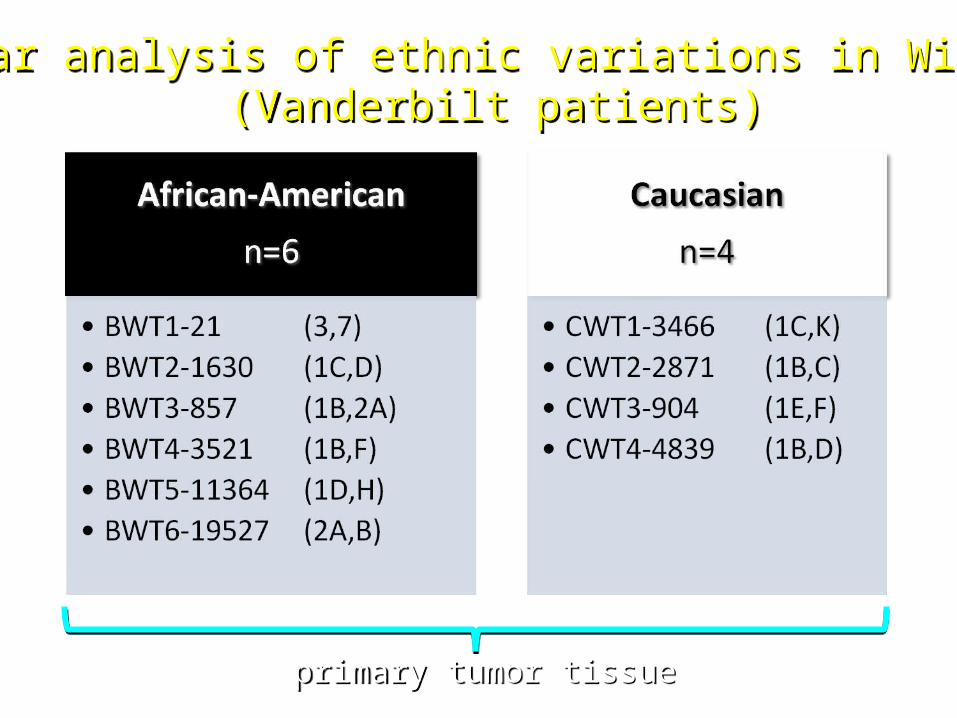
Molecular analysis of ethnic variations in Wilms tumor(Vanderbilt patients)
Molecular analysis of ethnic variations in Wilms tumor(Vanderbilt patients)
primary tumor tissueprimary tumor tissue

mucinous stroma
triphasic
mixoid stroma
BWT1-21-3BWT1-21-3BWT1-21-7BWT1-21-7
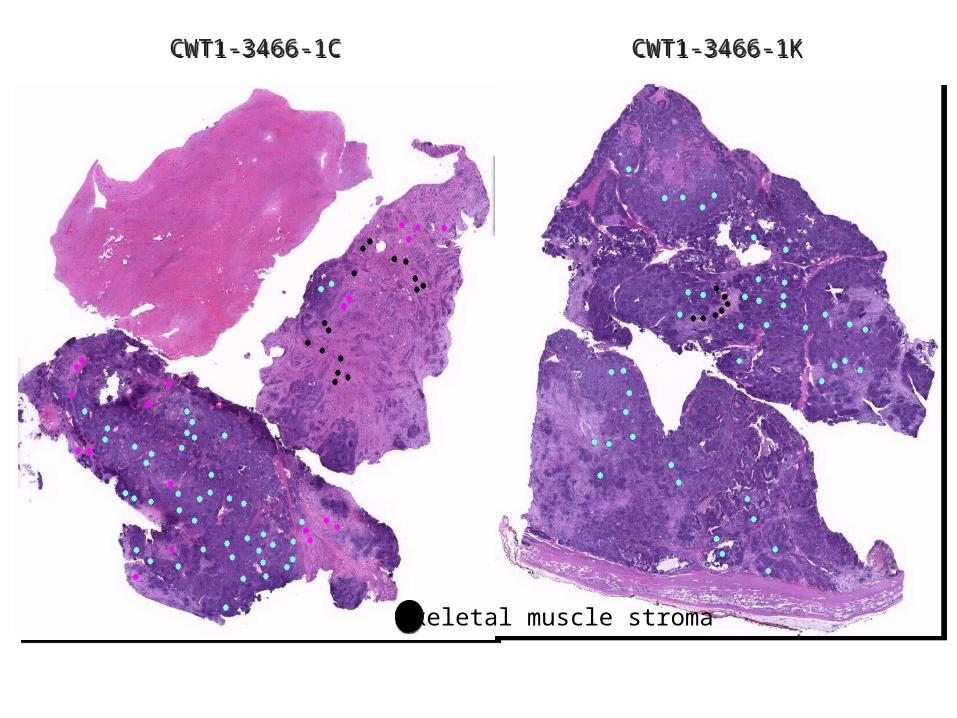
skeletal muscle stroma
CWT1-3466-1CCWT1-3466-1C CWT1-3466-1KCWT1-3466-1K
W
B
B
BBB
BBB
WW
WW
W
B
B
B
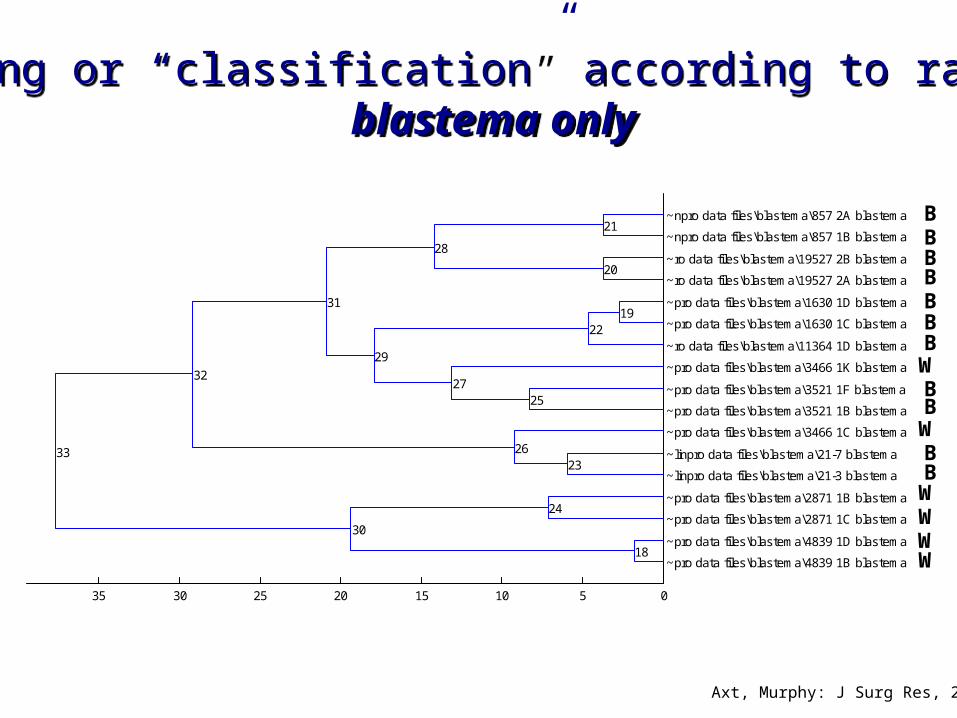
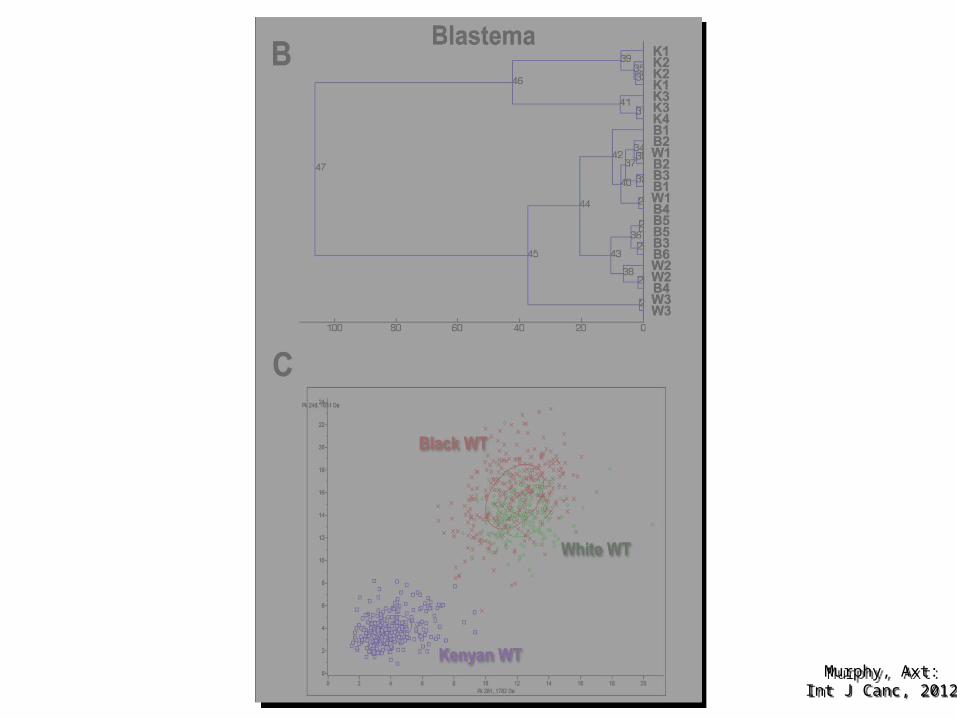
Clustering or “classification” according to race group:blastema only
Clustering or “classification” according to race group:blastema only
Axt, Murphy: J Surg Res, 2011
Inte
nsity
(U
)
Intensity (U)
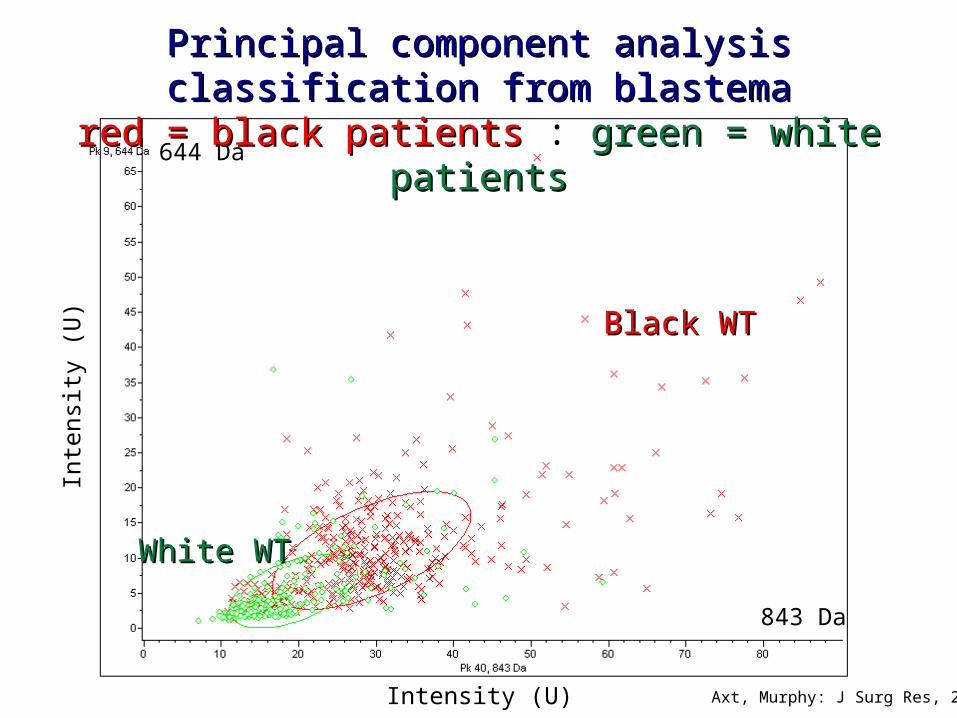
644 Da
843 Da
Black WTBlack WT
White WTWhite WT
Principal component analysis classification from Principal component analysis classification from blastemablastema
red = black patientsred = black patients : green = white patientsgreen = white patients
Axt, Murphy: J Surg Res, 2011
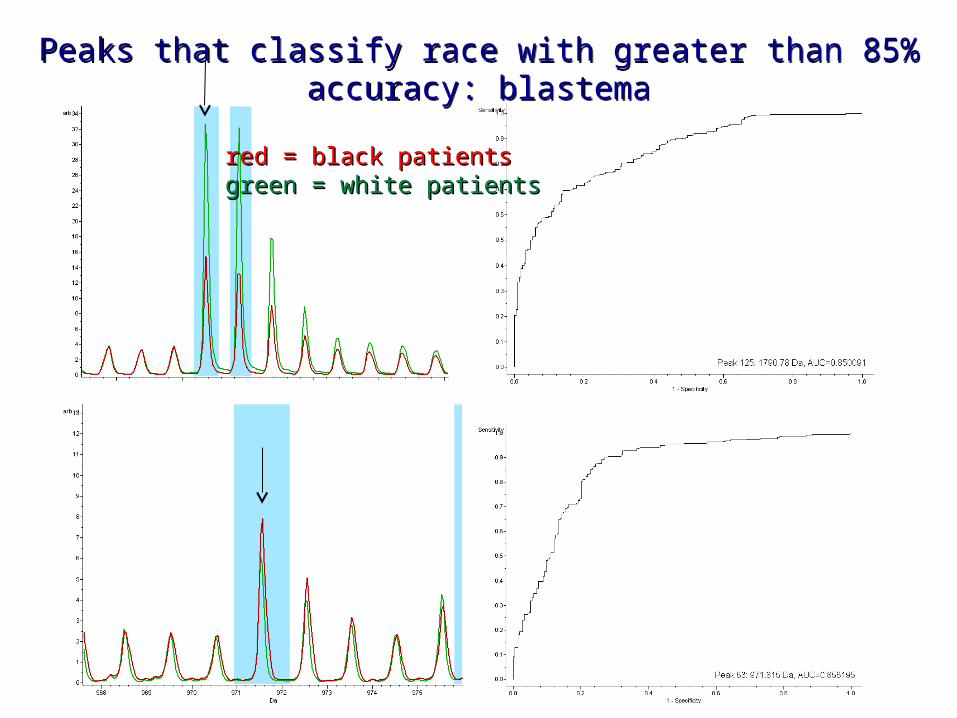
Peaks that classify race with greater than 85% accuracy: blastemaPeaks that classify race with greater than 85% accuracy: blastema
red = black patientsred = black patientsgreen = white patientsgreen = white patients
W
B
BBBBBBB
WW
WWW
W
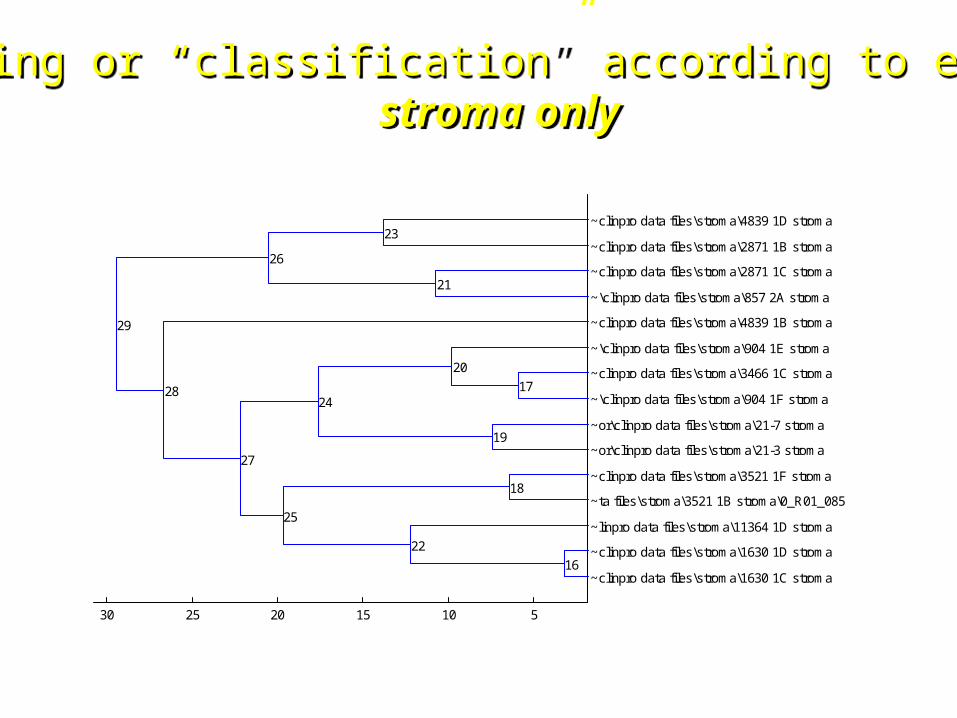
Clustering or “classification” according to ethnicity:stroma only
Clustering or “classification” according to ethnicity:stroma only
Axt, Murphy: J Surg Res, 2011

944 Da
2191 Da
Inte
nsity
(U
)
Intensity (U)
Black WTBlack WT
White WTWhite WT
Principal component analysis classification from stroma
blue = blackblue = black : orange = whiteorange = white
Axt, Murphy: J Surg Res, 2011
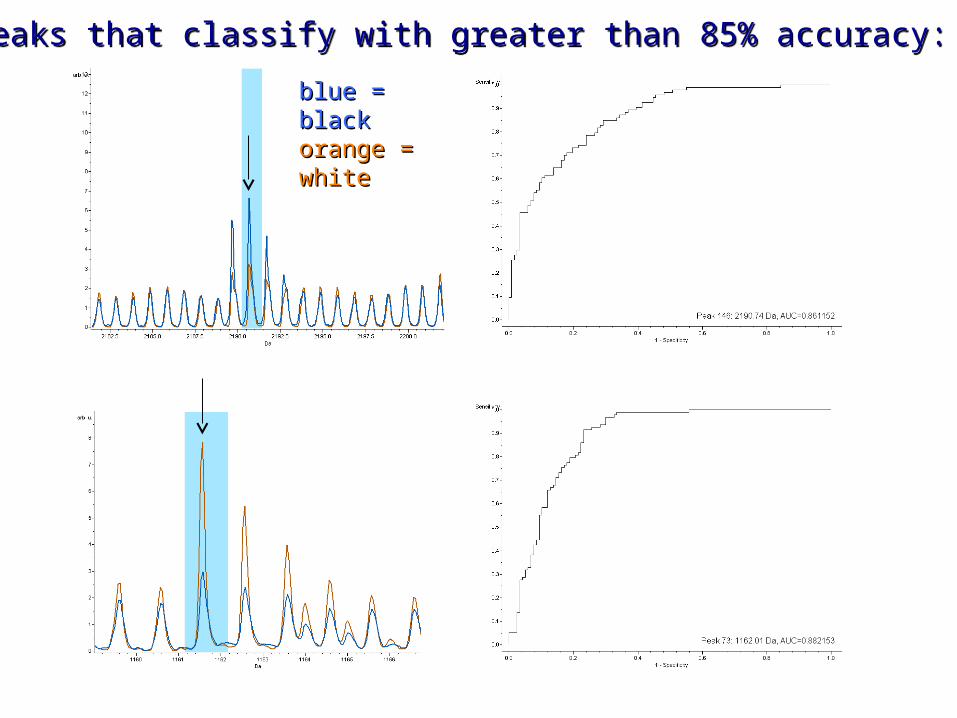
Peaks that classify with greater than 85% accuracy: stromaPeaks that classify with greater than 85% accuracy: stroma
blue = blackblue = blackorange = orange = whitewhite
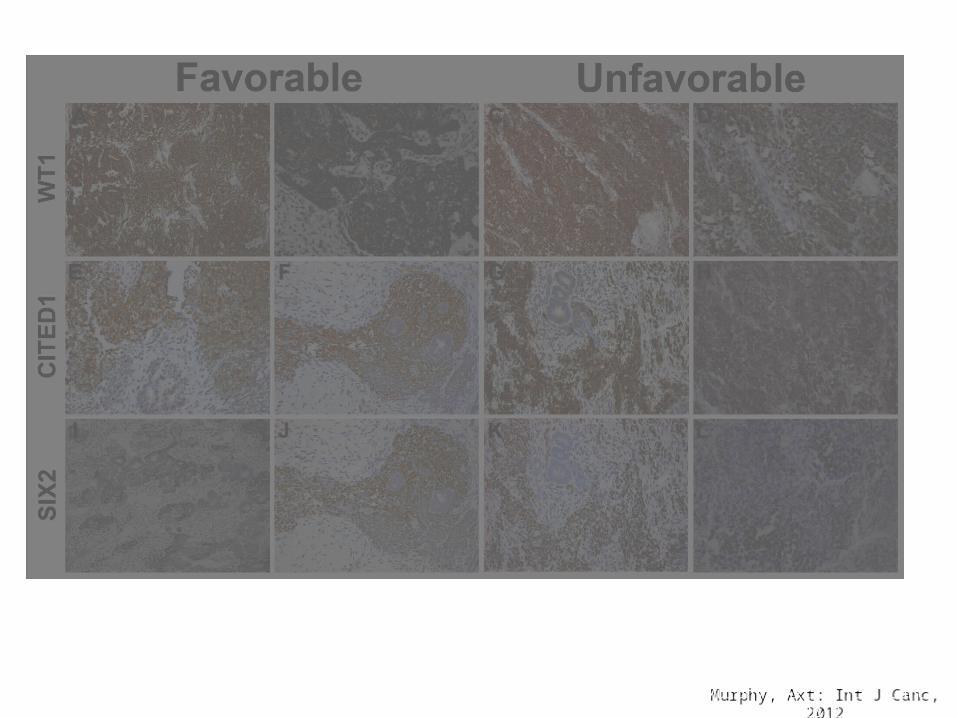
Murphy, Axt:Int J Canc, 2012Murphy, Axt:
Int J Canc, 2012
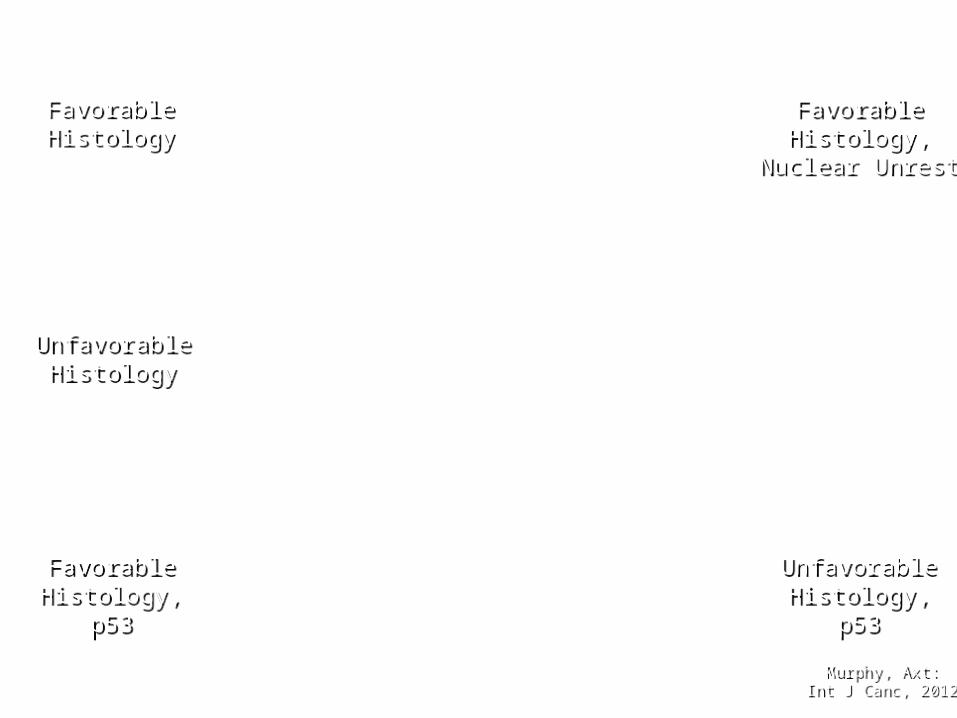
FavorableHistology
FavorableHistology
FavorableHistology,
Nuclear Unrest
FavorableHistology,
Nuclear Unrest
UnfavorableHistology
UnfavorableHistology
FavorableHistology,
p53
FavorableHistology,
p53
UnfavorableHistology,
p53
UnfavorableHistology,
p53
Murphy, Axt: Int J Canc, 2012Murphy, Axt: Int J Canc, 2012
Murphy, Axt:Int J Canc, 2012Murphy, Axt:
Int J Canc, 2012
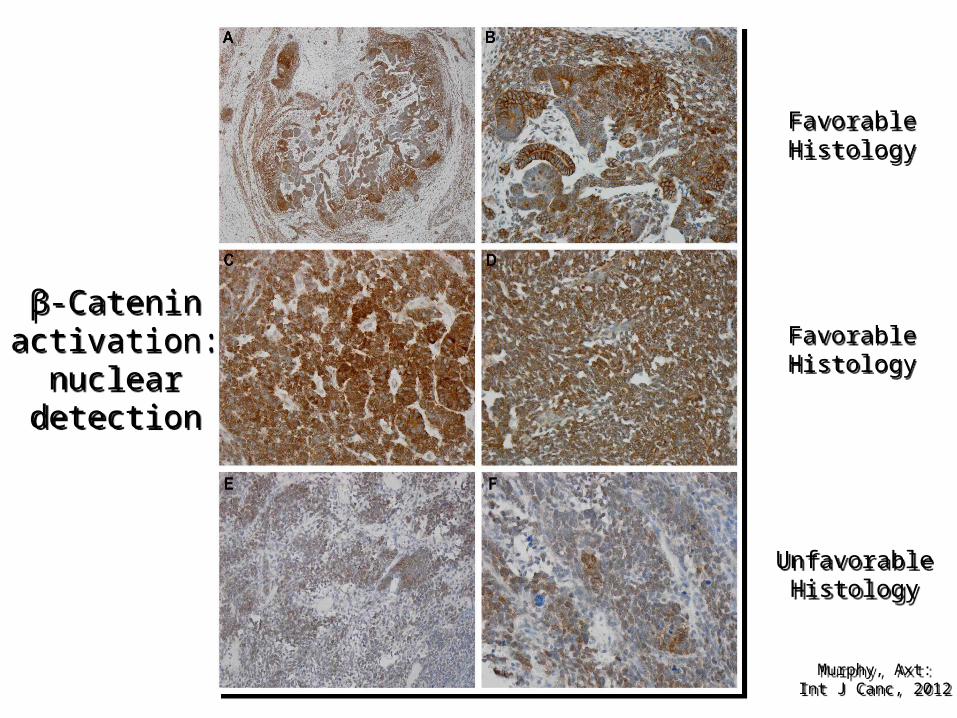
β-Cateninactivation:
nucleardetection
β-Cateninactivation:
nucleardetection
FavorableHistology
FavorableHistology
UnfavorableHistology
UnfavorableHistology
FavorableHistology
FavorableHistology
Murphy, Axt: Int J Canc, 2012Murphy, Axt: Int J Canc, 2012
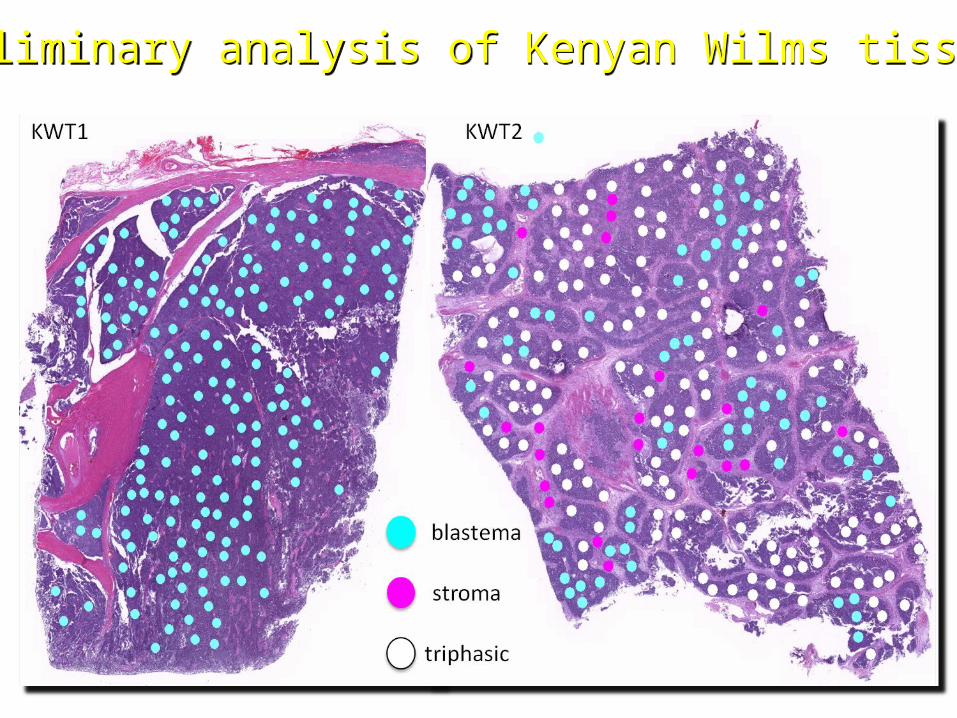
Preliminary analysis of Kenyan Wilms tissuesPreliminary analysis of Kenyan Wilms tissues
Murphy, Axt:Int J Canc, 2012Murphy, Axt:
Int J Canc, 2012

CONCLUSION
• WT specimens arising among different race• groups show unique molecular fingerprints• that could explain disparate incidences and• biological behavior and that could reveal• novel therapeutic targets.
ACKNOWLEDMENTS
• Axt, Jason; Axt, Meridith; Githanga, Jessie; Hansen, Erik; Lessan, Joel; Li, Ming; Musimbi, Joyce; Mwachiro, Michael; Newton, Mark; Ndung’u, James; Njuguna, Festis; Nzioka, Ancent, ; Oruko, Oliver; Patel, Kirtika; Tenge, Robert; Ukoli, Flora; White, Russel; O’Neill, James; Lovvorn, Harold

AcknowledgementsAcknowledgements• National Cancer Institute grant: 1R21National Cancer Institute grant: 1R21CA155946-01• Vanderbilt CTSA grant: UL1 RR024975Vanderbilt CTSA grant: UL1 RR024975• National Cancer Institute grant: 5T32CA106183-National Cancer Institute grant: 5T32CA106183-
06A106A1• National Cancer Institute grant: 4R00CA135695-03National Cancer Institute grant: 4R00CA135695-03• Mass spectrometry:Mass spectrometry:
– Vanderbilt Ingram Cancer Center Core Support GrantVanderbilt Ingram Cancer Center Core Support GrantP30-CA68485P30-CA68485
– Department of Defense Grant DOD W81XWH-05-1- 0179Department of Defense Grant DOD W81XWH-05-1- 0179

THANK YOU!!!