Ethiopia RI Thematic Study marketing - World...
45
Mobilizing Rural Institutions for Sustainable Livelihoods and Equitable Development A Case Study of Agricultural Marketing and Smallholder Cooperatives in Ethiopia By Tanguy Bernard and David J. Spielman International Food Policy Research Institute Addis Ababa, Ethiopia Revised draft for comment April 2008 International Food Policy Research Institute 2033 K St., NW Washington, D.C. 20006 U.S.A. P.O. Box 5689 Addis Ababa, Ethiopia
Transcript of Ethiopia RI Thematic Study marketing - World...

Mobilizing Rural Institutions for Sustainable Livelihoods and Equitable Development
A Case Study of Agricultural Marketing
and Smallholder Cooperatives in Ethiopia
By
Tanguy Bernard and David J. Spielman International Food Policy Research Institute
Addis Ababa, Ethiopia
Revised draft for comment April 2008
International Food Policy Research Institute 2033 K St., NW
Washington, D.C. 20006 U.S.A.
P.O. Box 5689 Addis Ababa, Ethiopia
ii
Table of Contents
1. MARKETING AND SMALLHOLDER COOPERATIVES IN ETHIOPIA ...............................................1 1.1. INTRODUCTION............................................................................................................................................1 1.2. RELEVANCE OF THE STUDY .........................................................................................................................1 1.3. RELEVANCE OF THE STUDY TO ETHIOPIA ....................................................................................................2 1.4. DATA AND DATA SOURCES ..........................................................................................................................4
2. COOPERATIVES AND THEIR CONTEXT IN RURAL ETHIOPIA ........................................................6 2.1. COOPERATIVES, MARKETS AND THEIR LOCAL CONTEXT..............................................................................6 2.2. MARKET ACTORS AND MARKETING CHAINS ................................................................................................7
3. MARKETING COOPERATIVES IN ETHIOPIA .......................................................................................10 3.1. COOPERATIVE DESIGN AND FUNCTION ......................................................................................................10 3.2. INCIDENCE, INCLUSION AND PARTICIPATION .............................................................................................16 3.3. REPRESENTATION, RESPONSIVENESS, AND ACCOUNTABILITY ...................................................................24 3.4. ADAPTABILITY AND ADAPTIVE CAPACITY .................................................................................................31
4. PERFORMANCE, OUTCOMES, AND LIVELIHOODS ...........................................................................33 5. CONCLUSIONS AND RECOMMENDATIONS .........................................................................................38 6. REFERENCES.................................................................................................................................................41
The authors thank Zewdu Tadessa, Dejene Tefera, Martha Negash, and Ira Matushke for their contributions to the work undertaken for this study; Nicolas Perrin, Arun Agrawal, Jeeva A.
Perumalpillai-Essex, Achim Fock, Getachew Adem, Ibrahim Mohamed, Girma Tadesse, Haile Gebre, Abera Bekele, and Belew Worku for their guidance and oversight; and Noah Kebede, Damtaw Engida,
Etenesh Yitna, and Kwaw Andam for their technical support. The authors also acknowledge the insights and comments provided by participants at a World Bank-IFPRI workshop on “Rural Institutions and
Sustainable Livelihoods” conducted in Addis Ababa on April 10-11, 2008.
1
1. Marketing and smallholder cooperatives in Ethiopia
1.1. Introduction
This paper provides a diagnostic of how smallholder cooperatives in Ethiopia contribute to the
improvement of rural livelihoods by facilitating commercial linkages between smallholders and markets.
The paper examines the key problems that necessitate the use of cooperatives for marketing purposes; the
institutional context within which cooperatives operate; the key characteristics of cooperatives engaged in
marketing; and their real and potential outcomes. In doing so, this paper also addresses a key issue in the
study of membership-based rural producer organizations (RPOs)—whether such organizations can be
leveraged for pro-poor development by linking farmers to markets.
The study relies on a combination of qualitative and quantitative data from several different sources. The
analyses contained in this study are specifically drawn from three sources described in the overview
accompanying this paper. They are the 2005 Ethiopia Rural Smallholder Survey (ERSS); the 2006
Ethiopian Smallholder Cooperatives Survey (ESCS); and the 2007 Cooperative-level Case Studies
conducted as a part of this study.
1.2. Relevance of the study
The commercialization of surplus output from small-scale, resource-poor farmers is closely linked to
higher productivity, greater specialization, and higher income. These outcomes, in turn, can contribute
significantly to improvements in household food security, poverty reduction and economy-wide growth
(Timmer 1997; Fafchamps 2005). However, in the face of imperfect markets, high transaction costs,
volatile prices and sizable risks, many smallholders are rarely able to exploit the potential gains from
commercialization (de Janvry et al. 1991; Key et al. 2000; Jayne et al. 2006). Mechanisms to cope with
these constraints are needed to increase smallholder participation in markets and to ensure that they
realize the benefits of participation.
One such mechanism is the membership-based rural producer organization (World Bank 2007; Chen et al.
2006). Governments, donors, and rural development practitioners expect that membership-based RPOs
can help smallholders overcome marketing constraints and contribute to improvements in their well-being
and livelihoods (World Bank 2003; Berdegué 2001; Collion and Rondot 1998).

2
The empirical record—drawn from experiences across a variety of developing countries—provides
insight into the external and internal conditions under which these organizations may be more or less
effective at serving their members (e.g. Bernard et al. 2007, 2006; Chirwa et al. 2005; Neven et al. 2005;
Sharma and Gulati 2003; Damiani 2000; Uphoff 1993; Attwood and Baviskar 1987; Tendler 1983). Key
issues include the extent to which RPOs are inclusive of the rural poor, governed and managed
effectively, responsive to internal and external changes and opportunities, and independent from wider
political agendas.
1.3. Relevance of the study to Ethiopia
These issues are particularly relevant in Ethiopia, where smallholder cooperatives are an important
component of the country’s rural development strategy. In Ethiopia, smallholders represent the vast
majority of the agricultural population (63 percent of farmers cultivate less than one hectare, and 87
percent less than two hectares). Yet just 28 percent of agricultural output in the country is
commercialized, suggesting the need for innovative mechanisms to encourage commercial production
among smallholders (Dessalegn et al. 1998).
These issues are central to the Government of Ethiopia (GoE) and its economic growth strategy,
Agriculture Development-led Industrialization (ADLI). Since it was formally set forth in 1995, this
strategy has motivated efforts to accelerate agricultural growth through the commercialization of
smallholder production (FDRE 2005, 2002). It has also contributed to the foundations of the GoE’s
poverty reduction strategy, which includes the Sustainable Development and Poverty Reduction Program
(SDPRP) approved in 2002, the 2004 Food Security Strategy (FSS), and, most recently, the 2006 Plan for
Accelerated and Sustained Development to End Poverty (PASDEP) (FDRE 2002, 2006).
Farmer cooperatives represent one of the GoE’s key mechanisms through which it intends to promote the
modernization and commercialization of smallholder agriculture. Farmer cooperatives also represent a
preferred mechanism through which many donor and non-governmental organization (NGOs) are
organizing their interventions in support of the country’s agricultural development strategy. Thus, since
1994, the GoE has assigned rural marketing cooperatives with significant responsibility for promoting
smallholder commercialization (cf. Proclamations 85/1994, 147/1998, and 402/2004; FDRE 1994, 1998;
Rahmato 2002).

3
To this end, the Federal Cooperative Agency of Ethiopia was created in 2002 to organize and promote
cooperatives at the national level as a means of promoting smallholder commercialization. Its ambitious
five-year development plan (2006–2010) aims to provide cooperative services to 70 percent of the
population through the presence of at least one such organization in each kebele1 by 2010. Under the
GoE’s current strategy, each kebele is expected to have a cooperative in place by 2010, through which 60
percent of the agricultural outputs will be marketed and 90 percent of agricultural inputs supplied. Legal
reforms in 1998 and 2004 were introduced to strengthen membership incentives by improving member
rights associated with ownership, voting, share transfers, and risk management.
This strong government effort to promote cooperatives implies that the decision of where to establish a
cooperative is largely driven by external considerations, and is thus exogenous to members themselves.
This is further supported by cooperative-level data indicating that only 26 percent of these organizations
were initiated by members themselves (Bernard et al. 2007).
This approach has proceeded even in spite of the long and tumultuous history of cooperatives in Ethiopia
that started during the Imperial era prior to 1973 and continued through the military (“Derg”) regime
(1974-1991), at the fall of which they were dismantled. However, the approach may be slow in fulfilling
its objectives. As of 2005-06, cooperative coverage was estimated at less than 35 percent of all kebeles,
with only 17 percent of households living in a given kebele with a cooperative actually participating in the
organization. And while cooperatives are not meant to be selective, participants tend to be better-off in
terms of physical and human capital (Bernard et al. 2007). Meanwhile, only 55 percent of the
cooperatives that claim to be involved in marketing their members’ surplus cereals output had actually
sold any produce in 2005.
Still, there is much anecdotal evidence from across Ethiopia to suggest that cooperatives can play a
constructive role in promoting smallholder commercialization, particularly with respect to high-value
crops such as coffee, or perishable crops such as dairy, fruits, and vegetables (although the challenge of
extending this role to less valuable food-staple crops remains). Cooperatives can also serve as interfaces
between smallholders and other rural actors, e.g., public, private, and civil society organizations engaged
in research, extension, business education, or entrepreneurship training to enhance productivity and value
addition.
1 In Ethiopia, kebeles or peasant associations (PAs) are the smallest administrative unit below the woreda (district) level. For purposes of comparison, kebeles correspond to a cluster of villages in most other sub-Saharan African countries.
4
1.4. Data and data sources
Data for this study are drawn from three main sources: (a) the 2007 Cooperative-level Case Studies; (b)
the 2006 Ethiopian Smallholder Cooperatives Survey (ESCS); and the 2005 Ethiopia Rural Smallholder
Survey (ERSS). Each source is described in detail in the overview paper accompanying this study.
Note the following. First, while the 2006 ESCS surveyed a total of 207 cooperatives, only 172 were
established with the intention of providing marketing services to their members, while only 140 actually
engaged in marketing services in the prior year. This study draws on this sub-sample of 172 marketing
cooperatives. Second, all of the case study cooperatives covered by the 2007 Cooperative-level Case
Studies are cooperatives with activity portfolios that include, but are not limited to, agricultural
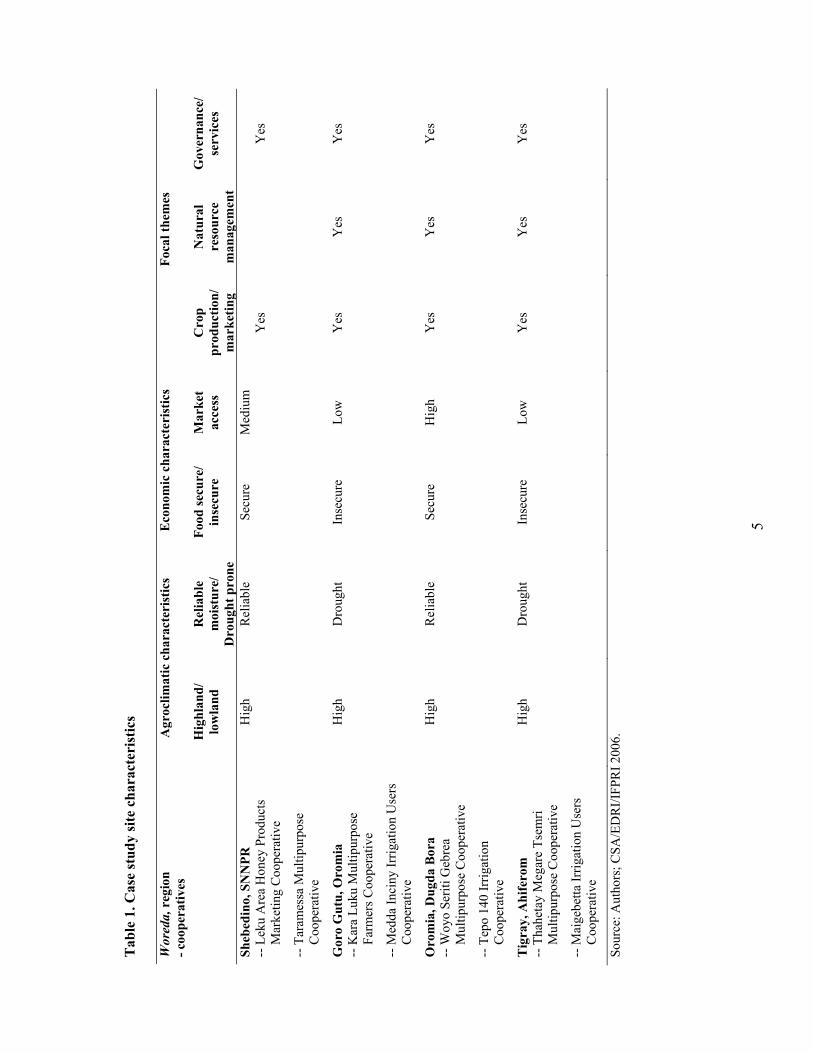
marketing. Table 1 provides a basic description of these cooperatives, including their variation in terms of
agroclimatic zones and socioeconomic characteristics. These case study cooperatives are examined in
more detail throughout the study.
5
Tab
le 1
. Cas
e st
udy
site
cha
ract
eris
tics
A
groc
limat
ic c
hara
cter
istic
s
Eco
nom
ic c
hara
cter
istic
s Fo
cal t
hem
es
Woreda,
reg
ion
- coo
pera
tives
Hig
hlan
d/
low
land
R
elia
ble
moi
stur
e/
Dro
ught
pro
ne
Food
secu
re/
inse
cure
M
arke
t ac
cess
C
rop
prod
uctio
n/
mar
ketin
g
Nat
ural
re
sour
ce
man
agem
ent
Gov
erna
nce/
se
rvic
es
Sheb
edin
o, S
NN
PR
Hig
h R
elia
ble
Secu
re
Med
ium
-- L
eku
Are
a H
oney
Pro
duct
s M
arke
ting
Coo
pera
tive
Yes
Yes
-- T
aram
essa
Mul
tipur
pose
C
oope
rativ
e
Gor
o G
utu,
Oro
mia
H
igh
Dro
ught
In
secu
re
Low
Y
es
Yes
Y
es
-- K
ara
Luku
Mul
tipur
pose
Fa
rmer
s Coo
pera
tive
-- M
edda
Inci
ny Ir
rigat
ion
Use
rs
Coo
pera
tive
Oro
mia
, Dug
da B
ora
H
igh
Rel
iabl
e Se
cure
H
igh
Yes
Y
es
Yes
--
Woy
o Se
riti G
ebre
a M
ultip
urpo
se C
oope
rativ
e
-- T
epo
140
Irrig
atio
n C
oope
rativ
e
Tig
ray,
Ahi
fero
m
Hig
h D
roug
ht
Inse
cure
Lo
w
Yes
Y
es
Yes
--
Tha
heta
y M
egar
e Ts
emri
Mul
tipur
pose
Coo
pera
tive
-- M
aige
betta
Irrig
atio
n U
sers
C
oope
rativ
e
Sour
ce: A
utho
rs; C
SA/E
DR
I/IFP
RI 2
006.
6
2. Cooperatives and their context in rural Ethiopia
2.1. Cooperatives, markets and their local context
In light of the GoE’s strategies for rural development and economic growth, smallholder
commercialization is a topic that has received extensive attention in recent years. And as in many other
sub-Saharan African countries, Ethiopia’s agricultural sector underwent major reforms in the in the early
1990s to encourage smallholder commercialization. Specific reforms included the removal of restrictions
on private trade in grains and other commodities.
But while these reforms increased market integration, market competition, and the entry of private
traders, wider systemic and structural constraints may have limited the impact of reforms. Several studies
on agricultural marketing in Ethiopia describe the challenges facing both smallholders and the wider
economy.
A fundamental problem in Ethiopia is the persistently high transactions costs associated with trading
agricultural commodities (Gabre-Madhin 2001; Dercon 1995; Negassa and Jayne 1997). Poor market
information systems to provide smallholders and traders with price information, when coupled with poor
infrastructure and weak private sector capacity, are a significant impediment to the commercialization of
the country’s largely subsistence-oriented smallholder population (Gabre-Madhin et al. 2003; Alemu et al.
2006a, 2006b). Indeed, these factors are believed to have contributed to Ethiopia’s most recent food crisis
in 2002-03 when, despite good harvest and sizable grain surpluses, grain producer prices dropped 60-80
percent (Gabre-Madhin et al. 2003). A wide range of solutions are needed to improve financial services
for the agricultural sector, modernize storage facilities for grains and other commodities, facilitate
linkages between agricultural production and processing, and improve legal recourse for contract
enforcement. To the credit of both the GoE and stakeholders in the agricultural sector, progress is being
made in many of these areas.
To provide a more detailed understanding of the context within which smallholder commercialization is
progressing, as well as the constraints it faces in Ethiopia, we provide here an overview of the markets for
food staple crops (grains, namely teff, wheat and maize, representing Ethiopia’s main staples) and high
value crops (coffee). These two sets of crops are critically important: 98 percent of grains cultivated in
Ethiopia are produced by smallholders, of which 80 percent are cereals; while coffee, Ethiopia’s largest
export crop, comprises 37 percent of its export earnings (Gabre-Madhin 2001; NBE various years).

7
2.2. Market actors and marketing chains
A closer look at the key actors and their interactions in markets for grain and coffee provide a better idea
of exactly where these constraints exist, and how such constraints might be lifted. The following draws
largely from Gabre-Madhin et al. (2003) and from observations drawn from the data sources used in this
study.
The key interface between farmers and markets occurs primarily at level of the market town—often, the
woreda capital and/or a junction between primary or secondary roads—with marketable surpluses moving
onward through a series of exchanges in regional and terminal markets. Market participants in these
marketing chains include a range of actors including assemblers/collectors, wholesalers, processors,
brokers, cooperatives, government agencies, financial service providers, and industry associations, and
vary between grain markets (Figure 1) and coffee markets (Figure 2). Key participants include the
following.
– Assemblers and collectors. Assemblers are traders or part-time traders in assembly markets who collect surplus output from farmers at the farm-gate, from village markets, or from market towns. Collectors, found commonly in the coffee sector, are locally-licensed traders who, by law, are allowed to buy only sun-dried coffee from individual farmers. They typically transfer their purchases to wholesalers.
– Grain wholesalers. In Ethiopia’s grain markets, wholesalers can be classified into three major
categories, with some overlap: (a) the regional wholesalers who supply grain from the surplus areas or from farmers, assemblers, or other wholesalers and sell their grain to the central markets and sometimes to deficit markets; (b) wholesalers in the deficit market who purchase in bulk from regional wholesalers or from central markets such as Addis Ababa and sell in deficit markets; and (c) government parastatals such as Ethiopian Grain Traders Enterprise (EGTE).
– Coffee wholesalers. In Ethiopia’s coffee markets, Wholesalers are coffee traders whose licenses
entitle them only to buy sun-dried coffee from collectors. Currently suppliers are allowed to buy coffee directly from farmers. The wholesalers have to process their coffee before taking it to the terminal market, where it is auctioned. However, as per the regulation, suppliers are not allowed to involve in export. They have storage facilities and some even have their own hullers.
– Processors. Processors include grain mills, coffee processing companies, or value-adding enterprises
that are owned either by private individuals and the government and who process commodities for onward distribution to intermediary or consumer markets. In market towns, small grain mills also serve as grain wholesaling and retailing outlets, and may provide cleaning and packaging services to customers as well.
– Brokers. Brokers specialize in bringing the buyers and sellers together by facilitating sales between
wholesalers and other wholesalers, processors, or retailers; by disseminating price and other information to market participants; and by influencing grain trade and price formation in the Addis Ababa central market. Brokers can be classified as those with relatively more working capital with

8
which to provide storage services, cover transportation cost on behalf of regional wholesale traders, and engage in wholesaling. The second group of brokers only facilitates the sales of grain brought to the market at some fixed rate for their services.
– Exporters. Exporters are coffee traders who are allowed to buy coffee at the auctions, and to process
and export it. Although getting a license to export coffee from the Federal Ministry of Trade and Industry is relatively easier, the Ethiopian Coffee and Tea Authority also maintains some regulatory control by checking the minimum level of capital, sufficient facilities to operate, etc. before the applicant is given the license. Coffee exporters are not allowed to by coffee from farmers, collectors and suppliers. They are only allowed to buy coffee from the auction markets. Efforts should be made to allow exporters to buy coffee directly from farmers. Coffees that are not sold in the auction or cannot be exported are sold to domestic wholesalers. In 2002, there were over 180 exporters, out of which 72 were active. The export share of the private sector has grown significantly in recent years.
– Cooperatives and cooperative unions. Cooperatives for both grain and coffee are involved in a range
of activities including from supplying inputs to collecting, processing and wholesaling surpluses from smallholder production. In the coffee sector, several cooperatives are licensed to export as well. Cooperative unions provide both input supply and marketing services to their member cooperatives, and sometimes to other cooperatives throughout the country.
– Government agencies. A range of government agencies is involved in the production and marketing
of cereals and coffee. Chief among them is the Ministry of Agriculture and Rural Development (MOARD) and the regional ministries of agriculture and rural development. Through woreda-level offices, kebele-level development agents, and (more recently), through cooperatives, MoARD and its regional counterparts provide inputs (seed and fertilizer), extension and advisory services, promotion of and support to cooperatives, and a range of other agricultural production and marketing services. Similarly, the Ethiopian Coffee and Tea Authority and the regional coffee and tea bureaus provide technical services such as extension, training, processing, and marketing to coffee growers and other market actors, while also representing the industry in policymaking and international forums.
– Financial service providers. Regional credit and savings institutions represent the main source of
financing for the purchase of inputs for smallholder production. The Development Bank of Ethiopia (DBE) is the main supplier of both short and long term loans to coffee growers, processors and exporters, and has recently become engaged in providing short-term loans to coffee marketing cooperatives and new investors in the coffee sector.
– The Ethiopian Private Coffee Exporters Association. The coffee exporters association was created to
provide coffee trade information, advocate for improved policy environment and provide technical support to its members (private exporters). It promotes coffee exports, organizes conferences for its members, etc.
For cereals, farm-gate sales to regional traders represent 36 percent of all sales, followed by sales directly
to rural consumers (31 percent) and rural assemblers (12 percent), the latter of which re-sell onward to
regional traders. Even despite grain market reforms over the past decade, processors still do not play a
more significant role at points of exchange beyond the farm-gate (Gabre-Madhin et al. 2003).
9
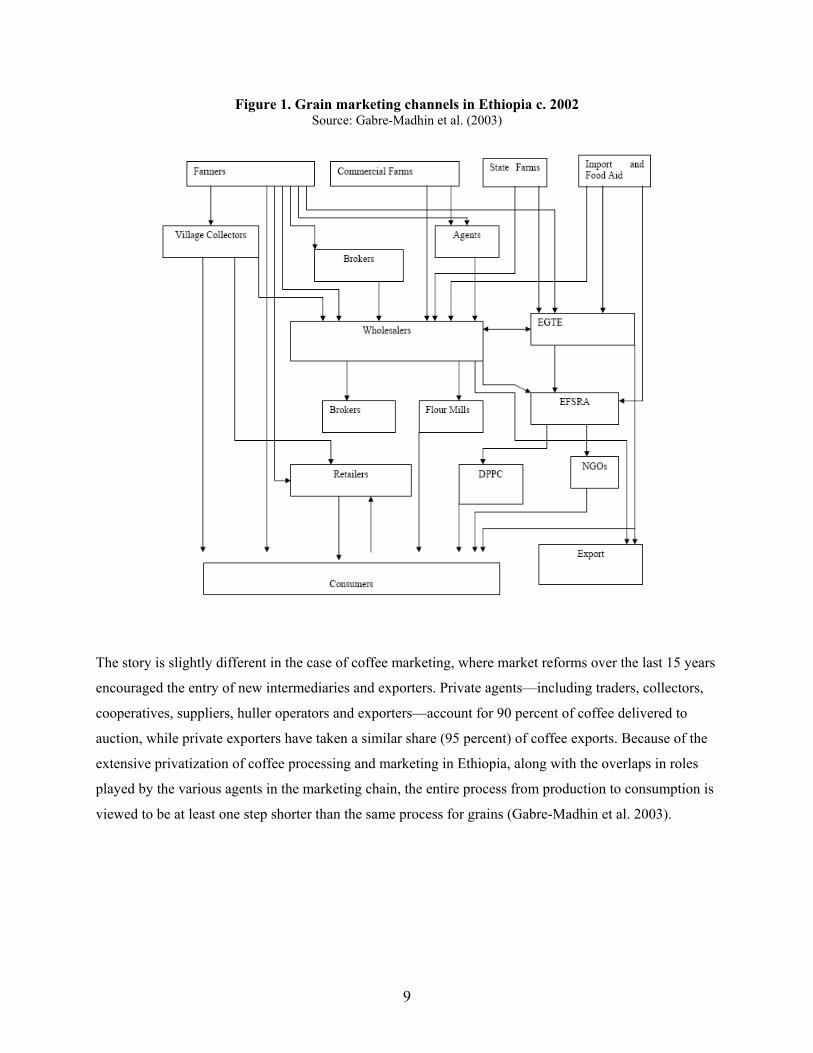
Figure 1. Grain marketing channels in Ethiopia c. 2002 Source: Gabre-Madhin et al. (2003)
The story is slightly different in the case of coffee marketing, where market reforms over the last 15 years
encouraged the entry of new intermediaries and exporters. Private agents—including traders, collectors,
cooperatives, suppliers, huller operators and exporters—account for 90 percent of coffee delivered to
auction, while private exporters have taken a similar share (95 percent) of coffee exports. Because of the
extensive privatization of coffee processing and marketing in Ethiopia, along with the overlaps in roles
played by the various agents in the marketing chain, the entire process from production to consumption is
viewed to be at least one step shorter than the same process for grains (Gabre-Madhin et al. 2003).

10
Figure 2. Coffee marketing channels in Ethiopia c. 2002 Source: Gabre-Madhin et al. (2003)
These two cases illustrate the complexity of marketing chains in Ethiopia and the difficulties facing
smallholders and other marketing chain agents. At each point along the chain, there exist constraints
relating to inequitable bargaining power, information asymmetries relating to both commodity price and
quality, issues of quantities and scale economies, as well as standards and measures. It is for many of
these reasons that cooperatives are expected to play a constructive role in the commercialization and
marketing of smallholder production.
3. Marketing cooperatives in Ethiopia
3.1. Cooperative design and function
More specifically, marketing cooperatives are intended to be the main conduit for both input provision to
smallholders and marketing of their surplus output. Marketing cooperative design in Ethiopia follows a
fairly consistent template, not least because of the common approach taken by federal, regional, and

11
woreda authorities in promoting cooperative formation. Thus, most cooperatives are governed by a
management committee consisting of several members who handle most of the day-to-day operational
decisions. Other bodies include membership committees (for the consideration and admittance of new
members), finance committees (for bookkeeping and the distribution of dividends), and other, more ad
hoc committees set up for various purposes. Figures from the 2006 ESCS show that 94 percent of
management committee members are said to have received management training.
Marketing cooperatives also maintain a fairly standard function in terms of their activity portfolios. We
present here figures from the 2005 ESCS that are drawn from a sample of 172 cooperatives that were
specifically identified as being involved in some form of agricultural marketing by both the woreda
cooperative promotion office and the cooperative itself (Table 2). Most marketing cooperatives (84
percent) were engaged in the provision of fertilizer or improved seed to their members, price information
(71 percent) and credit services (54 percent) to their members.
Table 2. Smallholder marketing cooperatives in Ethiopia: Descriptive statistics Variablea
Unit / description Mean
(Std Dev) Cooperative characteristics Average membership size Number of members in 2005 942.23 ( 773.52) Average land holding per member Hectares 1.75 (1.01) Age of cooperative Years 8.18 (4.68) Received external assistance at inception Yes 59.30 (49.27) Received financial assistance at inception
Yes 20.34 (40.37)
Marketing performance Sold members’ surpluses over the past 12 months Percent 58.72 (49.37) Value of surplus output sold last yearb Ethiopian Birr 256,408 (734,526) Value sold last year, per memberb
Ethiopian Birr 1,116 (6,982)
Marketing-related activities
Average number of marketing-related activities No. of activities, including marketing 3.51 Input provision Percent providing this service 83.72 % Credit Percent providing this service 54.06 % Extension Percent providing this service 23.25 % Price information Percent providing this service 70.93 % Processing
Percent providing this service 19.18 %
a Based on a sample of 172 cooperatives surveyed in 2005. b Only for cooperatives reporting that they had sold members’ surplus output. 1Ethiopian Birr (ETB) ≈ 0.114 US
dollars (USD). Source: ESCS (2006)

12
However, in spite of the consistent design of cooperatives in Ethiopia, there are significant variations in
terms of the role and functions that marketing cooperatives play.
Consider, for example, the Leku Area Honey Products Marketing Cooperative in Shebedino woreda of
the SNNP regional state. The Leku Cooperative is a honey production and marketing organization located
in Shebedino woreda of the Southern Nations, Nationalities, and Peoples (SNNP) regional state.
The woreda comprises 32 densely-populated kebeles that cover a range of agroecological zones
(highlands, midlands, and lowlands) and with it, a range of stresses (drought, pest infestations, volatile
rainfall patterns, and flooding). Average household size is 7-8 people with average land holdings of 0.25
hectares per household. The woreda’s farming activities rely primarily on rainfed cultivation of coffee,
maize, false banana, and beans. Since the drought in 2001-03, the woreda has seen consistent rainfall that
has improved the area’s food security situation significantly.
The Leku Cooperative was established in 2002 by a small group of beekeepers—in effect, a local
solidarity group—to train its members in modern beekeeping technologies, increase honey production
among its members, and protect them from price volatility in the honey market. Today, the cooperative is
promoting modern beehiving and honey extraction techniques among its 127 members, and is marketing
its high-quality honey in local markets at a significant (133 percent) margin over the farm-gate price. The
cooperative is succeeding in its efforts to improve the quality of production and processing through the
introduction of new technologies such as modern beehives and a honey extractor.
But the cooperative is also struggling on the marketing side: Its sales are limited to the local market only,
and it has thus far missed out on marketing opportunities in the nearby regional capital (Awassa) and
contract opportunities with a private firm (Beza Mar PLC) owing to a lack of technical capacity to seize
these opportunities. The cooperative’s level of human capacity is quite limited, and they are currently in
search of technical training assistance in most areas of engagement, including production, processing and
marketing.
The Leku Cooperative is indicative of many cooperatives in Ethiopia, including both those case study
cooperatives covered by this study and those surveyed by the 2006 ESCS. Despite lofty goals, members’
high expectations, and workable designs, their functional capabilities are fairly limited. Many lack the
managerial and technical capacity needed to play a significant role in the marketing of surplus output for
their members.

13
Another useful example is the Woyo Seriti Gebreal Multipurpose Cooperative in Dugda Bora woreda,
Oromia region. The woreda is situated in the lowlands of the Rift Valley characterized by issues of soil
fertility and erosion, limited and variable rainfall, small and scattered landholdings, and endemic diseases
such as malaria. In spite of this, the woreda is also suitable for cultivation of high-value crops such as
onions, chilis, tomatoes and potatoes with the provision of irrigation that draw water from neighboring
Lake Ziway. The area is also suitable for high-value crop cultivation because it is situated within the
Ziway-Meki marketshed, an area of rapid economic growth that lies within close proximity to Addis
Ababa, Adama, Mojo and other commercial centers via two of Ethiopia’s major primary transport arteries
that link the central, south and eastern parts of the country.
While the area offers significant potential for both production and marketing, smallholders in the area
have only begun exploiting these opportunities in the last 5-10 years. And, by their own admission, they
are still learning how to bargain with area traders to obtain profitable or even break-even returns on their
crops.
The Woyo Seriti Gebreal Cooperative was formed in 2000 by a small group of farmers who owned land
adjacent to one another and to Lake Ziway. The purpose of the cooperative is to increase agricultural
yields and output of its members, provide them with market price information, provide access to financial
services, and improve their position with local traders through collective bargaining. From an initial
membership of 25 (22 men and 3 women, all drawn from separate households), the cooperative has
expanded concurrently with the expansion of its pump irrigation scheme to 48 members (42 men and 6
women). Each member cultivates 0.5 hectares within the pump irrigation scheme’s catchment area.
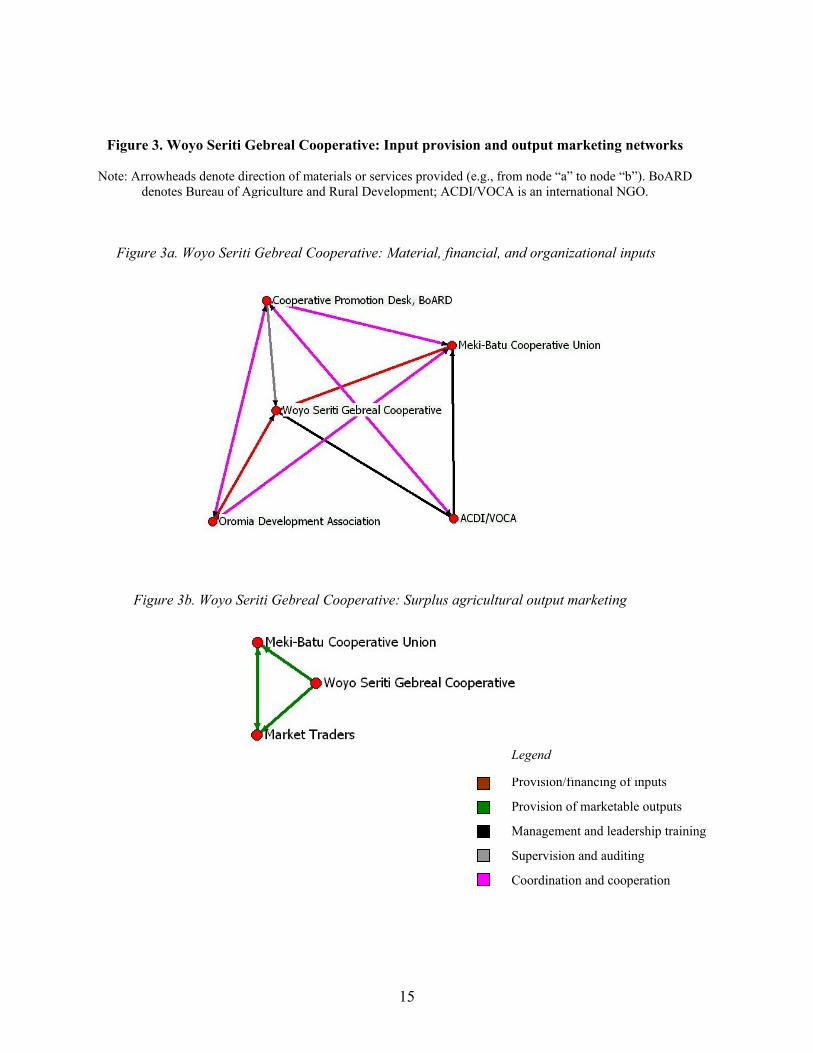
The cooperative’s success is attributable to a number of factors, including the extensive material, financial
and organizational support it receives from different sources (Figure 3). The Oromia Development
Association (ODA), a local NGO working in close collaboration with the regional government, provided
the cooperative with a loan of 110,000 Birr which was used to purchase the pump and irrigation
equipment. The Meki Batu Cooperative Union provided the cooperative with a working capital loan of
200,000 to cover inputs (pump motor maintenance, fuel, seed, fertilizer, pesticides and equipment) for
high-value crop cultivation. The cooperative promotion desk at the woreda office of the Bureau of
Agriculture and Rural Development for Oromia region provides oversight of the cooperative’s
governance system, and was instrumental in securing the cooperative’s legal status in 2003.
14
ACDI/VOCA, an international NGO has provided training in cooperative management with sessions on
bookkeeping, recordkeeping, administration and leadership.
For the most part, the support provided by these organizations to the Woyo Seriti Gebreal Cooperative is
given in a coordinated and concerted manner. Figure 3 below illustrates the Woyo Seriti Gebreal
Cooperative in terms of access to agricultural inputs and marketing of agricultural surplus. As shown in
this figure, ACDI/VOCA’s activities are undertaken in partnership with the woreda office of the BoARD,
while the Meki Batu Cooperative Union maintains close linkages with both of these organizations in areas
such as training and capacity strengthening. This particular case is indicative of how the design and
functions of cooperatives contribute to their success given the right combination of production inputs,
market accessibility, and concerted effort by government agencies, non-governmental organizations, and
rural producer organizations.
15
Provision/financing of inputs
Provision of marketable outputs
Management and leadership training
Supervision and auditing
Coordination and cooperation
Legend
Figure 3a. Woyo Seriti Gebreal Cooperative: Material, financial, and organizational inputs
Figure 3. Woyo Seriti Gebreal Cooperative: Input provision and output marketing networks
Note: Arrowheads denote direction of materials or services provided (e.g., from node “a” to node “b”). BoARD denotes Bureau of Agriculture and Rural Development; ACDI/VOCA is an international NGO.
Figure 3b. Woyo Seriti Gebreal Cooperative: Surplus agricultural output marketing

16
3.2. Incidence, inclusion and participation
We examine here issues relating to the incidence of cooperatives in Ethiopia and, more specifically, the
extent to which they are inclusive, i.e., allowing for the participation of all individuals or households that
are meant to be covered.
Of the 205 cooperatives surveyed under the 2006 ESCS, 172 (84 percent) declared that they were
engaged in marketing their members’ production. Using data on these cooperatives, Bernard et al. (2007)
found that the overall incidence of cooperatives among Ethiopian smallholders remains limited at present:
Only 9 percent of all smallholders were members of such organizations in 2005. This low incidence may
result from both limited cooperative coverage and limited participation incentives. Indeed, only 40
percent of households have access to a cooperative in their kebele, while only 17 percent of the
households that do live in a kebele where a cooperative exists are, in fact, members.
Surveys of non-members suggests a variety of possible reasons for not joining, ranging from a perception
that the cooperative will not be beneficial, to concerns about the trustworthiness of cooperative
management, to rejection of membership bids (Table 3). These figures suggest the need for closer
examination of households’ reluctance or inability to participate in a cooperative in Ethiopia.
History and legacy. First, households may be reluctant to join because of the cooperative movement’s
checkered past in Ethiopia. Under the previous regime, cooperatives were used to extend strong
government control to the local level and promote socialist ideology through compulsory participation.
Field observations suggest that present-day cooperatives must go through a slow process of trust recovery
to overcome persisting suspicion and wariness on the part of their potential members.
Such was the case with the Taramessa Multipurpose Cooperative in Shebedino woreda of the SNNP
regional state. The cooperative was first established in 1974-75 under the Derg regime not only to boost
coffee production, but also to manage the economic activities of its farmer-members. At that time,
farmers were obliged to supply and sell all their main outputs (coffee and maize) to the cooperative for a
price set by the state. In return, they received access to shops for basic consumer items and grain mills,
both owned by the (state) cooperatives and distributed to each kebele.
Following the fall of the Derg in 1991, the cooperative collapsed and its property was stolen, damaged or
left idle. The cooperative was brought back to life in 1995 with a loan of 700,000 Birr from the Ethiopian
Coffee and Tea Authority for the purchase of machinery and the construction of a new office. The

17
cooperative now boasts over 2,000 members and, in spite of price volatility in international coffee
markets and some internal governance issues (discussed later), is performing satisfactorily, according to
members interviewed for this study.
Table 3. Reasons for not being a member of a cooperative (percent) Response ESCS cooperatives
(in percent, n=270) Case study cooperatives
(in percent, n=53)
Doesn’t think the organization could benefit him/her 39 9Was not accepted as a member in the organization 14 9Prefers to wait until he/she sees that the organization is benefiting other members
13 4
Scared that once money is invested in the organization, it will be difficult to get it back
11 0
Does not trust this organization’s management 9 2Does not trust organizations in general 4 0Is not aware that the organization exists 0 23Does not have land (e.g., in the cooperative’s area of operation) -- 28Does not have money to meet membership requirements -- 13Other
9 11
Source: ESCS (2006); 2007 Cooperative-level Case Studies. Note: May not total to 100 percent due to rounding.
Conception and formation. Second, some households may not join cooperatives simply as a result of the
way in which a specific cooperative was conceived and formed. While woreda-level cooperative
promotion offices play a central role in establishing and designing cooperatives, some cooperatives form
along more organic lines, for example, as local solidarity groups among peers, as a group neighbors
defined by some geographic limitation, or as the result of some implicit membership criteria. Table 3
gives a statistical representation of the magnitude of the phenomenon.
Again, the Leku Honey Marketing Cooperative provides an illustration of this phenomenon. Membership
in the Leku cooperative is technically open to all and draws from across several kebeles and ethnic groups
in the woreda. The only membership criteria is the purchase of a share in the cooperative and payment of
membership fees that total 30 Ethiopian Birr (US$3.35)—an amount that is not particularly onerous for
most households in the woreda. Yet membership remains limited: Only about a third of all households

18
involved in beekeeping in the woreda are actually members of the cooperative. This is mainly due to two
factors: First, that few beekeepers in the woreda are actually aware of the cooperatives existence; and
second, that the cooperative leadership places high value on prior knowledge of, and a one-to-one
relationship with, prospective members. In effect, the cooperative operates as a local solidarity group
among peers rather than a major marketing channel for the area.
The Woyo Seriti Gebreal Multipurpose Cooperative in Dugda Bora woreda of Oromia region offers
another illustration of these criteria. The cooperative’s initial membership was limited to just 50
households that held land within the pump irrigation system catchment area. Since diversifying into
activities such as input supply and seed multiplication, membership has been expanded, and has
maintained a strong track record in delivering services to its initial members (those who are part of the
pump irrigation scheme), new members (those who use its collective marketing and input supply
services), and non-members (those who make use of the cooperative’s collective marketing and input
supply services).
Economic incentives. Third is another class of explanation based on the analysis of a household’s
economic incentives to participate in a cooperative. Consider, for instance, a commercialization
cooperative where each individual’s gain from participation is a function of both the gains in prices he/she
may obtain from participating in the organization, and the quantity of output he/she would like to market.
The price difference is in large part driven by the level of product aggregation in the cooperative. Indeed,
it is likely that the per unit transaction costs decrease with the total amount commercialized. This is also
true at the individual level, where it is often observed that larger farmers face lower per unit of output
transaction costs than smaller ones. The gains in transaction costs provided by the cooperative are
therefore typically larger for the smallest farmers than for the larger ones. The total gains however will
depend on the overall quantity that is being commercialized: for a given per unit gain, those with a lower
marketable surplus will now gain less than those with larger surplus. From these simple mechanisms, one
can clearly see an inverted U-shape relationship between the “size” of the farmer, and his/her potential
gains from the cooperative on a commercialization perspective.2 Considering a fixed cost of participation
into the organization, one may therefore observe somewhat of a “middle-class” effect of cooperative
participant, similar to what Weinberger and Jutting (2001) observed in Chad.3
2 Note that commercialization can here refer to both access to inputs and marketing of output. 3 Of course, few, if any, cooperative participants could be classified as “middle class” in terms of the broader distribution of income in Ethiopia. Rather, most participants would likely be classified as “poor” or “extremely poor,” and would likely fall within Ethiopia’s lowest income deciles.
19
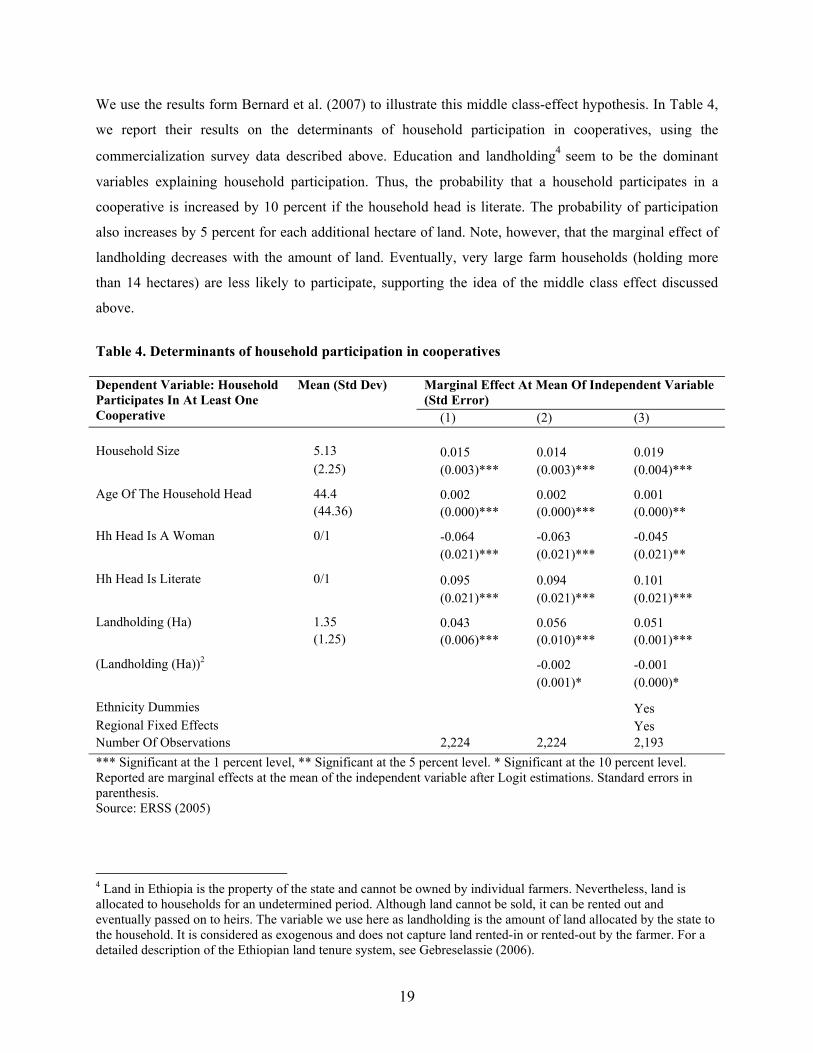
We use the results form Bernard et al. (2007) to illustrate this middle class-effect hypothesis. In Table 4,
we report their results on the determinants of household participation in cooperatives, using the
commercialization survey data described above. Education and landholding4 seem to be the dominant
variables explaining household participation. Thus, the probability that a household participates in a
cooperative is increased by 10 percent if the household head is literate. The probability of participation
also increases by 5 percent for each additional hectare of land. Note, however, that the marginal effect of
landholding decreases with the amount of land. Eventually, very large farm households (holding more
than 14 hectares) are less likely to participate, supporting the idea of the middle class effect discussed
above.
Table 4. Determinants of household participation in cooperatives
Marginal Effect At Mean Of Independent Variable (Std Error)
Dependent Variable: Household Participates In At Least One Cooperative
Mean (Std Dev)
(1) (2) (3)
Household Size 5.13 0.015 0.014 0.019 (2.25) (0.003)*** (0.003)*** (0.004)***
Age Of The Household Head 44.4 0.002 0.002 0.001 (44.36) (0.000)*** (0.000)*** (0.000)**
Hh Head Is A Woman 0/1 -0.064 -0.063 -0.045 (0.021)*** (0.021)*** (0.021)**
Hh Head Is Literate 0/1 0.095 0.094 0.101 (0.021)*** (0.021)*** (0.021)***
Landholding (Ha) 1.35 0.043 0.056 0.051 (1.25) (0.006)*** (0.010)*** (0.001)***
(Landholding (Ha))2 -0.002 -0.001 (0.001)* (0.000)*
Ethnicity Dummies Yes Regional Fixed Effects Yes Number Of Observations 2,224 2,224 2,193 *** Significant at the 1 percent level, ** Significant at the 5 percent level. * Significant at the 10 percent level. Reported are marginal effects at the mean of the independent variable after Logit estimations. Standard errors in parenthesis. Source: ERSS (2005)
4 Land in Ethiopia is the property of the state and cannot be owned by individual farmers. Nevertheless, land is allocated to households for an undetermined period. Although land cannot be sold, it can be rented out and eventually passed on to heirs. The variable we use here as landholding is the amount of land allocated by the state to the household. It is considered as exogenous and does not capture land rented-in or rented-out by the farmer. For a detailed description of the Ethiopian land tenure system, see Gebreselassie (2006).
20
Scale economies vs. coordination costs. A fourth class of explanation for low participation emanates from
the cooperatives’ perspective. The overall low participation observed in Ethiopia may be driven by
cooperatives’ reluctance to include all potential members. Indeed, inclusive membership implies two
potentially opposing effects: Economies of scale in the collective marketing of surpluses or procurement
of inputs, and the offsetting increases in coordination costs that result from larger numbers of members.
This latter effect may be particularly important if increased membership goes along with increased
heterogeneity and divergent interests among members with respect to the cooperative’s operations.
An interesting angle on this issue is reflected in the experiences of the Maigebetta Irrigation Cooperative
in Ahiferom woreda, Tigray region. Like much of the Tigray region, Ahiferom woreda is a highland
region characterized by steep hillsides and valleys, short and variable rains, poor market and transport
infrastructure, and high population densities. Major crops cultivated in the woreda include teff, millet,
sorghum, barely, wheat, and beans, all of which are adapted to the woreda’s difficult agroecological
characteristics but of limited market value.
The Maigebetta Cooperative was established in 2002 with support from the cooperative promotion desk
of the woreda office of the Bureau of Agriculture and Rural Development for Tigray region. The effort to
establish the cooperative revolved around a pump irrigation scheme and smallholders residing in its
catchment area. The cooperative was supported by start-up capital of 109,457 Birr in cash, of which
30,000 Birr was provided by the woreda administration, 64,507 Birr from the woreda safety net
programs, and 14,950 Birr from the region’s cooperative promotion bureau. It also received a generator
from FARM Africa, an international NGO, to run a 46 hp water pump for its irrigation scheme. The
irrigation catchment area covers 20 hectares and provides sufficient water for the cultivation of chilis,
onions, and tomatoes, all of which are cash crops in local markets.
The cooperative is comprised of 25 members (23 men and 2 women), all of whom joined at inception.
The experiences gained from their initial forays into vegetable production have allowed them to move in
to year-round production, alongside new activities such as beekeeping and livestock fattening.
However, the cooperative is still contending with the near absence of linkages to support its operations
and expansion. First, the cooperative has difficulties in finding technicians (and spare parts) to keep the
pump and generator running. Second, it has experienced problems in finding transporters and market
21
traders for their surplus output are equally hard to come by. Geography explains part of this: Maigebetta
is 40 km from the nearest market town via a tertiary road.
The Maigebetta Cooperative is also noteworthy for its relatively unique agricultural marketing strategy
that somewhat illustrates the tradeoff between scale economies in the collective marketing of surpluses,
and the offsetting increases in coordination costs that result from large numbers of members. When
members first started producing vegetables, they realized that their surplus output consisted of just a few
semi-perishable crops (e.g., chilis, onions or tomatoes) that were ready for market all at the same time.
This tended to put them at a disadvantage when bargaining with traders, or tended to glut the thin local
markets. To address this situation, the cooperative now requires members to vary their production, e.g., if
several members cultivate tomatoes, others should cultivate onions, while others should cultivate chilis.
Instead of aggregating production to increase their bargaining power and reduce per unit transactions
costs, the cooperative has chosen the opposite strategy which, in the context of local markets, may be the
most rational and strategic option.
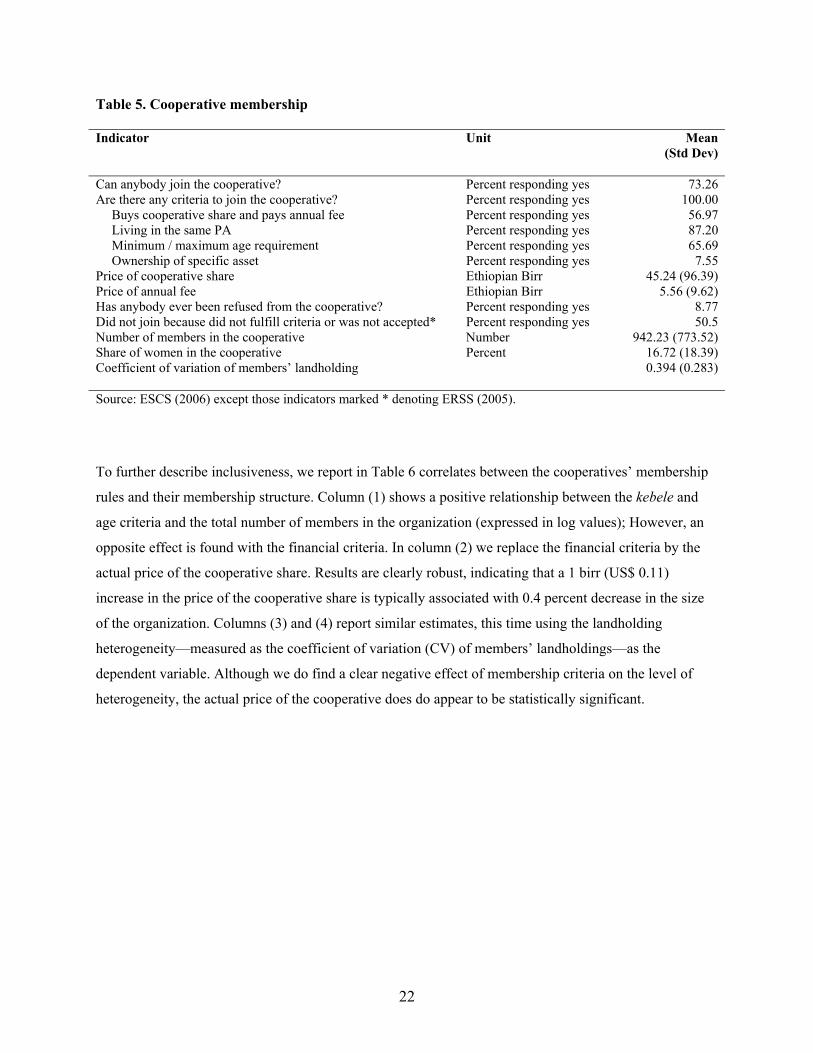
In Table 5, we report cooperative-level indicators of inclusiveness. We find that although the majority of
cooperatives declare that their membership is open to all individuals, all of them condition membership
on the fulfillment of particular criteria. For instance, 87 percent of the organizations only accept members
living within the same kebele, a criteria that may be interpreted as a means to reduce monitoring costs
among members. Surprisingly, asset ownership is not often cited as a primary criterion, possibly due to
the fact that these cooperatives are all mainly linked to agriculture and that most households control at
least a portion of land such that an asset criterion would not be binding in most cases. More constraining
however may be the request that all members buy a share of the cooperative, which costs an average of 45
birr (US$ 5.00) but can reach up to 1000 birr (US$ 111.00). Overall, although very few cooperatives had
officially refused membership to interested individuals, household-level data indicate that nearly 50
percent of non-members living in kebeles with such organization did not join because they could not
fulfill membership criteria that were, in most cases, of a financial nature.
22
Table 5. Cooperative membership Indicator Unit Mean
(Std Dev)
Can anybody join the cooperative? Percent responding yes 73.26 Are there any criteria to join the cooperative? Percent responding yes 100.00
Buys cooperative share and pays annual fee Percent responding yes 56.97 Living in the same PA Percent responding yes 87.20 Minimum / maximum age requirement Percent responding yes 65.69 Ownership of specific asset Percent responding yes 7.55
Price of cooperative share Ethiopian Birr 45.24 (96.39) Price of annual fee Ethiopian Birr 5.56 (9.62) Has anybody ever been refused from the cooperative? Percent responding yes 8.77 Did not join because did not fulfill criteria or was not accepted* Percent responding yes 50.5 Number of members in the cooperative Number 942.23 (773.52) Share of women in the cooperative Percent 16.72 (18.39) Coefficient of variation of members’ landholding
0.394 (0.283)
Source: ESCS (2006) except those indicators marked * denoting ERSS (2005).
To further describe inclusiveness, we report in Table 6 correlates between the cooperatives’ membership
rules and their membership structure. Column (1) shows a positive relationship between the kebele and
age criteria and the total number of members in the organization (expressed in log values); However, an
opposite effect is found with the financial criteria. In column (2) we replace the financial criteria by the
actual price of the cooperative share. Results are clearly robust, indicating that a 1 birr (US$ 0.11)
increase in the price of the cooperative share is typically associated with 0.4 percent decrease in the size
of the organization. Columns (3) and (4) report similar estimates, this time using the landholding
heterogeneity—measured as the coefficient of variation (CV) of members’ landholdings—as the
dependent variable. Although we do find a clear negative effect of membership criteria on the level of
heterogeneity, the actual price of the cooperative does do appear to be statistically significant.

23
Table 6. Membership criteria and actual membership
Dependent variable Total membership (log) heterogeneity (CV landholding)
(1) (2) (3) (4) PA criteria 0.477 0.287 0.018 0.027 (0.256)* (0.242) (0.066) (0.071) Age criteria 0.336 0.379 -0.043 -0.002 (0.200)* (0.175)** (0.052) (0.051) Asset criteria -0.305 -0.422 -0.032 -0.016 (0.345) (0.317) (0.089) (0.093) Financial criteria -0.482 -0.095 (0.176)*** (0.045)** Share price -0.004 0.0002 (0.001)*** (0.0002) Constant 6.040 6.136 0.462 0.364 (0.314)*** (0.263)*** (0.081)*** (0.077)*** Number of observations 171 165 171 169
*** significant at the 1 percent level, ** 5 percent level, and * 10 percent level. Least square coefficients reported with standard errors in parenthesis. Source: ESCS (2006)
In summary, the limited incidence of, and participation in, marketing cooperatives in Ethiopia can be
explained in part by a households’ choice not to join the organization, in part by the nature of the
cooperative’s inception and formation, and in part by a cooperative’s reluctance to open its membership
widely. In all cases, the mechanisms identified suggest that the poorest households may not participate in
such organizations, either because of the low returns they would derive from it, or because of the high
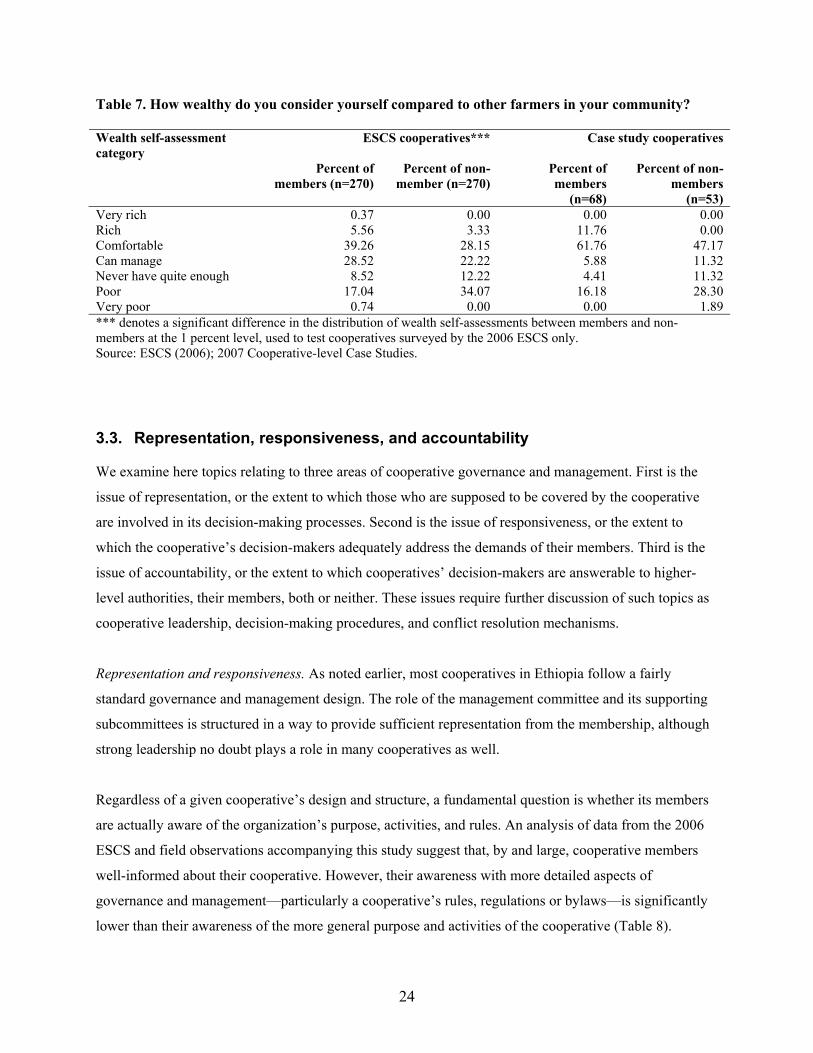
financial contribution required by the organization. Indeed, wealth self-assessments by cooperative
members and non-members support these finding (Table 7).
24
Table 7. How wealthy do you consider yourself compared to other farmers in your community?
ESCS cooperatives*** Case study cooperatives
Wealth self-assessment category Percent of
members (n=270) Percent of non-
member (n=270) Percent of members
(n=68)
Percent of non-members
(n=53) Very rich 0.37 0.00 0.00 0.00 Rich 5.56 3.33 11.76 0.00 Comfortable 39.26 28.15 61.76 47.17 Can manage 28.52 22.22 5.88 11.32 Never have quite enough 8.52 12.22 4.41 11.32 Poor 17.04 34.07 16.18 28.30 Very poor 0.74 0.00 0.00 1.89 *** denotes a significant difference in the distribution of wealth self-assessments between members and non-members at the 1 percent level, used to test cooperatives surveyed by the 2006 ESCS only. Source: ESCS (2006); 2007 Cooperative-level Case Studies.
3.3. Representation, responsiveness, and accountability
We examine here topics relating to three areas of cooperative governance and management. First is the
issue of representation, or the extent to which those who are supposed to be covered by the cooperative
are involved in its decision-making processes. Second is the issue of responsiveness, or the extent to
which the cooperative’s decision-makers adequately address the demands of their members. Third is the
issue of accountability, or the extent to which cooperatives’ decision-makers are answerable to higher-
level authorities, their members, both or neither. These issues require further discussion of such topics as
cooperative leadership, decision-making procedures, and conflict resolution mechanisms.
Representation and responsiveness. As noted earlier, most cooperatives in Ethiopia follow a fairly
standard governance and management design. The role of the management committee and its supporting
subcommittees is structured in a way to provide sufficient representation from the membership, although
strong leadership no doubt plays a role in many cooperatives as well.
Regardless of a given cooperative’s design and structure, a fundamental question is whether its members
are actually aware of the organization’s purpose, activities, and rules. An analysis of data from the 2006
ESCS and field observations accompanying this study suggest that, by and large, cooperative members
well-informed about their cooperative. However, their awareness with more detailed aspects of
governance and management—particularly a cooperative’s rules, regulations or bylaws—is significantly
lower than their awareness of the more general purpose and activities of the cooperative (Table 8).

25
Table 8. Cooperative members’ knowledge about their own cooperative Question: In your organization, are you aware of… Percent
responding (n=68)
Percent responding
“yes”
…the purpose of the organization? 99 95.52 …the activities of the organization? 97 93.94 …the rules, regulations, and/or bylaws of the organization? 97 53.03 …how decisions are made in the organization? 97 71.21 …how leaders are selected in the organization? 97 90.91 …how conflicts are resolved?
96 83.08
Do you feel that your cooperative is governed democratically?*
100 97.41
Source: 2007 Cooperative-level Case Studies, except * denoting ESCS (2006) (n=270)
A further issue is whether members actually participate in the governance and management activities of
their cooperative. Observations from the 2007 Cooperative-level Case Studies suggest that, in general,
most members participate in meetings on at least a monthly basis (Figure 4), although half identify
themselves as either not active or sometimes active in the cooperative (Figure 5).

26
Figure 4. How many meetings of the organization have you attended over the past one year? Source: 2007 Cooperative-level Case Studies (n=68)
0 5 10 15 20 25 30 35 40
0
1-10
11-20
21-30
>25M
eetin
gs a
ttend
ed
Percent
Figure 5. How active have you been in your cooperative over the past one year? Source: 2007 Cooperative-level Case Studies (n=58)
0 5 10 15 20 25 30
Not active
Sometimes active
Usually active
Highly active
Leve
l of a
ctiv
ity
Percent

27
Data from the 2006 ESCS provide some insight into how decisions are actually taken within marketing
cooperatives in Ethiopia. Overall, general assembly members tend to allocate technical decisions to the
cooperative leadership in the majority of the cases, while they tend to allocate general decisions to the
cooperative leadership in roughly half of the cases (Figure 6).
Figure 6. Distribution of cooperatives according to percentage of decisions taken by the general assembly
Source: ESCS (2006)
0
10
20
30
40
50
60
70
0% 10% 20% 30% 40% 50% 60% 70% 80% 90% 100%
All decisions General decisions only Technical decisions only
In summary, while evidence suggests that cooperative members are generally informed about the basic
structures and functions of their cooperatives, there is some variation in (a) the degree to which they are
aware of how decisions are made and (b) the degree to which they participate in different types of
decision-making functions within the cooperative.
Accountability. To better understand the issue of accountability, consider the Taramessa Multipurpose
Cooperative in Shebedino woreda of the SNNP regional state mentioned earlier. This cooperative is
considered to be one of several model coffee producers’ organizations in the Sidama Zone of SNNP,
home to Ethiopia’s reknowned high-quality export coffee. The cooperative comprises more than 2,000
members, is fully integrated into the coffee marketing chain, and receives support from the woreda office

28
of the regional Bureau of Agriculture and Rural Development, the Sidama Coffee Producers’ Cooperative
Union, several commercial interests that finance coffee production, and ACDI/VOCA for management
and leadership training (Figure 7).
Provision/financing of inputs
Provision of marketable outputs
Management and leadership training
Supervision and auditing
Coordination and cooperation
Legend
Figure 7. Taramessa Multipurpose Cooperative: Coffee production and marketing networks
Note: Arrowheads denote direction of materials or services provides (e.g., from node “a” to node “b”). BoARD denotes Bureau of Agriculture and Rural Development Source: 2007 Cooperative-level Case Studies

29
Internally, there has been much concern among the Taramessa Cooperative’s membership over the
accountability of its leadership. Members recognize that leadership is also a means of gaining personal
benefit—employment for relatives, access to the cooperatives resources, and social recognition and
stature. Thus, the local office of the Bureau of Agriculture and Rural Development has intervened on
several occasions to audit the cooperative and, where necessary, change the leadership. However, there is
little capacity among the members to directly hold their leadership accountable by investigating suspected
wrongdoing, enforcing rules and regulations, or even discussing these issues in open forums. These
problems have been compounded by occasional shocks such as the fall in international coffee prices
during the early 1990s, and a fraudulent check worth ETB 117,000 (approximately US$ 13,340) received
by the cooperative in exchange for its coffee—a transaction that nearly rendered the cooperative
insolvent.
Yet in spite of these problems, the cooperative has been performing over the last several years and,
importantly, has demonstrated its capacity to bounce back from various shocks. And in spite of the
governance issues, the cooperative has been able to expand its scope of activities in response to members’
interests and market signals over the past two to three years. Still, the Taramessa Cooperative illustrates
how even among the larger cooperatives engaged in lucrative markets for high-value crops, governance
and management issues can still be a persistent threat to their success.
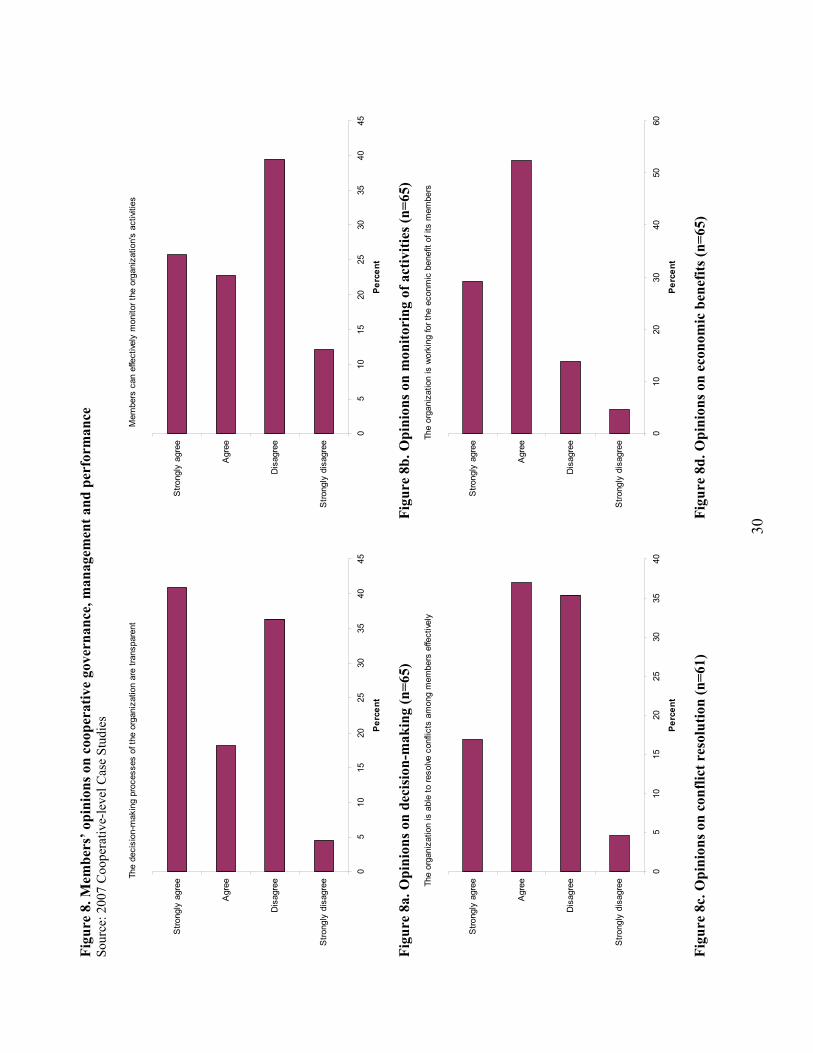
Responses from members polled in the 2007 Cooperative-level Case Studies tend to support the findings
from this example. Between 40 and 50 percent of these cooperative members did not agree with
affirmative statements about transparent decision making, effective activity monitoring, or effective
conflict resolution (Figure 8a-c). Interestingly, a much larger proportion of members (82 percent) agreed
that their organization was nonetheless working for the economic benefit of its members.
30
Figu
re 8
. Mem
bers
’ opi
nion
s on
coop
erat
ive
gove
rnan
ce, m
anag
emen
t and
per
form
ance
So
urce
: 200
7 C
oope
rativ
e-le
vel C
ase
Stud
ies
The
deci
sion
-mak
ing
proc
esse
s of
the
orga
niza
tion
are
trans
pare
nt
05
1015
2025
3035
4045
Stro
ngly
dis
agre
e
Dis
agre
e
Agr
ee
Stro
ngly
agr
ee
Perc
ent
Fi
gure
8a.
Opi
nion
s on
deci
sion
-mak
ing
(n=6
5)
Mem
bers
can
effe
ctive
ly m
onito
r the
org
aniz
atio
n's
activ
ities
05
1015
2025
3035
4045
Stro
ngly
dis
agre
e
Dis
agre
e
Agr
ee
Stro
ngly
agr
ee
Perc
ent
Fi
gure
8b.
Opi
nion
s on
mon
itori
ng o
f act
iviti
es (n
=65)
Th
e or
gani
zatio
n is
abl
e to
reso
lve c
onfli
cts
amon
g m
embe
rs e
ffect
ively
05
1015
2025
3035
40
Stro
ngly
dis
agre
e
Dis
agre
e
Agr
ee
Stro
ngly
agr
ee
Perc
ent
Fi
gure
8c.
Opi
nion
s on
conf
lict r
esol
utio
n (n
=61)
The
orga
niza
tion
is w
orki
ng fo
r the
eco
nmic
ben
efit
of it
s m
embe
rs
010
2030
4050
60
Stro
ngly
dis
agre
e
Dis
agre
e
Agr
ee
Stro
ngly
agr
ee
Perc
ent
Fi
gure
8d.
Opi
nion
s on
econ
omic
ben
efits
(n=6
5)

31
In summary, there is some evidence suggesting that cooperative have limited capacity to ensure
accountability, i.e., to ensure that no one person can use the cooperative to obtain power or resources over
another person. This is true even despite the fact that management committee members are thought to be
properly trained to carry out their leadership roles in an accountable manner. In general, field
observations suggest that cooperatives’ decision-makers are responsible and answerable to woreda-level
cooperative promotion offices far more than their own members.
3.4. Adaptability and adaptive capacity
We briefly address here the issue of adaptability, or the extent to which cooperatives are able to address
threats or opportunities in the external environment to the benefit of their members.
As suggested by several examples cited from the 2007 Cooperative-level case studies, many of the
successful marketing cooperatives in Ethiopia (e.g., the Woyo Seriti Gebreal, Leku and Taramessa
Cooperatives) have demonstrated their ability to leverage resources and expertise from other agricultural
sector actors to exploit new market opportunities. This includes local and international NGOs, private
companies involved in production and marketing, and cooperative unions that form umbrellas over these
cooperatives. However, in many of the cases cited here, it is often these other actors that motivate, design
and support the cooperative. A more grassroots but possibly less common means of promoting
cooperatives would require that smallholders (or activists within a smallholder community) organize
themselves and convey their interests and needs to these other actors. It may be that these two avenues of
cooperative formation result in qualitatively different outcomes in terms of governance, performance, and
impact on livelihoods. However, the data collected and analyzed for this study do not offer any immediate
conclusions on this.
Similarly, and as suggested by several of these same case study cooperatives, many successful marketing
cooperatives in Ethiopia have demonstrated their ability to respond to new market opportunities. For
example, the Kara Luku Multipurpose Farmers Cooperative in Goro Gutu woreda, Oromia region shifted
from chaat to haricot bean production and marketing organization, even despite the reknowned and
lucrative potential of chaat, because chaat market conditions were simply not in their favor. Their distance
from a main road, the high taxes imposed on their commodity, and the relatively better organizational
skills of chaat traders meant that chaat marketing margins were either too low or too variable to make the
crop a sustainable livelihood option. The entry of two international NGOs—Catholic Relief Services
32
(CRS), which provided training on cooperative management, and the Comitato Internationale per lo
Sviluppo dei Popoli (CISP), which provided a loan for the production and marketing of haricot beans—
allowed the Kara Luku Cooperative to diversify into new income-generating activities. Their ability to
adapt to new market opportunities and new actors in those markets allowed them to continue their
collective efforts and contribute to the improvement of livelihoods for their members.
A more topical issue relating to adaptability is the extent to which marketing cooperatives are able to
leverage similar resources and expertise to manage or mitigate the risks associated with increased risks
associated with climate change. At the level of the smallholder, climate change essentially means that
livelihoods based on crop production and marketing will be exposed to greater environmental risks.
Typical effects of climate change will be an increase frequency of extreme events, ranging from droughts
to floods, which either reduce yields and output, or make yields and output more variable.
At the level of agricultural markets, the occurrence of such events is likely to affect the market prices of
agricultural products. Because such events are likely to affect large geographical areas at once, mutual
insurance mechanisms sometimes offered by cooperatives—for example, where members contribute to
mitigating a negative income shocks experienced by a fellow member—will probably be of limited use in
the face of locally covariate risks.
Institutions such as cooperatives may nevertheless help mitigate the effects of these events through
several mechanisms. Increased access to adequate inputs (seeds, fertilizers and pesticides) may lower the
responsiveness of yields to environmental factors. Similarly, access to irrigation sometimes promoted by
these organizations may lower one’s exposure to such risks. From a market perspective, a cooperative
with enough capital liquidities will be able to store and exploit spatial and temporal arbitrage
opportunities to reduce the effect of environmentally driven price variability. Finally, cooperatives may
offer their members with opportunities for income diversification into non-farm activities, thereby
lowering the exposure of their income to agriculture related risks.
The 2007 Cooperative-level Case Studies attempted to obtain data on the capacity of cooperatives and
cooperative members to manage environmental shocks. Cooperative leaders and members were asked to
recall their experiences with events over the last 20 years such as floods, droughts, insect infestation, and
other climate-related events, as well as agricultural price collapses; and to discuss the extent to which the
cooperative played a role in coping or managing the impact of such events. Responses suggested that
cooperatives are neither designed nor placed strategically enough to play such a role, while other GoE
33
programs such as the Productive Safety Net Program are. Indeed, the GoE has accumulated extensive
experience in recent history addressing negative shocks in the agricultural sector and responses suggest
that cooperative members are often aware of these programs.
4. Performance, outcomes, and livelihoods This section examines the cooperative performance and the livelihood outcomes of cooperatives in
Ethiopia. While it is difficult to provide representative or conclusive analysis of the relationships between
cooperative membership and household welfare, this section examines the pathways through which such
outcomes might occur, and the extent to which cooperative members are either cognizant of such benefits
and pathways. To the extent possible, we frame this part of the study in terms of cooperative members’
own perspectives based on data collected from various sources.
We first examine the extent to which cooperative members are satisfied with the performance of their
cooperatives. Of the 270 cooperative members surveyed by the 2006 ESCS, 89.63 percent responded that
they were satisfied with the services provided to them by their cooperative; a slightly lower percentage
(71.21) offered a similar response in the 2007 Cooperative-level Case Studies. Thus, there seems to be a
basic level of satisfaction with marketing cooperative services, although this does not necessarily reflect
on which type of service the members are satisfied with, e.g., collective marketing, input supply, credit
provision, or other such services.
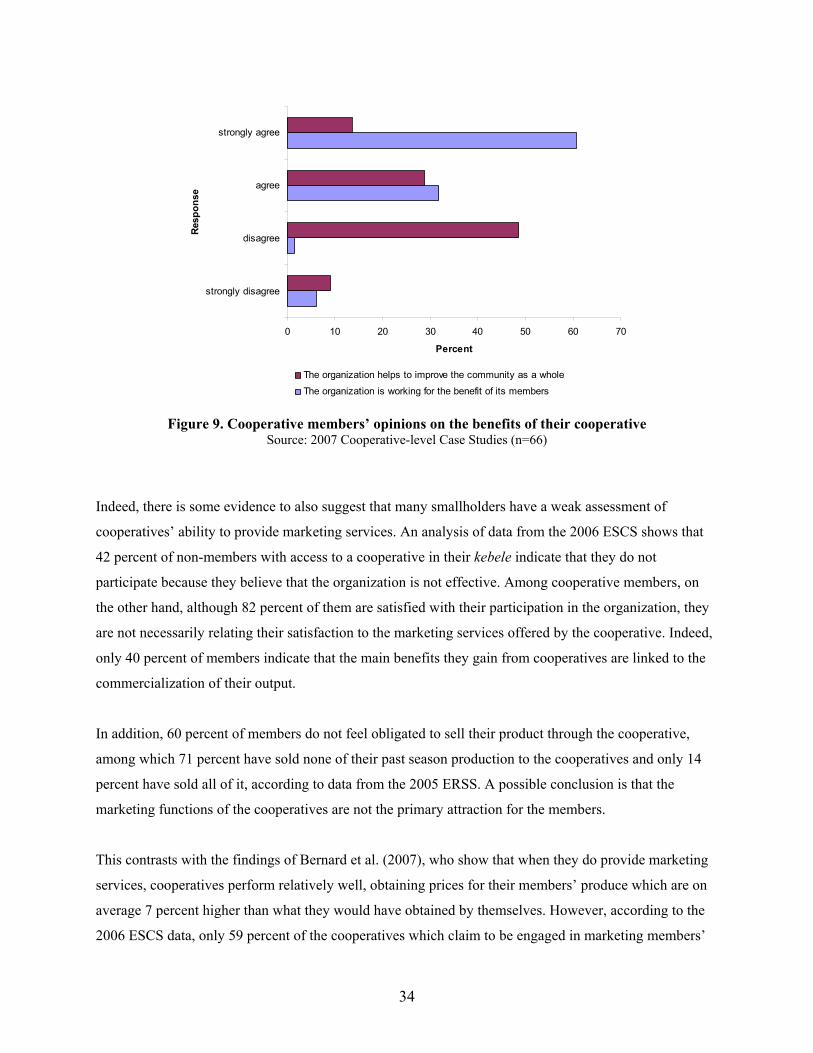
A more subjective set of questions asked in the 2007 Cooperative-level Case Studies suggests that
cooperative members recognize that the benefits of cooperatives accrue more to individual members than
to the wider community (Figure 9).
34
0 10 20 30 40 50 60 70
strongly disagree
disagree
agree
strongly agree
Resp
onse
Percent
The organization helps to improve the community as a whole
The organization is working for the benefit of its members
Figure 9. Cooperative members’ opinions on the benefits of their cooperative Source: 2007 Cooperative-level Case Studies (n=66)
Indeed, there is some evidence to also suggest that many smallholders have a weak assessment of
cooperatives’ ability to provide marketing services. An analysis of data from the 2006 ESCS shows that
42 percent of non-members with access to a cooperative in their kebele indicate that they do not
participate because they believe that the organization is not effective. Among cooperative members, on
the other hand, although 82 percent of them are satisfied with their participation in the organization, they
are not necessarily relating their satisfaction to the marketing services offered by the cooperative. Indeed,
only 40 percent of members indicate that the main benefits they gain from cooperatives are linked to the
commercialization of their output.
In addition, 60 percent of members do not feel obligated to sell their product through the cooperative,
among which 71 percent have sold none of their past season production to the cooperatives and only 14
percent have sold all of it, according to data from the 2005 ERSS. A possible conclusion is that the
marketing functions of the cooperatives are not the primary attraction for the members.
This contrasts with the findings of Bernard et al. (2007), who show that when they do provide marketing
services, cooperatives perform relatively well, obtaining prices for their members’ produce which are on
average 7 percent higher than what they would have obtained by themselves. However, according to the
2006 ESCS data, only 59 percent of the cooperatives which claim to be engaged in marketing members’
35
products had actually performed such activities over the year 2005. At the same time, most of them
claimed to be engaged in other types of activities, ranging from input provision (84 percent), credit (54
percent), agricultural extension (23 percent), price information (71 percent), processing of agricultural
products (19 percent), consumption services (62 percent), literacy trainings (12 percent), HIV/AIDS
prevention (23 percent), and provision of public infrastructures (15 percent).
Although it is clear that some of these services may be complementary to the commercialization activities
of cooperatives, others appear quite remote from it. Such is the case for social services such as
consumption, literacy trainings, HIV/AIDS prevention or public infrastructure. Overall, 74 percent of the
marketing cooperatives provide—or intend to provide—at least one such social service. Interestingly, the
average membership size in these organizations is nearly twice as large as in the more specialized
organizations. The average per-member landholding is, however, 25 percent larger in the more
specialized ones.
Consider the case of Thahetay Megare Tsemri Multipurpose Cooperative in Ahiferom woreda of the
Tigray regional state. The cooperative has diversified from a traditional role in supplying fertilizer and
seed to members for the production of teff and millet to a range of activities including collective
procurement and sale of household consumption goods, surplus output marketing, honey marketing, and a
water pump rental service. Of particular interest is that the cooperative has, with assistance from the local
office of the Bureau of Agriculture and Rural Development (BoARD), made an arrangement to sell its
well-known premium variety of honey to Dema PLC, a private honey processing and marketing interest.
And in spite of its success, the governance and management of the cooperatives remains organized along
lines similar to many cooperatives in the country: Decision-making and accountability systems are closely
tied to the BoARD rather than the membership, while day-to-day issues tend to be addressed through
informal interactions among the leaders, management committee and members. Note that voting is
conducted on a one-share-one-vote basis, where 40 of the 805 coop members hold 2 shares each while the
rest hold 1 each. There is no indication, however, that the larger shareholders gain any advantage over
others or hold any special position in the cooperative—although votes are cast on a one-vote-one-share
basis, there are rarely opportunities to vote e.g., for new leaders, since the leaders remain unchanged.
Rather, their advantage is only in receiving larger distribution of dividends in accordance with their
shareholding.
36
This illustration suggests that inclusive membership, democratic governance and cooperative performance
are not always clearly linked. Thus, we attempt here to relate various measures of inclusiveness with the
marketing performance of cooperatives using data from the ECS. Indeed, as inclusive as they may be,
Ethiopian cooperatives may have limited impact on poorer households unless they perform well. Less
than 60 percent of the cooperatives had sold—or helped sell—any of their members’ output in 2005,
despite having declared that marketing was their main purpose. We relate this apparent low performance
to cooperatives’ characteristics in Table 9 below.
Specifically, we investigate here the relationship between membership, governance and performance. The
reported results do not account for likely endogeneity biases and should therefore be interpreted only as
correlations. Nevertheless, they are useful in pinpointing eventual tradeoffs relevant for future, and more
robust, analysis. We use as a dependent variable an indication of performance—whether the organization
had sold any of its members’ output in 2005 and relate it to the cooperative’s characteristic through a
series of Logit estimations. Column (1) presents the basic marketing cooperative model, whereby
marketing is a function of the total product aggregation in the organization, proxied here by the log of the
total landholding of cooperative members. As expected, the obtained coefficient is largely positive and
statistically significant. Moreover, the parameter estimates of the log of total membership are negative in
the estimation, consistent with the idea that, for a given level of product aggregation, a larger organization
essentially means larger coordination costs which may impair the organization’s performance. Age of the
cooperative and an indicator of local market access are also introduced as controls, although they yield no
clear effect in the estimation.
In Column (2) we introduce an indicator of membership heterogeneity along with the other variables. The
previous results still hold, although the point estimates are somewhat smaller in magnitude. Surprisingly,
more heterogeneity seems to be linked to better performance, which goes against the idea of greater
heterogeneity leading to more coordination costs. One way to interpret this sign is that greater
heterogeneity may mean the cooperative being driven by a few much larger farmers who have an
incentive to ensure the organization’s success, as suggested by anecdotal evidence from our case studies.
All these results hold constant in Column (3) where we use the binary indicator defined above to control
for high versus low levels of participation, the effect of which cannot be distinguished from zero.
Finally, in column (4), we interact the level of participation with the variable for membership structure.
The level of participation remains insignificant, as does its interaction with the log of the total
membership. By contrast, we find a strong and negative effect of the interaction between the level of
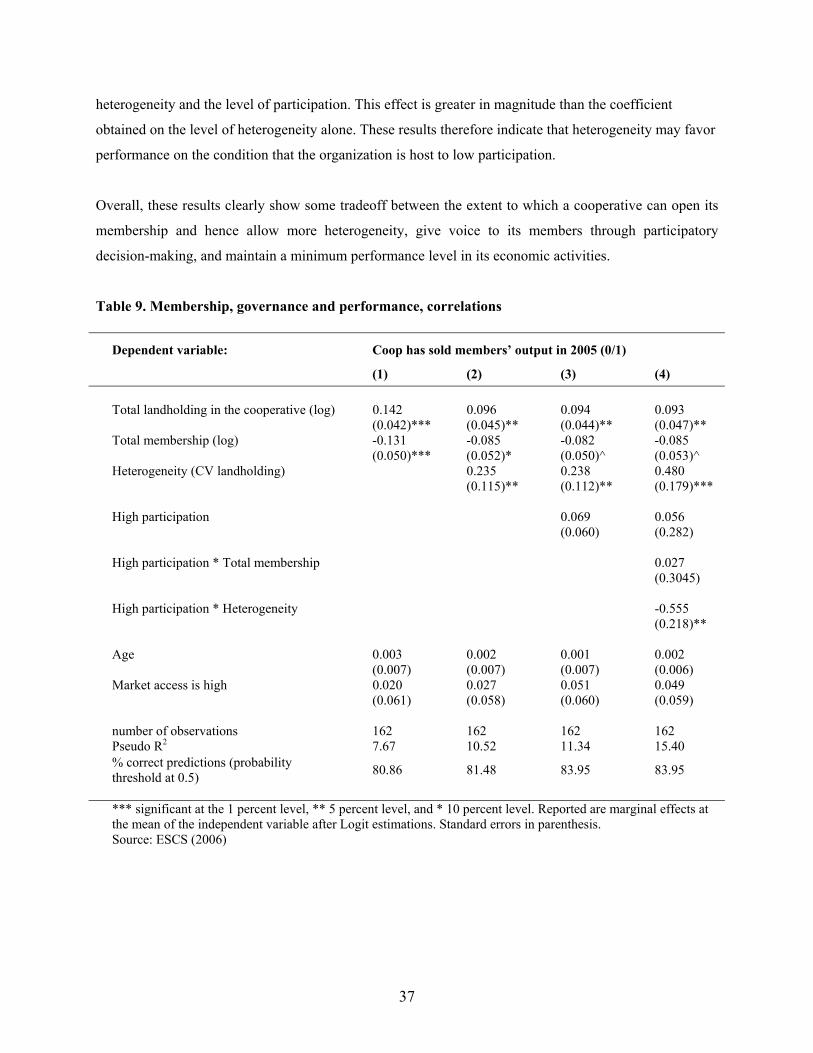
37
heterogeneity and the level of participation. This effect is greater in magnitude than the coefficient
obtained on the level of heterogeneity alone. These results therefore indicate that heterogeneity may favor
performance on the condition that the organization is host to low participation.
Overall, these results clearly show some tradeoff between the extent to which a cooperative can open its
membership and hence allow more heterogeneity, give voice to its members through participatory
decision-making, and maintain a minimum performance level in its economic activities.
Table 9. Membership, governance and performance, correlations
Dependent variable: Coop has sold members’ output in 2005 (0/1)
(1) (2) (3) (4) Total landholding in the cooperative (log) 0.142 0.096 0.094 0.093 (0.042)*** (0.045)** (0.044)** (0.047)** Total membership (log) -0.131 -0.085 -0.082 -0.085 (0.050)*** (0.052)* (0.050)^ (0.053)^ Heterogeneity (CV landholding) 0.235 0.238 0.480 (0.115)** (0.112)** (0.179)*** High participation 0.069 0.056 (0.060) (0.282) High participation * Total membership 0.027 (0.3045) High participation * Heterogeneity -0.555 (0.218)** Age 0.003 0.002 0.001 0.002 (0.007) (0.007) (0.007) (0.006) Market access is high 0.020 0.027 0.051 0.049 (0.061) (0.058) (0.060) (0.059) number of observations 162 162 162 162 Pseudo R2 7.67 10.52 11.34 15.40 % correct predictions (probability threshold at 0.5) 80.86 81.48 83.95 83.95
*** significant at the 1 percent level, ** 5 percent level, and * 10 percent level. Reported are marginal effects at the mean of the independent variable after Logit estimations. Standard errors in parenthesis. Source: ESCS (2006)

38
5. Conclusions and Recommendations This study provides a diagnostic of how smallholder cooperatives contribute to the improvement of rural
livelihoods in Ethiopia by linking farmers to markets. The study examines the history of cooperatives in
Ethiopia along with the social context and market environment in which they currently operate. The study
further examines key elements of their design and function—characteristics such as inclusion,
participation, representation, responsiveness, accountability, and adaptability—as well as variations in
design and function. Ultimately, the analytical insights from this study (and summarized below) are
intended to inform policymakers on options available to further strengthen smallholder cooperatives as a
part of Ethiopia’s wider strategy for agricultural development, economic growth, and poverty reduction.
It should be noted that this study is an analysis of a national cooperative promotion effort that is presently
at an interim phase of development. It should also be noted that this study attempts to provide analysis at
both the national and local levels using several different data sources designed for varying (and
sometimes divergent) objectives. Thus, the insights offered below should be viewed as tentative
conclusions and recommendations that, at most, are meant to allow for reflection and exploration of
innovative policy options and solutions.
The cooperative as a development partner. The evidence presented above illustrates how cooperatives
function within the wider landscape of organizations and institutions dedicated to improving the
economic and social welfare of smallholders and contributing more widely to agricultural development,
economic growth, and poverty reduction in Ethiopia. Cooperatives play an important role as interfaces
between farmers and the various woreda-level offices and services of the regional Bureaus of Agriculture
and Rural Development, local and international non-governmental organization, cooperative unions,
private agricultural and agroprocessing concerns, and private traders and brokers. They function as vital
conduits not only for marketable surpluses of agricultural commodities, but also for agricultural inputs,
credit technologies, organizational innovations, institutional innovations, and capacity strengthening. In
the absence of other grassroots organizations—or in the absence of willingness and ability to collaborate
with other organizations for whatever reasons—cooperatives are a useful means of meeting the GoE’s
goal of increasing smallholder production and commercialization. Thus, the evidence presented here
suggests that the cooperative is a relevant partner to the wider development community—both state and
non-state actors—in Ethiopia.
39
Recommendation. Policy initiatives at the federal, regional and woreda levels should continue to
encourage public officials—woreda administrators, BoARD officers, BoARD specialists, kebele
development agents and others—to take advantage of this rich institutional landscape to leverage
resources and expertise in support of cooperatives and the smallholders they represent.
The limits of inclusiveness. The evidence presented here also suggests that it is unlikely that
cooperatives will grow to be as inclusive as current GoE targets expect. Inclusiveness in cooperatives is
limited by several different factors including the history and legacy of cooperatives in previous regimes;
the current processes of cooperative conception and formation; the absence of sufficient economic
incentives and the “middle-class effect”; and the tradeoff between scale economies and coordination costs
in a cooperative. These factors may limit the GoE’s strategy to 2010 that envisions establish a
cooperative in each kebele, cooperative services to 70 percent of the population, marketing through
cooperatives of 60 percent of the country’s agricultural surplus, and provision of 90 percent of
agricultural inputs supplied.
At the same time, the evidence shown here that in spite of limited inclusiveness, some cooperatives are
still able to generate benefits for individuals and households that are not formally members in a marketing
cooperative. The spillover effect occur in a number of instances, for example, where the cooperative
supplies inputs (seed and fertilizer) to both members and non-members, or where non-members are able
to access services through a family member who is also a cooperative member. They are an unintended
consequence of cooperative design and implementation, and may contribute to improving rural
livelihoods in Ethiopia.
Recommendation. Policy initiatives should do more to (a) acknowledge, identify and leverage alternative
mechanisms that respond specifically to the needs of individuals, households and groups that are excluded
from cooperatives, and (b) recognize that the existence of spillover benefits from cooperatives means that
extensive membership in a given community may not be a necessary condition for improving livelihoods.
This first recommendation makes a strong case for continued investment in targeted interventions such as
the Productive Safety Net Program (PSNP), which could be developed further to recognize their
complementarities with cooperatives in Ethiopia. The second recommendation makes a case for
sustaining the commitment to establishment of cooperatives based on a non-compulsory membership as
set forth in revisions to the laws and regulations governing cooperatives in Ethiopia today.
40
The tradeoff between marketing and non-marketing activities. The evidence presented here suggests
a tradeoff between marketing-related activities undertaken by a cooperative and other non-production or
non-marketing activities. Cooperatives may be taking on responsibilities and activities beyond the scope
of either their mandate or capacity, potentially reducing their effectiveness is commercializing
smallholders’ surplus output. This, in turn, may negatively affect the livelihood outcomes expected from
marketing cooperatives in Ethiopia.
Recommendation. Careful consideration should be given to exactly what is expected from cooperatives,
and what their capacity is to manage a diversified activity portfolio. Too many activities that are too
heterogeneous in character could reduce a cooperative’s marketing performance and, in the long run, its
viability as an organization.
The governance challenge. Finally, the evidence presented here suggests that cooperative governance
and management systems and capacities are still under development. While many cooperative members
express some degree of satisfaction with the services provided by their cooperative, issues such as
participation, responsiveness, accountability and adaptability are often raised by members. Given the
checkered history of Ethiopia’s cooperatives and the large-scale initiative currently being pursued to
again promote cooperatives, it is likely that these governance and management issues will remain a
concern.
Recommendation. Efforts to replicate these successes would require greater investment in strengthening
the capacity of cooperatives to govern and manage themselves independently from the BoARD or other
external actors. Paradoxically, this will require new and innovation investments in developing the skills
and knowledge of BoARD officers, BoARD specialists, and development agents to convey governance
and management expertise to cooperative leaders and members. This includes investment and
improvement in the curriculum and teaching practices in Agricultural Technical, Vocational Educational
Training (ATVET) colleges, particularly with respect to topics such social mobilization, cooperative
management, cooperative accounting and bookkeeping and community conflict resolution.
In summary, this study recognizes the potential contribution of smallholder cooperatives to increasing
agricultural production and marketable surpluses in rural Ethiopia and, in the long run, contributing to
Ethiopia’s wider objectives of agricultural development, economic growth, and poverty reduction. A
range of additional and innovative policies and investments are needed to ensure that this contribution
ultimately play a part in meeting these goals.
41
6. References
Alemu, D., E. Gabre-Madhin, and S. Dejene. 2006a. From farmer to market and market to farmer: Characterizing smallholder commercialization in Ethiopia. Ethiopia Strategy Support Program (ESSP) working paper. Washington, D.C.: IFPRI.
Alemu, D., H. de Groote, and D. Bacha. 2006b. The role of market information system in improving rural livelihood and the status of the service in Ethiopia. Ethiopian Journal of Agricultural Economics 6(1): 87-108.
Attwood, D., and B. Baviskar. 1987. Why do some co-operatives work but not others? A comparative analysis of sugar co-operatives in India. Economic and Political Weekly 22(26): A38-45.
Berdegué, J. 2001. Cooperating to compete, associative peasant business firms in Chile. Ph.D. thesis, Wageningen University, Netherlands.
Bernard, T., E. Gabre-Madhin, and A. S. Taffesse. 2007a. Smallholders’ commercialization through cooperatives: A diagnostic for Ethiopia. IFPRI discussion paper no. 00722. Washington, D.C.: IFPRI.
Bernard, T., de Janvry, A., Sadoulet, E., 2006 When does community conservatism constrain village organizations? Mimeo. University of California, Berkeley.
Chen, M., R. Jhabvala, R. Kanbur, and C. Richards. 2006. Membership based organization of the poor: Concepts, experience and policy. In: M. Chen, R. Jhabvala, R. Kanbur and C. Richards (eds.), MBOP: Membership Based Organizations of the Poor. Forthcoming.
Chirwa E., Dorward, A., Kachule R., Kumwenda I., Kydd, J., Poole N., Poulton C., Stockbridge M. 2005. Walking tightropes: Supporting farmer organizations for market access. Natural Resource Perspectives No. 99. London: ODI
Collion, M-H., and P. Rondot. 1998. Background, discussions, and recommendations. In: P. Rondot and M-H. Collion, (eds.), Agricultural Producer Organizations, Their Contribution to Rural Capacity Building and Poverty Reduction. Washington, D.C.: World Bank.
CSA (Central Statistical Authority). 2003. Ethiopian Agricultural Sample Enumeration (2001/02 (1994 E.C.)) – Results at the Country Level. Addis Ababa: CSA.
CSA/EDRI/IFPRI (Central Statistical Agency/Ethiopian Development Research Institute/International Food Policy Research Institute). 2006. Atlas of the Ethiopian Rural Economy. Addis Ababa: IFPRI/CSA.
Damiani, O. 2000. The State and Nontraditional Agricultural exports in Latin America: Results and lessons of Three Case Studies. The Inter-American Development Bank, Washington, D.C.
De Janvry, A., M. Fafchamps, and E. Sadoulet. 1991. Peasant behavior with missing markets: Some paradoxes explained. Economic Journal 101: 1400-1417.
42
Dercon, S. 1995. On market integration and liberalization: method and application to Ethiopia. Journal of Development Studies. 32(1): 112-143
Dessalegn, G., T. Jayne and J. Shaffer. 1998. Market structure, conduct and performance: Constraints on performance of Ethiopian grain markets. Working Paper no. 8. Michigan State University Grain Market Research Project, Addis Ababa.
ERSS (Ethiopian Rural Smallholders Survey). 2005. Survey, data and related materials. Addis Ababa: IFPRI.
ESCS (Ethiopian Smallholder Cooperatives Survey). 2006. Survey, data and related materials. Addis Ababa: IFPRI.
Fafchamps, M. 2005. Market Institutions in sub-Saharan Africa. Cambridge: MIT Press.
FDRE (Federal Democratic Republic of Ethiopia). 2005. Ethiopia: Building on progress: A plan for accelerated and sustained development to end poverty. Addis Ababa: Ministry of Finance and Economic Development.
________. 2004. Proclamation No 402/2004 on Agricultural Cooperative Societies (Amendment). Published in the Federal Negarit Gazeta, ref . 402/2004.
________. 2002. Ethiopia: Sustainable Development and Poverty Reduction Program. Addis Ababa: Ministry of Finance and Economic Development.
________. 1998. Proclamation No 147/1998 to Provide For the Establishment of Cooperative Societies. Published in the Federal Negarit Gazeta, ref . 147/1998.
________. 1994. Proclamation No 85/1994 on Agricultural Cooperative Societies. Published in the Federal Negarit Gazeta, ref . 85/1994.
Gabre-Madhin, E.Z. 2001. Market Institutions, Transaction Costs, and Social Capital in the Ethiopian Grain Market. IFPRI Research Report No. 124. Washington, D.C.: IFPRI.
Gabre-Madhin, E.Z., W. Amha, E. Tafara, J. Schluter, T. Teshome, and G. Kilkile. 2003. Getting Markets
Right in Ethiopia: An Institutional and Legal Analysis of Grain and Coffee Marketing. International Fund for Agricultural Development (IFAD) project document. Washington, D.C.: IFPRI.
Gebreselassie, S. 2006. Land, land policy and smallholder agriculture in Ethiopia: Options and
scenarios, future agricultures. Ethiopian Economic Association, Addis Ababa.
Jayne, T., B. Zulu, and J. Nijhoff. 2006. Stabilizing food markets in Eastern and Southern Africa. Food Policy 31(4).
Key, N., E. Sadoulet, E. and A. de Janvry. 2000. Transaction costs and agricultural household supply response. American Journal of Agricultural Economics 82: 1273-1279.
43
NBE (National Bank of Ethiopia). Various years. National Bank of Ethiopia Annual and Quarterly Reports. Addis Ababa: NBE.
Negassa, A. and T. Jayne. 1997. The response of Ethiopian grain markets to liberalization. Working Paper No. 6. Grain Marketing Research Project, Addis Ababa, Ethiopia.
Neven, D., T. Reardon and R. Hopkins. 2005. Case studies of farmer linking to dynamic markets in Southern Africa: The Fort Hare Farmers Group. Michigan State University, Anne Arbor.
Rahmato, D. 2002. Civil society organizations in Ethiopia. In B. Zewde and S. Pausewang (eds.), Ethiopia: The Challenge of Democracy from Below, pp. 103-119. Stockholm and Addis Ababa: Nordiska Afrkainstitute and Forum for Social Studies.
Sharma, V.P. and A. Gulati. 2003. Trade liberalization, market reforms and competitiveness of India dairy sector. MTID Discussion Paper No. 61. Washington, D.C.: IFPRI
Tendler, J. 1983. What to think about cooperatives a guide from Bolivia. The Inter-American Foundation.
Timmer, C.O. 1997. Farmers and markets: The political economy of new paradigms. American Journal of Agricultural Economics 79: 621-627.
Uphoff, N. 1993. Grassroots organizations and NGOs in rural development: Opportunities with diminishing states and expanding markets. World Development 21(4): 607-22.
Weinberger, K., and J. Jutting. 2001. Determinants of participation in local development groups: Experiences from group based projects in Kashmir and Chad. Center for Development Research (ZEF). Bonn: University of Bonn.
World Bank. 2007. Community driven development. <http://web.worldbank.org/ WBSITE/EXTERNAL/TOPICS/EXTSOCIALDEVELOPMENT/EXTCDD/0,,contentMDK:20250804~menuPK:535770~pagePK:148956~piPK:216618~theSitePK:430161,00.html>, accessed October 25, 2007.
________. 2003. Reaching the rural poor, a renewed strategy for rural development. Washington, D.C.: World Bank.