Ethanol In the Motor Fuel Pool :Supply, Demand and Policy Considerations Larry Kumins Vice...
25
Ethanol In the Motor Fuel Pool :Supply, Demand and Policy Considerations Larry Kumins Vice President, Research and Analysis Energy Policy Research Foundation Inc. At Center For Energy Studies Louisiana State University April 27, 2007
-
Upload
miles-mckenzie -
Category
Documents
-
view
214 -
download
0
Transcript of Ethanol In the Motor Fuel Pool :Supply, Demand and Policy Considerations Larry Kumins Vice...

Ethanol In the Motor Fuel Pool :Supply, Demand and Policy Considerations
Larry KuminsVice President, Research and Analysis
Energy Policy Research Foundation Inc.At
Center For Energy StudiesLouisiana State University
April 27, 2007

2
Introduction
Energy Policy Research Foundation Inc. (EPRINC): successor organization to the Petroleum Industry Research Foundation Inc. (PIRINC) Founded in NY in 1944 Re-imagined in DC in 2007 as EPRINC EPRINC brings policy analysis and industry
economics to bear on current energy issues

3
Agenda
Part I: Ethanol Comes of Age—MTBE Replacement
Part II: Corn—Supply & Price Part III: Vehicle Fleet Constrains Ethanol
Consumption Part IV: Oil Refiners—Adversely Impacted? Part V: Energy Security/ Oil Imports

4
Part 1: Ethanol Comes of Age
5
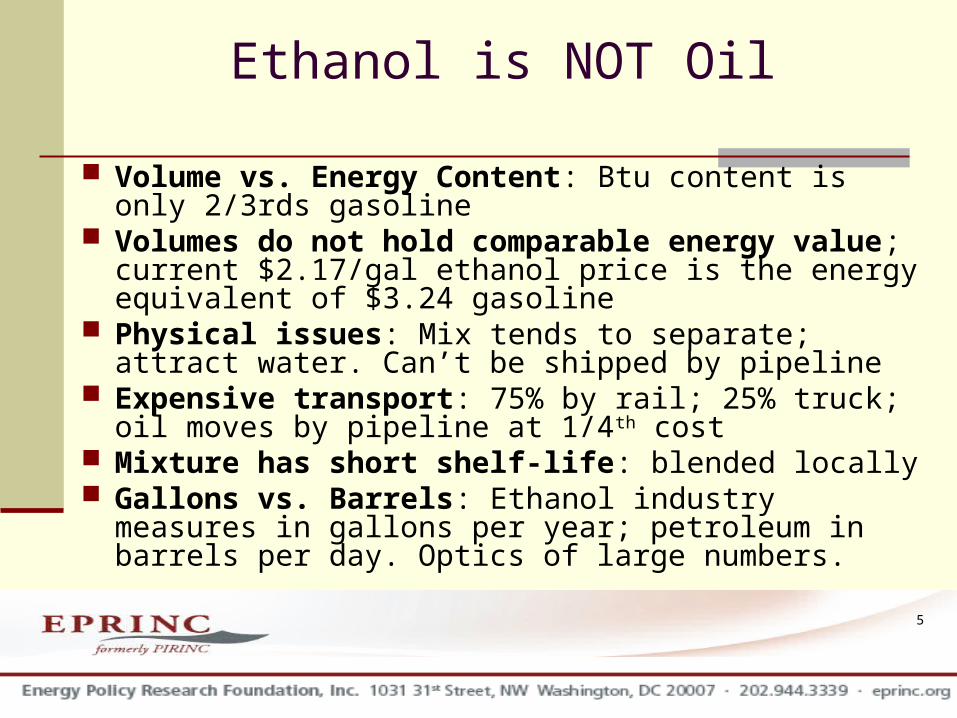
Ethanol is NOT Oil
Volume vs. Energy Content: Btu content is only 2/3rds gasoline
Volumes do not hold comparable energy value; current $2.17/gal ethanol price is the energy equivalent of $3.24 gasoline
Physical issues: Mix tends to separate; attract water. Can’t be shipped by pipeline
Expensive transport: 75% by rail; 25% truck; oil moves by pipeline at 1/4th cost
Mixture has short shelf-life: blended locally Gallons vs. Barrels: Ethanol industry measures in
gallons per year; petroleum in barrels per day. Optics of large numbers.

6
Some Background
Used as a high octane motor fuel since internal combustion invented
Energy Tax Act of ’78 started the federal tax exemption
4 cents/gal “gasohol”
American Jobs Creation Act of 2004—51 cents per gal for ethanol blended
EPAct 05 mandates—4.0 bil gals in 2006; 7.5 bil gal in 2012

7
Some Background(continued)
MTBE was a blending component of choice, adding oxygen content and boosting octane. Needed to make oxygenated gasoline.
MTBE Phase-out: In process since 2000 Consumption peaked at about 300,000 b/d Zeroed-out in 2006
Essential and complimentary to making gasoline
Max MTBE use: ~300,000 b/d
Now replaced with ~400,000 b/d ethanol

8
Ethanol and MTBE Consumption 2002-2006
0
50
100
150
200
250
300
350
400
2002 2003 2004 2005 2006
000/
b/d
EthanolMTBE

9
Ethanol Replaces MTBE - 2006
0
50
100
150
200
250
300
350
400
450
Jan
Feb
MarchApril
May
June Ju
lyAugSept Oc
tNov
Dec
EthanolMTBE
10
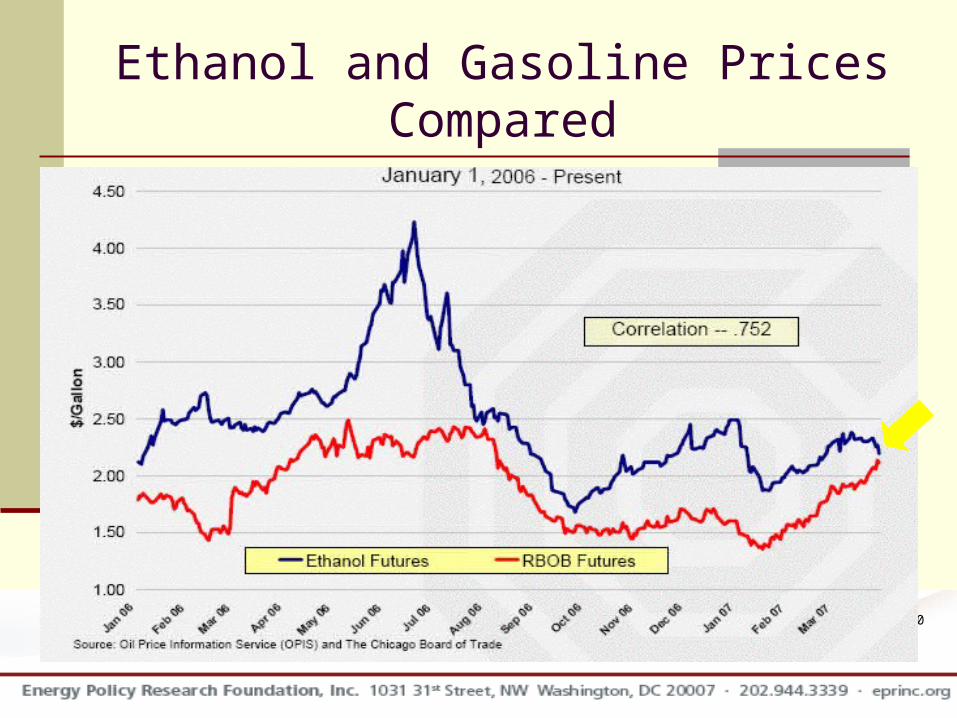
Ethanol and Gasoline Prices Compared

11
Price Update: Ethanol, Mogas, Corn
$2.08 $2.06$2.10
$2.16
$1.36$1.33
$0.00
$0.50
$1.00
$1.50
$2.00
$2.50
May-07 Jun-07
RBOBEthanolCorn
Note: Corn prices/2.8 = gallon equivalent price
Source: CBOT and NYMEX near-month futures contracts

12
Part II: Corn

13
Corn Ethanol Production 2007. . .expect to use 27% of ’07 corn crop for nearly 9 bil. gal.
0
1
2
3
4
5
6
7
8
9
10
Bil
lio
n g
allo
ns
0
5
10
15
20
25
30
Per
cen
t
Ethanol Share of Corn ProductionSource: Keith Collins, Chief Economist, USDA. Presentation at the EIA Outlook Conference 3/07

14
Corn Prices: 2005 - 2007
Apr
07
Source: USDA; CBCT

15
Farmers Respond to High Corn Prices - 2007
Record Corn Plantings - Highest Since 1944 Corn acreage increased 15%
Using land from: Cotton—acreage down 20% Soybeans—acreage down 11%
Price Implications Corn prices fell ~$0.50 per bu on report release.
Cotton and soybean prices will rise because of smaller plantings
Source: USDA, Prospective Plantings. Mar.2007

16
High Agricultural Product Prices
Between 2006 and 2007 Corn prices rose by $1.50 to $2.00
Record corn prices increased consumers food cost by an estimated $15 to $20 billion
Cotton and Soybean prices will rise as a result of acreage reallocation to corn
These higher prices will impact the rate of inflation, with adverse macroeconomic impact

17
Part III:
Vehicle Fleet Constrains Ethanol Consumption

18
Auto fleet designed to use 10% ethanol; it can’t use more Ethanol transport constraints prevent universal distribution
Not all gasoline blenders can get ethanol Less than 100% mogas can be E-10
If higher blends are to be consumed, more E-85 (FFVs) needed in fleet
E-85 vehicles have sold poorly: Out of 237 million vehicles on the road, only 6 million are FFVs Detroit makers pledged half 2012 output will be FFVs; foreign makers not
showing interest In 2017, 280 million vehicles on the road: How many will be FFVs?
Vehicle Fleet Will Slow Ethanol Uptake
Implication: if Detroit succeeds, only 25% of new vehicles sold will be FFVs

19
Recap: Role of Ethanol in the Gasoline Pool
% Ethanol
Billions Gallons/
Year
B/D (000)
Fundamental Factor Price Implication
~ %5 ~8 500Necessary- Complimentary—The current situation; replacing MTBE
Higher than Gasoline
5% - 8% ~12 750Enhancing Gasoline Performance and Increasing supply Volumes
Converging on Gasoline Price
10% ~15 1,000
Max % current vehicles can use
Limited by Distribution Infrastructure
Price Competition
among Ethanol Producers
Much greater
than 10%35 2,300
Exceeds likely Auto Fleet Capability
Market Oversupplied—Serious Price
Erosion

20
Part IV: Refiners

21
Investment: Ethanol Plant vs. Oil Refining
Refining---2003-2006 Refining capacity grew by 0.6 mbd Imports of refined oil product grew by 1.0 mbd U.S. refining capacity continues to lag consumption growth Results in very high refinery utilization w/o capability to deal with outages,
scheduled maintenance, etc. Current gasoline price situation--$2.15 in January; $2.85 in April due to refinery
outages
Ethanol Capacity Grew Rapidly 115 plants operating; 375,000 b/d capacity 86 plants under construction; 400,000 b/d capacity
Ethanol and oil compete for capital and for the same materials and services
Ethanol may be crowding out investment in petroleum refining
22
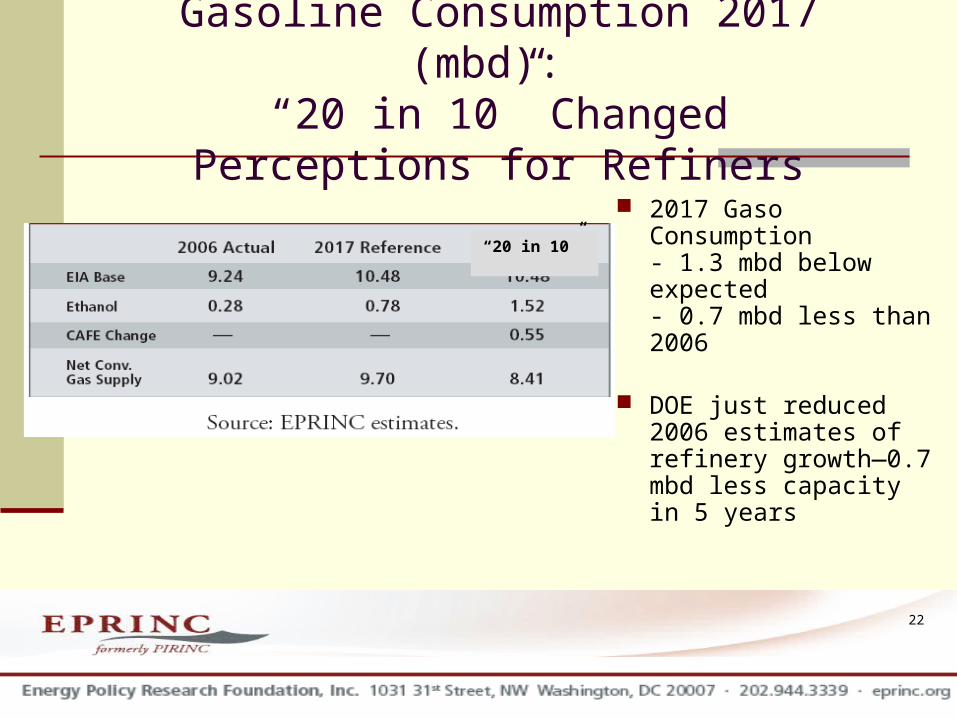
Gasoline Consumption 2017 (mbd):
“20 in 10” Changed Perceptions for Refiners
2017 Gaso Consumption- 1.3 mbd below expected- 0.7 mbd less than 2006
DOE just reduced 2006 estimates of refinery growth—0.7 mbd less capacity in 5 years
“20 in 10”

23
Part V: Energy Security/ Oil Imports
24
Ethanol Fuels Program Is Costly
$0.51 blender tax credit costs $3 bil per year at today’s rate of consumption. Costs rise as ethanol blending increases.
Because of lower energy value, a gallon of ethanol replaces 2/3rds of a gallon of imported gasoline. At $2.19 per gallon of ethanol, this is the equivalent of ~$3.25 for each
gallon of import saving. The tax credit adds to this.
Should the higher cost of corn to consumers be attributed to the reduction of oil imports?
Should costs arising from price increases in other crops resulting their displacement by corn acreage be attributed to oil import reduction?

25
Energy Security Goals: Minimizing Risk
Control Growth/Reduce Petroleum Imports Buffer Economy from Price Shocks Caused
By Adverse World Market Events Encourage U.S. Refinery Capacity Catch-up
With Consumption Reduce risk from refinery mishaps
BUT Depending on An Agricultural Commodity For Energy Supply Introduces New Risks Associated
with Crop Cycle