UNICA's Institutional Folder: Sugar, Ethanol, Bioelectricity & Beyond

i
Ethanol from Sugar Beets: A Process and Economic Analysis
A Major Qualifying Project Submitted to the faculty of
WORCESTER POLYTECHNIC INSTITUTE In partial fulfillment of the requirements
For the Degree of Bachelor of Science
Emily Bowen Sean C. Kennedy Kelsey Miranda
Submitted April 29th 2010
Report submitted to: Professor William M. Clark
Worcester Polytechnic Institute
This report represents the work of three WPI undergraduate students submitted to the faculty as evidence of completion of a degree requirement.
WPI routinely publishes these reports on its website without editorial or peer review.
ii
Acknowledgements
Our team would first like to thank Professor William Clark for advising and supporting our
project. We greatly appreciate the guidance, support, and help he provided us with
throughout the project.
We also want to thank the scientists and engineers at the USDA who provided us with the
SuperPro Designer file and report from their project “Modeling the Process and Costs of
Fuel Ethanol Production by the Corn Dry-Grind Process”. This information allowed us to
thoroughly explore the benefits and disadvantages of using sugar beets as opposed to corn
in the production of bioethanol.
We would like to thank the extractor vendor Braunschweigische Maschinenbauanstalt AG
(BMA) for providing us with an approximate extractor cost with which we were able to
compare data gained through our software.
Finally, we want to thank Worcester Polytechnic Institute for providing us with the
resources and software we needed to complete our project and for providing us with the
opportunity to participate in such a worthwhile and rewarding project.

iii
Abstract The aim of this project was to design a process for producing bioethanol from sugar beets
as a possible feedstock replacement for corn. Currently eighty-five percent of the energy
used by the United States comes from non-renewable fossil fuels, which contribute to global
climate change and are environmentally destructive (The Role of Renewable Energy
Consumption, 2007). The process of converting corn to bioethanol is very energy intensive,
as well as involving a staple food crop. Domestic sugar demand has decreased in recent
years, leaving space for the growth of sugar beets for other purposes (SIC 2063, 2005).
A process was designed and modeled using commercially available chemical engineering
design software and a cost analysis was performed. This process was compared to a
process designed by the USDA that modeled the production of bioethanol from corn.
Results showed that sugar beets are a superior feedstock for producing bioethanol
compared to corn. For the same amount of bioethanol, sugar beets require a smaller
acreage of land and fewer sugar beets, and potentially utilizes a more direct and
inexpensive process with a smaller environmental cost. We recommend that further
research into energy be conducted on the sugar beets to bioethanol process and that a
pilot-scale plant be built to pave the way for future developments in bioethanol production.

iv
Executive Summary
Fossil fuels are heavily relied on as a source of energy in the United States. Currently 85% of
the energy used by the United States is from fossil fuels. Fossil fuels create pollution when
they are burned, may contribute to climate change, and the supply of fossil fuels is limited
(The Role of Renewable Energy Consumption, 2007). As a result considerable research is
being done to find alternative fuels that can be used as a replacement for fossil fuels. Many
types of clean alternative energy are currently being researched, such as solar, wind, and
biofuels.
This project will focus on bioethanol as a promising alternative fuel. Bioethanol is made
from plant material that is broken down and fermented by yeast. In Brazil, bioethanol from
sugarcane is widely used as a fuel for automobiles. In fact, 45% of the fuel used for vehicles
in Brazil is bioethanol from sugarcane (Rohter, 2006). Brazil has shown that this is a
feasible and economical liquid fuel. However, due to the difference in climates, the United
States cannot grow sugarcane in sufficient quantities to produce ethanol. Instead the United
States currently uses corn as a feedstock for bioethanol production.
Corn is not an ideal feedstock for ethanol production. There are a number of reasons for
this, but the primary concern is the net energy value (NEV) of corn. A net energy value is
the ratio of the energy a fuel provides divided by energy required to produce that fuel. The
net energy value of corn is highly debated, and has been reported to range from 0.79 to 1.3
(Shapouri et all, 2002, Pimentel and Patzek, 2005). Even if the more optimistic estimates
are correct, 1.3 is a mediocre NEV at best. By comparison sugarcane has an NEV of at least
eight (Rohter, 2006).
As both feedstocks currently used for ethanol production have serious flaws, this project set
out to investigate another feedstock: sugar beets. Sugar beets contain sucrose that is used
to produce table sugar (Cattanach et all, 1991). Sugar beets can be grown over much of the
US (Jacobs, 2006), and could be converted to ethanol using a process similar to that used to
convert sugarcane to ethanol. The goal of this project was to design and perform a cost
analysis of a sugar beet to ethanol process using information known about the process to
convert sugar cane to ethanol and information known about the process to convert sugar
beets to sugar. This process was modeled using two commercially available Chemical
Engineering design software packages: Aspen Plus and SuperPro Designer.
The USDA performed a similar simulation using SuperPro Designer for a corn to ethanol
process. The file for this simulation was obtained, and compared to the sugar beet to
ethanol process that was designed. Equipment, feedstock, and utility costs for each

v
simulation were compared. The sugar beet to ethanol equipment cost was found to be
approximately $16 million while the corn to ethanol equipment cost approximately $18.5
million. Yearly utility costs were found to be approximately $23 million and $15 million for
beets and corn, respectively. Feedstock costs per gallon were found to be $1.76 for corn and
$1.66 for beets. Costs contributions associated with other process inlets, such as yeast,
lime, and solvents, were found to be $0.10 per gallon for corn and $0.07 per gallon for sugar
beets. The cost of utilities per gallon, such as cooling water, chilled water, and steam were
found to be $0.38 for corn and $0.57 for sugar beets. The total cost for producing one gallon
of ethanol from corn is $2.24, as opposed to $2.30 for sugar beets. This cost includes the
feedstock cost in addition to all process and utility costs. This does not take into account the
more expensive equipment costs for the corn to ethanol process, and may vary significantly
with fluctuating feedstock costs if the purchase price per kilogram of corn or beets
fluctuates. The utility cost was shown to be the deciding factor in cost analysis. The USDA
used a molecular sieve adsorption tower in their process to separate ethanol and water.
Using this separation mechanism would allow the utility costs to be significantly dropped
and cause ethanol from sugar beets to cost less per gallon than ethanol from corn.
It was also found that corn and sugar beets require approximately the same amount of
water and fertilizer per acre of land planted. However one acre of sugar beets will produce
about 1930 kg ethanol while one acre of corn will produce only 1000 kg. This means that
more energy from fossil fuels will be used to irrigate and fertilize corn per kg of ethanol
produced. Whether ethanol is being produced from corn or sugar beets there are some
unusable parts of the plant that are left over. In sugar beets the pulp and tops are a valuable
food for sheep, cows, and other livestock. In corn the stover (stalks, leaves, husks, and cobs)
are generally just tilled back into the earth (Kyle, 2010).
Overall sugar beets seem to be a very promising feedstock. However future research is still
needed to determine several key pieces of information about the sugar beet to ethanol
process. The NEV for sugar beets should be researched further; particularly the energy
used for the utilities in the sugar beet to ethanol process, and the energy used to grow the
sugar beets should be determined. Since the utility costs are the largest difference between
the corn and ethanol processes, alternative methods of separation should be researched to
lower utility costs in the sugar beets to ethanol process. If utility costs are lowered, the
sugar beets to ethanol process will likely become more economical than the corn to ethanol
process. Also lab scale followed by pilot scale version of this process should be assembled
to further test the process’ feasibility.
vi
Table of Contents
Acknowledgements __________________________________________________________ ii
Abstract ____________________________________________________________________ iii
Executive Summary __________________________________________________________ iv
Table of Contents ____________________________________________________________ vi
Table of Figures ____________________________________________________________ viii
Table of Tables ______________________________________________________________ ix
1. Introduction ______________________________________________________________ 1
2. Background _______________________________________________________________ 3
2.1 - Global Warming and the Need for Clean, Renewable Energy Sources _______________ 3
2.2 – Different Types of Non-Renewable Fossil Fuels _________________________________ 4
2.2.1 - Coal ______________________________________________________________________________ 5 2.2.2 - Petroleum and Natural Gas ___________________________________________________________ 6
2.3 – Different Types of Alternative Energy Sources __________________________________ 7
2.4 – Ethanol as a Biofuel for Renewable Energy _____________________________________ 9
2.5 – The Use of Food for Fuel _____________________________________________________ 10
2.6 – Alternative Sources for Ethanol Production ___________________________________ 11
2.7 – Sugar Beets as a Source of Ethanol ____________________________________________ 12
2.8 – Distillation Methods for Ethanol Production ___________________________________ 13
2.8.1 – Traditional Distillation _____________________________________________________________ 13 2.8.2 – Reactive Distillation ________________________________________________________________ 14 2.8.3 – Pressure-Swing Distillation _________________________________________________________ 15
2.8.4 – Extractive Distillation ______________________________________________________________ 16
2.8.5 – Molecular Sieve Adsorption Distillation _______________________________________________ 17 2.8.6 – Salt Separations ___________________________________________________________________ 17
2.9 – Computer Modeling and Assessment Programs for Chemical Processes ___________ 17
2.9.1 – Aspen Plus _______________________________________________________________________ 17 2.9.2 – SuperPro Designer _________________________________________________________________ 18
2.9.3 – SuperPro Designer Model Provided by the USDA _______________________________________ 18 2.9.4 – CAPCOST _________________________________________________________________________ 18
3. Methodology _____________________________________________________________ 20
3.1 – Pretreatment ______________________________________________________________ 20
3.1.1-Beet Slicing ________________________________________________________________________ 20
3.1.2– Sucrose Extraction _________________________________________________________________ 20 3.1.3 – Filtration _________________________________________________________________________ 21
3.2 – Fermentor and Centrifuge ___________________________________________________ 22
vii
3.2.1 Yeast and Conversion ________________________________________________________________ 22
3.2.2 Fermentor Design ___________________________________________________________________ 23
3.2.3 Centrifuge _________________________________________________________________________ 24
3.3 – Extractive Distillation _______________________________________________________ 24
4. Results and Discussion ____________________________________________________ 26
4.1 – Pretreatment ______________________________________________________________ 26
4.1.1 – Sucrose Extraction _________________________________________________________________ 26 4.1.2 – Filtration _________________________________________________________________________ 27
4.2 – Fermentation ______________________________________________________________ 29
4.2.1 Yeast, Conversion, and Fermentor Design _______________________________________________ 29
4.2.2 Centrifuge _________________________________________________________________________ 30
4.3 – Distillation _________________________________________________________________________ 30
4.3.1 Extractive Distillation ________________________________________________________________ 30 4.3.2 Optimization of distillation ___________________________________________________________ 32
4.4 – Comparisons of Feedstocks __________________________________________________ 33
4.4.1 Sugar Beets ________________________________________________________________________ 33
4.4.2 Sugar Cane _________________________________________________________________________ 34 4.4.3 Corn ______________________________________________________________________________ 34
4.4.4 Energy required for conversion _______________________________________________________ 36 4.4.5 Cost per gallon of ethanol ____________________________________________________________ 37
5. Conclusions ______________________________________________________________ 39
6. Recommendations ________________________________________________________ 41
7. References _______________________________________________________________ 43
8. Appendix A – Process Flow Diagram of Sugar Beets Process from AutoCad____________ A1
9. Appendix B – Process Flow Diagram of Sugar Beets Process from SuperPro Designer ___________________________________________________________________________________________________________ A2
10. Appendix C – Sugar Beets Material and Energy Balance from SuperPro Designer__ A3
11. Appendix D – Sugar Beets Economic Evaluation Report from SuperPro Designer A17
12. Appendix E – Sugar Beets Aspen Simulation Data _______________________________________ A38
13. Appendix F – Simplified Process Flow Diagram of Corn Process from “Modeling the Process and Costs of Fuel Ethanol Production by the Corn Dry-Grind Process (Kwiatkowski, 2006) _______________________________________________________________________________ A43
14. Appendix G – Corn Material and Energy Balance from SuperPro Designer (Kwiatkowski, 2006) _______________________________________________________________________________ A44
15. Appendix H - Corn Economic Evaluation Report from SuperPro Designer (Kwiatkowski, 2006) A78
16. Appendix I – Cost Analysis Calculations ___________________________________________________ A85

viii
Table of Figures
Figure 2.1: Consumption of Energy in United States in 2007 Broken Down by Source 5
Figure 2.2: Schematic of Traditional Distillation 14
Figure 2.3: Schematic of Pressure-Swing Distillation 15
Figure 2.4: Schematic of Extractive Distillation 16
Figure 3.1: Outline of Sugar Extraction and Press Water Production in a Sugar Beet Factory (Bogliolo et al.,
1996) 20
Figure 3.2: The Basic Steps for One Stage of the Filtration Process 222
Figure 3.3: Extractive Distillation Process 24
Figure 4.1: The Sucrose Extraction Section Modeled in SuperPro Designer 26
Figure 4.2: The Filtration Section Modeled in SuperPro Designer 27
Figure 4.3: Determination of the Optimal Reflux Point for Tower T-101 32
Figure 4.4: Determination of the Optimal Reflux Point for Tower T-102 333
ix
Table of Tables
Table 3.1: Composition of Raw Sugar Beet Juice (Ogbonna et al., 2001) 21 Table 41.: Summary of Streams Associated with the Sucrose Extraction Process 27 Table 42.: Summary of Streams Associated with Stage 1 in the Filtration Process 28 Table 4.3: Summary of Streams Associated with Stage 2 in the Filtration Process 28
Table 4.4: A Summary of Costs for the Filtration Section 29 Table 4.5: Stream Summary for the Fermentation Stage 29 Table 4.6: Stream Summary for Tower 1 and Thickener 30 Table 4.7: Stream Summary for Tower 2 30 Table 4.8: Stream Summary for Decanter and Flash Unit 31
Table 4.9: Separation Equipment Cost 32
Table 4.10: Optimization of Reflux Ratio 33 Table 4:11: Steam Usage in Corn to Ethanol Process 37
Table 4.12: Cost to Produce Ethanol on a Per Gallon Basis 37

1
1. Introduction Over the past decade, global climate change has turned from a heavily debated to widely
recognized and documented problem. Studies have shown that the rate of global warming
has risen to 0.2 ± 0.05 degrees centigrade per year (Hansen et al., 2006), a number which is
alarming due to the capacity of ecosystems to withstand changes in temperatures of within
2 – 4.5 degrees centigrade before becoming unstable (IPCC, 2007). Climate change is
intensified by the release of certain chemicals into the atmosphere, known as greenhouse
gases. These gases include carbon dioxide, methane, and nitrous oxide, and are produced in
high quantities by the burning of fossil fuels, such as coal and petroleum, fuels that are the
source of the majority of the world’s energy demand and are non-renewable relative to the
rate at which they are consumed. With the energy demand only growing higher, it is
imperative to develop clean, renewable sources of energy.
One source of renewable energy is bioethanol. Bioethanol is ethanol produced from
fermentation of sugars extracted from plant matter. In the United States, the most common
sources of bioethanol are corn or wheat (EPA, 2010), but it can also be produced using
sugar cane, or sugar beets. One problem with the current production of bioethanol in the
United States is that it relies heavily on staple food crops, such as corn and wheat, thus
creating a conflict between use as food versus fuel. Corn is also very energy-intensive to
convert into ethanol, producing roughly the same amount of energy as was necessary for
conversion, as opposed to crops such as sugarcane which produce six times more energy
than they require to process and convert their sugars to ethanol. Whereas the corn process
is fueled by fossil fuels, the leftover plant material from the sugar cane, known as bagasse,
can be dried and burned as fuel, cutting down on the majority of the process’ dependence
on fossil fuels.
Though sugar cane can’t be easily grown in the United States, sugar beets thrive in a wide
variety of climates, and can be grown from Texas to as far north as the Dakotas, including
places where other staple food crops can’t be easily grown. Sugar beets are a food crop, but
imported sugar and an increased reliance on corn syrup have decreased the demand for
domestic sugar in the United States, so basing the production of bioethanol on this crop
wouldn’t result in the conflict between food versus fuel. Though the leftover pulp from the
sugar beet process cannot be burned to recover fuel costs, it can be dried and fed to
livestock.
Currently, there are no plants in place producing bioethanol from sugar beets. A process
was developed for the extraction and conversion of ethanol from sugar beets, using as a
reference existing processes for producing sugar from sugar beets and ethanol from sugar
cane. Aspen Plus and SuperPro Designer, computer modeling software designed for
2
chemical processes, were used to simulate the process and develop a working model. The
cost of building and operating the sugar beet to ethanol plant was determined using
SuperPro Designer, CAPCOST, and commercial vendors. The process was then compared to
a process designed by the USDA for producing bioethanol from corn, which was detailed in
the report “Modeling the Process and Costs of Fuel Ethanol Production by the Corn Dry-
Grind Process” (Kwiatkowski et. al., 2006).
3
2. Background
2.1 - Global Warming and the Need for Clean, Renewable Energy Sources As the world enters the twenty-first century, global climate change has become a widely
recognized and heavily documented problem. Studies have shown that the current rate of
global warming has remained constant at 0.2 ± 0.05 degrees centigrade per decade since
approximately 1975, having increased from a slower but more fluctuating rate (Hansen et
al., 2006). This might seem like a relatively small change. However, recent studies
conducted by the International Panel for Climate Change (IPCC) have found that it is likely
that the earth’s climates and ecosystems can only withstand changes in temperatures of
within 2 – 4.5 degrees centigrade (IPCC, 2007).
Some climate change is natural, as the earth progresses through cycles of heating and
cooling. Changes in temperature of Pacific Ocean spanning 1.35 million years have been
estimated by a collaborative of the National Aeronautics and Space Administration,
Goddard Institute for Space Studies, the Columbia University Earth Institute, and the Sigma
Space Partners, Inc. Their research concludes that excluding human impact, the earth
would currently be entering a cooling phase, which it is not. This agrees with the Synthesis
Report generated in 2007 by the IPCC, which states that, considering only natural forces
such as solar energy, the world would currently be cooling, not warming.
Global warming is already having concrete impacts on the environment, as exemplified by
the melting of the permafrost along the coast of Alaska. As documented by the Alaska
Climate Research Center of the University of Fairbanks, temperatures in Alaska have risen
significantly since 1977, sometimes by as much as 1.9 degrees centigrade above the norm
(Temperature Change in Alaska, 2009). Many indigenous people living along the coast have
been forced to relocate as their towns and villages experience flooding, erosion, and the
loss of homes as the ground melts into the Ocean (Ansari, 2009). As global warming
continues, it could lead to further flooding and coastal erosion, as well as droughts, food
and water shortages, and salinated groundwater due to sea level rise (IPCC, 2007).
Humanity has exacerbated global warming. The IPCC concluded in their Synthesis Report
that it is very unlikely that global warming is due to natural causes alone (IPCC, 2007).
Using data from ice core samples, the IPCC showed how levels of various greenhouse gases
- carbon dioxide, methane, and nitrous oxide – have increased in the atmosphere over the
past 10,000 years. The levels of greenhouse gases began to rise steadily after the Industrial
Revolution in the mid 1700’s, with a steep increase in the mid to late 1900’s into the
present. This was a period of time in which the economies of the industrialized countries
were becoming increasingly dependent on fossil fuels such as coal and petroleum.
4
Over time, the energy demands of the world have grown as world populations increased
and more countries began industrializing, leading to increased amounts of greenhouse
gases being released. According to the U.S. Energy Information Administration, the global
energy demand in 2006 was 472 quadrillion Btu, and is expected to rise 44% by 2015
(International Energy Outlook 2009, 2009). 100 quadrillion Btu's of the global energy
demand were used in the United States (Guey-Lee, 2007).
With such a high demand for energy and the need to scale back on emissions of greenhouse
gases to slow further increases in global temperatures, it is highly important to research
and implement alternative forms of energy that do not rely on fossil fuels.
2.2 – Different Types of Non-Renewable Fossil Fuels Fossil fuels are formed when organic material is subjected to heat and pressure over
millions of years. Though all fossil fuels form and collect underground, the means through
which they are harvested and used vary.
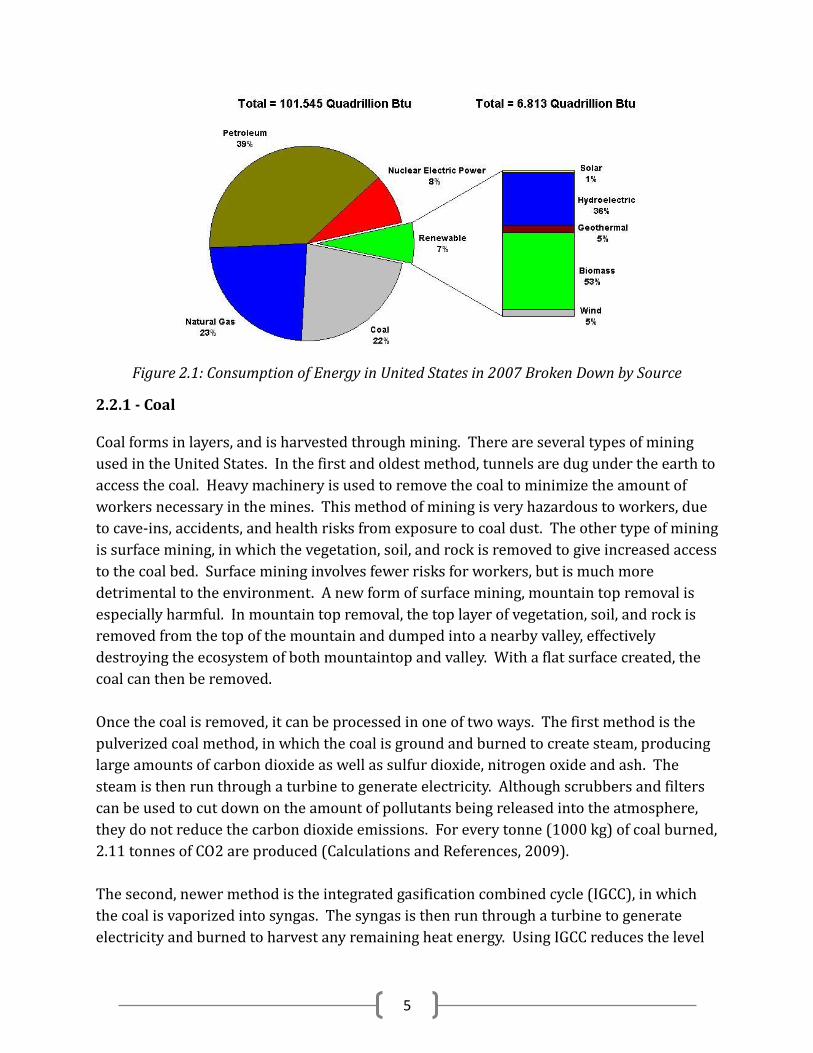
Figure 2.1 shows the relative consumption of coal, petroleum, and natural gas (methane),
compared with nuclear power and renewable energy sources such as solar and
hydroelectric (The Role of Renewable Energy Consumption, 2007). As can be seen, fossil
fuels still provide 84% of the energy consumed by the United States. Besides producing a
large amount of greenhouse gases, these energy sources are non-renewable and are being
consumed at an unsustainable rate. At the current rates of consumption, it is estimated
that the world’s supply of coal, petroleum, and natural gas will eventually be depleted,
though estimates on how soon this will be vary (IPCC, 2007).
5
Figure 2.1: Consumption of Energy in United States in 2007 Broken Down by Source
2.2.1 - Coal Coal forms in layers, and is harvested through mining. There are several types of mining
used in the United States. In the first and oldest method, tunnels are dug under the earth to
access the coal. Heavy machinery is used to remove the coal to minimize the amount of
workers necessary in the mines. This method of mining is very hazardous to workers, due
to cave-ins, accidents, and health risks from exposure to coal dust. The other type of mining
is surface mining, in which the vegetation, soil, and rock is removed to give increased access
to the coal bed. Surface mining involves fewer risks for workers, but is much more
detrimental to the environment. A new form of surface mining, mountain top removal is
especially harmful. In mountain top removal, the top layer of vegetation, soil, and rock is
removed from the top of the mountain and dumped into a nearby valley, effectively
destroying the ecosystem of both mountaintop and valley. With a flat surface created, the
coal can then be removed.
Once the coal is removed, it can be processed in one of two ways. The first method is the
pulverized coal method, in which the coal is ground and burned to create steam, producing
large amounts of carbon dioxide as well as sulfur dioxide, nitrogen oxide and ash. The
steam is then run through a turbine to generate electricity. Although scrubbers and filters
can be used to cut down on the amount of pollutants being released into the atmosphere,
they do not reduce the carbon dioxide emissions. For every tonne (1000 kg) of coal burned,
2.11 tonnes of CO2 are produced (Calculations and References, 2009).
The second, newer method is the integrated gasification combined cycle (IGCC), in which
the coal is vaporized into syngas. The syngas is then run through a turbine to generate
electricity and burned to harvest any remaining heat energy. Using IGCC reduces the level
6
of pollutants released to the environment, and allows easier capture of the carbon dioxide
gas.
Currently, coal still provides approximately 22 % of the total energy consumed in the
United States (The Role of Renewable Energy Consumption, 2007), though numbers are
declining slightly with the increased push toward renewable fuel sources. Although
sources vary on the exact number of years, studies have shown that at current consumption
rates, coal mines will be depleted in approximately 100 – 150 years.
2.2.2 - Petroleum and Natural Gas Petroleum and natural gas collect in permeable rock, such as sandstone, often beneath the
ocean floor. In order to harvest the petroleum, a well is drilled, after which the petroleum
and natural gas are pumped out of the earth. Until the mid 1900’s, the natural gas was
burned off before the petroleum was recovered, as the pipelines that existed were
inadequate to effectively transport natural gas.
The United States imports half of the petroleum it consumes, from Saudi Arabia, Mexico,
Canada, Venezuela, and other countries. One of the main environmental hazards of
petroleum is due to transportation. This includes both the transportation of the petroleum
from the well to refineries and its use as in fuel, such as gasoline in automobiles. The
combustion of oil releases nitrous oxides, carbon dioxide, carbon monoxide, sulfur oxides,
and other pollutants into the atmosphere. As a point of reference, combustion of oil
produces 3.16 tonnes of carbon dioxide per tonne of oil burned (Calculations and
References, 2009). Petroleum is burned in the form of gasoline in automobiles, and must
be shipped long distances to refineries in other countries. Ocean tanker accidents cause oil
spills in the oceans, which coat the surface of the ocean with a film of oil and kill marine
wildlife. A damaged ocean tanker can release enough oil to coat thousands of square miles
of ocean. According to the National Research Council, almost one billion gallons of oil per
year wind up in global waterways, only 13% of which is from tanker oil spills (How Oil
Works, 2009).
Currently, petroleum provides 39% of the energy consumed by the United States (The Role
of Renewable Energy Consumption, 2007). However, estimates show that globally there is
only a 60 to 70 year supply of petroleum. To a country that has built its economy upon
petroleum products and consumes over 25% of the world’s oil each year, this could be
extremely detrimental (How Oil Works, 2009).
7
Natural gas burns much cleaner than petroleum or coal. Natural gas produces very little
sulfur dioxide and no ash upon combustion. It produces 43% fewer carbon pollutants than
coal and 30% fewer than petroleum. However, it is a very strong greenhouse gas and still
produces nitrous oxide when combusted. Methane gas traps heat 58 times more efficiently
than carbon dioxide.
Currently, natural gas provides approximately 23% of the total energy consumed in the
United States (The Role of Renewable Energy Consumption, 2007). This number is likely to
increase as further developments in hydrogen fuel cells continue to be made, which utilizes
natural gas to fuel the production of electricity at a more efficient rate than normal
combustion. Estimates based on current technology show that natural gas reserves in the
United States alone should last at least sixty years, though this could triple given future
improvements in recovery.
2.3 – Different Types of Alternative Energy Sources There are many energy sources that are cleaner than fossil fuels, including nuclear electric,
solar, hydroelectric, geothermal, biofuels, and wind. Nuclear energy is produced by the
splitting of uranium ions through fusion to release energy which can be harnessed in the
production of steam. Out of all the other alternative energy sources discussed in this
section, nuclear energy is the only source that is not considered a renewable source. This is
because nuclear energy depends on the element uranium, which is not a renewable
resource.
In order to convert uranium to fuel, first it is mined and concentrated into uranium oxide
pellets to be transported to the nuclear power plant. Once in the nuclear power plant, the
uranium oxide pellets are pelted with neutrons to split them and release heat and neutrons,
which collide with other uranium oxide pellets to continue the reaction.
Nuclear energy is often considered “clean” because the reaction doesn’t produce many of
the common air pollutants, such as carbon dioxide, sulfur dioxide, and nitrous oxide.
However, the process of nuclear fission leaves behind a waste product composed of used
uranium fuel, which remains radioactive and very toxic for thousands of years after its
generation. At the moment, there is no permanent solution to the problem of what to do
with the waste, and it is being stored at the nuclear facilities in which they are generated,
though the U.S. Department of Energy wants to create a permanent nuclear waste disposal
center in the Yucca Mountains of Nevada.
8
Solar energy is a clean, renewable resource which can be harvested in a variety of ways,
whether through photovoltaic solar panels or solar thermal concentrators for the
production of electricity or desiccant coolers and absorption chillers. Federal tax incentives
are being offered to citizens who wish to implement solar energy to power their homes and
businesses and photovoltaic cells are decreasing in price, making them more affordable for
incorporation into homes. However, solar technology generally has a very low efficiency,
such as 15% for a photovoltaic cell.
Wind energy is a clean, renewable resource which is harvested by wind turbines, which
generate electricity in amounts proportional to the speed of the wind passing through the
turbine. One downside to wind energy is that the wind turbines must be built to match the
wind speed produced at the wind farm, which can vary seasonally or even daily. If the wind
blows too slowly, the turbine won’t work, but if the wind blows too fast, the turbine will
shut down to avoid being damaged. Hydroelectric energy is similar to wind energy in that
it takes advantage of the motion of a fluid to produce electricity.
Geothermal energy takes advantage of the heat produced by the earth. This can be done
either by heating homes using water from hot springs, or by pumping air into the ground to
be warmed (or cooled) and then pumping it back into the house to be used as a coolant or
to be further warmed in a heating system. The second system takes advantage of the fact
that the earth remains a constant 10 degrees centigrade a short depth below the ground.
Geothermal energy is most efficient in areas that experience temperature extremes, such as
the northern United States. However, geothermal technology can be difficult to install in
existing buildings. Solar, wind, and geothermal energies do not produce carbon dioxide or
other greenhouse gases.
Biological fuels consist of the oil from the fruit of plants such as soybeans, sunflowers, and
palms, as well as ethanol produced from the breakdown of cellulosic materials such as corn
stocks, sugarcane, or sugar beets. Although the burning of ethanol produces carbon
dioxide, a greenhouse gas, biofuels are considered a carbon neutral source. This is because
the carbon dioxide produced by the combustion of the ethanol is consumed by the plants
which produce the cellulosic materials from which the ethanol is fermented (Harrison,
2003). While the oils are similar to diesel fuel and can be burned in compatible engines,
fuel ethanol is often used as an additive to gasoline to cut down on harmful emissions and
will be the focus of the next section.

9
2.4 – Ethanol as a Biofuel for Renewable Energy Bioenergy is defined as any energy source that is derived from organic matter or biomass,
which can then be used to produce heat and electricity, or used for transportation (United
Nations, 2007). In particular, liquid biofuels such as ethanol, generally known as
bioethanol, and biodiesel are the main producers of bioenergy, especially in transportation
(United Nations, 2007). Ethanol used today in biofuels is typically made from fermenting
and then distilling starch crops, such as corn or wheat (EPA, 2010). Bioethanol can be
produced from any crop that produces fermentable sugars, which also includes sugar cane,
sugar beets, and unused portions of other crops such as fruit waste. However, the use of
these crops for ethanol threatens the use of land for food (United Nations, 2007). This
could potentially be resolved in the future, as ethanol can also be produced by cellulosic
biomass such as trees and grass (EPA, 2010), but lignin in their structures restricts access
to usable materials for producing ethanol (United Nations, 2007).
A common blend of ethanol sold that can be used to fuel most vehicles is E10, also known
as gasohol, which is a 10% mixture of ethanol in gasoline (EPA, 2010). A blend with a
higher concentration of ethanol which is used frequently is E85, an 85% mixture of ethanol
in gasoline. This mixture can only be used by flex-fuel vehicles (EPA, 2010). Flex-fuel
vehicles are capable of operating using any mixture of ethanol and gasoline (EPA, 2010),
not just E85, as anhydrous ethanol concentrations are capable of reaching closer to 100%
as a fuel where it is not mixed with gasoline.
One benefit from using a higher concentration of ethanol in gasoline is that it is cheaper.
For the year 2009, it was estimated that E85 cost on average $2.13/gallon, while regular
gasoline cost $2.67/gallon (EPA, 2010). A disadvantage to this comparison is that ethanol
has less energy than gasoline. E85 vehicles were estimated to get anywhere from 20-30%
worse mileage than comparable gasoline powered vehicles (EPA, 2010). This would mean
for a 30 MPG gasoline vehicle, a comparable flex-fuel vehicle running on E85 would get
anywhere from 21-24 MPG. In terms of cost per mile, the 30 MPG vehicle would cost
$0.089/mile and the comparable flex-fuel vehicle would cost anywhere from $0.089/mile
to $0.101/mile. While the average price is lower, the profitability of using ethanol as a fuel
is an issue that can be traced to the energy used to produce and distribute the ethanol from
its original source, which is currently starch crops (EPA, 2010).
The production of ethanol from a crop usually involves five basic steps: pretreatment of the
crops, sugar recovery, fermentation of the sugar to produce ethanol, distillation of the
ethanol to higher concentrations, and drying of the ethanol. Once a crop is grown and
harvested, it will need to be initially physically treated, such as being cleaned then sliced
into thinner pieces or ground into finer material. Sugars are then recovered by various

10
means from different crops, such as through the use of enzymes or simpler extraction
methods. These sugars are then fermented by yeasts to produce ethanol. The ethanol is
distilled through a series of columns to produce a higher concentration. However, the
separation of ethanol from water becomes more difficult as the ethanol concentration rises
due to azeotropic condition of the vapor-liquid equilibrium, limiting the distillation
potential. This ethanol is then dried further to increase the overall concentration without
being hindered by the vapor-liquid equilibrium.
2.5 – The Use of Food for Fuel Aside from the requirements to produce biofuels from crops, other disadvantages occur
during the decision making process on whether to use crops for bioethanol production.
Initially, from the farmer’s perspective, they have two options to choose from, either
continue growing crops for food or re-orient their production to cater to use in ethanol
production. Producing ethanol for a farmer could require funds for reconstruction and the
building of a new facility. The potential for returns may only be marginal. However, there
are subsidies that are available to help fund reorientation of farms toward producing crops
for bioethanol (United Nations, 2007).
The leading producers of ethanol as a biofuel are the United States and Brazil (United
Nations, 2007). Brazil has seen adequate success using sugar cane as a source for
bioethanol (United Nations, 2007), as their climate is conducive for its growth (United
Nations, 2007). The United States has more commonly used corn to produce bioethanol, as
it requires a more temperate climate that is available in North America (United Nations,
2007). The issue that derives from this is that a competition between using corn as food or
fuel has risen. Diverting land use from the production of food to the production of ethanol
has the potential to limit the availability of food supplies (United Nations, 2007), making it
a moral issue similar to the carbon emissions. The U.S. Food and Agricultural Organization
estimated approximately 854 million individuals worldwide are already suffering from
undernourishment (United Nations, 2007). An indicator of the limitation of the access of
food is the market price for a crop (United Nations, 2007). Since corn has been used for
ethanol production, the price for corn in the United States had approximately tripled from
its low point in 2005 to its highest point in 2008 (Corn: Monthly Price Chart). The debate
over food versus fuel pertaining to corn has resulted in a call for a more economically and
socially sustainable crop to be used in the ethanol production process.

11
2.6 – Alternative Sources for Ethanol Production Besides corn, there are a number of other options for plant material that can be used as a
source for biofuels. All plants have pros and cons; however some are much more viable
sources. An ideal plant would grow quickly, thrive in a broad range of environments, be
moderately pest resistant, produce a high amount of fuel per unit area of plant growth, and
the conversion of the plant material to a biofuel would be easy and low cost in both money
and energy. Although all of these factors have to be considered, the last two are the first
that need to be considered when determining the viability of a crop as a source of a
biofuels.
Plants that are grown as food sources are generally easier to convert into a useful liquid
biofuel. These plants contain more easily usable sugars or oils that can be fermented into
alcohols or used as biodiesel, respectively. Other plants that are not used as foods, such as
grasses, present the problem of being difficult to break down into a usable form. All plants
have an irregular polymer called lignin that helps provide structural strength and flexibility
in the cell walls. Lignin is very difficult to break down because of the irregularity of the
molecule. In plants such as sugarcane, the sugar (sucrose) can be washed away from the
fibrous lignin and then used to create useful biofuels. Similarly oil can be removed from
algae or soy beans. Research is currently being done by many institutions into ways to
break down lignin, but currently it is a huge hurdle for many potential energy crops. This
leaves crops that contain more easily usable sugars and oils. Corn or corn oil can be used,
however is does not provide very much energy compared to the energy needed to convert it
into ethanol or biodiesel.
Essentially any vegetable oil can be used for the production of biodiesel, including soybean
oil, rapeseed (canola) oil, olive oil, and sunflower oil among many others. These food
sources again raise the issue of using food crops for fuel. However when processing soy
beans, soy oil is produced as a byproduct. Although some soy oil is used for food,
production far outpaces demand which makes soy oil a good feedstock for production of
biodiesel. In 2008 approximately 60% of biodiesel produced in the US was from soy oil
(Weber, 2009). Additionally vegetable oil used by restaurants can be cleaned and converted
into biodiesel (Yokayo biofuels, 2005). Other non-food oils, notably oil from algae, are also
possible sources. Algae needs a significant amount of sunlight to grow, which is somewhat
limiting, but otherwise it is a very viable source. All biodiesel sources have issues of limited
source materials, although crop production could potentially be increased. Also more
restaurants could be made aware that their waste oil may be converted into biodiesel.
Crops used as a source of sugar for food can also be used for fermentation and conversion
to alcohols for fuels. The most widely used alcohol for this purpose is ethanol, although
12
butanol is also a potential alternative. Brazil uses significant amounts of ethanol as a liquid
fuel for cars. In 2005, all gasoline sold in the country was required to contain at least 26%
ethanol. Pure ethanol is also available widely for fuel in Brazil, and can be used by
consumers with ‘flex fuel’ cars. Flex fuel cars are specially designed to run on either
traditional gasoline or ethanol (Morgan, 2005). Sugar cane has a much higher energy
return compared to the energy put into the conversion than corn. Corn is close to 1:1,
although depending on the calculation it is both claimed to be somewhat higher and
somewhat lower. Sugar cane is about 8:1, which makes it a considerably better fuel source
as well as much more environmentally friendly (Rohter, 2006). While it takes a
considerable amount of fossil fuel to create ethanol from corn, the fibrous waste product
from sugar cane, called bagasse, can be burned to provide a large portion of the energy
needed for conversion. Unfortunately sugar cane can only be grown in very limited areas of
the southern United States, and even in those areas that it can be grown the growing
conditions are not ideal. However, another crop that could be grown in the United States
and potentially converted into biofuels is sugar beets.
2.7 – Sugar Beets as a Source of Ethanol Sugar beets can grow in much of US, and are produced primarily in the Dakotas and
Minnesota. Other states that produce large amounts of sugar beets are Idaho, California,
Michigan, Nebraska, Wyoming, Montana, Colorado and Texas. Sugar beets can grow in a
wide variety of soil types, from sandy to rich topsoil to clay rich soil (Cattanach et all, 1991).
Sugar beets could be grown over a large portion of the United States because they grow
well in a wide variety of climates. Sugar beets are used to produce sugar for food, beet
sugar accounted for 58.8% of the sugar produced in the United States in 2005 (Jacobs,
2006).
Less expensive imported sugar from both sugar beets and sugar cane has decreased the
selling price of sugar in the United States, and has decreased overall sugar production., The
average American’s yearly sugar intake has fallen from 102 lbs/yr in 1970 to 45 lbs/yr in
2002 (SIC 2063, 2005). The reason for this drastic drop is that corn syrup has taken over a
significant amount of the market sugar once had:
… corn sweeteners—corn syrup, dextrose, and high fructose corn syrup (HFCS)—
accounted for more than 55 percent of U.S. sweetener consumption in the early
2000s, according to the Corn Refiners Association. In 2003, an estimated 535 million
bushels of corn were used to make HFCS, which since 1980 has been the sweetener
of choice for the major U.S. soft drink manufacturers. (SIC 2046, 2005)
13
An increase in demand for sugar to be fermented to create ethanol might help increase
market prices by increasing demand for sugar. Because sugar beets can be grown over so
much of the US, the demand for more beet sugar could be met by expanding the amount of
land they are grown over.
Sugar beets take more energy to produce sugar from than sugar cane, because unlike sugar
cane sugar beets do not have a byproduct like bagasse that can be burned for energy.
However, sugar beets do have other byproducts that are used as animal feed. Both the tops
of sugar beets and the pulp left after sugar is extracted from the beets are used as feed for
cows and sheep. Molasses from sugar beets is also used as an additive to feed. Molasses
from sugar beets does not have the same taste as molasses from sugar cane and is not
generally consumed by humans. An average of 13 to 25 tons of sugar beets can be grown
per acre of un-irrigated farm land. Irrigation increases yield by 15 to 30 percent (Cattanach
et all, 1991).
It is relatively easy to extract sugar from sugar beets. The beets are chopped into thin chips
called cossettes and washed in a counter current flow with water. The washed cossettes are
pressed to remove remaining water and sugar. The sucrose rich water is then cleaned of
impurities with lime and filtration and separated by drying and crystallization (Process
description, 2000). If the sugar from beets was used to create ethanol instead of sugar, the
cleaned sucrose rich water could be put through a fermentation step instead of drying and
crystallization. The current sugar extraction process could be duplicated exactly up until
this point. The sucrose water mixture might have to be diluted or concentrated to be a
more ideal food for the yeast that would be used to ferment it. Next a separation step to
recover ethanol, most likely by distillation, would finish the process of creating ethanol
from sugar beets.
2.8 – Distillation Methods for Ethanol Production
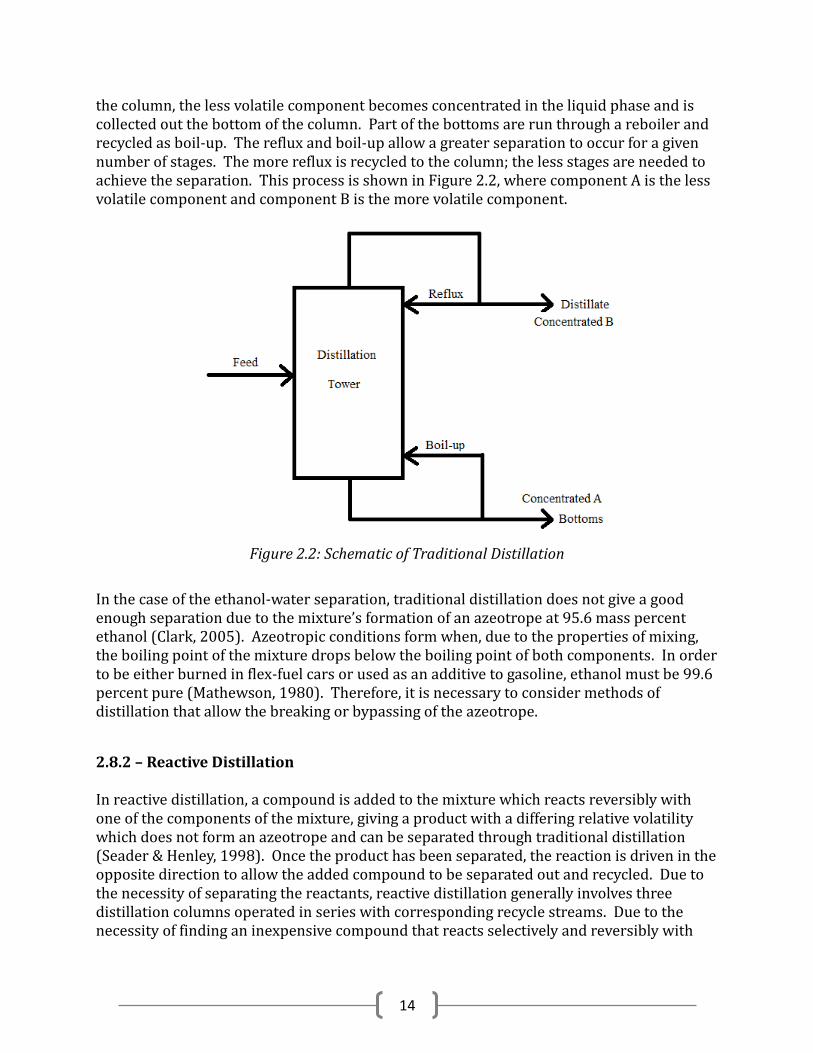
2.8.1 – Traditional Distillation In order to purify the ethanol to be used as fuel, distillation is often used. Distillation is the separation of two or more compounds based on their relative volatilities (Wankat, 2006). In traditional distillation, the mixture is fed into a distillation column and heated, causing part of the feed to vaporize. The column is packed with stages which allow vapor to pass up the column and liquid to travel downward. Ideally, at each stage the vapor passing up the column and liquid flowing down are achieving equilibrium. As the mixture progresses up the column, the more volatile component becomes concentrated in the vapor phase and is collected out the top of the column as distillate. The distillate is often condensed, and part of the distillate is recycled back into the tower as reflux. As the mixture progresses down
14
the column, the less volatile component becomes concentrated in the liquid phase and is collected out the bottom of the column. Part of the bottoms are run through a reboiler and recycled as boil-up. The reflux and boil-up allow a greater separation to occur for a given number of stages. The more reflux is recycled to the column; the less stages are needed to achieve the separation. This process is shown in Figure 2.2, where component A is the less volatile component and component B is the more volatile component.
Figure 2.2: Schematic of Traditional Distillation
In the case of the ethanol-water separation, traditional distillation does not give a good enough separation due to the mixture’s formation of an azeotrope at 95.6 mass percent ethanol (Clark, 2005). Azeotropic conditions form when, due to the properties of mixing, the boiling point of the mixture drops below the boiling point of both components. In order to be either burned in flex-fuel cars or used as an additive to gasoline, ethanol must be 99.6 percent pure (Mathewson, 1980). Therefore, it is necessary to consider methods of distillation that allow the breaking or bypassing of the azeotrope.
2.8.2 – Reactive Distillation In reactive distillation, a compound is added to the mixture which reacts reversibly with one of the components of the mixture, giving a product with a differing relative volatility which does not form an azeotrope and can be separated through traditional distillation (Seader & Henley, 1998). Once the product has been separated, the reaction is driven in the opposite direction to allow the added compound to be separated out and recycled. Due to the necessity of separating the reactants, reactive distillation generally involves three distillation columns operated in series with corresponding recycle streams. Due to the necessity of finding an inexpensive compound that reacts selectively and reversibly with

15
water and the presence of other, more feasible, methods of separation, reactive distillation is not used to separate ethanol and water.
2.8.3 – Pressure-Swing Distillation The composition at which an azeotrope forms generally changes depending upon the pressure under which the system is operated. Pressure-swing distillation takes advantage of this change (Seader & Henley, 1998). Often utilizing a two-column system, the feed goes to a distillation tower at a higher or lower pressure than atmospheric, allowing the mixture to “jump” the azeotrope. The less volatile component leaves the bottoms as a nearly pure liquid. The distillate from the tower with a composition close to azeotropic for the operating pressure is then fed to a second column at a different pressure, generally atmospheric, which gives an azeotropic distillate stream of the less volatile component and a pure bottoms stream of the more volatile component. The distillate from the second tower is recycled back to the first column. This process is shown in Figure 2.3, where component A is the less volatile component and component B is the more volatile component.
Figure 2.3: Schematic of Pressure-Swing Distillation
Though the azeotrope formed by a mixture of ethanol and water does change over different pressures, it is only changing by a few percentage points. Therefore, although the separation can be completed, it is very expensive. It generally requires very large distillation towers using materials and designs which can withstand conditions of high
16
pressure or vacuum, and a large number of equilibrium stages to complete separations near azeotropic conditions. Due to these reasons, pressure-swing distillation is not the most common method of dehydrating ethanol.
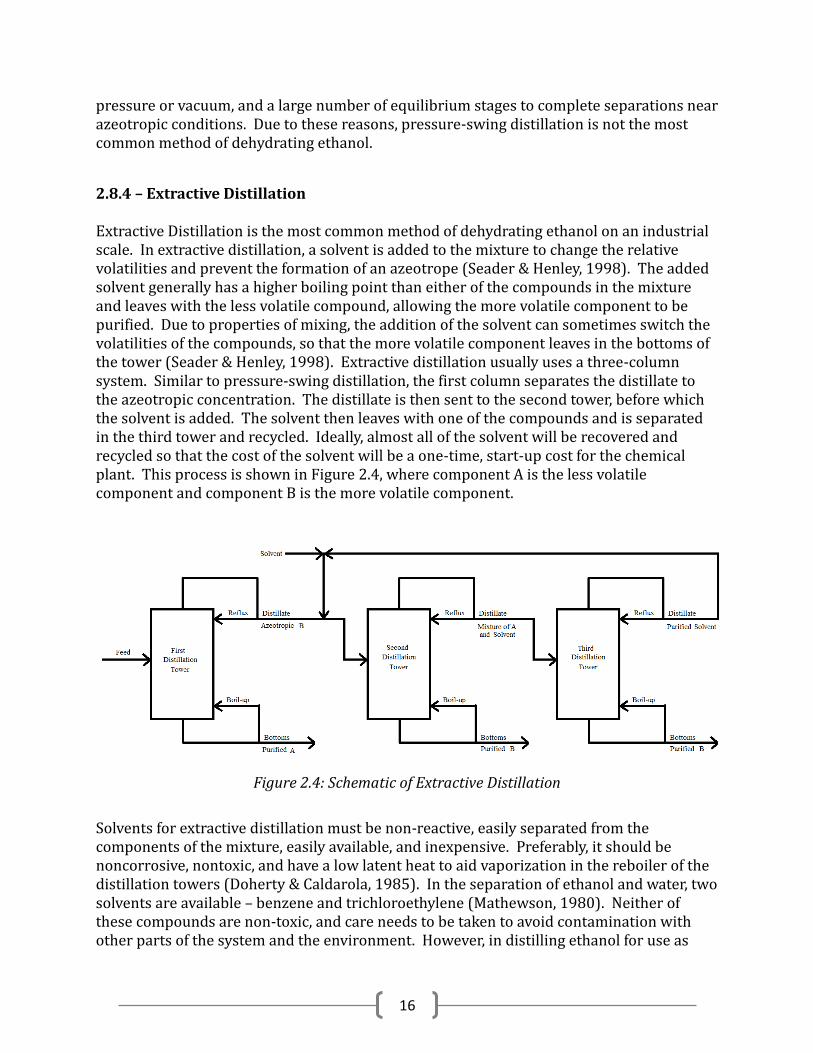
2.8.4 – Extractive Distillation Extractive Distillation is the most common method of dehydrating ethanol on an industrial scale. In extractive distillation, a solvent is added to the mixture to change the relative volatilities and prevent the formation of an azeotrope (Seader & Henley, 1998). The added solvent generally has a higher boiling point than either of the compounds in the mixture and leaves with the less volatile compound, allowing the more volatile component to be purified. Due to properties of mixing, the addition of the solvent can sometimes switch the volatilities of the compounds, so that the more volatile component leaves in the bottoms of the tower (Seader & Henley, 1998). Extractive distillation usually uses a three-column system. Similar to pressure-swing distillation, the first column separates the distillate to the azeotropic concentration. The distillate is then sent to the second tower, before which the solvent is added. The solvent then leaves with one of the compounds and is separated in the third tower and recycled. Ideally, almost all of the solvent will be recovered and recycled so that the cost of the solvent will be a one-time, start-up cost for the chemical plant. This process is shown in Figure 2.4, where component A is the less volatile component and component B is the more volatile component.
Figure 2.4: Schematic of Extractive Distillation
Solvents for extractive distillation must be non-reactive, easily separated from the components of the mixture, easily available, and inexpensive. Preferably, it should be noncorrosive, nontoxic, and have a low latent heat to aid vaporization in the reboiler of the distillation towers (Doherty & Caldarola, 1985). In the separation of ethanol and water, two solvents are available – benzene and trichloroethylene (Mathewson, 1980). Neither of these compounds are non-toxic, and care needs to be taken to avoid contamination with other parts of the system and the environment. However, in distilling ethanol for use as
17
fuel, the alcohol needs to be denatured to prevent human consumption, so leaving trace amounts of the solvent in the anhydrous ethanol is not an issue.
2.8.5 – Molecular Sieve Adsorption Distillation
A different method utilized in the model designed by the USDA in “Modeling the Process and Costs of Fuel Ethanol Production by the Corn Dry-Grind Process” is molecular sieve adsorption distillation. This method utilizes a column packed with microporous beads. As the ethanol-water mixture flow through the beads, the smaller water molecules are trapped inside, while the larger ethanol molecules are able to flow by unimpeded. This allows the collection of nearly pure (99.6 mass percent) ethanol. The beads can then be heated to drive off the water and reused (Kwiatkowski, 2007). This process is described further in section 2.9.3.
2.8.6 – Salt Separations
Another method of separating ethanol from water is drying with salts. In this method, first distillation is used to bring the ethanol to the azeotropic concentration. To separate the mixture past the azeotrope, the ethanol-water mixture is filtered through dry salt. Since salt will absorb water, but not ethanol, nearly pure ethanol can be collected. The wet salt can then be heated to evaporate off the water and dry the salt, which can then be recycled (Mathewson, 1980).
2.9 – Computer Modeling and Assessment Programs for Chemical Processes
2.9.1 – Aspen Plus Aspen Plus is a modeling software package used for a variety of process types in chemical engineering. Aspen Plus includes many basic units, such as distillation towers, drums, pumps, and heat exchangers. It does not include many specialty unit operations that are used for particular industries, such as conveyor belts or equipment necessary for the pretreatment of solids. Aspen Plus includes a wide variety of thermodynamic packages, which gives the user many options as to which will most accurately model any process. Aspen can accurately model ideal and non-ideal mixtures as it has a very strong set of available thermodynamic models included. Aspen Plus also includes large databases of information about many chemical components. Aspen Plus is accurate modeling software to use for processing plants that contain straightforward unit operations without many industry specific pieces of equipment. Aspen Plus can be used to simulate sections of plants modeled with other software in areas where thermodynamically complicated processes take place. An example of this is an azeotropic system, where predicting an ideal system would give wildly inaccurate results.
18
Aspen Plus can be a difficult program to learn and work with because it contains so much information. This makes the program complicated, but also an incredibly valuable resource. When given inappropriate information about a system Aspen Plus will sometimes give nonsensical results, but more often it will simply give an error message. This often catches user mistakes, which is helpful, if sometimes frustrating. Considerable knowledge of thermodynamics, chemical equipment and processes is necessary to successfully work with Aspen Plus, or the user will end up with many errors and little information.
2.9.2 – SuperPro Designer SuperPro Designer is also a modeling software package. It is designed specifically for processes including biological components. SuperPro Designer includes unit operations specific to biological operations, such as fermentors and strainers that Aspen lacks. However, SuperPro Designer has significantly less rigorous thermodynamic packages and far less information about components in databases. This often forces the user to research outside of the program in order to gather enough information for a successful simulation. SuperPro Designer is a much more straightforward program to learn and use than Aspen Plus. However, much more care is required of the user to successfully run a simulation in SuperPro Designer because it will give physically impossible results. SuperPro Designer also includes a costing feature that certain versions of Aspen Plus lack. It is very helpful to get an approximate cost of equipment and plant operating cost as the simulation is completed.
2.9.3 – SuperPro Designer Model Provided by the USDA In the paper, “Modeling the Process and Costs of Fuel Ethanol Production by the Corn Dry-Grind Process”, the USDA modeled the generation of ethanol through the fermentation of corn (Kwiatkowski, 2006). The process was modeled using the commercially available chemical engineering design software SuperPro Designer. The project was a continuation of one previously completed using Aspen Plus for design and Microsoft Excel for compilation and economic analysis. Though the model was designed for corn, it was done so in a way that the model could be adapted to other grains. The benefit that was found in using SuperPro Designer was that they could design and analyze the process using the same software. For specific material and energy balances and cost analysis see Appendices F – H.
2.9.4 – CAPCOST While SuperPro Designer has the ability to provide a rough estimate for the costs in a process, they are not necessarily accurate, as the program is estimating both the cost and the process outputs simultaneously, which has been stated to be rough estimates as well. Generally, processes that require only a few units are easy to estimate by hand, but a
19
computer aided program would be beneficial in estimating larger processes. For estimating the cost of a larger process, such as the sugar beet to ethanol process, the program CAPCOST, in addition to the modeling program Aspen Plus to find the equipment data necessary, could be used in order to estimate the cost of the process. CAPCOST takes data given to it, either taken from a proposed process or one modeled in a program such as Aspen Plus, and will provide a detailed capital cost estimate for the plant. CAPCOST comes bundled with Analysis, Synthesis, and Design of Chemical Processes (Turton et al., 2009) in the form of a program created with Microsoft Excel. The program comes with templates to model several common units in a process, such as centrifuges, conveyors, heat exchangers, towers, vessels, and more. Units that it does not have a template for, it can be modeled using another template under certain conditions, such as modeling a reactor as a packed tower. The information needed by CAPCOST is dependent on the input of the units. For example, CAPCOST will need to know various materials of construction for design, operating pressure, and types of varying units, as well as specific information dependent on unit, such as heat exchange area for a heat exchanger, number of stages, diameter, and height for a distillation column, and size for a vessel. When the cost index is provided, such as the Chemical Engineering Plant Cost Index (CEPCI), CAPCOST will then provide a series of costs for each unit (Turton et. al., 2009).
20
3. Methodology
The goal of the project was to design a process to produce ethanol using sugar beets as a feedstock and compare the process and corresponding economic analysis with that of using corn. This section describes the gathering of information and the construction of the SuperPro Designer model used to simulate the process. In the following sections, when using SuperPro Designer to compute large recycle streams, the streams were not connected but iteratively developed so that an inlet stream entered the process in equal composition to the exiting recycle stream. SuperPro Designer is unable to deal with large recycle streams.
3.1 – Pretreatment
3.1.1-Beet Slicing Sugar beets are bulb-shaped white root vegetables weighing approximately two kilograms each. In order to remove sucrose from the beets, they first must be sliced into much smaller pieces. These pieces are called cossettes, and are shaped approximately like shoe-string French fries. A slicer was used to model this step in SuperPro Designer (Asadi, 2007). Since the flows into and out of the slicer were for the purposes of the model exactly the same as the flow into the extractor, the slicer was not added to the full model, but designed and a cost analysis performed in a separate flow sheet.
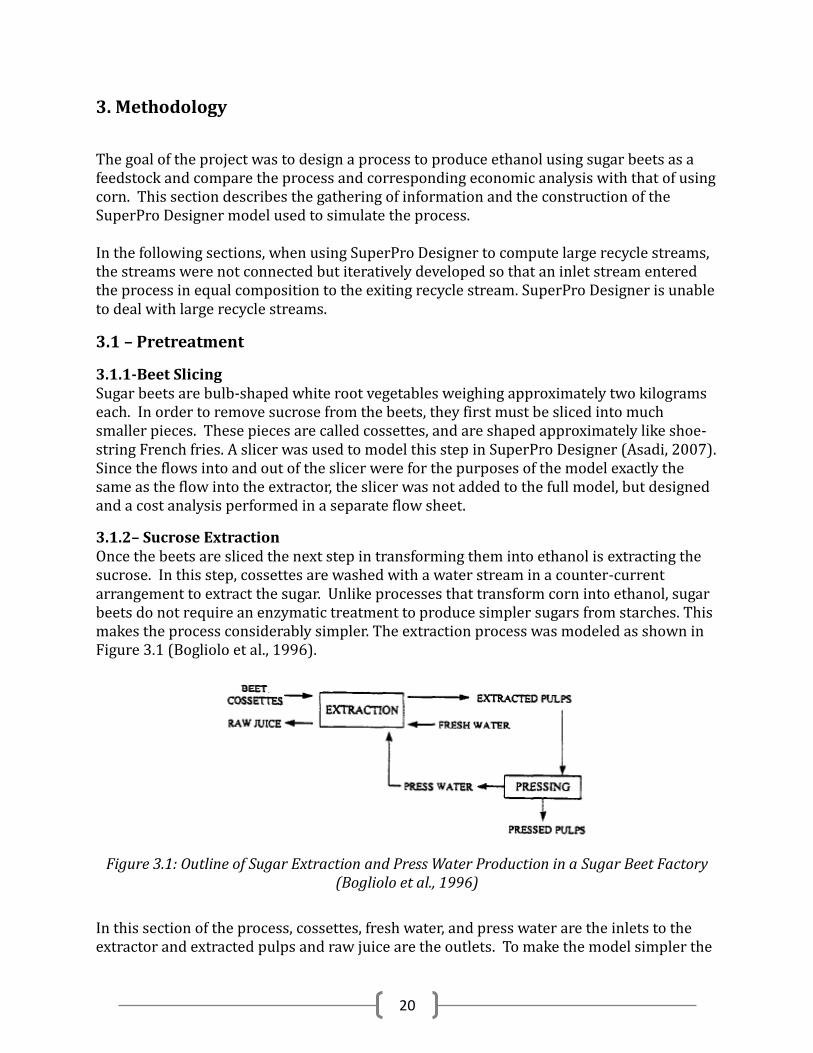
3.1.2– Sucrose Extraction Once the beets are sliced the next step in transforming them into ethanol is extracting the sucrose. In this step, cossettes are washed with a water stream in a counter-current arrangement to extract the sugar. Unlike processes that transform corn into ethanol, sugar beets do not require an enzymatic treatment to produce simpler sugars from starches. This makes the process considerably simpler. The extraction process was modeled as shown in Figure 3.1 (Bogliolo et al., 1996).
Figure 3.1: Outline of Sugar Extraction and Press Water Production in a Sugar Beet Factory (Bogliolo et al., 1996)
In this section of the process, cossettes, fresh water, and press water are the inlets to the extractor and extracted pulps and raw juice are the outlets. To make the model simpler the

21
beets were represented as only usable sucrose, water, and inert solids. The solid pulp was removed and fed to a press, producing press water that was recycled back into the extractor with fresh water and pressed pulp. In this model the pressed pulp was regarded as waste stream, as it is not used anymore in the process. Often the pulp is sold as a food for animals such as cows, horses, and sheep. In SuperPro Designer, the water entering the extractor was first mixed with the cossettes stream and this combined stream was set to enter the unit. The main product leaving the extractor was the raw juice, which contains sucrose as well as a small amount of other non-usable sugars, ions, and inert compounds that have the potential to be detrimental to the process. The composition of the raw juice is shown in Table 3.1 (Ogbonna et al., 2001)
Table 3.1: Composition of Raw Sugar Beet Juice (Ogbonna et al., 2001)
Components Weight Percent Water Solids
65.62% 17.30%
Sucrose 16.50% Other Sugars 0.24% Impurities 0.34%
The extractor was modeled in SuperPro Designer as a mixer/settler liquid extractor. The press was modeled using a two-way component splitter. For the extractor and press, the data from above was used to set the raw juice composition. Additionally information about pulp content was needed to complete this section of the simulation. It was found that the incoming beets are approximately 25% inert solids, and pressed cossettes are about 20% solids (Koppar and Pullammanappallil, 2008). Additionally about 1% of the sugar entering the plant is lost to the cossettes (Asadi, 2007). The cost for the extractor from SuperPro Designer was checked against an estimated cost from the extractor vendor Braunschweigische Maschinenbauanstalt AG (BMA). The value given by BMA was used in the finished model.
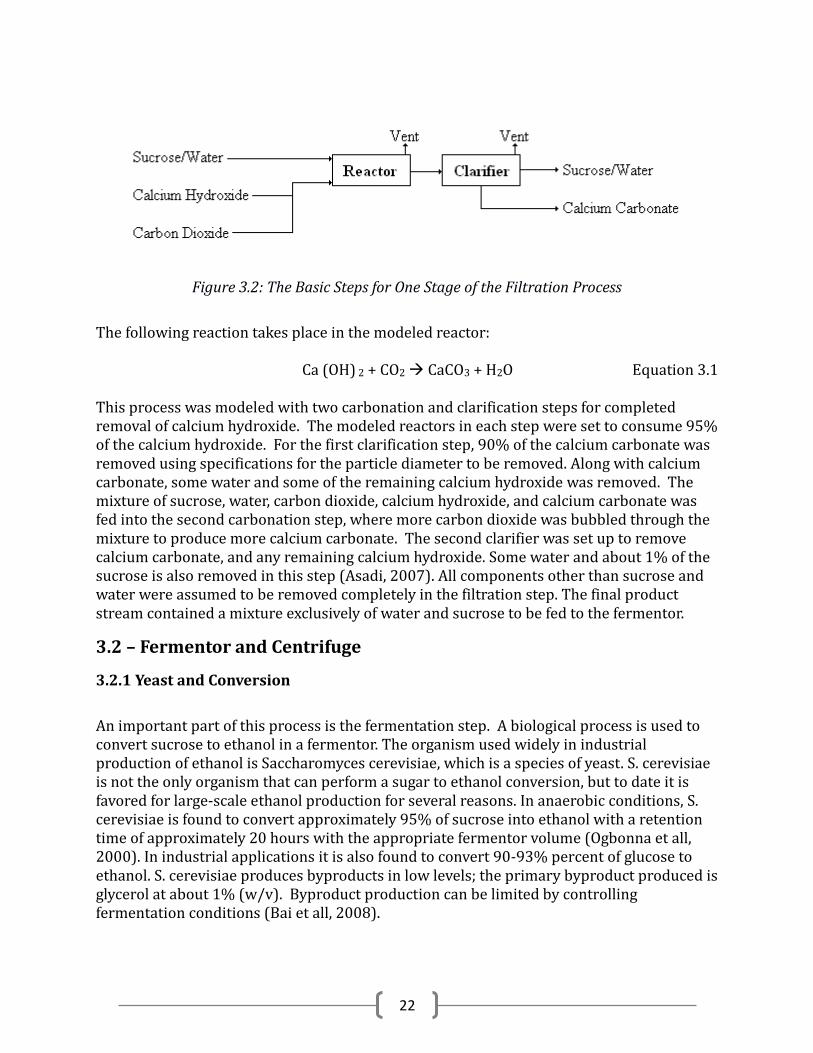
3.1.3 – Filtration Impurities in the sucrose are removed by treating the raw juice with lime. In the filtration process calcium hydroxide is added to the beats. Then carbon dioxide is bubbled through the mixture and, as shown in Equation 3.1, calcium carbonate is formed. The calcium carbonate is allowed to precipitate out in a clarifier and takes with it a vast majority of the impurities found in the raw juice. This carbonation and clarification process may be repeated multiple times, though most commonly it is repeated twice. To simulate the formation of calcium carbonate, a continuous stirred tank reactor was used in order to model the conversion of calcium hydroxide to calcium carbonate (smbsc.com, 2010 and Asadi, 2007). A brief outline of this procedure is shown in Figure 3.2.
22
Figure 3.2: The Basic Steps for One Stage of the Filtration Process
The following reaction takes place in the modeled reactor:
Ca (OH) 2 + CO2 CaCO3 + H2O Equation 3.1 This process was modeled with two carbonation and clarification steps for completed removal of calcium hydroxide. The modeled reactors in each step were set to consume 95% of the calcium hydroxide. For the first clarification step, 90% of the calcium carbonate was removed using specifications for the particle diameter to be removed. Along with calcium carbonate, some water and some of the remaining calcium hydroxide was removed. The mixture of sucrose, water, carbon dioxide, calcium hydroxide, and calcium carbonate was fed into the second carbonation step, where more carbon dioxide was bubbled through the mixture to produce more calcium carbonate. The second clarifier was set up to remove calcium carbonate, and any remaining calcium hydroxide. Some water and about 1% of the sucrose is also removed in this step (Asadi, 2007). All components other than sucrose and water were assumed to be removed completely in the filtration step. The final product stream contained a mixture exclusively of water and sucrose to be fed to the fermentor.
3.2 – Fermentor and Centrifuge
3.2.1 Yeast and Conversion
An important part of this process is the fermentation step. A biological process is used to convert sucrose to ethanol in a fermentor. The organism used widely in industrial production of ethanol is Saccharomyces cerevisiae, which is a species of yeast. S. cerevisiae is not the only organism that can perform a sugar to ethanol conversion, but to date it is favored for large-scale ethanol production for several reasons. In anaerobic conditions, S. cerevisiae is found to convert approximately 95% of sucrose into ethanol with a retention time of approximately 20 hours with the appropriate fermentor volume (Ogbonna et all, 2000). In industrial applications it is also found to convert 90-93% percent of glucose to ethanol. S. cerevisiae produces byproducts in low levels; the primary byproduct produced is glycerol at about 1% (w/v). Byproduct production can be limited by controlling fermentation conditions (Bai et all, 2008).

23
Another organism that has been investigated for its ability to produce ethanol from sugars is Zymomonas mobilis. Although Z. mobilis will convert more sugar to ethanol than S. cerevisiae (up to 97% conversion of glucose), it produces very limiting byproducts when fed with sucrose or fructose. Additionally Z. mobilis will only consume D-glucose, D-fructose and sucrose. As feedstocks for industrial ethanol production are either sucrose or sacrificed starches, which produce a variety of sugars, this is extremely undesirable. Additionally many ethanol production processes sell solid byproducts as animal feed, and Z. mobilis, although technically safe, is not acceptable in such feed while S. cerevisiae is acceptable (Bai et all, 2008). S. cerevisiae produces less ethanol once the ethanol concentration reaches 10%, by weight, and the cells will die once the concentration reaches 18% by weight (Liu and Qureshi, 2009). The conversion of sucrose to ethanol is approximately 95%, although it can be as high as 98% (Ogbonna, 2001). The simulation for this project used 95% conversion, as a conservative number. This means that for each gram of sucrose that enters the fermentor, approximately 0.51 grams of ethanol will be produced (Bai et all, 2008). The reaction that produces ethanol from sucrose and water is shown in Equation 3.2.
𝐶12𝐻22𝑂11 + 𝐻2𝑂 = 4𝐶2𝐻5𝑂𝐻 + 4𝐶𝑂2 Equation 3.2
A high concentration of ethanol will kill essentially any yeast, so the conversion and stoichiometry of the sucrose to ethanol reaction were considered when determining the concentration of the sucrose in the fermentor feed. The fermentor feed was modeled as essentially only water and sucrose. The concentration of sucrose in the feed should be no more than 17.9% by weight in order to keep the exiting ethanol concentration below 10% by weight. In this simulation the concentration of sucrose in the fermentor feed is 14.8% sucrose by weight. It is ideal for the incoming concentration of sucrose to be close to the maximum while still maintaining a reasonable margin. The difference between the maximum and the amount actually used is important so that the yeast will consume the maximum amount of sucrose without being overwhelmed by ethanol when small fluctuations in concentration occur. However, this difference should not be too large so that the following separation step will not have an unnecessarily high energy cost.
3.2.2 Fermentor Design
Important factors to design of the process in and around the fermentation step that were supplied to SuperPro Designer were: conversion of sucrose to ethanol, feed rate of yeast, and time for conversion. SuperPro Designer uses a heuristic for the maximum size of a single fermentor along with the calculated necessary volume for fermentation to determine the size and number of fermentors required. The fermentors were designed to be large enough to handle the flow of water and sucrose for the necessary retention time of approximately 20 hours. Yeast was fed to the reactor at a rate of 0.25 kg/L of liquid (Mathewson, 1980).

24
3.2.3 Centrifuge Yeast must be separated from the fermentor outlet stream so that it does not block or damage equipment later in the process. The easiest way to remove yeast it to take advantage of the very significant difference in size between the tiny molecules of water, ethanol, and sucrose, and the much larger yeast cells. It was determined that the best way to perform this type of separation was with a disk stack centrifuge (Green and Perry, 2008). A disk stack centrifuge was modeled in SuperPro Designer. The only data needed for this equipment to be modeled was the size of a S. cerevisiae cell, which was found to be a minimum of 5 micrometers (Bai et all, 2008).
3.3 – Extractive Distillation
In order to design a separation using extractive distillation, first the solvent must be chosen. For an ethanol-water separation, the solvents benzene and trichloroethylene (TCE) were suggested (Mathewson, 1980). In order to determine the best solvent, two separate simulations were run, first using benzene as the solvent, next using TCE. These simulations were completed in Aspen Plus as shown in the process flow diagram below.
Figure 3.3: Extractive Distillation Process
This process utilizes a pair of distillation towers in series with the ethanol product leaving the bottom of the second distillation column. The first column provides a crude separation of water from ethanol. Ethanol with some water is the distillate from this column, and
25
water with some residual sucrose is the bottoms. A thickening step was added to the bottom of the first tower to allow the recovery of unreacted sucrose that is removed with the water. Since this stream contains too much water to be recycled back to the pre-treatment steps, this thickening step was necessary to drive off some of the water to avoid flooding the extractor. Some of the ethanol is purged with the water in this step. TCE was added to the more concentrated ethanol stream before the second column. This column produces very high purity ethanol out the bottom, and a mixture of water and TCE as the distillate. Once a majority of the ethanol was purified and removed from the system, the TCE was separated from the water so that the water could be released as waste. Liquid TCE and water form a two-phase liquid-liquid mixture, allowing the majority of the TCE to be removed through the use of a gravity decanter, which separates the two phases based upon the difference in densities. As TCE is denser than water, it is removed from the bottoms of the decanter. There is still enough TCE remaining in the tops of the decanter that the stream does not pass the emissions standards of the United States Environmental Protection Agency. The legal limits set by the EPA for the discharge of TCE and benzene with wastewater is 0.005 mg/L, or 5 parts per billion (EPA, 2010). The waste stream is dilute enough that it doesn’t warrant the addition of a third distillation tower. Therefore, the stream is sent through a flash tank. Almost all of the TCE is removed, and a very small amount is lost in the wastewater stream leaving the bottoms of the flash unit.
Once the simulations were running without errors, the reflux ratios and number of stages of the distillation towers were checked to ensure the numbers received were reasonable. The input to the towers was adjusted when necessary to balance the operating cost of the reflux ratio against the equipment cost of the stages. The total and component mass flow rates of each stream were checked to ensure the separations had proceeded as needed.
Once the results of the simulation were determined feasible, the system was transferred into SuperPro Designer and the simulation was refined until the numbers matched those from Aspen Plus to take advantage of Aspen’s superior thermodynamic packages. The dimensional specifications of the equipment were also examined.
Next the recycle streams were incorporated into the system. Water, ethanol, and TCE were recycled whenever possible. No recycle stream from after the addition of TCE was routed back to the pre-treatment, fermentation, or filtration steps to avoid killing yeast due to contamination.

26
4. Results and Discussion The following sections describe the results gained through the modeling and analysis of the sugar beets to ethanol process. The detailed SuperPro Designer and Aspen reports can be found in the Appendices, as well as a complete process flow diagram. All of the equipment costs listed in this section were taken from SuperPro Designer cost estimations, with the exception of the extraction unit, where a vender cost was used. All costs from SuperPro Designer were checked with Capcost and were found to be in good agreement.
4.1 – Pretreatment
4.1.1 – Sucrose Extraction
To produce the desired amount of ethanol for the sugar beets process, the amount of cossettes entering the system was approximately 38,600 kg/h. The vendor Braunschweigische Maschinenbauanstalt AG estimated a cost of $5,424,000 for an extractor capable of handling that many beets. This was found to be greater than the cost given by SuperPro Designer, but it was decided that the cost from the vendor would be more accurate for a real plant. Though this is a large cost, the extractor handles a large volume of material and contains many moving parts. The beets are carried upward on a rotating spiral to allow maximum contact with the water passing in the opposite direction while preventing the beets from being swept away with the raw juice. The extractor must be sturdy enough to withstand the flows of beets and water without malfunction. Figure 4.1 shows this section of the process as modeled in SuperPro Designer. Table 4.1 shows a corresponding stream summary.
Figure 4.1: The Sucrose Extraction Section Modeled in SuperPro Designer
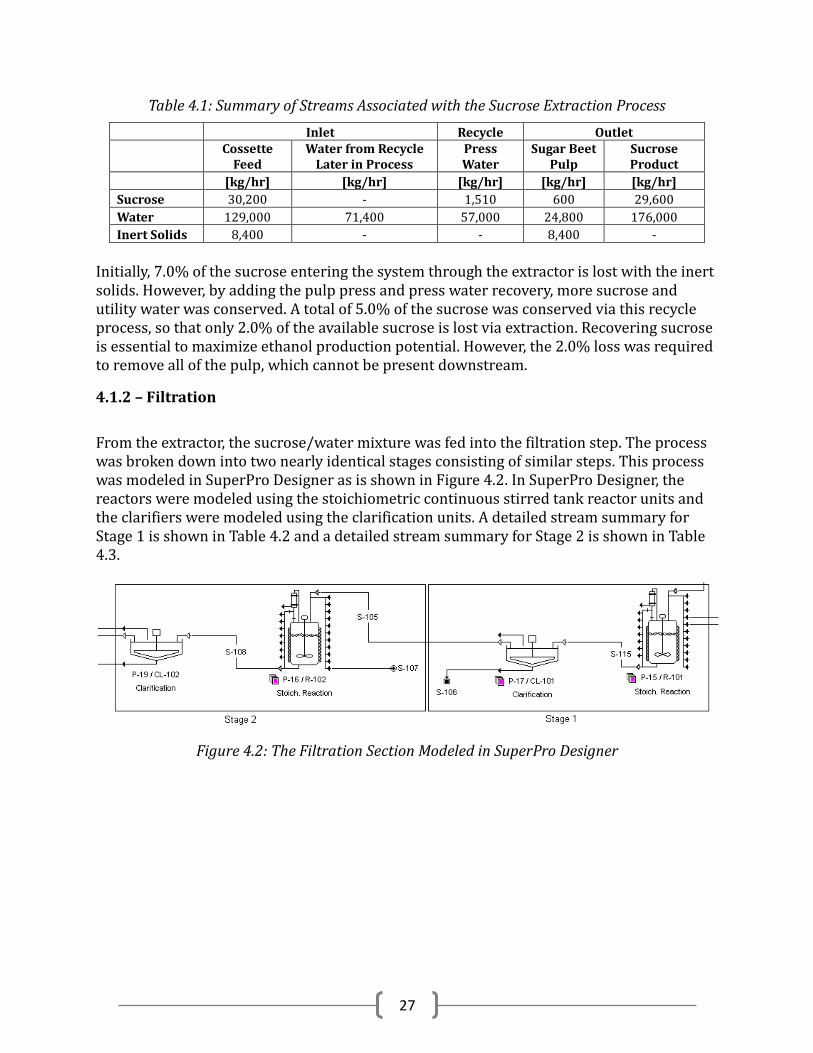
27
Table 4.1: Summary of Streams Associated with the Sucrose Extraction Process
Inlet Recycle Outlet
Cossette
Feed Water from Recycle
Later in Process Press Water
Sugar Beet Pulp
Sucrose Product
[kg/hr] [kg/hr] [kg/hr] [kg/hr] [kg/hr]
Sucrose 30,200 - 1,510 600 29,600
Water 129,000 71,400 57,000 24,800 176,000
Inert Solids 8,400 - - 8,400 -
Initially, 7.0% of the sucrose entering the system through the extractor is lost with the inert solids. However, by adding the pulp press and press water recovery, more sucrose and utility water was conserved. A total of 5.0% of the sucrose was conserved via this recycle process, so that only 2.0% of the available sucrose is lost via extraction. Recovering sucrose is essential to maximize ethanol production potential. However, the 2.0% loss was required to remove all of the pulp, which cannot be present downstream.
4.1.2 – Filtration
From the extractor, the sucrose/water mixture was fed into the filtration step. The process was broken down into two nearly identical stages consisting of similar steps. This process was modeled in SuperPro Designer as is shown in Figure 4.2. In SuperPro Designer, the reactors were modeled using the stoichiometric continuous stirred tank reactor units and the clarifiers were modeled using the clarification units. A detailed stream summary for Stage 1 is shown in Table 4.2 and a detailed stream summary for Stage 2 is shown in Table 4.3.
Figure 4.2: The Filtration Section Modeled in SuperPro Designer

28
Table 4.2: Summary of Streams Associated with Stage 1 in the Filtration Process
Feed into Reactor R-101 Feed into
Clarifier CL-101 Clarifier CL-101 Products
Sucrose Inlet
Stream
Reactant Component
Feeds Reactor R-101
Product Separated
Waste Reactor R-102
Feed
[kg/hr] [kg/hr] [kg/hr] [kg/hr] [kg/hr]
Sucrose 29,600 - 29,600 148 29,500
Water 176,000 3,360 186,000 46,141 138,000
Calcium Hydroxide - 7,840 168 16.8 151
Carbon Dioxide - 2,500 604 - 604
Calcium Carbonate - - 4,310 3,880 431
Table 4.3: Summary of Streams Associated with Stage 2 in the Filtration Process
Feed into Reactor R-102 Feed into Clarifier CL-102
Clarifier CL-102 Products
CL-101 Product
Reactant Component
Feeds Reactor R-102
Product Separated
Waste Sucrose Product
[kg/hr] [kg/hr] [kg/hr] [kg/hr] [kg/hr]
Sucrose 29,500 - 29,500 147 29,300
Water 138,000 - 138,000 34,600 104,000
Calcium Hydroxide 151 - 7.6 7.6 -
Carbon Dioxide 604 210 729 729 -
Calcium Carbonate 431 - 625 625 -
More calcium hydroxide could be consumed by adding more stages. However, only 0.3% of the total amount entering the first reactor was left unreacted after the two stages. Therefore it would be unprofitable to try to reduce purchase costs for calcium hydroxide by purchasing another set of equipment. More sucrose and water were lost during filtration. From the previous stage of the process, approximately 75,500 kg/hr of water was lost, while 3,360 kg/hr was recycled back into the filtration steps as well as the first reactor. It might be a viable option to look further into possibly recovering more water for recycling into other parts of the overall process. Sucrose loss was not as substantial in filtration as it was in extraction, as filtration loses only 48.9% as much sucrose as earlier. The total amount of sucrose lost from the amount originally available from the sugar beets was about 1.0%, 0.5% for each stage of filtration, bringing the total amount of sucrose lost over the entire process to 3.0% so far. Therefore, 97.0% of the sucrose from sugar beets entering the system was conserved and able to be fermented in the next step. Purchase costs for each filtration unit in this section was taken directly from the SuperPro Designer economic evaluation model rather than private vendors. A summary of costs is shown in Table 4.4.
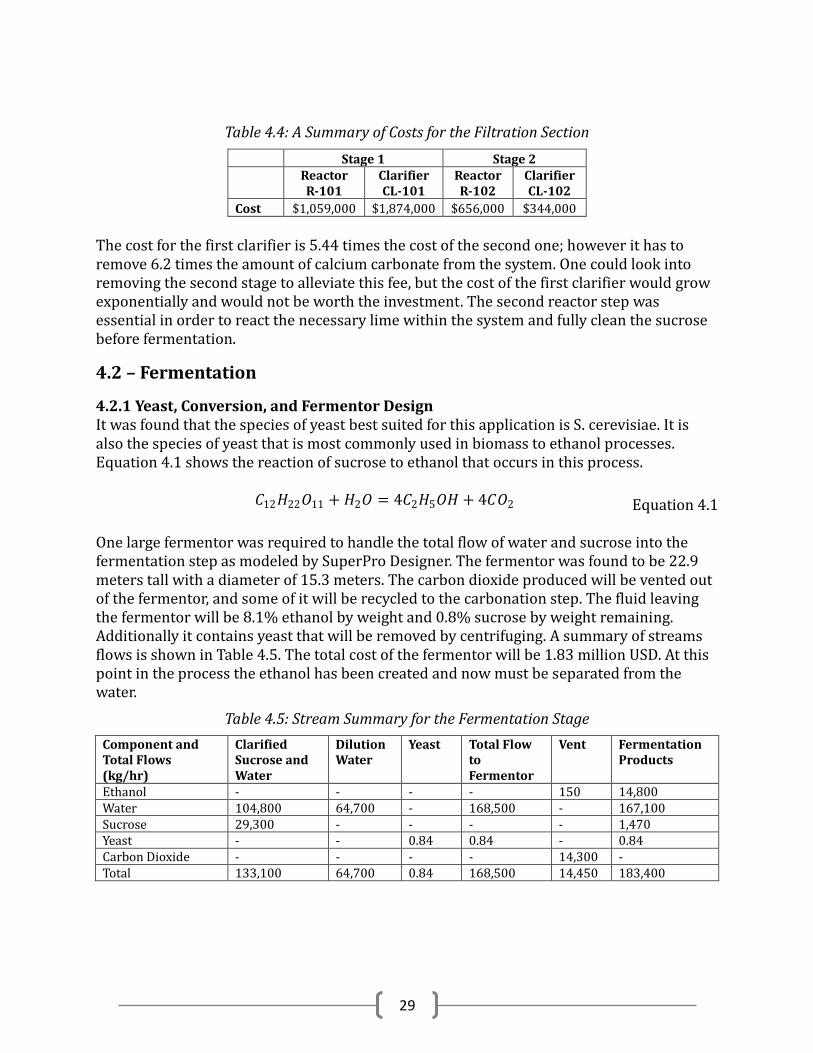
29
Table 4.4: A Summary of Costs for the Filtration Section
Stage 1 Stage 2
Reactor R-101
Clarifier CL-101
Reactor R-102
Clarifier CL-102
Cost $1,059,000 $1,874,000 $656,000 $344,000
The cost for the first clarifier is 5.44 times the cost of the second one; however it has to remove 6.2 times the amount of calcium carbonate from the system. One could look into removing the second stage to alleviate this fee, but the cost of the first clarifier would grow exponentially and would not be worth the investment. The second reactor step was essential in order to react the necessary lime within the system and fully clean the sucrose before fermentation.
4.2 – Fermentation
4.2.1 Yeast, Conversion, and Fermentor Design It was found that the species of yeast best suited for this application is S. cerevisiae. It is also the species of yeast that is most commonly used in biomass to ethanol processes. Equation 4.1 shows the reaction of sucrose to ethanol that occurs in this process.
𝐶12𝐻22𝑂11 + 𝐻2𝑂 = 4𝐶2𝐻5𝑂𝐻 + 4𝐶𝑂2 Equation 4.1
One large fermentor was required to handle the total flow of water and sucrose into the fermentation step as modeled by SuperPro Designer. The fermentor was found to be 22.9 meters tall with a diameter of 15.3 meters. The carbon dioxide produced will be vented out of the fermentor, and some of it will be recycled to the carbonation step. The fluid leaving the fermentor will be 8.1% ethanol by weight and 0.8% sucrose by weight remaining. Additionally it contains yeast that will be removed by centrifuging. A summary of streams flows is shown in Table 4.5. The total cost of the fermentor will be 1.83 million USD. At this point in the process the ethanol has been created and now must be separated from the water.
Table 4.5: Stream Summary for the Fermentation Stage
Component and Total Flows (kg/hr)
Clarified Sucrose and Water
Dilution Water
Yeast Total Flow to Fermentor
Vent Fermentation Products
Ethanol - - - - 150 14,800 Water 104,800 64,700 - 168,500 - 167,100 Sucrose 29,300 - - - - 1,470 Yeast - - 0.84 0.84 - 0.84 Carbon Dioxide - - - - 14,300 - Total 133,100 64,700 0.84 168,500 14,450 183,400

30
4.2.2 Centrifuge It was found that a single centrifuge is needed to separate the yeast from the fermentor product stream. Along with all the yeast, about 5 kilograms per hour of water is also removed from the fermentation products stream, along with traces of ethanol and sucrose. The centrifuge is a disk stack centrifuge with required sigma value of 160,000 square meters. A sigma value represents the size of a gravitational settler that would perform an equal separation to the centrifuge. Because many variables affect the separation provided by a centrifuge it is common to give a sigma value instead of a specific size (Green and Perry, 2008). The cost of this centrifuge is $43,800.
4.3 – Distillation
4.3.1 Extractive Distillation The solvent chosen for use in the extractive distillation steps was trichloroethylene. Although both benzene and trichloroethylene perform similarly throughout the actual distillation steps, trichloroethylene is more easily separated from water in the post-treatment steps. Both benzene and water form a two-phase liquid-liquid mixture with water. This allows the majority of the solvent to be decanted off. A flash unit can be used to remove enough of the remaining trichloroethylene to meet EPA standards. However, the flash unit is not able to remove enough of the benzene to be within legal limits. Either a distillation column or multiple flash units must be purchased, driving up equipment costs, or the water stream needs to be further diluted, resulting in a higher operating cost. The fermentation steps yielded 14,850 kg/hr of ethanol in a mixture with 1,466 kg/hr of unreacted sucrose and 167,000 kg/hr of water at 30 degrees Centigrade and one atmosphere of pressure. Through the separation process, 14,700 kg/hr of anhydrous ethanol was obtained at a total equipment cost of $769,600. The tables 4.7 through 4.9 summarize the main flows into and out of the each piece of equipment.
Table 4.6: Stream Summary for Tower 1 and Thickener
Component and Total Flows (kg/hr)
Tower 1 Feed Tower 1 Tops Tower 1 Bottoms
Purge Recycle to pre-treatment
Ethanol 14,850 17,850 1.5 1.1 0.4 Water 167,000 4,176 162,900 116,500 46,100 Sucrose 1,466 - 1,466 - 1,466 Total 183,300 22,030 164,400 116,500 47,570
Table 4.7: Stream Summary for Tower 2
Component and Total Flows (kg/hr)
TCE from Holding Tank
Tower 2 Feed Decanter Feed Tower 2 Bottoms Ethanol Product
Ethanol 620 15,500 774 14,700 Water 628 4,800 4,800 0.48 Trichloroethylene 84,000 84,000 84,000 - Total 85,250 104,300 89,570 14,700

31
Table 4.8: Stream Summary for Decanter and Flash Unit
Component and Total Flows (kg/hr)
Decanter Tops
Decanter Bottoms
Waste Trichloroethylene Recycle 2
To Holding Tank
Ethanol 416 357 159 260 614 Water 4,768 36 4,169 598 634 Trichloroethylene 8.4 83,992 .00008 8.3992 83,999 Total 5,192 84,390 4,328 866.4 85,350
The first distillation tower was actually modeled as two towers run in parallel. They had a reflux ratio of 7.894 and 27 stages. The height of the towers was 16.20 meters and the diameter was 2.61 meters. The thickener had a surface area of 564.6 m2 and held a volume of 1,694,000 liters. The thickener had a diameter of 26.8 meters and a depth of 3 meters. The second distillation tower had a reflux ratio of 0.305 and 73 stages. The height of the tower was 29 meters and the diameter was 1.84 meters. The flash drum was constructed according to ASME standards and held a volume of 453.7 liters. The diameter of the drum was 0.52 meters and the height was 2.10 meters. From this process, 160.1 kg/hr of ethanol, 120,700 kg/hr of water, and 0.00008 kg/hr of trichloroethylene are lost either in purge or waste streams. Only 1.09 percent of the ethanol and 0.0000001 percent of the trichloroethylene are lost. 72.3 percent of the water is lost, which appears very high. However, as much water as possible was recycled to various parts of the process. All of the water lost in the purge stream after the thickening step had to be driven off because the pre-treatment steps didn’t need any more water. The water lost in the waste stream after the flash could not be recycled because it was contaminated with trichloroethylene. The following table summarizes the cost of each piece of equipment. These costs were taken from SuperPro Designer, with the exception of the cost of the Decanter. Neither SuperPro Designer nor Capcost had a specific model in place for determining the cost of a decanter. However, the decanter is basically a process vessel, and can be costed in Capcost based upon the residence time the liquid spends inside the decanter and the volume of fluid being processed. A heuristic for liquid-liquid separations sets the residence time to 30 – 60 minutes to allow adequate settling (Turton et. al., 2009). Given a volumetric flow of 65,796 Liters/hour into the decanter and allowing 75% of the vessel volume to be in use at any given time, the total volume of the decanter will be equal to 61,863 L or 61.7 m3 when using a residence time of 45 minutes. Approximating the width to be equal to the height and the length to be 3 times the width, this gives dimensions of approximately (8.28 x 2.76 w x 2.76 h). This information was then plugged into Capcost to estimate the cost of the decanter.

32
Table 4.9: Separation Equipment Cost
Equipment Tower 1 Thickener Tower 2 Decanter Heat Exchanger Flash Drum
Total
Cost $326,000 $407,000 $250,000 $36,000 $40,000 $4,000 $769,600
As can be seen in the table, the majority of the cost for this part of the sugar beets to bioethanol production process is due to the costs of the two towers and the thickener. The first tower was more expensive than the second. However, it was processing almost twice as much material as the second column. The expense of the thickener was due to the volume necessary to accommodate the large amount of fluid flowing through.
4.3.2 Optimization of distillation Optimization was conducted on the two distillation units in the system. The price of each unit was reiterated for varying values of R/Rmin, a ratio of the actual reflux ratio to the minimum reflux ratio, and plotted to determine which conditions created a global minimum cost. The results for this procedure are shown in the following figures.
Figure 4.3: Determination of the Optimal Reflux Point for Tower T-101
$250,000
$260,000
$270,000
$280,000
$290,000
$300,000
$310,000
$320,000
$330,000
$340,000
1.15 1.2 1.25 1.3 1.35 1.4 1.45 1.5 1.55 1.6 1.65
Un
it C
ost
R/Rmin
33
Figure 4.4: Determination of the Optimal Reflux Point for Tower T-102
Our initial approximation of R/Rmin for both columns was set to 1.15. As seen in Figures 4.3 and 4.4, it is clear that the cost of each unit can be dropped drastically if a different value were chosen. Through SuperPro Designer’s cost approximations, it was found that the optimal value for the first tower, T-101, was 1.52 and the optimal value for the second tower, T-102, was 3.05. The table below compares the cost of the towers before and after optimization. As can be seen below, optimization decreases equipment costs by approximately $50,000 – $100,000 from our earlier approximations of the reflux ratio. This is done without affecting the extent of the separations.
Table 4.20: Optimization of Reflux Ratio
Tower 1 Tower 2 R/Rmin Optimal
R/Rmin R/Rmin Optimal
R/Rmin Ratio 1.15 1.52 1.15 3.05 Equipment Cost
$326,000 $274,000 $250,000 $163,000
4.4 – Comparisons of Feedstocks
4.4.1 Sugar Beets Each gram of sucrose that is recovered from sugar beets can be converted into approximately half a gram of ethanol. Sugar beets are generally about 17% sucrose by mass, although genetic modifications, selective breeding, and irrigation increase this number substantially, up to 21% (Cattanach et all., 1991), (Laboski et al., 2002). An average
$150,000.00
$170,000.00
$190,000.00
$210,000.00
$230,000.00
$250,000.00
$270,000.00
1.15 1.4 1.65 1.9 2.15 2.4 2.65 2.9 3.15 3.4
Un
it C
ost
R/Rmin

34
of 97% of the sucrose in sugar beets can be recovered for fermentation (Asadi, 2007). In 2009 25.8 tons or about 23,400 kg of sugar beets were harvested per acre of land cultivated (Haley and Dohlman, 2009). This means that per acre of land planted with sugar beets approximately 1930 kg of ethanol could be produced. Sugar beets preferably need to be processed soon after harvesting, as the sugar begins to degrade after a short period of time. However, they can be stored up to 180 days, as has been done by existing sugar beet plants when necessary, though this is not optimal for sucrose recovery (Southern Minnesota Sugar Beets Cooperative, 2010). Sugar beets can be grown in many areas of the United States, from Minnesota to Texas. In recent years the numbers of acres of land that are planted with sugar beets has decreased, however more sugar beets have actually been grown (SIC 2063, 2005). This is due to increased crop density that is made possible by genetic alterations of sugar beets. There is certainly room to grow more sugar beets in the United States, simply by using the areas that were once planted with sugar beets that are no longer in use. In addition sugar beets can be grown in a wide range of soil types and in most areas in the United States (Cattanach et all., 1991).
4.4.2 Sugar Cane Taking into consideration only the merits of the feedstock, sugar cane is a better choice as a feedstock for ethanol production than sugar beets. When sugar cane is processed the byproduct it produces that is analogous to spent beet pulp is called bagasse. Bagasse is a much more valuable byproduct than beet pulp because it can be burned to provide a large amount of the energy needed to power the ethanol plant (Quinteroa et al., 2008). Sugar beets do not have a byproduct like bagasse that can be burned to provide energy required for plant operation. This means that sugar cane requires less energy for conversion into ethanol than sugar beets will. The corresponding byproduct from sugar beets is useful as an animal feed, but it will not help provide energy (Cattanach et all., 1991). The reason sugar cane is not a viable feedstock in the United States is that there is a very limited area where sugar cane can be grown. This area includes primarily Florida and Louisiana as well as some areas of Texas (Haley and Dohlman, 2009). Additionally, even in this area conditions are not ideal for growing sugar cane. Sugar cane cannot be transported over long distances, as the sugar will begin to break down if it is not processed soon after the cane is harvested. This means that there is very limited possibility for producing ethanol from sugar cane in the United States. In countries closer to the equator, such as Brazil, sugar cane is an excellent choice as a bioethanol feedstock (Almeida, 2007 and Morgan, 2005).
4.4.3 Corn Converting corn into ethanol is a more complicated process that converting sugar cane or sugar beets into ethanol. Sugar cane and sugar beets both contain sucrose, which can be removed fairly simply from the plants. The plant material is first crushed or shredded then washed with water to separate sucrose from fiber. In order to get a fermentable sugar from corn a more complicated process is required. Corn contains starch, which must be broken
35
down into sugar before it can be fermented. This requires an enzymatic treatment and enzyme recovery steps. Approximately 3500 kg of corn can be produced from 1 acre of land, and 1 L of ethanol can be produced from 2.69 kg of corn. This means that only 1300 L of ethanol, or just over 1000 kg of ethanol, can be produced per acre of corn grown (Pimentel and Patzek, 2005). This is just more than half of the amount of ethanol that can be produced from sugar beets grown over the same area. Additionally, the net energy value (NEV) of corn has been highly debated. Some studies have found that the amount of energy needed to produce ethanol from corn is less than the amount of energy supplied by the ethanol (Shapouri et all, 2002), this finding would correspond to a positive NEV. However other studies have determined that more energy is used to produce ethanol than is supplied by the energy, or a negative NEV (Pimentel and Patzek, 2005). There are many factors involved in calculating the NEV for ethanol from corn. Researchers often estimate different values for specific energy costs, for example the amount of energy needed to produce fertilizer, and some values are neglected entirely in some studies. Corn stover includes the stalk, leaf, husk, and cobs left over after the corn kernels have been harvested. It does not include the roots of the corn plant, which are essentially always left for soil supplementation. Stover is the analogous fibrous material to bagasse from sugarcane or pressed pulp from sugar beets. Unlike bagasse or pressed pulp, which are used for energy production and animal feed, respectively. Corn stover is rarely used for such purposes. One reason stover is not used for other purposes is that leaving it intact helps improve soil quality. According to USDA guidelines at least 30% of corn stover should be left on the field to supplement the soil, prevent erosion, and contain moisture and therefore improve crops the next year. If stover is removed the soil must be enriched with additional fertilizers, which is estimated to cost approximately $6.40 per acre. (Hettenhaus, 2002) Cows can be allowed to graze on the stalks, leaves etc that are left on the field, but they have to be monitored carefully and fed supplements as corn stover is not a complete food for cows. Less than 5% of corn stalks were fed to animals or used as bedding as of 2002 (Hettenhaus, 2002). The nutritional value of corn stover decreases significantly after harvest, so if it is to be fed to cows, this should be done soon after harvest. If corn stover is baled it has to be treated with a chemical, usually ammonia, to prevent deterioration and add protein (Kyle, 2009). The other possible use for corn stover is to use it as a feedstock for conversion into ethanol. As there is a very large quantity of corn stover produced there is a large amount of this cellulosic byproduct. However, like all cellulosic materials, corn stover contains lignin, which significantly limits its possible use as an ethanol feedstock (Chapel et al., 2007). More information about lignin is included in section 2.6: Alternative Sources for Ethanol Production. As a result of these limitations to the uses of corn stover, it is very common for

36
farmers to simply leave stover on the field, or to plow it underground to enrich the soil (Kyle, 2009).
4.4.4 Energy required for conversion The amount of energy necessary to produce ethanol from a feedstock depends both on the chemical process required for the conversion and on factors such as transportation costs, irrigation requirements, fertilizer needs, and pesticide applications. Transportation costs are impossible to assess comparatively since they would depend on the location of a sugar beet to ethanol plant, which does not exist at this time. Pesticide use varies widely from farm to farm and from year to year because it is often applied in response to a problem. As a result an accurate comparison was not possible. Sugar beets require approximately 560 mm of water to grow to maturity (Efetha, 2008). They also require certain levels of potassium, phosphate, and especially nitrogen. The level of each of these nutrients in the soil already has a very high effect on how much fertilizer must be added. Maximum amounts of each nutrient necessary are: 80 lbs potassium/acre, 100 lbs phosphate/acre, and 200 lbs nitrogen/acre (Cattanach et all., 1991). In general however, lower levels will be required because the soil will not be completed depleted of these nutrients, which the above numbers assume. Amounts as low as one half of the amount listed above are required for soil with just moderate amounts of each nutrient. Corn requires approximately 26 inches of water to grow to maturity (Kranz, 2008), which is almost exactly equal to 560mm. This means that there will be essentially no energy difference per acre due to irrigation needs. Per year corn requires approximately the following amounts of nutrients as fertilizer: 160 lbs potassium/acre, 70 lbs phosphate/acre, and 140 lbs nitrogen/acre (ProCrop, 2009). It is difficult to comment on which crop requires more energy as fertilizer per acre, since fertilizer needs depend so heavily on the levels of nutrients already in the soil. Corn definitely requires more potassium, but the other nutrients may be higher or lower for either crop. However, both amount of irrigation and fertilizer required are on a per acre basis and sugar beets will produce almost twice as much ethanol per acre. This means that per liter of ethanol produced the energy cost for both irrigation and fertilizer will likely be much lower for sugar beets. The amount of energy used to convert corn to ethanol was compared to the amount of energy used to convert sugar beets into ethanol. This comparison was made between the USDA SuperPro Designer corn to ethanol simulation (see section 2.9.3 for more information), and the sugar beet to ethanol SuperPro Designer simulation created in this project (Kwiatkowski, 2006). The energy used in the sugar beet process falls into one of four categories: electricity, cooling water, chilled water, and steam. The sugar beet simulation calculates an annual use of 28,940,000 kW/h of electricity, 93,600,000,000 kg of cooling water, 437,000,000 kg cooled water and 1,265,000,000 kg of steam. The corn to ethanol process has a longer list of utilities used, including natural gas, cooling tower water, and more varieties of steam. The USDA corn simulation calculates an annual use of 29,400,000 kW/h of electricity, 37,300,000,000 kg of cooling water, 0 kg cooled water 11,800,000 kg natural gas, and 21,850,000,000 kg of cooling tower water. Table 4.11 shows
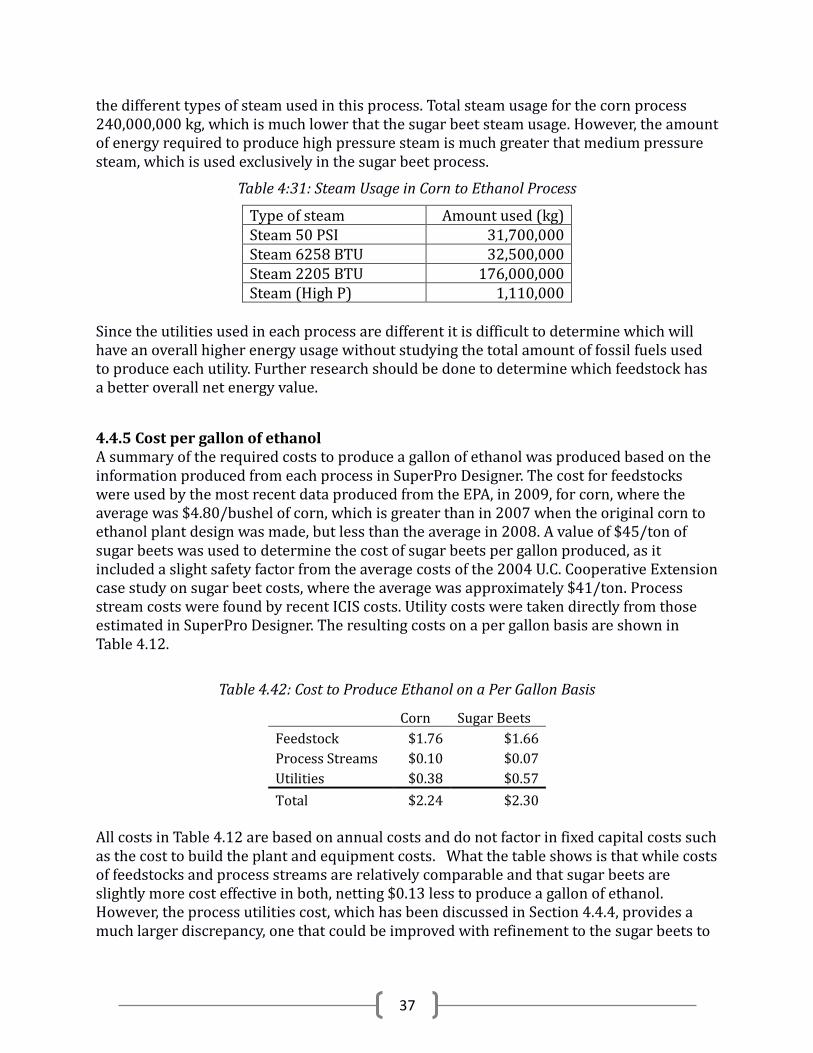
37
the different types of steam used in this process. Total steam usage for the corn process 240,000,000 kg, which is much lower that the sugar beet steam usage. However, the amount of energy required to produce high pressure steam is much greater that medium pressure steam, which is used exclusively in the sugar beet process.
Table 4:31: Steam Usage in Corn to Ethanol Process
Type of steam Amount used (kg) Steam 50 PSI 31,700,000 Steam 6258 BTU 32,500,000 Steam 2205 BTU 176,000,000 Steam (High P) 1,110,000
Since the utilities used in each process are different it is difficult to determine which will have an overall higher energy usage without studying the total amount of fossil fuels used to produce each utility. Further research should be done to determine which feedstock has a better overall net energy value.
4.4.5 Cost per gallon of ethanol A summary of the required costs to produce a gallon of ethanol was produced based on the information produced from each process in SuperPro Designer. The cost for feedstocks were used by the most recent data produced from the EPA, in 2009, for corn, where the average was $4.80/bushel of corn, which is greater than in 2007 when the original corn to ethanol plant design was made, but less than the average in 2008. A value of $45/ton of sugar beets was used to determine the cost of sugar beets per gallon produced, as it included a slight safety factor from the average costs of the 2004 U.C. Cooperative Extension case study on sugar beet costs, where the average was approximately $41/ton. Process stream costs were found by recent ICIS costs. Utility costs were taken directly from those estimated in SuperPro Designer. The resulting costs on a per gallon basis are shown in Table 4.12.
Table 4.42: Cost to Produce Ethanol on a Per Gallon Basis
Corn Sugar Beets
Feedstock $1.76 $1.66
Process Streams $0.10 $0.07
Utilities $0.38 $0.57
Total $2.24 $2.30 All costs in Table 4.12 are based on annual costs and do not factor in fixed capital costs such as the cost to build the plant and equipment costs. What the table shows is that while costs of feedstocks and process streams are relatively comparable and that sugar beets are slightly more cost effective in both, netting $0.13 less to produce a gallon of ethanol. However, the process utilities cost, which has been discussed in Section 4.4.4, provides a much larger discrepancy, one that could be improved with refinement to the sugar beets to
38
ethanol plant design. As it stands now, sugar beets costs $0.06 more to produce a gallon of ethanol, but this difference could be alleviated with improvements to the system.
39
5. Conclusions The previously described process was modeled to produce the same amount of ethanol as was produced by the USDA model. For sugar beets, 168,000 kg of raw beet produces 14,700 kg of ethanol. A process modeled by the USDA for producing ethanol from corn required 46,350 kg of corn to produce the same amount of ethanol. This is a very large difference in the amounts of raw materials necessary. However, when the amounts of raw materials are reduced to the approximate amount of acres, it can be seen that it requires 7.2 acres of sugar beets versus 13.2 acres of corn to produce the same amount of ethanol. Therefore, although it requires approximately 10 times as much raw sugar beet to produce the same amount of ethanol, as far as land use sugar beets can produce approximately 1.8 times as much ethanol. Knowing that an acre of sugar beets and an acre of corn require approximately as much water, and assuming comparable fertilizer and pesticide requirements, it can be determined that sugar beets are almost twice as efficient when it comes to land usage requirements. The cost of purchasing the equipment for a sugar beets processing facility comes out to approximately $15,876,000, based on estimates from SuperPro Designer. The cost of purchasing the equipment for the process modeled by the USDA was $18,556,000. The majority of the cost of the sugar beets plant came from the extractor used to wash the sucrose from the cossettes. Further research into the use and refinement of the extractor could yield a lower cost. Although costs would be cut considerably if a sugar beet to table sugar plant were available for conversion into a sugar beet to ethanol plant, as all the equipment except those required for fermentation and separation would already be in place, this is not possible at this time. Currently all sugar beet plants in the United States are running at capacity. Besides not leaving any room for new sugar beet farmers unless they are able to build a new facility or take the spot of another farmer in an existing collective, this also does not leave any sugar beet plants free for partial or full conversion. However, if in the future demands on domestic sugar decrease enough that the plants begin to operate under capacity, this would be an economic option for the creation of a sugar beets to ethanol plant. The proposed sugar beets plant required total annual utilities of 9,620,000 kilowatt hours of electricity, 1,272,000,000 kg of steam, and 93,595,000,000 kg of cooling water. The corn model provided by the USDA required total annual utilities of 29,430,000 kilowatt hours of electricity, 37,312,000,000 kg of cooling water, 11,770,000 kg of natural gas, and 241,300,000 kg of steam. The corn model consumes 67% more electricity than the sugar beets process, and requires a large amount of natural gas. The sugar beets process requires nearly 70% more cooling water and 81% more steam. The majority of this extra cost is likely to come from the utilities required by the distillation towers. The corn model used molecular sieves and packed towers with salt to separate ethanol and water. If a similar separation method was put in place for the sugar beet process, the utility cost could be cut significantly.
40
From the 30,200 kg of sucrose available from 168,000 kg of raw beets, 900 kg is lost during the process. Therefore, only about 3% of the total available sugar is being lost throughout the process. Of the 14,700 kg of ethanol produced from the same amount of sugar beets, 190 kg are lost during separation. This is a loss of a little more than one percent. Out of the 84,000 kg of trichloroethylene added to the second distillation tower to separate the 14,700 kg of ethanol from the water, only 0.00008 kg is lost during the separation from the water. Taking these factors into consideration, as well as the growing area, crop density, and food versus fuel problem mentioned earlier, it is clear that sugar beets are the superior feedstock for producing ethanol.

41
6. Recommendations Though through our research and simulations, we determined that sugar beets are the superior feedstock, there is still a lot of work to be done before a sugar beets to ethanol plant would be ready to be built. There was uncertainty built into both our data and the data gained from the corn model provided by the USDA, due to the use of SuperPro Designer, especially with data relying on thermodynamic principles. As was stated in the background, SuperPro Designer lacks rigorous thermodynamic packages. Though our simulations were run through Aspen Plus as often as possible to check the accuracy of the data, we were unable to model the pretreatment, filtration, and fermentation steps in Aspen Plus. We recommend that the process be modeled using software with rigorous thermodynamic packages similar to Aspen Plus but with the ability to model these steps. We also recommend that further studies on sugar beets to ethanol plants find and incorporate additional data about processing and growing sugar beets that can be used to modify the process simulation and increase accuracy. A partnership with the USDA would yield statistical data on the annual fertilizer and pesticide requirements of sugar beets, as well as current growth patterns and ranges. With this information, an accurate NEV can be calculated for sugar beets, and the optimal location for a sugar beets to ethanol plant can be found. This location would be one where the growth of the sugar beets does not limit the growth of other key food crops, while allowing the minimization of necessary fertilizers and pesticides. We also recommend that further research be conducted into utility optimization for the sugar beet to ethanol process. Unlike with sugar cane, the pressed beet pulp cannot be burned to recovered energy and help fuel the process. To prevent the plant from running unsustainably by relying on energy from non-renewable sources to drive the production of ethanol, we recommend that research on alternative fuel sources be researched and considered, as well as the energy demands of the sugar beets plant minimized. Part of this research could involve utilizing the molecular sieve adsorption separation mechanism used in the USDA model to cut back on utility costs. This would minimize not only the steam and cooling water utilities necessary for the extractive distillation system, but also eliminate the electricity usage necessary to pump the large volumes of trichloroethylene through the system. We recommend that further studies be conduction on minimizing the cost per gallon, including investigating if there is an optimum size at which equipment and utility costs become minimized. If it can be shown that sugar beets can be more economical than corn, even with current government-sponsored subsidies on corn, sugar beets will be more likely to become mainstream as a feedstock for bioethanol production. We recommend that further research be conducted into utilizing sugar beets as a feedstock for producing ethanol, and that a pilot scale plant be built. Although studies have been done researching the theoretical benefits of using sugar beets over corn, there are currently no plants in place for converting the sucrose washed from the sugar beets into ethanol. Were

42
a sugar beet to table sugar plant become unused in the future, we recommend it’s conversion to a bioethanol plant, though we recognize that this is not possible at this time. Any future researchers can contact the contributing engineers for SuperPro Designer files and Simulation data used for this project at the following e-mail addresses: Emily Bowen: [email protected] Sean C. Kennedy: [email protected] Kelsey Miranda: [email protected] Additionally, Professor William M. Clark has access to all of the files and data used for this project.

43
7. References
Alan Efetha. (2008). Irrigation management of sugar beets Government of Alberta: Rural and Agricultural Development, Irrigation Branch.
Almeida, C. (2007). Sugarcane ethanol: Brazil's biofuel success. Ansari, A. (2009, April 28). "Climate change" forces Eskimos to abandon village. CNN,
Retrieved from http://www.cnn.com/2009/TECH/science/04/24/climate.change.eskimos/index.html
Asadi, M. (2007). Sugar-beet handbook. Bai, F. W., Anderson, W. A., & Moo-Young, M. (2008). Ethanol fermentation technologies
from sugar and starch feedstocks. Biotechnology Advances, 26(1), 89-105. DOI: 10.1016/j.biotechadv.2007.09.002
Basic information about benzene in drinking water. (2010). Retrieved 3/23, 2010, from
http://www.epa.gov/safewater/contaminants/basicinformation/benzene.html Basic information about trichloroethylene in drinking water. (2010). Retrieved 3/23, 2010,
from http://www.epa.gov/safewater/contaminants/basicinformation/trichloroethylene.html#four
BMA beet extraction plants. Bogliolol, M., Bottinol, A., Caparmellil, G., De Petrol, M., Servidal, A. ,Pezzi, G., &Vallini, G.
(1996). Clean water recycle in sugar extraction process: Performance analysis of reverse osmosis in the treatment of sugar beet press water.Desalination(108), 261-271.
Calculations and references. (2009). Retrieved 4/8, 2010, from
http://www.epa.gov/cleanenergy/energy-resources/refs.html#railcars Cattanach, A.W., Dexter, A.G., &Oplinger, E.S. (1991). Sugarbeets. Alternative Field Crops
Manual, Chapple, Clint ,Ladisch, Michael , &Meilan, Rick. (2007). Loosening lignin's grip on biofuel
production. Nature Biotechnology, (25), 746-748. Clark, J. (2005). Non-ideal mixtures of liquids. Retrieved 3/19, 2010, from
http://www.chemguide.co.uk/physical/phaseeqia/nonideal.html

44
Core Writing Team. (2007). Climate change 2007: Synthesis report. Geneva, Switzerland: Intergovernmental Panel on Climate Change.
Corn (C, CBOT): Monthly Price Chart. (2010). Commodity prices / quotes & commodity
charts – free. Doherty, M. F., & Caldarola, G. A. (1985). Design and synthesis of homogeneous azeotropic
distillations - 3 - the sequencing of columns for azeotropic and extractive distillations. Industrial Chemical Engineering Fundamentals, 24, 474.
Ensinas, A. V., Nebra, S. A., Lozano, M. A., & Serra, L. M. (2007). Analysis of process steam
demand reduction and electricity generation in sugar and ethanol production from sugarcane. Energy Conversion and Management, 48, 2978.
EPA: U.S. Environmental Protection Agency, Office of Energy Efficiency and Renewable
Energy, U.S. Department of Energy. (2010). Fuel economy guide: 2010 model year. Green, D. W., & Perry, R. H. (2008). Perry's chemical engineers' handbook (8th edition). Guey-Lee, L. (2007). Renewable energy consumption and electricity preliminary 2006
statistics. Retrieved January 22, 2010, from http://www.eia.doe.gov/cneaf/solar.renewables/page/prelim_trends/rea_prereport.html
Haas, M. J., McAloon, A. J., Yee, W. C., & Foglia, T. A. (2006). A process model to estimate
biodiesel production costs. Bioresource Technology, 97, 671. Haley, Stephen, &Dohlman, Erik. (2009). Sugar and sweeteners outlook. USDA, Economic
Research Service, ((SSS-256)) Hansen, J., Sato, M., Ruedy, R., Lo, K., Lea, D., & Medina-Elizade, M. (2006). Global
temperature change. Proceedings of the National Academy of Sciences, 103(39), 14288. doi:10.1073
Harrison, J. A. P. D. (2003). The carbon cycle: What goes around comes around.
Visionlearning, EAS-2(3), 4/8/10. Hayes, F. W. (1982). Production of ethanol from sugar cane (435/161 ed.). England:
Retrieved from http://www.freepatentsonline.com/4326036.html How coal works. (2009). Retrieved January 22, 2010, from
http://www.ucsusa.org/clean_energy/technology_and_impacts/energy_technologies/how-coal-works.html
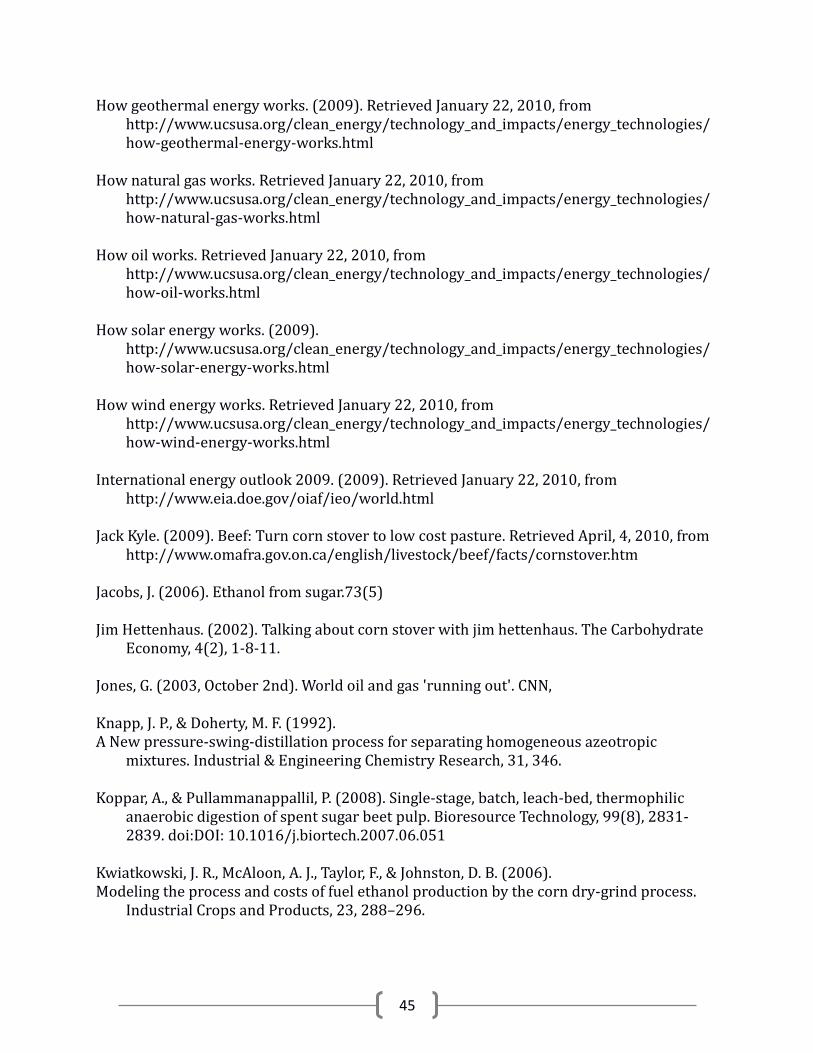
45
How geothermal energy works. (2009). Retrieved January 22, 2010, from http://www.ucsusa.org/clean_energy/technology_and_impacts/energy_technologies/how-geothermal-energy-works.html
How natural gas works. Retrieved January 22, 2010, from
http://www.ucsusa.org/clean_energy/technology_and_impacts/energy_technologies/how-natural-gas-works.html
How oil works. Retrieved January 22, 2010, from
http://www.ucsusa.org/clean_energy/technology_and_impacts/energy_technologies/how-oil-works.html
How solar energy works. (2009).
http://www.ucsusa.org/clean_energy/technology_and_impacts/energy_technologies/how-solar-energy-works.html
How wind energy works. Retrieved January 22, 2010, from
http://www.ucsusa.org/clean_energy/technology_and_impacts/energy_technologies/how-wind-energy-works.html
International energy outlook 2009. (2009). Retrieved January 22, 2010, from
http://www.eia.doe.gov/oiaf/ieo/world.html Jack Kyle. (2009). Beef: Turn corn stover to low cost pasture. Retrieved April, 4, 2010, from
http://www.omafra.gov.on.ca/english/livestock/beef/facts/cornstover.htm Jacobs, J. (2006). Ethanol from sugar.73(5) Jim Hettenhaus. (2002). Talking about corn stover with jim hettenhaus. The Carbohydrate
Economy, 4(2), 1-8-11. Jones, G. (2003, October 2nd). World oil and gas 'running out'. CNN, Knapp, J. P., & Doherty, M. F. (1992). A New pressure-swing-distillation process for separating homogeneous azeotropic
mixtures. Industrial & Engineering Chemistry Research, 31, 346. Koppar, A., & Pullammanappallil, P. (2008). Single-stage, batch, leach-bed, thermophilic
anaerobic digestion of spent sugar beet pulp. Bioresource Technology, 99(8), 2831-2839. doi:DOI: 10.1016/j.biortech.2007.06.051
Kwiatkowski, J. R., McAloon, A. J., Taylor, F., & Johnston, D. B. (2006). Modeling the process and costs of fuel ethanol production by the corn dry-grind process.
Industrial Crops and Products, 23, 288–296.
46
Ladisch, M. R., & Dyck, K. (1979). Dehydration of ethanol: New approach gives positive balance. Science, 205(4409), 898.
Liu, S., & Qureshi, N. (2009). How microbes tolerate ethanol and butanol. New
Biotechnology, 26(3-4), 117-121. doi:DOI: 10.1016/j.nbt.2009.06.984 Mathewson, S. W. (1980). The manual for the home and farm production of alcohol fuel. Milk of lime. Retrieved 3/13, 2010, from
http://www.rijkersbv.com/rijkers_en/applications/milk_of_lime.htm Morgan, D. Brazil's biofuel strategy pays off as gas prices soar. The Washington Post, Muller, D., & Marquardt, W. (1997). Experimental verification of multiple steady states in heterogeneous azeotropic distillation.
Industrial & Engineering Chemistry Research, 36, 5410. Nuclear energy. (2008). Retrieved January 22, 2010, from
http://www.epa.gov/RDEE/energy-and-you/affect/nuclear.html Ogbonna, James C. ,Mashima, Hiroaki, & Tanaka, Hideo. (2001). Scale up of fuel ethanol
production from sugar beet juice using loofa sponge immobilized bioreactor. Bioresource Technology, 76(1), 1-8.
Pimentel, D., & Patzek, T. W. (2005). Ethanol production using corn, switchgrass, and wood;
biodiesel production using soybean and sunflower. Natural Resources Research, 14(1), 65-76.
Process description.(2000). Imperial Bioresources LLC, ProCrop 2009: Fertilizer requirements for corn. (2009). Retrieved 4/8, 2010, from
http://www.ag.ndsu.edu/procrop/crn/crnftr05.htm Quinteroa, J. A., Montoyaa, M. I., Sa´ncheza, O. J., Giraldoc, O. H., & Cardona, C. A. (2008). Fuel
ethanol production from sugarcane and corn: Comparative analysis for a colombian case. Energy, 33, 385.
Rohter, L. (2006, April 10). With big boost from sugar cane, brazil is satisfying its fuel needs.
New York Times, The role of renewable energy consumption in the nation's energy supply 2007. (2009).
Retrieved January 22, 2010, from http://www.eia.doe.gov/cneaf/solar.renewables/page/trends/highlight1.html
Seader, J. D., & Henley, E. J. (1998). Separation process principles

47
Shapouri, H., Duffeild, J. A., & Wang, M. (2002). The energy balance of corn ethanol: An update No. 34075)
SIC 2046 wet corn milling.(2005). Encyclopedia of American Industries, SIC 2063 beet sugar.(2005). Encyclopedia of American Industries, Southern minnesota beet sugar cooperative: The sugar process.(2010). Temperature change in alaska. (2009). Retrieved January 22, 2010, from
http://climate.gi.alaska.edu/ClimTrends/Change/TempChange.html Turton, R., Bailie, R. C., Whiting, W. B., & Shaeiwitz, J. A. (2009). Analysis, synthesis, and
design of chemical processes (third edition). United Nations: UN-Energy. (2007). Sustainable bioenergy: A framework for decision
makers. Wankat, P. C. (2006). Separation process engineering (2nd ed.) Prentice Hall. Weber, J. A. (2009). Feedstock supplies for U.S. biodiesel production. MARC IV Consulting
Inc, William L Kranz, Suat Irmak, Simon J van Donk, C. Dean Yonts, & Derrel L Martin. (2008).
Irrigation management for corn University of Nebraska-Lincoln Extension, Insitute of Agricultural and Natural Resources.
Yokayobiofuels.(2010).
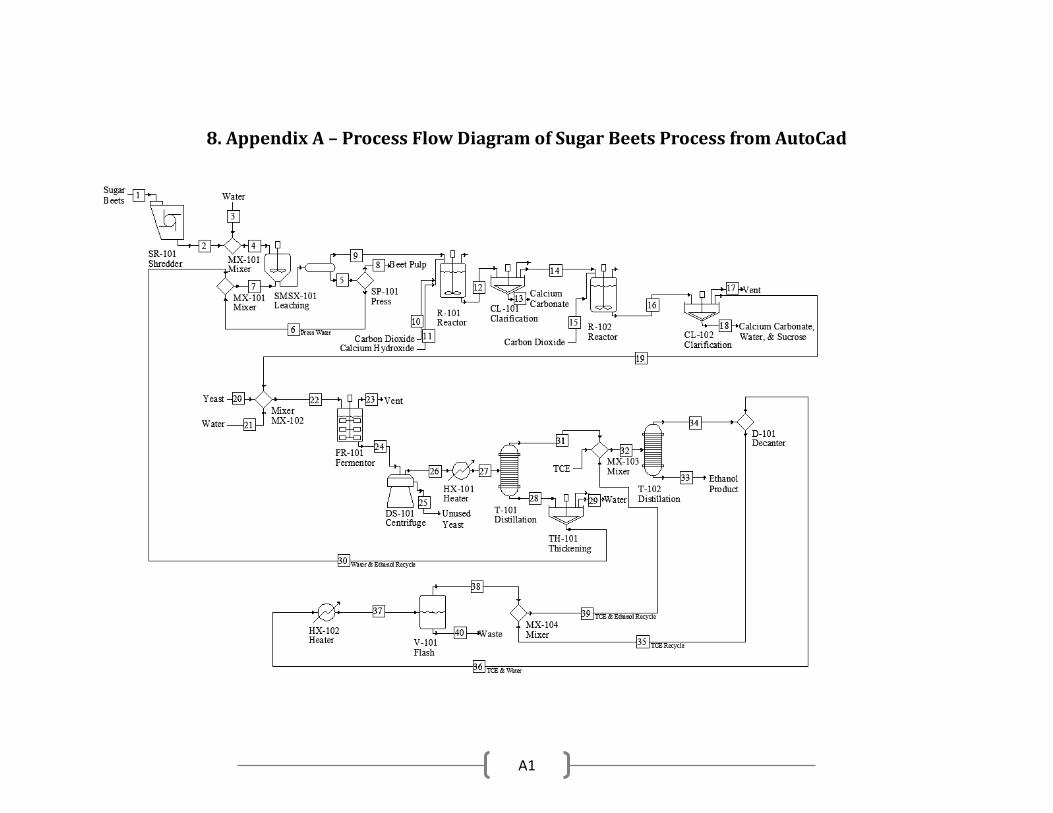
A1
8. Appendix A – Process Flow Diagram of Sugar Beets Process from AutoCad

A2
9. Appendix B – Process Flow Diagram of Sugar Beets Process from SuperPro Designer

10. Appendix C – Sugar Beets Material and Energy Balance from SuperPro Designer
A3
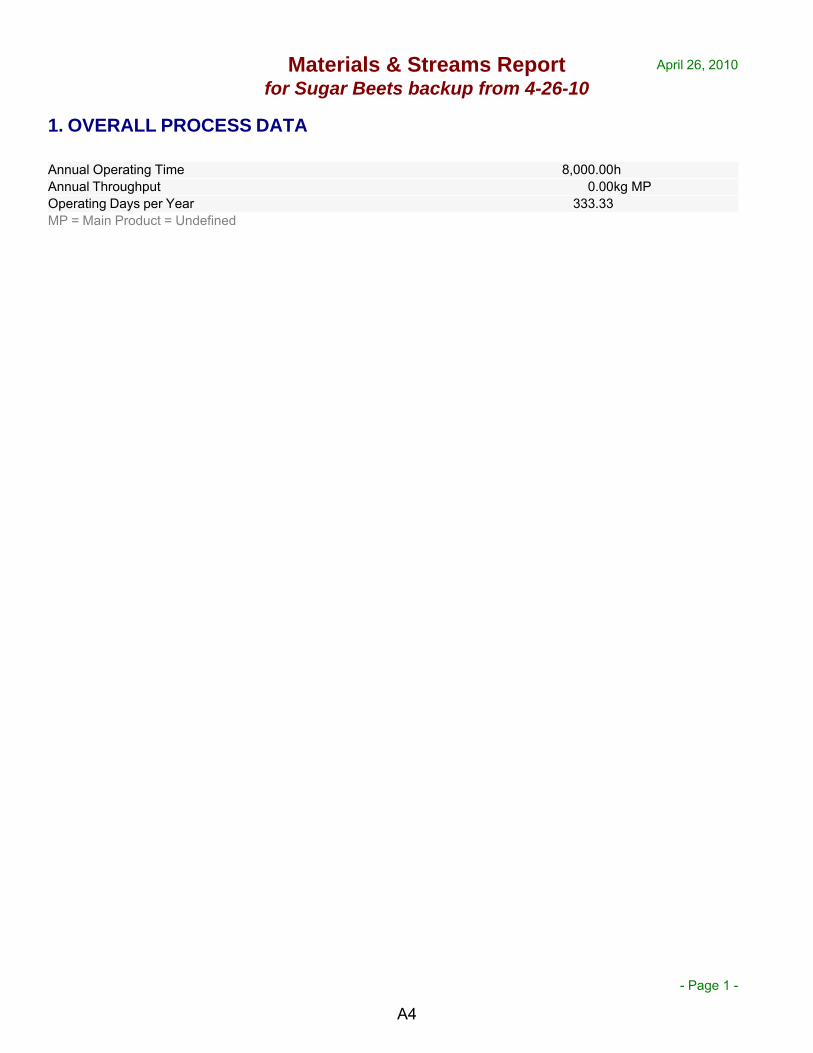
Materials & Streams Reportfor Sugar Beets backup from 4-26-10
April 26, 2010
- Page 1 -
1. OVERALL PROCESS DATA
Annual Operating Time 8,000.00hAnnual Throughput 0.00kg MPOperating Days per Year 333.33MP = Main Product = Undefined
A4

- Page 2 -
2.1 STARTING MATERIAL REQUIREMENTS (per Section)
Section Starting Material Active Product
AmountNeeded
(kgSin/kg
MP)
MolarYield
(%)
MassYield
(%)
GrossMassYield
(%)
Sugar Beets Simulation (none) (none) Unknown Unknown Unknown Unknown
Sin = Section Starting Material, Aout = Section Active Product
2.2 BULK MATERIALS (Entire Process)
Material kg/yr kg/h kg/kg MP1,1,2-TriChEth 671,999,934 83,999.992Ethyl Alcohol 4,966,080 620.760Water 2,191,264,106 273,908.013Inert Solids 67,199,993 8,399.999Sucrose 241,919,976 30,239.997Ca Hydroxide 26,879,997 3,360.000Carb. Dioxide 21,680,000 2,710.000Yeast 6,720 0.840TOTAL 3,225,916,806 403,239.601
A5
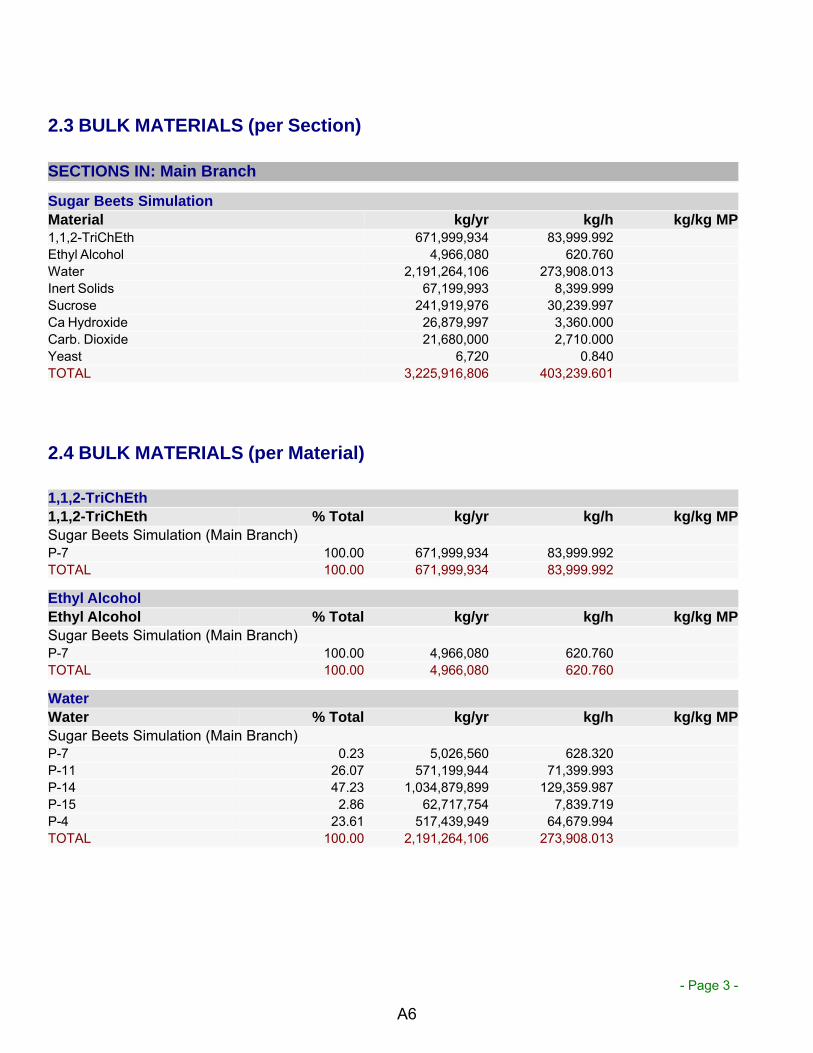
- Page 3 -
2.3 BULK MATERIALS (per Section)
SECTIONS IN: Main Branch
Sugar Beets Simulation
Material kg/yr kg/h kg/kg MP1,1,2-TriChEth 671,999,934 83,999.992Ethyl Alcohol 4,966,080 620.760Water 2,191,264,106 273,908.013Inert Solids 67,199,993 8,399.999Sucrose 241,919,976 30,239.997Ca Hydroxide 26,879,997 3,360.000Carb. Dioxide 21,680,000 2,710.000Yeast 6,720 0.840TOTAL 3,225,916,806 403,239.601
2.4 BULK MATERIALS (per Material)
1,1,2-TriChEth
1,1,2-TriChEth % Total kg/yr kg/h kg/kg MP
Sugar Beets Simulation (Main Branch)P-7 100.00 671,999,934 83,999.992TOTAL 100.00 671,999,934 83,999.992
Ethyl Alcohol
Ethyl Alcohol % Total kg/yr kg/h kg/kg MP
Sugar Beets Simulation (Main Branch)P-7 100.00 4,966,080 620.760TOTAL 100.00 4,966,080 620.760
Water
Water % Total kg/yr kg/h kg/kg MP
Sugar Beets Simulation (Main Branch)P-7 0.23 5,026,560 628.320P-11 26.07 571,199,944 71,399.993P-14 47.23 1,034,879,899 129,359.987P-15 2.86 62,717,754 7,839.719P-4 23.61 517,439,949 64,679.994TOTAL 100.00 2,191,264,106 273,908.013
A6
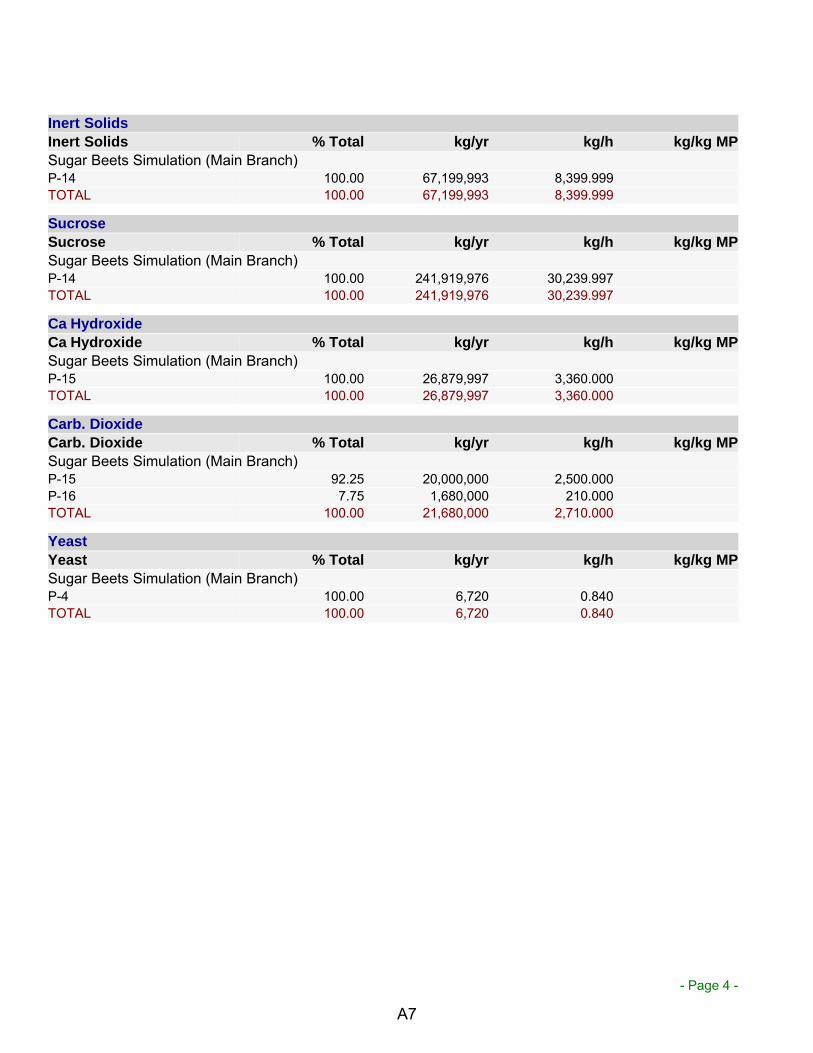
- Page 4 -
Inert Solids
Inert Solids % Total kg/yr kg/h kg/kg MP
Sugar Beets Simulation (Main Branch)P-14 100.00 67,199,993 8,399.999TOTAL 100.00 67,199,993 8,399.999
Sucrose
Sucrose % Total kg/yr kg/h kg/kg MP
Sugar Beets Simulation (Main Branch)P-14 100.00 241,919,976 30,239.997TOTAL 100.00 241,919,976 30,239.997
Ca Hydroxide
Ca Hydroxide % Total kg/yr kg/h kg/kg MP
Sugar Beets Simulation (Main Branch)P-15 100.00 26,879,997 3,360.000TOTAL 100.00 26,879,997 3,360.000
Carb. Dioxide
Carb. Dioxide % Total kg/yr kg/h kg/kg MP
Sugar Beets Simulation (Main Branch)P-15 92.25 20,000,000 2,500.000P-16 7.75 1,680,000 210.000TOTAL 100.00 21,680,000 2,710.000
Yeast
Yeast % Total kg/yr kg/h kg/kg MP
Sugar Beets Simulation (Main Branch)P-4 100.00 6,720 0.840TOTAL 100.00 6,720 0.840
A7
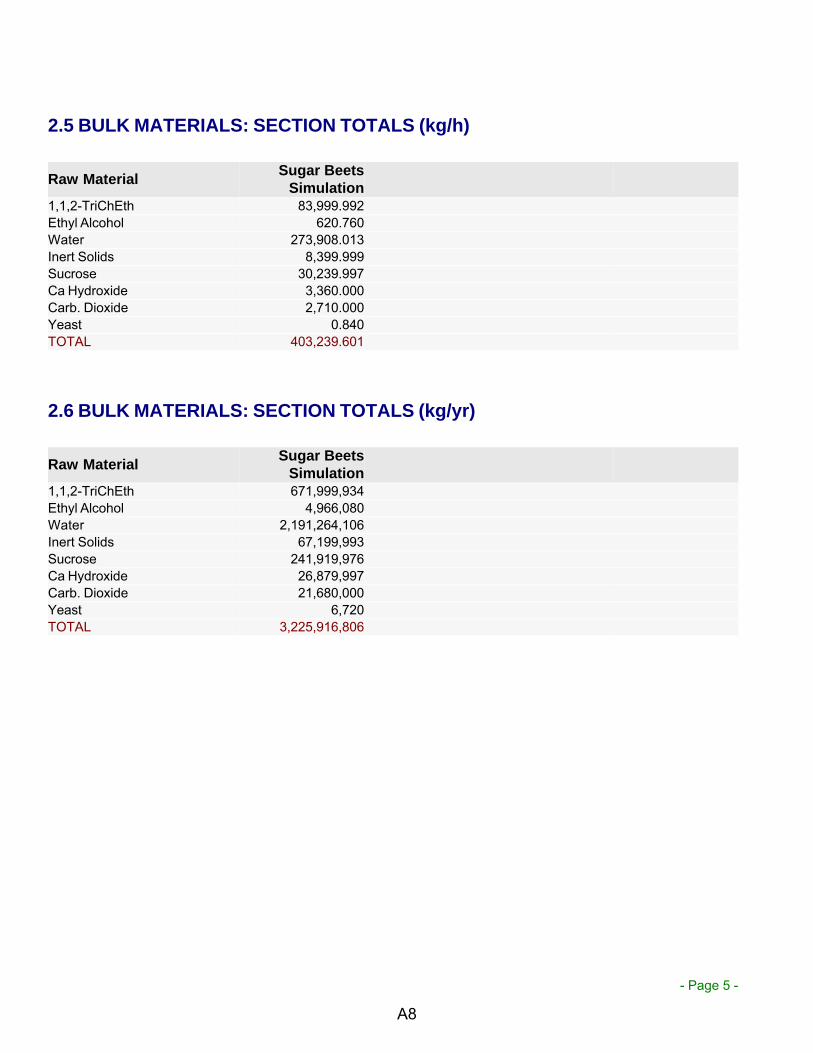
- Page 5 -
2.5 BULK MATERIALS: SECTION TOTALS (kg/h)
Raw MaterialSugar Beets
Simulation1,1,2-TriChEth 83,999.992Ethyl Alcohol 620.760Water 273,908.013Inert Solids 8,399.999Sucrose 30,239.997Ca Hydroxide 3,360.000Carb. Dioxide 2,710.000Yeast 0.840TOTAL 403,239.601
2.6 BULK MATERIALS: SECTION TOTALS (kg/yr)
Raw MaterialSugar Beets
Simulation1,1,2-TriChEth 671,999,934Ethyl Alcohol 4,966,080Water 2,191,264,106Inert Solids 67,199,993Sucrose 241,919,976Ca Hydroxide 26,879,997Carb. Dioxide 21,680,000Yeast 6,720TOTAL 3,225,916,806
A8
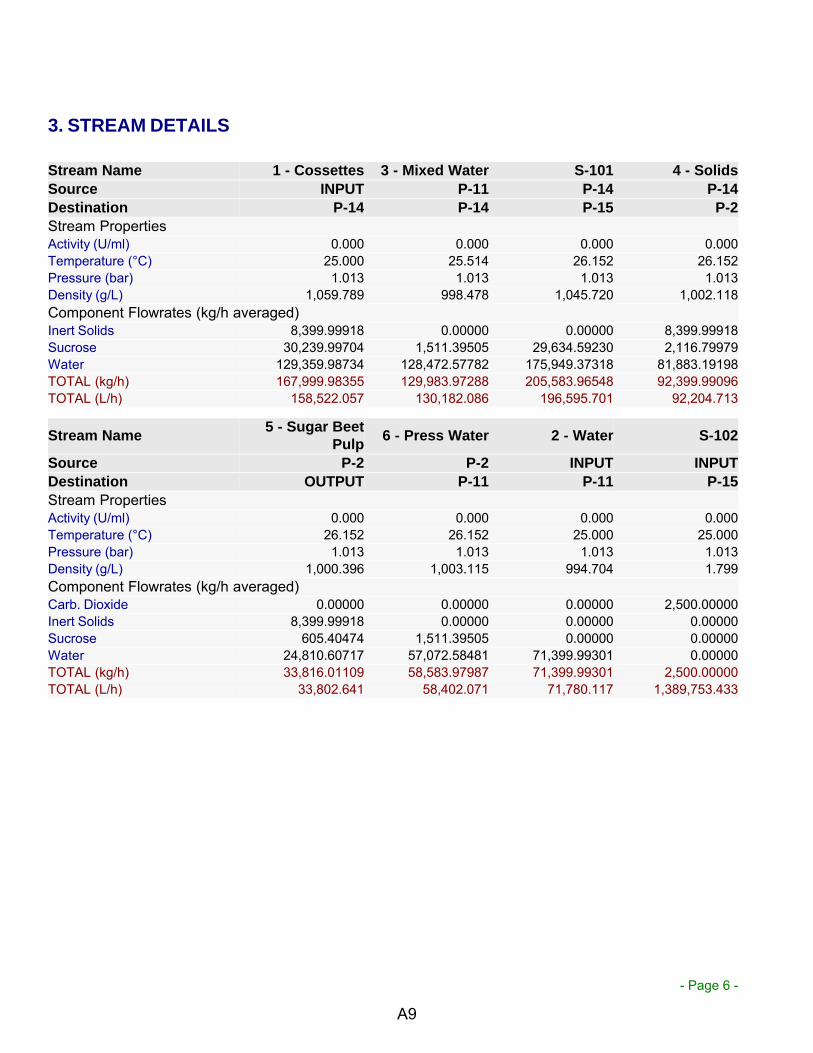
- Page 6 -
3. STREAM DETAILS
Stream Name 1 - Cossettes 3 - Mixed Water S-101 4 - Solids
Source INPUT P-11 P-14 P-14
Destination P-14 P-14 P-15 P-2
Stream PropertiesActivity (U/ml) 0.000 0.000 0.000 0.000Temperature (°C) 25.000 25.514 26.152 26.152Pressure (bar) 1.013 1.013 1.013 1.013Density (g/L) 1,059.789 998.478 1,045.720 1,002.118Component Flowrates (kg/h averaged)Inert Solids 8,399.99918 0.00000 0.00000 8,399.99918Sucrose 30,239.99704 1,511.39505 29,634.59230 2,116.79979Water 129,359.98734 128,472.57782 175,949.37318 81,883.19198TOTAL (kg/h) 167,999.98355 129,983.97288 205,583.96548 92,399.99096TOTAL (L/h) 158,522.057 130,182.086 196,595.701 92,204.713
Stream Name5 - Sugar Beet
Pulp6 - Press Water 2 - Water S-102
Source P-2 P-2 INPUT INPUT
Destination OUTPUT P-11 P-11 P-15
Stream PropertiesActivity (U/ml) 0.000 0.000 0.000 0.000Temperature (°C) 26.152 26.152 25.000 25.000Pressure (bar) 1.013 1.013 1.013 1.013Density (g/L) 1,000.396 1,003.115 994.704 1.799Component Flowrates (kg/h averaged)Carb. Dioxide 0.00000 0.00000 0.00000 2,500.00000Inert Solids 8,399.99918 0.00000 0.00000 0.00000Sucrose 605.40474 1,511.39505 0.00000 0.00000Water 24,810.60717 57,072.58481 71,399.99301 0.00000TOTAL (kg/h) 33,816.01109 58,583.97987 71,399.99301 2,500.00000TOTAL (L/h) 33,802.641 58,402.071 71,780.117 1,389,753.433
A9
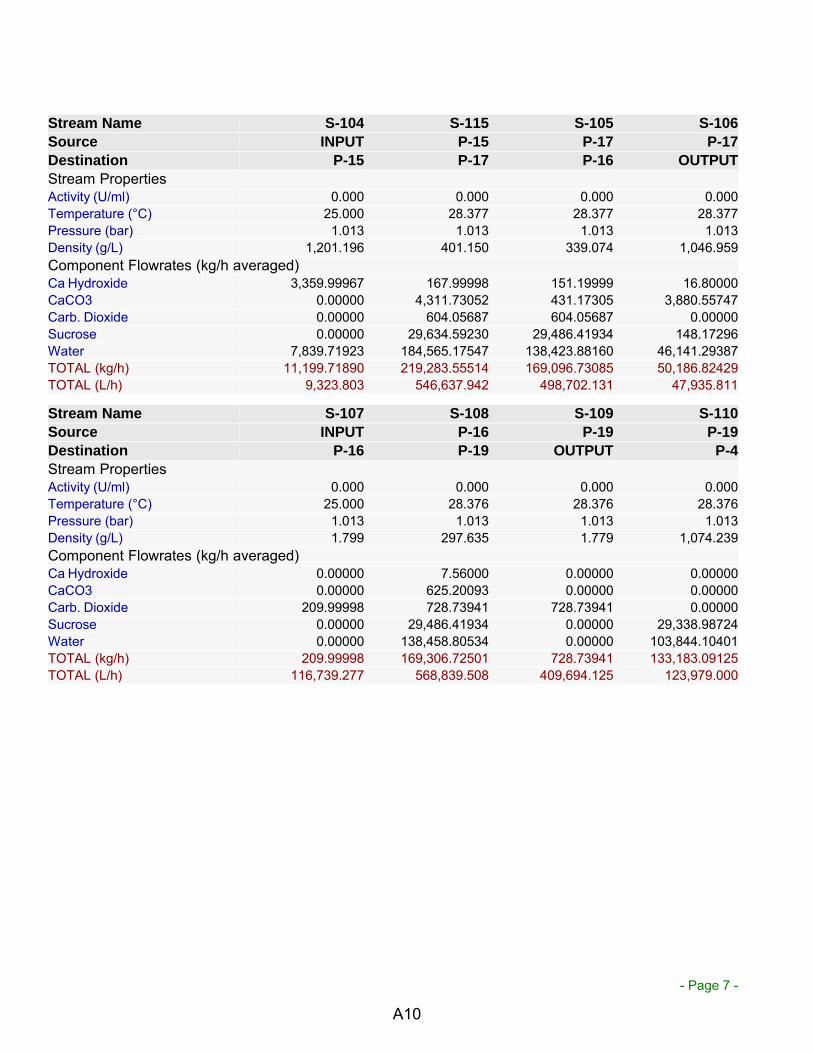
- Page 7 -
Stream Name S-104 S-115 S-105 S-106
Source INPUT P-15 P-17 P-17
Destination P-15 P-17 P-16 OUTPUT
Stream PropertiesActivity (U/ml) 0.000 0.000 0.000 0.000Temperature (°C) 25.000 28.377 28.377 28.377Pressure (bar) 1.013 1.013 1.013 1.013Density (g/L) 1,201.196 401.150 339.074 1,046.959Component Flowrates (kg/h averaged)Ca Hydroxide 3,359.99967 167.99998 151.19999 16.80000CaCO3 0.00000 4,311.73052 431.17305 3,880.55747Carb. Dioxide 0.00000 604.05687 604.05687 0.00000Sucrose 0.00000 29,634.59230 29,486.41934 148.17296Water 7,839.71923 184,565.17547 138,423.88160 46,141.29387TOTAL (kg/h) 11,199.71890 219,283.55514 169,096.73085 50,186.82429TOTAL (L/h) 9,323.803 546,637.942 498,702.131 47,935.811
Stream Name S-107 S-108 S-109 S-110
Source INPUT P-16 P-19 P-19
Destination P-16 P-19 OUTPUT P-4
Stream PropertiesActivity (U/ml) 0.000 0.000 0.000 0.000Temperature (°C) 25.000 28.376 28.376 28.376Pressure (bar) 1.013 1.013 1.013 1.013Density (g/L) 1.799 297.635 1.779 1,074.239Component Flowrates (kg/h averaged)Ca Hydroxide 0.00000 7.56000 0.00000 0.00000CaCO3 0.00000 625.20093 0.00000 0.00000Carb. Dioxide 209.99998 728.73941 728.73941 0.00000Sucrose 0.00000 29,486.41934 0.00000 29,338.98724Water 0.00000 138,458.80534 0.00000 103,844.10401TOTAL (kg/h) 209.99998 169,306.72501 728.73941 133,183.09125TOTAL (L/h) 116,739.277 568,839.508 409,694.125 123,979.000
A10
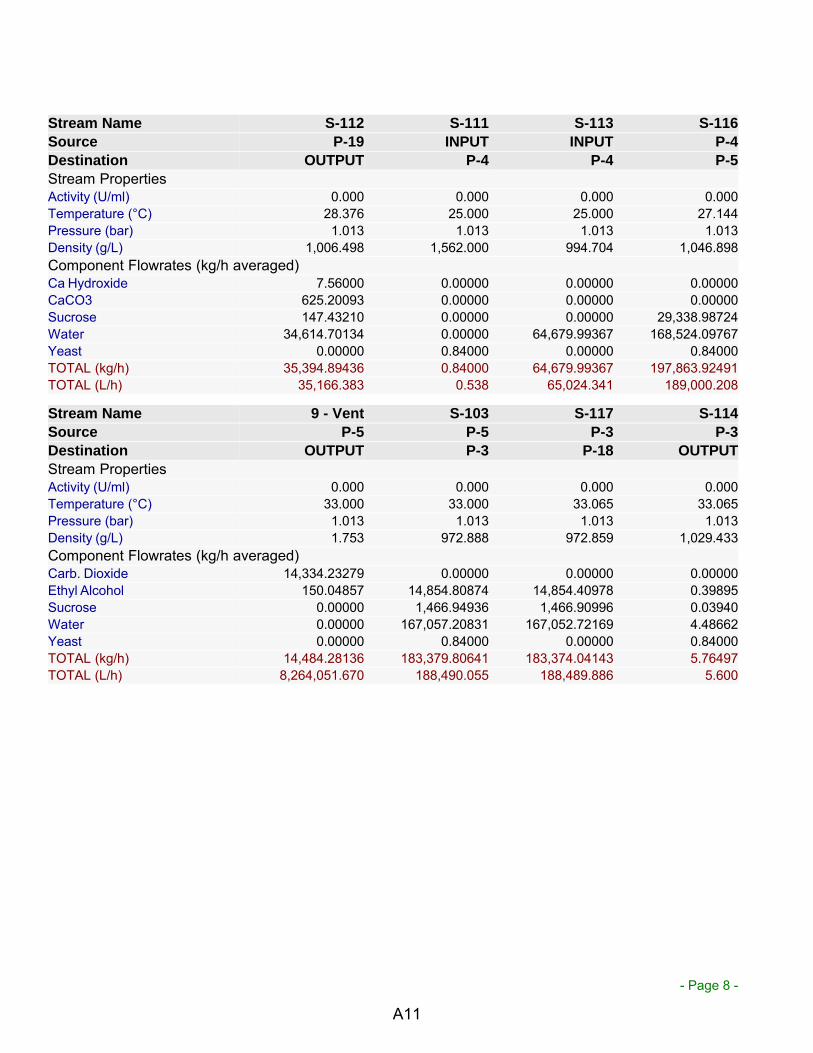
- Page 8 -
Stream Name S-112 S-111 S-113 S-116
Source P-19 INPUT INPUT P-4
Destination OUTPUT P-4 P-4 P-5
Stream PropertiesActivity (U/ml) 0.000 0.000 0.000 0.000Temperature (°C) 28.376 25.000 25.000 27.144Pressure (bar) 1.013 1.013 1.013 1.013Density (g/L) 1,006.498 1,562.000 994.704 1,046.898Component Flowrates (kg/h averaged)Ca Hydroxide 7.56000 0.00000 0.00000 0.00000CaCO3 625.20093 0.00000 0.00000 0.00000Sucrose 147.43210 0.00000 0.00000 29,338.98724Water 34,614.70134 0.00000 64,679.99367 168,524.09767Yeast 0.00000 0.84000 0.00000 0.84000TOTAL (kg/h) 35,394.89436 0.84000 64,679.99367 197,863.92491TOTAL (L/h) 35,166.383 0.538 65,024.341 189,000.208
Stream Name 9 - Vent S-103 S-117 S-114
Source P-5 P-5 P-3 P-3
Destination OUTPUT P-3 P-18 OUTPUT
Stream PropertiesActivity (U/ml) 0.000 0.000 0.000 0.000Temperature (°C) 33.000 33.000 33.065 33.065Pressure (bar) 1.013 1.013 1.013 1.013Density (g/L) 1.753 972.888 972.859 1,029.433Component Flowrates (kg/h averaged)Carb. Dioxide 14,334.23279 0.00000 0.00000 0.00000Ethyl Alcohol 150.04857 14,854.80874 14,854.40978 0.39895Sucrose 0.00000 1,466.94936 1,466.90996 0.03940Water 0.00000 167,057.20831 167,052.72169 4.48662Yeast 0.00000 0.84000 0.00000 0.84000TOTAL (kg/h) 14,484.28136 183,379.80641 183,374.04143 5.76497TOTAL (L/h) 8,264,051.670 188,490.055 188,489.886 5.600
A11
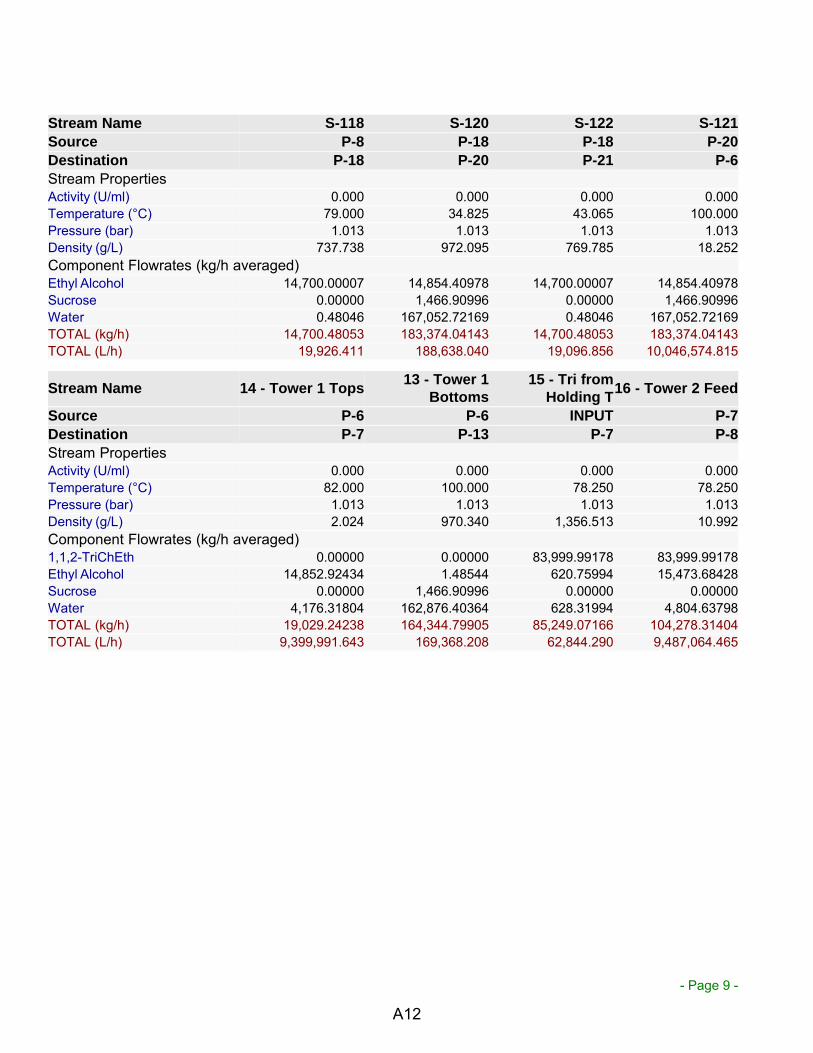
- Page 9 -
Stream Name S-118 S-120 S-122 S-121
Source P-8 P-18 P-18 P-20
Destination P-18 P-20 P-21 P-6
Stream PropertiesActivity (U/ml) 0.000 0.000 0.000 0.000Temperature (°C) 79.000 34.825 43.065 100.000Pressure (bar) 1.013 1.013 1.013 1.013Density (g/L) 737.738 972.095 769.785 18.252Component Flowrates (kg/h averaged)Ethyl Alcohol 14,700.00007 14,854.40978 14,700.00007 14,854.40978Sucrose 0.00000 1,466.90996 0.00000 1,466.90996Water 0.48046 167,052.72169 0.48046 167,052.72169TOTAL (kg/h) 14,700.48053 183,374.04143 14,700.48053 183,374.04143TOTAL (L/h) 19,926.411 188,638.040 19,096.856 10,046,574.815
Stream Name 14 - Tower 1 Tops13 - Tower 1
Bottoms15 - Tri from
Holding T16 - Tower 2 Feed
Source P-6 P-6 INPUT P-7
Destination P-7 P-13 P-7 P-8
Stream PropertiesActivity (U/ml) 0.000 0.000 0.000 0.000Temperature (°C) 82.000 100.000 78.250 78.250Pressure (bar) 1.013 1.013 1.013 1.013Density (g/L) 2.024 970.340 1,356.513 10.992Component Flowrates (kg/h averaged)1,1,2-TriChEth 0.00000 0.00000 83,999.99178 83,999.99178Ethyl Alcohol 14,852.92434 1.48544 620.75994 15,473.68428Sucrose 0.00000 1,466.90996 0.00000 0.00000Water 4,176.31804 162,876.40364 628.31994 4,804.63798TOTAL (kg/h) 19,029.24238 164,344.79905 85,249.07166 104,278.31404TOTAL (L/h) 9,399,991.643 169,368.208 62,844.290 9,487,064.465
A12
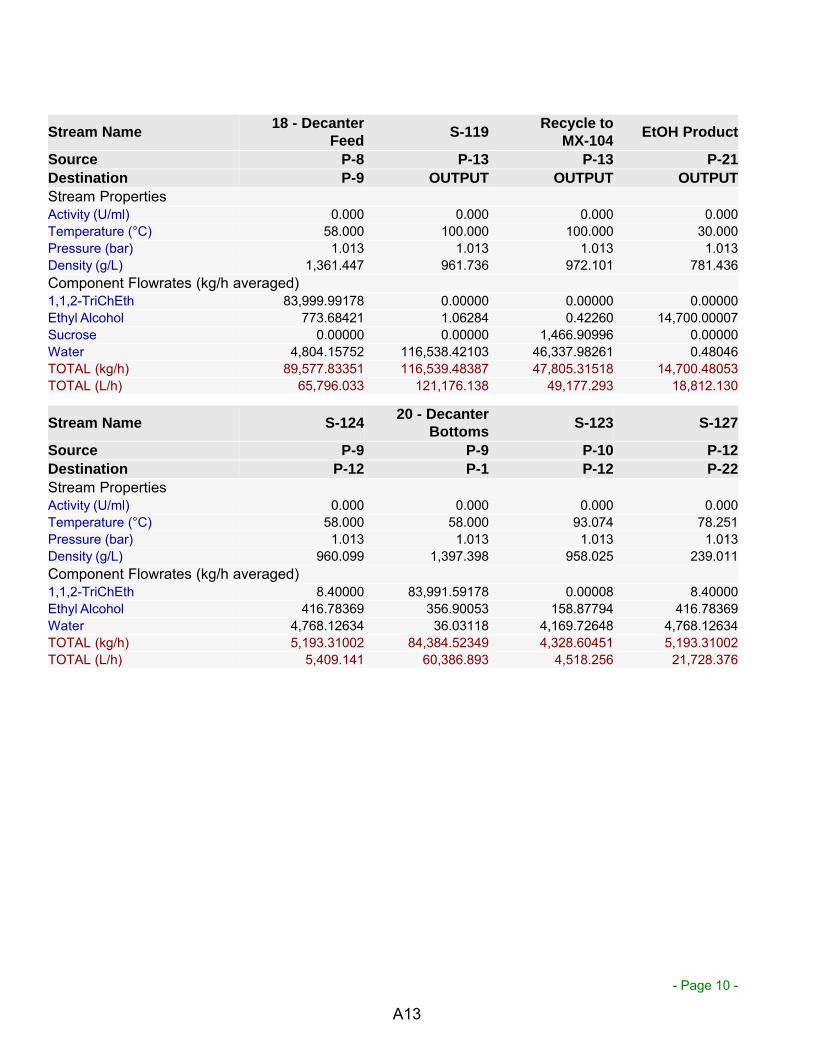
- Page 10 -
Stream Name18 - Decanter
FeedS-119
Recycle toMX-104
EtOH Product
Source P-8 P-13 P-13 P-21
Destination P-9 OUTPUT OUTPUT OUTPUT
Stream PropertiesActivity (U/ml) 0.000 0.000 0.000 0.000Temperature (°C) 58.000 100.000 100.000 30.000Pressure (bar) 1.013 1.013 1.013 1.013Density (g/L) 1,361.447 961.736 972.101 781.436Component Flowrates (kg/h averaged)1,1,2-TriChEth 83,999.99178 0.00000 0.00000 0.00000Ethyl Alcohol 773.68421 1.06284 0.42260 14,700.00007Sucrose 0.00000 0.00000 1,466.90996 0.00000Water 4,804.15752 116,538.42103 46,337.98261 0.48046TOTAL (kg/h) 89,577.83351 116,539.48387 47,805.31518 14,700.48053TOTAL (L/h) 65,796.033 121,176.138 49,177.293 18,812.130
Stream Name S-12420 - Decanter
BottomsS-123 S-127
Source P-9 P-9 P-10 P-12
Destination P-12 P-1 P-12 P-22
Stream PropertiesActivity (U/ml) 0.000 0.000 0.000 0.000Temperature (°C) 58.000 58.000 93.074 78.251Pressure (bar) 1.013 1.013 1.013 1.013Density (g/L) 960.099 1,397.398 958.025 239.011Component Flowrates (kg/h averaged)1,1,2-TriChEth 8.40000 83,991.59178 0.00008 8.40000Ethyl Alcohol 416.78369 356.90053 158.87794 416.78369Water 4,768.12634 36.03118 4,169.72648 4,768.12634TOTAL (kg/h) 5,193.31002 84,384.52349 4,328.60451 5,193.31002TOTAL (L/h) 5,409.141 60,386.893 4,518.256 21,728.376
A13
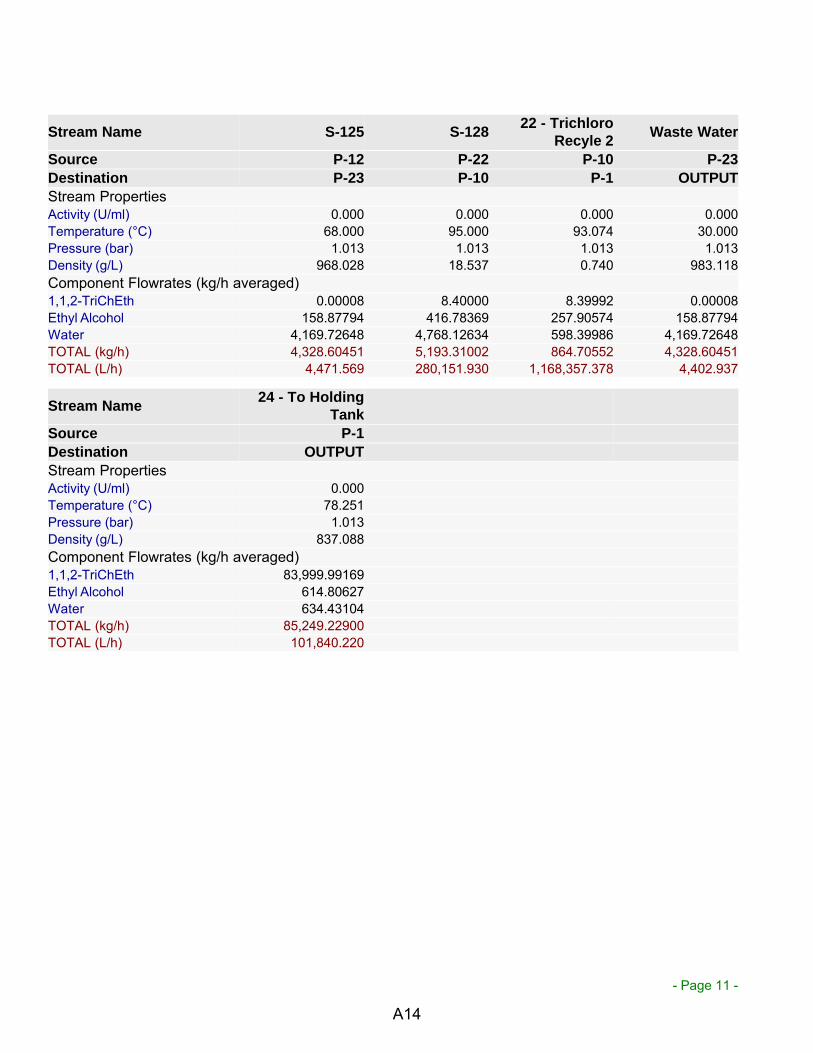
- Page 11 -
Stream Name S-125 S-12822 - Trichloro
Recyle 2Waste Water
Source P-12 P-22 P-10 P-23
Destination P-23 P-10 P-1 OUTPUT
Stream PropertiesActivity (U/ml) 0.000 0.000 0.000 0.000Temperature (°C) 68.000 95.000 93.074 30.000Pressure (bar) 1.013 1.013 1.013 1.013Density (g/L) 968.028 18.537 0.740 983.118Component Flowrates (kg/h averaged)1,1,2-TriChEth 0.00008 8.40000 8.39992 0.00008Ethyl Alcohol 158.87794 416.78369 257.90574 158.87794Water 4,169.72648 4,768.12634 598.39986 4,169.72648TOTAL (kg/h) 4,328.60451 5,193.31002 864.70552 4,328.60451TOTAL (L/h) 4,471.569 280,151.930 1,168,357.378 4,402.937
Stream Name24 - To Holding
Tank
Source P-1
Destination OUTPUT
Stream PropertiesActivity (U/ml) 0.000Temperature (°C) 78.251Pressure (bar) 1.013Density (g/L) 837.088Component Flowrates (kg/h averaged)1,1,2-TriChEth 83,999.99169Ethyl Alcohol 614.80627Water 634.43104TOTAL (kg/h) 85,249.22900TOTAL (L/h) 101,840.220
A14

- Page 12 -
4. OVERALL COMPONENT BALANCE (kg/yr)
COMPONENT IN OUT OUT-IN1,1,2-TriChEth 671,999,934 671,999,934 - 0Ca Hydroxide 26,879,997 194,880 - 26,685,117CaCO3 0 36,046,067 36,046,067Carb. Dioxide 21,680,000 120,503,778 98,823,778Ethyl Alcohol 4,966,080 125,004,938 120,038,858Inert Solids 67,199,993 67,199,993 - 0Sucrose 241,919,976 18,943,673 - 222,976,303Water 2,191,264,106 2,186,017,045 - 5,247,061Yeast 6,720 6,720 0TOTAL 3,225,916,806 3,225,917,029 222
A15

- Page 13 -
5. EQUIPMENT CONTENTS
This section will be skipped (overall process is continuous)
A16
11. Appendix D – Sugar Beets Economic Evaluation Report from SuperPro Designer
A17
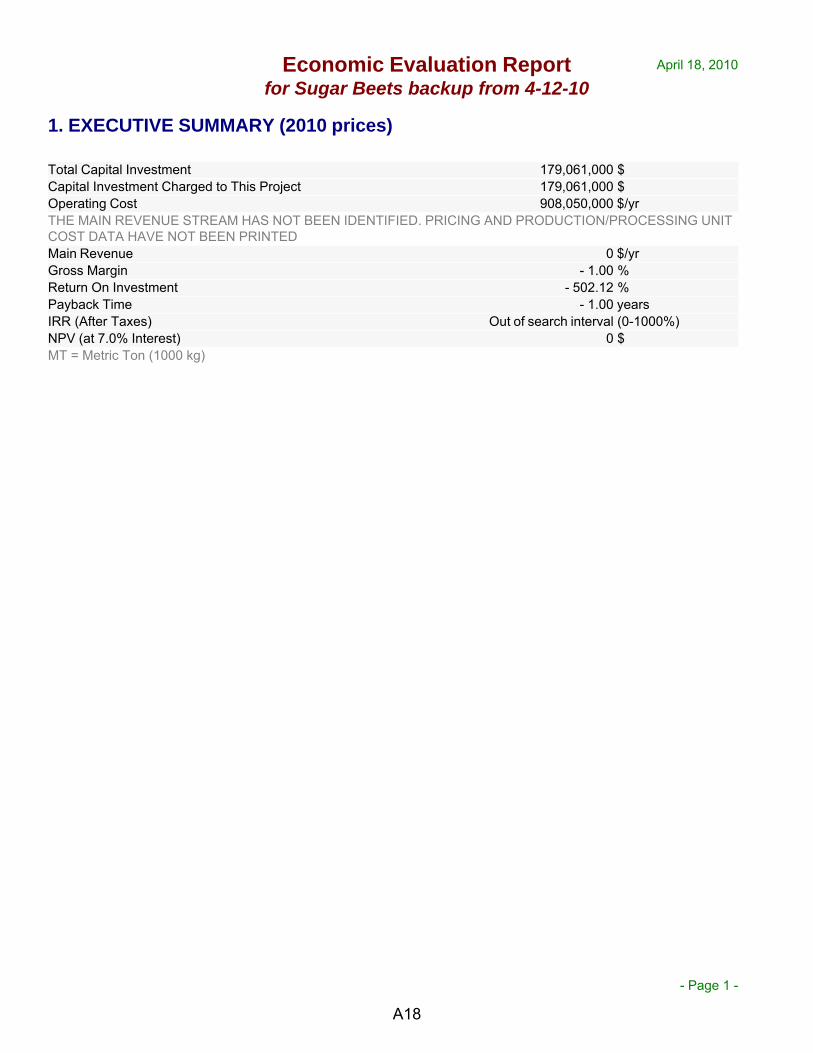
Economic Evaluation Reportfor Sugar Beets backup from 4-12-10
April 18, 2010
- Page 1 -
1. EXECUTIVE SUMMARY (2010 prices)
Total Capital Investment 179,061,000 $Capital Investment Charged to This Project 179,061,000 $Operating Cost 908,050,000 $/yrTHE MAIN REVENUE STREAM HAS NOT BEEN IDENTIFIED. PRICING AND PRODUCTION/PROCESSING UNITCOST DATA HAVE NOT BEEN PRINTEDMain Revenue 0 $/yrGross Margin - 1.00 %Return On Investment - 502.12 %Payback Time - 1.00 yearsIRR (After Taxes) Out of search interval (0-1000%)NPV (at 7.0% Interest) 0 $MT = Metric Ton (1000 kg)
A18
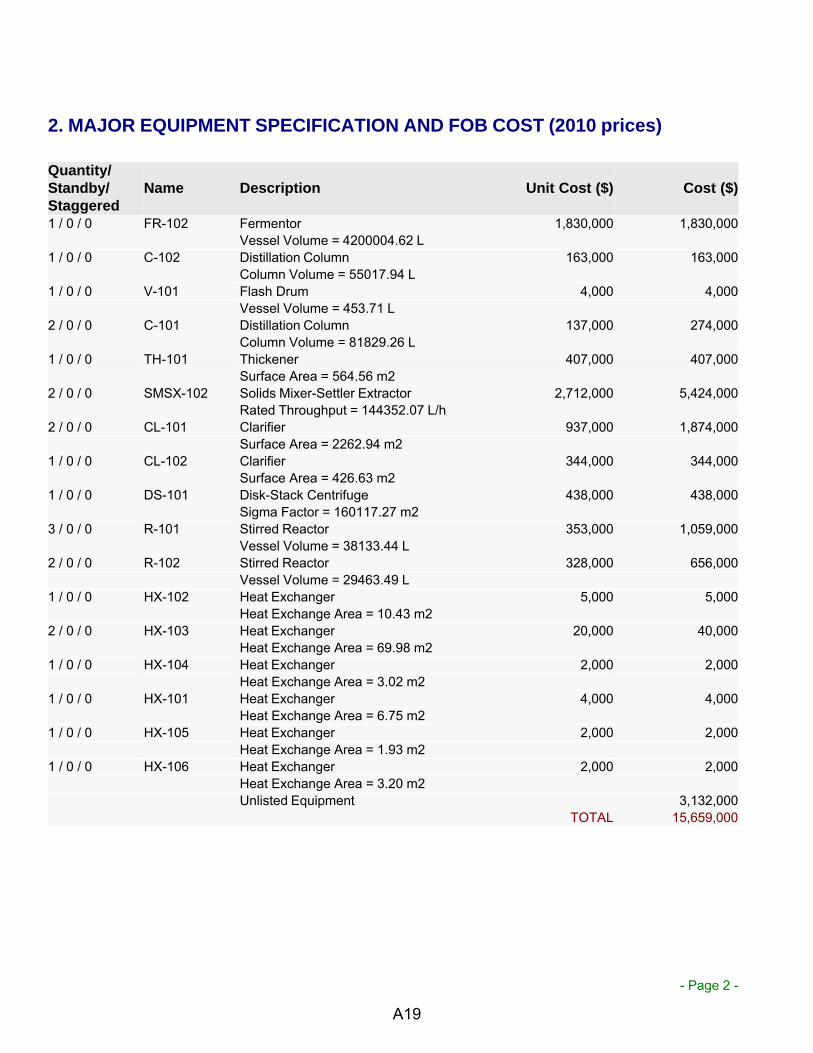
- Page 2 -
2. MAJOR EQUIPMENT SPECIFICATION AND FOB COST (2010 prices)
Quantity/Standby/Staggered
Name Description Unit Cost ($) Cost ($)
1 / 0 / 0 FR-102 Fermentor 1,830,000 1,830,000Vessel Volume = 4200004.62 L
1 / 0 / 0 C-102 Distillation Column 163,000 163,000Column Volume = 55017.94 L
1 / 0 / 0 V-101 Flash Drum 4,000 4,000Vessel Volume = 453.71 L
2 / 0 / 0 C-101 Distillation Column 137,000 274,000Column Volume = 81829.26 L
1 / 0 / 0 TH-101 Thickener 407,000 407,000Surface Area = 564.56 m2
2 / 0 / 0 SMSX-102 Solids Mixer-Settler Extractor 2,712,000 5,424,000Rated Throughput = 144352.07 L/h
2 / 0 / 0 CL-101 Clarifier 937,000 1,874,000Surface Area = 2262.94 m2
1 / 0 / 0 CL-102 Clarifier 344,000 344,000Surface Area = 426.63 m2
1 / 0 / 0 DS-101 Disk-Stack Centrifuge 438,000 438,000Sigma Factor = 160117.27 m2
3 / 0 / 0 R-101 Stirred Reactor 353,000 1,059,000Vessel Volume = 38133.44 L
2 / 0 / 0 R-102 Stirred Reactor 328,000 656,000Vessel Volume = 29463.49 L
1 / 0 / 0 HX-102 Heat Exchanger 5,000 5,000Heat Exchange Area = 10.43 m2
2 / 0 / 0 HX-103 Heat Exchanger 20,000 40,000Heat Exchange Area = 69.98 m2
1 / 0 / 0 HX-104 Heat Exchanger 2,000 2,000Heat Exchange Area = 3.02 m2
1 / 0 / 0 HX-101 Heat Exchanger 4,000 4,000Heat Exchange Area = 6.75 m2
1 / 0 / 0 HX-105 Heat Exchanger 2,000 2,000Heat Exchange Area = 1.93 m2
1 / 0 / 0 HX-106 Heat Exchanger 2,000 2,000Heat Exchange Area = 3.20 m2Unlisted Equipment 3,132,000
TOTAL 15,659,000
A19

- Page 3 -
3. FIXED CAPITAL ESTIMATE SUMMARY (2010 prices in $)
3A. Total Plant Direct Cost (TPDC) (physical cost)1. Equipment Purchase Cost 15,659,0002. Installation 6,115,0003. Process Piping 5,481,0004. Instrumentation 6,264,0005. Insulation 470,0006. Electrical 1,566,0007. Buildings 7,047,0008. Yard Improvement 2,349,0009. Auxiliary Facilities 6,264,000TPDC 51,214,000
3B. Total Plant Indirect Cost (TPIC)10. Engineering 12,803,00011. Construction 17,925,000TPIC 30,728,000
3C. Total Plant Cost (TPC = TPDC+TPIC)TPC 81,942,000
3D. Contractor's Fee & Contingency (CFC)12. Contractor's Fee 4,097,00013. Contingency 8,194,000CFC = 12+13 12,291,000
3E. Direct Fixed Capital Cost (DFC = TPC+CFC)DFC 94,233,000
A20
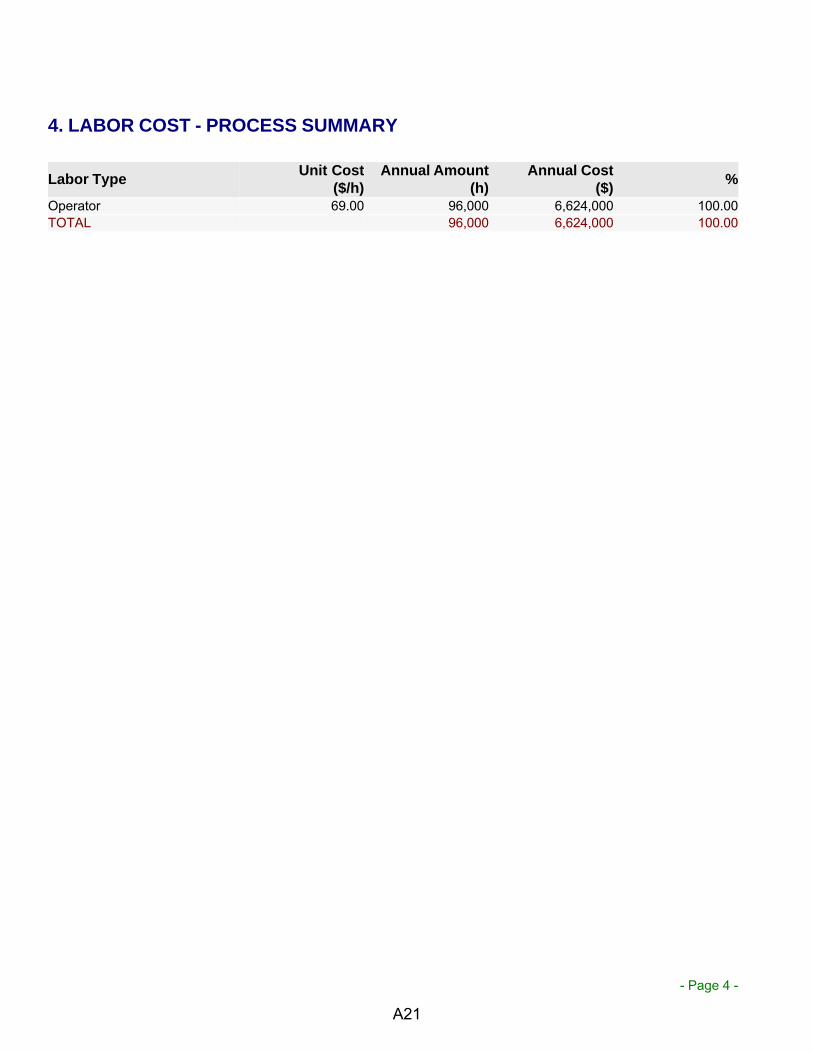
- Page 4 -
4. LABOR COST - PROCESS SUMMARY
Labor TypeUnit Cost
($/h)Annual Amount
(h)Annual Cost
($)%
Operator 69.00 96,000 6,624,000 100.00TOTAL 96,000 6,624,000 100.00
A21
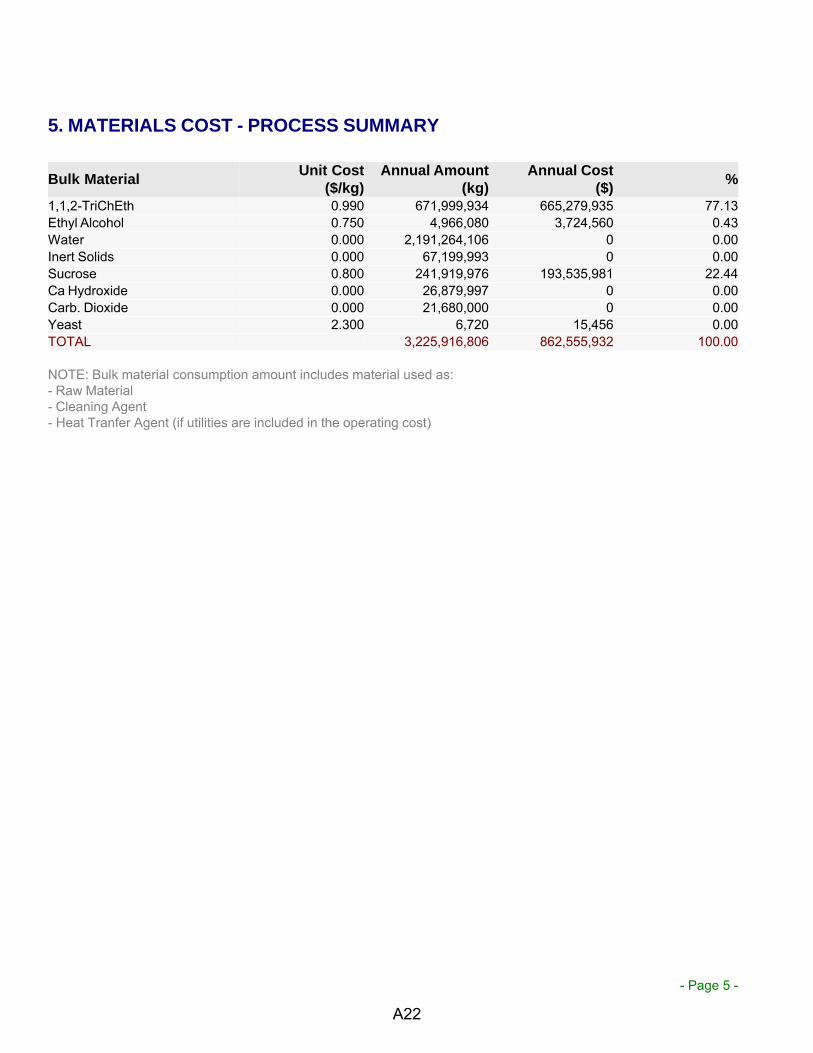
- Page 5 -
5. MATERIALS COST - PROCESS SUMMARY
Bulk MaterialUnit Cost
($/kg)Annual Amount
(kg)Annual Cost
($)%
1,1,2-TriChEth 0.990 671,999,934 665,279,935 77.13Ethyl Alcohol 0.750 4,966,080 3,724,560 0.43Water 0.000 2,191,264,106 0 0.00Inert Solids 0.000 67,199,993 0 0.00Sucrose 0.800 241,919,976 193,535,981 22.44Ca Hydroxide 0.000 26,879,997 0 0.00Carb. Dioxide 0.000 21,680,000 0 0.00Yeast 2.300 6,720 15,456 0.00TOTAL 3,225,916,806 862,555,932 100.00
NOTE: Bulk material consumption amount includes material used as:- Raw Material- Cleaning Agent- Heat Tranfer Agent (if utilities are included in the operating cost)
A22

- Page 6 -
6. VARIOUS CONSUMABLES COST (2010 prices) - PROCESS SUMMARY
THE CONSUMABLES COST IS ZERO.
A23

- Page 7 -
7. WASTE TREATMENT/DISPOSAL COST (2010 prices) - PROCESS SUMMARY
THE TOTAL WASTE TREATMENT/DISPOSAL COST IS ZERO.
A24

- Page 8 -
8. UTILITIES COST (2010 prices) - PROCESS SUMMARY
Utility Annual Amount Reference UnitsAnnual Cost
($)%
Electricity 9,619,990 kWh 961,999 4.58Steam 1,264,859,153 kg 15,178,310 72.30Steam (High P) 0 kg 0 0.00Cooling Water 93,595,250,084 kg 4,679,763 22.29Chilled Water 436,946,888 kg 174,779 0.83TOTAL 20,994,850 100.00
A25
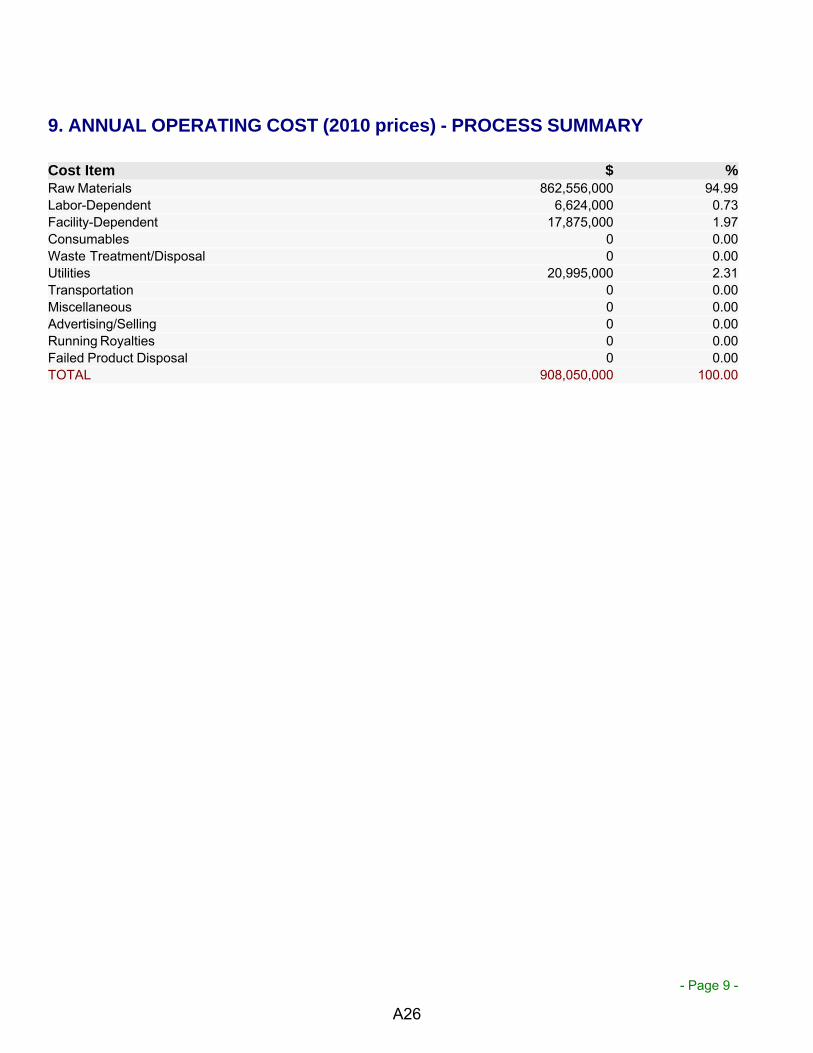
- Page 9 -
9. ANNUAL OPERATING COST (2010 prices) - PROCESS SUMMARY
Cost Item $ %Raw Materials 862,556,000 94.99Labor-Dependent 6,624,000 0.73Facility-Dependent 17,875,000 1.97Consumables 0 0.00Waste Treatment/Disposal 0 0.00Utilities 20,995,000 2.31Transportation 0 0.00Miscellaneous 0 0.00Advertising/Selling 0 0.00Running Royalties 0 0.00Failed Product Disposal 0 0.00TOTAL 908,050,000 100.00
A26

- Page 10 -
A27

Economic Evaluation Reportfor Sugar Beets backup from 4-18-10
April 18, 2010
- Page 1 -
1. EXECUTIVE SUMMARY (2010 prices)
Total Capital Investment 1,952,000 $Capital Investment Charged to This Project 1,952,000 $Operating Cost 2,328,000 $/yrTHE MAIN REVENUE STREAM HAS NOT BEEN IDENTIFIED. PRICING AND PRODUCTION/PROCESSING UNITCOST DATA HAVE NOT BEEN PRINTEDMain Revenue 0 $/yrGross Margin - 1.00 %Return On Investment - 111.02 %Payback Time - 1.00 yearsIRR (After Taxes) Out of search interval (0-1000%)NPV (at 7.0% Interest) 0 $MT = Metric Ton (1000 kg)
A28
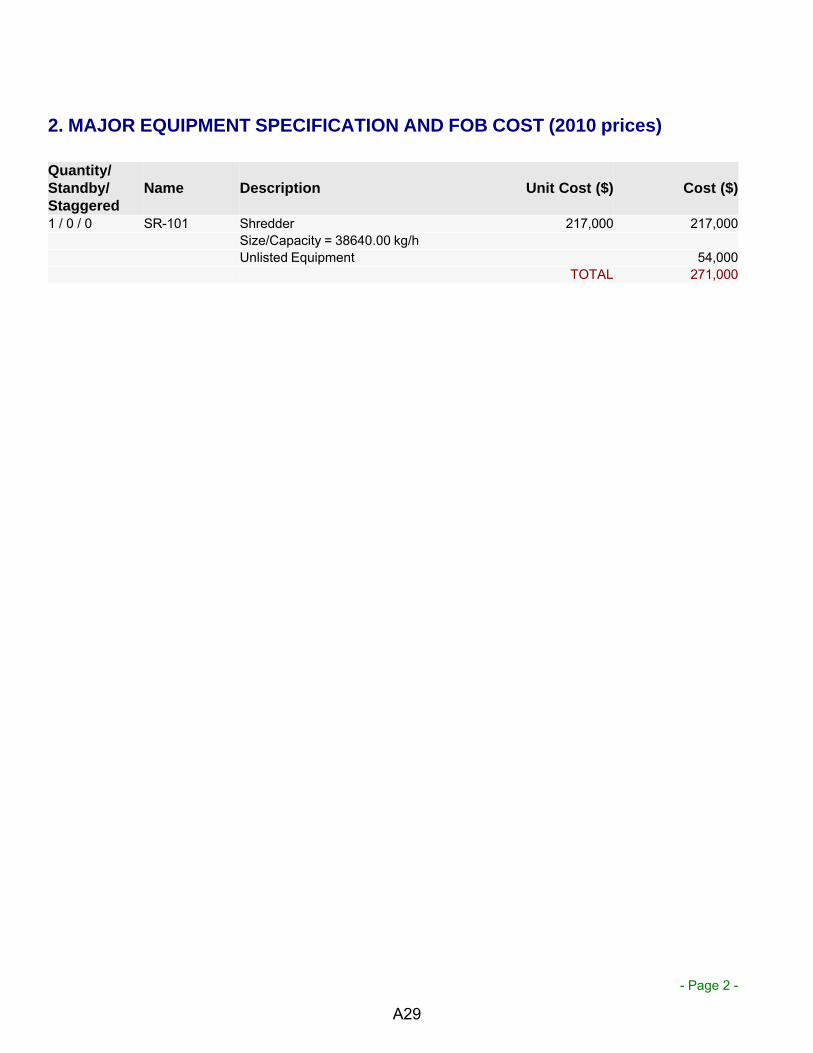
- Page 2 -
2. MAJOR EQUIPMENT SPECIFICATION AND FOB COST (2010 prices)
Quantity/Standby/Staggered
Name Description Unit Cost ($) Cost ($)
1 / 0 / 0 SR-101 Shredder 217,000 217,000Size/Capacity = 38640.00 kg/hUnlisted Equipment 54,000
TOTAL 271,000
A29

- Page 3 -
3. FIXED CAPITAL ESTIMATE SUMMARY (2010 prices in $)
3A. Total Plant Direct Cost (TPDC) (physical cost)1. Equipment Purchase Cost 271,0002. Installation 136,0003. Process Piping 95,0004. Instrumentation 109,0005. Insulation 8,0006. Electrical 27,0007. Buildings 122,0008. Yard Improvement 41,0009. Auxiliary Facilities 109,000TPDC 917,000
3B. Total Plant Indirect Cost (TPIC)10. Engineering 229,00011. Construction 321,000TPIC 550,000
3C. Total Plant Cost (TPC = TPDC+TPIC)TPC 1,467,000
3D. Contractor's Fee & Contingency (CFC)12. Contractor's Fee 73,00013. Contingency 147,000CFC = 12+13 220,000
3E. Direct Fixed Capital Cost (DFC = TPC+CFC)DFC 1,687,000
A30

- Page 4 -
4. LABOR COST - PROCESS SUMMARY
Labor TypeUnit Cost
($/h)Annual Amount
(h)Annual Cost
($)%
Operator 69.00 1,143 78,857 100.00TOTAL 1,143 78,857 100.00
A31
- Page 5 -
5. MATERIALS COST - PROCESS SUMMARY
THE COST OF ALL MATERIALS IS ZERO. PLEASE CHECK THE MATERIAL BALANCES AND THE PURCHASINGCOST OF RAW MATERIALS.
A32

- Page 6 -
6. VARIOUS CONSUMABLES COST (2010 prices) - PROCESS SUMMARY
THE CONSUMABLES COST IS ZERO.
A33
- Page 7 -
7. WASTE TREATMENT/DISPOSAL COST (2010 prices) - PROCESS SUMMARY
THE TOTAL WASTE TREATMENT/DISPOSAL COST IS ZERO.
A34
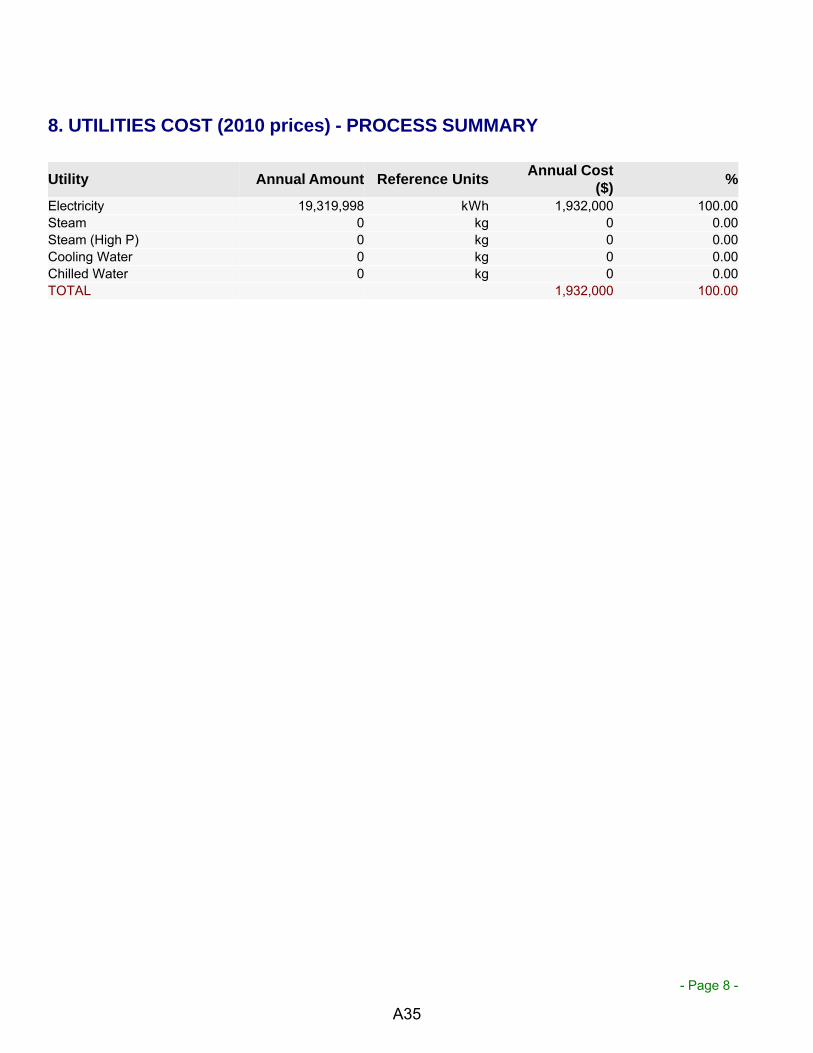
- Page 8 -
8. UTILITIES COST (2010 prices) - PROCESS SUMMARY
Utility Annual Amount Reference UnitsAnnual Cost
($)%
Electricity 19,319,998 kWh 1,932,000 100.00Steam 0 kg 0 0.00Steam (High P) 0 kg 0 0.00Cooling Water 0 kg 0 0.00Chilled Water 0 kg 0 0.00TOTAL 1,932,000 100.00
A35
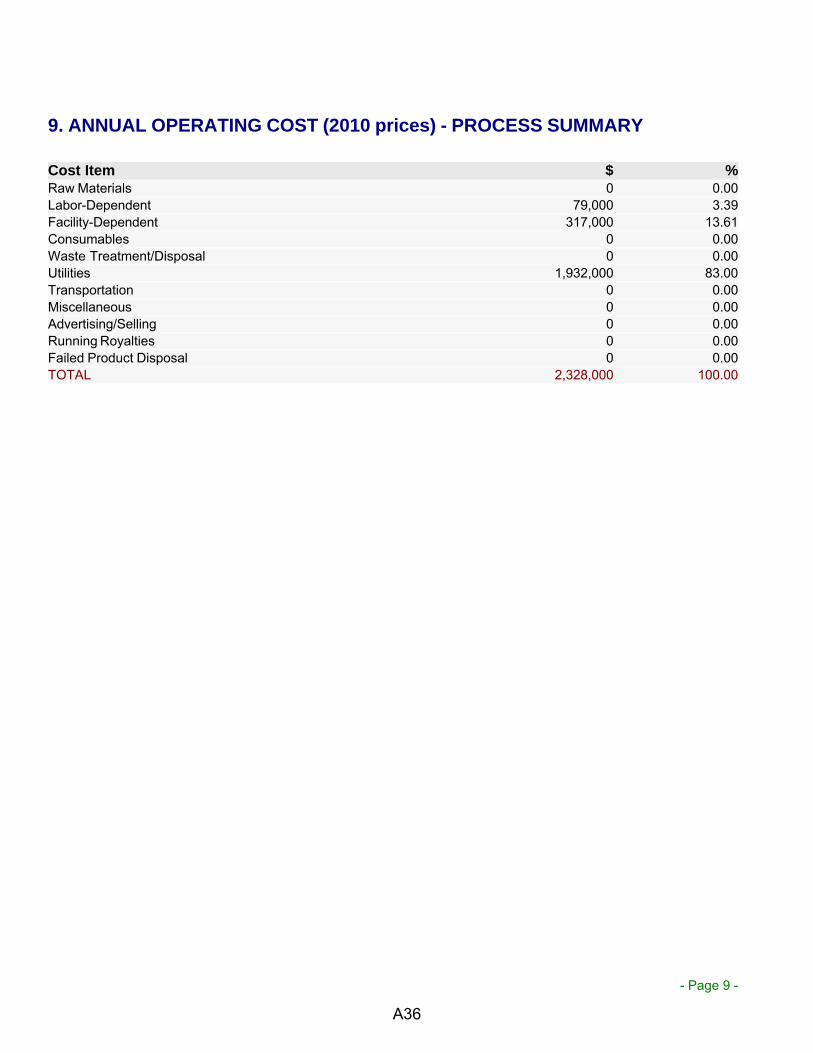
- Page 9 -
9. ANNUAL OPERATING COST (2010 prices) - PROCESS SUMMARY
Cost Item $ %Raw Materials 0 0.00Labor-Dependent 79,000 3.39Facility-Dependent 317,000 13.61Consumables 0 0.00Waste Treatment/Disposal 0 0.00Utilities 1,932,000 83.00Transportation 0 0.00Miscellaneous 0 0.00Advertising/Selling 0 0.00Running Royalties 0 0.00Failed Product Disposal 0 0.00TOTAL 2,328,000 100.00
A36

- Page 10 -
A37
13. Appendix E – Sugar Beets Aspen Simulation Data
A38

1-T1FEED
2-T1TOP
3-RECBEW
5-T2FEED6-T2TOP
7-T2BOTT
4-TRICHL 8-FLASHT
9-FLASHB
10-T3TOP
11-WASTE
B1
B2
B3
B6
B8
A39
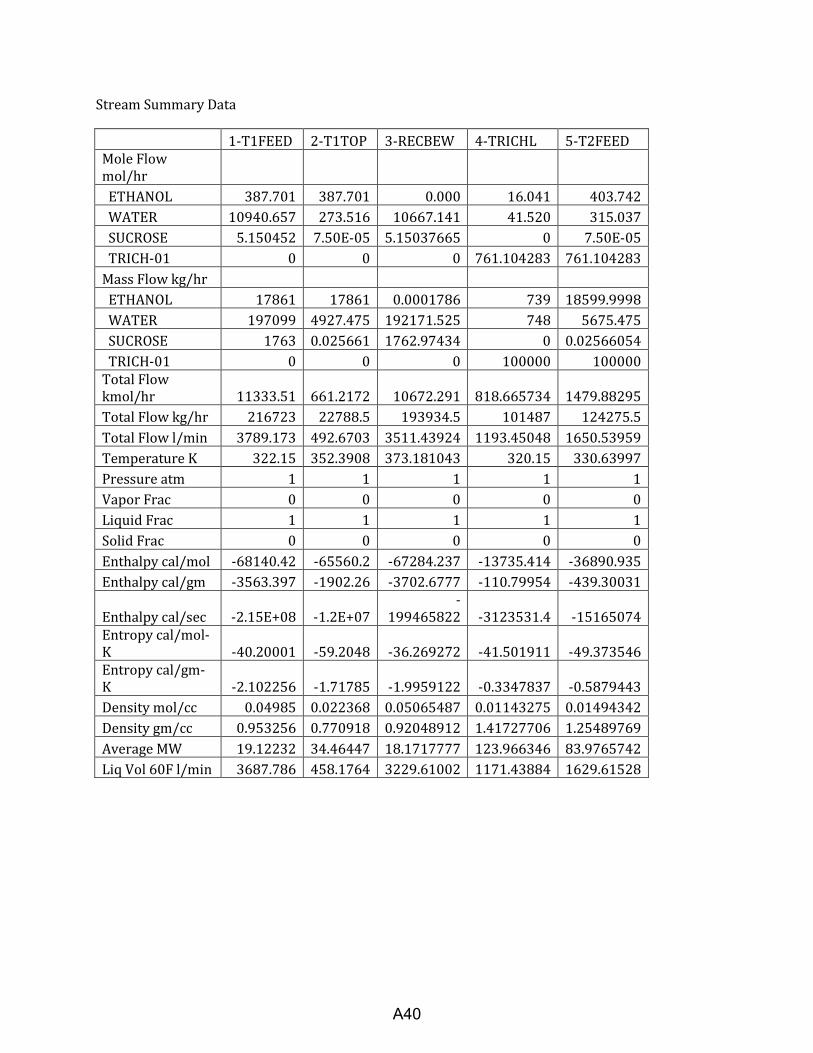
Stream Summary Data
1-T1FEED 2-T1TOP 3-RECBEW 4-TRICHL 5-T2FEED
Mole Flow mol/hr ETHANOL 387.701 387.701 0.000 16.041 403.742 WATER 10940.657 273.516 10667.141 41.520 315.037 SUCROSE 5.150452 7.50E-05 5.15037665 0 7.50E-05 TRICH-01 0 0 0 761.104283 761.104283 Mass Flow kg/hr ETHANOL 17861 17861 0.0001786 739 18599.9998 WATER 197099 4927.475 192171.525 748 5675.475 SUCROSE 1763 0.025661 1762.97434 0 0.02566054 TRICH-01 0 0 0 100000 100000 Total Flow kmol/hr 11333.51 661.2172 10672.291 818.665734 1479.88295 Total Flow kg/hr 216723 22788.5 193934.5 101487 124275.5 Total Flow l/min 3789.173 492.6703 3511.43924 1193.45048 1650.53959 Temperature K 322.15 352.3908 373.181043 320.15 330.63997 Pressure atm 1 1 1 1 1 Vapor Frac 0 0 0 0 0 Liquid Frac 1 1 1 1 1 Solid Frac 0 0 0 0 0 Enthalpy cal/mol -68140.42 -65560.2 -67284.237 -13735.414 -36890.935 Enthalpy cal/gm -3563.397 -1902.26 -3702.6777 -110.79954 -439.30031
Enthalpy cal/sec -2.15E+08 -1.2E+07 -
199465822 -3123531.4 -15165074 Entropy cal/mol-K -40.20001 -59.2048 -36.269272 -41.501911 -49.373546 Entropy cal/gm-K -2.102256 -1.71785 -1.9959122 -0.3347837 -0.5879443 Density mol/cc 0.04985 0.022368 0.05065487 0.01143275 0.01494342 Density gm/cc 0.953256 0.770918 0.92048912 1.41727706 1.25489769 Average MW 19.12232 34.46447 18.1717777 123.966346 83.9765742 Liq Vol 60F l/min 3687.786 458.1764 3229.61002 1171.43884 1629.61528
A40
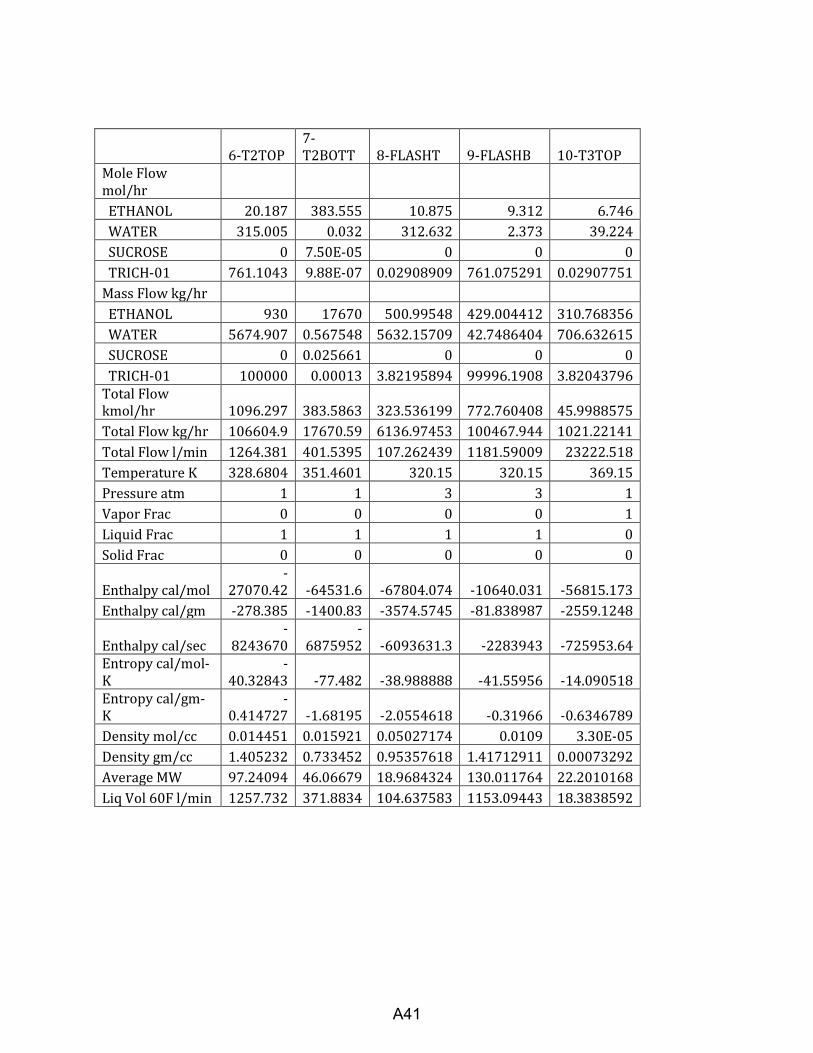
6-T2TOP
7-T2BOTT 8-FLASHT 9-FLASHB 10-T3TOP
Mole Flow mol/hr ETHANOL 20.187 383.555 10.875 9.312 6.746 WATER 315.005 0.032 312.632 2.373 39.224 SUCROSE 0 7.50E-05 0 0 0 TRICH-01 761.1043 9.88E-07 0.02908909 761.075291 0.02907751 Mass Flow kg/hr ETHANOL 930 17670 500.99548 429.004412 310.768356 WATER 5674.907 0.567548 5632.15709 42.7486404 706.632615 SUCROSE 0 0.025661 0 0 0 TRICH-01 100000 0.00013 3.82195894 99996.1908 3.82043796 Total Flow kmol/hr 1096.297 383.5863 323.536199 772.760408 45.9988575 Total Flow kg/hr 106604.9 17670.59 6136.97453 100467.944 1021.22141 Total Flow l/min 1264.381 401.5395 107.262439 1181.59009 23222.518 Temperature K 328.6804 351.4601 320.15 320.15 369.15 Pressure atm 1 1 3 3 1 Vapor Frac 0 0 0 0 1 Liquid Frac 1 1 1 1 0 Solid Frac 0 0 0 0 0
Enthalpy cal/mol -
27070.42 -64531.6 -67804.074 -10640.031 -56815.173 Enthalpy cal/gm -278.385 -1400.83 -3574.5745 -81.838987 -2559.1248
Enthalpy cal/sec -
8243670 -
6875952 -6093631.3 -2283943 -725953.64 Entropy cal/mol-K
-40.32843 -77.482 -38.988888 -41.55956 -14.090518
Entropy cal/gm-K
-0.414727 -1.68195 -2.0554618 -0.31966 -0.6346789
Density mol/cc 0.014451 0.015921 0.05027174 0.0109 3.30E-05 Density gm/cc 1.405232 0.733452 0.95357618 1.41712911 0.00073292 Average MW 97.24094 46.06679 18.9684324 130.011764 22.2010168 Liq Vol 60F l/min 1257.732 371.8834 104.637583 1153.09443 18.3838592
A41

Equipment Reports
Tower 1 Tower 2
Minimum reflux ratio: 3.289 1.606 Actual reflux ratio: 3.782 8.032 Minimum number of stages: 1.12E+01 28.6590725 Number of actual stages: 2.31E+01 32.6990552 Feed stage: 8.715907 -29.774353 Number of actual stages above feed: 7.715907 -30.774353 Reboiler heating required (cal/sec): 11345407 23022755.5 Condenser cooling required (cal/sec): 8333325 22977302.8 Distillate temperature (K): 352.3908 328.68036 Bottom temperature (K): 373.181 351.460089 Distillate to feed fraction: 0.058342 0.74079954
Decanter Flash Unit
Temperature (K) 320.150 369.150 Pressure (atm) 3 1 Heat Duty (cal/sec) -133904.72 2.08E+05
A42

13. Appendix F – Simplified Process Flow Diagram of Corn Process from “Modeling the Process and Costs of Fuel Ethanol Production by the Corn Dry-Grind Process (Kwiatkowski, 2006)
A43
15. Appendix G – Corn Material and Energy Balance from SuperPro Designer (Kwiatkowski, 2006)
A44

Materials & Streams Reportfor Corn_to_EtOH_40MGY_v7_5
April 26, 2010
- Page 1 -
1. OVERALL PROCESS DATA
Annual Operating Time 7,920.00hAnnual Throughput 119,171,455.05kg MPOperating Days per Year 330.00MP = Main Product = Total flow of stream ETHANOL
A45
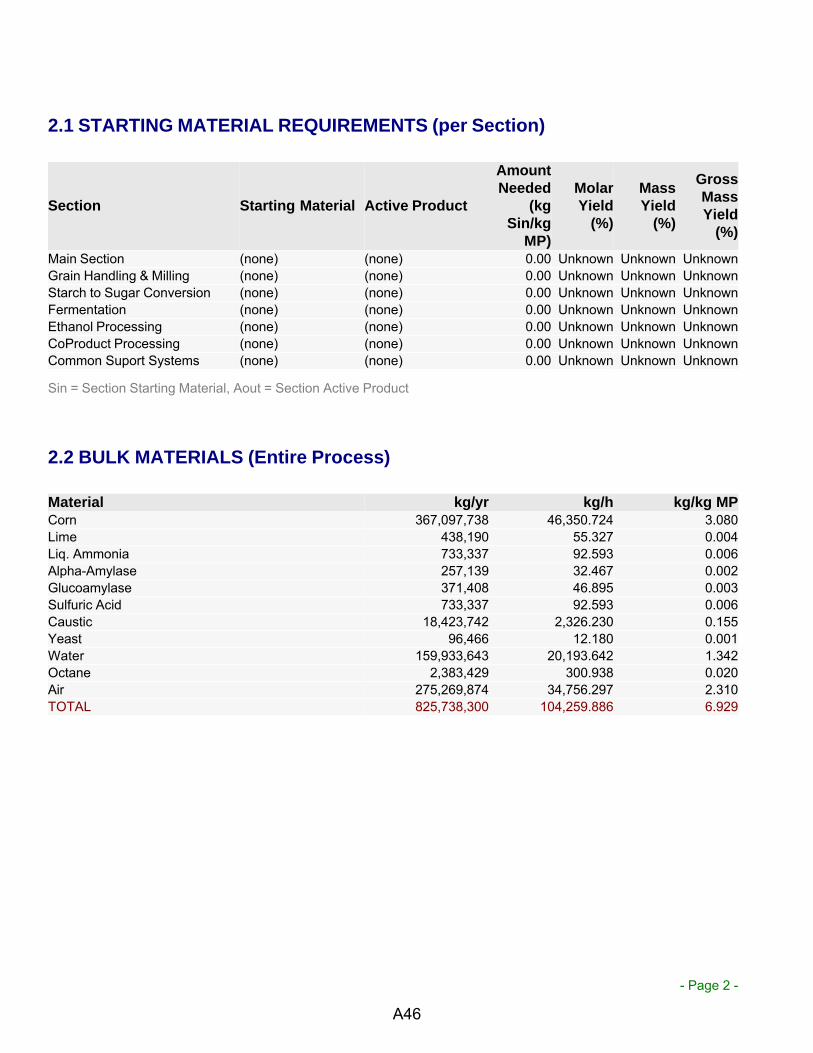
- Page 2 -
2.1 STARTING MATERIAL REQUIREMENTS (per Section)
Section Starting Material Active Product
AmountNeeded
(kgSin/kg
MP)
MolarYield
(%)
MassYield
(%)
GrossMassYield
(%)
Main Section (none) (none) 0.00 Unknown Unknown UnknownGrain Handling & Milling (none) (none) 0.00 Unknown Unknown UnknownStarch to Sugar Conversion (none) (none) 0.00 Unknown Unknown UnknownFermentation (none) (none) 0.00 Unknown Unknown UnknownEthanol Processing (none) (none) 0.00 Unknown Unknown UnknownCoProduct Processing (none) (none) 0.00 Unknown Unknown UnknownCommon Suport Systems (none) (none) 0.00 Unknown Unknown Unknown
Sin = Section Starting Material, Aout = Section Active Product
2.2 BULK MATERIALS (Entire Process)
Material kg/yr kg/h kg/kg MPCorn 367,097,738 46,350.724 3.080Lime 438,190 55.327 0.004Liq. Ammonia 733,337 92.593 0.006Alpha-Amylase 257,139 32.467 0.002Glucoamylase 371,408 46.895 0.003Sulfuric Acid 733,337 92.593 0.006Caustic 18,423,742 2,326.230 0.155Yeast 96,466 12.180 0.001Water 159,933,643 20,193.642 1.342Octane 2,383,429 300.938 0.020Air 275,269,874 34,756.297 2.310TOTAL 825,738,300 104,259.886 6.929
A46

- Page 3 -
2.3 BULK MATERIALS (per Section)
SECTIONS IN: Main Branch
Grain Handling & Milling
Material kg/yr kg/h kg/kg MPCorn 367,097,738 46,350.724 3.080TOTAL 367,097,738 46,350.724 3.080
Starch to Sugar Conversion
Material kg/yr kg/h kg/kg MPLime 438,190 55.327 0.004Liq. Ammonia 733,337 92.593 0.006Alpha-Amylase 257,139 32.467 0.002Glucoamylase 371,408 46.895 0.003Sulfuric Acid 733,337 92.593 0.006Caustic 18,423,742 2,326.230 0.155TOTAL 20,957,152 2,646.105 0.176
Fermentation
Material kg/yr kg/h kg/kg MPYeast 96,466 12.180 0.001Water 159,933,643 20,193.642 1.342TOTAL 160,030,108 20,205.822 1.343
Ethanol Processing
Material kg/yr kg/h kg/kg MPOctane 2,383,429 300.938 0.020TOTAL 2,383,429 300.938 0.020
CoProduct Processing
Material kg/yr kg/h kg/kg MPAir 275,269,874 34,756.297 2.310TOTAL 275,269,874 34,756.297 2.310
A47
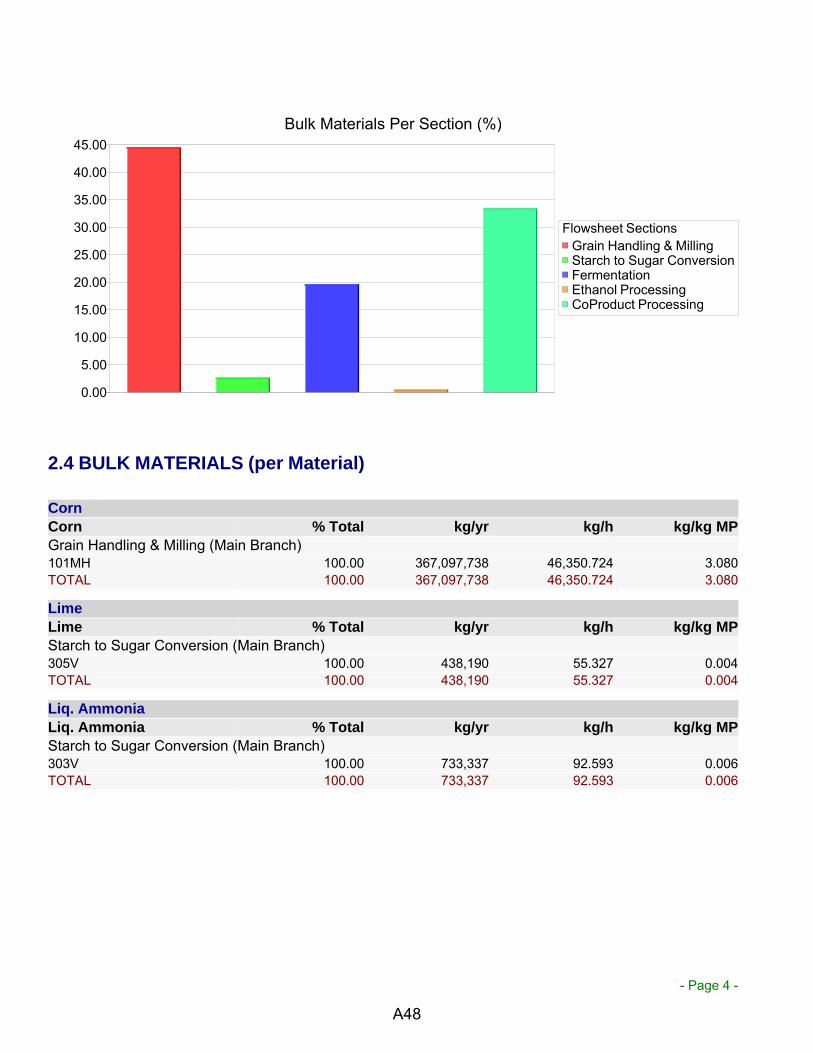
- Page 4 -
Bulk Materials Per Section (%)
Flowsheet SectionsGrain Handling & MillingStarch to Sugar ConversionFermentationEthanol ProcessingCoProduct Processing
0.00
5.00
10.00
15.00
20.00
25.00
30.00
35.00
40.00
45.00
2.4 BULK MATERIALS (per Material)
Corn
Corn % Total kg/yr kg/h kg/kg MP
Grain Handling & Milling (Main Branch)101MH 100.00 367,097,738 46,350.724 3.080TOTAL 100.00 367,097,738 46,350.724 3.080
Lime
Lime % Total kg/yr kg/h kg/kg MP
Starch to Sugar Conversion (Main Branch)305V 100.00 438,190 55.327 0.004TOTAL 100.00 438,190 55.327 0.004
Liq. Ammonia
Liq. Ammonia % Total kg/yr kg/h kg/kg MP
Starch to Sugar Conversion (Main Branch)303V 100.00 733,337 92.593 0.006TOTAL 100.00 733,337 92.593 0.006
A48
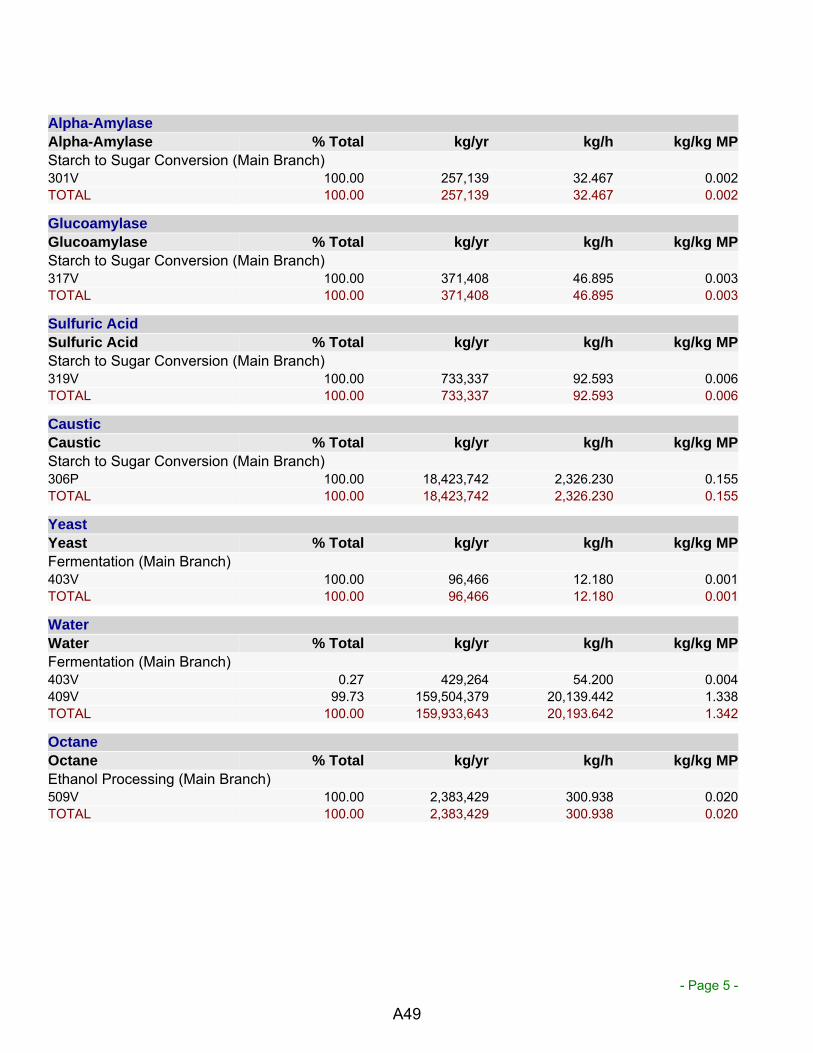
- Page 5 -
Alpha-Amylase
Alpha-Amylase % Total kg/yr kg/h kg/kg MP
Starch to Sugar Conversion (Main Branch)301V 100.00 257,139 32.467 0.002TOTAL 100.00 257,139 32.467 0.002
Glucoamylase
Glucoamylase % Total kg/yr kg/h kg/kg MP
Starch to Sugar Conversion (Main Branch)317V 100.00 371,408 46.895 0.003TOTAL 100.00 371,408 46.895 0.003
Sulfuric Acid
Sulfuric Acid % Total kg/yr kg/h kg/kg MP
Starch to Sugar Conversion (Main Branch)319V 100.00 733,337 92.593 0.006TOTAL 100.00 733,337 92.593 0.006
Caustic
Caustic % Total kg/yr kg/h kg/kg MP
Starch to Sugar Conversion (Main Branch)306P 100.00 18,423,742 2,326.230 0.155TOTAL 100.00 18,423,742 2,326.230 0.155
Yeast
Yeast % Total kg/yr kg/h kg/kg MP
Fermentation (Main Branch)403V 100.00 96,466 12.180 0.001TOTAL 100.00 96,466 12.180 0.001
Water
Water % Total kg/yr kg/h kg/kg MP
Fermentation (Main Branch)403V 0.27 429,264 54.200 0.004409V 99.73 159,504,379 20,139.442 1.338TOTAL 100.00 159,933,643 20,193.642 1.342
Octane
Octane % Total kg/yr kg/h kg/kg MP
Ethanol Processing (Main Branch)509V 100.00 2,383,429 300.938 0.020TOTAL 100.00 2,383,429 300.938 0.020
A49

- Page 6 -
Air
Air % Total kg/yr kg/h kg/kg MP
CoProduct Processing (Main Branch)610D 99.80 274,720,484 34,686.930 2.305611X 0.20 549,389 69.367 0.005TOTAL 100.00 275,269,874 34,756.297 2.310
2.5 BULK MATERIALS: SECTION TOTALS (kg/kg MP)
Raw Material Main SectionGrain Handling &
MillingStarch to Sugar
ConversionFermentation
Corn 0.000 3.080 0.000 0.000Lime 0.000 0.000 0.004 0.000Liq. Ammonia 0.000 0.000 0.006 0.000Alpha-Amylase 0.000 0.000 0.002 0.000Glucoamylase 0.000 0.000 0.003 0.000Sulfuric Acid 0.000 0.000 0.006 0.000Caustic 0.000 0.000 0.155 0.000Yeast 0.000 0.000 0.000 0.001Water 0.000 0.000 0.000 1.342Octane 0.000 0.000 0.000 0.000Air 0.000 0.000 0.000 0.000TOTAL 0.000 3.080 0.176 1.343
Raw MaterialEthanol
ProcessingCoProduct
ProcessingCommon Suport
SystemsCorn 0.000 0.000 0.000Lime 0.000 0.000 0.000Liq. Ammonia 0.000 0.000 0.000Alpha-Amylase 0.000 0.000 0.000Glucoamylase 0.000 0.000 0.000Sulfuric Acid 0.000 0.000 0.000Caustic 0.000 0.000 0.000Yeast 0.000 0.000 0.000Water 0.000 0.000 0.000Octane 0.020 0.000 0.000Air 0.000 2.310 0.000TOTAL 0.020 2.310 0.000
A50

- Page 7 -
Bulk Materials (Entire Process)
Raw MaterialsCornLimeLiq. AmmoniaAlpha-AmylaseGlucoamylaseSulfuric AcidCausticYeastWaterOctaneAir
0.00
0.50
1.00
1.50
2.00
2.50
3.00
3.50
Mat
eria
l Con
sum
ptio
n (k
g/kg
MP
)
2.6 BULK MATERIALS: SECTION TOTALS (kg/h)
Raw Material Main SectionGrain Handling &
MillingStarch to Sugar
ConversionFermentation
Corn 0.000 46,350.724 0.000 0.000Lime 0.000 0.000 55.327 0.000Liq. Ammonia 0.000 0.000 92.593 0.000Alpha-Amylase 0.000 0.000 32.467 0.000Glucoamylase 0.000 0.000 46.895 0.000Sulfuric Acid 0.000 0.000 92.593 0.000Caustic 0.000 0.000 2,326.230 0.000Yeast 0.000 0.000 0.000 12.180Water 0.000 0.000 0.000 20,193.642Octane 0.000 0.000 0.000 0.000Air 0.000 0.000 0.000 0.000TOTAL 0.000 46,350.724 2,646.105 20,205.822
A51

- Page 8 -
Raw MaterialEthanol
ProcessingCoProduct
ProcessingCommon Suport
SystemsCorn 0.000 0.000 0.000Lime 0.000 0.000 0.000Liq. Ammonia 0.000 0.000 0.000Alpha-Amylase 0.000 0.000 0.000Glucoamylase 0.000 0.000 0.000Sulfuric Acid 0.000 0.000 0.000Caustic 0.000 0.000 0.000Yeast 0.000 0.000 0.000Water 0.000 0.000 0.000Octane 300.938 0.000 0.000Air 0.000 34,756.297 0.000TOTAL 300.938 34,756.297 0.000
Bulk Materials (Entire Process)
Raw MaterialsCornLimeLiq. AmmoniaAlpha-AmylaseGlucoamylaseSulfuric AcidCausticYeastWaterOctaneAir
0.00
5000.00
10000.00
15000.00
20000.00
25000.00
30000.00
35000.00
40000.00
45000.00
50000.00
Mat
eria
l Con
sum
ptio
n (k
g/h)
A52

- Page 9 -
2.7 BULK MATERIALS: SECTION TOTALS (kg/yr)
Raw Material Main SectionGrain Handling &
MillingStarch to Sugar
ConversionFermentation
Corn 0 367,097,738 0 0Lime 0 0 438,190 0Liq. Ammonia 0 0 733,337 0Alpha-Amylase 0 0 257,139 0Glucoamylase 0 0 371,408 0Sulfuric Acid 0 0 733,337 0Caustic 0 0 18,423,742 0Yeast 0 0 0 96,466Water 0 0 0 159,933,643Octane 0 0 0 0Air 0 0 0 0TOTAL 0 367,097,738 20,957,152 160,030,108
Raw MaterialEthanol
ProcessingCoProduct
ProcessingCommon Suport
SystemsCorn 0 0 0Lime 0 0 0Liq. Ammonia 0 0 0Alpha-Amylase 0 0 0Glucoamylase 0 0 0Sulfuric Acid 0 0 0Caustic 0 0 0Yeast 0 0 0Water 0 0 0Octane 2,383,429 0 0Air 0 275,269,874 0TOTAL 2,383,429 275,269,874 0
A53
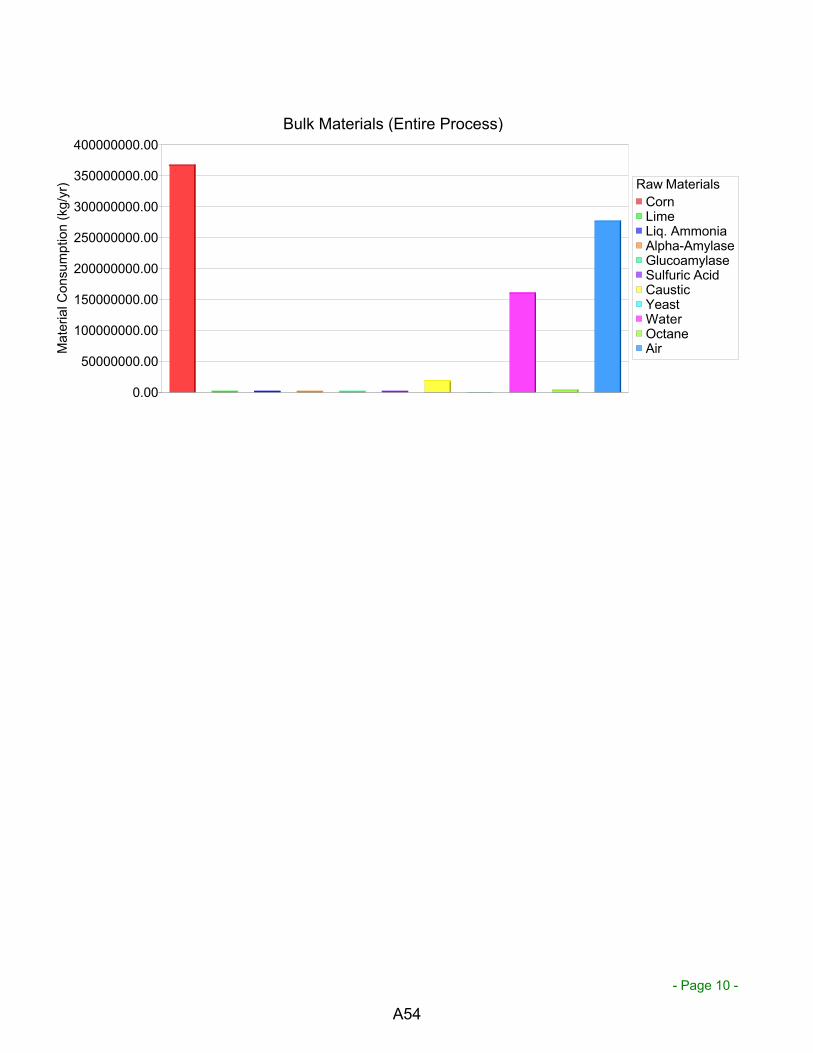
- Page 10 -
Bulk Materials (Entire Process)
Raw MaterialsCornLimeLiq. AmmoniaAlpha-AmylaseGlucoamylaseSulfuric AcidCausticYeastWaterOctaneAir
0.00
50000000.00
100000000.00
150000000.00
200000000.00
250000000.00
300000000.00
350000000.00
400000000.00
Mat
eria
l Con
sum
ptio
n (k
g/yr
)
A54
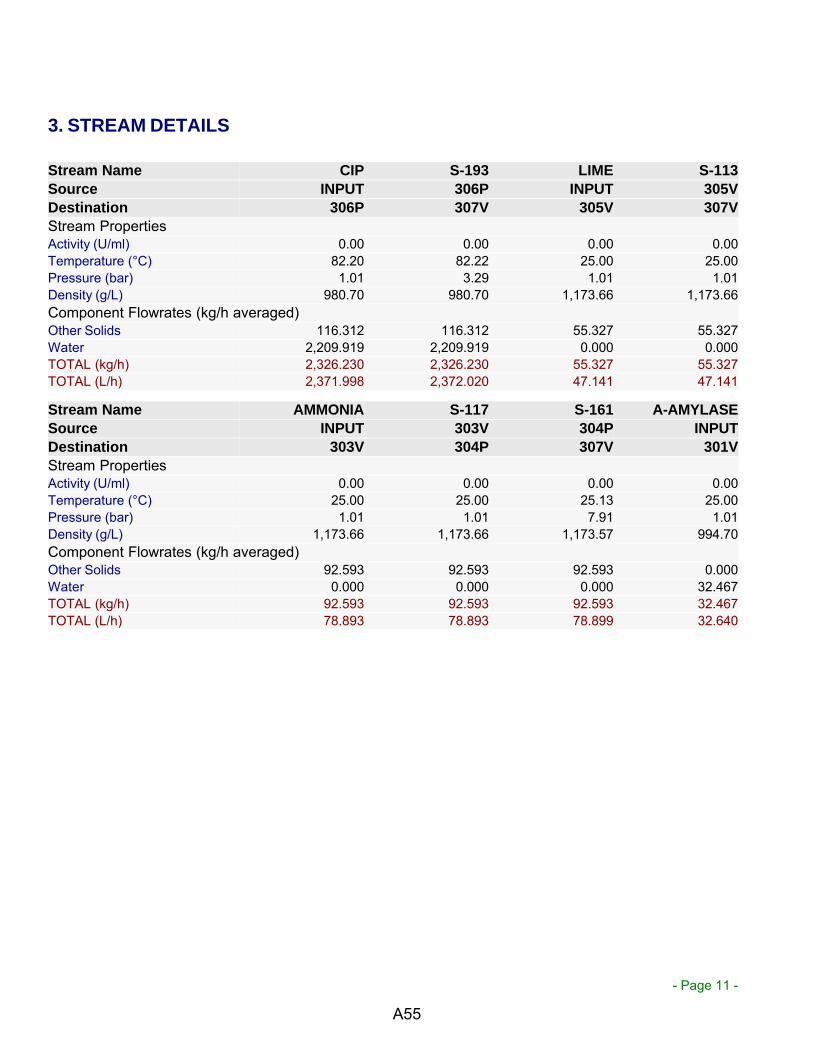
- Page 11 -
3. STREAM DETAILS
Stream Name CIP S-193 LIME S-113
Source INPUT 306P INPUT 305V
Destination 306P 307V 305V 307V
Stream PropertiesActivity (U/ml) 0.00 0.00 0.00 0.00Temperature (°C) 82.20 82.22 25.00 25.00Pressure (bar) 1.01 3.29 1.01 1.01Density (g/L) 980.70 980.70 1,173.66 1,173.66Component Flowrates (kg/h averaged)Other Solids 116.312 116.312 55.327 55.327Water 2,209.919 2,209.919 0.000 0.000TOTAL (kg/h) 2,326.230 2,326.230 55.327 55.327TOTAL (L/h) 2,371.998 2,372.020 47.141 47.141
Stream Name AMMONIA S-117 S-161 A-AMYLASE
Source INPUT 303V 304P INPUT
Destination 303V 304P 307V 301V
Stream PropertiesActivity (U/ml) 0.00 0.00 0.00 0.00Temperature (°C) 25.00 25.00 25.13 25.00Pressure (bar) 1.01 1.01 7.91 1.01Density (g/L) 1,173.66 1,173.66 1,173.57 994.70Component Flowrates (kg/h averaged)Other Solids 92.593 92.593 92.593 0.000Water 0.000 0.000 0.000 32.467TOTAL (kg/h) 92.593 92.593 92.593 32.467TOTAL (L/h) 78.893 78.893 78.899 32.640
A55
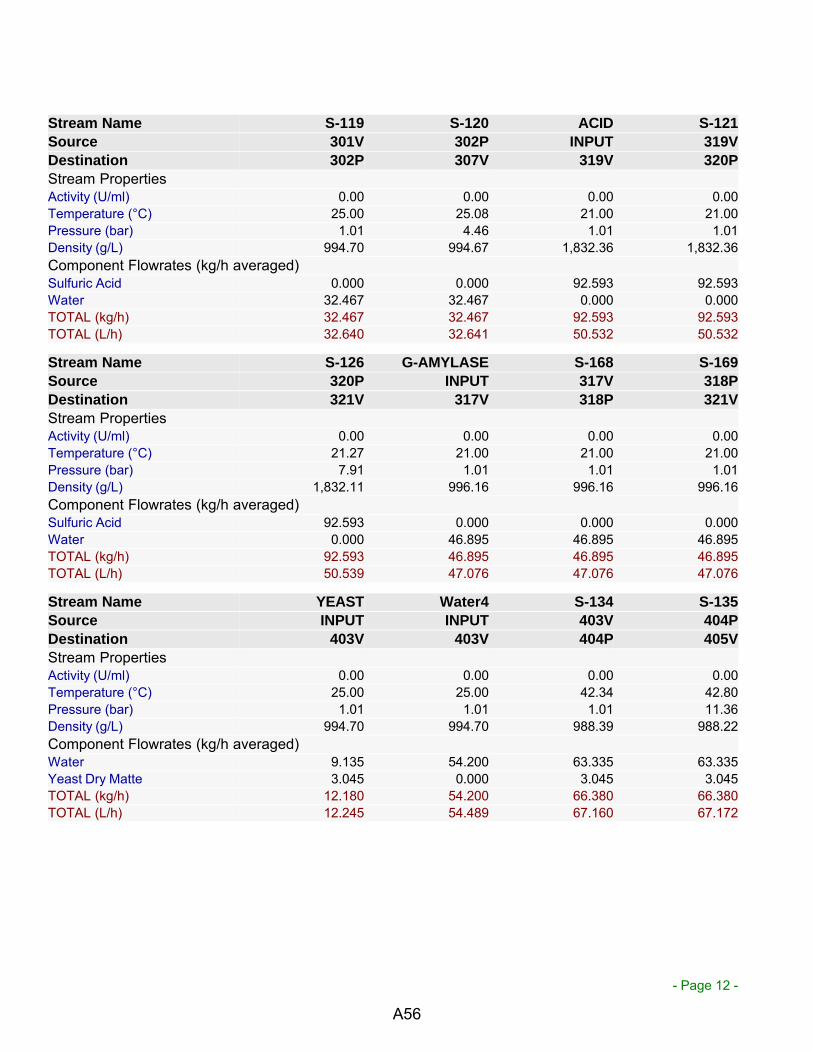
- Page 12 -
Stream Name S-119 S-120 ACID S-121
Source 301V 302P INPUT 319V
Destination 302P 307V 319V 320P
Stream PropertiesActivity (U/ml) 0.00 0.00 0.00 0.00Temperature (°C) 25.00 25.08 21.00 21.00Pressure (bar) 1.01 4.46 1.01 1.01Density (g/L) 994.70 994.67 1,832.36 1,832.36Component Flowrates (kg/h averaged)Sulfuric Acid 0.000 0.000 92.593 92.593Water 32.467 32.467 0.000 0.000TOTAL (kg/h) 32.467 32.467 92.593 92.593TOTAL (L/h) 32.640 32.641 50.532 50.532
Stream Name S-126 G-AMYLASE S-168 S-169
Source 320P INPUT 317V 318P
Destination 321V 317V 318P 321V
Stream PropertiesActivity (U/ml) 0.00 0.00 0.00 0.00Temperature (°C) 21.27 21.00 21.00 21.00Pressure (bar) 7.91 1.01 1.01 1.01Density (g/L) 1,832.11 996.16 996.16 996.16Component Flowrates (kg/h averaged)Sulfuric Acid 92.593 0.000 0.000 0.000Water 0.000 46.895 46.895 46.895TOTAL (kg/h) 92.593 46.895 46.895 46.895TOTAL (L/h) 50.539 47.076 47.076 47.076
Stream Name YEAST Water4 S-134 S-135
Source INPUT INPUT 403V 404P
Destination 403V 403V 404P 405V
Stream PropertiesActivity (U/ml) 0.00 0.00 0.00 0.00Temperature (°C) 25.00 25.00 42.34 42.80Pressure (bar) 1.01 1.01 1.01 11.36Density (g/L) 994.70 994.70 988.39 988.22Component Flowrates (kg/h averaged)Water 9.135 54.200 63.335 63.335Yeast Dry Matte 3.045 0.000 3.045 3.045TOTAL (kg/h) 12.180 54.200 66.380 66.380TOTAL (L/h) 12.245 54.489 67.160 67.172
A56
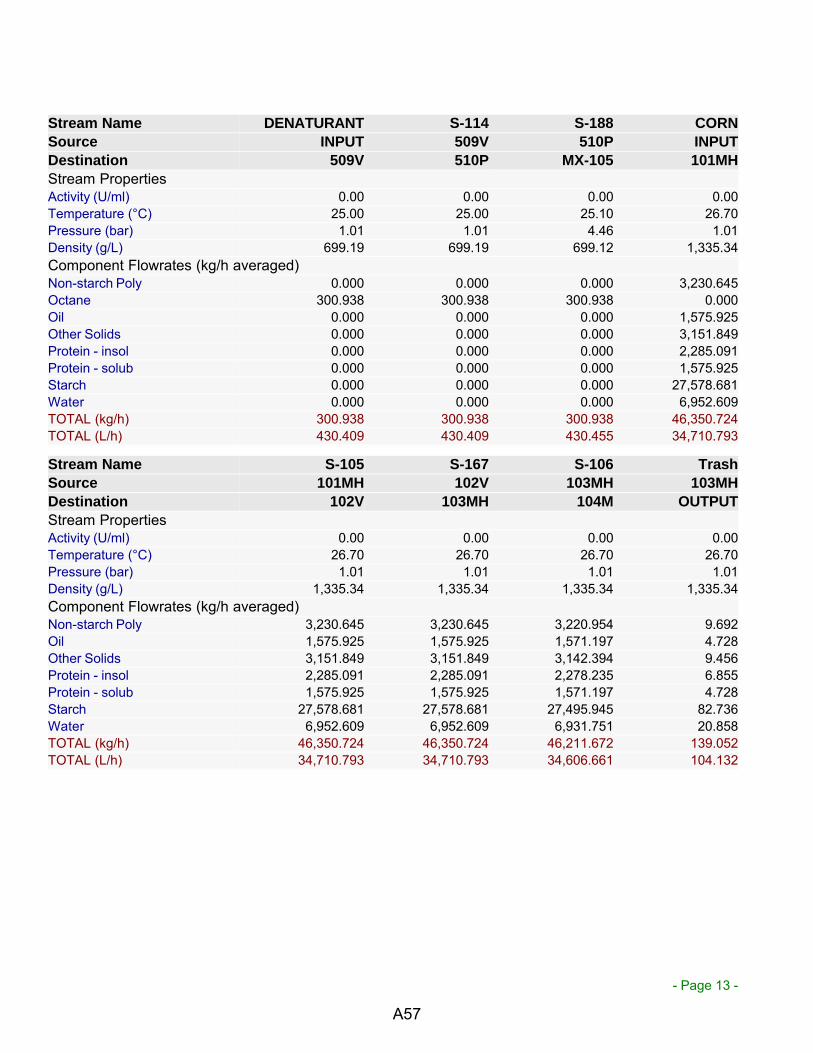
- Page 13 -
Stream Name DENATURANT S-114 S-188 CORN
Source INPUT 509V 510P INPUT
Destination 509V 510P MX-105 101MH
Stream PropertiesActivity (U/ml) 0.00 0.00 0.00 0.00Temperature (°C) 25.00 25.00 25.10 26.70Pressure (bar) 1.01 1.01 4.46 1.01Density (g/L) 699.19 699.19 699.12 1,335.34Component Flowrates (kg/h averaged)Non-starch Poly 0.000 0.000 0.000 3,230.645Octane 300.938 300.938 300.938 0.000Oil 0.000 0.000 0.000 1,575.925Other Solids 0.000 0.000 0.000 3,151.849Protein - insol 0.000 0.000 0.000 2,285.091Protein - solub 0.000 0.000 0.000 1,575.925Starch 0.000 0.000 0.000 27,578.681Water 0.000 0.000 0.000 6,952.609TOTAL (kg/h) 300.938 300.938 300.938 46,350.724TOTAL (L/h) 430.409 430.409 430.455 34,710.793
Stream Name S-105 S-167 S-106 Trash
Source 101MH 102V 103MH 103MH
Destination 102V 103MH 104M OUTPUT
Stream PropertiesActivity (U/ml) 0.00 0.00 0.00 0.00Temperature (°C) 26.70 26.70 26.70 26.70Pressure (bar) 1.01 1.01 1.01 1.01Density (g/L) 1,335.34 1,335.34 1,335.34 1,335.34Component Flowrates (kg/h averaged)Non-starch Poly 3,230.645 3,230.645 3,220.954 9.692Oil 1,575.925 1,575.925 1,571.197 4.728Other Solids 3,151.849 3,151.849 3,142.394 9.456Protein - insol 2,285.091 2,285.091 2,278.235 6.855Protein - solub 1,575.925 1,575.925 1,571.197 4.728Starch 27,578.681 27,578.681 27,495.945 82.736Water 6,952.609 6,952.609 6,931.751 20.858TOTAL (kg/h) 46,350.724 46,350.724 46,211.672 139.052TOTAL (L/h) 34,710.793 34,710.793 34,606.661 104.132
A57
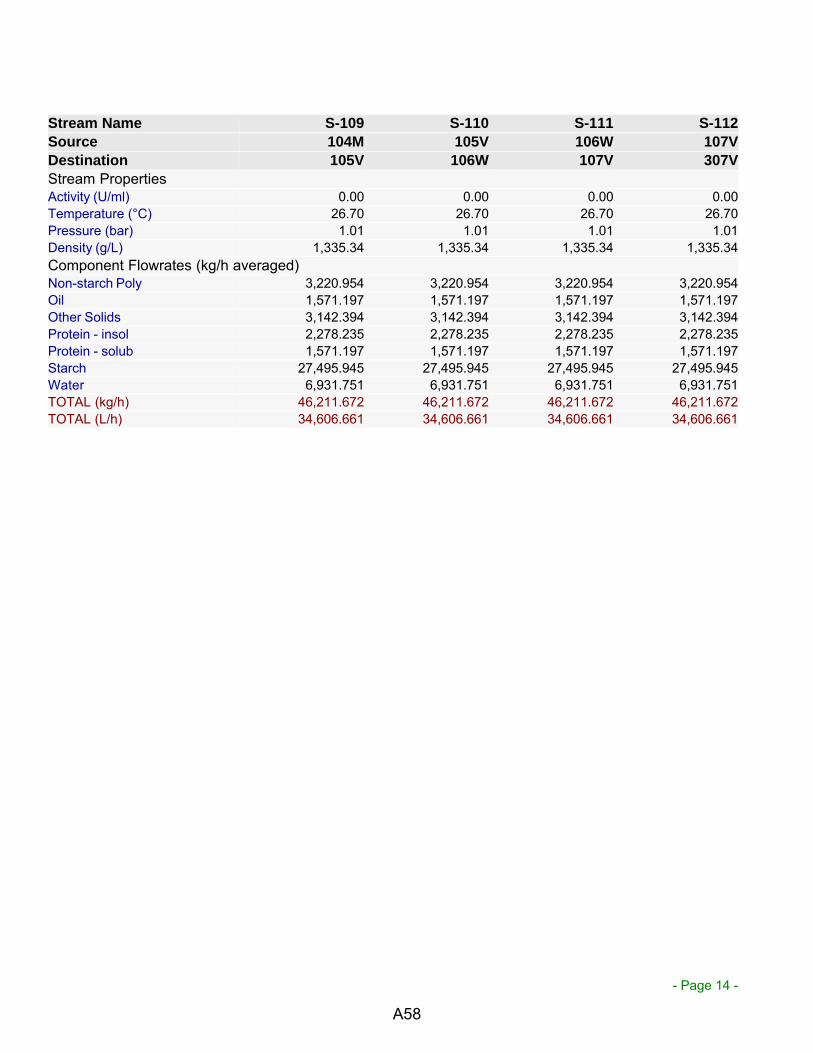
- Page 14 -
Stream Name S-109 S-110 S-111 S-112
Source 104M 105V 106W 107V
Destination 105V 106W 107V 307V
Stream PropertiesActivity (U/ml) 0.00 0.00 0.00 0.00Temperature (°C) 26.70 26.70 26.70 26.70Pressure (bar) 1.01 1.01 1.01 1.01Density (g/L) 1,335.34 1,335.34 1,335.34 1,335.34Component Flowrates (kg/h averaged)Non-starch Poly 3,220.954 3,220.954 3,220.954 3,220.954Oil 1,571.197 1,571.197 1,571.197 1,571.197Other Solids 3,142.394 3,142.394 3,142.394 3,142.394Protein - insol 2,278.235 2,278.235 2,278.235 2,278.235Protein - solub 1,571.197 1,571.197 1,571.197 1,571.197Starch 27,495.945 27,495.945 27,495.945 27,495.945Water 6,931.751 6,931.751 6,931.751 6,931.751TOTAL (kg/h) 46,211.672 46,211.672 46,211.672 46,211.672TOTAL (L/h) 34,606.661 34,606.661 34,606.661 34,606.661
A58

- Page 15 -
Stream Name S-137 S-153 S-160 S-125
Source 407P 315E 316E 316E
Destination 316E 316E 321V 412V
Stream PropertiesActivity (U/ml) 0.00 0.00 0.00 0.00Temperature (°C) 47.52 97.80 59.52 78.25Pressure (bar) 6.18 2.00 2.00 6.18Density (g/L) 975.98 516.01 1,036.45 239.13Component Flowrates (kg/h averaged)Carb. Dioxide 0.000 14.038 14.038 0.000Ethyl Alcohol 14,744.373 431.867 431.867 14,744.373Non-starch Poly 3,291.497 3,291.497 3,291.497 3,291.497Oil 1,724.069 1,724.069 1,724.069 1,724.069Other Solids 5,040.753 4,525.380 4,525.381 5,040.754Protein - insol 2,328.132 2,328.132 2,328.132 2,328.132Protein - solub 2,561.333 2,139.664 2,139.664 2,561.333Starch 275.018 27,501.839 27,501.839 275.018Sulfuric Acid 119.005 26.412 26.412 119.005Water 105,161.770 108,319.239 108,319.229 105,161.760Yeast Dry Matte 624.694 45.753 45.753 624.694TOTAL (kg/h) 135,870.645 150,347.890 150,347.882 135,870.636TOTAL (L/h) 139,214.947 291,367.336 145,060.951 568,196.912
A59

- Page 16 -
Stream Name S-122 S-182 S-157 S-131
Source 321V 322P 406P 401E
Destination 322P 401E 401E 402E
Stream PropertiesActivity (U/ml) 0.00 0.00 0.00 0.00Temperature (°C) 60.00 60.03 32.24 45.40Pressure (bar) 1.01 3.91 4.46 3.91Density (g/L) 971.18 1,013.42 983.26 1,020.38Component Flowrates (kg/h averaged)Carb. Dioxide 14.038 14.038 0.000 14.038Ethyl Alcohol 431.867 431.867 14,744.373 431.867Glucose 30,252.023 30,252.023 0.000 30,252.023Non-starch Poly 3,291.497 3,291.497 3,291.497 3,291.497Oil 1,724.069 1,724.069 1,724.069 1,724.069Other Solids 4,525.381 4,525.381 5,040.753 4,525.381Protein - insol 2,328.132 2,328.132 2,328.132 2,328.132Protein - solub 2,139.664 2,139.664 2,561.333 2,139.664Starch 275.018 275.018 275.018 275.018Sulfuric Acid 119.005 119.005 119.005 119.005Water 105,340.922 105,340.922 105,161.827 105,340.922Yeast Dry Matte 45.753 45.753 624.694 45.753TOTAL (kg/h) 150,487.370 150,487.370 135,870.701 150,487.370TOTAL (L/h) 154,953.563 148,494.786 138,184.296 147,481.073
A60
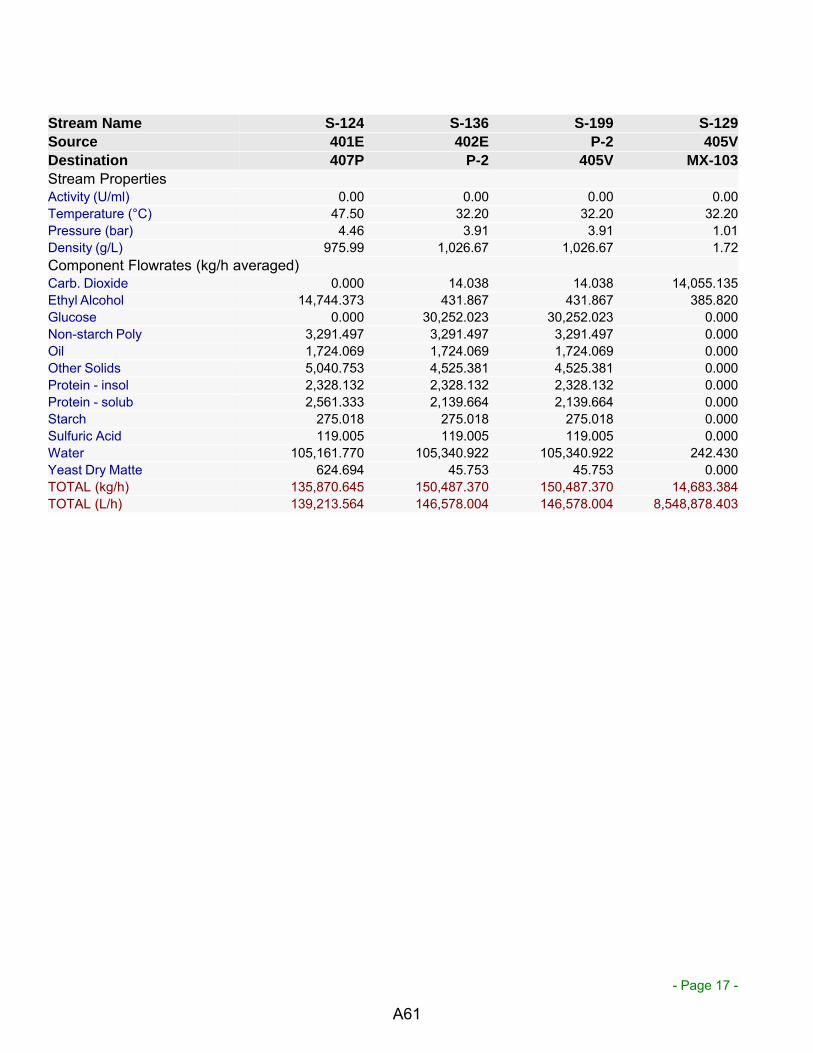
- Page 17 -
Stream Name S-124 S-136 S-199 S-129
Source 401E 402E P-2 405V
Destination 407P P-2 405V MX-103
Stream PropertiesActivity (U/ml) 0.00 0.00 0.00 0.00Temperature (°C) 47.50 32.20 32.20 32.20Pressure (bar) 4.46 3.91 3.91 1.01Density (g/L) 975.99 1,026.67 1,026.67 1.72Component Flowrates (kg/h averaged)Carb. Dioxide 0.000 14.038 14.038 14,055.135Ethyl Alcohol 14,744.373 431.867 431.867 385.820Glucose 0.000 30,252.023 30,252.023 0.000Non-starch Poly 3,291.497 3,291.497 3,291.497 0.000Oil 1,724.069 1,724.069 1,724.069 0.000Other Solids 5,040.753 4,525.381 4,525.381 0.000Protein - insol 2,328.132 2,328.132 2,328.132 0.000Protein - solub 2,561.333 2,139.664 2,139.664 0.000Starch 275.018 275.018 275.018 0.000Sulfuric Acid 119.005 119.005 119.005 0.000Water 105,161.770 105,340.922 105,340.922 242.430Yeast Dry Matte 624.694 45.753 45.753 0.000TOTAL (kg/h) 135,870.645 150,487.370 150,487.370 14,683.384TOTAL (L/h) 139,213.564 146,578.004 146,578.004 8,548,878.403
A61

- Page 18 -
Stream Name S-132 S-128 S-175 S-143
Source 405V 412V 412V 408E
Destination 406P 408E 413E MX-103
Stream PropertiesActivity (U/ml) 0.00 0.00 0.00 0.00Temperature (°C) 32.20 81.00 81.00 37.80Pressure (bar) 1.01 1.01 1.01 1.00Density (g/L) 983.28 0.92 946.13 821.56Component Flowrates (kg/h averaged)Ethyl Alcohol 14,744.373 560.286 14,184.087 10.341Non-starch Poly 3,291.497 0.000 3,291.497 0.000Oil 1,724.069 0.000 1,724.069 0.000Other Solids 5,040.753 0.000 5,040.754 0.000Protein - insol 2,328.132 0.000 2,328.132 0.000Protein - solub 2,561.333 0.000 2,561.333 0.000Starch 275.018 0.000 275.018 0.000Sulfuric Acid 119.005 0.000 119.005 0.000Water 105,161.827 483.744 104,678.016 3.694Yeast Dry Matte 624.694 0.000 624.694 0.000TOTAL (kg/h) 135,870.701 1,044.030 134,826.605 14.035TOTAL (L/h) 138,181.605 1,133,823.317 142,503.998 17.084
Stream Name S-140 S-133 WATER CO2
Source 408E MX-103 INPUT 409V
Destination MX-104 409V 409V OUTPUT
Stream PropertiesActivity (U/ml) 0.00 0.00 0.00 0.00Temperature (°C) 37.80 37.80 12.80 16.06Pressure (bar) 1.00 1.00 1.00 1.00Density (g/L) 861.94 1.78 999.15 1.84Component Flowrates (kg/h averaged)Carb. Dioxide 0.000 14,055.135 0.000 14,041.079Ethyl Alcohol 549.945 396.161 0.000 0.792Water 480.050 246.124 20,139.442 100.911TOTAL (kg/h) 1,029.995 14,697.420 20,139.442 14,142.783TOTAL (L/h) 1,194.968 8,257,433.707 20,156.550 7,671,787.315
A62

- Page 19 -
Stream Name S-142 S-144 S-183 S-139
Source 409V 410P 502P 413E
Destination 410P 608T 413E MX-104
Stream PropertiesActivity (U/ml) 0.00 0.00 0.00 0.00Temperature (°C) 16.06 16.09 115.33 99.38Pressure (bar) 1.00 3.90 4.46 1.01Density (g/L) 726.02 907.81 8,055.98 939.43Component Flowrates (kg/h averaged)Carb. Dioxide 14.055 14.055 0.000 0.000Ethyl Alcohol 395.369 395.369 44.202 14,184.087Non-starch Poly 0.000 0.000 3,291.497 3,291.497Oil 0.000 0.000 1,724.069 1,724.069Other Solids 0.000 0.000 5,040.754 5,040.754Protein - insol 0.000 0.000 2,328.132 2,328.132Protein - solub 0.000 0.000 2,561.333 2,561.333Starch 0.000 0.000 275.018 275.018Sulfuric Acid 0.000 0.000 119.005 119.005Water 20,284.655 20,284.655 92,076.402 104,678.016Yeast Dry Matte 0.000 0.000 624.694 624.694TOTAL (kg/h) 20,694.079 20,694.079 108,085.107 134,826.605TOTAL (L/h) 28,503.443 22,795.716 13,416.754 143,519.100
A63
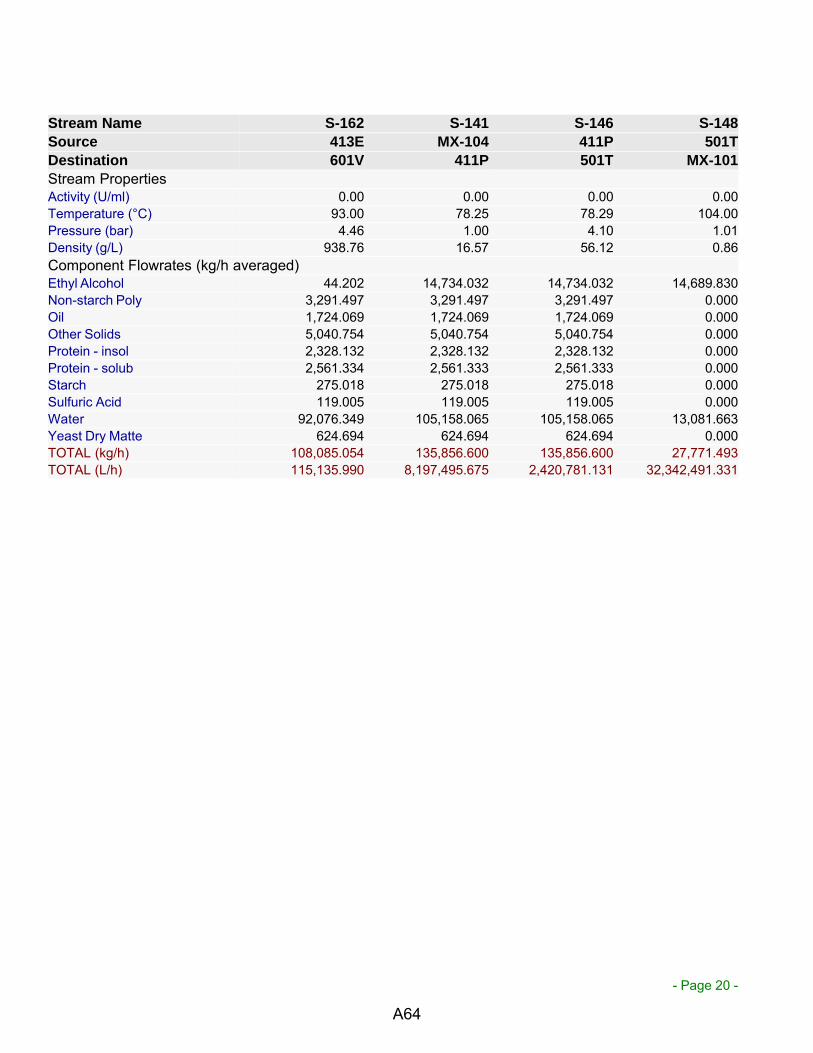
- Page 20 -
Stream Name S-162 S-141 S-146 S-148
Source 413E MX-104 411P 501T
Destination 601V 411P 501T MX-101
Stream PropertiesActivity (U/ml) 0.00 0.00 0.00 0.00Temperature (°C) 93.00 78.25 78.29 104.00Pressure (bar) 4.46 1.00 4.10 1.01Density (g/L) 938.76 16.57 56.12 0.86Component Flowrates (kg/h averaged)Ethyl Alcohol 44.202 14,734.032 14,734.032 14,689.830Non-starch Poly 3,291.497 3,291.497 3,291.497 0.000Oil 1,724.069 1,724.069 1,724.069 0.000Other Solids 5,040.754 5,040.754 5,040.754 0.000Protein - insol 2,328.132 2,328.132 2,328.132 0.000Protein - solub 2,561.334 2,561.333 2,561.333 0.000Starch 275.018 275.018 275.018 0.000Sulfuric Acid 119.005 119.005 119.005 0.000Water 92,076.349 105,158.065 105,158.065 13,081.663Yeast Dry Matte 624.694 624.694 624.694 0.000TOTAL (kg/h) 108,085.054 135,856.600 135,856.600 27,771.493TOTAL (L/h) 115,135.990 8,197,495.675 2,420,781.131 32,342,491.331
A64

- Page 21 -
Stream Name S-147 S-150 S-155 S-149
Source 501T MX-101 503T 503T
Destination 502P 503T 504X 506P
Stream PropertiesActivity (U/ml) 0.00 0.00 0.00 0.00Temperature (°C) 115.33 100.00 95.00 114.36Pressure (bar) 1.01 1.01 1.01 1.01Density (g/L) 8,178.74 1.01 1.69 902.00Component Flowrates (kg/h averaged)Ethyl Alcohol 44.202 17,627.164 17,528.452 98.712Non-starch Poly 3,291.497 0.000 0.000 0.000Oil 1,724.069 0.000 0.000 0.000Other Solids 5,040.754 0.000 0.000 0.000Protein - insol 2,328.132 0.000 0.000 0.000Protein - solub 2,561.333 0.000 0.000 0.000Starch 275.018 0.000 0.000 0.000Sulfuric Acid 119.005 0.000 0.000 0.000Water 92,076.402 16,614.352 1,904.004 14,710.340Yeast Dry Matte 624.694 0.000 0.000 0.000TOTAL (kg/h) 108,085.107 34,241.516 19,432.456 14,809.052TOTAL (L/h) 13,215.371 34,003,660.717 11,495,786.280 16,418.018
Stream Name S-156 S-171 S-186 S-184
Source 504X 504X 505P 506P
Destination 505P 511V MX-101 507T
Stream PropertiesActivity (U/ml) 0.00 0.00 0.00 0.00Temperature (°C) 95.00 95.00 95.04 114.40Pressure (bar) 1.01 1.01 4.46 4.46Density (g/L) 2.51 1.53 11.03 2.50Component Flowrates (kg/h averaged)Ethyl Alcohol 2,839.609 14,688.843 2,839.609 98.712Water 1,846.884 57.120 1,846.884 14,710.340TOTAL (kg/h) 4,686.493 14,745.963 4,686.493 14,809.052TOTAL (L/h) 1,863,904.720 9,631,881.561 424,908.313 5,912,791.494
A65
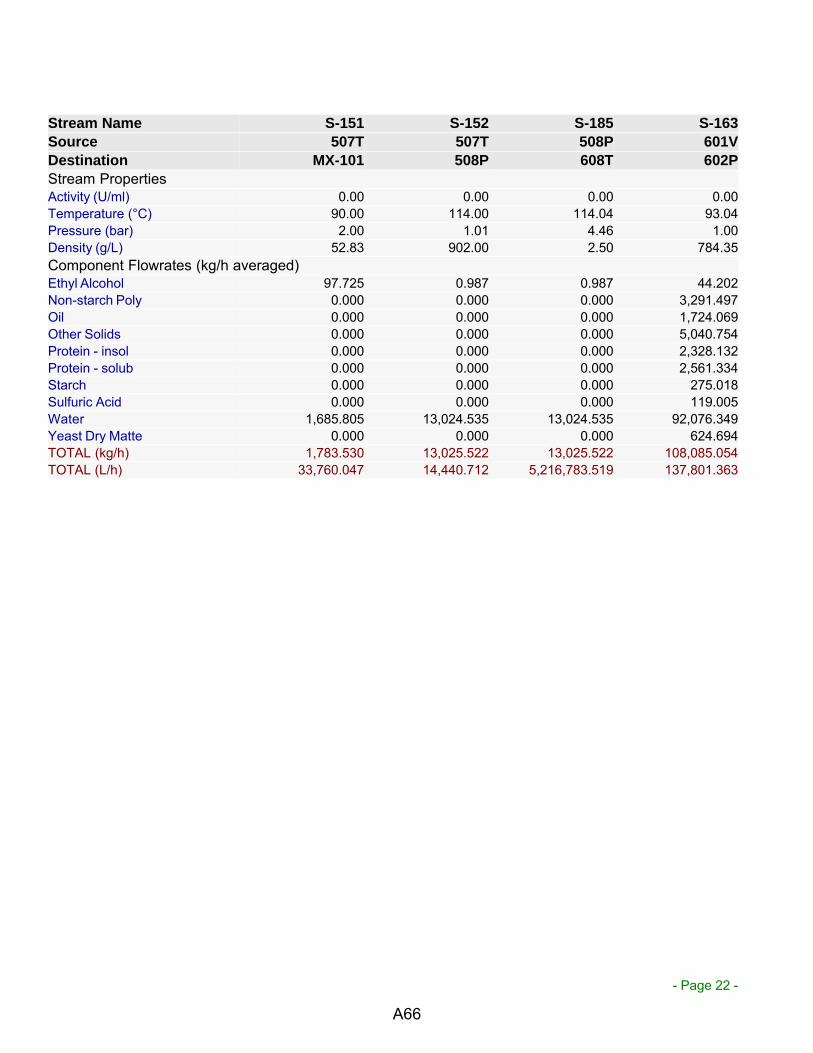
- Page 22 -
Stream Name S-151 S-152 S-185 S-163
Source 507T 507T 508P 601V
Destination MX-101 508P 608T 602P
Stream PropertiesActivity (U/ml) 0.00 0.00 0.00 0.00Temperature (°C) 90.00 114.00 114.04 93.04Pressure (bar) 2.00 1.01 4.46 1.00Density (g/L) 52.83 902.00 2.50 784.35Component Flowrates (kg/h averaged)Ethyl Alcohol 97.725 0.987 0.987 44.202Non-starch Poly 0.000 0.000 0.000 3,291.497Oil 0.000 0.000 0.000 1,724.069Other Solids 0.000 0.000 0.000 5,040.754Protein - insol 0.000 0.000 0.000 2,328.132Protein - solub 0.000 0.000 0.000 2,561.334Starch 0.000 0.000 0.000 275.018Sulfuric Acid 0.000 0.000 0.000 119.005Water 1,685.805 13,024.535 13,024.535 92,076.349Yeast Dry Matte 0.000 0.000 0.000 624.694TOTAL (kg/h) 1,783.530 13,025.522 13,025.522 108,085.054TOTAL (L/h) 33,760.047 14,440.712 5,216,783.519 137,801.363
A66
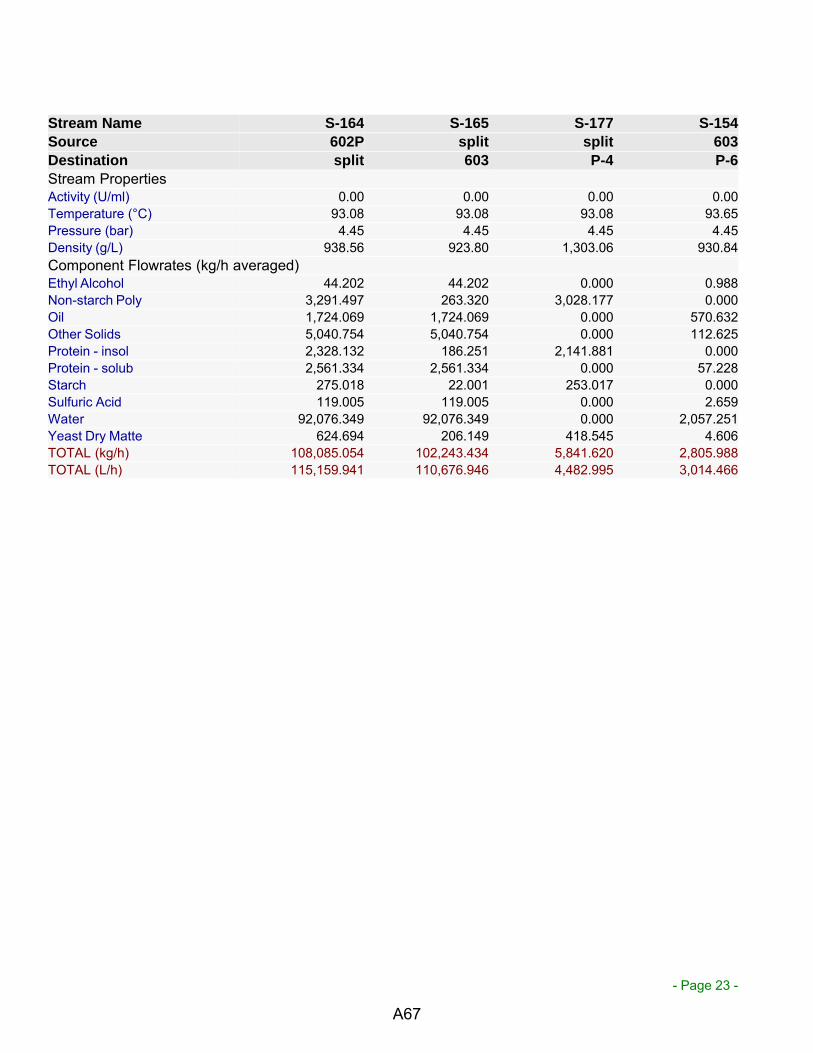
- Page 23 -
Stream Name S-164 S-165 S-177 S-154
Source 602P split split 603
Destination split 603 P-4 P-6
Stream PropertiesActivity (U/ml) 0.00 0.00 0.00 0.00Temperature (°C) 93.08 93.08 93.08 93.65Pressure (bar) 4.45 4.45 4.45 4.45Density (g/L) 938.56 923.80 1,303.06 930.84Component Flowrates (kg/h averaged)Ethyl Alcohol 44.202 44.202 0.000 0.988Non-starch Poly 3,291.497 263.320 3,028.177 0.000Oil 1,724.069 1,724.069 0.000 570.632Other Solids 5,040.754 5,040.754 0.000 112.625Protein - insol 2,328.132 186.251 2,141.881 0.000Protein - solub 2,561.334 2,561.334 0.000 57.228Starch 275.018 22.001 253.017 0.000Sulfuric Acid 119.005 119.005 0.000 2.659Water 92,076.349 92,076.349 0.000 2,057.251Yeast Dry Matte 624.694 206.149 418.545 4.606TOTAL (kg/h) 108,085.054 102,243.434 5,841.620 2,805.988TOTAL (L/h) 115,159.941 110,676.946 4,482.995 3,014.466
A67

- Page 24 -
Stream Name S-174 S-197 S-198 S-196
Source 603 603 P-6 FSP-103
Destination P-4 P-6 FSP-103 310V
Stream PropertiesActivity (U/ml) 0.00 0.00 0.00 0.00Temperature (°C) 93.65 93.65 93.65 93.65Pressure (bar) 4.45 4.45 4.45 4.45Density (g/L) 924.32 923.09 923.35 923.35Component Flowrates (kg/h averaged)Ethyl Alcohol 7.583 35.632 36.619 9.810Non-starch Poly 0.000 263.320 263.320 70.543Oil 1,153.437 0.000 570.632 152.872Other Solids 864.731 4,063.398 4,176.023 1,118.754Protein - insol 0.000 186.251 186.251 49.896Protein - solub 439.392 2,064.714 2,121.942 568.467Starch 0.000 22.001 22.001 5.894Sulfuric Acid 20.415 95.931 98.590 26.412Water 15,795.514 74,223.583 76,280.835 20,435.597Yeast Dry Matte 35.364 166.179 170.785 45.753TOTAL (kg/h) 18,316.436 81,121.009 83,926.997 22,484.000TOTAL (L/h) 19,816.199 87,879.765 90,894.230 24,350.518
A68

- Page 25 -
Stream Name S-176 S-101 S-102 S-103
Source FSP-103 605V 606P 607Ev
Destination 605V 606P 607Ev 608T
Stream PropertiesActivity (U/ml) 0.00 0.00 0.00 0.00Temperature (°C) 93.65 93.71 93.74 79.00Pressure (bar) 4.45 1.00 4.45 1.01Density (g/L) 923.35 765.13 923.30 721.42Component Flowrates (kg/h averaged)Ethyl Alcohol 26.809 26.809 26.809 26.208Non-starch Poly 192.777 192.777 192.777 0.000Oil 417.760 417.760 417.760 0.000Other Solids 3,057.269 3,057.269 3,057.269 0.000Protein - insol 136.354 136.354 136.354 0.000Protein - solub 1,553.475 1,553.475 1,553.475 0.000Starch 16.107 16.107 16.107 0.000Sulfuric Acid 72.178 72.178 72.178 0.000Water 55,845.238 55,845.238 55,845.238 45,494.933Yeast Dry Matte 125.031 125.031 125.031 0.000TOTAL (kg/h) 61,442.997 61,442.997 61,442.997 45,521.141TOTAL (L/h) 66,543.712 80,304.322 66,547.083 63,098.973
A69

- Page 26 -
Stream Name S-172 S-104 S-187 S-127
Source 607Ev 608T 609P FSP-101
Destination MX-102 609P FSP-101 307V
Stream PropertiesActivity (U/ml) 0.00 0.00 0.00 0.00Temperature (°C) 79.00 100.00 100.04 100.04Pressure (bar) 1.01 1.01 4.46 4.46Density (g/L) 1,000.67 5.45 2.60 2.60Component Flowrates (kg/h averaged)Carb. Dioxide 0.000 14.055 14.055 14.038Ethyl Alcohol 0.601 422.564 422.564 422.057Non-starch Poly 192.777 0.000 0.000 0.000Oil 417.760 0.000 0.000 0.000Other Solids 3,057.269 0.000 0.000 0.000Protein - insol 136.354 0.000 0.000 0.000Protein - solub 1,553.475 0.000 0.000 0.000Starch 16.107 0.000 0.000 0.000Sulfuric Acid 72.178 0.000 0.000 0.000Water 10,350.305 78,804.123 78,804.123 78,709.558Yeast Dry Matte 125.031 0.000 0.000 0.000TOTAL (kg/h) 15,921.856 79,240.742 79,240.742 79,145.653TOTAL (L/h) 15,911.135 14,551,488.393 30,485,762.061 30,449,179.146
A70

- Page 27 -
Stream Name PC S-115 S-108 S-116
Source FSP-101 307V 308P P-1
Destination OUTPUT 308P P-1 310V
Stream PropertiesActivity (U/ml) 0.00 0.00 0.00 0.00Temperature (°C) 100.04 100.20 100.31 87.00Pressure (bar) 4.46 1.01 4.18 4.18Density (g/L) 2.60 0.85 3.52 686.05Component Flowrates (kg/h averaged)Carb. Dioxide 0.017 14.038 14.038 14.038Ethyl Alcohol 0.507 422.057 422.057 422.057Non-starch Poly 0.000 3,220.954 3,220.954 3,220.954Oil 0.000 1,571.197 1,571.197 1,571.197Other Solids 0.000 3,406.625 3,406.625 3,406.625Protein - insol 0.000 2,278.235 2,278.235 2,278.235Protein - solub 0.000 1,571.197 1,571.197 1,571.197Starch 0.000 27,495.945 27,495.945 27,495.945Water 94.565 87,883.694 87,883.694 87,883.694TOTAL (kg/h) 95.089 127,863.942 127,863.942 127,863.942TOTAL (L/h) 36,582.914 149,730,693.500 36,285,337.062 186,376.044
A71
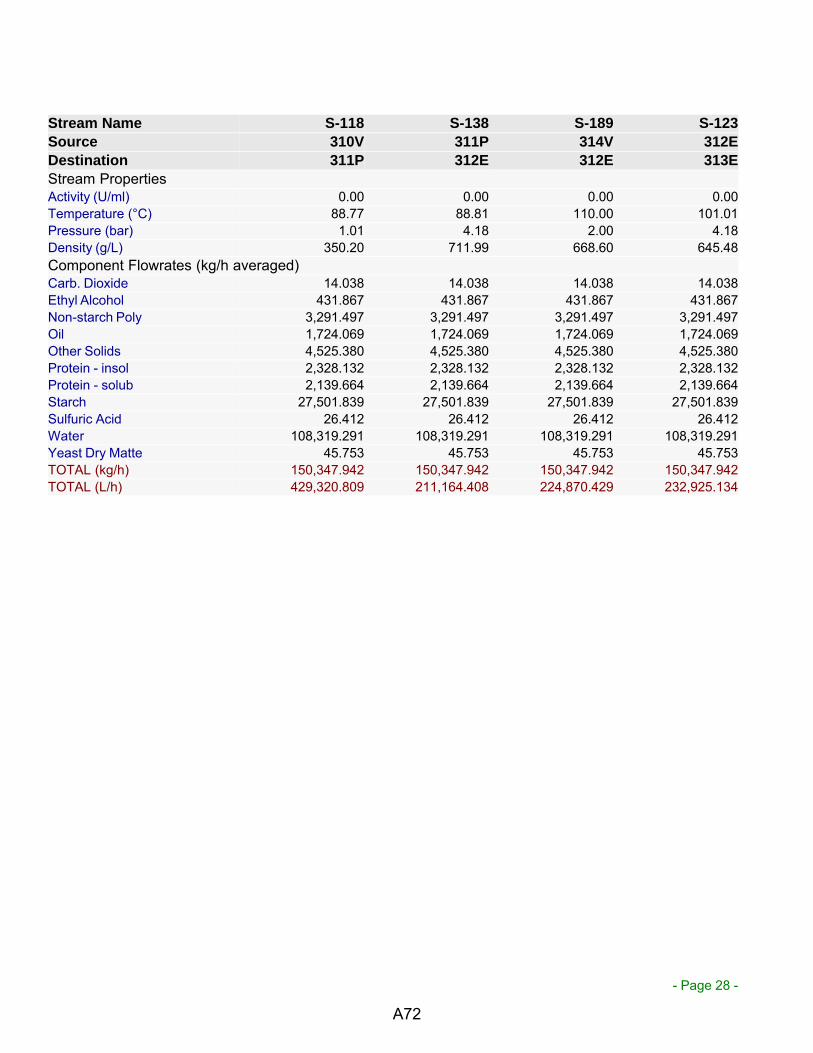
- Page 28 -
Stream Name S-118 S-138 S-189 S-123
Source 310V 311P 314V 312E
Destination 311P 312E 312E 313E
Stream PropertiesActivity (U/ml) 0.00 0.00 0.00 0.00Temperature (°C) 88.77 88.81 110.00 101.01Pressure (bar) 1.01 4.18 2.00 4.18Density (g/L) 350.20 711.99 668.60 645.48Component Flowrates (kg/h averaged)Carb. Dioxide 14.038 14.038 14.038 14.038Ethyl Alcohol 431.867 431.867 431.867 431.867Non-starch Poly 3,291.497 3,291.497 3,291.497 3,291.497Oil 1,724.069 1,724.069 1,724.069 1,724.069Other Solids 4,525.380 4,525.380 4,525.380 4,525.380Protein - insol 2,328.132 2,328.132 2,328.132 2,328.132Protein - solub 2,139.664 2,139.664 2,139.664 2,139.664Starch 27,501.839 27,501.839 27,501.839 27,501.839Sulfuric Acid 26.412 26.412 26.412 26.412Water 108,319.291 108,319.291 108,319.291 108,319.291Yeast Dry Matte 45.753 45.753 45.753 45.753TOTAL (kg/h) 150,347.942 150,347.942 150,347.942 150,347.942TOTAL (L/h) 429,320.809 211,164.408 224,870.429 232,925.134
A72
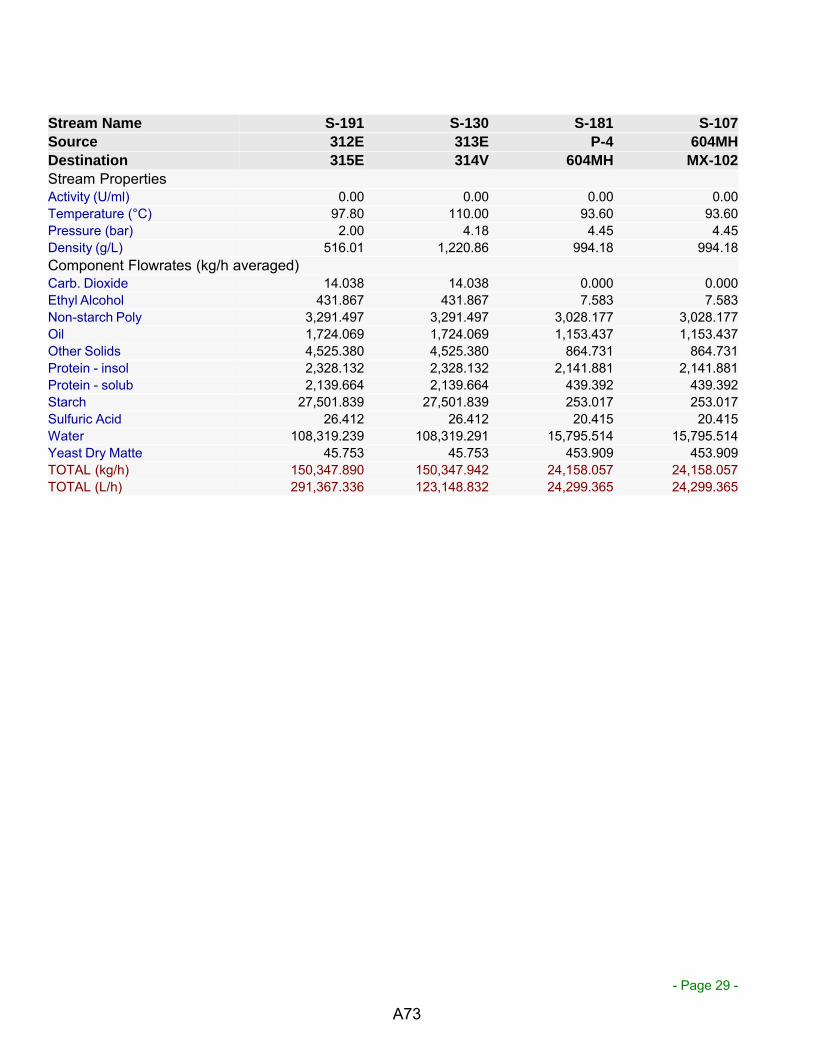
- Page 29 -
Stream Name S-191 S-130 S-181 S-107
Source 312E 313E P-4 604MH
Destination 315E 314V 604MH MX-102
Stream PropertiesActivity (U/ml) 0.00 0.00 0.00 0.00Temperature (°C) 97.80 110.00 93.60 93.60Pressure (bar) 2.00 4.18 4.45 4.45Density (g/L) 516.01 1,220.86 994.18 994.18Component Flowrates (kg/h averaged)Carb. Dioxide 14.038 14.038 0.000 0.000Ethyl Alcohol 431.867 431.867 7.583 7.583Non-starch Poly 3,291.497 3,291.497 3,028.177 3,028.177Oil 1,724.069 1,724.069 1,153.437 1,153.437Other Solids 4,525.380 4,525.380 864.731 864.731Protein - insol 2,328.132 2,328.132 2,141.881 2,141.881Protein - solub 2,139.664 2,139.664 439.392 439.392Starch 27,501.839 27,501.839 253.017 253.017Sulfuric Acid 26.412 26.412 20.415 20.415Water 108,319.239 108,319.291 15,795.514 15,795.514Yeast Dry Matte 45.753 45.753 453.909 453.909TOTAL (kg/h) 150,347.890 150,347.942 24,158.057 24,158.057TOTAL (L/h) 291,367.336 123,148.832 24,299.365 24,299.365
A73

- Page 30 -
Stream Name S-166 HOT AIR S-178 S-170
Source MX-102 INPUT 610D 610D
Destination 610D 610D 611X 612MH
Stream PropertiesActivity (U/ml) 0.00 0.00 0.00 0.00Temperature (°C) 87.69 104.00 70.00 70.00Pressure (bar) 1.01 1.01 1.01 1.01Density (g/L) 911.46 0.93 1.76 1,166.25Component Flowrates (kg/h averaged)Ethyl Alcohol 8.183 0.000 7.752 0.431Nitrogen 0.000 26,608.964 26,608.964 0.000Non-starch Poly 3,220.954 0.000 0.000 3,220.954Oil 1,571.197 0.000 0.000 1,571.197Other Solids 3,922.000 0.000 0.000 3,922.000Oxygen 0.000 8,077.966 8,077.966 0.000Protein - insol 2,278.235 0.000 0.000 2,278.235Protein - solub 1,992.866 0.000 0.000 1,992.866Starch 269.124 0.000 0.000 269.124Sulfuric Acid 92.593 0.000 0.000 92.593Water 26,145.819 0.000 24,768.626 1,377.193Yeast Dry Matte 578.941 0.000 0.000 578.941TOTAL (kg/h) 40,079.913 34,686.930 59,463.308 15,303.535TOTAL (L/h) 43,973.352 37,210,741.444 33,873,175.263 13,121.986
A74

- Page 31 -
Stream Name DDGS S-180 EXHAUST S-158
Source 612MH INPUT 611X 511V
Destination OUTPUT 611X OUTPUT 512P
Stream PropertiesActivity (U/ml) 0.00 0.00 0.00 0.00Temperature (°C) 70.00 25.00 76.05 42.00Pressure (bar) 1.01 1.01 1.01 1.01Density (g/L) 1,166.25 1.18 1.72 771.39Component Flowrates (kg/h averaged)Carb. Dioxide 0.000 0.000 14.812 0.000Ethyl Alcohol 0.431 0.000 0.000 14,688.843Nitrogen 0.000 53.213 26,662.177 0.000Non-starch Poly 3,220.954 0.000 0.000 0.000Oil 1,571.197 0.000 0.000 0.000Other Solids 3,922.000 0.000 0.000 0.000Oxygen 0.000 16.154 8,077.966 0.000Protein - insol 2,278.235 0.000 0.000 0.000Protein - solub 1,992.866 0.000 0.000 0.000Starch 269.124 0.000 0.000 0.000Sulfuric Acid 92.593 0.000 0.000 0.000Water 1,377.193 0.000 24,777.723 57.120Yeast Dry Matte 578.941 0.000 0.000 0.000TOTAL (kg/h) 15,303.535 69.367 59,532.677 14,745.963TOTAL (L/h) 13,121.986 58,827.198 34,542,440.734 19,116.154
Stream Name S-159 S-192 S-179 ETHANOL
Source 512P MX-105 513V 514P
Destination MX-105 513V 514P OUTPUT
Stream PropertiesActivity (U/ml) 0.00 0.00 0.00 0.00Temperature (°C) 42.08 41.77 41.77 41.81Pressure (bar) 4.46 4.46 1.00 2.72Density (g/L) 771.32 769.67 769.67 769.64Component Flowrates (kg/h averaged)Ethyl Alcohol 14,688.843 14,688.843 14,688.843 14,688.843Octane 0.000 300.938 300.938 300.938Water 57.120 57.120 57.120 57.120TOTAL (kg/h) 14,745.963 15,046.901 15,046.901 15,046.901TOTAL (L/h) 19,117.873 19,549.804 19,549.804 19,550.686
A75

- Page 32 -
4. OVERALL COMPONENT BALANCE (kg/h)
COMPONENT IN OUT OUT-INCarb. Dioxide 0.000 14,055.908 14,055.908Ethyl Alcohol 0.000 14,690.573 14,690.573Nitrogen 26,662.177 26,662.177 0.000Non-starch Poly 3,230.645 3,230.645 - 0.000Octane 300.938 300.938 0.000Oil 1,575.925 1,575.925 - 0.000Other Solids 3,416.081 3,931.455 515.375Oxygen 8,094.120 8,077.966 - 16.154Protein - insol 2,285.091 2,285.091 - 0.000Protein - solub 1,575.925 1,997.594 421.670Starch 27,578.681 351.860 - 27,226.821Sulfuric Acid 92.593 92.593 0.000Water 29,444.666 26,428.370 - 3,016.296Yeast Dry Matte 3.045 578.941 575.896TOTAL 104,259.886 104,260.037 0.150
A76

- Page 33 -
5. EQUIPMENT CONTENTS
This section will be skipped (overall process is continuous)
A77

16. Appendix H – Corn Economic Evaluation Report from SuperPro Designer (Kwiatkowski, 2006)
A78

58005000.0058005000.00
119171455.0580003000.00
0.6746534000.0012648990.0059183000.00
- 35.18- 25.90- 1.00
Out of search interval- 170,884,000
Name Unit Cost ($)
101MH 121000.00
979000.00
104M 98000.00
105V 33000.00
106W 51000.00
107V 44000.00
307V 69000.00
305V 9000.00
303V 28000.00
301V 50000.00
302P 4000.00
310V 161000.00
321V 103000.00
317V 84000.00
Vessel Volume = 52.13 m31 / 0 / 0 Receiver Tank 84000.00
April 23, 2010
Power = 0.20 kW1 / 0 / 0 Blending Tank 161000.00
Vessel Volume = 141.43 m31 / 0 / 0 Stirred Reactor 103000.00
Vessel Volume = 8.77 m31 / 0 / 0 Receiver Tank 50000.00
Vessel Volume = 12.19 m31 / 0 / 0 Gear Pump 4000.00
Vessel Volume = 15.28 m31 / 0 / 0 Hopper 9000.00
Vessel Volume = 4.02 m31 / 0 / 0 Receiver Tank 28000.00
Vessel Volume = 100.93 m31 / 0 / 0 Receiver Tank 44000.00
Vessel Volume = 76.90 m31 / 0 / 0 Blending Tank 69000.00
Size/Capacity = 46211.67 kg/h1 / 0 / 0 Receiver Tank 33000.00
Vessel Volume = 76.90 m31 / 0 / 0 Hopper 51000.00
Belt Length = 100.00 m1 / 0 / 0 Silo/Bin 979000.00
Vessel Volume = 18540.29 m31 / 0 / 0 Grinder 98000.00
2. MAJOR EQUIPMENT SPECIFICATION AND FOB COST (2007 prices)
Quantity/Standby/Staggered
Description Cost ($)
1 / 0 / 0 Belt Conveyor 121000.00
IRR (After Taxes) (0-1000%)NPV (at 5.0% Interest) $
MP = Total Flow of Stream ETHANOL
Gross Margin %Return On Investment %Payback Time years
Main Revenue $/yrOther Revenues $/yrTotal Revenues $/yr
Main Product Rate kg MP/yrOperating Cost $/yrProduct Unit Cost $/kg MP
Economic Evaluation Reportfor Corn_to_EtOH_40MGY_v7_5
1. EXECUTIVE SUMMARY (2007 prices)
Total Capital Investment $Capital Investment Charged to This Project $
A79
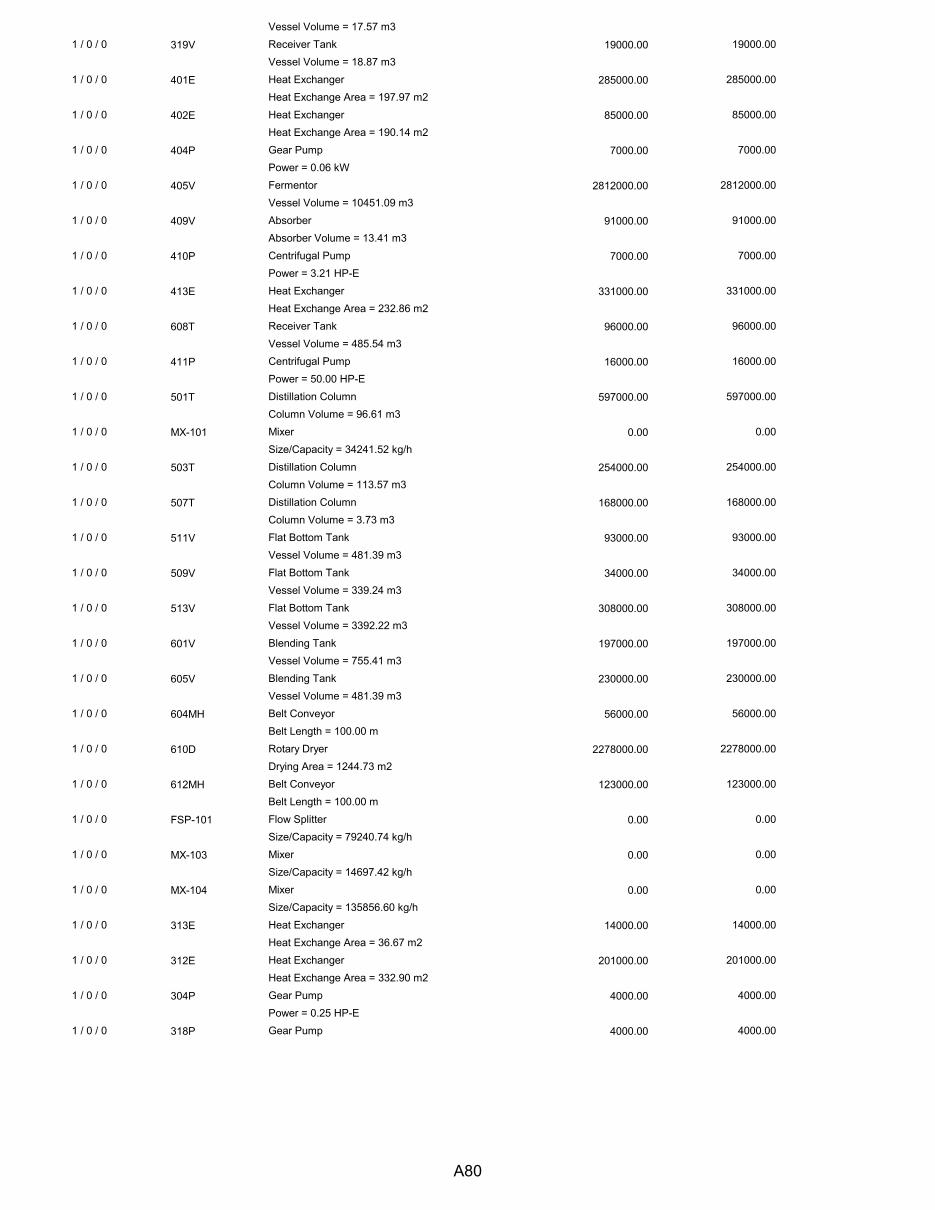
319V 19000.00
401E 285000.00
402E 85000.00
404P 7000.00
405V 2812000.00
409V 91000.00
410P 7000.00
413E 331000.00
608T 96000.00
411P 16000.00
501T 597000.00
MX-101 0.00
503T 254000.00
507T 168000.00
511V 93000.00
509V 34000.00
513V 308000.00
601V 197000.00
605V 230000.00
604MH 56000.00
610D 2278000.00
612MH 123000.00
FSP-101 0.00
MX-103 0.00
MX-104 0.00
313E 14000.00
312E 201000.00
304P 4000.00
318P 4000.00
Power = 0.25 HP-E1 / 0 / 0 Gear Pump 4000.00
Heat Exchange Area = 36.67 m21 / 0 / 0 Heat Exchanger 201000.00
Heat Exchange Area = 332.90 m21 / 0 / 0 Gear Pump 4000.00
Size/Capacity = 14697.42 kg/h1 / 0 / 0 Mixer 0.00
Size/Capacity = 135856.60 kg/h1 / 0 / 0 Heat Exchanger 14000.00
Belt Length = 100.00 m1 / 0 / 0 Flow Splitter 0.00
Size/Capacity = 79240.74 kg/h1 / 0 / 0 Mixer 0.00
Belt Length = 100.00 m1 / 0 / 0 Rotary Dryer 2278000.00
Drying Area = 1244.73 m21 / 0 / 0 Belt Conveyor 123000.00
Vessel Volume = 755.41 m31 / 0 / 0 Blending Tank 230000.00
Vessel Volume = 481.39 m31 / 0 / 0 Belt Conveyor 56000.00
Vessel Volume = 339.24 m31 / 0 / 0 Flat Bottom Tank 308000.00
Vessel Volume = 3392.22 m31 / 0 / 0 Blending Tank 197000.00
Column Volume = 3.73 m31 / 0 / 0 Flat Bottom Tank 93000.00
Vessel Volume = 481.39 m31 / 0 / 0 Flat Bottom Tank 34000.00
Size/Capacity = 34241.52 kg/h1 / 0 / 0 Distillation Column 254000.00
Column Volume = 113.57 m31 / 0 / 0 Distillation Column 168000.00
Power = 50.00 HP-E1 / 0 / 0 Distillation Column 597000.00
Column Volume = 96.61 m31 / 0 / 0 Mixer 0.00
Heat Exchange Area = 232.86 m21 / 0 / 0 Receiver Tank 96000.00
Vessel Volume = 485.54 m31 / 0 / 0 Centrifugal Pump 16000.00
Absorber Volume = 13.41 m31 / 0 / 0 Centrifugal Pump 7000.00
Power = 3.21 HP-E1 / 0 / 0 Heat Exchanger 331000.00
Power = 0.06 kW1 / 0 / 0 Fermentor 2812000.00
Vessel Volume = 10451.09 m31 / 0 / 0 Absorber 91000.00
Heat Exchange Area = 197.97 m21 / 0 / 0 Heat Exchanger 85000.00
Heat Exchange Area = 190.14 m21 / 0 / 0 Gear Pump 7000.00
1 / 0 / 0 Receiver Tank 19000.00Vessel Volume = 18.87 m3
1 / 0 / 0 Heat Exchanger 285000.00
Vessel Volume = 17.57 m3
A80

320P 4000.00
403V 115000.00
611X 925000.00
514P 40000.00
510P 5000.00
314V 174000.00
412V 62000.00
408E 19000.00
316E 614000.00
308P 25000.00
311P 15000.00
322P 15000.00
406P 76000.00
407P 15000.00
502P 13000.00
506P 7000.00
508P 5000.00
505P 4000.00
606P 11000.00
602P 13000.00
609P 12000.00
512P 5000.00
315E 51000.00
306P 4000.00
MX-105 0.00
MX-102 0.00
607Ev 3415000.00
103MH 61000.00
504X 1718000.00
Evaporation Area = 664.18 m21 / 0 / 0 Flow Splitter 61000.00
Size/Capacity = 46350.72 kg/h1 / 0 / 0 Component Splitter 1718000.00
Size/Capacity = 15046.90 kg/h1 / 0 / 0 Mixer 0.00
Size/Capacity = 40079.91 kg/h1 / 0 / 0 Evaporator 3415000.00
Heat Exchange Area = 179.12 m21 / 0 / 0 Gear Pump 4000.00
Power = 5.00 HP-E1 / 0 / 0 Mixer 0.00
Power = 20.00 HP-E1 / 0 / 0 Centrifugal Pump 5000.00
Power = 10.00 HP-E1 / 0 / 0 Heat Exchanger 51000.00
Power = 20.00 HP-E1 / 0 / 0 Centrifugal Pump 13000.00
Power = 50.00 HP-E1 / 0 / 0 Centrifugal Pump 12000.00
Power = 10.00 HP-E1 / 0 / 0 Centrifugal Pump 4000.00
Power = 0.35 HP-E1 / 0 / 0 Centrifugal Pump 11000.00
Power = 50.00 HP-E1 / 0 / 0 Centrifugal Pump 7000.00
Power = 20.00 HP-E1 / 0 / 0 Centrifugal Pump 5000.00
Power = 25.34 HP-E1 / 0 / 0 Centrifugal Pump 15000.00
Power = 12.76 HP-E1 / 0 / 0 Centrifugal Pump 13000.00
Power = 50.00 kW1 / 0 / 0 Centrifugal Pump 15000.00
Power = 50.00 HP-E1 / 0 / 0 Centrifugal Pump 76000.00
Heat Exchange Area = 405.68 m21 / 0 / 0 Centrifugal Pump 25000.00
Power = 3.55 kW1 / 0 / 0 Centrifugal Pump 15000.00
Vessel Volume = 14.29 m31 / 0 / 0 Condenser 19000.00
Condensation Area = 58.70 m21 / 0 / 0 Heat Exchanger 614000.00
Power = 5.00 HP-E1 / 0 / 0 Receiver Tank 174000.00
Vessel Volume = 14.16 m31 / 0 / 0 Flash Drum 62000.00
Vessel Volume = 13.33 m31 / 0 / 0 Gear Pump 40000.00
Power = 1.79 HP-E1 / 0 / 0 Gear Pump 5000.00
Power = 0.02 kW1 / 0 / 0 Blending Tank 115000.00
Vessel Volume = 2.97 m31 / 0 / 0 Wet Air Oxidizer 925000.00
Power = 0.25 HP-E1 / 0 / 0 Gear Pump 4000.00
A81

603.00 852000.00
split 0.00
MX-106 0.00
FSP-103 0.00
MX-107 0.00
HX-101 23000.00
TOTAL
Unit Cost ($/h)
Annual Amount (h)
Annual Cost ($)
0.00 0.00 0.0052.00 39600.00 2059200.00
39600.00 2059200.00
Unit Cost($/kg)
Annual Amount(kg)
Annual Cost ($)
0.14 367097738.00 50567713.000.09 438190.00 39437.000.22 733337.00 161334.002.25 257139.00 578562.002.25 371408.00 835669.000.11 733337.00 80667.000.01 18423742.00 223296.001.86 96466.00 179426.000.00 159933643.00 7037.000.72 2383429.00 1722266.000.00 275269874.00 0.00
Water 0.01Octane 3.17Air 0.00
Sulfuric Acid 0.15Caustic 0.41Yeast 0.33
Liq. Ammonia 0.30Alpha-Amylase 1.06Glucoamylase 1.54
Bulk Material %
Corn 92.96Lime 0.07
Plant Operators 100.00TOTAL 100.00
5. MATERIALS COST - PROCESS SUMMARY
4. LABOR COST - PROCESS SUMMARY
Labor Type %
Operator 0.00
CoProduct Processing 24624000.00Common Suport Systems 2200000.00Plant DFC 58005000.00
Starch to Sugar Conversion 4956000.00Fermentation 11760000.00Ethanol Processing 9752000.00
Section Name DFC ($)Main Section 552000.00Grain Handling & Milling 4161000.00
Heat Exchange Area = 98.85 m2Unlisted Equipment 0.00
18556000.00
3. DIRECT FIXED CAPITAL COST (DFC) SUMMARY (2007 prices in $)
Size/Capacity = 83927.00 kg/h1 / 0 / 0 Mixer 0.00
Size/Capacity = 83927.00 kg/h6 / 0 / 0 Heat Exchanger 138000.00
Size/Capacity = 108085.05 kg/h1 / 0 / 0 Mixer 0.00
Size/Capacity = 24158.06 kg/h1 / 0 / 0 Flow Splitter 0.00
Size/Capacity = 19432.46 kg/h1 / 0 / 0 Disk-Stack Centrifuge 852000.00
Throughput = 1735.13 L/min1 / 0 / 0 Component Splitter 0.00
A82
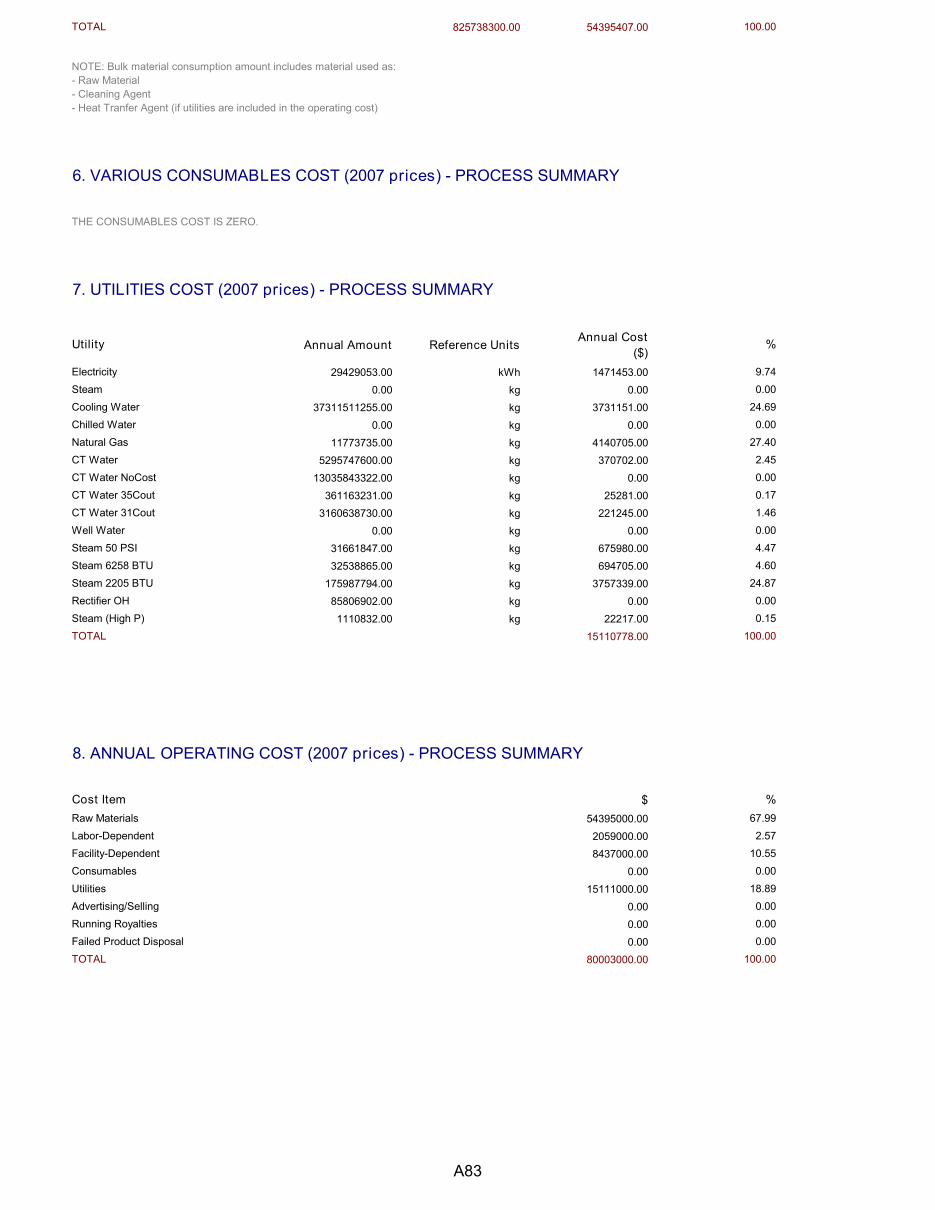
825738300.00 54395407.00
Annual Amount Reference Units Annual Cost ($)
29429053.00 kWh 1471453.000.00 kg 0.00
37311511255.00 kg 3731151.000.00 kg 0.00
11773735.00 kg 4140705.005295747600.00 kg 370702.00
13035843322.00 kg 0.00361163231.00 kg 25281.00
3160638730.00 kg 221245.000.00 kg 0.00
31661847.00 kg 675980.0032538865.00 kg 694705.00
175987794.00 kg 3757339.0085806902.00 kg 0.001110832.00 kg 22217.00
15110778.00
$54395000.002059000.008437000.00
0.0015111000.00
0.000.000.00
80003000.00
Failed Product Disposal 0.00TOTAL 100.00
Utilities 18.89Advertising/Selling 0.00Running Royalties 0.00
Labor-Dependent 2.57Facility-Dependent 10.55Consumables 0.00
8. ANNUAL OPERATING COST (2007 prices) - PROCESS SUMMARY
Cost Item %Raw Materials 67.99
Rectifier OH 0.00Steam (High P) 0.15TOTAL 100.00
Steam 50 PSI 4.47Steam 6258 BTU 4.60Steam 2205 BTU 24.87
CT Water 35Cout 0.17CT Water 31Cout 1.46Well Water 0.00
Natural Gas 27.40CT Water 2.45CT Water NoCost 0.00
Steam 0.00Cooling Water 24.69Chilled Water 0.00
7. UTILITIES COST (2007 prices) - PROCESS SUMMARY
Utility %
Electricity 9.74
TOTAL 100.00
NOTE: Bulk material consumption amount includes material used as:- Raw Material- Cleaning Agent- Heat Tranfer Agent (if utilities are included in the operating cost)
6. VARIOUS CONSUMABLES COST (2007 prices) - PROCESS SUMMARY
THE CONSUMABLES COST IS ZERO.
A83

58005000.000.000.000.000.00
58005000.0058005000.00
121203994.00119171455.00
80003000.00
0.67
0.100.39
12649000.0046534000.0059183000.00
- 20,820,0000.00
- 15,022,000
Gross Margin NegativeReturn On Investment NegativePayback Time Negative
N. Taxes (40%) $/yrO. Net Profit (M-N + Depreciation) $/yr
Total Revenues $/yr
M. Gross Profit (L-I) $/yr
L. RevenuesDDGS (Other Revenue) $/yrETHANOL (Main Revenue) $/yr
K. Selling / Processing PriceTotal flow in DDGS $/kgTotal flow of stream ETHANOL $/kg
AOC $/yr
J. Product Unit CostETHANOL $/kg
Total flow in DDGS (Other Revenue) kg/yrTotal flow of stream ETHANOL (Main Revenue) kg/yr
I. Annual Operating Cost
G. Investment Charged to This Project $
H. Revenue/Credit Stream Flowrates
E. Up-Front Royalties $F. Total Investment (A+B+C+D+E) $
C. Startup Cost $D. Up-Front R&D $
9. PROFITABILITY ANALYSIS (2007 prices)
A. Direct Fixed Capital $B. Working Capital $
A84

A85
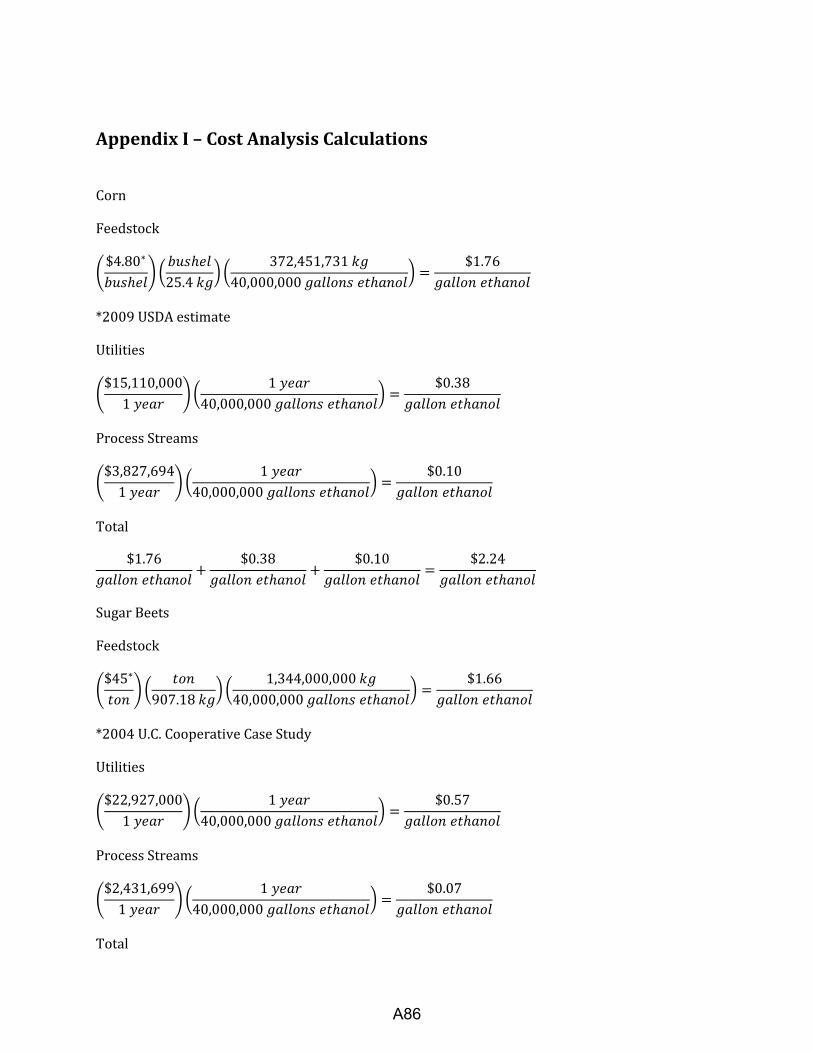
Appendix I – Cost Analysis Calculations
Corn
Feedstock
$4.80∗
𝑏𝑢𝑠ℎ𝑒𝑙
𝑏𝑢𝑠ℎ𝑒𝑙
25.4 𝑘𝑔
372,451,731 𝑘𝑔
40,000,000 𝑔𝑎𝑙𝑙𝑜𝑛𝑠 𝑒𝑡ℎ𝑎𝑛𝑜𝑙 =
$1.76
𝑔𝑎𝑙𝑙𝑜𝑛 𝑒𝑡ℎ𝑎𝑛𝑜𝑙
*2009 USDA estimate
Utilities
$15,110,000
1 𝑦𝑒𝑎𝑟
1 𝑦𝑒𝑎𝑟
40,000,000 𝑔𝑎𝑙𝑙𝑜𝑛𝑠 𝑒𝑡ℎ𝑎𝑛𝑜𝑙 =
$0.38
𝑔𝑎𝑙𝑙𝑜𝑛 𝑒𝑡ℎ𝑎𝑛𝑜𝑙
Process Streams
$3,827,694
1 𝑦𝑒𝑎𝑟
1 𝑦𝑒𝑎𝑟
40,000,000 𝑔𝑎𝑙𝑙𝑜𝑛𝑠 𝑒𝑡ℎ𝑎𝑛𝑜𝑙 =
$0.10
𝑔𝑎𝑙𝑙𝑜𝑛 𝑒𝑡ℎ𝑎𝑛𝑜𝑙
Total
$1.76
𝑔𝑎𝑙𝑙𝑜𝑛 𝑒𝑡ℎ𝑎𝑛𝑜𝑙+
$0.38
𝑔𝑎𝑙𝑙𝑜𝑛 𝑒𝑡ℎ𝑎𝑛𝑜𝑙+
$0.10
𝑔𝑎𝑙𝑙𝑜𝑛 𝑒𝑡ℎ𝑎𝑛𝑜𝑙=
$2.24
𝑔𝑎𝑙𝑙𝑜𝑛 𝑒𝑡ℎ𝑎𝑛𝑜𝑙
Sugar Beets
Feedstock
$45∗
𝑡𝑜𝑛
𝑡𝑜𝑛
907.18 𝑘𝑔
1,344,000,000 𝑘𝑔
40,000,000 𝑔𝑎𝑙𝑙𝑜𝑛𝑠 𝑒𝑡ℎ𝑎𝑛𝑜𝑙 =
$1.66
𝑔𝑎𝑙𝑙𝑜𝑛 𝑒𝑡ℎ𝑎𝑛𝑜𝑙
*2004 U.C. Cooperative Case Study
Utilities
$22,927,000
1 𝑦𝑒𝑎𝑟
1 𝑦𝑒𝑎𝑟
40,000,000 𝑔𝑎𝑙𝑙𝑜𝑛𝑠 𝑒𝑡ℎ𝑎𝑛𝑜𝑙 =
$0.57
𝑔𝑎𝑙𝑙𝑜𝑛 𝑒𝑡ℎ𝑎𝑛𝑜𝑙
Process Streams
$2,431,699
1 𝑦𝑒𝑎𝑟
1 𝑦𝑒𝑎𝑟
40,000,000 𝑔𝑎𝑙𝑙𝑜𝑛𝑠 𝑒𝑡ℎ𝑎𝑛𝑜𝑙 =
$0.07
𝑔𝑎𝑙𝑙𝑜𝑛 𝑒𝑡ℎ𝑎𝑛𝑜𝑙
Total
A86
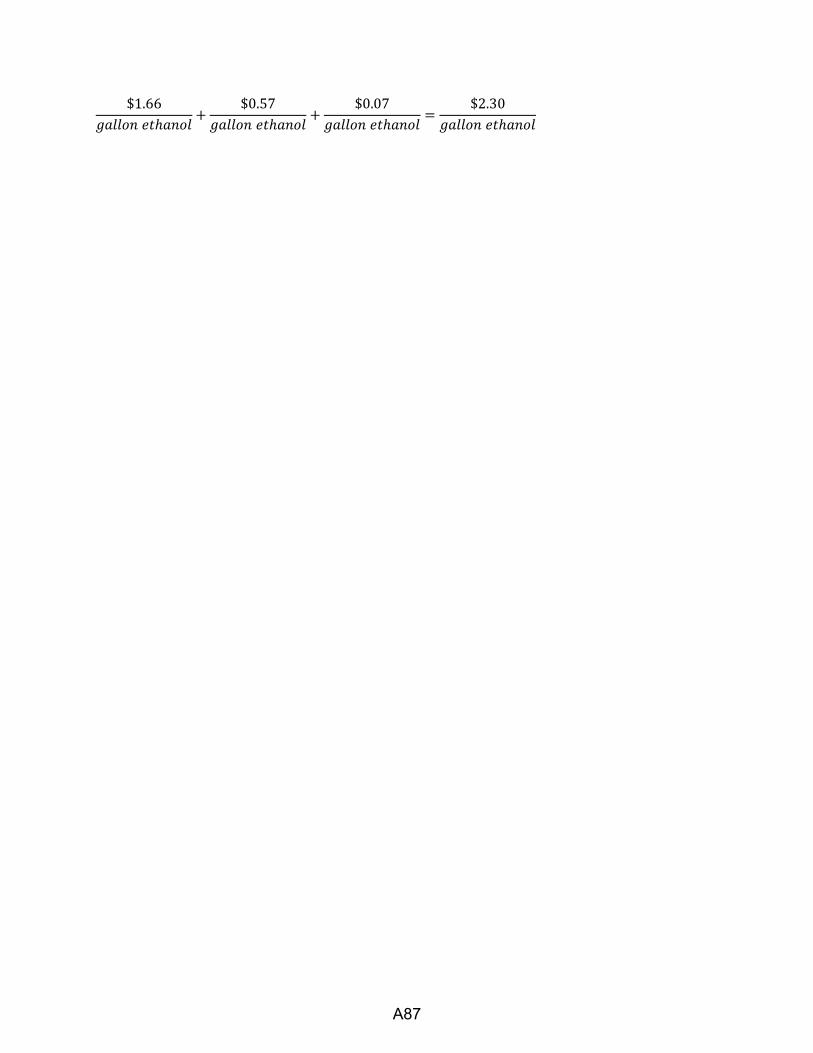
$1.66
𝑔𝑎𝑙𝑙𝑜𝑛 𝑒𝑡ℎ𝑎𝑛𝑜𝑙+
$0.57
𝑔𝑎𝑙𝑙𝑜𝑛 𝑒𝑡ℎ𝑎𝑛𝑜𝑙+
$0.07
𝑔𝑎𝑙𝑙𝑜𝑛 𝑒𝑡ℎ𝑎𝑛𝑜𝑙=
$2.30
𝑔𝑎𝑙𝑙𝑜𝑛 𝑒𝑡ℎ𝑎𝑛𝑜𝑙
A87