ETFs as a source of Income · ETFs as a source of Income June 2013 ... Retail Investors Websites...
15
ETFs as a source of Income June 2013 PRESENTED BY GARETH STOBIE
Transcript of ETFs as a source of Income · ETFs as a source of Income June 2013 ... Retail Investors Websites...

ETFs as a source of Income
June 2013
PRESENTED BY GARETH STOBIE

Introduction to Grindrod Bank’s ETF suite:
Tax efficient, 7.48%
No long term growth to income stream
Preference
Shares
6.95% taxable
Long term growth to income stream
Property
Grindrod: Exchange Traded Products

Your share of the South African listed property market
Liquid and cost effective
Growing income stream > 6%
Tangible investment secured by ‘bricks and mortar’
Regulated and transparent
Historical performance
PROPTRAX : PROPERTY ETFs

(20)
(10)
0
10
20
30
40
50
60
2003 2004 2005 2006 2007 2008 2009 2010 2011 2012
Income Price
Average annual income
return 11.01
Listed Property Returns and How They are
Derived?
Average annual returns: 26.08 percent
Average annual income: 11.01 percentage points or 43 percent of total return
Source: I-Net

Scorecard
SA Short Rates + Notwithstanding recent spike in bond yields,
generally low yields set to continue
SA Property Fundamentals 0
Industrial and retail doing well
Office continues to struggle
Forecast 6-8% pa distribution grow next 2-3 years
SA Valuations 0 Recent pull-back healthy for the market but yields
remain below historical average
Funding + Extremely low funding rates available to property
companies
Demand / Supply for SA
Listed Property 0
REIT legislation to be positive for sector
Numerous new issuances pose some supply side
risk but the issues remain over-subscribed
TOTAL + 2 Mildly positive outlook
Property Prospects

Investment Portfolio Portfolio with Property
Stocks 60.00% 50.00%
Bonds 30.00% 30.00%
Cash 10.00% 10.00%
Listed Property 0.00% 10.00%
100.00% 100.00%
10 Years, annualized
Return 16.80% 17.33%
Risk 10.40% 9.78%
Risk vs. Return : An Investors Quandary?

SAPY TEN
Index SAPY Customized, top ten
equally weighted
Yield(1) 6.78% 7.12%
Size R108m R141m
Share PTXSPY PTXTEN
1 Year(2) 26.0% 21.9%
3 Year(2) 21.6% n/a
PTX TEN & SAPY
Source: I-Net
(1) As at 14 June 2013
(2) Source: SIM. Performance annualised, gross of fees
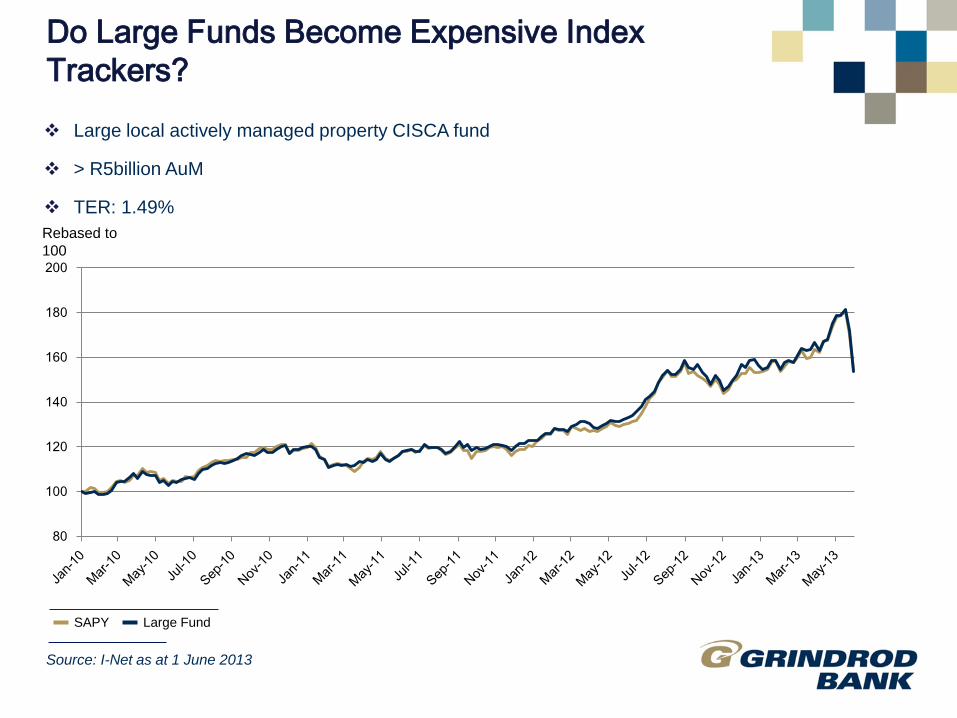
Do Large Funds Become Expensive Index
Trackers?
Large local actively managed property CISCA fund
> R5billion AuM
TER: 1.49%
SAPY Large Fund
80
100
120
140
160
180
200
Rebased to
100
Source: I-Net as at 1 June 2013

SA’s Preference share ETF
Hybrid investment: part Equity, part Debt
High yielding 7.48% fixed income investment
Significant pick-up in after tax yields relative to cash
Tax efficient (max DWT @ 15%)
Comparable to bonds and cash but must invest > 12 months
Very attractive after surprising pull back in valuations

Prefs vs. Cash since start of Financial Crisis
90
100
110
120
130
140
150
160
170
Jul-0
8
Sep-0
8
No
v-0
8
Jan-0
9
Ma
r-0
9
Ma
y-0
9
Jul-0
9
Sep-0
9
No
v-0
9
Jan-1
0
Ma
r-1
0
Ma
y-1
0
Jul-1
0
Sep-1
0
No
v-1
0
Jan-1
1
Ma
r-1
1
Ma
y-1
1
Jul-1
1
Sep-1
1
No
v-1
1
Jan-1
2
Ma
r-1
2
Ma
y-1
2
Jul-1
2
Sep-1
2
No
v-1
2
Jan-1
3
Ma
r-1
3
Ma
y-1
3
J251T STFIND
53%
23%
Rebased to
100
On an after tax basis the J251 has outperformed the Stefi
Source: I-Net as at 07 June 2013
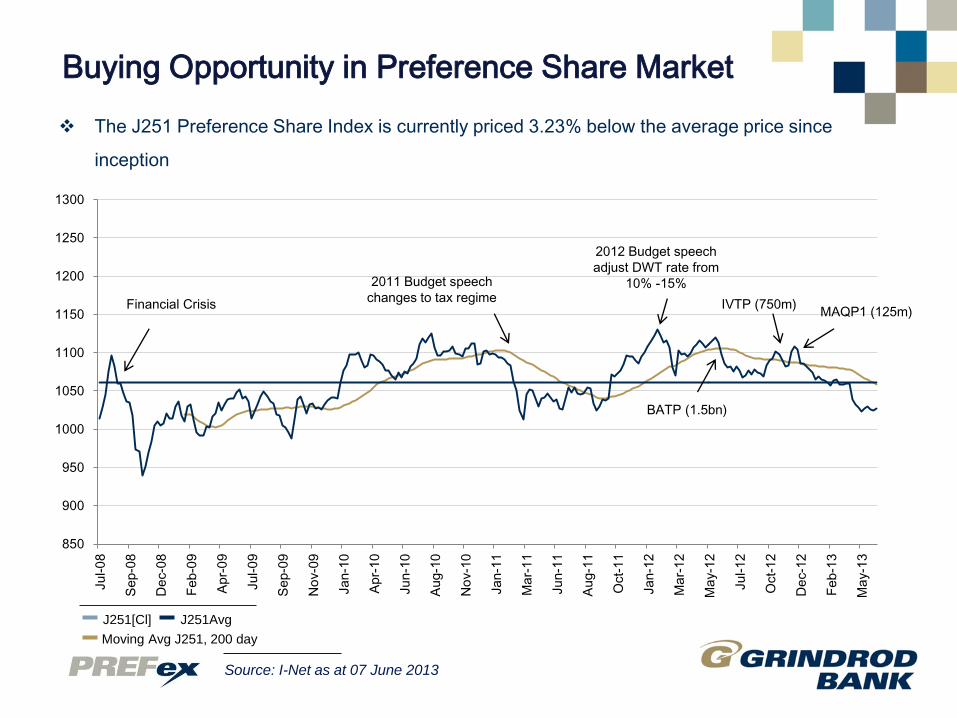
Buying Opportunity in Preference Share Market
Source: I-Net as at 07 June 2013
850
900
950
1000
1050
1100
1150
1200
1250
1300
Jul-0
8
Sep-0
8
De
c-0
8
Feb
-09
Apr-
09
Jul-0
9
Sep-0
9
No
v-0
9
Jan-1
0
Apr-
10
Jun-1
0
Aug-1
0
No
v-1
0
Jan-1
1
Ma
r-1
1
Jun-1
1
Aug-1
1
Oct-
11
Jan-1
2
Ma
r-1
2
Ma
y-1
2
Jul-1
2
Oct-
12
De
c-1
2
Feb
-13
Ma
y-1
3
2011 Budget speech
changes to tax regime
2012 Budget speech
adjust DWT rate from
10% -15%
BATP (1.5bn)
IVTP (750m) MAQP1 (125m)
Financial Crisis
J251Avg
Moving Avg J251, 200 day
J251[Cl]
The J251 Preference Share Index is currently priced 3.23% below the average price since
inception
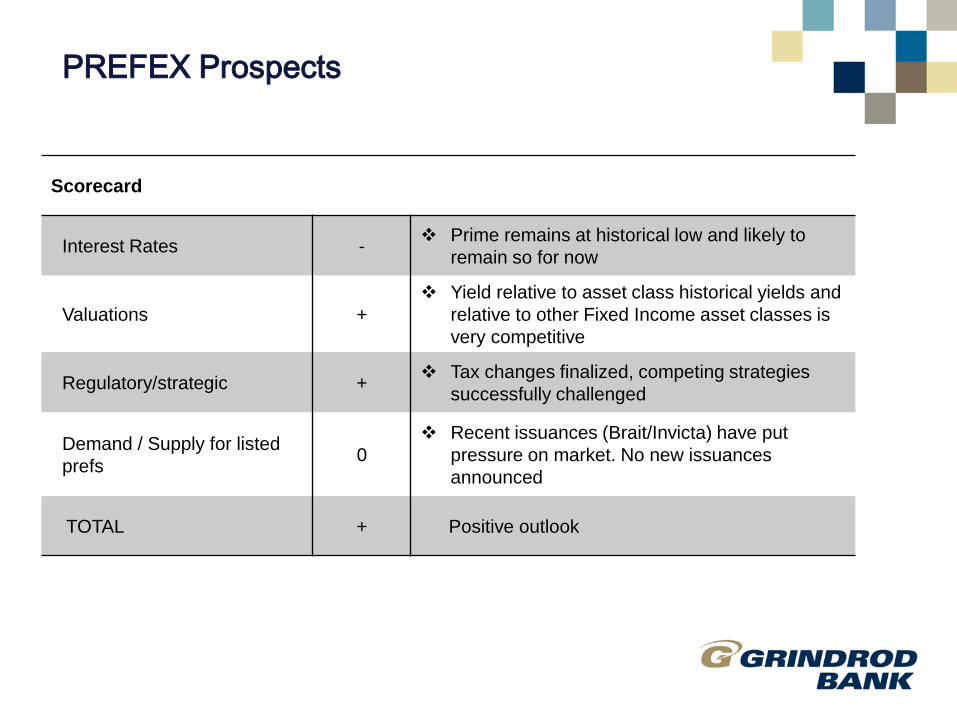
Scorecard
Interest Rates - Prime remains at historical low and likely to
remain so for now
Valuations +
Yield relative to asset class historical yields and
relative to other Fixed Income asset classes is
very competitive
Regulatory/strategic + Tax changes finalized, competing strategies
successfully challenged
Demand / Supply for listed
prefs 0
Recent issuances (Brait/Invicta) have put
pressure on market. No new issuances
announced
TOTAL + Positive outlook
PREFEX Prospects
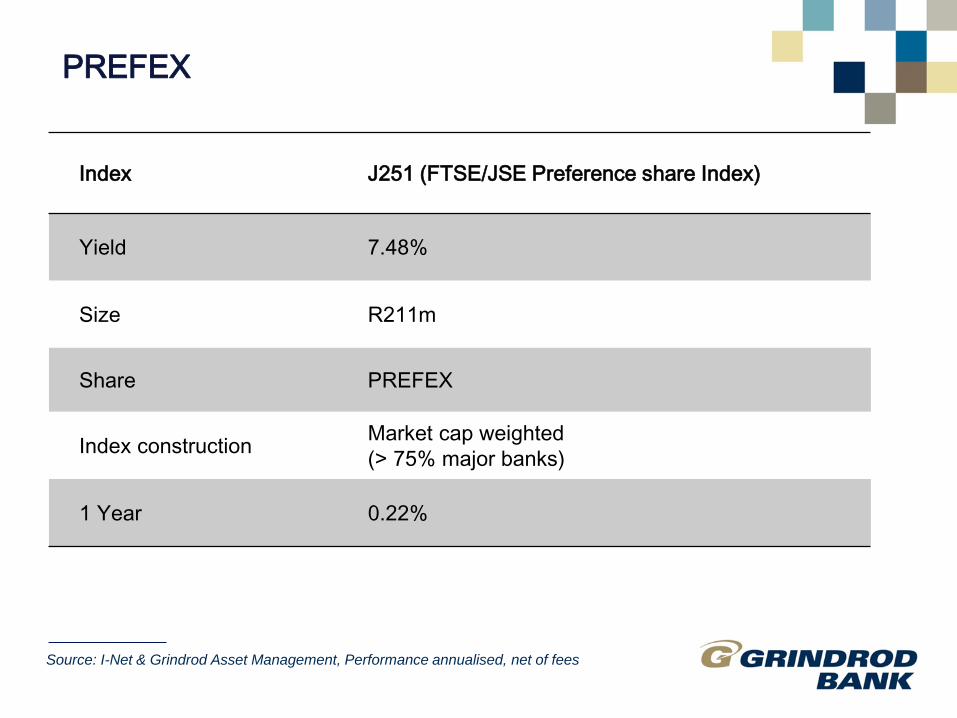
Source: I-Net & Grindrod Asset Management, Performance annualised, net of fees
Index J251 (FTSE/JSE Preference share Index)
Yield 7.48%
Size R211m
Share PREFEX
Index construction Market cap weighted
(> 75% major banks)
1 Year 0.22%
PREFEX

Source: Source: BlackRock as at end of 2012
Core: Broad diversification by closely mirroring asset
class benchmarks
Consistent performance relative to a benchmark
Low costs
Improved risk management
Satellite: Precise exposure to a wide range of discrete
market sectors, specific styles or market capitalisations indices
Exposure to selected market segments at low costs
Eliminating security selection or manager selection risk
14
ETF Usage Example: Core Satellite Strategy

Grindrod Securities Capital Markets
Taryn Mulligan
Telephone: +27 (0)31 333 6633
Fax: +27 (0)31 571 0505
Email: [email protected]
Chris Rule
Telephone: +27 (0)11 459 1846
Fax: +27 (0)11 388 2341
Email: [email protected]
Retail Investors Websites
Retail investors can transact through the etfSA
Investor Scheme
Telephone: 0861 3837 21
Website: www.etfsa.co.za
www.proptrax.co.za
www.grindrodsecurities.co.za
www.grindrodbank.co.za
Contact