ETF Indexing Chapter2
10
-
Upload
mandar-lawande -
Category
Documents
-
view
224 -
download
0
Transcript of ETF Indexing Chapter2

After dinner, Shivkumar was unwinding over a cup of filter coffee. Mini had
put Aditya to bed and she joined him, chatting happily about everything
that happened during the day. As was the case lately, the topic soon came
around to the little baby they were expecting. It was then that Shiv remembered
his conversation with his colleagues on the way home. He told Mini about it and
she listened with attention. When he explained how he wished he could invest
in the index, she smiled sweetly and said, “What exactly is an index? I know that
the Sensex and the Nifty are indices but how is an index created? Why does its
value keep changing? How does one index differ from another? And…” “Hold it;
hold it…” he replied, smiling back at her affectionately. “One question at a
time” Although he was now a professional copy writer, he had graduated in
statistics and was very conversant with how indices were created and how they
worked.
SECTION 2
Back To Basics
Back To Basics
19

Back To BasicsETFs AND INDEXING
20 21
“Let me explain what an index is with the help of an analogy that you would
understand,” he began. “Now I know that you are an expert at managing the
household budget, so why don't we create an example around that.” She
looked at him quizzically but let him carry on. “Let's decide what broad
categories our household expenses fall under. What would these be?” After
thinking a little, she replied, “Groceries, toiletries, vegetables, milk, fees, utility
and other bills and loan repayments, salaries to domestic help and other
miscellaneous expenses like toys and clothes, eating out, minor household
repairs, etc.”
“Alright,” nodded Shiv. “Now, let's say we
begin our indexing exercise with last
month's house hold expenses as the
base. This means from now on, we will
compare all rises in the budget to last
month's level of expenses.”
“Would you be able to tell me how much
was spent on each broad head?” he
asked. “That would be difficult,” she answered, frowning a little. Shiv carried
on, “Just for simplicity sake, shall we assume that Rs 17,000 went towards
payment of fees, bills and loan repayments, another Rs 8,000 towards
groceries, toiletries, vegetables and milk, yet another Rs 5,000 towards
salaries of domestic helpers and Rs 4,000 towards miscellaneous expenses?”
“Sounds fair enough,” she replied. “When we total up all these expenses, we
realise that we spent a
total of Rs 34,000. To
make this figure our
base, we reduce it to
100.”
Then he jotted it down on
a handy note book to
make it clearer for her. “Now suppose this month, for some reason, the amount
that is spent on each sub head increases by 10 per cent, i.e., fees, bills and
loan repayments become Rs 18,700, groceries et al become 8,800, salaries
increase to Rs 5,500 and miscellaneous expenses become Rs 4,400. The
index will increase by 10 per cent.”
Again, he jotted down and she was impressed to see that an increase of 10 per
cent in each item took the index so neatly to 110. He then explained that as the
value of the components of the index increased or decreased, the overall index
would increase or decrease accordingly. “What if some components increase
and others decrease?” she asked. “Then the index would increase or decrease
depending on whether the magnitude of the increase or decrease was
greater,” he explained. Alongside, he drew out a couple of further extensions
on the same index base. He showed her how a 10 per cent decrease in all the
items would result in a decrease of 10 per cent in the overall index. Then how a
mix of increasing and decreasing items could either result in an increase or
decrease in the index.
Finally, Mini said, “I understand how that basic index works but does it work in
the same way for stocks?” “Yes, the construction of a stock market index works
on a similar principle,” explained Shiv. “A stock market index is created by
Bills, fees and loans
Groceries etc
Salaries
Misc.
Total
Index calculation
8,000
5,000
4,000
34,000
Base Month
17,000
34,000
34,000x100.00
Index number 100.00
Bills, fees and loans
Groceries etc
Salaries
Misc.
Total
Index calculation
Index number
Base Month
17,000
8,000
5,000
4,000
34,000
34,000
34,000x100
100.00
18,700
8,800
5,500
4,400
37,400
110.00
37,400
34,000x100
Month 2
Bills,
fees and
loans
Groceries
etc
Salaries
Misc.
Total
Index
calculation
Index
number
17,000
8,000
5,000
4,000
34,000
34,000
= 100.00
Base
Month
37,400
34,000x100
18,700
8,800
5,500
4,400
37,400
= 110.00
Month 2
30,600
34,000x100
15,300
7,200
4,500
3,600
30,600
= 90.00
Month 3
33,700
34,000x100
16,500
8,200
5,100
3,900
33,700
= 99.11
Month 4
18,200
8,300
4,800
3,900
35,200
= 104.00
35,200
34,000x100
Month 5

Back To BasicsETFs AND INDEXING
22 23
putting together, with the help of a formula, the values of stocks of certain
select companies traded in a particular market. Accordingly, as the values of
the component stocks fluctuate, so does the index.”
“What formula is used to calculate a stock index?” asked Mini, all charged up
with the informal tutorial in statistics that she was enjoying. “Actually, the
formula for calculating the index could differ from index to index. For instance,
there are market-value weighted indices, free float market value-weighted
What is Indexing?
Indexing to beat active investing
Indexing is the process of linking the performance of a portfolio of stocks to that of an
index. More specifically, it involves investing in a pool of stocks that form part of an index
in the same proportion as is there in the index. It is done to replicate the performance of an
underlying market, especially if the index is a broad market index, which closely matches
the return of the overall stock market.
Alternatively, indexing to a more specific index allows the investor to quantitatively track
and measure the returns that have been earned by some underlying group of securities.
It is convenient as it becomes a 'Set it - forget it' strategy, as the returns will not stray far
from that of the market.
As investment guru Peter Lynch explains, “All the time and effort people devote to picking
the right fund, the hot hand, the great manager have, in most cases, led to no advantage."
and "Most individual investors would be better off in an index mutual fund.” This is
because stock market investment is not a zero sum game, i.e., when markets are up,
everyone wins and when markets are down, every one loses, with exceptions. However,
outperforming the market is a zero sum game, i.e. for some investors to outperform the
average, others have to under-perform. In the process, mirroring an index gives an
investor the best chance to reap market linked returns.
Facets that make up an ideal index
The creation of an ideal index is the dream and hope of market researchers. An ideal index
is one that is
lRepresentative of the market
lAdaptable to the dynamics of the market
lTransparent
lServes as a suitable benchmark for portfolio managers, enabling them to
evaluate the performance of their portfolios.
Different types of indices based on their method of construction
lMarket-value weighted index
lFree float market value-weighted index
lPrice-weighted index
l Total Returns index
lEqually-weighted index
In this method, each stock selected to form the index is given a weighting that is directly
proportional to the market capitalization of that stock. This method is based on the premise
that large companies have bigger revenues and higher profits, as compared to small
companies. Thus, they have a higher impact on economic activities and should therefore be
given a higher weightage. The following stock indices are constructed using this method:
?Wilshire 5000?NYSE Composite Index?London FTSE
The market value-weighted index takes into account all the shares issued by a company.
However, normally not all the issued shares are available for trading. Some shares, like the
holdings of promoters, those held by the Government, those acquired under the FDI route, etc.
are not freely traded. Experts opine that only the shares that are freely available for trading,
also called free float shares, should be used to compute an index. Only then can the true market
trend can be comprehended. An index that follows this method is called a free float market
value-weighted index or float adjusted market value-weighted index. In India, the BSE Sensex
and a few other BSE indices follow the free float methodology. The Nasdaq Composite index is
also constructed using the free float market value weighted method
In this method, each stock is given a weight that is directly proportional to its market price. The
following indices are constructed using this method:lDow Jones Industrial Average (DJIA)lNikkei 225
A price index reflects the returns one would earn if investment is made in the index portfolio.
However, it does not take into consideration the returns arising from dividend receipts. Only
the capital gains arising due to the price movements of constituent stocks are captured by a
price index. To get a better picture of returns, the dividends received from the constituent
stocks also need to be factored into the index values. Such an index, which includes the
dividends received, is called the Total Returns Index.lTotal returns indices are available on the S&P CNX Nifty Price index and
other S&P CNX Nifty indices
In this method, as the name suggest, each stock is given an equal weight. No differences in
weighting are attached to large and small companies. Normally, in any market, there are a
large number of small companies and only a few big companies. This method attaches a lot of
importance to the activities of small companies.
?S&P CNX Nifty?CNX Nifty Junior?S&P CNX 500

“Most of the mutual fund investments I have are index funds, approximately 75%.”
- Charles R. Schwab, founder and CEO of the Charles Schwab Corporation
Back To BasicsETFs AND INDEXING
24 25
indices, price-weighted indices, equally-weighted indices and others too”
Mini looked a little confused and before she could spring another barrage of
questions at him, Shiv continued, “These indices are constructed by experts
and understanding how an index is constructed may be an interesting
intellectual pursuit. However, from the point of view of an investor who needs to
track the stock market, it is enough to know that it is created in a way that it
reflects the movement and trends of the market or segment of the market,
depending on the choice of stocks that go to make up the index.”
“But aren't all the stocks that are traded on the exchange included in the index
calculation?” inquired Mini, who was still using the household budget index as
a backdrop for understanding stock market indices. “Oh no. Stock indices are
generally classified as broad based indices and sector specific indices,
depending on the size and width of the market they depict.
The stocks that go to build up an index are chosen in such a way that they
represent the market or the segment of the market that they are meant to
reflect. So, for instance, a pharma index will consist of major pharma stocks
and a mid cap index will comprise of stocks of companies with a particular level
of market capitalisation. In short, an index is a benchmark against which the
investors compare and evaluate the performance of their equity portfolio or
holdings. And different indices reflect unique segments of the market”
Mini was looking a little tired now. She suddenly remembered the whole point
of the exercise. “I get the broad picture of what an index is but why would
anyone want to create an index?” Shiv, who was more keyed up than ever,
explained, “The main objective of creating an index is to gain a snapshot view
of how the market or a segment of a market is performing. It also gives
investors the opportunity to link or compare the
performance of their investments to that of the index.
This process is called indexing. For instance, if an
investor's portfolio has not performed as well as the
index, it means that if he had chosen another set of
stocks, he might have got a better return. More
broadly, indexing is the process by which the
performance of a particular market or portfolio is
linked to a representative stock index.”
Broad based indices and sector specific indices
lBroad base indices
lSector specific indices
A broad base index represents the performance of the entire stock market. For this purpose, the
index represents various key industries or sectors of the economy. Most of the popularly quoted
indices, like DJIA, S&P CNX 500, S&PCNX Nifty and BSE Sensex, are broad base indices.
A sector specific index is a specialized index that represents the performance of a specific
sector of the economy. For instance, the Morgan Stanley Biotech index represents trends in the
biotechnology industry in the US market. Similarly, the CNX BANK , the CNX Realty and the
CNX IT are other examples of sectoral indices in the domestic market.
History of indexing
When the Vanguard Group was newly formed in 1975, John Bogle first presented the idea of
indexing to the board of directors. When questioned about how he managed to convince them to
issue the first index fund, Bogle says, “"I projected the costs of managing an index fund to be 0.3
per cent per year in operating expenses and 0.2 per cent per year in transaction costs. Since
fund annual costs at that time appeared to be about 2.0 per cent, I concluded that an index fund
should reasonably be expected to provide an annual return of +1.5 per cent above managed
fund.”
Did you know…
Stock market indices have been in existence since the late nineteenth century. The Dow Jones
Average was the first index to be created. It was constructed by Charles Dow and Edward
Jones in 1884. Later, in the 1960s, the S&P 500 was conceptualised. In India, the BSE Sensex
was created in the 1990s and the S&P CNX Nifty followed soon after.

Back To BasicsETFs AND INDEXING
26 27
“I get it,” said Mini trying to disguise a yawn. “When the newspapers say that
the Nifty is going up, it means that there may be some stocks that are losing
value but over all, the prices of most stocks in that category are rising…”
“Exactly!” said Shiv. “And today, Nilesh told me that it is possible to invest in the
index. So, just imagine the convenience with which we can invest and at the
same time make money that is indexed to the Nifty or some other leading
index.”
“I have just one last question before I go off to bed: Exactly how can we invest in
the index?” asked Mini. “Well,” smiled Shiv ruefully, “I'll find out from Nilesh on
Monday morning.” That night, long after Mini had gone off to bed, Shiv sat at his PC at home and
read up about various domestic and international indices.
Some Broad Indian indices
S&P CNX Nifty
The S&P CNX Nifty (popularly called the Nifty 50) is the most favoured index for
large companies listed on the National Stock Exchange of India (NSE). The
Index is owned and managed by India Index Services and Products Ltd. (IISL).
IISL is the first Indian company whose core business activity is the
maintenance of indices. It is a joint venture between the NSE and CRISIL. It
also has a consulting agreement with Standard & Poor's (S&P). This index gets
its name- S&P CNX from S&P - Standard & Poor's; C – CRISIL; N – NSE; X – Index
The S&P CNX Nifty is computed using the market value weighted average
method. It comprises of 50 stocks which are traded on the NSE. These stocks
represent around 21 diverse sectors. Nifty stocks represented about 47.14 per
cent of the total market capitalization as on September 30, 2008.
VARIOUS STOCK MARKET INDICES
S&P CNX Nifty Junior
The Nifty Junior index comprises of scrip No 51 to scrip No 100 of the most
liquid scrips on the NSE, i.e. the 50 most liquid scrips after the ones in the Nifty
index. It may be useful to think of the Junior Nifty as an incubator for the Nifty,
as scrips from Junior Nifty, which qualify for Nifty, go out of the Junior Nifty and
enter the Nifty.
The maintenance of the S&P CNX Nifty and the CNX Nifty Junior are
synchronized so that the two indices will always be disjoint sets; i.e. a stock will
S&P NIFTY - Oct 1998 to Sept 2008
Companies comprised in the Nifty as on 30th September 2008
ACC Ltd., Ambuja Cements Ltd., Bharat Heavy Electricals Ltd., Bharat Petroleum
Corporation Ltd., Bharti Airtel Ltd., Cairn India Ltd., Cipla Ltd., DLF Ltd., GAIL (India)
Ltd., Grasim Industries Ltd., HCL Technologies Ltd., HDFC Bank Ltd., Hero Honda
Motors Ltd., Hindalco Industries Ltd., Hindustan Unilever Ltd., Housing Development
Finance Corporation Ltd., I T C Ltd., ICICI Bank Ltd., Idea Cellular Ltd., Infosys
Technologies Ltd., Larsen & Toubro Ltd., Mahindra & Mahindra Ltd., Maruti Suzuki India
Ltd., NTPC Ltd., National Aluminium Co. Ltd., Oil & Natural Gas Corporation Ltd.,
Power Grid Corporation of India Ltd., Punjab National Bank, Ranbaxy Laboratories Ltd.,
Reliance Communications Ltd., Reliance Industries Ltd., Reliance Infrastructure Ltd.,
Reliance Petroleum Ltd., Reliance Power Ltd., Satyam Computer Services Ltd., Siemens
Ltd., State Bank of India, Steel Authority of India Ltd., Sterlite Industries (India) Ltd., Sun
Pharmaceutical Industries Ltd., Suzlon Energy Ltd., Tata Communications Ltd., Tata
Consultancy Services Ltd., Tata Motors Ltd., Tata Power Co. Ltd., Tata Steel Ltd., Unitech
Ltd., Wipro Ltd., Zee Entertainment Enterprises Ltd.

Back To Basics
28 29
never appear in both indices at the same time. Hence it may be meaningful to
pool the S&P CNX Nifty and the CNX Nifty Junior into a composite 100 stock
index or portfolio. CNX Nifty Junior represented about 6.38 per cent of the total
market capitalization as on September 30, 2008.
S&P CNX 500
The S&P CNX 500 (base year: 1994) is India's first broad based benchmark of
the Indian capital market. The S&P CNX 500 represents about 86.54% of total
market capitalization and about 78 per cent of the total turnover on the NSE as
on September 30, 2008.
The S&P CNX 500 companies are disaggregated into 72 industry indices viz.
S&P CNX Industry Indices. Industry weightages in the index reflect the industry
weightages in the market E.g. if the banking sector has a 5% weightage in the
universe of stocks traded on NSE, banking stocks in the index would also have
an approximate representation of 5% in the index.
BSE Sensex
The Sensex, or more formally - the Bombay Stock Exchange Sensitive Index,
consists of 30 of the most briskly traded stocks on the Bombay Stock Exchange
(BSE). These stocks alone comprise a large portion of the market
capitalization of BSE. The base year of the BSE Sensex is 1978-79 and it is
computed by using the free float value-weighted market index method. The
constituent companies' stocks are reviewed and modified at regular intervals.
CNX Nifty Junior - Oct 1998 to Sept 2008
ETFs AND INDEXING
Companies comprised in the S&P CNX Nifty Junior as on 30th September 2008
Aditya Birla Nuvo Ltd., Andhra Bank, Apollo Tyres Ltd., Ashok Leyland Ltd., Asian Paints
Ltd., Aventis Pharma Ltd., Axis Bank Ltd., Bank of Baroda, Bank of India, Bharat
Electronics Ltd., Bharat Forge Ltd., Biocon Ltd., Cadila Healthcare Ltd., Canara Bank,
Chennai Petroleum , Corporation Ltd., Container Corporation of India Ltd., Corporation
Bank, Cummins India Ltd., GMR Infrastructure Ltd., Housing Development and
Infrastructure Ltd., IDBI Bank Ltd., IFCI Ltd., ING Vysya Bank Ltd., Indian Hotels Co. Ltd.,
Indian Overseas Bank , Infrastructure Development Finance Co. Ltd., JSW Steel Ltd.,
Jaiprakash Associates Ltd., Jindal Steel & Power Ltd., Kotak Mahindra Bank Ltd., LIC
Housing Finance Ltd., Lupin Ltd., Moser Baer India Ltd., Mphasis Ltd., Mundra Port and
Special Economic Zone Ltd., Nirma Ltd., Oracle Financial Services Software Limited,
Patni Computer Systems Ltd., Power Finance Corporation Ltd., Raymond Ltd., Reliance
Capital Ltd., Reliance Natural Resources Ltd., Syndicate Bank, Tata Teleservices
(Maharashtra) Ltd., Tech Mahindra Ltd., UltraTech Cement Ltd., Union Bank of India,
United Spirits Ltd., Vijaya Bank, Wockhardt Ltd.
S&P CNX 500 - Oct 1998 to Sept 2008
BSE Sensex - Oct 1998 to Sep 2008

Back To BasicsETFs AND INDEXING
30 31
As on 30th September, 2008, the BSE Sensex
stocks represent 45.92% of the market
capitalization on the BSE.
A Sector Specific Indian Index
CNX Bank Index
CNX Bank Index (base year: 2000) is an index comprised of the most liquid and
large capitalised Indian Banking stocks. It provides investors and market
intermediaries with a benchmark that captures the capital market
performance of Indian Banks.
Some US indices
S&P 500
S&P 500 is an index comprised of 500 stocks of large-cap corporations. It
covers about 75 per cent of all US equities. Thus, it is nearly representative of
the entire US stock market.
This index was created on the 4th March, 1957. Prior to that, an S&P stock
market index of 90 industries, called the S&P 90, existed. The S&P 500 was
introduced as a real-time index, which was calculated by a computer. All the
stocks in this index are large companies trading on the New York stock
exchange and NASDAQ. The ownership and maintenance of this index rests
with Standard & Poor's, who are a part of McGraw-Hill.
The S&P 500 is computed using a floating market-value weighting method i.e.
only those shares available for trading in the market are considered.
Previously, this index was calculated by the market value weighted method.
The transition to the present method was done in 2005, in an attempt to depict
market trends more realistically. A committee selects the constituent
companies, which are a part of this index.
The index includes volatile "growth stocks" and less volatile "value stocks".
Thus, the index is broad-based and depicts nearly the entire US stock market.
Some non-US companies are also constituted in this index. A large number of
fund managers of index funds and ETFs follow the performance of the S&P
500. The S&P 500 is also used as a benchmark by mutual fund companies to
evaluate their performance.
Dow Jones Industrial Average (DJIA)
The 'Dow 30' or 'The Dow', as this index is popularly called, consists of the
stocks of 30 of the most widely held and largest pubic companies of America.
Charles Dow created this index along with Edward Jones. Charles Dow was the
editor of the Wall Street Journal in the nineteenth century. He was also the
Companies comprised in the BSE Sensex as on 30th September 2008
ACC Ltd., Bharat Heavy Electricals Ltd., Bharti Airtel Ltd., DLF Ltd., Grasim Industries
Ltd., HDFC, HDFC Bank Ltd., Hindalco Industries Ltd., Hindustan Unilever Ltd., ICICI
Bank Ltd., Infosys Technologies Ltd., ITC Ltd., Jaiprakash Associates Ltd., Larsen &
Toubro Limited, Mahindra & Mahindra Ltd., Maruti Suzuki India Ltd., NTPC Ltd., ONGC
Ltd., Ranbaxy Laboratories Ltd., Reliance Communications Limited, Reliance Industries
Ltd., Reliance Infrastructure Ltd., Satyam Computer Services Ltd., State Bank of India,
Sterlite Industries (India) Ltd., Tata Consultancy Services Limited, Tata Motors Ltd., Tata
Power Company Ltd., Tata Steel Ltd., Wipro Ltd.
The easiest and surest way for a fund to
achieve the top quartile in investment performance among peer funds is to achieve the
bottom quartile in expenses - John Bogle, founder and retired CEO of The
Vanguard Group
Back To BasicsETFs AND INDEXING
32 33
co-founder of Dow Jones & Company. The Dow
Jones Industrial Average (DJIA) was first
published on the 26th of May 1896. At that time it
was the average of stocks of twelve vital
American companies.
The 30 stocks comprising the DJIA are changed
with changing market conditions. The selection
of the 30 stocks lies in the hands of the 'The Wall
Street Journal' editors. Interestingly, General
Electric is the only company that has existed as a
part of DJIA from the beginning till now.
For purposes of calculation, the value of the index is arrived by dividing the
composite value of constituent stocks by the total number of stocks.
There have been some common criticisms regarding this index. Critics feel that
the DJIA includes only 30 stocks, which cannot be a proper indication of the
trends of such a broad market like the US. Further, it is computed as a price-
weighted average, which is not a very good method of constructing indices. The
S&P 500 or the Dow Jones Wilshire 5000, computed by the float-adjusted
market value weighted method, are better indices to examine the trends in the
US market.
Dow Jones Wilshire 5000
Being a broad based stock market index, the Dow Jones Wilshire 5000 depicts
a picture of the entire American stock market. Companies which are included
in this index are listed on the New York stock exchange, the NASDAQ or the
American Stock Exchange.
This index goes way back to 1974. While it was created by Wilshire Associates,
Dow Jones & Company assumed responsibility of maintenance and
calculation of this index in April 2004. Thus, it was renamed as the "Dow Jones
Wilshire 5000'.
The Wilshire 5000, as it is popularly called, is computed on the basis of the
market capitalization-weighted method. Another index based on a float-
adjusted market capitalization method is also constructed. The companies
that constitute the index are revised and updated every month.
NASDAQ-100
NASDAQ-100 is an adapted market value-weighted index of the NASDAQ stock
exchange. It was created on the 31st January, 1985 and comprises of 100
large domestic and international companies listed on the Nasdaq stock
exchange. A slightly modified market value-weighted method is used to
calculate the index. A significant feature of this index is that it does not include
any financial companies. This is because the NASDAQ-100 and NASDAQ
Financial -100 were introduced on the same day. Thus, the NASDAQ-100 does
not take into account stocks of financial companies. Further, there are
stringent standards that a company must comply with to be included in the
NASDAQ-100 index. Normally, the index is rebalanced only once in a year.
However, in situations of delisting, bankruptcy and mergers, the composition
changes more frequently. It is abbreviated as the NDX.
A special highlight of this index is that it includes international stocks also. In
fact, Infosys, a home grown IT company finds a place in the NASDAQ 100.
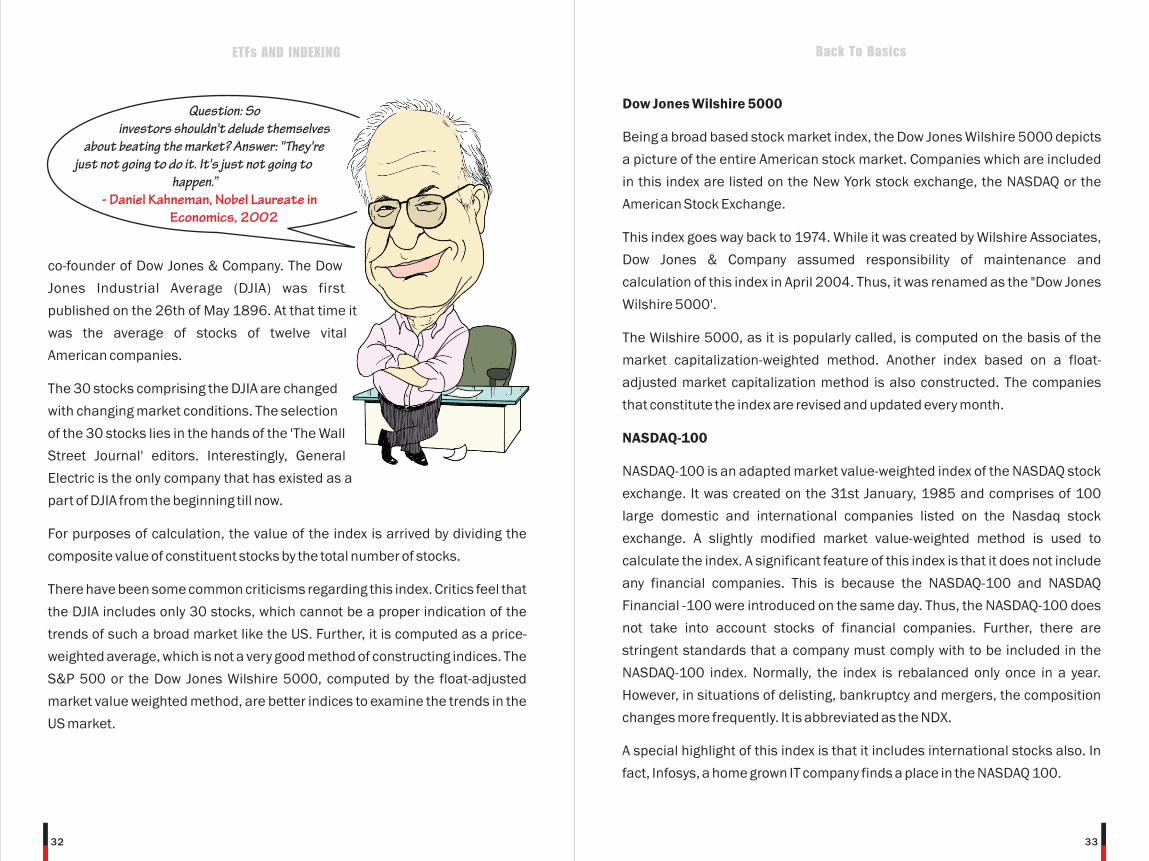
Question: So investors shouldn't delude themselves
about beating the market? Answer: "They're just not going to do it. It's just not going to
happen.” - Daniel Kahneman, Nobel Laureate in
Economics, 2002

Back To BasicsETFs AND INDEXING
34 35
Comparisons of Indices
Index
S&P CNX
Nifty
S&P CNX
Nifty Junior
S&P CNX 500
BSE Sensex
CNX Bank
Index
S&P 500
DJIA
Dow Jones
Wilshire 5000
Nasdaq 100
Country
India
India
India
India
India
US
US
US
US
Stock
Exchange
National
Stock
Exchange
National
Stock
Exchange
National
Stock
Exchange
Bombay
Stock
Exchange
National
Stock
Exchange
NYSE &
NASDAQ
NYSE
NYSE,
NASDAQ
& American
Stock
Exchange
NASDAQ
Base date
November
3rd, 1995
November
3rd, 1996
June
7th, 1999
January
1st, 1986
January
1st, 2000
March
4th, 1957
May
26th, 1896
January
29th, 1999
January
31st, 1985
Methodology
Market
capitalization
weighted
Market
capitalization
weighted
Market
capitalization
weighted
Free-float
Method
Market
capitalization
weighted
Market
capitalization
weighted
Price weighted
Market
capitalization
weighted
Market value
weighted
Number of
constituting
stocks
50
50
500
30
12
500
30
5000
100