etd.dtu.dketd.dtu.dk/thesis/312997/ris_r_1285.pdf · Abstract This master thesis deals with the...
65
Transcript of etd.dtu.dketd.dtu.dk/thesis/312997/ris_r_1285.pdf · Abstract This master thesis deals with the...

Ris� -R-1285(EN)
A new Diode Laser Systemfor Photodynamic Therapy
Eva Sams�e
Ris� National Laboratory, Roskilde, DenmarkAugust 2001

Abstract This master thesis deals with the description and speci�cation of a
new diode laser system for (interstitial) photodynamic therapy.
A 638 nm broad area diode laser is coupled to an external cavity with a self-
pumped, phase conjugate, barium titanate crystal constituting the end mirror of
the cavity. The external cavity includes a spatial �lter and an optional frequency
selective element. It is veri�ed experimentally that the spatial �lter and the phase
conjugating mirror cause the diode laser to exhibit an allmost di�fraction limited
output.
The enhanced output from the system is eÆciently coupled into an optical �ber
with a 50 �m core-diameter. It is veri�ed that the developed diode laser system
constitutes a revolutionary alternative to the lasers currently used in photody-
namic therapy and that the system makes practical conduction of interstitial pho-
todynamic therapy possible.
This work was completed July 17 2000
This thesis is submitted in partial ful�lment of the requirements for the degree of
Master of Science in Physics at the University of Copenhagen, Denmark.
ISBN 87-550-2921-3
ISBN 87-550-2922-1 (internet)
ISSN 0106-2840
Print: Pitney Bowes Management Services Danmark A/S, 2001

Contents
List of Symbols and Abbreviations 5
Preface 8
1 Introduction 9
1.1 PDT at Lund University 9
1.2 Scope of Thesis 10
2 Photodynamic Therapy 12
2.1 Historical Review 12
2.2 Mechanism of PDT 12
2.3 The Photosensitizer 14
2.3.1 ALA and PpIX 15
2.4 The Systems at Lund University 15
2.4.1 PDT in Lund 15
2.4.2 The 3/6-�ber System 16
2.4.3 Laser Induced Fluorescence 17
2.5 Discussion 19
3 The Light Source 21
3.1 The FSPCF Scheme 21
3.2 The Broad Area Laser 23
3.2.1 Modes 24
3.2.2 Astigmatism of the BAL Emission 26
3.3 Spatial Filtering 27
3.4 Spectral Filtering 28
3.5 The Phase Conjugating Mirror 29
3.5.1 The Physics of the Photorefractive E�ect 29
3.5.2 Optical Phase Conjugation 31
3.6 Beam Quality 33
3.6.1 De�nition of 'Di�raction-Limited' 33
3.6.2 The M2 factor 33
4 Experiments and Results 36
4.1 The Experimental Setup 36
4.2 Setup and Alignment of the System 38
4.2.1 The Phase Conjugating Mirror 38
4.2.2 The Broad Area Laser 38
4.3 Characteristics of the System 42
4.3.1 Spatial Characteristics 42
4.3.2 Spectral Characteristics 45
4.3.3 The Output Beam 46
4.3.4 Focusing the Output into an Optical Fiber 48
4.3.5 Power Stability of System 51
4.4 Discussion 52
Ris�-R-1285(EN) 3

5 Summary and Conclusion 53
5.1 Improvement of BAL Beam Characteristics 53
5.2 Adapting the Improved BAL to I-PDT 53
5.3 Future Prospects 54
References 55
Appendices 59
A Components Used in the Experimental Setups 59
B Clinical Explanations 61
C Clinical Protocols 62
D Lateral far-�eld of BAL modes 63
4 Ris�-R-1285(EN)

List of Symbols and Abbreviations
Symbols
D . . . . . . . . . . . . . . . . . . . . Beam diameter incl. presence of higher order modes [m]
D0 . . . . . . . . . . . . . Beam waist diameter incl. presence of higher order modes [m]
��g . . . . . . . . . . . . . . . . . . . . . . . . . . . . . . . . . Width (FWHM) of laser gain pro�le [m]
��spat . . . . . . . . . . . . . . . . . . . . . . . . . . . . . . . . . . . . . . . . . . . . . .Lateral mode spacing [m]
��spec . . . . . . . . . . . . . . . . . . . . . . . . . . . . . . . . . . . . . . . . Longitudinal mode spacing [m]
�n . . . . . . . . . . . . . . . . . . . . . . . . . . . . . . . . . . . . . . . . . . . Refractive index modulation [-]
�P . . . . . . . . . . . . . . . . . . . . . . . . . . . . . . . . . . . . . . . . . . . . . . . . . . . . . . . . .Powervariation [-]
ESC . . . . . . . . . . . . . . . . . . . . . . . . . . . . . . . . . . . . . . . . . . . . . . . . Space-Charge �eld [V/m]
f; f1 . . . . . . . . . . . . . . . . . . . . . . . . . . . . . . . . . . . . . . . . . . . . . . . . . . . . . . . . Focal lengths [m]
F . . . . . . . . . . . . . . . . . . . . . . . . . . . . . . . . . . . . . . . . . . . . . . . . . . . . . . . . . . . . . . . . . . Finesse [-]
FSR . . . . . . . . . . . . . . . . . . . . . . . . . . . . . . . . . . . . . . . . . . . . . . . . .Free Spectral Range [m]
I , I0 . . . . . . . . . . . . . . . . . . . . . . . . . . . . . . . . . . . . . Intensity [W/m2] and Current [mA]
IFWHM . . . . . . . . . . . . . . . . . . . . . . . . . . . . . . . . . . . . . . FWHM of intensity pro�le [deg]
Ith . . . . . . . . . . . . . . . . . . . . . . . . . . . . . . . . . . . . . . . . . . . . . . . . . . . Threshold current [mA]
� . . . . . . . . . . . . . . . . . . . . . . . . . . . . . . . . . . . . . . . . . . . . . . . . . . . . . . Center wavelength [m]
�0 . . . . . . . . . . . . . . . . . . . . . . . . . . . . . . . . . . . . . . . . . . Lasing wavelength in vacuum [m]
L . . . . . . . . . . . . . . . . . . . . . . . . . . . . . . . . . . . . . . . . . . . . . . . . . . . . . Laser cavity length [m]
m . . . . . . . . . . . . . . . . . . . . . . . . . . . . . . . . . . . . . . . . . . . . . . . . . . . . . . . . . . . mode number [-]
M2 . . . . . . . . . . . . . . . . . . . . . . . . . . . . . . . . . . . . . . . . . . . . . . . . . . . . . . . . . .Quality factor [-]
n . . . . . . . . . . . . . . . . . . . . . . . . . . . . . . . . . . . . . . . . . . . . . . . . . . . . . . . . .Refractive index [-]�!n . . . . . . . . . . . . . . . . . . . . . . . . . . . . . . . . . . . . . . . . . . . . . . . Normal of crystal surface [-]
N . . . . . . . . . . . . . . . . . . . . . . . Sample size/Number of stripes in LDA's or BAL's [-]
Pi . . . . . . . . . . . . . . . . . . . . . . . . . . . . . . . . . . . . . . . . . . . . . . . . . . . Power measured at i [W]
Ri . . . . . . . . . . . . . . . . . . . . . . . . . . . . . . . . . . . . . . . . . . . Re ectivity of i'th component [-]
Rcat . . . . . . . . . . . . . . . . . . . . . . . . . . . . . . . . . . . . . . . . . . . Phase conjugate re ectivity [-]
r . . . . . . . . . . . . . . . . . . . . . . . . . . . . . . . . . . . . . . . . . . . . . . . . . . . Transverse dimension [m]
s . . . . . . . . . . . . . . . . . . . . . . . . . . . . . . . . . . . . . . . . . . . . . . . . . . . . . . Standard Deviation [-]
SEM . . . . . . . . . . . . . . . . . . . . . . . . . . . . . . . . . . . . . . . . . . . . . Standard Error of Mean [-]
� . . . . . . . . . . . . . . . . . . . . . . . . . . . . . . . . . . . . . . . . . . . . . . . . . . . . . . . . . . . . . . . . . Variance [-]
� . . . . . . . . . . . . . . . . . . . . . . . . . . . . . . . . . . . . . . . . . . . . . . . . . . . . . . . Charge density [m�3]
T . . . . . . . . . . . . . . . . . . . . . . . . . . . . . . . . . . . . . . . . . . . . . . . . . . . . . . . . . . . .Temperature [K]
� . . . . . . . . . . . . . . . . . . . . . Angle made by ray marginal with optical axis [degrees]
�D . . . . . . . . . . . . . . . . . . . . . . . . . . . . . . . . . . . . . . . . . . . . . . . . . . Angle of divergence [rad]
�diff . . . . . . . . . . . . . . . . . . . . . . . . . . . . . . . . . . . . . . . . . . . . . . . . . . . Di�raction limit [rad]
�full . . . . . . . . . . . . . . . . . . . . . . . . . . . . . . . . . . Full cone angle of diverging beam [rad]
�m . . . . . . . . . . . . . . . . . . . . . . . . . Radiation angle for lobes of mode number m [rad]
W . . . . . . . . . . . . . . . . . . Spotsize of beam incl. presence of higher order modes [m]
W0 . . . . . . . . . . . . . . . . . . . . . . . . . . . .Beam waist incl. the of higher order modes [m]
w . . . . . . . . . . . . . . . . . . . . . . . . . . . . . . . . . . . . . . . . . . . . . . . . . . . . . . . . . . . . . . . . Spotsize [m]
w0 . . . . . . . . . . . . . . . . . . . . . . . . . . . . . . . . . . . . . . . . . . . . . . . . . . . . . . . . . . . .Beam waist [m]
x; y . . . . . . . . . . . . . . . . . . . . . . . . . . . . . . . . . . . . . . . . Transverse spatial coordinates [m]
x0 . . . . . Half-width of gain medium of laser diode array or broad area laser [m]
Xi . . . . . . . . . . . . . . . . . . . . . . . . . . . . . . . . . . . . . . . . . . . . Sample value of i'th entrance[-]
X . . . . . . . . . . . . . . . . . . . . . . . . . . . . . . . . . . . . . . . . . . . . . . . . . . . . . . . . . Mean of sample [-]
z . . . . . . . . . . . . . . . . . . . . . . . . . . . . . . . . . . . . . . . . . . . . . . . . Direction of propagation [m]
zR . . . . . . . . . . . . . . . . . . . . . . . . . . . . . . . . . . . . . . . . . . . . . . . . . . . . . . . . Rayleigh range [m]
Abbreviations
BAL . . . . . . . . . . . . . . . . . . . . . . . . . . . . . . . . . . . . . . . . . . . . . . . . . . . . . . . Broad Area Laser
Ris�-R-1285(EN) 5

FF . . . . . . . . . . . . . . . . . . . . . . . . . . . . . . . . . . . . . . . . . . . . . . . . . . . . . . . . . . . . Far-�eld plane
FSPCF . . . . . . . . . . . . . . . . . . . . . . . Frequency Selective Phase Conjugate Feedback
FSR . . . . . . . . . . . . . . . . . . . . . . . . . . . . . . . . . . . . . . . . . . . . . . . . . . . . . Free Spectral Range
FWHM. . . . . . . . . . . . . . . . . . . . . . . . . . . . . . . . . . . . . . . . .Full Width at Half-Maximum
IX . . . . . . . . . . . . . . . . . . . . . . . . . . . . . . . . . . . . . . . . . . . . . . . . . . . . . Inter System Crossing
LDA . . . . . . . . . . . . . . . . . . . . . . . . . . . . . . . . . . . . . . . . . . . . . . . . . . . . . .Laser Diode Array
LDB . . . . . . . . . . . . . . . . . . . . . . . . . . . . . . . . . . . . . . . . . . . . . . . . . . . . . . . . Laser Diode Bar
LIF. . . . . . . . . . . . . . . . . . . . . . . . . . . . . . . . . . . . . . . . . . . . . . .Laser Induced Fluorescence
N.A. . . . . . . . . . . . . . . . . . . . . . . . . . . . . . . . . . . . . . . . . . . . . . . . . . . . . . Numerical Aperture
NF . . . . . . . . . . . . . . . . . . . . . . . . . . . . . . . . . . . . . . . . . . . . . . . . . . . . . . . . . . . Near-�eld plane
PCF . . . . . . . . . . . . . . . . . . . . . . . . . . . . . . . . . . . . . . . . . . . . . .Phase Conjugate Feedback
PCM . . . . . . . . . . . . . . . . . . . . . . . . . . . . . . . . . . . . . . . . . . . . . .Phase Conjugating Mirror
SEM . . . . . . . . . . . . . . . . . . . . . . . . . . . . . . . . . . . . . . . . . . . . . . . . . Standard Error of Mean
Clinical Abbreviations
ALA . . . . . . . . . . . . . . . . . . . . . . . . . . . . . . . . . . . . . . . . . . . . . . . . . . . Æ-aminolevulinic acid
ALA-PDT . . . . . . . . . . . . . Photodynamic therapy using the photosensitizer ALA
BCC . . . . . . . . . . . . . . . . . . . . . . . . . . . . . . . . . . . . . . . . . . . . . . . . . . . Basal Cell Carcinoma
I-PDT. . . . . . . . . . . . . . . . . . . . . . . . . . . . . . . . . . . . . .Interstitial photodynamic therapy
PCT . . . . . . . . . . . . . . . . . . . . . . . . . . . . . . . . . . . . . . . . . . . . . . . . . . . . Photochemotherapy
PDT . . . . . . . . . . . . . . . . . . . . . . . . . . . . . . . . . . . . . . . . . . . . . . . . .Photodynamic Therapy
PpIX . . . . . . . . . . . . . . . . . . . . . . . . . . . . . . . . . . . . . . . . . . . . . . . . . . . . . Protoporphyrin IX
6 Ris�-R-1285(EN)


Preface
The present master thesis describes the work carried out in the Optics and Fluid
Dynamics Department at Ris� National Laboratory from August 1999 to July
2000. The work was supervised by
Dr. Paul Michael Petersen, Senior Scientist in OFD, Ris� National Laboratory,
Dr. Peter E. Andersen, Scientist in OFD, Ris� National Laboratory, and
Dr. Stig Steenstrup, Associate Professor, HC�, University of Copenhagen.
With all my sincere gratitude, I wish to thank my supervisors, Dr. Paul Michael
Petersen and Dr. Peter E. Andersen, for opening the fascinating world of biomedi-
cal optics to me. They have made my year at Ris� an eventful experience, through
which I have gained more experience than I could ever have imagined. I also wish
to extend thanks to my supervisor at the University of Copenhagen, Prof. Stig
Steenstrup, for �nally guiding me towards that particular area of physics that
really means a di�erence to me; the �eld of biophysics.
During the past year, I have had the privilege of occasionally visiting a very special
group of people at the Lund University Medical Laser Center. In this connection,
I would like to thank Prof. Stefan Andersson-Engels and his group at the atomic
physics department and Dr. med. Katarina Svanberg for their incredible open-
ness and for sharing their enormous knowledge within the �eld of photodynamic
therapy with me. Thank you for always inviting me to participate in the treat-
ment sessions and the animal experiments, which have provided me with a good
background for the work to follow.
A lot of special thanks are directed towards Dr. Sussie Juul Jensen, Dr. Christian
Pedersen and Dr. Peter Lodahl, who have provided me with invaluable acquain-
tance within the �eld of experimental laser physics. To Bo Toftmann Christensen
and Steven Richard Kitchen for their helpful assistance whenever needed and to
Morten Bache, Kim G. Jespersen and Per Michael Johansen for making the daily
round an enjoyable experience. Thanks to all of you for your great friendships and
for always being there. Finally, I take the opportunity to thank the rest of the
sta� in the department of Optics and Fluid Dynamics for making me fell welcome
at Ris�.
BBT-BL, Denmark is highly valued for lending me the �ber equipment and Morten
Dyndgaard for helping with the �ber cutting procedure.
Eva Sams�e
17 July 2000
8 Ris�-R-1285(EN)

1 Introduction
The use of lasers in medicine is still in a highly progressive state and the various
applications are continuously extended. The development of photodynamic therapy
(PDT) as a treatment modality of malignant and pre-malignant tumors seems to
become a promising alternative to existing treatments. PDT has developed rapidly
during the last decade due to the synthesizing of photosensitizers with improved
characteristics. The introduction of Æ-aminolevulinic acid (ALA) induced proto-
porphyrin IX (PpIX) as a photosensitizer has drastically decreased the side e�ects
of prior photosensitizers, mainly since ALA is a non-toxic compound, naturally
present in the human body.
At Lund University Hospital, ALA-PDT of super�cial lesions is now regarded
a standard clinical procedure. The next preferable step is to expand the treatment
to include interstitial PDT (I-PDT), i.e. PDT of solid, deeper lying tumors, and
a system for this application has been designed and is currently being developed.
As will be explained in the following, �ber delivery of the treatment light in several
thin optical �bers is essential to further develop and conduct this treatment.
Because of their modest size and relatively low cost, diode lasers are of interest
in a clinical environment, and recently they have become available at the required
wavelength for ALA-PDT. However, since these lasers su�er from poor beam char-
acteristics, their coupling eÆciency to optical �bers is low and thus, they are not
suited for adaptation to the I-PDT system designed in Lund.
In this thesis, a new diode laser system for I-PDT, constructed during the past
year, is presented. The system drastically improves the properties of the diode laser
itself and the output is eÆciently focused into an optical �ber. The work has been
performed in collaboration with Lund University and the system will prove to be
well suited for adaptation to the I-PDT system. Thus, it is of great interest for the
future development of I-PDT as an attractive alternative to conventional cancer
treatments of solid tumors.
Keeping in mind the plurality of today's conventional cancer treatment modali-
ties, a natural question arises: What is the need for a new modality? The question
is readily answered through the fact that cancer is still a disease, claiming far to
many lives and often at young ages.
1.1 PDT at Lund University
At Lund Laser Center (LLC), Lund University, ALA-PDT has been investigated
since 1991. The treatments are conducted at Lund University Hospital, where pa-
tients are now regularly treated for super�cial lesions, such as basal cell carcinomas
(BCC) (see appendix B). The cosmetic results and healing times are clearly better
than for treatment with cryosurgery (see appendix B), which is the prior choice
for conventional treatment of these kinds of lesions in Lund [1].
The traditionally employed light source for this treatment in Lund, have been a
Nd:YAG laser pumped dye laser. However, this system is inconvenient in a clinical
environment due to its size and complex operation. In addition, these systems are
expensive. Recently, a commercial diode laser system was employed. Diode lasers
are small, easy to operate and thus more suited for clinical use. However, these
devices su�er from poor beam characteristics and thereby have a low coupling
eÆciency to optical �bers. The commercial unit in Lund su�ers from poor beam
characteristics and delivers the treatment light through a multimode, 400-�m core-
diameter �ber. In dermatology, �ber delivery of the treatment light through �bers
Ris�-R-1285(EN) 9

thinner than 400 �m is not essential, since the lesions are so easily accessible.
However, treating tumors located in inner organs, �ber optic delivery of the laser
light in even thinner �bers, around 50 �m, is crucial.
In Lund, a system for interstitial PDT has been designed. The system requires
a powerful light source providing 1-2 Watts of output power at the appropriate
absorption wavelength of the photosensitizer, which is around 635 nm for ALA-
PDT. The light source should be adaptable to a clinical environment, i.e. small
and easy to operate, and it is a requirement that the treatment light is close
to the di�raction limit, since the I-PDT system splits the light into several 50-
�m core-diameter optical �bers. The I-PDT system has been investigated using
the commercial diode laser system mentioned above. However, when using this
laser, the treatment light cannot be delivered through 50-�m �bers. One has to
employ 400-�m �bers leading to poor cosmetic results and the risk of spreading
the cancerous cells. Moreover, the poor beam characteristics causes the treatment
light to be unevenly distributed in the di�erent �bers due to losses through the
optical I-PDT system.
1.2 Scope of Thesis
The aim of this master project is to develop a new diode laser system for interstitial
photodynamic therapy in Lund. The project has been carried out at Ris� National
Laboratory and was performed in close collaboration with Lund Laser Center.
LLC was visited at several occasions, both for specifying the requirements for
the desired light source and for gaining experience with the treatment modality
through participation in patient treatments and studies of animal models exposed
to the treatment of I-PDT.
In this thesis, I demonstrate the development of a new light source for I-PDT
based on a broad area diode laser incorporated in an external cavity with a phase-
conjugating mirror. The external cavity drastically improves the beam character-
istics of the freely running diode laser leading to a single lobed, almost di�raction
limited output, carrying up to 87 % of the energy emitted from the original light
source. The enhanced output of the laser system is eÆciently coupled into an
optical �ber with a core-diameter of 50 �m, the preferred core-diameter size for
the I-PDT system in Lund. The cavity is simple, stable and compact and thus of
interest in medical use. The use of this new diode laser system together with the
I-PDT system in Lund may be another step towards the development of PDT to
an attractive and simple treatment modality of malignant tumors.
In chapter 2, the mechanisms of photodynamic therapy are outlined and the
various parts in this treatment modality are explained. Moreover, the systems at
Lund University are described and diagnostics measurements performed in Lund
are presented.
In chapter 3, the special setup scheme of the external cavity is explained, and
relevant components are described in detail. The chapter provides the theoretical
background necessary to understand the experimental work, which constitutes the
essentials of this project. Finally, two methods for determining the quality of the
output beam is introduced.
Chapter 4 constitutes the essentials of the thesis and the most important
results are presented here. Experimental work including the construction of the
diode laser system is described and results are presented. The �nal system is fully
characterized and the beam quality of the enhanced output is estimated.
Finally the work is summarized and concluded on in chapter 5. This chapter
also provides the future prospects for collaborative work with Lund University in
10 Ris�-R-1285(EN)

the �eld of lasers in medicine.
An overview of relevant components used in experimental setups during this
work is presented in appendix A, while appendix B provides a list of explana-
tions to the various clinical terms employed throughout the thesis. Appendix C
constitutes an example of the clinical protocols used in PDT treatments in Lund
and �nally, appendix D concerns the beam quality factor, �diff .
Ris�-R-1285(EN) 11

2 Photodynamic Therapy
This chapter is introduced with a short review of the history of photodynamic ther-
apy. Following this, the mechanisms of PDT are presented and the di�erent parts
of the treatment are discussed. Finally the collaborative work with Lund University
and relevant apparatus from Lund are described. The description includes some
illustrative and typical results from a set of diagnostic measurements performed at
Lund University Hospital.
2.1 Historical Review
The use of light for therapeutic purposes goes back thousands of years. In ancient
times, in Egypt, China and India, the sunlight was used to treat various types of
medical conditions ranging from skin diseases to psychosis. About 3000 years ago
the Greeks introduced heliotherapy, a whole-body exposure to the sun, which was
regarded to be useful for the restoration of health. In the 18th century the ancient
forms of phototherapy were rediscovered and the sun exposure was reestablished as
an e�ective therapy for rickets (see appendix B). Finally, during the 19th century
phototherapy developed into a science, with the Danish physician Niels Finsen, as
one of the leading researchers. In 1893 he found that the use of red light in the
treatment of smallpox (see appendix B) prevented suppuration of pustules and in
1903 he received the Nobel Prize for his work using ultraviolet radiation from a
carbon arc in the treatment of lupus vulgaris (skin tuberculosis) [2].
All of the above mentioned treatments can be categorized as phototherapeutic
modalities. Another kind of treatment depending on light is photochemotherapy
(PCT), which relies not only on the delivery of radiation but also on a pre-
administration of an exogenous agent (a photosensitizer), which sensitizes the
tissue. That is, photochemotherapy can be regarded as chemically enhanced pho-
totherapy and PDT belongs to this group of phototherapy. The use of photosen-
sitizers can be traced all the way back to 1400 BC in India, where the use of
psoralens, obtained from the seeds of Psoralea corvlifolia was used to improve
the eÆciency of phototherapy in the repigmantation of vitiligenous skin (see ap-
pendix B). The Egyptians used psoralens from another plant, Amni majus, in the
treatment of vitiligo. The �rst scienti�c investigations on photosensitized reactions
started at the end of the 19th century, and during the 20th di�erent photosensi-
tizing agents and light sources have been investigated. In 1990 the introduction of
Æ-aminolevulinic acid as a precursor for the sensitizing agent protoporphyrin IX
revolutionized the area of PDT [3], [4]. The work on ALA-PDT in Lund started
in 1991, making the group in Lund one of the leading ALA-PDT specialists in the
world. Detailed reviews of the history of PDT are found in e.g. refs. [5], [6] and
[7].
2.2 Mechanism of PDT
PDT relies on the coexistence of three components: Light, photosensitizer and
oxygen. Light and photosensitizer are exogenous components, while the oxygen
is endogenous, due to its natural presence in the blood. The photosensitizer is
administered to the body where it accumulates in the tumor tissue. After a cer-
tain amount of time, depending on the employed photosensitizer, the tissue is
illuminated with laser light, exciting the photosensitizer molecules. This causes a
photochemical reaction to occur, leading to selective cell necrosis of the diseased
cells [8], [9]. In the following, the mechanism of ALA-PDT is described, most of
it, however, is applicable to other kinds of PDT as well.
12 Ris�-R-1285(EN)

When the photosensitizer is irradiated with light matching the absorption wave-
length of the substance, it is excited from its singlet ground state, S0, to its �rst
excited singlet state, S1 (the Q-band), see �gure 1.
������
�������� ��
�����������������
������
��
� � ������
��
��
��
������
����� ������
� �! !
� �
Figure 1. Mechanism of PDT. Laser light of approximately 635 nm excites the
photosensitizer from its singlet ground state S0 to the �rst excited singlet state S1.
Due to the small energy seperation, the photosensitizer molecules are able to relax
to the lower, metastabile, triplet state T1 by intersystem crossing (IX). The excess
energy is transferred to the surrounding molecules, most of which are oxygen, O2,
in its triplet ground state, which are thereby excited, resulting in the formation of
singlet molecular oxygen, 1O2. The very reactive and aggresive nature of singlet
oxygen leads to cell necrosis.
Due to the small energy separation between S1 and the lowest triplet state, T1, the
molecules are able to relax to T1, although this inter-system crossing (IX) is spin
forbidden. Since the energy of S1 is larger than the energy of T1, the reverse process
is inhibited. The relaxation from T1 to the singlet ground state S0 is again a spin
forbidden transition resulting in a low quantum yield, i.e. a low probability. Thus,
the lifetime of T1 is relatively long (milliseconds) and the molecules have a high
probability of interaction with surrounding molecules. Among the surrounding
molecules are oxygen, O2, in its ground triplet state. When the excess energy from
the excitation process �nds its way to the surrounding triplet oxygen, the oxygen
is excited to one of its �rst singlet states. The singlet oxygen, 1O2, acts oxidative
to almost every compound surrounding it, which results in severe damage and
selective cell necrosis of the cancerous cells [10]. The di�usion distance of singlet
oxygen in biological tissue is on the order of 0.01 �m, corresponding to a lifetime
of approximately 0.01-0.04 �s [11].
When the excited photosensitizer molecule transfers its excess energy to the
oxygen, it relaxes to the ground state and the cycle is repeated. However, it can
also be oxidized by the singlet oxygen, a process referred to as photodegradation
or photobleaching. The photobleaching of PpIX during PDT results in the forma-
tion of uorescent photoproducts, most of which are photoprotoporphyrin. The
uorescence from these photoproducts is observable, though very weak, at 670 nm
[12] (see also section 2.4.3).
Ris�-R-1285(EN) 13

2.3 The Photosensitizer
Tumor selective agents can be used both for diagnostic and therapeutic purposes.
In diagnostics, a uorescent marker is often used. The agent is administered and
after a certain amount of time, it accumulates in the diseased tissue. Subsequent
irradiation with low-power (often pulsed) near-ultraviolet (n-UV) or ultraviolet
(UV) light will cause a characteristic uorescence, whereby the tumor can be
localized. This kind of measurement is referred to as laser induced uorescence
(LIF) spectroscopy, and the tumor selective agent is referred to as a uorescent
tumor marker [10].
In therapy, irradiation is often performed with longer wavelengths and higher
power, whereby the photochemical reaction described in section 2.2 occurs. In
this context the tumor selective compound is referred to as a photosensitizer. A
lot of di�erent photosensitizers have been explored since the development of PDT
and only a few will be mentioned here. There are certain criteria to be ful�lled
when synthesizing a photosensitizer. The photosensitizer has to be a molecule that
accumulates well in the diseased tissue, so the surrounding healthy tissue is not
damaged during treatment. Furthermore it has to be non-toxic to the human body
and it has to leave the body within a reasonable period of time, so the patient does
not remain photosensitive for long. In the early days of PDT, patients could stay
photosensitive for several weeks, or even months, preventing them from staying
anywhere near light [13]. This problem is overcome with today's photosensitizers.
The photosensitizer has to absorb light in an accessible wavelength range ac-
cording to the light sources available and the visible absorption of the naturally
present compounds (chromophores) in the body. Figure 2 shows the absorption
of the most important chromophores in the human body. In the range 630 nm -
1300 nm, the tissue optical window, the natural absorption is rather low, i.e. a
photosensitizer absorbing in this range is of particularly great interest.
Figure 2. Light absorption of the major absorbers in biological tissue (chro-
mophores). The natural absorption is relatively low in the region from 630 nm
to 1300 nm, which is referred to as the tissue optical window. Adopted from [14].
Most of the work performed in the �eld of photosensitizers relies on the por-
phyrins and their relatives, molecules that are often large and relatively complex
14 Ris�-R-1285(EN)

[15]. An exception, however, is Æ-Aminolevulinic acid, which acts as a precursor
for the porphyrin protophorphyrin IX, i.e. ALA causes an endogenous photosensi-
tization of the tissue. ALA can be administered topically, orally or intravenously.
2.3.1 ALA and PpIX
ALA is a 5-carbon, straight-chain amino acid, naturally present in the body. It
is neither photosensitive nor uorescent itself, but it acts as a precursor for the
highly photosensitive and uorescent protoporphyrin IX in the synthesis of heme.
Heme is PpIX with an iron atom in its ferrous (Fe2+) state incorporated into its
core [16]. ALA in excessive amounts results in an increased activity in diseased
tissue of one of the enzymes, porphobilinogen deaminase, catalyzing one of the
steps in the heme-cycle [17], [18]. However, ferrochelatase, which is the enzyme
catalyzing the last step in the heme-cycle, shows a reduced activity in malignant
tissue when ALA is supplied in excess [19], [20]. In this way PpIX is selectively
accumulated in the diseased tissue.
PpIX has two strong absorption peaks, one around 410 nm (the Soret band),
the other around 635 nm. The absorption is strongest in the Soret band, but for
ALA-PDT, light around 635 nm is often used, since the long-wavelength red light
allows larger penetration in the tissue. Light at 410 nm could be eÆciently used in
treatment of thin super�cial lesions [21]. To achieve a high photodynamic yield and
to avoid a large temperature increase, it is advantageous to tune the therapeutic
light to the right wavelength. However, the absorption of PpIX is not always the
same for the in vivo situation as in aqueous solution [10]. The absorption is around
635 nm when present in the human body [22].
When excited in the Soret band, PpIX exhibits a strong dual-peaked uores-
cence. The strongest uorescence peak is situated around 635 nm and is related to
the concentration of PpIX, while a weaker peak due to uorescent waste products
is observed around 705 nm [23]. Since PpIX is both very photosensitive and show
a strong uorescence, this compound is well suited for both diagnostics (LIF) and
treatment (PDT). Furthermore the level of PpIX will rapidly drop to normal,
usually within one or two days [10], so the patient will not stay photosensitive for
long.
2.4 The Systems at Lund University
This section deals with the work in Lund in which I have participated. First
the situation regarding PDT in Lund is described. Subsequently, a description
of the system for interstitial PDT and the uorescence instruments is presented.
Measurements performed in connection with a PDT treatment will be presented
and explained in section 2.4.3. Finally, the situation in Lund is summarized and
the need and advantages of a collaborative work are outlined.
2.4.1 PDT in Lund
The research within photodynamic therapy in Lund is concentrated on ALA-PDT.
Until 1998 the employed light source was a pulsed Nd:YAG (neodymium-doped
yttrium-aluminium-garnet) laser-pumped dye laser. The system generates up to
20 W green (532 nm) light via frequency doubling of the infrared (1064 nm) light.
The green light pumps a dye laser resulting in an output of approximately 2
W of red (635 nm) light [10]. The system is large, heavy, expensive, complex to
operate and thus unsuited in a clinical environment. In 1998 a commercial diode
laser system (probably the �rst of its kind) for ALA-PDT emitting up to 1.5 W
Ris�-R-1285(EN) 15

through a 400-�m core-diameter microlensed optical �ber at a wavelength of 633
nm was employed [10]. This system is considerably smaller (size: 19 � 43 � 38
(cm)3, weight: 15 kg.) and easy to operate. Unfortunately the output power from
the system was slowly decreasing and the system had a limited lifetime, after
which another, similar system was employed. This system is currently in use, but
the power is again slowly decreasing, a well-known problem with red high power
diode lasers (see chapter 4).
The commercial unit mentioned above is well suited and regularly applied in
the treatment of super�cial lesions at Lund University Hospital (see e.g. [24]).
Treating deeper lying lesions is not possible, since the delivered light only has
a limited penetration depth of a couple of mm [25]. However, a new system for
interstitial PDT has been developed at the Department of Physics in Lund [26].
The system is described shortly in the following section, and will in this thesis be
referred to as the 3/6-�ber system.
2.4.2 The 3/6-�ber System
The 3/6-�ber system for I-PDT splits the treatment light into three or six optical
�bers, which can be inserted to the tumor tissue (�gure 3).
!
�
" "
�
�
�
�
� �
�
�
""
�
�
�
�
�
Figure 3. The multiple �ber system developed at the Department of Physics in
Lund. The treatment light is delivered through the connector 1) and is collimated
by the lens 2). 3) is an optional 50/50 beamsplitter, which makes it possible to use
either six or three output �bers. The choice depends on the size of the tumor to be
treated. The beamsplitters 4) are used to split the light in equal parts, which are
focused by the lenses 5) into the output connectors 6), delivering the light to the
treatment �bers.
Computer software has been developed to calculate the appropriate �ber posi-
tions and treatment times for di�erent tumor geometries [26]. The �bers can be
individually blocked at the �ber port whereby a photodiode, measuring the light
16 Ris�-R-1285(EN)

uence at the �ber tip, is switched on. To determine the total light distribution
in the tumor volume, light is transmitted in one �ber, while the others are used
for detection. Repeating this procedure for all six (or three) �bers gives an esti-
mate of the total light distribution. A labVIEW environment has been developed
to present the light dose distribution in real-time on a computer monitor. Dur-
ing treatment, intermediate dose calculations and corrections of output power in
the individual �bers are repeatedly performed, until all parts of the tumor have
received the required dose of treatment light [26].
There are some obstacles in adapting the commercial PDT laser to this system.
These are outlined in section 2.5.
2.4.3 Laser Induced Fluorescence
As mentioned in section 2.3, LIF is an advantageous diagnostic method. When
performing ALA-PDT one can use the characteristic uorescence from PpIX (sec-
tion 2.3.1) to follow the uptake and accumulation of photosensitizer before PDT,
and the photodegeneration after PDT. In Lund, the uorescence from the lesion
and the adjacent normal skin is monitored at �xed time intervals, according to
a standardized protocol [16]. An example of such a protocol is presented in ap-
pendix C. The measurements are also used to investigate the kinetics of the PpIX
accumulation and to determine when the accumulation of PpIX in the cancerous
tissue is suÆcient, i.e. when to start the treatment after ALA has been adminis-
tered. During treatment, LIF measurements are performed every 30 or 60 seconds
to follow the e�ect of treatment light on the photosensitizer (personal experience).
The applied light source is a compact nitrogen laser-pumped dye laser system
tuned to 405 nm, generating 3 ns pulses at a pulse repetition rate of 10 Hz [16].
The light is delivered through a 600-�m optical quartz �ber and this �ber is also
used to collect the induced uorescence. The excitation pulse energy out of the
�ber is approximately 1 - 2 �J. The collected uorescence is transmitted through
a dichroic mirror and a cut-o� �lter to separate the uorescence from scattered
excitation light. Finally, the uorescence is spectrally dispersed in a spectrometer
(resolution ' 5 nm) and detected with an image-intensi�ed linear diode array.
The system is showed schematically in �gure 4 and it is described in details in ref.
[27]
One of the PDT treatments concerned a 66 years old male patient su�ering from
Paget's disease (see appendix B). A picture of the super�cial lesion is presented in
�gure 5. The LIF measurements performed in connection with this PDT treatment
are shown in �gures 6 a) - f). The measurements were performed before, during
and after PDT.
The uorescence from 100 laser pulses was integrated for each spectrum to obtain
a high signal to noise relationship. The LIF measurements were recorded at six
di�erent times: one hour, two hours and four hours after ALA application, imme-
diately before PDT treatment, immediately after PDT treatment and �nally one
hour after PDT treatment. At each occasion a total of six spectra were recorded
in scans over the super�cial lesion (tumor center, 2 mm inside tumor border and
tumor border) and its immediate surroundings (2, 5 and10 mm outside visible
tumor border). For each set of measurements, the uorescence intensity from a
reference dye was recorded for normalization.
Each of the �gures 6 a) - f) shows three selected spectra from the point mon-
itoring measurements, corresponding to tumor center (full lines), tumor border
(dashed lines) and 10 mm outside tumor border (dotted lines). The �rst broad
uorescence centered around 490 nm is the tissue auto uorescence from the natu-
rally present uorophores. It is observed that the auto uorescence is clearly higher
Ris�-R-1285(EN) 17

#����
$����
%���
#����
&���������'"�����(
������'��)���(!
���* �����
�+�������,��
�
�����
&�������#����
�+�������
&����
��+-��
Figure 4. Schematic representation of the nitrogen laser-pumped dye laser system
for diagnostics at Lund University Hospital. The cut-o� �lter and the dichroic
mirror ensures that induced uorescence is separated from scattered excitation
light.
in the normal tissue than in the diseased skin. This applies for all times, also before
ALA application, which is not shown here (see e.g. ref. [16]). Following the time
evolution after ALA application, a very high PpIX uorescence develops inside
the lesion, as compared to the surrounding skin. Immediately before therapeutic
light delivery, in d), the PpIX accumulation in diseased tissue as compared to
the surrounding skin, is estimated to be suÆcient to start the treatment. This
estimation is based on experience from the medical doctor's point of view. The
uorescence immediately after the treatment is shown in e) and it is observed that
the PpIX level has dropped signi�cantly. Finally, one hour after the treatment, in
f), the PpIX is completely gone in the surrounding skin and almost bleached away
in the treated area. In the lesion, the uorescence from the photoproducts formed
during the irradiation can, with a trained eye, be observed as a relative increase
of the signal between the two peaks of PpIX around 670 nm. As mentioned in
section 2.2, the uorescence from the photoproducts is modest, which, makes it
diÆcult to observe here.
Figure 5. Super�cial Morbus Paget lesion on a 66 years old male patient. The
uorescence measurements (LIF) performed on this lesion are shown in �gure 6.
18 Ris�-R-1285(EN)

350 400 450 500 550 600 650 700 750 800
0
0.5
1.0
1.5
2.0
�������.%.
350 400 450 500 550 600 650 700 750 800
0
2.0
4.0
6.0
10 mm outside border
Tumor center
Tumor border
!������.%.
350 400 450 500 550 600 650 700 750 800
0
2.0
4.0
6.0
8.0
"������.%.
350 400 450 500 550 600 650 700 750 800
0
2.0
4.0
6.0
8.0
10.0�����&�
350 400 450 500 550 600 650 700 750 800
0
2.0
4.0
6.0����&�
350 400 450 500 550 600 650 700 750 800
0
0.5
1.0
1.5
2.0
2.5 ��������&�
/�0�������1��2
$�-���������1��2
�( ,(
�( 3(
�( �(
Figure 6. Laser induced uorescence measurements. Tissue excited at 405 nm,
uorescence recorded in the range 400 nm- 750 nm. The broad, blue-green peak
centered around 490 nm represents the auto uorescence from endogenous chro-
mophores in the tissue. This peak has a higher intensity in the normal than in the
cancerous tissue. The lesion is characterized by the uorescence from PpIX, with
an emission maximum at about 635 nm and an additional peak at about 705 nm.
The lesion is also characterized by a low auto uorescence.
2.5 Discussion
The PDT treatments of super�cial lesions are performed with great success in
Lund. However, regarding the development of an interstitial PDT treatment method,
there are some problems to be solved. The main problem with the I-PDT system
at Lund, is the delivering of treatment light from the commercial unit. This multi-
mode diode laser light is highly divergent and su�ers from poor beam characteris-
tics, resulting in a huge loss of light already at the �rst lens of the 3/6-�ber system
(�gure 3). Furthermore, the coupling eÆciency to the six �bers is low due to the
Ris�-R-1285(EN) 19

poor focusability of the diode laser light. Additional losses in the system, results in
an accumulated power from the system of only 700 mW (personal measurements).
Remember, in comparison that the freely running commercial unit provides 1.5
W. Moreover, there is a considerable discrepancy between the powers measured at
the individual �ber tips. It is desirable to have the same amount of power exiting
each �ber, since this would result in a regular treatment at each �ber tip inside
the tumor volume. Due to the divergence and poor focusability of the beam, this
is not possible and the losses at di�erent passages in the system, results in an
unevenly distribution of energy in the �bers.
Another problem is the size of the six �bers in the system. They all have core
diameters of 400 �m. Inserting six �bers of this size into a deeper lying lesion
will certainly cause some cosmetic damage. This was veri�ed in animal studies.
Moreover, inserting �bers of this size cause a risk of spreading the cancerous cells
to the normal tissue. Replacing the �bers with thinner �bers will, however, result
in even poorer coupling eÆciency and thereby even less output power.
Altogether there is a great need of a new diode laser system with improved beam
characteristics, adaptable to the 3/6-�ber-system in Lund. The desired source
should make it possible to replace the �bers in the 3/6 system with 50-�m core-
diameter �bers (personal conversation), without loosing too much power. Even
thinner �bers would risk breaking inside the patient. The source should experience
high quality beam characteristics, minimizing the amount of light lost at the �rst
lens in the 3/6-system and furthermore, its coupling eÆciency to 50-�m �bers
should be high, i.e. the source should be close to the di�raction limit.
In chapter 4, I will present such a system, developed during the past year.
As will be shown, the new diode laser system has signi�cantly improved beam
characteristics, and can be focused to an almost di�raction limited spot size. It is
thereby very well suited for optical �ber guidance and adaptation to the multiple-
�ber system in Lund.
20 Ris�-R-1285(EN)

3 The Light Source
This chapter introduces the relevant background necessary to understand the laser
system developed in connection with this thesis. First the so-called Frequency Se-
lective Phase Conjugate Feedback scheme is introduced, whereupon the relevant
components of this special system are described individually. The nature of the
employed laser type is accounted for and the principles of spatial and spectral �l-
tering are explained. The last section concerns two methods for estimating the beam
quality. These de�nitions will be employed when characterizing the laser system
in the chapter to follow.
3.1 The FSPCF Scheme
The laser system of concern in the present thesis is based on the frequency selective
phase conjugate feedback (FSPCF) scheme proposed by M. L�bel et Al. [28], [29].
The FSPCF scheme is a method to improve the poor spatial and temporal beam
characteristics of high power diode lasers, such as broad area lasers (BAL's), laser
diode arrays (LDA's) and laser diode bars (LDB's). The output from these multi
mode lasers consists of a superposition of transverse modes and their spectra are
usually relatively broad. The FSPCF system forces the laser diode to oscillate in
one temporal mode only and the output is extracted in one single spatial lobe.
The scheme in [28] and [29] exposes a high power diode laser to optical phase
conjugate feedback (PCF) from a self-pumped photorefractive crystal. The crystal,
also referred to as the phase conjugating mirror (PCM), serves as end mirror in
this external cavity system. Between the laser source and the crystal, a �ltering
(spatial as well as frequency selective) system is implemented. It is sometimes
necessary to include a half wave plate so the polarization of light lies in the c-
z plane, where c denotes the optical axis of the crystal (see section 3.5) and z
is the axis of propagation. This con�guration yields the highest photorefractive
response from the crystal (see section 3.5). The relevant implemented components
are described in more detail below.
In �gures 7 a) and b), schematic drawings of the setup are presented. In a) the
system is viewed from above while b) provides a sideview.
The �gure shows a laser diode, exempli�ed by a BAL, implemented in the external
feedback system. The x-, y- and z-axes indicate the lateral, transverse and longi-
tudinal directions respectively. These conventions are maintained throughout the
thesis. L1, which collimates the beam in the transverse direction, is an aspherical
lens with a small focal length (f) and a large numerical aperture N.A, given by
[30]:
N:A = n sin �, (1)
where � represents the angle made by the marginal of the ray with the optical axis
and n is the refractive index in object space. Since L1 is spherical, it also has some
in uence on the transverse direction. L2 is a cylindrical lens, which collimates the
beam in the lateral direction, and forms a far-�eld image (i.e. image of Fourier
plane of L1) of the output facet in a certain distance. This distance is given by
the lensmaker's equation [30]:
1
s1+
1
s2=
1
f, (2)
Ris�-R-1285(EN) 21

�
$��*����3
+����
�
�������
+�����
�(
,(
Figure 7. The Frequency Selective Phase Conjugate Feedback Scheme (FSPCF )
viewed from a) above and b) the side. L1 and L2 constitute a collimating lens
pair, W is a Wedge, E is an Etalon, M is a Mirror, SF is a Spatial Filter
consisting of two parallel razorblades and L3, a plano convex lens, focuses the
beam onto the crystal surface. x indicates the lateral direction (the low coherence
axis), y is the transverse direction (the high coherence axis) and the longitudinal
axis (direction of propagation) is denoted z. The spatial �ltering is performed in
the lateral direction, as outlined in b), where the selection of one lobe of a single
BAL mode is also depicted.
Where s1 is the distance between L2 and the Fourier plane of L1, f is the focal
length of L2 and s2 is the distance from L2 to the plane of the generated far-�eld
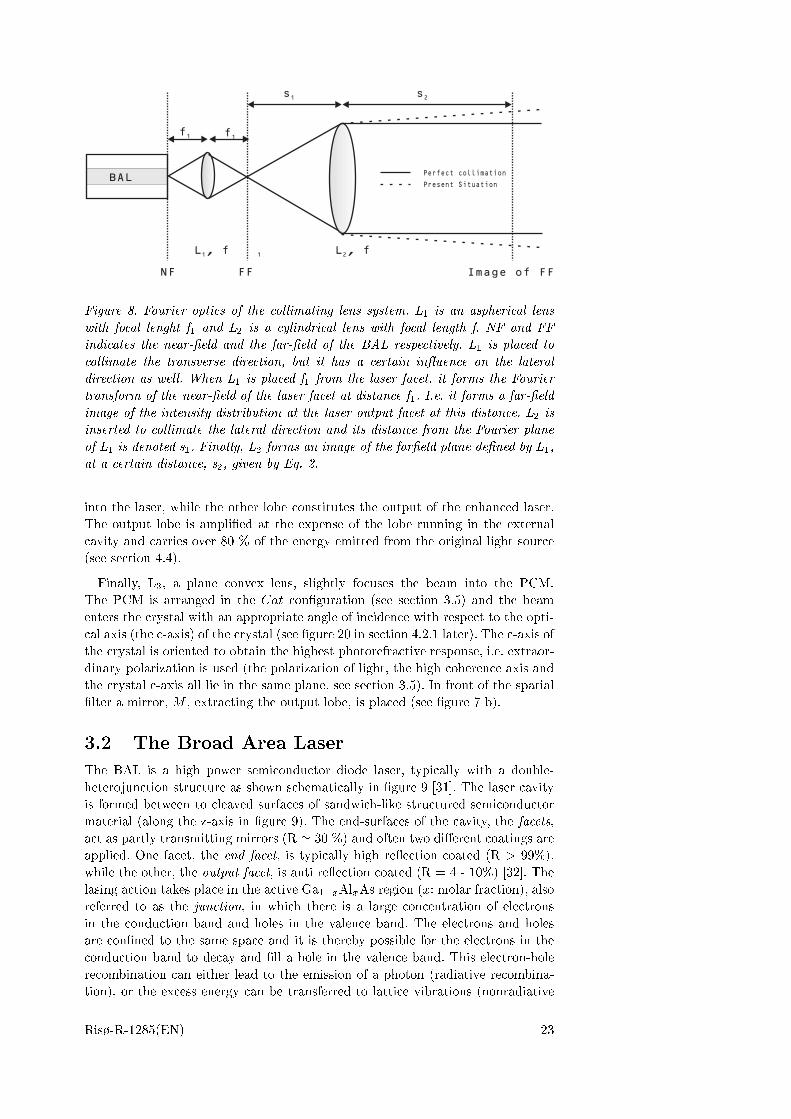
plane. The Fourier optics of the collimating lens system are shown in �gure 8,
where NF and FF indicate the near-�eld and the far-�eld of the BAL respectively.
Due to lens aberrations, astigmatism and the fact that L1 is spherical and L2cylindrical, the beam is slightly diverging in the lateral direction and the far-�eld
is imaged in the plane given by Eq. 2 at a distance s2 from L2. Substituting L1 with
a cylindrical lens to collimate only in the transverse direction, would theoretical
correct this problem, but achromats are more suited due to their large numerical
apertures.
W is a wedge, which extracts two re ections usable in beam diagnostics (one
of which leading to a beam analyzer, the other to a spectrometer). E is a Fabry-
Perot etalon, chosen to ensure only one spectral mode to pass, i.e. it has the
function of a spectral �lter leading to lasing action at a single wavelength. The
wavelength can be tuned several nanometers [29]. The spatial �lter, SF , is one of
the key components in the setup, ideally permitting only one single spatial mode
to pass when adjusted correct. SF is placed in the far-�eld de�ned by L2, where
the lateral intensity pro�le of a single BAL mode forms a double lobe (see section
3.2.1). One of the lobes is passed through to the phase conjugate mirror and back
22 Ris�-R-1285(EN)
% 4�����������������
% 4��!
��
��
��
�!
5.%
$ $$ ��������$$
���������������
���������-���
Figure 8. Fourier optics of the collimating lens system. L1 is an aspherical lens
with focal lenght f1 and L2 is a cylindrical lens with focal length f. NF and FF
indicates the near-�eld and the far-�eld of the BAL respectively. L1 is placed to
collimate the transverse direction, but it has a certain in uence on the lateral
direction as well. When L1 is placed f1 from the laser facet, it forms the Fourier
transform of the near-�eld of the laser facet at distance f1. I.e. it forms a far-�eld
image of the intensity distribution at the laser output facet at this distance. L2 is
inserted to collimate the lateral direction and its distance from the Fourier plane
of L1 is denoted s1. Finally, L2 forms an image of the far�eld plane de�ned by L1,
at a certain distance, s2, given by Eq. 2.
into the laser, while the other lobe constitutes the output of the enhanced laser.
The output lobe is ampli�ed at the expense of the lobe running in the external
cavity and carries over 80 % of the energy emitted from the original light source
(see section 4.4).
Finally, L3, a plane convex lens, slightly focuses the beam into the PCM.
The PCM is arranged in the Cat con�guration (see section 3.5) and the beam
enters the crystal with an appropriate angle of incidence with respect to the opti-
cal axis (the c-axis) of the crystal (see �gure 20 in section 4.2.1 later). The c-axis of
the crystal is oriented to obtain the highest photorefractive response, i.e. extraor-
dinary polarization is used (the polarization of light, the high coherence axis and
the crystal c-axis all lie in the same plane, see section 3.5). In front of the spatial
�lter a mirror, M , extracting the output lobe, is placed (see �gure 7 b).
3.2 The Broad Area Laser
The BAL is a high power semiconductor diode laser, typically with a double-
heterojunction structure as shown schematically in �gure 9 [31]. The laser cavity
is formed between to cleaved surfaces of sandwich-like structured semiconductor
material (along the z-axis in �gure 9). The end-surfaces of the cavity, the facets,
act as partly transmitting mirrors (R ' 30 %) and often two di�erent coatings are
applied. One facet, the end facet, is typically high re ection coated (R > 99%),
while the other, the output facet, is anti re ection coated (R = 4 - 10%) [32]. The
lasing action takes place in the active Ga1�xAlxAs region (x: molar fraction), also
referred to as the junction, in which there is a large concentration of electrons
in the conduction band and holes in the valence band. The electrons and holes
are con�ned to the same space and it is thereby possible for the electrons in the
conduction band to decay and �ll a hole in the valence band. This electron-hole
recombination can either lead to the emission of a photon (radiative recombina-
tion), or the excess energy can be transferred to lattice vibrations (nonradiative
Ris�-R-1285(EN) 23

recombination). In the �rst case the released photon can again induce an electron-
hole recombination leading to the emission of an additional photon. This is the
stimulated emission process leading to the light ampli�cation.
Layers of another semiconductor material, giving a refractive index variation
along the transverse direction, surround the active layer. This index variation leads
to a con�nement of ampli�cation in the active layer (transverse index-guiding)
[33]. There is no index variation in the lateral direction (x) but the gain pro�le
in this direction can be controlled via the metallization contact, also known as
the stripe, on top of the structure, which provides the current for the BAL. By
narrowing this metallization (or by proton implantations) one can achieve a better
con�nement of the injected carriers (lateral gain-guiding). An e�ect known as
antiguiding will, however, counteract this gain-induced con�nement and lead to a
broader �eld distribution in the lateral direction. Just beneath the metallization
contact, there is an increase in the carrier density, i.e. an increase in gain, which
leads to a reduction of the refractive index at this location. Thus, the optical �eld
will experience a region of lower refractiveindex at the center of the device, as
compared to the regions near the edges of the metallization contact. Since the
optical �eld tends to move towards regions of high refractive index, this leads to
a broadening of the �eld distribution in the lateral direction.
A detailed description of the lateral antiguiding e�ect is found elsewhere in
literature, see e.g. [33], [34] and [35].
6
�-+-
�������
7��������0����8%�����
��������������
�
�
9� .� .��*� �
9� .� .��'+*�+�(�*� �
9�.��'+*�+�(
9� .� .��'�*�+�(�*
9�.��'�*�+�(
#����� ���
��3��*�-�3�3
9���*�-�3�3
Figure 9. The typical Broad Area Laser. x, y and z represents the lateral, the
transverse and the longitudinal axes respectively. The device is index guided in the
transverse direction (y) and gain guided in the lateral direction (x). The intensity
distribution in the transverse direction is strongly con�ned to the active layer and
only the fundamental mode is present. In the lateral direction, the intensity pro-
�le is broader and several modes oscillate simultanously, leading to a sinusoidal
variation across the output facet.
3.2.1 Modes
The light from broad area lasers is strongly con�ned in the transverse direction,
simply because the tiny dimension (/ 1 �m) of the active layer only supports the
fundamental, nearly Gaussian, mode [36]. This leads to high spatial coherence in
24 Ris�-R-1285(EN)

the transverse direction, which is also known as the high coherence axis or simply
the fast axis [37]. The lateral direction, however, is signi�cantly wider; the wider
the lateral direction, the more optical power can be extracted without damaging
the end facets [36], [38]. This permits several spatial modes to oscillate on the
expense of spatial coherence. The axis is therefore referred to as the low coherence
axis or simply the slow axis.
Besides from oscillating in a number of spatial modes, a BAL will in general also
oscillate in a number of longitudinal modes. The simultaneous oscillation of spatial
and temporal modes are outlined in �gure 13 (section 3.4), where ��spec denotes
the longitudinal (temporal) and ��spat denotes the lateral (spatial) mode spacing.
When the spatial �ltering is applied it is also possible to discriminate between
the longitudinal modes by the introduction of a frequency selective element as
described in section 3.4 below.
Lateral �lamentation Due to the nonlinear interaction between the optical
�eld and the refractiveindex, broad area lasers su�er from self-induced �lamenta-
tion, which leads to a periodic �eld distribution in the lateral direction. In 1987,
D. Mehuys et Al. made a theoretical investigation of the lateral modes of broad
area lasers [39]. Their work is shortly reviewed here for the sake of clarity of the
mode selection process (spatial �ltering) essential to the present work.
The boundary conditions i.e. zero optical �eld at the edges of the metallization
contact, results in a periodical-varying �eld (�lamentation) between the edges.
The �eld consists of a superposition of the fundamental and higher order modes,
which all together can be expressed as superposition of sinusoidal functions. The
fundamental mode constitutes a single half period of a sinusoidal, while higher
order modes result in the observed variation in optical �eld, i.e. a periodic variation
of lateral intensity distribution. Furthermore, the boundary conditions excite a
saturation phenomenon. In regions of high optical intensity the gain saturates,
leading to a local depletion in the gain pro�le (spatial hole burning). The result
is local increases in refractive index and thereby a further con�nement of the
optical �eld in regions of high refractive index, i.e.(again) a periodic varying �eld
distribution on the output facet.
All together, this lead to a �eld amplitude, consisting of a small ripple on a large
DC value and the cavity supports a number of higher order sinusoidal modes, often
referred to as broad area modes (BAL modes). Matching �elds of di�erent modes
at the boundary determines the depth of the over all modulation. The situation is
sketched in �gure 10. The broadness of the distribution is due to the antiguiding
e�ect described shortly above.
Each higher order sinusoidal mode leads to the formation of a double lobe
distribution in the far-�eld (the absolute square of the Fourier transform of a
sine). The fundamental mode though, constitutes a single lobe in the far-�eld
originally referred to as the in-phase mode [40].
The description of BAL modes is complex and until now, no one has presented
a complete theory for their mischievous nature. Two descriptions do exist though,
namely the super-mode theory [40], [41] and the perturbed broad area model
(originally described in [42]). The perturbed broad area model is superior to the
super-mode theory in the case of gain-guided devices. This is due the fact that the
super-mode theory does not allow for higher order mode numbers, m, exceeding N,
where N is the number of stripes in the device. Thus, in the case of a single stripe
unit, such as a BAL, the super-mode theory would only predict the existence
of one single lateral mode. This prediction is incomparable with experimental
observations. None of the two theories, however, provide a complete description,
Ris�-R-1285(EN) 25

they both have their limitations, and the given situation determines which model
to apply.
�����0������3�
+�����
:������0����3���+�����
9����+�����
��������+�����
��;���3��-����
#����� ���
�
�
Figure 10. Double heterojunction structure broad area laser geometry with coordi-
nat system used in this thesis. The fundamental transverse mode highly con�ned
to the active layer is depicted in the top left of the �gure. The bottom shows the
nonlinear lateral mode intensity pro�le. the gain is locally depleted by stimulated
emission in the high intensity regions, leading to a local increase in refractive
index.
The two lobes of a BAL mode are radiated symmetrically with respect to the
zero angle of the laser and di�erent BAL-modes are also radiated at di�erent
angles, �m, where m denotes the mode number. This makes it possible to spatially
distinguish between them. Introducing a spatial �lter in the external cavity, one
can then ideally discriminate certain modes to obtain a single mode (double lobe)
formation.
3.2.2 Astigmatism of the BAL Emission
Due to the di�erent guiding mechanisms in the lateral (gain-guiding) and the
transverse (index-guiding) directions, the broad area laser su�er from astigmatism.
That is, the beam waists of the two directions are not coinciding. In the transverse
direction, which almost constitutes a point source, the waist is located on the front
facet of the device. The lateral direction, however, has a certain extension and the
waist is located behind the front facet. The situation is depicted in �gure 11. This
longitudinal separation in waist-plane in the two directions, results in problems
when collimating the beam or re-imaging the junction. Collimation can in principle
be done with two cylindrical lenses. Alternatively one can employ an anamorphic
system, as described in [43]. The typical separation between the waists is on the
order of 30 �m - 50 �m for BALs and LDAs (personal conversation).
26 Ris�-R-1285(EN)

.��������
�
�
#����� ���
.��0�������
5.%
%<���������������'�(
7������������������'�(
� � �� == ��
Figure 11. Schematic illustration of the astigmatism, from which high power diode
lasers su�er. The astigmatism results in problems when collimating or re-imaging
the junction.
3.3 Spatial Filtering
The spatial �lter (SF) is one of the key components in the setup. It opens the
possibility to extract a large fraction of the total power emitted from the BAL in
one single lobe. The spatial �lter is an adjustable slit consisting of two parallel
razorblades. Placed between the BAL and the PCM, the �lter can, when adjusted
correct, select a single mode, ideally allowing only one lobe of a selected mode to
reach the external re ector. Figure 12 provides a sideview of the situation. The
spatial mode (lobe) selection is performed in the lateral (x) direction in agreement
with the mode description given in section 3.2.1
Allowing only one of the two lobes to reach the PCM and be retrore ected,
the laser will be forced to oscillate in this mode only. One lobe is reinjected from
the PCM to the active region of the BAL in a negative angle of incidence, -�m,
determined by the mode number m (see �gure 12). As the lobe reaches the output
facet, and is transformed into the sinusoidal near-�eld pattern, it traverses through
the active medium to the end facet and �nally, after multiple re ections in the
��#��,�
�-+-��,�
5.%
����#
��#����3,��>
�
�
%�
%!
�$
#
����
#3�
�-�,����
���
Figure 12. Sideview of the spatial �ltering process. The spatial �lter is adjusted
to permit only one lobe (the injection lobe) to pass through and be retrore ected
by the phase conjugating crystal. The other lobe (the output lobe) is in this way
signi�cantly ampli�ed on the expence of the injection lobe.
Ris�-R-1285(EN) 27

active gain medium, it exits the output facet in the angle of the positive mode
lobe, +�m [44]. The positive lobe (the output lobe), radiated in an angle +�m, is
in this way signi�cantly ampli�ed on the expense of the injection lobe and can be
extracted from the system by placing a mirror in front of the spatial �lter. As a
consequence the output from the laser constitutes a single lobe nearly Gaussian
distribution, leading to a high degree of focusability.
3.4 Spectral Filtering
To discriminate the longitudinal modes a Fabry-Perot etalon can be included in
the external cavity. A Fabry-Perot etalon is simply a pair of plane-plane plates,
which are either air spaced or �lled with a dielectric material (e.g. fused silica). If
the distance between the plates is small enough, the spacing between transmission
maxima of the etalon, i.e. the Free Spectral Range (FSR), will be large as compared
to the width, ��g , of the laser gain pro�le. By adjusting the angle of incidence on
the etalon, a resonance frequency can be brought near the center of the gain pro�le,
while the next resonance frequency lies outside the gain pro�le. The situation
is schematically depicted in �gure 13, where ��spec denotes the spectral mode
spacing and ��spat the spatial mode spacing. The properties of the etalon may be
characterized by its �nesse (F), de�ned as F = FSR
FWHM, where FWHM is the full
width at half maximum of a peak in the transmittance curve of the etalon [45].
Thus a high �nesse etalon provides a narrower longitudinal �lter than does a low
�nesse etalon. Correspondingly, a high �nesse etalon is more diÆcult to implement
and align in a cavity than a low �nesse etalon.
In the following the free spectral range of the etalon is compared to the lon-
gitudinal mode spacing ��spec of the BAL. The comparison is considered for
parameters relevant in experiments to follow. The longitudinal mode spacing of
the BAL, ��spec, is given by [45]:
��spec =�20
2nBALL(3)
where �0 is the lasing wavelength in vacuum, nBAL is the refractive index of the
BAL, and L is the length of the broad area cavity. For a GaAlAs (n = 3.6) BAL
with �0 = 638 nm and L = 1 mm, the longitudinal mode spacing is ��spec = 0.06
nm. With �gure 13 in mind, the demands to the etalon is
� FSR (etalon) & ��g (laser) and
� FWHM (etalon) . ��spec (laser).
For Broad area lasers and laser diode arrays, a bandwidth, ��g , of approximately
1 nm is typical, i.e. several (in this example: 16) longitudinal modes oscillate
simultaneously. Choosing a solid fused silica (n = 1.5) etalon with a thickness of
d = 100 �m, a free spectral range of FSR = �2
2nd' 1.4 nm is obtained. Deciding
e.g. for a �nesse of F = 25, this gives a FWHM of the etalon of FSR
F = 0.05 nm.
Thus, theoretically, this would be a reasonable choice of etalon.
In practice, however, one could choose an etalon with a slightly larger thickness,
e.g. 150 �m, and a lower �nesse, e.g. F = 14, giving a FSR of 0.9 nm and a FWHM
of 0.06 nm. This etalon would be much easier to implement in an external cavity
and the properties would, most likely, be suÆcient to ful�ll the requirements for
the present purpose.
28 Ris�-R-1285(EN)

%����������+�����������������+����
������
�+�������3�
�+�����
�+������3�
�+�����
/�0������
$�:
��
���+����
���+���
$/7#
Figure 13. Schematic illustration of the spectral �ltering process with a Fabry-Perot
etalon. If the distance between the etalon plates is small enough, the Free Spectral
Range (FSR), between adjacent resonance frequencies of the etalon, will be large
compared with the width, ��g, of the laser gain pro�le. In this way the laser can
be forced to oscillate in one temporal mode only.
3.5 The Phase Conjugating Mirror
The external cavity re ector considered here is a photorefractive BaTiO3 crystal.
The crystal has three symmetry axes, two of which are identical. The third axis,
the optical axis (the c-axis), indicates the direction of spontaneous polarization.
This arises from a shift of the Ba2+ ions and Ti4+ ions, with respect to the O2�
ions in the crystal, which results in the development of a dipole moment (or a
spontaneous polarization) in the direction of motion: the c-axis [46]. Optical phase
conjugate feedback from the crystal causes the broad spectrum of a diode laser to
narrow down to a few longitudinal modes and to scan towards longer wavelength.
The exact mechanism and the physical origin of this phenomenon, known as self-
induced frequency scanning, is not yet established and it will not be treated in this
thesis (for references, see e.g.[47], [48] and [49]). However, this narrowing of the
longitudinal mode spectrum is perhaps observed in the stability measurements in
the next chapter, section 4.3.5.
3.5.1 The Physics of the Photorefractive E�ect
Detailed description of the photorefractive e�ect and its various applications will
not be presented here. However, the physics of the e�ect will be outlined, since one
of the applications, namely optical phase conjugation, constitutes an important
part of the external cavity considered in this work. The photorefractive e�ect was
discovered in 1966, where it ruined the phase matching condition in an experiment
concerning second harmonic generation. This unfavorable behavior lead to the,
scarcely attering, designation "Optical Damage" [50]. However, 3 years later the
potentials of this useful e�ect was realized and it was renamed "the photorefractive
e�ect" [51].
The photorefractive e�ect concerns the writing of volume phase gratings in pho-
torefractive materials. The physics of the e�ect is brie y explained by considering
two coherent light beams incident on a photorefractive material (e.g. BaTiO3).
The interference between the beams will cause an intensity modulation inside
the material which, in the case of two plane waves, results in a sinusoidal grating
structure as shown in �gure 14 a). In the bright areas, electrons from �xed �lled
Ris�-R-1285(EN) 29

+ ++
+ ++
+ ++
+ ++
+ ++
- --
- --
- --
- --
- --
- --
�������
�3-����
�������3�����
3����,-��
��3-��3��+���*
�����������3
:������0����3��
0������
�(
,(
�(
3(
�
�
�
��>���
������
����
�
�
�
�
�
�
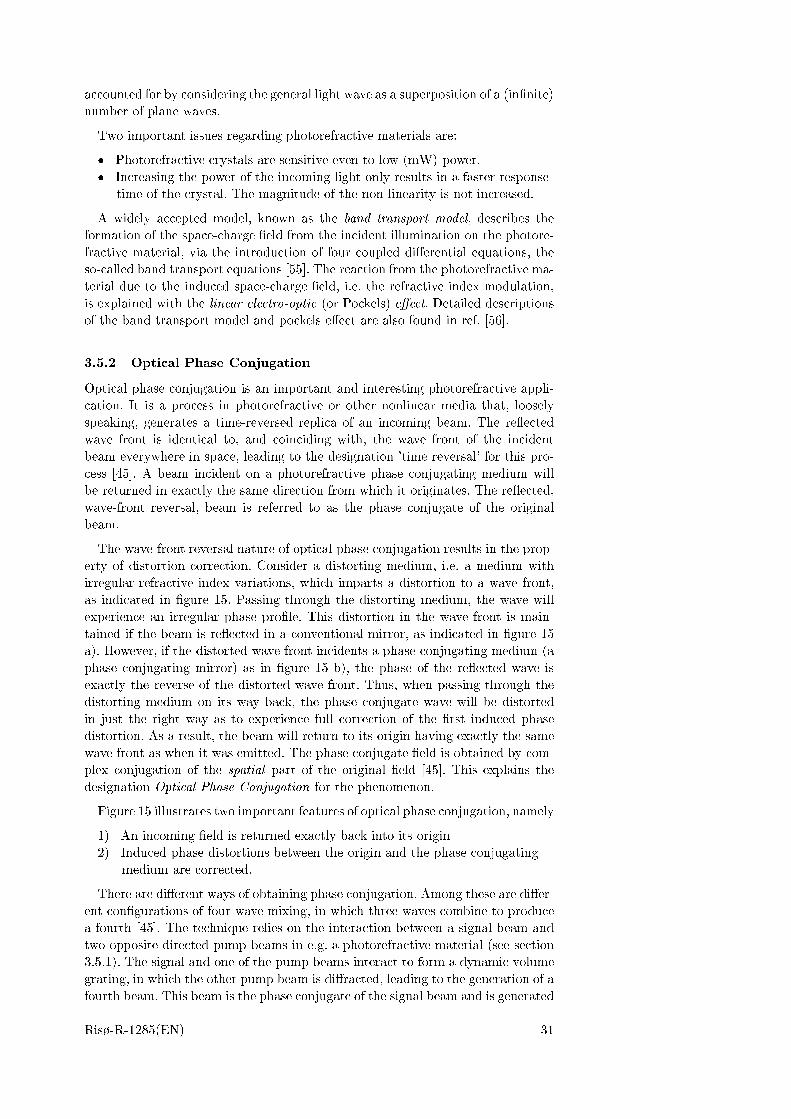
Figure 14. The physics of the photorefractive e�ect. a) shows the resulting inten-
sity modulation of two interacting, coherent plane waves. This leads to a seperation
of charges as shown in b), which again induces a space-charge �eld in the pho-
torefractive material as depicted in c). Finally, as indicated in d), this leads to a
refrative index variation through Pockels e�fect.
donor atoms are photoexited into the conduction band. Here they are free to mi-
grate through the material via drift, i.e. motion of electrons in an electric �eld, or
di�usion, i.e. electron migration from high concentration to low concentration re-
gions. Reaching a dark region, the electrons recombine with the immobile ionized
acceptors. All together, this leads to the generation of a spatially varying charge
density distribution, �, as shown in �gure 14 b). Figure 14 c) illustrates the result-
ing internal electrical space-charge �eld, ESC . Finally, as depicted in �gure 14 d),
the induced space-charge �eld, originating from the electro-optic properties of the
crystal, results in a refractive index modulation inside the photorefractive material
through Pockels e�ect [52], [53]. The change in refractive index, �n, is propor-
tional to the magnitude of the applied electric �eld, i.e. the induced space-charge
�eld.. The interaction of incoming light with the index modulation, i.e. with the
volume phase grating, leads to exchange of energy and phase between the beams,
also known as photorefractive coupling. The grating can be erased by illumination
of the material by a single plane wave or an incoherent light beam. The photons
in this beam will re-excite the charge carriers whereby their distribution becomes
uniform and the refractive index grating disappears. The mapping of the intensity
distribution as a volume phase grating is thus a dynamic process, i.e. writing and
erasing may be carried out repeatedly. In the case of bariumtitanate (BaTiO3),
a large index modulation, i.e. a large photorefractive response, is obtained by en-
suring that the polarization of the incoming light lies in the c-z plane, where z is
the direction of propagation [54].
The generalization of the e�ect to waves which are not necessarily plane, is
30 Ris�-R-1285(EN)
accounted for by considering the general light wave as a superposition of a (in�nite)
number of plane waves.
Two important issues regarding photorefractive materials are:
� Photorefractive crystals are sensitive even to low (mW) power.
� Increasing the power of the incoming light only results in a faster response
time of the crystal. The magnitude of the non-linearity is not increased.
A widely accepted model, known as the band transport model, describes the
formation of the space-charge �eld from the incident illumination on the photore-
fractive material, via the introduction of four coupled di�erential equations, the
so-called band transport equations [55]. The reaction from the photorefractive ma-
terial due to the induced space-charge �eld, i.e. the refractive index modulation,
is explained with the linear electro-optic (or Pockels) e�ect. Detailed descriptions
of the band transport model and pockels e�ect are also found in ref. [56].
3.5.2 Optical Phase Conjugation
Optical phase conjugation is an important and interesting photorefractive appli-
cation. It is a process in photorefractive or other nonlinear media that, loosely
speaking, generates a time-reversed replica of an incoming beam. The re ected
wave front is identical to, and coinciding with, the wave front of the incident
beam everywhere in space, leading to the designation 'time reversal' for this pro-
cess [45]. A beam incident on a photorefractive phase conjugating medium will
be returned in exactly the same direction from which it originates. The re ected,
wave-front reversal, beam is referred to as the phase conjugate of the original
beam.
The wave-front reversal nature of optical phase conjugation results in the prop-
erty of distortion correction. Consider a distorting medium, i.e. a medium with
irregular refractive index variations, which imparts a distortion to a wave front,
as indicated in �gure 15. Passing through the distorting medium, the wave will
experience an irregular phase pro�le. This distortion in the wave front is main-
tained if the beam is re ected in a conventional mirror, as indicated in �gure 15
a). However, if the distorted wave front incidents a phase conjugating medium (a
phase conjugating mirror) as in �gure 15 b), the phase of the re ected wave is
exactly the reverse of the distorted wave front. Thus, when passing through the
distorting medium on its way back, the phase conjugate wave will be distorted
in just the right way as to experience full correction of the �rst induced phase
distortion. As a result, the beam will return to its origin having exactly the same
wave front as when it was emitted. The phase conjugate �eld is obtained by com-
plex conjugation of the spatial part of the original �eld [45]. This explains the
designation Optical Phase Conjugation for the phenomenon.
Figure 15 illustrates two important features of optical phase conjugation, namely
1) An incoming �eld is returned exactly back into its origin
2) Induced phase distortions between the origin and the phase conjugating
medium are corrected.
There are di�erent ways of obtaining phase conjugation. Among these are di�er-
ent con�gurations of four-wave mixing, in which three waves combine to produce
a fourth [45]. The technique relies on the interaction between a signal beam and
two opposite directed pump beams in e.g. a photorefractive material (see section
3.5.1). The signal and one of the pump beams interact to form a dynamic volume
grating, in which the other pump beam is di�racted, leading to the generation of a
fourth beam. This beam is the phase conjugate of the signal beam and is generated
Ris�-R-1285(EN) 31

��0������������
�(
��������;-���������
,(
&���������3�-�
/�0��$����������������
/�0��$����,�������������
Figure 15. Re ection from a) a conventional mirror and b) from a phase conju-
gating mirror. The incident wavefronts are indicated with full lines whereas the
re ected wavefronts are dashed. In the case of a phase conjugate mirrror, distor-
tions will be corrected on the way back to the original light source.
due to the nonlinear interaction of phase and energy inside the material. It can
be shown [45] that the nonlinear mixing of the pump and the signal beams results
in the production of a polarization in the material and that this polarization is
proportional to the phase conjugate of the signal wave. The polarization causes a
spontaneous buildup of a counter propagating beam that is the phase conjugate
of the signal wave.
The most compact con�guration is the self-pumped Cat conjugator, which
makes use of internal re ections inside the photorefractive material. In this con-
�guration, the energy of the two pump beams originates from the signal beam
itself. J. Feinberg [57], described the Cat conjugator in 1982. He demonstrated
the generation of a phase conjugate wave by self-induced four-wave mixing in a
BaTiO3 crystal. Since he demonstrated the con�guration in a distortion correcting
experiment with an image of his cat (!), it has ever since been referred to as the
Cat con�guration.
Consider in �gure 16 the Cat geometry where a wave is incident on a pho-
torefractive crystal. Internal re ections cause the incoming beam to interfere with
itself in two interactions zones, leading to the formation of dynamic volume grat-
ings. The incoming beam is di�racted in the self-generated gratings, leading to
the bi-directional internal loop path connecting the two interaction zones as de-
picted in the �gure. The phase conjugate wave is formed as the incoming beam
is di�racted in the gratings. The self-pumped Cat con�guration is attractive due
to its compactness and lack of external pump beams and it will be the applied
con�guration in connection with the present work.
Phase conjugators are superior to conventional mirrors in an external cavity,
since they are self-aligning to the cavity and eventually distortions are dynami-
cally corrected for. Thus, the phase conjugating mirror results in a stable cavity,
independent on the length between the laser source and the external re ector.
Four-wave mixing and optical phase conjugation is described more thoroughly
elsewhere in literature. See e.g. refs. [53], [58] and the references mentioned above.
32 Ris�-R-1285(EN)

�������
���������
$-�*<�0��������
������
���������0�
������
�������
<�0�
��������;-���
��+����
Figure 16. The photorefractive self-pumped Cat conjugator. Four-wave mixing
takes place in two regions inside the crystal, whereby a phase conjugate replica
of the incoming beam is produced. Due to internal re ections, the incoming beam
follows a bidirectional loop, coupling the four-wave mixing regions.
3.6 Beam Quality
The last section in this theoretical chapter concerns two (of many) beam-quality
determination methods. One often employed method is to express how close to
the di�raction-limit, the beam of interest is. This method requires some informa-
tion about the laser source and is a way to compare the observed laser intensity
pro�le with the fundamental mode pro�le of the same laser. Alternatively one can
consider the M2 quality factor. This number compares the beam of concern to
a Gaussian nature, i.e. it determines the focusability of the beam. Both methods
will be considered here.
3.6.1 De�nition of 'Di�raction-Limited'
The di�raction-limit of a broad area laser (or a laser diode array) is de�ned in the
following way [59]:
�diff =1:189�
2x0, (4)
where �diff is the full width at half-maximum (FWHM) of the intensity pro�le
of the fundamental BAL mode (see section 3.2.1), � is the center wavelength of
the laser and x0 is the half-width of the gain medium of the laser. If the radiation
from the BAL is equal to this limit, it is said to be di�raction-limited. For a laser
with � = 638 nm and x0 = 50 �m, the di�raction limit is �diff ' 0.43Æ. Eq. (4)
is compensated for in appendix D.
3.6.2 The M2 factor
The quantityM2 expresses beam quality with 1 denoting a perfect Gaussian beam
and higher values representing poorer beam quality. The number is in this way
connected to the focusability of the beam as compared to the theoretically best
laser beam; the Gaussian.
Consider, in �gure 17, the Gaussian beam geometry.
The Gaussian intensity distribution has the form [60]:
Ris�-R-1285(EN) 33

�
�'�(
<�
<' (
?�
�& �
�
�8�
�
!
Figure 17. The Gaussian beam geometry and intensity distribution. w(z) is the
beam radius or the spot size. The waist is located at w (z=0) = w0. �D is the angle
of divergence. At r = w, the intensity distribution has dropped to 13.5% ( 1e2) of
its peak value.
I(r) = I0 � e(�2r2=w
2), (5)
where r denotes the transverse direction (the plane orthogonal to the direction, z,
of propagation), I0 is the intensity at the center of the laser beam (at r = 0) and
w measures the width of the beam. As can be seen from Eq. (5) and �gure 17, the
intensity drops to I0�e�2 (or to 13.5% of the peak value), when r = w. Commonly
w is referred to as the spot radius or the spot size of the Gaussian beam.
The M2 factor gives no detailed information on the higher order modes present in
the beam and correspondingly neither is any information on mode contest required
to determine its value. The M2 number arises from the fact that the transverse
extent, W (z); of any high-order mode, is everywhere larger than the underlying
Gaussian beam by a constant factor, M , i.e. W (z) = Mw(z), where w(z) is the
width of the Gaussian distribution at distance z from the waist. Replacing w(z)
with Mw(z) in the Gaussian beam propagation formula yields a similar formula
for sources with higher order modes present. The expression for the beam radius,
W (z), including the presence of higher-order modes is then [60]:
W (z) =W0
s1 +
�M2�z
�W 20
�2=W0
s1 +
�M2z
zR
�2, (6)
where W0 is the beam radius at the waist and � is the wavelength of the source.
The Rayleigh range, zR =�W
2
0
�, is a measure of the length of the waist region, and
the two regimes z � zR and z � zR are known as the far-�eld and the near-�eld
regions respectively. This expression has exactly the same form as its Gaussian
equivalent, except for the M2 factor. In general, one can substitute M2� for � in the
Gaussian formulas to obtain the more general, and completely similar, formulas
for beams containing higher order modes. Noting that in the far-�eld M2�z
�W 2
0
� 1,
one obtains the following (good) approximation from Eq. (6):
34 Ris�-R-1285(EN)

M2 =
D0�full�
4�for z � zR, (7)
where D0 = 2W0 represents the beam waist diameter and �full = 2�D ' 2Wz
is
the full cone angle of the diverging beam. D0 is simply obtained by measuring the
beam diameter, de�ned as the 1e2-limit, at the waist. �full (�D ' w(z)
z=) �full '
D(z)
z- see �gure 17) is evaluated as the slope of the straight line appearing, when
the measured beam diameters are plotted against the distance, z, from the waist
(see section 4.2).
The measurements required for determining M2 are simple but informative, and
in section 4.3, these measurements are evaluated and described for the far-�eld
and the output from the system designed in connection with the present work.
Ris�-R-1285(EN) 35

4 Experiments and Results
This chapter deals with the construction of a new diode laser system for photo-
dynamic therapy based on the FSPCF scheme described in the previous chapter.
The setup is described and the system is fully characterized. Experimental results
will be presented and discussed. Once aligned correctly, the enhanced external cav-
ity laser runs in a very stable manner, which is an important requirement when
implementing it in a clinical environment.
The BAL used in this work emits up to 250 mW, which is certainly very high
power in comparison with the market available, but it is not enough to treat ma-
lignant tumors with the method of interest in Lund, which require 1-2 Watts!
However, the principle of the present system is of great interest in Lund and the
enhanced output may be used in re ectance measurements, in which important op-
tical parameters of the diseased and the healthy tissue can be determined. It is a
matter of time - perhaps only months - before a red diode laser (e.g. an array or
a bar) emitting enough optical power is available. When this happens, the system
can be rebuilt and, as will be shown in this chapter, the system will constitute a
revolutionary alternative to the lasers currently used in Interstitial ALA-PDT at
Lund University Hospital.
4.1 The Experimental Setup
This section outlines the experimental setup and the various components are de-
�ned.
The employed laser source is a broad area diode laser from High Power Devices
Inc. (HPD). It has a maximum output power of 250 mW emitted at a center
wavelength of 638 nm. The dimensions of the emitting aperture are 100 � 1 �m2,
while the chip dimensions are 100 � 500 � 1000 �m3 (height, width and length
respectively). The BAL is implemented in the external cavity system shown in
�gure 18. As before the coordinate system represents the lateral (x), the transverse
(y) and the longitudinal (z) axes respectively. L1 is an aspherical lens with a
focal length of f = 4:5 mm and a numerical aperture of N:A: = 0:55. This lens
collimates the beam in the transverse direction (y), i.e. along the high coherence
axis. L2, which collimates the low coherence axis (x), is a cylindrical lens with
f = 40 mm and it is placed 56 mm from L1. This lens de�nes a far-�eld plane
(image of the Fourier plane of the �rst lens) at a distance of approximately 180
mm ( 140' 1
56�4:5 +1180
) from the emitting junction. The 4o wedge, W , extracts
two re ections leading to a beam analyzer (placed in the far-�eld de�ned by L7)
and a spectrometer respectively. In this way, the spatial and temporal properties
of the laser system can be followed in real time. Approximately 20 % of the optical
power from the laser is lost in the collimation lenses and the wedge.
E represents an etalon with a Finesse of F = 14. The etalon may be omitted,
since the lasing action in one particular wavelength is not strictly essential to the
present purpose. No etalon is included in the setup unless otherwise stated. The
spatial �lter, SF , is mounted on two translation stages and is placed exactly in
the far-�eld plane de�ned by L2. It consists of two parallel razor blades that can
be adjusted independently, so only light between the blades is allowed to reach
the external re ector. Experimental experience has shown that the best results
are obtained when starting out by slowly adjusting the lower blade until a double
lobe is appearant on the beam analyzer (i.e. one of the lobes of a given mode is
selected by the SF ). After that one should carefully slide down the upper blade,
to stabilize and further narrow the chosen lobe. It is very likely that the BAL has
36 Ris�-R-1285(EN)

��,����3��������
�$
5�����
%�
%�%
!/ #�
�
�
%�
%�
%"
��������3����,����������
&����
�� ����,���
%@
%)
5.%
�
$��*����3
+����
Figure 18. Experimental setup viewed from above. L1 and L2 constitutes a colli-
mating lens system, W is a wedge, E is a Fabry Perot etalon, SF is a spatial �lter
and M is a mirror extracting the output lobe from the system. L3 is a convex lens,
L4 and L5 constitutes a beam expanding system and L6 is an achromat focussing
the output into the �ber. Finally L7 and L8 focusses the re ections from the wedge
into the diagnostics instruments.
a preferred mode to lase in (as is the case for LDA's - see [42]), and that this
particular spatial mode is located in the 'upper part' of the lateral dimension of
the laser. The process of spatial �ltering is one of the absolute most demanding
tasks in aligning the FSPCF laser.
L3 is a plane convex lens with f = 100 mm. This lens slightly focuses the beam
onto the PCM at an angle of approximately 50Æ. The beam entering the crystal has
dimensions of 1 x 2 mm2. Experience has shown that the highest photorefractive
response is obtained when the entrance beam is as large as possible compared
to the crystal surface. The PCM is a self-pumped photorefractive bariumtitanate
(BaTiO3) crystal of dimensions a � a � c = 5.41 � 5.35 � 6.98 mm3. It is
orientated, so the high coherence axis (y), the polarization of the BAL (linear
polarized along y) and the crystal c-axis lie in the same plane, which yields the
highest photorefractive response (see section 3.5.1). M is a mirror, placed very
close to the spatial �lter (i.e. close to the far-�eld de�ned by L2), that extracts
the output lobe �ltered by the SF. The output beam has dimensions 1 � 8 mm2
measured at M. It is collimated in the high coherence axis (y), but is slightly
diverging in the slow axis (x) (remember the e�ect of astigmatism mentioned in
section 3.2.2).
One of the main challenges is to eÆciently focus the output beam into an optical
�ber with a small core diameter of 50 �m. To do this, it is necessary to expand
the beam in the lateral direction to obtain an approximately circular (or as has
to be the case here: quadratic) shape before the beam is focused into the �ber.
The beam expanding system is built with two cylindrical lenses of f = 5 mm (L4)
and f = 40 mm (L5) respectively. The choice of lenses gives an expansion of 8 (=405) times in the slow axis direction. The two lenses are placed ' 45 mm (sum of
focal lengths) apart to ensure collimation of the expanded beam. Approximately
Ris�-R-1285(EN) 37

10 % of the optical power is lost in the beam expanding system. Following the
expanding lens system, an achromat (doublet) with a focal length of f = 40 mm
(L6) is inserted to focus the output into the optical �ber. Achromats are well
suited for this application, because of their large numerical apertures. L7 and L8
are both convex spherical singlets with focal lengths of 50 mm. They simply focus
the two re ections into the diagnostics devices.
Finally the 50-�m �ber is mounted in a single mode �ber aligner with 5 axes
of motion. The single-mode �ber aligner is mounted on a translation stage, and is
chosen to ensure a high precision setting with respect to the positioning of the �ber
facet. The length of the external cavity is 35 cm and it was built on a lightweight
(14 kg) honeycomb breadboard of dimensions 45 � 60 cm2, to ensure mobility, for
future transporting to Lund.
4.2 Setup and Alignment of the System
This section concerns the di�erent measurements performed to be able to align
and specify the system. The phase conjugating mirror and the broad area laser are
characterized and the recorded intensity distributions in the far-�eld of the laser
are presented. These are used to recognize the far-�eld plane when implementing
the spatial �lter in the setup.
4.2.1 The Phase Conjugating Mirror
As mentioned earlier the PCM used in the setup is a self-pumped photorefractive
BaTiO3 crystal. To determine the appropriate con�guration, with respect to the
angle of incidence, when implementing it in the �nal system, a re ectivity curve
was evaluated. The measurements were performed with a Helium-Neon (HeNe)
laser at 633 nm, and the setup is shown in �gure 19.
The crystal was arranged in the Cat geometry and the measurements performed
with an angle of incidence ranging from 15Æ to 85Æ degrees, with respect to the
normal, �!n , of the crystal surface (�gure 19). The amount of light reaching the �rstdetector, D1, is P1 = R
BSPHeNe, where RBS is the re ectivity of the beamsplitter
and PHeNe is the power emitted by the HeNe laser. The amount of light passed
through the beamsplitter and reaching the PCM is then (1� RBS)PHeNe . Some
of the light, namely RCat(1 � RBS)PHeNe , where RCat is the phase conjugate
re ectivity, is retrore ected via optical phase conjugation. In this way the detector,
D2, detects an amount of light given by P2 = RBSRCat(1�RBS)PHeNe. That is,
RCat =P2
RBSPHeNe� 1(1�RBS)
and �nally:
RCat =P2
P1� 1
1�RBS
(8)
The results of the measurements are shown in �gure 20, where RCat is shown as
a function of angle of incidence, �.
The curve is very promising for the alignment of the FSPCF system. The crystal
has an extremely large angle of acceptance, and a large phase conjugate re ectivity
in general. In the interval, � ' 40Æ � 65Æ the re ectivity is almost 70%.
4.2.2 The Broad Area Laser
When receiving the BAL from HPD, the �rst thing to do, was to verify that the
power-current characteristics and the maximum power, as speci�ed by the dealer,
38 Ris�-R-1285(EN)

7� ��������A�������
�
5������4:����
5�4 :5��
&!
&�
��
�7��� ��
�!
��
'�*: (�5�� 7��� ��
: '�*: (����� 5�� 7��� ��
Figure 19. Setup for measuring the phase conjugate re ectivity of the BaTiO3 crys-
tal. BS is a beamsplitter with re ectivity RBS. The detectors, D1 and D2, measure
the power simultanously at the depicted positions for each position of the crystal.
The crystal is exposed to a HeNe laser at 633 nm with an angle of incidence on the
crystal ranging from 15Æ to 85Æ. The amount of phase conjugate light retrore ected
by the crystal is measured at the detector D2. The phase conjugate re ectivity is
calculated from Eq. 8.
were reproducible. At �rst this did not seem to be the case. The threshold current,
Ith, and the maximum achievable power, Pmax, were both shifted signi�cantly
compared to the speci�cations. It showed out that a batch production of power
supplies were wrong calibrated when produced, and this naturally delayed the
work. The measured power-current characteristics at di�erent temperatures are
shown in �gure 21.
Figure 20. Self-pumped phase-conjugation. Rcat is the light, retro ected via phase
conjugate feedback in the Cat-conjugator. The curve shows phase conjugate re ec-
tivity in the region, � ' 20Æ � 80Æ. In general the re ectivity is very high, up to
70% in a large region.
Ris�-R-1285(EN) 39

0 100 200 300 400 500 600
0
50
100
150
200
250
�-����4���1�.2
�<��4���1�/2
��?�!�B� �
��?�!�B� �
��?�!�B� �
Figure 21. Power-Current characteristics at di�erent temperatures for the 638 nm
BAL from HPD. Lowering the drive temperature increases the maximum achiev-
able power considerably. A threshold current of 330 mA is observed for all three
temperatures and a maxium power of 210 mW at 550 mA is obtained at T = 21.5oC.
A threshold current around Ith = 330 mA is measured for all temperatures and
at T = 21.5 ÆC and I = 1.8 � Ith (600 mA), a Pmax of 250 mW is achievable.
Although the maximum applicable drive current is 600 mA, only up to 550 mA
('1.7 � Ith) was applied, to ensure that the BAL was not overloaded. These results
are not quite identical to the speci�cations. To obtain the powers speci�ed by HPD,
the temperature had to be lowered from 25ÆC to 21.5ÆC.
As observed in �gure 21, lowering the drive temperature results in a considerable
higher achievable power from the BAL. This gave rise to an examination of the
temperature dependence of the power from the laser. Usually the variation is
around �P ' 1% per 1ÆC (private conversation; based on experience), but this
was certainly not the case with the red BAL. Figure 22 shows the power variation
with temperature at a drive current of 370 mA. A very strong dependence on
temperature is observed in the interval, T = 20ÆC - 23ÆC, where a variation of up
to �P ' 15 % per. 1ÆC is measured. This implies that it is very important to use
a stable and fast responding temperature controller, able to keep the temperature
�xed with a certainty of approximately 0.01ÆC. Such a device was employed, and
in the following a working temperature of 21.5ÆC is applied.
It was tempting to lower the temperature even further and thereby obtain even
higher powers, but no risks were taken regarding the safety of the diode. The time
of delivery of these devices is long and the possibility that the laser would su�er
from some kind of injury prevented me from decreasing the temperature further.
Recording the Far-�eld Distribution Before implementing the BAL in the
FSPCF system, intensity pro�les in the real far-�eld, i.e. at a large distance com-
pared to the Rayleigh range, were measured at di�erent drive currents. This was
performed to be able to place the spatial �lter exactly in the far-�eld plane later
on, by recognizing the shape of the far-�eld distribution (remember, according to
section 3.2.1 that the beam has to be �ltered exactly in the far-�eld plane to obtain
40 Ris�-R-1285(EN)

18 20 22 24 26
0
2
4
6
8
10
12
14
16
18
20
���+���-���1 �2
�<���1�/2
Figure 22. Power variation with temperature at I = 370 mA, for the 638 nm
BAL from HPD. The measurement indicates a strong dependence on temperature,
especially in the interval T = 20oC - 23oC.
the double lobe formation. Furthermore, it is then possible to place the beam ana-
lyzer precisely in the far-�eld plane de�ned by L7 (�gure 18), when diagnosing the
system and following the e�ect of spatial �ltering in real time. The obtained inten-
sity distributions measured at a distance of 1150 mm from the source are shown at
di�erent drive currents in �gure 23. The distributions all have some characteristic
peaks (modes) to search for when localizing the far-�eld planes later on.
-3 -2 -1 0 1 2 3
0
20
40
60
80
100�C���.�'�B!� (
�
"����.�'�B�� (�
")���.�'�B"� (�
�����.�'�B�� (�
.�����13��B2
�<���1.�,B-���2
Figure 23. Intensity distributions in the real far-�eld of the 638 nm BAL. The
intensity pro�les are shown for 1.2Ith, 1.3Ith, 1.4Ith and 1.5Ith respectively. T =
21.5ÆC.
Ris�-R-1285(EN) 41

4.3 Characteristics of the System
In this section, I present the spatial and temporal characteristics of the system. It
is demonstrated that the spatial properties of the laser are signi�cantly improved.
As regards the temporal improvement, the measurements presented here are per-
formed with another diode laser (an 815-nm array). Unfortunately an accident
with the spectrometer, which was damaged in a transporting process, prevented
me from visualizing the spectral �ltering process for the red BAL. However, the
FSPCF system was constructed around an infrared array in the early period of this
work, and these measurements illustrate the principle of longitudinal mode selec-
tion. Finally, the quality of the output beam is estimated, and the �ber coupling
process is evaluated.
4.3.1 Spatial Characteristics
The BAL was implemented in the FSPCF system as described in section 4.1. The
output was very sensitive to the PCF and the spatial �ltering was performed with
great success. In �gures 24 a), b) and c), the intensity distributions in the far-�eld,
are shown for di�erent drive currents (1.3�Ith, 1.4�Ith and 1.7�Ith respectively). Thedashed curves indicate the distribution when PCM and SF are applied, while the
full line curves show the behaviour of the freely running laser.
As observed in the �gure, the double lobe pro�le is maintained even at high drive
currents. In section 3.6 the di�raction limit was found to �diff = 0:43Æ. The
FWHM values are reduced to 0.6Æ, 0.7Æ and 0.8Æ, corresponding to 1.4, 1.6 and
1.8 times the di�raction limit for a), b) and c) respectively. The FWHM values
are 3.3Æ (7.6��diff ), 3.6Æ (8.3��diff ) and 4.1Æ (9.4��diff ) for these drive currents,when the laser runs freely. This again corresponds to the extraction of 87 %, 82 %
and 78 % of the total power emitted from the BAL in one single lobe (the output
lobe).
M2 measurements The quality factor, M2 was evaluated at I = 1:3�Ith = 430
mA for the freely running laser versus when PCF and SF was applied. The results
are shown in �gures 25 a) for the freely running laser and b) when PCF and spatial
�ltering is applied. For the freely running laser, M2 = 6:4 is obtained, while the
value drops to M2 = 4:1, when the laser is exposed to PCF and spatial �ltering.
Though this indicates an improvement, the decrease in M2 value seems unreliably
small, as compared to the improvement in the di�raction limit regime. The �diffmeasurements indicate an improvement of almost a factor 6 (from 7.6 to 1.4 at 430
mA). According to the de�nition of M2 (see section 3.6.2), the measurements were
performed at the, relatively low, 13.5 %-level of the intensity distribution. Looking
at �gure 24, it is observed that at this level both lobes contribute signi�cantly to
the measurement resulting in a rather large beam width. The 13.5 %-widths cor-
responding to the freely running laser as compared to the new system are almost
the same. When employing the de�nition of the di�raction limit, the comparison
relies on the 50 %-level (the FWHM). It is clear from �gure 24 that measurements
at this level will imply a signi�cantly better result. I think one ought to weigthen
the two lobes in an appropriate manner according to their respective contribu-
tions to the intensity in order to get a more reliable M2 value. Weighting the
two lobes in the M2 measurements would probably give a result more comparable
to the di�raction limit measurements. Another solution could be to perform the
M2 measurements at the 50 %-level with subsequent level-corrections. However,
again it is probably a good idea to weigthen the lobes, since at this level there is
absolutely no contribution from the small lobe and the result from such measure-
ments, without weightening, would most likely be too optimistic. This prediction
42 Ris�-R-1285(EN)

was actually veri�ed, though not included in the thesis, in measurements giving a
M2 below 1.
The spatial characteristics of the system are summarized in table 1.
��������1.�,B�-���2
-4 -2 0 2 4
0
20
40
60
80
100 �?�B)��
$/7#�?��B@�3��B�'�B@� (�3���
$/7#�?�"B��3��B�'CB"� (�3���
.�����13������2
�(
-4 -2 0 2 4
0
20
40
60
80
100
$/7#�?��B)�3��B�'�B�� (�3���
$/7#�?��B��3��B�'@B�� (�3���
�?�B"��
,(
��#����3,��>��++���3
-4 -2 0 2 4
0
20
40
60
80
100
$������:-������?�B��
�
$/7#�?��B��3��B�')B�� (�3���
$/7#�?��B��3��B�'�B"� (�3����(
Figure 24. Intensity distributions with (full-line curves) and without (dashed
curves) PCM Feedback in the far-�eld for the 638 nm BAL. Distributions are
shown for a) 1.3 � Ith, b) 1.4 � Ith and c) 1.7 � Ith. The double lobe pro�le is
maintained even at highest drive current.
Ris�-R-1285(EN) 43

Figure 25. M2 measurements at I = 1.3Ith = 430 mA for a) the freely running laser
and b) when PCM feedback and spatial �ltering is applied. The graphs shows the
measured beam diameter as a function of distance from focus. The measurements
are approximated with a straight line, the slope of which, is equivalent to the full
cone angle, �full, as descriped in section 3.6. M2 drops from 6.4 to 4.1 from a) to
b). The beam is focused with a f = 50mm lens, the temperature is T = 21.5 ÆC.
Table 1 IFWHM [deg] Quality [�diff ] M2
I [Ith] PCM No PCM PCM No PCM PCM No PCM
1.3 0.6 3.3 1.4 7.6 4.1 6.4
1.4 0.7 3.6 1.6 8.3 - -
1.7 0.8 4.1 1.8 9.4 - -
Table 1. Summary of the spatial characteristics of the system. The improvement
of the characteristics when phase conjugate feedback (PCM) is applied relative to
when the crystal is blocked is convincing.
44 Ris�-R-1285(EN)

4.3.2 Spectral Characteristics
A solid etalon with a �nesse of F = 14 was employed for the spectral �ltering
process. Unfortunately, as mentioned above, the spectrometer su�ered from severe
damage in a transporting process, such that the spectral �ltering could not be
monitored at the time of the setup of the present system. No changes in the
spatial pro�le was observed when implementing the etalon and it was left out in
the following measurements.
In the early period of this work, the FSPCF scheme was explored experimentally
with another laser source and in this case, the spectrum was evaluated and the
spectral �ltering was successfully performed. The setup is completely analogous to
the setup shown in �gure 7, but the laser is a 815-nm (center wavelength at 25ÆC)
LDA from SDL (appendix A) and the crystal is a photorefractive Rh:BaTiO3
(Rhodium doped) crystal arranged in the self-pumped Cat geometry. The etalon
has a free spectral range of FSR = 0.49 nm, a FWHM bandwidth of 0.19 nm at
814 nm and a �nesse of F = 2.6. In comparison, the distance between adjacent
longitudinal modes in the array is of the order 0.11 nm. The alignment procedure
relies on tilting the etalon, so the maximum transmission of the etalon is tuned
to a frequency matching an array mode with high gain (�gure 13).
As shown in �gure 26, the spectral �ltering was performed with great success and
the spectral bandwidth signi�cantly reduced. The measurements are relative, so
the value of the selected wavelength shown in the upper spectrum is not speci�ed.
It could be tuned over the whole spectrum by slightly tilting the etalon.
/�����#����3,��>
$�������-�����
/�0������ 1��,B -���2
�������
1��,B
-���2
Figure 26. Spectrum from laser diode array. In the upper spectrum the LDA is
exposed to FSPCF at a drive current of 1.6Ith. The lower spectrum shows the
freely running laser at the same drive current.
Even though the spectral �ltering was not veri�ed for the 638 nm BAL system,
there is no reason to believe that implementing the etalon in the external cavity
should cause any problems at all. The frequency selective part of the FSPCF
scheme has been examined for a lot of di�erent high power diode lasers and may
be regarded a standard procedure, [28], [29], [32], [37], [61], [62].
Ris�-R-1285(EN) 45

4.3.3 The Output Beam
The positive angle lobe is extracted from the system by the mirror M in �gure
18.M is placed at an angle of approximately +1.5 Æ with respect to the normal of
the laser end facet, so only the high intensity lobe is extracted. The power-current
characteristics of the laser output was measured, and the result is shown in �gure
27.
��� !�� ��� "�� ��� ���
!�
"�
��
@�
���
�!�
�"�
���
�<���1�/2
�-�����1�.2
� ?������.�
Figure 27. Power-Current characteristics of the output from the laser system. The
threshold current is now lower (315 mA) than for the freely running laser (330
mA - compare with �gure 21).
As observed in the �gure, the threshold current of the output beam is now lower
than for the freely running laser (compare with �gure 21). The freely running laser
has an Ith of 330 mA, while the output of the new system has an Ith of 315 mA.
This lowering of the threshold current is due to the feedback process, which results
in a rise in optical power inside the laser and thereby an earlier/faster lasing action
than for the freely running device.
The full line curves in �gure 28 show the intensity distributions of the (non-
expanded) output in the lateral direction of this enhanced diode laser system.
The distributions are shown at di�erent distances from the focus of a 50 mm
convex lens, temporally placed after M in �gure 18. The output when no PCF is
applied is also shown (dashed curves) and the enhancement is obvious. The spot is
between 4 and 4.5 times more intense when the crystal is not blocked. Note that
the output now has the same, almost single lobed, shape at di�erent distances
along propagation.
Discussion of Output Beam Characteristics There is one conspicuous thing
about the pro�les in �gure 28, though. An extra peak seems to appear in the
distribution. Near the focus it appears like a shoulder on the output lobe and
further away is gets a more peak-like behavior. Looking back, this phenomenon is
also apparent in the double lobe pro�le shown in �gure 24. Perhaps an answer to
this disturbing behavior is found in reference [44]. Here R. Pillai suggests that it is
not possible to extract a single lobe from the BAL, since the closely spaced spatial
modes of a BAL overlap in the far-�eld. A model is evaluated taking into account
that the overlapping modes experience di�erent gains according to the spatial
�ltering process, the addressed mode experiencing the highest gain. It is suggested
46 Ris�-R-1285(EN)

0 400 800 1200 1600
0
20
40
60
80
100
$/7#�?�)@ ��
0 1000 2000 3000
0
20
40
60
80
100
$/7#�? � � ��
0 500 1000 1500 2000
0
20
40
60
80
100
$/7# ��� ����
100
0 400 800 1200 1600
0
20
40
60
80
$/7#�? �����
��������1��,B-���2
����*������1 �2�
��#����3,��>���3��$��++���3
$�������-�����������
�( ,(
�( 3(
Figure 28. Lateral intensity distibution of (non-expanded) output at a) 0 mm, b)
5 mm, c) 15 mm and d) 35 mm from focus (beam focused with f = 50 mm lens).
I = 1.3Ith = 430 mA and T = 21.5ÆC. In the full-line curves PCM and SF is
applied, while the dashed curves represent the freely running laser. The pro�le
now has approximately the same shape at di�erent distances from the focus (like
a Gaussian would have).
that when addressing e.g. mode number 10 with the spatial �lter, then the "single
lobe" selected is really a superposition of the lobes corresponding to modes 9-12
with number 10 experiencing the highest gain. The far-�eld calculated with this
model looks very similar to the far-�elds shown in �gure 24, but the FWHM of the
selected lobe is somewhat wider than the calculated value for the real single-lobe
formation. With this model in mind, it is very likely that the shoulder in �gure
28, derive from one of the nearest neighbors to the mode addressed by the spatial
�lter. The broadening of the �eld due to this mode-superposition model is very
modest.
Yet another explanation could be that the mode selected by the spatial �lter is
not a pure BAL mode, but rather a higher order excited mode due to the external
cavity coupling. Looking at �gure 24, the selected mode, or rather the positive
angle lobe is situated at the "border", and maybe even outside the border, of the
freely running distribution. This suggests that the mode addressed by the spatial
�lter is not a pure BAL mode originally present in the device, but perhaps rather
one of several additional modes, excited by the external feedback process.
Finally, one could imagine that the selected mode is really a superposition of
higher order BAL-modes having di�erent phases. Maybe the asymmetry of the
lobes could then also (in addition to the injection locking view) bee explained by
the damping of one lobe and the ampli�cation of the other lobe, due to phase
Ris�-R-1285(EN) 47

mismatch of the negative angle lobe and phase match of the positive angle lobe
respectively.
All together, the spatial (lateral) mode discrimination does probably not result
in the selection of a single, pure BAL mode.
Quality of output beam A M2 factor of 2.4 was evaluated for the output at I
= 430 mA. The measurements are shown in �gure 29. As expected, the M2 value is
now even lower than measured for the double lobe pro�le. This is consistent with
the fact that the output beam (-lobe) propagates in a more Gaussian manner than
the double lobe pro�le, which indicates that the output experience a high degree
of focusability.
0 20 40 60 80
0
200
400
600
800
1000
&�������������-��1��2
&�������1�2
�
� ��-��4 ��B�D �4 ��B�D
?�CB�����34�& ?�!�! �
# ? & 8" ?�!B"! � � �
� �-��
Figure 29. M2 measurement at I = 1.3Ith= 430 mA and T = 21.5 ÆC for the
output beam. The M2 is now considerably less than for the double lobe pro�le and
for the freely running laser (compare with �gure 25).
4.3.4 Focusing the Output into an Optical Fiber
The �nal step was to focus the output into an optical �ber with a 50 �m core-
diameter (appendix A). As described earlier, a beam expanding system was con-
structed to ensure that the elliptical fashion of the beam (8 � 1 mm2 along the
high and low coherence axis respectively) became as 'circular' as possible, so that
the size of the focused beam could be minimized. The dimensions of the collimated
expanded beam were D � D = 8 � 8 mm2. The theoretically smallest achievable
spot size (full width of I(z) at I = I0
e2) using a Gaussian beam is 4�f/(�D) [60],
which in this case gives 4.1 �m, for � = 638 nm, f = 40 mm and D = 8 mm.
For this laser system a spot size of 18.8 � 25.6 �m2 is obtained and the FWHM
cross-section is 9.6 � 9.0 �m2. Comparison with the Gaussian spot size indicates
that the present system is of high quality, with a close to di�raction limited per-
formance. Figure 30 shows the intensity distributions in the lateral (w) and the
transverse (v) directions of the spot.
The 50 �m �ber was mounted in a single-mode �ber aligner mounted on a
translation stage. The coupling process was performed with great success and up
to 73% of the power measured at L6 (�gure 18) was coupled through the �ber.
48 Ris�-R-1285(EN)

� �� ��� ��� !�� !�� ���
�
!�
"�
��
@�
���
���3��-�0�E
��<������'<(E
C�B��D�E��B) �
��B��D�E�CB� �
��B��D�E��@B@ �
���
&����3��-�0�E
$��������'0(E
C�B��D�E��B� �
��B��D�E�CB� �
��B��D�E���B� �
���
0��������1��,B-���2
����*������1 �2�
<
Figure 30. Spot size of focused output beam. Both the transverse (v - dashed curve)
and the lateral (w - solid curve) cross-section are shown. The spot size is focused
to 9.6�m � 9.0�m at IFWHM and 18.8�m � 25.6�m at I = I0
e2.
Figure 31 shows the power current characteristics of the �ber output when PCF
and spatial �ltering are applied (dots) and when no feedback is applied, i.e. the
crystal is blocked (crosses). As is observed from the �gure, a considerable larger
amount of light is coupled through the �ber, when the phase conjugate feedback
and the spatial �ltering are applied.
0 100 200 300 400 500 600
0
20
40
60
80
100
��#��++���3
��#�,��>�3
�-�����1�.2
�<���1�/2
���
�@
��
�C!
Figure 31. Power-current characteristics of output through �ber. The circles repre-
sent the power measured when PCM feedback is applied, while the crosses represent
the �ber output when the feedback is blocked. The enhancement is obvious.
Table 2 provides an overview of the power extracted from the system, measured
at di�erent positions in the setup at I = 1.3 � Ith.The power measurements are
Ris�-R-1285(EN) 49

performed at di�erent positions marked with the detectors in �gure 32. PBAL is
the power measured from the freely running laser, Peff is the power measured
after L2 in �gure 18 (remember that no etalon is implemented), Pout is the power
measured at M, Pout;eff is measured at L6 and �nally Pfiber is measured at the
output facet of the 50-�m �ber.
��������3����,����������
��*�����,��
��,����3��������
�5.%
����
�-4���
���,��
�-
%�������������
+�����
�-+-��,�
��;����
�,�
Figure 32. Sideview of the setup. Table 2 provides an overview of the powers mea-
sured at di�erent positions in the setup. The detectors depict where the powers are
measured.
Table 2 PBAL Peff Pout Pout;eff Pfiber
I = 1.3 � Ith 93 mW 79 mW 74 mW 67 mW 49 mW
% of PBAL 100 % 85 % 80 % 72 % 53 %
% of Peff - 100 % 94 % 85 % 62 %
% of Pout - - 100 % 91 % 66 %
% of Pout;eff - - - 100 % 73 %
Table 2. Overwiev of the power extracted from the system measured at di�erent
positions in the setup. PBAL is the power measured for the BAL itself, Peff is
measured after the second collimating lens, Pout is measured at M, Pout;eff is
measured at L6 and Pfiber is the power measured at the output facet of the �ber.
50 Ris�-R-1285(EN)

4.3.5 Power Stability of System
The long-term stability of the power from the system was examined through a 20
hours "hands-o�" measurement, where the power was measured every 60 seconds.
The result is shown in �gure 33 a). The long-term stability of the system without
PCF was measured for comparison (�gure 33 b). Through the formula,
s =p� =
vuut 1
N � 1
NXi=1
�Xi �X
�2, (9)
where � is the variance, N is the sample size, Xi is the i'th entrance of the sample
and X is the mean, the standard deviations were calculated to s ' 3 % and s ' 4
% for the system with and without PCF respectively within 20 hours of operation.
The standard error of the mean, SEM , is less than 0.1 % (SEM = spN) in both
cases. The result indicates that the system is stable which is important when
implementing it in a clinical environment. The �gure shows that the system with
PCF (a) is globally more stable than without feedback (b). The local noise,
however, is somewhat larger in the external feedback system than for the freely
running laser. The di�erence in the noise levels, though very small, can perhaps
be attributed to a longitudinal mode partition phenomenon. In the case of the
freely running laser a lot of longitudinal modes, the main mode and a lot of
weaker neighbor modes, oscillate simultaneously. Only the total intensity, not the
single mode, of the laser is stabilized. This leads to a strong cancellation between
the anticorrelated uctuations of the main mode and the additional weak modes
[63], resulting in a low overall noise amplitude. In the external feedback system,
however, fewer longitudinal modes oscillate and the spectrum is narrowed down
due to the PCF (see introduction to section 3.5). Thus, in this case the mode
cancellation is not as pronounced and a larger noise level is observed. Moreover, the
feedback from the PCM may generate external cavity modes that also contributes
to the noise. In ref. [32], M. L�bel exposes an infrared LDA to a PCM (BaTiO3)
and �nds that the PCF indeed leads to an increase in intensity noise and several
characteristic external cavity-resonance peaks are identi�ed in the spectrum. The
external cavity modespacing is found to be on the order of GHz. The phenomenon
of mode partition noise is investigated in e.g. refs. [63], [64] and [65] and is beyond
the scope of this thesis.
0 5 10 15 20
"CB�
"CB�
��B�
��B�
��B�
�( ��#����3,��>��++���3
�����1�-��2
�<���1�/2
� � �� �� !�
C!B�
C!B�
C�B�
C�B�
C"B�
,( %������-���������
�����1�-��2
�<���1�/2
Figure 33. Power stabiltity measurement during 20 hours of "o�-hands" operation
of a) the output from �ber and b) the free-running laser. The standard deviations
are a) 3.3 % and b) 3.6 % respectively. The standard error of the mean is below
0.1 % in both cases. I = 430 mA and T = 21.5 Æ C.
Ris�-R-1285(EN) 51

4.4 Discussion
The poor beam characteristics of the 638-nm broad area laser have been signi�-
cantly improved. From a M2 of 6.4 (7.6 � �diff ) freely running, the BAL is now
running with a M2 of 2.4 (1.4 � �diff ). This improvement made it possible to
couple the output into an optical �ber with great eÆciency. Up to �73 % of the
output from the system was coupled through the 50-�m core-diameter �ber.
However, there is reason to believe that even more optical power can be ex-
tracted from the system. One way to improve the system is to choose better
optics e.g. with anti-re ection coating to minimize the losses due to re ections.
Replacing the collimating lens pair (L1 and L2 in �gure 18) with micro lenses
placed on the output facet of the laser would not only result in a smaller loss, but
also in a considerably reduction of the external cavity length. The technology of
micro optics is in a progressive state, and hopefully collimated diode lasers will
soon be available at a low cost.
Choosing beam expanding lenses with a larger numerical apertures would prob-
ably also make a di�erence, since 10 % is lost at this point. Finally, one could
choose a more suited �ber with better characteristics for the present purpose.
Again, a larger numerical aperture would bee of interest.
52 Ris�-R-1285(EN)

5 Summary and Conclusion
In this �nal chapter I will conclude and summarize on the work described in the
present thesis. Originally this chapter was reserved to the description of clinical
measurements performed with the new diode laser system on tumor-induced animal
models. Unfortunately, the time did not allow for this. However, the measurements
are still planned and they will take place some time in the near future.
One of the main problems in connection with the present work, was to �nd a
company, able to deliver a red diode laser, emitting enough power to be of interest
for the present purpose. Unfortunately a diode laser of the kind implemented in
the commercial system currently in use at Lund University Hospital (see section
2.4.1) has not been obtainable. There is a lot of competition in the area and the
available items are, for the time being, only sold when implemented in expensive
commercial systems. Moreover, the production of high power (watts) laser diodes
at visible wavelengths is very modest, since these lasers often su�er from heat
damage and consequently they have a very limited lifetime. This was also the case
for the system in Lund, see section 2.4.1.
5.1 Improvement of BAL Beam Characteristics
In chapter 4, a new diode laser system for photodynamic therapy was successfully
demonstrated. The beam characteristics of a multi-mode broad area laser were
signi�cantly improved and the output was eÆciently coupled into an optical �ber
with a core-diameter of only 50 �m. The enhanced properties of the new system
are maintained at drive current far above threshold.
At I = 1.3 � Ith approximately 80 % of the optical power from the multi-mode
diode laser was extracted in one single, almost di�raction limited, lobe. It is es-
timated that this number could be increased to around 94 %, if the collimating
lens pair used in this work, is replaced with micro lenses mounted directly on the
output facet of the laser.
62 % of the output power from the collimated laser is extracted through the
optical �ber, a number that may be increased signi�cantly (to around 70-80 %)
with the introduction of a beam expanding system with larger numerical aperture.
Employing a �ber with a larger numerical aperture would probably increase the
�ber output even further. The maximum achieved output power through the �ber
was 98 mW when PCF was applied. With no feedback, this number decreases to
18 mW.
5.2 Adapting the Improved BAL to I-PDT
Unfortunately, the adaptation of the improved diode laser system to the 3/6-�ber
system in Lund is not presented in this thesis. However, this issue will be pursued
in the near future. The output of the improved, expanded system is well collimated
and it has proven to be highly focusable. Thus, I would recommend implying this
diode laser system without �ber in the 3/6-�ber system in Lund. The six 400-�m
core-diameter �bers can now safely be replaced with 50-�m core-diameter �bers,
as desired. The loss at the �rst lens in the 3/6-�ber system will be modest, since
the divergence of the diode laser system output beam is minimal and, as have
been shown, the coupling to the multiple 50-�m �bers will be eÆcient. The losses
in the 3/6 system will be minimal and the power through the individual �bers will
be evenly distributed, as desired (see section 2.5).
Ris�-R-1285(EN) 53

The relatively small numerical aperture (0.25) of the 50-�m �ber results in a
quite diverging (�full = 28 Æ) beam exiting the �ber facet. This is actually desirable
in interstitial PDT, since the light will then disperse in a large angle inside the
tumor, resulting in a more regular distribution of treatment light in the diseased
tissue.
5.3 Future Prospects
The utilization of diode lasers in medicine is in a highly progressive state and
one is o�ered a lot of challenges. Regarding interstitial PDT, the next step is
to adapt the system, developed though this work, to the multiple-�ber system
in Lund. Meanwhile, the search for a red diode laser with more optical power
should continue, and once employed, this diode laser should be implemented in
the FSPCF scheme. Finally the development of a commercial system based on the
FSPCF scheme and the 3/6-�ber system can be accomplished.
Remembering the properties of protoporphyrin IX as both highly uorescent
(diagnostics) and photodynamic active (therapy), an intriguing challenge is wait-
ing. Imagine an instrument for both diagnostics and therapy. This could possibly
be accomplished by frequency doubling of an infrared (810 nm) diode laser. This
source would then emit violet light at 405 nm (matching the Soret band of PpIX)
and implemented in the FSPCF scheme, the beam characteristics could be im-
proved, as described in the present thesis. Infrared LDA's and LDB's are available
at high power (4-5 W and 80-100W respectively) and hopefully a lot of blue/violet
light can be generated in this way. The system should be able to run both in con-
tinuous (for therapy) and pulsed (for diagnostics) mode. The penetration depth
is modest in this wavelength range, but delivering the light interstitial through
multiple optical �bers, this obstacle may be overcome.
54 Ris�-R-1285(EN)

References
[1] I. Wang, N. Bendsoe, C. af Klinteberg, A.M.K. Enejder, S. Andersson-Engels,
S. Svanberg, and K. Svanberg. Photodynamic therapy versus cryosurgery of
basal cell carcinomas; results of a phase III clinical trial. 1999. Manuscript
for Cancer (1999). Paper XI in reference [10].
[2] N. R. Finsen. Phototherapy. Edward Arnold, London, England, 1901.
[3] J. C. Kennedy, R. H. Pottier, and D. C. Pross. Photodynamic therapy with
endogenous protoporphyrin IX: Basic principles and present clinical experi-
ence. J. Photochem. Photobiol., 6:143{148, 1990.
[4] J. C. Kennedy and R. Pottier. Endogenous protoporphyrin IX, a clinically
useful photosensitizer for photodynamic therapy. J. Photochem. Photobiol.,
14:275{292, 1992.
[5] F. Urbach, P.D. Forbes, R.E. Davies, and D. Berger. Cutaneous photobiology:
Past, present and future. J. Invest. Dermatol., 67:209{224, 1976.
[6] T. J. Dougherty, B. W. Henderson, S. Schwartz, J. W. Winkelman, and R. L.
Lipson. Photodynamic Therapy - Historical Perspective. Marcel Dekker, New
York, 1992.
[7] M. D. Daniell and J. S. Hill. A history of photodynamic therapy. Aust. N.
Z. J. Surg., 61:340{348, 1991.
[8] K. Robinson. Photodynamic therapy reaches beyond cancer treatment. Bio-
photonics International, page 42, Jan/Feb 1999.
[9] E. Wachter, C. Seaton, and M. Armas. Two photons take aim at cancer.
Biophotonics International, page 40, July/August 1999.
[10] C. af Klinteberg. On the Use of Light for the Characterization and Treatment
of Malignant Tumours. PhD thesis, Lund University, Department of Physics,
Lund Institute of Technology, 1999.
[11] J. Moan and K. Berg. The photodegradation of porphyrins in cells can be used
to estimate the lifetime of singlet oxygen. Photochem. Photobiol., 53:549{553,
1991.
[12] K. K�onig, H. Schneckenburger, A. R�uck, and R. Steiner. In vivo photoprod-
uct formation during PDT with ALA-induced endogenous porphyrins. J.
Photochem. Photobiol. B, 18:287{290, 1993.
[13] F. Meyer-Betz. Untersuchungen �uber die biologische (photodynamische)
wirkung des h�amatoporphyrins und andere derivate des blut- und gallen-
farbsto�s. Dtsch. Arch. Klin. Med., 112:476{450, 1913.
[14] J.-L. Boulnois. Photophysical processes in recent medical laser developments:
A review. Lasers Med. Sci., 1:47{66, 1986.
[15] I. Wang. Photodynamic Therapy and Laser-Based Diagnostic Studies of Ma-
lignant Tumours. PhD thesis, Lund University, The Jubileum Institute, De-
partment of Oncology, Lund University Hospital, SE-221 85 Lund, Sweden,
1999.
[16] C. af Klinteberg, I. Wang, A. M. K. Enejder, S. Andersson-Engels, S. Svan-
berg, and K. Svanberg. Æ-aminolevulinic acid-induced protoporphyrin IX
uorescence in basal cell carcinomas of the skin. Manuscript in preparation
(paper VI in ref [9]), 1999.
Ris�-R-1285(EN) 55

[17] L. Leibovici, N. I. L. I. Schoenfeld, H. A. Yehoshua, R. Mamet, R. Rakowski,
A. Shindel, and A. Atsmon. Activity of porphobilinogen deaminase in pe-
ripheral blood mononuclear cells of patients with metastatic cancer. Cancer,
62:2297{2300, 1988.
[18] M. Kondo, N. Hirota, T. Takaoka, and M. Kajiwara. Heme-biosynthetic
enzyme activities and porphyrin accumulation in normal liver and hepatoma
cell lines of rat. Cell Biol. Toxicol., 9:95{105, 1993.
[19] H. A. Dailey and A. Smith. Di�erential interaction of porphyrins used in
photoradiation therapy with ferrochelatase. Biochem. J., 223:441{445, 1984.
[20] M. M. H. El-Sharabasy, A. M. El-Waseef, M. M. Hafez, and S. A. Salim.
Porphyrin metabolism in some malignant diseases. Br. J. Cancer, 65:409{
412, 1992.
[21] B. Ehrenberg, G. Jori, and J. Moan, editors. Choice of Proper Wavelength
for Photochemotherapy, volume 2625. Proc. SPIE, 1996.
[22] Q. Peng, T. Warloe, K. Berg, J. Moan, M. Kongshaug, K.-E. Giercksky, and
J. M. Nesland. 5-aminolevulinic acid-based photodynamic therapy: Clinical
research and future challenges. Cancer, 79:2282{2308, 1997.
[23] C. Af Klinteberg, A. M. K. Enejder, I. Wang, S. Andersson-Engels, S. Svan-
berg, and K. Svanberg. Kinetic uorescence studies of Æ-aminolevulinic acid-
induced protoporphyrin IX accumulation in basal cell carcinomas. Manuscript
in preparation. Paper VII in ref [15], 1999.
[24] I. Karu, S. P�alsson, I. Wang, C. af Klinteberg, N. Bendsoe, S. Andersson-
Engels, S. Svanberg, and K. Svanberg. Photodynamic therapy using Æ-
aminolevulinic acid and intensity modulated diode laser light. Submitted
to Lasers Med. Sci.. Paper IX in ref. [10], 1999.
[25] L. O. Svaasand, B. J. Tromberg, P. Wyss, M.-T. Wyss-Desserich, Y. Tadir,
and M. W. Berns. Light and drug distribution with topically administered
photosensitizers. Lasers Med. Sci., 11:261{265, 1996.
[26] N. Ohlsson and O. Rylow. Development of a Multi�bre System for Inter-
stitial Photodynamic Therapy of Malignant Tumours. Master's thesis, Lund
Institute of Technology, Lund Sweden, 1998.
[27] C. af Klinteberg, M. Andreasson, O. Sandstr�om, S. Andersson-Engels, and
S. Svanberg. Compact medical uorosensor for minimally invasive tissue
characterisation. Manuscript in preparation. Paper VI in ref [10], 1999.
[28] Martin L�bel, Paul M. Petersen, and Per M. Johansen. Single-mode operation
of a laser-diode array with frequency-selective phase-conjugate feedback. Opt.
Lett., 23:825, 1998.
[29] Martin L�bel, Paul M. Petersen, and Per M. Johansen. Tunable single-mode
operation of a high-power laser-diode array by use of an external cavity with
a grating and a photorefractive phase-conjugate mirror. J. Opt. Soc. Am. B,
15:2000, 1998.
[30] S. J. F. L. Pedrotti and L. S. Pedrotti. Introduction to Optics. Prentice Hall
PTR, Upper Saddle River, New Jersey, 07458, 2nd edition, 1996.
[31] O. Svelto. Principle of Lasers. Plenum Press, N.Y., USA, third edition, 1989.
ISBN: 0-306-42967-5.
56 Ris�-R-1285(EN)

[32] M. L�bel. Improvement of the Coherence Characteristics of Laser Diode
Arrays Using Photorefractive Phase Conjugation. PhD thesis, Risoe National
Laboratory, 1998.
[33] G. P. Agrawal and N. K. Dutta. Semiconductor Lasers. Van Nostrand Rein-
hold, 2nd edition, 1993.
[34] G. Agrawal. Fast-fourier-transform based beam-propagation model for stripe-
geometry semiconductor lasers. J. Appl. Phys., 56:3100, 1984.
[35] G. Agrawal. E�ect of index antiguiding on the far-�eld distribution of stribe-
geometric lasers. J. Appl. Phys., 47:283, 1983.
[36] A. Jakubowicz. Material and fabrication-related limitations to high-power
operation of GaAs/AlGaAs and InGaAs/AlGaAs laser diodes. Mat. Sci.
Eng. B, 44:359, 1997.
[37] S. J. Jensen. Spatial Structures and Temporal Dynamics in Photorefractive
Nonlinear Systems. PhD thesis, Risoe National Laboratory, 1999.
[38] J. Hendrix, G. Morthier, and R. Baets. In uence of laser parameters and
unpumped regions near the facets on the power level for catastrophic optical
damage in short wavelength lasers. IEE Proc.-Optoelectron., 144:109, 1997.
[39] D. Mehuys, P.J. Lang, M. Mittelstein, J. Salzman, and A. Yariv. Self-
stabilized nonlinear lateral modes of broad area lasers. IEEE J. Quan. Elec.,
23:1909, 1987.
[40] J. K. Butler, D. E. Ackley, and D. Botez. Coupled-mode analysis of phase-
locked injection laser arrays. Appl. Phys. Lett., 44:293, 1984.
[41] E. Kapon, J. Katz, and A. Yariv. Mode analysis of phase-locked arrays of
semiconductor lasers. Opt. Lett., 10:125, 1984.
[42] J. M. Verdiell and R. Frey. A broad-area mode-coupling model for muliple-
stripe semiconductor lasers. IEEE J. Quan. Elec., 26:270, 1990.
[43] E. Acosta, R. Gonzales, and C. Gomez-Reino. Design of an anamorphic
gradient-index lens to correct astigmatism of gaussian laser beams. Opt.
Lett., 16:627, 1991.
[44] R. M. R. Pillai. External Cavity Semiconductor Laser Arrays Insensitive to
Paraxial Alignment. PhD thesis, University of Southern California, 1995.
[45] P. W Milonni and J. H. Eberly. LASERS. John Wiley and Sons, Inc., N.Y.,
USA, 1988. ISBN: 0 471 62731 3.
[46] C. Kittel. Introduction to Solid State Physics. Number ISBN 0-471-87474-4.
Wiley and Sons, sixth edition, 1986.
[47] M. Cronin-Golomb, K. Y. Lau, and A. Yariv. Infrared photorefractive passive
phase conjugation withBaTiO3: Demonstrations with GaAlAs and 1.09-�m
Ar+ lasers. Appl. Phys Lett., 47:567, 1985.
[48] M. Cronin-Golomb and A. Yariv. Self-induced frequency scanning and dis-
tributed bragg re ection in semiconductor lasers with phase-conjugate feed-
back. Opt. Lett., 11:455, 1986.
[49] A. Shiratori and M. Obara. Frequency-stable, narrow-spectral-width oscilla-
tion of an AlGaInP diode laser coupled to a BaTiO3: Co stimulated photore-
fractive backscattering phase conjugator. Appl. Phys. B, 65:329, 1997.
Ris�-R-1285(EN) 57

[50] A. Ashkin, G. D. Boyd, J. M. Dziedzic, R. G. Smith, A. A. Ballman, J. J.
Levinstein, and K. Nassau. Optically-induced refractive index inhomogenities
in LiNbO3 and LiTaO3. Appl. Phys. Lett., 9:72, 1966.
[51] F. S. Chen. Optically induced change of refractive indices in LiNbO3 and
LiTaO3. J. Appl. Phys., 40:3389, 1969.
[52] A. Yariv and P. Yeh. Optical Waves in Crystals. Wiley and Sons, 1984. ISBN:
0-471-09142-1.
[53] P. Yeh. Introduction to Photorefractive Nonlinear Optics. Wiley Series in
Pure and Applied Optics, New York, 1993.
[54] Y. Fainman, E Klancnik, and S. H. Lee. Optimal coherent image ampli�cation
by two-wave coupling in photorefractive BaTiO3. Opt. Eng., 25:228, 1986.
[55] N. Kukhtarev, V. B. Markov, S. G. Odulov, M. S. Soskin, and V. L. Vinetskii.
Holographic storage in electrooptic crystal. i. steady state. Ferroelectrices,
22:949, 1979.
[56] T. J. Hall, R. Jaura, L. M. Connors, and P. D. Foote. The photorefractive
e�ect - a review. Prog. Quant. Electr., 10:77, 1985.
[57] J. Feinberg. Self-pumped, continous-wave phase conjugator using internal
re ections. Opt. Lett., 7:486, 1982.
[58] P. M. Petersen and Torben Skettrup. Uline�r Optik. ISBN 87-502-0756-3.
Polyteknisk forlag, Lyngby, 1994.
[59] R. M. R. Pillai and E. M. Garmire. Paraxial-misalignment insensitive
external-cavity semiconductor-laser array emitting near-di�raction limited
single-lobed beam. IEEE J. Quan. Elec., 32:996, 1996.
[60] D. R. Hall and P. E. Jackson. The Physics and Technology of Laser Res-
onators. IOP Publishing Ltd, 1989.
[61] P. M. Petersen, S. J. Jensen, and P. M. Johansen. Phase locking of laser
diode arrays using a photorefractive Rh:BaTiO3 crystal. Laser Resonators
II, Proceedings of SPIE, 3611:142, 1999.
[62] S. J. Jensen, M. L�bel, and P. M. Petersen. Stability of the single-mode
output of a laser diode array with phase conjugate feedback. Appl. Phys.
Lett., 76(5):535{537, 2000.
[63] T. C. Zhang, J. Ph. Poizat, P. Grelu, J. F. Roch, P. Grangier, F. Marin,
A Bramati, V. Jost, M. D. Levenson, and E. Giacobino. Quantum noise of
free-running and externally-stabilized laser diodes. Quantum Semiclass. Opt.,
7:601, 1995.
[64] F. Marin, A. Bramati, E. Giacobino, T. C. Zhang, J. Ph. Poizat, J. F. Roch,
and P. Grangier. Squeezing and intermode correlations in laser diodes. Phys.
Rev. Lett., 75:3426, 1995.
[65] P. Lodahl. Noise of the frequency doubled diode laser. Master's thesis, Aarhus
University, Institute of Physics and Astronomy, 1997.
[66] D. M. Anderson (Chief Lexicographer), J. Keith, and P D. Novak (Lexicogra-
phers). Dorland's Illustrated Medical Dictionary. W. B. Saunders Company,
Philadelphia, PA, USA., 28th edition, 1997.
58 Ris�-R-1285(EN)

A Components Used in the Ex-perimental Setups
This appendix gives an overwiev of the most relevant components and instruments
used in the experimental setups.
Broad Area Laser GaAlAs BAL. The device is gain-guided in the lateral di-
rection and index-guided in the transverse direction with a 100 �m wide and 1
�m broad emitting junction. The BAL has a threshold current of 330 mA freely
running and a maximum output power of 280 mW at I = 600 mA. The center
wavelength, �0, of the multimode spectrum at 25 oC is 638 nm. Model HPD1302-
TO3-TEC, serial number 15 17206. Manufacturer: High Power Devices, Inc, By,
Stat, USA.
Laser Diode Array GaAlAs ten-stripe proton-implanted gain-guided LDA,
with a 100 �m wide emitting junction. It is temperature controlled with a peltier
element. The array has a threshold of 280 mA and a maximum output power of
0.5 W at 900 mA. The re ectivity of the output facet is approximately Rout =
0.04. The center wavelength, �0 , of the multimode spectrum at 25 ÆC is 815 nm.
The longitudinal mode spacing is 0.11 nm. Model SDL-2432-H1, serial number
AK428. Manufacturer: SDL, San Jose, CA, USA.
Collimation Lens (L1) Focal length of f = 4.5 mm and numerical aperture
N.A = 0.55. Model C230TM-B. Manufacturer: Thorlabs Inc., NJ, USA.
Collimation Lens (L2) Cylindrical lens with focal length f = 40 mm. Manufac-
turer: Linos Photonics Ltd, http://www.linos-photonics.co.uk/en/kontaktfr.htm.
Etalon I (Used in BAL setup) Solid (fused silica) etalon of thikness 150 �m.
Free Spectral Range, FSR = 0.9 nm, FWHM= 0.06 nm and F = 14. Re ectance, R
= 80%. Manufacturer VLOC, Subsidiary of II-VI-incorporated, New Port Richey,
USA.
Etalon II (Used in LDA setup) Etalon with FSR = 225 GHz, FWHM = 0.19
nm and F = 2.6. Standard etalon from a Ti:sapphire ring laser (model: Coherent
899-01).
BaTiO3 (Used in BAL setup) Undoped BaTiO3 crystal. The crystal is 0Æ-cut
and measures 5.41 � 5.35 � 6.98 mm3 (a � a � c).
Rh:BaTiO3 (Used in LDA setup) Rhodium doped BaTiO3 with a 800 ppm
concentration. Manufacturer: Deltronic Crystal, USA.
Fiber 50 mm core diameter multimode glass �ber. Numerical aperture, N.A. =
0.25. Manufacturer: BBT-BL, Benny Larsen, DK (www.dops.dk).
Ris�-R-1285(EN) 59

Diode Laser Driver 2 A Laser Diode Controller - 230 V AC. 0-2 A bipolar
driver current. Resolution optical power (jumper selectable): 0.1 mW / 1.0 mW.
Current accuracy:� 5 mA. Web: http://www.thorlabs.com/thorcat/Lasdiode/laserdiodee.html.
Temperature Controller 2 A Thermo-electric cooler driver - 240 V AC. bipo-
lar � 2 A Output. Maximum output power: 12 W. Resolution of TEC current: 1
mA. Web: http://www.thorlabs.com/thorcat/Lasdiode/laserdiodee.html.
60 Ris�-R-1285(EN)

B Clinical Explanations
This appendix gives an explanation to relevant clinical terms mentioned in the
thesis. The explanations can be found in [66].
Basal Cell Carcinoma (BCC) An epithelial tumor of the skin originating from
neoplastic di�erentiation of basal cells, rarely metastatic but locally invasive and
aggressive; it usually occurs as one or several small, pearly nodules or plaques
having central depressions. It is most often on the face of an older adult, par-
ticularly on a sun-exposed area of a fair-skinned man, and is the most common
form of skin cancer. It has been divided into numerous and variable subtypes on
the basis of clinical and histological characteristics; the more constant subtypes
include nodulo-ulcerative, morphea-like, cystic, and super�cial.
Cryosurgery Destruction of tissue by the application of extreme cold; utilized
in some forms of intracranial and cutaneous surgery.
Paget's disease A neoplasm of the vulva and sometimes the perianal region
histologically and clinically quite similar to Paget's disease of the breast, but
having less of a tendency to be associated with underlying invasive carcinoma.
Pox Any eruptive or pustular disease, especially one caused by a virus (speci�c
entries: chicken pox, cow pox, horse pox, rabbit pox, small pox, etc.).
Rickets (English disease) An interruption in the development and mineraliza-
tion of the growth plate of bone. Clinically, defects manifest as speci�c radio-
graphic abnormalities, osteomalacia, bone pain, fatigability, growth retardation,
and frequently hypotonia, convulsions, and tetany. Biochemical abnormalities in-
clude hypocalcemia, elevated serum alkaline phosphatase, hypophosphatemia, and
decreased intestinal absorption of calcium and phosphorus. The disorder is caused
by a variety of defects in vitamin D, calcium and phosphorus homeostasis, includ-
ing dietary de�ciencies or malabsorption, primary disorder of bone matrix, and
acquired or inherited metabolic and hormonal abnormalities.
Vitiligo A usually progressive, chronic pigmentary anomaly of the skin mani-
fested by depigmented white patches that may be surrounded by a hyperpigmented
border; it is associated with a dominantly inherited predispotion, and it has been
speculated that autoimmune mechanisms are involved in the etiology. E.g. vitilige-
nous skin.
Ris�-R-1285(EN) 61

C Clinical Protocols
This appendix provides an example of the clinical protocols used during PDT treat-
ment and LIF measurements in Lund. The protocols are from an interstitial PDT
session with a tumor induced rat.
Figure 34.
62 Ris�-R-1285(EN)

D Lateral far-�eld of BAL modes
In this appendix, the expression for the di�raction limit, �diff , de�ned in chapter
3 and used in chapter 4 is compensated for. The expression was used to compare
the output from the constructed laser system with the width of the fundamental
BAL mode (m=1) and gives an expression of the quality of the beam.
�diff is de�ned as the FWHM of the fundamental BAL mode (intensity pro�le)
in the far-�eld. Its value is calculated for the unperturbed problem, which provide
a good understanding of the radiation properties and the spatial seperation of BAL
modes in the far-�eld, though it is not a correct solution to the perturbed problem.
The unperturbed case models the problem similar to an eigenvalue problem of an
in�nite square-well potential assuming a uniform refractive index and gain inside
the well. At the boundaries, outside the well, an in�nite absorption with gain
! �1 is assumed, resulting in perfect con�nement of the modes inside the well.
The solution to this problem, i.e. the scalar electrical near-�eld distribution, is
denoted m(x), where x, as usual, denotes the lateral dimension, and is described
by real, sine-like BAL modes [59]:
m(x) =
s1
x0
sin(m�x
2x0
+m�
2)rect(
x
x0
), (D.10)
where x0 is the half-width of the emitting aperture of the BAL, m is the mode
number and the function rect(x/x0) equals unity for j x j� x0 and zero everywhere
else. The far-�eld of the BAL modes may be obtained by the Fourier transform of
the near-�eld, which yields [59]:
FTfm(x)g = m(�)
=
px0
2�[exp(i
(m� 1)�
2) sinc(
m�
2� 2�x
0�
�)
+ exp(i�(m� 1)�
2) sinc(
m�
2+2�x
0�
�)], (D.11)
where � [rad] is the variable radiation angle with respect to the normal of the laser
output facet and � = 2�=k, where k is the free-space wave number, is the lasing
wavelength. Writing the sinc function in terms of the sine, sinc(q) = sin qqgives:
m(�) =
px0
2�[exp(i
(m� 1)�
2)sin[�(m
2� 2x0 �
�)]
�(m2� 2x0 �
�)
+ exp(i�(m� 1)�
2)sin[�(m
2+ 2x0 �
�)]
�(m2+ 2x0 �
�)
. (D.12)
The intensity distribution in the far-�eld is obtained as the absolute square of
this expression, i.e. I(�) =j m(�) j2. The intensity of the fundamental BAL
mode (single lobe) centered around � = 0 is easily evaluated from Eq. (D.12) by
substituting m = 1, � = 0 and then absolute squaring the expression. We get:
Imaxfundamental
= Ifundamental(� = 0) =j m=1(� = 0) j2=jpx0
2�[2 � sin(
�
2)
�
2
] j2= 4x0
�4.
(D.13)
Ris�-R-1285(EN) 63

Expanding j m(�) j2 in terms of trigonometric functions (using the command
TrigExpand in Mathematica) yields:
j m(�) j2= 1
4�2[
8x0�4
�2(4xo� � �)2(4xo� + �)2
+8x
0�4 cos4[�x0�
�]
�2(4xo� � �)2(4xo� + �)2
� 48x0�4 cos2[�x0�
�] sin2[�x0�
�]
�2(4xo� � �)2(4xo� + �)2
+8x
0�4 sin4[�x0�
�]
�2(4xo� � �)2(4xo� + �)2
,(D.14)
which is reduced to:
j m(�) j2=4x
0�4 cos2[�x0�
�]
�4(�4x0� + �)2(4x
0� + �)2
=4x
0�4 cos2[ 2�x0�
�]
�4(256x40�4 � 32x
0�2�2 + �
4). (D.15)
In Eq. (D.13) we found that j m=1(� = 0) j2= 4x0
�4for the fundamental mode,
i.e. for the intensity at half maximum for the fundamental mode, we have:
4x0�4 cos2[ 2�x0�
�]
�4(256x40�4 � 32x
0�2�2 + �
4)=
1
2
4x0
�4)
2�4 cos2[ 2�x0��
]
256x40�4 � 32x
0�2�2 + �
4= 1 )
cos2[2�x
0�
�] = 128(
x0�
�)4 � 16(
x0�
�)2 +
1
2. (D.16)
Substituting t = xo�
�in this equation yields cos2[2�t] = 128t4 � 16t2 + 1
2, which
solved numerically gives t� = 0:297241. The full width of the fundamental mode
(�diff � FWHM) is then given by:
�diff = 2t��
x0
= 4t��
2x0
= 1:189�
2x0
. (D.17)
Equation (D.17) is exactly the expression de�ned in chapter 3 and used in chapter
4 in this thesis 2
64 Ris�-R-1285(EN)

Bibliographic Data Sheet Ris�-R-1285(EN)
Title and author(s)
A New Diode Laser System for Photodynamic Therapy
Eva Sams�e
ISBN
87-550-2921-3 87-550-2922-1 (internet)
ISSN
0106-2840
Dept. or group
Optics and Fluid Dynamics Department
Date
August 2001
Groups own reg. number(s) Project/contract No.
Pages
65
Tables
2
Illustrations
34
References
66
Abstract (Max. 2000 char.)
This master thesis deals with the description and speci�cation of a new diode
laser system for (interstitial) photodynamic therapy. A 638 nm broad area diode
laser is coupled to an external cavity with a self-pumped, phase conjugate, bar-
ium titanate crystal constituting the end mirror of the cavity. The external cavity
includes a spatial �lter and an optional frequency selective element. It is veri�ed
experimentally that the spatial �lter and the phase conjugating mirror cause the
diode laser to exhibit an allmost di�fraction limited output.
The enhanced output from the system is eÆciently coupled into an optical �ber
with a 50 �m core-diameter. It is veri�ed that the developed diode laser system
constitutes a revolutionary alternative to the lasers currently used in photody-
namic therapy and that the system makes practical conduction of interstitial pho-
todynamic therapy possible.
Descriptors
DIODE LASERS; PHOTODYNAMIC THERAPY; PHASE CONJUGATE FEED-
BACK; SINGLE MODE FORMATION
Available on request from:
Information Service Department, Ris� National Laboratory
(Afdelingen for Informationsservice, Forskningscenter Ris�)
P.O. Box 49, DK{4000 Roskilde, Denmark
Phone (+45) 46 77 46 77, ext. 4004/4005 � Fax (+45) 46 77 40 13
E-mail: [email protected]