Kidneyhyper.ahajournals.org/content/hypertensionaha/64/1/111...McQuarrie et al Urinary Sodium and...
28
111 E xperimental and population studies have established dietary sodium intake as a key mediator of blood pres- sure, 1 with sodium reduction demonstrating a fall in systolic blood pressure of 3 to 5 mm Hg. 2,3 The Trial of Hypertension Prevention (TOHP) demonstrated a 25% cardiovascular risk reduction with a low sodium diet. 4 Population extrapolations suggest that salt-related blood pressure elevation accounts for 14% of strokes and 9% of myocardial infarctions. 5 Damaging effects of dietary sodium on end organs have been shown in hypertension, including left ventricular hypertrophy and albu- minuria. 6–8 However, conflicting data exist, with a Cochrane Review finding no definitive evidence that sodium intake directly has an effect on cardiovascular risk. 9 Sodium intake is widely thought to influence the progres- sion of chronic kidney disease (CKD), independently of the effects on blood pressure. 10 Experimental evidence suggests a direct pathogenic role for increased sodium intake in renal failure, 11 and sodium reduction has been shown to reduce pro- teinuria in CKD. 12,13 One Italian study 14 showed patients with low urinary sodium (UNa) excretion to have lower baseline creatinine clearance, but slower long-term progression of CKD. Long-term follow-up from the Ramipril in Nondiabetic Renal Failure (REIN) cohort demonstrated that higher UNa to creatinine ratio (UNa:Cr) was associated with the progression to end-stage renal failure. 15 UNa excretion (mmol/24 hours) is a reliable method of measuring sodium intake, independent of dietary assessment, even in patients with reduced estimated glomerular filtration rate (eGFR), where 90% of ingested sodium is excreted in the urine. 2 UNa mirrors dietary sodium intake in patients with CKD. 16 The kidney adapts to reduced nephron mass by alter- ing sodium handling and increasing fractional excretion of sodium. Because overall GFR declines with falling nephron mass, there is an increase in single nephron GFR, decreased proximal tubular sodium reabsorption, and altered capacity of the distal tubule to reabsorb sodium, 17 increasing fractional excretion of sodium. Therefore, the kidneys maintain sodium homeostasis between intake and excretion. Abstract—Dietary sodium intake is associated with hypertension and cardiovascular risk in the general population. In patients with chronic kidney disease, sodium intake has been associated with progressive renal disease, but not independently of proteinuria. We studied the relationship between urinary sodium (UNa) excretion and UNa to creatinine ratio and mortality or requirement for renal replacement therapy in chronic kidney disease. Adult patients attending a renal clinic who had ≥1 24-hour UNa measurement were identified. Twenty-four-hour UNa measures were collected and UNa to creatinine ratio calculated. Time to renal replacement therapy or death was recorded. Four hundred twenty-three patients were identified with mean estimated glomerular filtration rate of 48 mL/min per 1.73 m 2 . Ninety patients required renal replacement therapy and 102 patients died. Mean slope decline in estimated glomerular filtration rate was −2.8 mL/ min per 1.73 m 2 per year. Median follow-up was 8.5 years. Patients who died or required renal replacement therapy had significantly higher UNa excretion and UNa to creatinine ratio, but the association with these parameters and poor outcome was not independent of renal function, age, and albuminuria. When stratified by albuminuria, UNa to creatinine ratio was a significant cumulative additional risk for mortality, even in patients with low-level albuminuria. There was no association between low UNa and risk, as observed in some studies. This study demonstrates an association between UNa excretion and mortality in chronic kidney disease, with a cumulative relationship between sodium excretion, albuminuria, and reduced survival. These data support reducing dietary sodium intake in chronic kidney disease, but additional study is required to determine the target sodium intake. (Hypertension. 2014;64:111-117.) • Online Data Supplement Key Words: diet ◼ hypertension ◼ mortality ◼ Renal Insufficiency ◼ sodium Received December 27, 2013; first decision January 15, 2014; revision accepted March 18, 2014. From Institute of Cardiovascular and Medical Sciences, University of Glasgow, Glasgow, United Kingdom (E.P.M., A.H.T., E.M.F., A.G.J., P.B.M.); The Glasgow Renal and Transplant Unit, Western Infirmary, Glasgow, United Kingdom (E.P.M., A.H.T., J.G.F., A.G.J., P.B.M.); and Renal Unit, Monklands Hospital, Airdrie, United Kingdom (J.P.T.). The online-only Data Supplement is available with this article at http://hyper.ahajournals.org/lookup/suppl/doi:10.1161/HYPERTENSIONAHA. 113.03093/-/DC1. This paper was sent to David Ellison, Consulting Editor, for review by expert referees, editorial decision, and final disposition. Correspondence to Patrick B. Mark, Institute of Cardiovascular and Medical Sciences, University of Glasgow, Glasgow G12 8TA, United Kingdom. E-mail [email protected] Association Between Urinary Sodium, Creatinine, Albumin, and Long-Term Survival in Chronic Kidney Disease Emily P. McQuarrie, Jamie P. Traynor, Alison H. Taylor, E. Marie Freel, Jonathan G. Fox, Alan G. Jardine, Patrick B. Mark © 2014 American Heart Association, Inc. Hypertension is available at http://hyper.ahajournals.org DOI: 10.1161/HYPERTENSIONAHA.113.03093 Kidney by guest on July 1, 2018 http://hyper.ahajournals.org/ Downloaded from by guest on July 1, 2018 http://hyper.ahajournals.org/ Downloaded from by guest on July 1, 2018 http://hyper.ahajournals.org/ Downloaded from by guest on July 1, 2018 http://hyper.ahajournals.org/ Downloaded from by guest on July 1, 2018 http://hyper.ahajournals.org/ Downloaded from by guest on July 1, 2018 http://hyper.ahajournals.org/ Downloaded from by guest on July 1, 2018 http://hyper.ahajournals.org/ Downloaded from by guest on July 1, 2018 http://hyper.ahajournals.org/ Downloaded from by guest on July 1, 2018 http://hyper.ahajournals.org/ Downloaded from by guest on July 1, 2018 http://hyper.ahajournals.org/ Downloaded from by guest on July 1, 2018 http://hyper.ahajournals.org/ Downloaded from by guest on July 1, 2018 http://hyper.ahajournals.org/ Downloaded from by guest on July 1, 2018 http://hyper.ahajournals.org/ Downloaded from by guest on July 1, 2018 http://hyper.ahajournals.org/ Downloaded from by guest on July 1, 2018 http://hyper.ahajournals.org/ Downloaded from by guest on July 1, 2018 http://hyper.ahajournals.org/ Downloaded from by guest on July 1, 2018 http://hyper.ahajournals.org/ Downloaded from by guest on July 1, 2018 http://hyper.ahajournals.org/ Downloaded from by guest on July 1, 2018 http://hyper.ahajournals.org/ Downloaded from by guest on July 1, 2018 http://hyper.ahajournals.org/ Downloaded from by guest on July 1, 2018 http://hyper.ahajournals.org/ Downloaded from by guest on July 1, 2018 http://hyper.ahajournals.org/ Downloaded from
Transcript of Kidneyhyper.ahajournals.org/content/hypertensionaha/64/1/111...McQuarrie et al Urinary Sodium and...

111
Experimental and population studies have established dietary sodium intake as a key mediator of blood pres-
sure,1 with sodium reduction demonstrating a fall in systolic blood pressure of 3 to 5 mm Hg.2,3 The Trial of Hypertension Prevention (TOHP) demonstrated a 25% cardiovascular risk reduction with a low sodium diet.4 Population extrapolations suggest that salt-related blood pressure elevation accounts for 14% of strokes and 9% of myocardial infarctions.5 Damaging effects of dietary sodium on end organs have been shown in hypertension, including left ventricular hypertrophy and albu-minuria.6–8 However, conflicting data exist, with a Cochrane Review finding no definitive evidence that sodium intake directly has an effect on cardiovascular risk.9
Sodium intake is widely thought to influence the progres-sion of chronic kidney disease (CKD), independently of the effects on blood pressure.10 Experimental evidence suggests a direct pathogenic role for increased sodium intake in renal failure,11 and sodium reduction has been shown to reduce pro-teinuria in CKD.12,13 One Italian study14 showed patients with
low urinary sodium (UNa) excretion to have lower baseline creatinine clearance, but slower long-term progression of CKD. Long-term follow-up from the Ramipril in Nondiabetic Renal Failure (REIN) cohort demonstrated that higher UNa to creatinine ratio (UNa:Cr) was associated with the progression to end-stage renal failure.15
UNa excretion (mmol/24 hours) is a reliable method of measuring sodium intake, independent of dietary assessment, even in patients with reduced estimated glomerular filtration rate (eGFR), where 90% of ingested sodium is excreted in the urine.2 UNa mirrors dietary sodium intake in patients with CKD.16 The kidney adapts to reduced nephron mass by alter-ing sodium handling and increasing fractional excretion of sodium. Because overall GFR declines with falling nephron mass, there is an increase in single nephron GFR, decreased proximal tubular sodium reabsorption, and altered capacity of the distal tubule to reabsorb sodium,17 increasing fractional excretion of sodium. Therefore, the kidneys maintain sodium homeostasis between intake and excretion.
Abstract—Dietary sodium intake is associated with hypertension and cardiovascular risk in the general population. In patients with chronic kidney disease, sodium intake has been associated with progressive renal disease, but not independently of proteinuria. We studied the relationship between urinary sodium (UNa) excretion and UNa to creatinine ratio and mortality or requirement for renal replacement therapy in chronic kidney disease. Adult patients attending a renal clinic who had ≥1 24-hour UNa measurement were identified. Twenty-four-hour UNa measures were collected and UNa to creatinine ratio calculated. Time to renal replacement therapy or death was recorded. Four hundred twenty-three patients were identified with mean estimated glomerular filtration rate of 48 mL/min per 1.73 m2. Ninety patients required renal replacement therapy and 102 patients died. Mean slope decline in estimated glomerular filtration rate was −2.8 mL/min per 1.73 m2 per year. Median follow-up was 8.5 years. Patients who died or required renal replacement therapy had significantly higher UNa excretion and UNa to creatinine ratio, but the association with these parameters and poor outcome was not independent of renal function, age, and albuminuria. When stratified by albuminuria, UNa to creatinine ratio was a significant cumulative additional risk for mortality, even in patients with low-level albuminuria. There was no association between low UNa and risk, as observed in some studies. This study demonstrates an association between UNa excretion and mortality in chronic kidney disease, with a cumulative relationship between sodium excretion, albuminuria, and reduced survival. These data support reducing dietary sodium intake in chronic kidney disease, but additional study is required to determine the target sodium intake. (Hypertension. 2014;64:111-117.) • Online Data Supplement
Key Words: diet ◼ hypertension ◼ mortality ◼ Renal Insufficiency ◼ sodium
Received December 27, 2013; first decision January 15, 2014; revision accepted March 18, 2014.From Institute of Cardiovascular and Medical Sciences, University of Glasgow, Glasgow, United Kingdom (E.P.M., A.H.T., E.M.F., A.G.J., P.B.M.); The
Glasgow Renal and Transplant Unit, Western Infirmary, Glasgow, United Kingdom (E.P.M., A.H.T., J.G.F., A.G.J., P.B.M.); and Renal Unit, Monklands Hospital, Airdrie, United Kingdom (J.P.T.).
The online-only Data Supplement is available with this article at http://hyper.ahajournals.org/lookup/suppl/doi:10.1161/HYPERTENSIONAHA. 113.03093/-/DC1.
This paper was sent to David Ellison, Consulting Editor, for review by expert referees, editorial decision, and final disposition.Correspondence to Patrick B. Mark, Institute of Cardiovascular and Medical Sciences, University of Glasgow, Glasgow G12 8TA, United Kingdom.
E-mail [email protected]
Association Between Urinary Sodium, Creatinine, Albumin, and Long-Term Survival in Chronic Kidney Disease
Emily P. McQuarrie, Jamie P. Traynor, Alison H. Taylor, E. Marie Freel, Jonathan G. Fox, Alan G. Jardine, Patrick B. Mark
© 2014 American Heart Association, Inc.
Hypertension is available at http://hyper.ahajournals.org DOI: 10.1161/HYPERTENSIONAHA.113.03093
Kidney
by guest on July 1, 2018http://hyper.ahajournals.org/
Dow
nloaded from
by guest on July 1, 2018http://hyper.ahajournals.org/
Dow
nloaded from
by guest on July 1, 2018http://hyper.ahajournals.org/
Dow
nloaded from
by guest on July 1, 2018http://hyper.ahajournals.org/
Dow
nloaded from
by guest on July 1, 2018http://hyper.ahajournals.org/
Dow
nloaded from
by guest on July 1, 2018http://hyper.ahajournals.org/
Dow
nloaded from
by guest on July 1, 2018http://hyper.ahajournals.org/
Dow
nloaded from
by guest on July 1, 2018http://hyper.ahajournals.org/
Dow
nloaded from
by guest on July 1, 2018http://hyper.ahajournals.org/
Dow
nloaded from
by guest on July 1, 2018http://hyper.ahajournals.org/
Dow
nloaded from
by guest on July 1, 2018http://hyper.ahajournals.org/
Dow
nloaded from
by guest on July 1, 2018http://hyper.ahajournals.org/
Dow
nloaded from
by guest on July 1, 2018http://hyper.ahajournals.org/
Dow
nloaded from
by guest on July 1, 2018http://hyper.ahajournals.org/
Dow
nloaded from
by guest on July 1, 2018http://hyper.ahajournals.org/
Dow
nloaded from
by guest on July 1, 2018http://hyper.ahajournals.org/
Dow
nloaded from
by guest on July 1, 2018http://hyper.ahajournals.org/
Dow
nloaded from
by guest on July 1, 2018http://hyper.ahajournals.org/
Dow
nloaded from
by guest on July 1, 2018http://hyper.ahajournals.org/
Dow
nloaded from
by guest on July 1, 2018http://hyper.ahajournals.org/
Dow
nloaded from
by guest on July 1, 2018http://hyper.ahajournals.org/
Dow
nloaded from
by guest on July 1, 2018http://hyper.ahajournals.org/
Dow
nloaded from

112 Hypertension July 2014
Measuring urinary creatinine excretion takes account of muscle mass, and calculating UNa:Cr may minimize the inac-curacy associated with 24-hour collections. One caveat is that lower urinary creatinine has been associated with worse outcome.18 In this study, we assessed whether UNa excretion, corrected for urinary creatinine, as a method to maximize the utility of 24-hour urine collection correlates with renal out-come or patient survival in CKD.
PatientsAdult patients attending renal clinics at Glasgow Royal Infirmary between 1992 and 2007 who had ≥1 24-hour UNa measurement were identified using the electronic patient records. Patients were advised to collect urine for 24 hours after the first void. Urinary electrolytes were measured using flame photometry in a standard laboratory. The 24-hour UNa:Cr was calculated as millimoles per millimoles; UNa:Cr has no units. The date of first UNa measurement was deemed the date of study entry. Trained nurses measured blood pres-sure manually 3 times, using standardized sphygmomanom-eters; the mean of the last 2 measurements was recorded. Height and weight were recorded. Baseline drug therapy, eGFR using the 4-variable Modification of Diet in Renal Disease formula, and albuminuria as urinary albumin to creat-inine ratio (uACR) were also recorded. The electronic patient record was updated prospectively. General advice was given regarding reducing sodium intake, but a dietician did not rou-tinely assess the patients. Patients receiving renal replacement therapy (RRT) at the time of measurement, patients without weight recording, and patients without eGFR recording at the time of UNa measurement and ≥1 additional reading were
excluded. Patients with decline in eGFR >10 mL/min per 1.73 m2 per year were excluded to provide a cohort with slowly progressive CKD. The West of Scotland Ethics committee granted a waiver to approve this study as analysis of routinely collected clinical data.
Outcomes and AnalysisDates of starting RRT or death were recorded. Each outcome was analyzed separately and together, censoring for death after starting RRT. Annual decline in eGFR was calculated. Baseline demographics were compared using Student t test, Mann–Whitney U test, χ2 test, or 1-way ANOVA as appro-priate with mean values and standard deviation presented for normally distributed data and median and interquartile range for nonnormally distributed data. Correlations between UNa measures and other factors were ascertained using Spearman or Pearson correlation coefficients. Kaplan–Meier survival analysis was performed for time to RRT or death for patients divided by quartiles of UNa:Cr or stratified by group of UNa:Cr and uACR based on the median value for each, with significance estimated by the log-rank method. Cox survival analysis was performed to determine independent predictors of RRT and death, with variables identified as significantly
Table 1. Baseline Demographics of Cohort
Variable Result (n=488)
Male sex, % 212 (50.1)
Age, y 51.1±16.8
Weight 75.5±18.4
eGFR at baseline (mL/min per 1.73 m2) 48±25
SBP, mm Hg 139±25
DBP, mm Hg 79±13
MAP, mm Hg 99±14
uACR, mg/mmol 11.0 (83)
UNa, mmol/24 h 155.8±66.0
UCr, mmol/24 h 10.1±3.9
UNa:Cr 16.4±5.9
Diuretic therapy, % 106 (25.1)
ACEi, % 105 (24.8)
Deaths, n (%) 102 (24.1)
RRT, n (%) 90 (21.3%)
eGFR loss, mL/min per 1.73 m2 per y −2.8 (4.0)
Mean±SD or median (interquartile range) values or number and percentage of total cohort are displayed. ACEi indicates angiotensin-converting enzyme inhibitor; DBP, diastolic blood pressure; eGFR, estimated glomerular filtration rate; MAP, mean arterial pressure; RRT, renal replacement therapy; SBP, systolic blood pressure; uACR, urinary albumin to creatinine ratio; UCr, 24-h urinary creatinine excretion; UNa, 24-h urinary sodium excretion; and UNa:Cr, urinary sodium to creatinine ratio.
Figure 1. A, Bar chart of mean urinary sodium excretion (mmol/24 h) and 1 SD by chronic kidney disease (CKD) stage; P<0.001 by 1-way ANOVA. B, Bar chart of mean urinary sodium to creatinine ratio (UNa:Cr) and 1 SD by CKD stage; P<0.001 by 1-way ANOVA.
by guest on July 1, 2018http://hyper.ahajournals.org/
Dow
nloaded from

McQuarrie et al Urinary Sodium and Creatinine in Kidney Disease 113
influential on outcome by univariate analysis entered into a backward stepwise regression model.19 Different measures of UNa excretion were entered separately because of collinearity. Data were analyzed using SPSS version 21 (IBM, Armonk, NY), with Kaplan–Meier curves drawn with KMWin20 using R (R Foundation for Statistical Computing, Vienna, Austria).
ResultsBaseline DemographicsTable 1 summarizes baseline demographics for the cohort. Four hundred twenty-three patients were included. Of these, 50.1% were men with mean age of 51.1 (SD, 16.8) years. Figure S1 in the online-only Data Supplement shows the over-all cohort with excluded subjects. Mean baseline eGFR was 48 (SD, 28) mL/min per 1.73 m2. Mean UNa was 155.8 (SD, 66.0) mmol/24 hours, and mean UNa:Cr was 16.4 (SD, 5.9). One hundred fifty-four patients had repeat UNa available. Median time to repeat sampling was 385 (interquartile range, 800) days. Repeat UNa correlated with first UNa (R=0.56; P<0.001) with a difference between mean first and second UNa of 2.0 mmol/24 hours. Average change in UNa was −2.5%. Primary renal disease was specified in 199 (47.0%) patients and was renovascular disease (n=68), diabetic nephropathy (n=39), tubulointerstitial disease/polycystic kidney disease (n=51), glomerulonephritis (n=39), and others (n=8). The remainder was recorded as CKD of unknown cause.
UNa Excretion in Patients With CKDPatients with lower eGFR had lower UNa levels, particularly in CKD stage 5 (Figure 1A), although there were significant differences across all CKD groups (1-way ANOVA; P<0.001). UNa:Cr increased with progressive CKD (Figure 1B). To ascertain the factors correlated with UNa excretion, the fol-lowing factors were entered into a correlation matrix: UNa, UNa:Cr, age, weight, eGFR, blood pressure, and uACR. UNa correlated with higher weight (R=0.37; P<0.001), higher eGFR
(0.206; P=0.001), log10
uACR (−0.15; P=0.003), mean arterial pressure (0.10; P=0.041), but not systolic blood pressure or diastolic blood pressure. UNa was not significantly correlated with age. UNa was higher in men (174 versus 137 mmol/24 hours; P<0.001). UNa was lower in patients prescribed diuret-ics (145 versus 159 mmol/24 hours; P=0.05), but there were no significant differences in UNa between those receiving and those not receiving angiotensin-converting enzyme inhibitors.
UNa:Cr correlated with age (R=0.30; P<0.001), systolic blood pressure (0.22; P<0.001), mean arterial pressure (0.12; P=0.02), lower eGFR (−0.23; P<0.001), and higher log
10
uACR (0.15; P=0.003). There were no significant correlations with diastolic blood pressure or weight. UNa:Cr was higher in women (17.5 versus 15.3; P<0.001) and in patients pre-scribed diuretics (P<0.001) but not angiotensin-converting enzyme inhibitors.
UNa and Albumin ExcretionTo assess the interaction between uACR and UNa:Cr, subjects were divided into groups based on high or low uACR and UNa:Cr, respectively, with subjects allocated to high or low group based on uACR or UNa:Cr being above or below the median value for the cohort. The cut points were 11 mg/mmol and 16.0 for uACR and UNa:Cr, respectively. The 4 groups are shown in Table 2 with significant differences in age, renal func-tion, and blood pressure being demonstrated across the groups.
UNa and Albumin Excretion and Death and Need for RRTNinety patients (21.3%) required RRT and 102 patients died (24.1%) during follow-up. The cause of death was car-diovascular disease (n=25), infection (n=13), malignancy (n=2), known other (n=19), and unknown (n=43). Forty-eight patients died after receiving RRT. One hundred forty-four (34.0%) patients either required RRT or died. Censoring for death or RRT, median follow-up for the cohort was 8.5
Table 2. Demographics of Patients by Stratum of Combined uNA:Cr and uACR
Variable All Patients (N=423)Low UNa:Cr;
Low uACR (N=127)High UNa:Cr;
Low uACR (N=111)Low UNa:Cr;
High uACR (N=80)High UNa:Cr;
High uACR (N=105) P Value
eGFR, mL/min per 1.73 m2 48 (25) 61 (21) 54 (23) 36 (23) 34 (22) <0.001
Age, y 52.1 (16.8) 46.9 (16.5) 52.7 (17.8) 51.9 (14.6) 57.9 (15.8) <0.001
Male sex, n (%) 212 (50.1) 73 (57.5) 42 (37.8) 52 (65.0) 45 (42.9) <0.001
SBP, mm Hg 139 (24) 132 (20) 136 (22) 142 (25) 150 (26) <0.001
MAP, mm Hg 99 (14) 96 (13) 96 (13) 102 (15) 105 (16) <0.001
Log10
uACR 1.14 (0.9) 0.39 (0.40) 0.47 (0.44) 1.99 (0.37) 2.05 (0.43) <0.001
Weight 75.5 (18.4) 75.3 (17.1) 74.2 (20.0) 79.2 (18.4) 74.3 (17.8) 0.23
UNa, mmol/24 h 156 (66) 140 (46) 192 (82) 127 (46) 160 (64) <0.001
UCr, mmol/24 h 10.1 (3.9) 12.0 (3.7) 9.4 (3.6) 10.7 (3.8) 7.9 (3.2) <0.001
Dead, n (% of group) 102 (24.1) 9 (7.1) 24 (21.6) 27 (33.8) 45 (42.9) <0.001
RRT, n (% of group) 90 (21.3) 8 (6.3) 7 (6.3) 28 (35.0) 47 (44.8) <0.001
RRT or dead, n (% of group) 144 (34.0) 14 (11.0) 24 (21.6) 40 (50.0) 66 (62.9) <0.001
Subjects were divided into groups based on high or low uACR and UNa:Cr, respectively, with subjects allocated to high or low group based on uACR or UNa:Cr being above or below median value for the cohort (11 mg/mmol and 16.0 for ACR and UNa:Cr, respectively). Data shown are mean with SD in parentheses for continuous variables and number and percentage of the group for categorical variables. Comparisons are 1-way ANOVA for continuous variables and χ2 for categorical variables. eGFR indicates estimated glomerular filtration rate; MAP, mean arterial pressure; RRT, renal replacement therapy; SBP, systolic blood pressure; uACR, urinary albumin to creatinine ratio; UCr, 24-h urinary creatinine excretion; UNa, 24-h urinary sodium excretion; and UNa:Cr, urinary sodium to creatinine ratio.
by guest on July 1, 2018http://hyper.ahajournals.org/
Dow
nloaded from

114 Hypertension July 2014
(interquartile range, 6.7) years. Mean slope decline in eGFR was −2.8 (4.0) mL/min per 1.73 m2 per year. Characteristics of patients who died or required RRT during follow-up are shown in Table S1. Kaplan–Meier analysis demonstrated that highest UNa or UNa:Cr groups exhibited reduced patient survival and combined patient and renal survival (P<0.001; Figure S2). Higher UNa:Cr was not associated with signifi-cantly reduced time to requirement for RRT (P=0.087). Effect of interaction between uACR and UNa:Cr was tested using the groups in Table 2. Patients with higher UNa:Cr were at greater
risk of both death and requirement for RRT, irrespective of uACR status (Figure 2B). Increased uACR was an additional risk for reduced patient and renal survival (Figure 2). The effect of interaction between UNa:Cr and uACR on survival analysis to death, RRT, or either death or RRT was also per-formed with patients stratified by diuretic use (Figures S3 and S4) or by eGFR >45 or <45 mL/min per 1.73 m2 (Figure S5). To assess the implications of UNa and albuminuria, survival analysis was performed with patients stratified into high and low UNa and albuminuria groups based on median UNa (143 mmol/24 hours) and uACR (11 mg/mmol). In these analyses, patients with lower UNa had relatively improved outcome, with patients in higher albuminuria groups having poorer out-come (Figure S6).
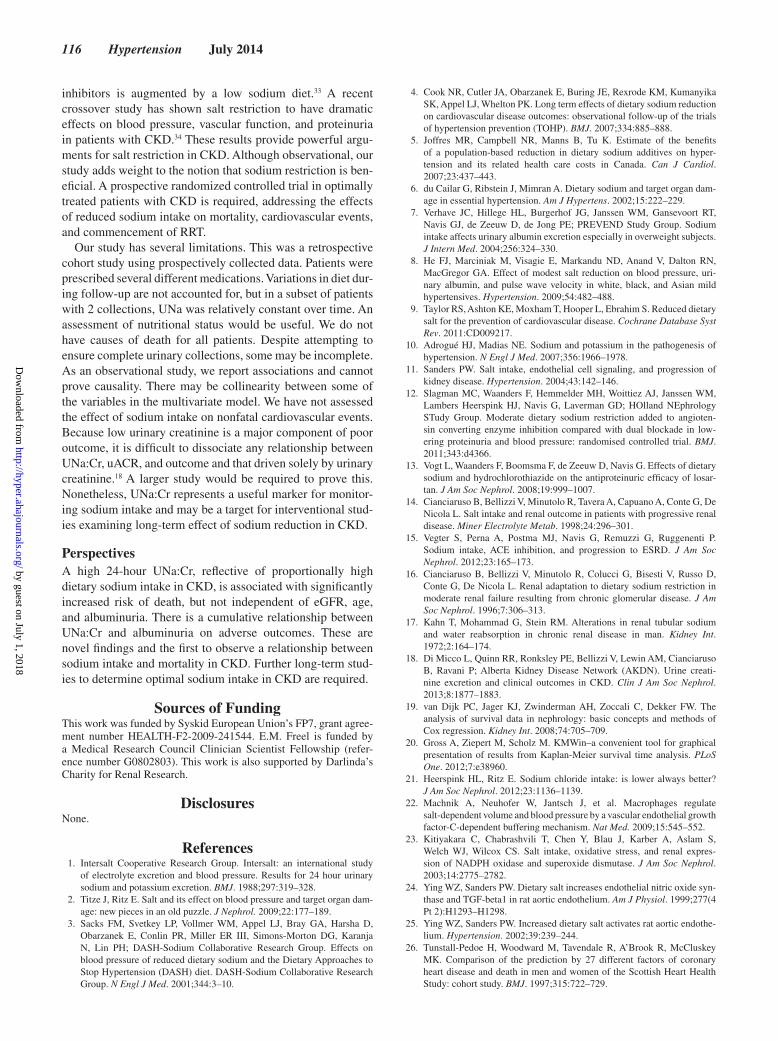
Cox Regression AnalysesCox regression analysis was performed to identify indepen-dent predictors of death, RRT, or RRT or death (Table 3; Tables S2 and S3). Albuminuria, eGFR, and age were inde-pendent predictors of death, whereas UNa:Cr was not an independent predictor of death (P=0.085). Albuminuria and eGFR were predictors of need for RRT, whereas eGFR while diuretic use appeared protective. Albuminuria and age were predictors of the combined outcome of death or RRT. Additional analyses were performed separately for subjects receiving or not receiving diuretic therapy with consistent results irrespective of diuretic status (Tables S4–S9). Figure 3 demonstrates hazard plots for risk of death or RRT stratified by combined UNa:Cr group and albuminuria after adjust-ing for age, sex, eGFR, mean arterial pressure, diuretic, and angiotensin-converting enzyme inhibitor usage. This demon-strates the association between cumulative uACR and UNa:Cr grouping and significantly increased the risk of death or RRT.
DiscussionIn this study, we demonstrate an association between UNa excretion, a marker of dietary sodium intake, and mortality in patients with CKD. However, this relationship did not per-sist after adjusting for age, renal function, blood pressure, and albuminuria. UNa was associated with the risk of requiring RRT, but not independent of albuminuria or baseline eGFR, findings similar to post hoc analyses of the REIN studies.15
The mean sodium excretion in our cohort was equivalent to a dietary salt intake of 9.1 g per day, lower than the United Kingdom average, reflecting the combined effects of dietary advice and malnutrition in CKD.21 We adjusted UNa for urinary creatinine excretion, which corrects for muscle mass, but may also take into account reduced GFR, or reduced tubular secretion of creatinine in CKD. The use of 24-hour UNa:Cr rather than 24-hour UNa may reduce the bias associated with incomplete urine collections, similar to using the uACR to estimate albumin excretion. Because uACR also depends on urinary creatinine, its prognostic role is also determined by low urinary creatinine, which reflects frailty and low muscle mass. Low urinary cre-atinine may also partly explain the prognostic value of UNa:Cr in our study. Twenty-four-hour urine collection remains the best method for assessing sodium excretion, and our UNa:Cr was derived from a 24-hour collection. Spot samples are less rep-resentative because of circadian variation in sodium excretion.
Figure 2. A, Kaplan–Meier survival plot of time to death by group of urinary sodium to creatinine ratio (UNa:Cr) and albuminuria. Kaplan–Meier survival plot of survival to requirement for renal replacement therapy by group of UNa:Cr and albuminuria (1=low UNa:Cr, low urinary albumin to creatinine ratio [uACR]; 2=high UNa:Cr, low uACR; 3=low UNa:Cr, high uACR; 4=high UNa:Cr, high uACR). Comparison by log-rank test and estimate of significance for both A and B; P<0.001.
by guest on July 1, 2018http://hyper.ahajournals.org/
Dow
nloaded from

McQuarrie et al Urinary Sodium and Creatinine in Kidney Disease 115
We observed lower UNa excretion in patients with lower eGFR, perhaps because of reduced dietary intake related to poor appetite. Alternatively, despite increasing fractional sodium excretion, the failing kidneys may be unable to excrete sodium fully. However, even if sodium is stored in nonosmoti-cally active form, as recently proposed,22 the accumulation of vast amounts of sodium over a prolonged period would over-whelm storage sites. Thus, even in advanced CKD, patients are in sodium balance, and UNa reflects dietary intake.
There are multiple mechanisms for sodium-mediated damage. Hemodynamic effects mediated via volume reten-tion include increased shear stress, endothelial dysfunction, elevated cardiac preload, vascular stiffness, and elevated afterload and left ventricular hypertrophy. Nonhemodynamic factors such as oxidative stress via superoxide production23 and inflammation have also been demonstrated.24,25
Damaging effects of dietary sodium intake on end organs have been shown in various populations. A study of normoten-sive and never-treated hypertensives showed that high dietary sodium intake was associated with left ventricular hyper-trophy and albuminuria.6 The Framingham Offspring Study demonstrated increasing UNa to be associated with increasing uACR,7,8 using spot UNa samples normalized to creatinine. Using spot samples could introduce variability because UNa excretion may vary throughout the day. The large Scottish Heart Health Study, drawn from a population similar to ours, showed that UNa predicted coronary heart disease in women.26
Controversy exists regarding the influence of low sodium intake on cardiovascular events in the general population. A large pan-European study in patients without cardiovas-cular disease found low UNa excretion to be associated with increased cardiovascular risk.27 Post hoc analyses of the Ongoing Telmisartan Alone and in Combination with Ramipril Global Endpoint Trial (ONTARGET) and Telmisartan Randomized Assesment Study in ACE Intolerant Subjects with Cardiovascular Disease (TRANSCEND) trials in patients at high cardiovascular risk demonstrated J-shaped relationships between UNa and outcome,28 whereas data from ONTARGET suggest that sodium intake does not per se increase the risk of CKD in diabetes mellitus.29 Therefore, in
non-CKD populations, although reduction in dietary sodium intake may be beneficial, there may be a lower threshold of optimum sodium intake.
In patients with CKD, proteinuria (or albuminuria) is a major predictor of both CKD progression30 and predicts cardio-vascular disease in both CKD and the general population.31,32 In univariate analyses, we demonstrated that increased UNa excretion has cumulative effects with albuminuria on both renal and patient survival in patients with low and high urinary albumin excretion. Lowering dietary sodium intake has been shown to reduce proteinuria, independent of blood pressure.12 The antiproteinuric response to renin–angiotensin system
Table 3. Cox Regression Survival Analyses for End Point of Death (Death as the Dependent Variable; n=102)
Variable
Univariate Multivariate
HR P Value 95% CI HR P Value 95% CI
Age, y 1.049 1.030 1.069 1.048 <0.001 1.030 1.067
Log10
uACR 1.767 <0.001 1.303 2.396 1.726 <0.001 1.281 2.325
eGFR 0.976 0.001 0.962 0.989 0.973 <0.001 0.961 0.986
UNa:Cr 1.034 0.057 0.999 1.071 1.030 0.085 0.996 1.064
MAP 0.993 0.32 0.978 1.007
Diuretic use 1.209 0.42 0.761 1.922
ACEi use 1.155 0.53 0.738 1.806
Female sex 0.879 0.55 0.578 1.337
Data are presented as hazard ratio (HR), 95% confidence interval (CI), and estimate of significance (P ). Variables included in the Cox regression model were age, eGFR, sex, MAP, log
10 uACR, UNa:Cr, ACEi use, and diuretic use. ACEi indicates angiotensin-converting
enzyme inhibitor; eGFR, estimated glomerular filtration rate; log10
ACR, log-transformed urinary albumin to creatinine ratio; MAP, mean arterial pressure; uACR, urinary albumin to creatinine ratio; and UNa:Cr, urinary sodium to creatinine ratio.
Figure 3. Hazard plot of risk of death or renal replacement therapy by combined urinary sodium to creatinine ratio (UNa:Cr) and albuminuria (1=low UNa:Cr, low urinary albumin to creatinine ratio [uACR]; 2=high UNa:Cr, low uACR; 3=low UNa:Cr, high uACR; 4=high UNa:Cr, high uACR) after adjusting for age, sex, estimated glomerular filtration rate (eGFR), proteinuria, mean arterial pressure (MAP), and diuretic or angiotensin-converting enzyme inhibitors (ACEi) usage. Variables included in the Cox regression model were age, eGFR, sex, MAP, log10 uACR, UNa:Cr, ACEi use, and diuretic use.
by guest on July 1, 2018http://hyper.ahajournals.org/
Dow
nloaded from
116 Hypertension July 2014
inhibitors is augmented by a low sodium diet.33 A recent crossover study has shown salt restriction to have dramatic effects on blood pressure, vascular function, and proteinuria in patients with CKD.34 These results provide powerful argu-ments for salt restriction in CKD. Although observational, our study adds weight to the notion that sodium restriction is ben-eficial. A prospective randomized controlled trial in optimally treated patients with CKD is required, addressing the effects of reduced sodium intake on mortality, cardiovascular events, and commencement of RRT.
Our study has several limitations. This was a retrospective cohort study using prospectively collected data. Patients were prescribed several different medications. Variations in diet dur-ing follow-up are not accounted for, but in a subset of patients with 2 collections, UNa was relatively constant over time. An assessment of nutritional status would be useful. We do not have causes of death for all patients. Despite attempting to ensure complete urinary collections, some may be incomplete. As an observational study, we report associations and cannot prove causality. There may be collinearity between some of the variables in the multivariate model. We have not assessed the effect of sodium intake on nonfatal cardiovascular events. Because low urinary creatinine is a major component of poor outcome, it is difficult to dissociate any relationship between UNa:Cr, uACR, and outcome and that driven solely by urinary creatinine.18 A larger study would be required to prove this. Nonetheless, UNa:Cr represents a useful marker for monitor-ing sodium intake and may be a target for interventional stud-ies examining long-term effect of sodium reduction in CKD.
PerspectivesA high 24-hour UNa:Cr, reflective of proportionally high dietary sodium intake in CKD, is associated with significantly increased risk of death, but not independent of eGFR, age, and albuminuria. There is a cumulative relationship between UNa:Cr and albuminuria on adverse outcomes. These are novel findings and the first to observe a relationship between sodium intake and mortality in CKD. Further long-term stud-ies to determine optimal sodium intake in CKD are required.
Sources of FundingThis work was funded by Syskid European Union’s FP7, grant agree-ment number HEALTH-F2-2009-241544. E.M. Freel is funded by a Medical Research Council Clinician Scientist Fellowship (refer-ence number G0802803). This work is also supported by Darlinda’s Charity for Renal Research.
Disclosures None.
References 1. Intersalt Cooperative Research Group. Intersalt: an international study
of electrolyte excretion and blood pressure. Results for 24 hour urinary sodium and potassium excretion. BMJ. 1988;297:319–328.
2. Titze J, Ritz E. Salt and its effect on blood pressure and target organ dam-age: new pieces in an old puzzle. J Nephrol. 2009;22:177–189.
3. Sacks FM, Svetkey LP, Vollmer WM, Appel LJ, Bray GA, Harsha D, Obarzanek E, Conlin PR, Miller ER III, Simons-Morton DG, Karanja N, Lin PH; DASH-Sodium Collaborative Research Group. Effects on blood pressure of reduced dietary sodium and the Dietary Approaches to Stop Hypertension (DASH) diet. DASH-Sodium Collaborative Research Group. N Engl J Med. 2001;344:3–10.
4. Cook NR, Cutler JA, Obarzanek E, Buring JE, Rexrode KM, Kumanyika SK, Appel LJ, Whelton PK. Long term effects of dietary sodium reduction on cardiovascular disease outcomes: observational follow-up of the trials of hypertension prevention (TOHP). BMJ. 2007;334:885–888.
5. Joffres MR, Campbell NR, Manns B, Tu K. Estimate of the benefits of a population-based reduction in dietary sodium additives on hyper-tension and its related health care costs in Canada. Can J Cardiol. 2007;23:437–443.
6. du Cailar G, Ribstein J, Mimran A. Dietary sodium and target organ dam-age in essential hypertension. Am J Hypertens. 2002;15:222–229.
7. Verhave JC, Hillege HL, Burgerhof JG, Janssen WM, Gansevoort RT, Navis GJ, de Zeeuw D, de Jong PE; PREVEND Study Group. Sodium intake affects urinary albumin excretion especially in overweight subjects. J Intern Med. 2004;256:324–330.
8. He FJ, Marciniak M, Visagie E, Markandu ND, Anand V, Dalton RN, MacGregor GA. Effect of modest salt reduction on blood pressure, uri-nary albumin, and pulse wave velocity in white, black, and Asian mild hypertensives. Hypertension. 2009;54:482–488.
9. Taylor RS, Ashton KE, Moxham T, Hooper L, Ebrahim S. Reduced dietary salt for the prevention of cardiovascular disease. Cochrane Database Syst Rev. 2011:CD009217.
10. Adrogué HJ, Madias NE. Sodium and potassium in the pathogenesis of hypertension. N Engl J Med. 2007;356:1966–1978.
11. Sanders PW. Salt intake, endothelial cell signaling, and progression of kidney disease. Hypertension. 2004;43:142–146.
12. Slagman MC, Waanders F, Hemmelder MH, Woittiez AJ, Janssen WM, Lambers Heerspink HJ, Navis G, Laverman GD; HOlland NEphrology STudy Group. Moderate dietary sodium restriction added to angioten-sin converting enzyme inhibition compared with dual blockade in low-ering proteinuria and blood pressure: randomised controlled trial. BMJ. 2011;343:d4366.
13. Vogt L, Waanders F, Boomsma F, de Zeeuw D, Navis G. Effects of dietary sodium and hydrochlorothiazide on the antiproteinuric efficacy of losar-tan. J Am Soc Nephrol. 2008;19:999–1007.
14. Cianciaruso B, Bellizzi V, Minutolo R, Tavera A, Capuano A, Conte G, De Nicola L. Salt intake and renal outcome in patients with progressive renal disease. Miner Electrolyte Metab. 1998;24:296–301.
15. Vegter S, Perna A, Postma MJ, Navis G, Remuzzi G, Ruggenenti P. Sodium intake, ACE inhibition, and progression to ESRD. J Am Soc Nephrol. 2012;23:165–173.
16. Cianciaruso B, Bellizzi V, Minutolo R, Colucci G, Bisesti V, Russo D, Conte G, De Nicola L. Renal adaptation to dietary sodium restriction in moderate renal failure resulting from chronic glomerular disease. J Am Soc Nephrol. 1996;7:306–313.
17. Kahn T, Mohammad G, Stein RM. Alterations in renal tubular sodium and water reabsorption in chronic renal disease in man. Kidney Int. 1972;2:164–174.
18. Di Micco L, Quinn RR, Ronksley PE, Bellizzi V, Lewin AM, Cianciaruso B, Ravani P; Alberta Kidney Disease Network (AKDN). Urine creati-nine excretion and clinical outcomes in CKD. Clin J Am Soc Nephrol. 2013;8:1877–1883.
19. van Dijk PC, Jager KJ, Zwinderman AH, Zoccali C, Dekker FW. The analysis of survival data in nephrology: basic concepts and methods of Cox regression. Kidney Int. 2008;74:705–709.
20. Gross A, Ziepert M, Scholz M. KMWin–a convenient tool for graphical presentation of results from Kaplan-Meier survival time analysis. PLoS One. 2012;7:e38960.
21. Heerspink HL, Ritz E. Sodium chloride intake: is lower always better? J Am Soc Nephrol. 2012;23:1136–1139.
22. Machnik A, Neuhofer W, Jantsch J, et al. Macrophages regulate salt-dependent volume and blood pressure by a vascular endothelial growth factor-C-dependent buffering mechanism. Nat Med. 2009;15:545–552.
23. Kitiyakara C, Chabrashvili T, Chen Y, Blau J, Karber A, Aslam S, Welch WJ, Wilcox CS. Salt intake, oxidative stress, and renal expres-sion of NADPH oxidase and superoxide dismutase. J Am Soc Nephrol. 2003;14:2775–2782.
24. Ying WZ, Sanders PW. Dietary salt increases endothelial nitric oxide syn-thase and TGF-beta1 in rat aortic endothelium. Am J Physiol. 1999;277(4 Pt 2):H1293–H1298.
25. Ying WZ, Sanders PW. Increased dietary salt activates rat aortic endothe-lium. Hypertension. 2002;39:239–244.
26. Tunstall-Pedoe H, Woodward M, Tavendale R, A’Brook R, McCluskey MK. Comparison of the prediction by 27 different factors of coronary heart disease and death in men and women of the Scottish Heart Health Study: cohort study. BMJ. 1997;315:722–729.
by guest on July 1, 2018http://hyper.ahajournals.org/
Dow
nloaded from

McQuarrie et al Urinary Sodium and Creatinine in Kidney Disease 117
27. Stolarz-Skrzypek K, Kuznetsova T, Thijs L, Tikhonoff V, Seidlerová J, Richart T, Jin Y, Olszanecka A, Malyutina S, Casiglia E, Filipovský J, Kawecka-Jaszcz K, Nikitin Y, Staessen JA; European Project on Genes in Hypertension (EPOGH) Investigators. Fatal and nonfatal outcomes, inci-dence of hypertension, and blood pressure changes in relation to urinary sodium excretion. JAMA. 2011;305:1777–1785.
28. O’Donnell MJ, Yusuf S, Mente A, Gao P, Mann JF, Teo K, McQueen M, Sleight P, Sharma AM, Dans A, Probstfield J, Schmieder RE. Urinary sodium and potassium excretion and risk of cardiovascular events. JAMA. 2011;306:2229–2238.
29. Dunkler D, Dehghan M, Teo KK, Heinze G, Gao P, Kohl M, Clase CM, Mann JF, Yusuf S, Oberbauer R; ONTARGET Investigators. Diet and kid-ney disease in high-risk individuals with type 2 diabetes mellitus. JAMA Intern Med. 2013;173:1682–1692.
30. Nitsch D, Grams M, Sang Y, Black C, Cirillo M, Djurdjev O, Iseki K, Jassal SK, Kimm H, Kronenberg F, Oien CM, Levey AS, Levin A, Woodward M, Hemmelgarn BR; Chronic Kidney Disease Prognosis
Consortium. Associations of estimated glomerular filtration rate and albu-minuria with mortality and renal failure by sex: a meta-analysis. BMJ. 2013;346:f324.
31. Smink PA, Lambers Heerspink HJ, Gansevoort RT, de Jong PE, Hillege HL, Bakker SJ, de Zeeuw D. Albuminuria, estimated GFR, traditional risk factors, and incident cardiovascular disease: the PREVEND (Prevention of Renal and Vascular Endstage Disease) study. Am J Kidney Dis. 2012;60:804–811.
32. Fox CS, Matsushita K, Woodward M, et al; Chronic Kidney Disease Prognosis Consortium. Associations of kidney disease measures with mortality and end-stage renal disease in individuals with and without dia-betes: a meta-analysis. Lancet. 2012;380:1662–1673.
33. Esnault VL, Ekhlas A, Delcroix C, Moutel MG, Nguyen JM. Diuretic and enhanced sodium restriction results in improved antiproteinuric response to RAS blocking agents. J Am Soc Nephrol. 2005;16:474–481.
34. McMahon EJ, Bauer JD, Hawley CM, Isbel NM, Stowasser M, Johnson DW, Campbell KL. A randomized trial of dietary sodium restriction in CKD. J Am Soc Nephrol. 2013;24:2096–2103.
What Is New?•Urinary sodium (UNa) to creatinine ratio is higher with increasing severity
of chronic kidney disease (CKD).•High UNa intake reflected by a high UNa or high UNa to creatinine ratio
is associated with reduced survival in patients with CKD irrespective of albuminuria status.
•Association between high UNa or high UNa to creatinine ratio and in-creased need for renal replacement therapy is not independent of base-line renal function or albuminuria.
What Is Relevant?•These data support the notion of reducing dietary sodium intake in pa-
tients with CKD.
•The major benefit of sodium reduction is likely to be on patient survival and not on progression of renal disease.
• Further study is required to inform target levels of sodium intake in pa-tients with CKD.
SummaryWe have demonstrated an association between UNa excretion and mortality in CKD and a cumulative relationship between sodium excretion, albuminuria, and reduced survival.
Novelty and Significance
by guest on July 1, 2018http://hyper.ahajournals.org/
Dow
nloaded from

G. Jardine and Patrick B. MarkEmily P. McQuarrie, Jamie P. Traynor, Alison H. Taylor, E. Marie Freel, Jonathan G. Fox, Alan
Chronic Kidney DiseaseAssociation Between Urinary Sodium, Creatinine, Albumin, and Long-Term Survival in
Print ISSN: 0194-911X. Online ISSN: 1524-4563 Copyright © 2014 American Heart Association, Inc. All rights reserved.
is published by the American Heart Association, 7272 Greenville Avenue, Dallas, TX 75231Hypertension doi: 10.1161/HYPERTENSIONAHA.113.030932014;64:111-117; originally published online April 14, 2014;Hypertension.
http://hyper.ahajournals.org/content/64/1/111World Wide Web at:
The online version of this article, along with updated information and services, is located on the
http://hyper.ahajournals.org/content/suppl/2014/04/14/HYPERTENSIONAHA.113.03093.DC1Data Supplement (unedited) at:
http://hyper.ahajournals.org//subscriptions/
is online at: Hypertension Information about subscribing to Subscriptions:
http://www.lww.com/reprints Information about reprints can be found online at: Reprints:
document. Permissions and Rights Question and Answer this process is available in the
click Request Permissions in the middle column of the Web page under Services. Further information aboutOffice. Once the online version of the published article for which permission is being requested is located,
can be obtained via RightsLink, a service of the Copyright Clearance Center, not the EditorialHypertensionin Requests for permissions to reproduce figures, tables, or portions of articles originally publishedPermissions:
by guest on July 1, 2018http://hyper.ahajournals.org/
Dow
nloaded from

1
Association between urinary sodium, creatinine, albumin and long term
survival in chronic kidney disease
Emily P. McQuarrie, Jamie P. Traynor, Alison H. Taylor, E. Marie Freel,
Jonathan G. Fox, Alan G. Jardine, Patrick B. Mark
From Institute of Cardiovascular and Medical Sciences, University of Glasgow
(E.P.M, A.H.T., E.M.F., A.G.J, P.B.M), Renal Unit, Monklands Hospital, Airdrie
(J.P.T), The Glasgow Renal & Transplant Unit, Western Infirmary, Glasgow
(J.G.F)
Short title: Urinary sodium and creatinine in kidney disease
Correspondence:
Dr Patrick B Mark
Institute of Cardiovascular and Medical Sciences
University of Glasgow
Glasgow G12 8TA
Tel: +44 141 330 8218
Fax: +44 141 330 6972
Email: [email protected]

2
Variable Alive at end of
follow up N=321
Died during
follow up N=102
p No RRT during follow
up=333
RRT during
follow up N=90
p
eGFR (ml/min/1.73m2) 54 (24) 27 (17) <0.001 55 (22) 19 (18) <0.001
Age (years) 48.4 (16.4) 63.8 (12.0) <0.001 50.5 (17.3) 57.9 (13.3) <0.001
N male (%) 159 (49.5) 53 (52.0) 0.669 163 (48.9) 49 (54.4) 0.355
SBP (mmHg) 136 (21) 152 (28) <0.001 137 (23) 149 (26) <0.001
MAP (mmHg) 98 (14) 103 (16) 0.009 98 (14) 103 (16) 0.009
Log10uACR 0.94 (0.8) 1.74 (0.8) <0.001 0.91 (0.8) 1.94 (0.6) <0.001
Weight (kg) 76.0 (18.8) 73.9 (16.8) 0.325 76.2 (19.0) 73.0 (15.8) 0.153
UNa (mmol/24h) 162 (68) 136 (56) <0.001 162 (69) 134 (48) <0.001
UCr (mmol/24h) 10.8 (3.9) 7.7 (2.8) <0.001 10.6 (3.9) 8.1 (3.1) <0.001
Na:Cr 15.7 (5.4) 18.8 (6.7) <0.001 16.0 (5.6) 17.7 (6.6) 0.015
Table S1: Comparison between patients who died or commenced RRT during
follow up and those who did not. Data shown are mean with standard
deviation in parentheses for continuous variables and number and percentage
of the group for categorical variable. Comparisons are t-test for continuous
variables and Chi square for categorical variables. RRT = renal replacement
therapy; eGFR = estimated glomerular filtration rate; SBP = systolic blood
pressure; MAP =mean arterial pressure; uACR = urinary albumin to creatinine
ratio; log10uACR = log transformed uACR; UNa = 24h urinary sodium
excretion; UCr = 24h urinary creatinine excretion; UNa:Cr = urinary sodium to
creatinine ratio

3
RRT as dependent variable (n=90)
Variable Univariate Multivariate
HR p-value 95% Confidence interval HR p-value 95% Confidence interval
eGFR 0.899 <0.001 0.880 0.918 1.048 <0.001 1.030 1.067
log10 uACR 2.357 <0.001 1.592 3.488 1.726 <0.001 1.281 2.325
Diuretic use 0.651 0.085 0.399 1.061 0.619 0.037 0.394 0.971
Gender(female) 0.736 0.16 0.478 1.132
ACEi use 0.755 0.23 0.475 1.199
Age 0.994 0.48 0.976 1.011
UNa:Cr 4.365 0.49 0.997 1.006
MAP 0.997 0.66 0.982 1.011
Table S2: Cox regression survival analyses for end point of renal replacement therapy. Data presented as hazard ratio (HR), 95%
confidence interval (95% CI) and estimate of significance (p). eGFR = estimated glomerular filtration rate; log10uACR = log
transformed urinary albumin:creatinine ratio; age in years; MAP = mean arterial pressure; UNa:Cr = urinary sodium:creatinine ratio;
ACEi = angiotensin converting enzyme inhibitor (0=yes). Variables included in the Cox regression model were age, eGFR, gender,
mean arterial pressure, log10uACR, UNa:Cr, ACEi use, diuretic use.

4
Death or RRT as dependent variable (n=138)
Variable Univariate Multivariate
HR p-value 95% Confidence interval HR p-value 95% Confidence interval
eGFR 0.935 <0.001 0.922 0.949 0.936 <0.001 0.924 0.949
log10 uACR 1.787 <0.001 1.380 2.314 1.812 <0.001 1.417 2.318
Age 1.019 0.016 1.003 1.034 1.022 0.002 1.008 1.037
Na:Cr 1.021 0.16 0.992 1.052
Gender (female) 0.831 0.30 0.587 1.176
MAP 1.003 0.68 0.990 1.015
ACEi use 1.065 0.74 0.734 1.546
Diuretic use 0.991 0.96 0.675 1.457
Table S3: Cox regression survival analyses for combined end point of death and renal replacement therapy as dependent variable.
Data presented as hazard ratio (HR), 95% confidence interval (95% CI) and estimate of significance (p). eGFR = estimated
glomerular filtration rate; log10uACR = log transformed urinary albumin:creatinine ratio; age in years; MAP = mean arterial pressure;
UNa:Cr = urinary sodium:creatinine ratio; ACEi = angiotensin converting enzyme inhibitor (0=yes). Variables included in the Cox
regression model were age, eGFR, gender, mean arterial pressure, log10uACR, UNa:Cr, ACEi use, diuretic use.

5
Death as dependent variable in patients treated with diuretics (n=106)
Variable Univariate Multivariate
HR p-value 95% Confidence interval HR p-value 95% Confidence interval
Age 1.048 0.004 1.015 1.081 1.050 0.002 1.019 1.083
log10 uACR 1.591 0.045 1.010 2.507 1.723 0.003 1.197 2.479
Na:Cr 1.041 0.119 0.990 1.094
MAP 0.984 0.122 0.964 1.004
eGFR 0.985 0.208 0.962 1.008
Gender (female) 0.817 0.512 0.446 1.495
ACEi use 1.073 0.822 0.579 1.988
Table S4: Cox regression survival analyses for end point of death for patients receiving diuretic therapy. Data presented as hazard
ratio (HR), 95% confidence interval (95% CI) and estimate of significance (p). eGFR = estimated glomerular filtration rate;
log10uACR = log transformed urinary albumin:creatinine ratio; age in years; MAP = mean arterial pressure; UNa:Cr = urinary
sodium:creatinine ratio; ACEi = angiotensin converting enzyme inhibitor (0=yes). Variables included in the Cox regression model
were age, eGFR, gender, mean arterial pressure, log10uACR, UNa:Cr, ACEi use.

6
Death as dependent variable in patients not treated with diuretics (total cohort n=317)
Variable Univariate Multivariate
HR p-value 95% Confidence interval HR p-value 95% Confidence interval
Age 1.047 <0.001 1.023 1.071 1.051 <0.001 1.029 1.074
eGFR 0.972 0.001 0.956 0.989 0.973 0.002 0.956 0.990
log10 uACR 2.051 0.001 1.342 3.133 2.101 0.001 1.381 3.197
Na:Cr 1.036 0.189 0.983 1.091
Gender (female) 0.858 0.610 0.476 1.546
MAP 1.002 0.869 0.980 1.024
ACEi use 1.059 0.871 0.528 2.124
Table S5: Cox regression survival analyses for end point of death for patients not receiving diuretic therapy. Data presented as
hazard ratio (HR), 95% confidence interval (95% CI) and estimate of significance (p). eGFR = estimated glomerular filtration rate;
log10uACR = log transformed urinary albumin:creatinine ratio; age in years; MAP = mean arterial pressure; UNa:Cr = urinary
sodium:creatinine ratio; ACEi = angiotensin converting enzyme inhibitor (0=yes). Variables included in the Cox regression model
were age, eGFR, gender, mean arterial pressure, log10uACR, UNa:Cr, ACEi use.

7
RRT as dependent variable in patients treated with diuretics (total cohort n=106)
Variable Univariate Multivariate
HR p-value 95% Confidence interval HR p-value 95% Confidence interval
eGFR 0.880 <0.001 0.836 0.925 0.877 <0.001 0.835 0.921
Age 0.966 0.038 0.934 0.998 0.967 0.032 0.938 0.997
Na:Cr 1.059 0.033 1.005 1.116 1.047 0.057 0.999 1.098
Gender (female) 0.568 0.087 0.298 1.084
log10 uACR 1.736 0.098 0.903 3.338
MAP 0.990 0.318 0.970 1.010
ACEi use 0.859 0.692 0.405 1.821
Table S6: Cox regression survival analyses for end point of requirement for renal replacement therapy for patients receiving
diuretic therapy. Data presented as hazard ratio (HR), 95% confidence interval (95% CI) and estimate of significance (p). eGFR =
estimated glomerular filtration rate; log10uACR = log transformed urinary albumin:creatinine ratio; age in years; MAP = mean
arterial pressure; UNa:Cr = urinary sodium:creatinine ratio; ACEi = angiotensin converting enzyme inhibitor (0=yes). Variables
included in the Cox regression model were age, eGFR, gender, mean arterial pressure, log10uACR, UNa:Cr, ACEi use.

8
RRT as dependent variable in patients not treated with diuretics (total cohort n=317)
Variable Univariate Multivariate
HR p-value 95% Confidence interval HR p-value 95% Confidence interval
eGFR 0.896 <0.001 0.873 0.921 0.900 <0.001 0.878 0.923
log10 uACR 2.439 <0.001 1.477 4.028 2.462 <0.001 1.532 3.958
ACEi use 1.430 0.282 0.745 2.745
Na:Cr 0.973 0.348 0.920 1.030
Age 1.007 0.516 0.985 1.029
Gender (female) 0.873 0.668 0.470 1.622
MAP 1.003 0.823 0.980 1.025
Table S7: Cox regression survival analyses for end point of requirement for renal replacement therapy for patients not receiving
diuretic therapy. Data presented as hazard ratio (HR), 95% confidence interval (95% CI) and estimate of significance (p). eGFR =
estimated glomerular filtration rate; log10uACR = log transformed urinary albumin:creatinine ratio; age in years; MAP = mean
arterial pressure; UNa:Cr = urinary sodium:creatinine ratio; ACEi = angiotensin converting enzyme inhibitor (0=yes). Variables
included in the Cox regression model were age, eGFR, gender, mean arterial pressure, log10uACR, UNa:Cr, ACEi use.

9
Death or RRT as dependent variable in patients treated with diuretics (total cohort n=106)
Variable Univariate Multivariate
HR p-value 95% Confidence interval HR p-value 95% Confidence interval
eGFR 0.938 <0.001 0.914 0.963 0.939 <0.001 0.917 0.962
log10 uACR 1.553 0.031 1.042 2.316 1.561 0.016 1.088 2.238
Na:Cr 1.029 0.182 0.987 1.074
Age 1.017 0.244 0.989 1.046
Gender (female) 0.868 0.587 0.521 1.447
MAP 0.998 0.824 0.981 1.016
ACEi use 0.971 0.917 0.563 1.676
Table S8: Cox regression survival analyses for combined end point of death and renal replacement therapy as dependent variable
for patients receiving diuretic therapy. Data presented as hazard ratio (HR), 95% confidence interval (95% CI) and estimate of
significance (p). eGFR = estimated glomerular filtration rate; log10uACR = log transformed urinary albumin:creatinine ratio; age in
years; MAP = mean arterial pressure; UNa:Cr = urinary sodium:creatinine ratio; ACEi = angiotensin converting enzyme inhibitor
(0=yes). Variables included in the Cox regression model were age, eGFR, gender, mean arterial pressure, log10uACR, UNa:Cr,
ACEi use.
10
Death or RRT as dependent variable in patients not treated with diuretics (total cohort n=317)
Variable Univariate Multivariate
HR p-value 95% Confidence interval HR p-value 95% Confidence interval
eGFR 0.934 <0.001 0.918 0.950 .934 <0.001 0.918 0.951
log10 uACR 1.981 <0.001 1.398 2.807 1.999 <0.001 1.419 2.816
Age 1.019 0.043 1.001 1.038 1.023 0.008 1.006 1.041
MAP 1.011 0.249 0.992 1.030
Gender (female) 0.752 0.252 0.462 1.225
Na:Cr 1.016 0.464 0.974 1.060
ACEi use 1.036 0.898 0.603 1.780
Table S9: Cox regression survival analyses for combined end point of death and renal replacement therapy as dependent variable
for patients not receiving diuretic therapy. Data presented as hazard ratio (HR), 95% confidence interval (95% CI) and estimate of
significance (p). eGFR = estimated glomerular filtration rate; log10uACR = log transformed urinary albumin:creatinine ratio; age in
years; MAP = mean arterial pressure; UNa:Cr = urinary sodium:creatinine ratio; ACEi = angiotensin converting enzyme inhibitor
(0=yes). Variables included in the Cox regression model were age, eGFR, gender, mean arterial pressure, log10uACR, UNa:Cr,
ACEi use.

11
Figure S1
Recruitment of cases from the electronic patient record showing excluded
subjects

12
A
B
Figure S2 (a) Kaplan-Meier survival plot of time to death by quartile of UNa:Cr
(1 = lowest, 4 = highest). Comparison by log rank test and estimate of
significance, p<0.001 (b) Kaplan-Meier survival plot of time to death or RRT
by quartile of UNa:Cr (1 = lowest, 4 = highest) . Comparison by log rank test
and estimate of significance p<0.001.

13
S3(a)
3(b)
3(c)

14
Figure S3 (a) Patients receiving diuretic therapy. Kaplan-Meier survival plot of
time to death by quartile of UNa:Cr (1 = lowest, 4 = highest). Comparison by
log rank test and estimate of significance, p=0.019 (b) Patients receiving
diuretic therapy. Kaplan-Meier survival plot of time to requirement for renal
replacement therapy by quartile of UNa:Cr (1 = lowest, 4 = highest).
Comparison by log rank test and estimate of significance, p<0.001 (c)
Patients receiving diuretic therapy. Kaplan-Meier survival plot of time to death
or requirement for renal replacement therapy by quartile of UNa:Cr (1 =
lowest, 4 = highest). Comparison by log rank test and estimate of significance,
p<0.001

15
S4 (a)
4(b)
4(c)

16
Figure S4 (a) Patients not receiving diuretic therapy. Kaplan-Meier survival
plot of time to death by quartile of UNa:Cr (1 = lowest, 4 = highest).
Comparison by log rank test and estimate of significance, p<0.001 (b)
Patients not receiving diuretic therapy. Kaplan-Meier survival plot of time to
requirement for renal replacement therapy by quartile of UNa:Cr (1 = lowest, 4
= highest). Comparison by log rank test and estimate of significance, p<0.001
(c) Patients not receiving diuretic therapy. Kaplan-Meier survival plot of time
to death or requirement for renal replacement therapy by quartile of UNa:Cr (1
= lowest, 4 = highest). Comparison by log rank test and estimate of
significance, p<0.001
17
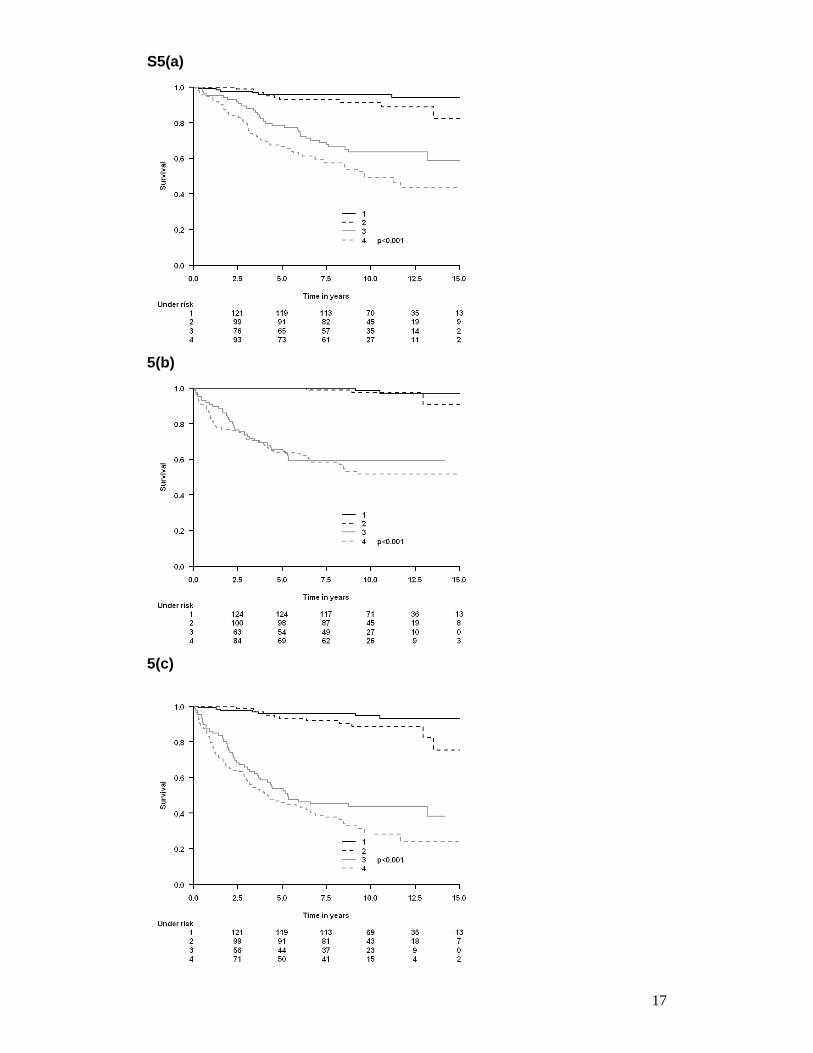
S5(a)
5(b)
5(c)

18
Figure S5 (a) Kaplan-Meier survival plot of time to death stratified by eGFR
and UNa:Cr (1 = eGFR ≥45ml/min/1.732, low UNa:Cr, 2 = eGFR
≥45ml/min/1.732, high UNa:Cr, 3 = eGFR <45ml/min/1.732, low UNa:Cr, 4 =
eGFR <45ml/min/1.732, high UNa:Cr). Comparison by log rank test and
estimate of significance, p<0.001 (b) Kaplan-Meier survival plot of time to
requirement for renal replacement therapy stratified by eGFR and UNa:Cr (1 =
eGFR ≥45ml/min/1.732, low UNa:Cr, 2 = eGFR ≥45ml/min/1.732, high UNa:Cr,
3 = eGFR <45ml/min/1.732, low UNa:Cr, 4 = eGFR <45ml/min/1.732, high
UNa:Cr). Comparison by log rank test and estimate of significance, p<0.001
(c) Kaplan-Meier survival plot of time to death or requirement for renal
replacement therapy stratified by eGFR and UNa:Cr (1 = eGFR
≥45ml/min/1.732, low UNa:Cr, 2 = eGFR ≥45ml/min/1.732, high UNa:Cr, 3 =
eGFR <45ml/min/1.732, low UNa:Cr, 4 = eGFR <45ml/min/1.732, high
UNa:Cr). Comparison by log rank test and estimate of significance, p<0.001

19
S6(a)
6(b)
6(c)

20
Figure S6 (a) Kaplan-Meier survival plot of time to death by group of UNa and
albuminuria (b) Kaplan-Meier survival plot of survival to requirement for RRT
by group of UNa and albuminuria (c) Kaplan-Meier survival plot of survival to
death or requirement for RRT by group of UNa and albuminuria (low UNa
group is UNa <143mmol/24h, low uACR group is uACR <11mg/mmol; key for
figure is 1 = low UNa, low uACR, 2 = high UNa, low uACR, 3 = low UNa, high
uACR, 4 = high UNa, high uACR). Comparison by log rank test and estimate
of significance, for both (a) and (b) p<0.001.


![[Donald Mcquarrie] Physical Chmistry a Molecular(BookFi.org)](https://static.fdocuments.in/doc/165x107/563dbbb3550346aa9aaf8156/donald-mcquarrie-physical-chmistry-a-molecularbookfiorg.jpg)