ESTIMATION. STATISTICAL INFERENCE It is the procedure where inference about a population is made on...
38
ESTIMATION ESTIMATION
-
Upload
florence-williams -
Category
Documents
-
view
214 -
download
0
Transcript of ESTIMATION. STATISTICAL INFERENCE It is the procedure where inference about a population is made on...

ESTIMATIONESTIMATION

STATISTICAL STATISTICAL INFERENCEINFERENCE
It is the procedure where inference It is the procedure where inference about a population is made on the about a population is made on the basis of the results obtained from a basis of the results obtained from a sample drawn from that population sample drawn from that population

STATISTICAL STATISTICAL INFERENCEINFERENCE
This can be achieved by :This can be achieved by :
Hypothesis testing Hypothesis testing
Estimation: Point estimationEstimation: Point estimation
Interval estimationInterval estimation

EstimationEstimation
If the mean and the variance of a If the mean and the variance of a normal distribution are known , then normal distribution are known , then the probabilities of various events the probabilities of various events can be determined.can be determined.
But almost always these values are But almost always these values are not known , and we have to estimate not known , and we have to estimate these numerical values from these numerical values from information of a simple random information of a simple random sample sample

EstimationEstimation
The process of estimation involves The process of estimation involves calculating from the data of a sample calculating from the data of a sample , some “statistic” which is an , some “statistic” which is an approximation of the corresponding approximation of the corresponding “parameter” of the population from “parameter” of the population from which the sample was drawnwhich the sample was drawn

POINT ESTIMATIONPOINT ESTIMATION
It is a single numerical value btained It is a single numerical value btained from a random sample used to from a random sample used to estimate the corresponding estimate the corresponding population parameterpopulation parameter
__ Sample mean (X) is the best point Sample mean (X) is the best point
estimate for population mean(estimate for population mean(µ µ ))

POINT ESTIMATIONPOINT ESTIMATION
Sample standard deviation (Sample standard deviation (ss) is the ) is the best point estimate for population best point estimate for population standard deviation (standard deviation (σσ ) )
~ ~
Sample proportion ( P) is the best Sample proportion ( P) is the best point estimator for population point estimator for population proportion (P)proportion (P)

But, there is always a sort of But, there is always a sort of sampling error that can be measured sampling error that can be measured by the Standard Error of the mean by the Standard Error of the mean which relates to the precision of the which relates to the precision of the estimated meanestimated mean

Because of sampling variation we Because of sampling variation we can not say that the exact parameter can not say that the exact parameter value is some specific number, but value is some specific number, but we can determine a range of values we can determine a range of values within which we are confident the within which we are confident the unknown parameter lies unknown parameter lies

INTERVAL ESTIMATIONINTERVAL ESTIMATION
It consists of two numerical values It consists of two numerical values defining an interval within which lies defining an interval within which lies the unknown parameter we want to the unknown parameter we want to estimate with a specified degree of estimate with a specified degree of confidenceconfidence

INTERVAL ESTIMATIONINTERVAL ESTIMATION
The values depend on the confidence The values depend on the confidence level which is equal to 1-level which is equal to 1-α (α is the α (α is the probability of error) probability of error)
The interval estimate may be The interval estimate may be expressed as:expressed as:
Estimator Estimator ± Reliability coefficient X ± Reliability coefficient X standard error standard error

INTERVAL ESTIMATIONINTERVAL ESTIMATION
ParameterParameterEstimatorEstimatorStandard Standard errorerror
Population Population meanmean
((µ )µ )
Sample mean_Sample mean_
( X) ( X)
σ /√ nσ /√ n

INTERVAL ESTIMATIONINTERVAL ESTIMATION
ParameterParameterEstimatorEstimatorStandard Standard errorerror
Difference Difference between two between two population meanspopulation means
(µ(µ11-µ-µ22))
Difference Difference between two between two sample meanssample means
_ __ _
( X( X11-X-X22) )
√√ (σ(σ2211/n/n11)+ )+
(σ(σ2222/n/n22))

INTERVAL ESTIMATIONINTERVAL ESTIMATION
ParameterParameterEstimatorEstimatorStandard Standard errorerror
PopulatiPopulation on proportiproportionon
( (PP))
Sample Sample proportionproportion
~ ~
(P)(P)
~~ ~~
√√ p(1-p)/np(1-p)/n(since P is (since P is unknown, and unknown, and we want to we want to estimate it)estimate it)

INTERVAL ESTIMATIONINTERVAL ESTIMATION
ParameterParameterEstimatorEstimatorStandard errorStandard error
Difference Difference between two between two Population Population proportionsproportions
( P( P11-P-P22))
Difference Difference between between two Sample two Sample proportionproportion
~ ~ ~ ~
PP11-P-P22
~ ~ ~ ~ ~ ~
√√ pp11(1-p(1-p11)/n)/n1 + 1 + pp22(1-(1-
~~pp22)/n)/n2 2

Reliability CoefficientReliability Coefficient
The reliability coefficient is the value The reliability coefficient is the value of of
ZZ1-1-α /2α /2 corresponding to the corresponding to the confidence levelconfidence level

Reliability CoefficientReliability Coefficient
ConfidenConfidence levelce level
α -valueα -valueZ-valueZ-value
90%90%0.10.11.6451.645
95%95%0.050.051.961.96
99%99%0.010.012.582.58

Confidence IntervalConfidence Interval
The Confidence Interval is central The Confidence Interval is central and symmetric around the sample and symmetric around the sample mean , so that there is (mean , so that there is (α/2 %) α/2 %) chance that the parameter is more chance that the parameter is more than the upper limit, and (α/2 % ) than the upper limit, and (α/2 % ) chance that it is less than the lower chance that it is less than the lower limit limit

CI FOR POPULATION CI FOR POPULATION MEANMEAN
The sample mean is an unbiased estimate for The sample mean is an unbiased estimate for population mean population mean
If the population variance is known, CI around If the population variance is known, CI around µ:µ:
_ __ _
{{X- X- ZZ1-1-α /2α /2 x x σ /√ nσ /√ n < µ < X + < µ < X + ZZ1-1-α /2α /2 x x σ /√ σ /√
nn}}

EXERCISEEXERCISE
The mean s.indirect bilirubin level of The mean s.indirect bilirubin level of 16 four days old infants was found to 16 four days old infants was found to be 5.98 mg/dl. The population SD be 5.98 mg/dl. The population SD ((σ)=3.5 mg/dl. Assuming normality , σ)=3.5 mg/dl. Assuming normality , find 90,95, 99% CI for find 90,95, 99% CI for µ:µ:
_ __ _
{{X- X- ZZ1-1-α /2α /2 x x σ /√ nσ /√ n < µ < X + < µ < X + ZZ1-1-α /2α /2 x x σ /√ n}σ /√ n}

EXERCISEEXERCISE
_ __ _
CICI{{X- X- ZZ1-1-α /2α /2 x x σ /√ nσ /√ n < µ < X + < µ < X + ZZ1-1-α /2α /2 x x σ /√ σ /√ n}=1-n}=1-αα
90%CI90%CI= {= {5.98- 1.645 * 5.98- 1.645 * 3.5 /√ 163.5 /√ 16 < µ < 5.98 < µ < 5.98 + 1.645 * + 1.645 * 3.5 /√ 16}=1-3.5 /√ 16}=1-0.10.1
90%CI90%CI= {= {5.98- 1.44 < µ < 5.98 + 1.445.98- 1.44 < µ < 5.98 + 1.44}=1-}=1-0.10.1
90%CI90%CI= = {{4.54 < µ < 7.424.54 < µ < 7.42}}

_ __ _
CICI{{X- X- ZZ1-1-α /2α /2 x x σ /√ nσ /√ n < µ < X + < µ < X + ZZ1-1-α /2α /2 x x σ /√ σ /√ n}=1-n}=1-αα
95%CI95%CI { {5.98- 1.96 * 5.98- 1.96 * 3.5 /√ 163.5 /√ 16 < µ < 5.98 + < µ < 5.98 + 1.96 * 1.96 * 3.5 /√ 16} 3.5 /√ 16}
95%CI95%CI { {5.98- 1.715 < µ < 5.98 + 1.7155.98- 1.715 < µ < 5.98 + 1.715} }
95%CI95%CI {{4.265 < µ < 7.6954.265 < µ < 7.695} }

_ __ _
CICI{{X- X- ZZ1-1-α /2α /2 x x σ /√ nσ /√ n < µ < X + < µ < X + ZZ1-1-α /2α /2 x x σ /√ n}=1-σ /√ n}=1-αα
99%CI99%CI{{5.98- 2.58 * 5.98- 2.58 * 3.5 /√ 163.5 /√ 16 < µ < 5.98 + < µ < 5.98 + 2.58 * 2.58 * 3.5 /√ 16}3.5 /√ 16}
99%CI99%CI{{5.98- 2.258 < µ < 5.98 + 2.2585.98- 2.258 < µ < 5.98 + 2.258}}
99%CI=99%CI={ { 3.72 < µ < 8.243.72 < µ < 8.24}}

CI for difference between CI for difference between two population meanstwo population means
A sample of 10 twelve years old boys and A sample of 10 twelve years old boys and a sample of 10 twelve years old girlsa sample of 10 twelve years old girls yielded mean height of 59.8 inches (boys), yielded mean height of 59.8 inches (boys), and 58.5 inches (girls). Assuming and 58.5 inches (girls). Assuming normality and normality and σσ11=2 inches, and σ=2 inches, and σ22= 3 = 3 inches . Find 90% CI for the difference in inches . Find 90% CI for the difference in means of height between girls and boys at means of height between girls and boys at this age.this age.

CI for difference between CI for difference between two population meanstwo population means
_ _ _ __ _ _ _
CI{CI{( X( X11-X-X22) ) -Z -Z √ √ (σ(σ2211/n/n11)+ (σ)+ (σ22
22/n/n22)< )< (µ(µ11-µ-µ22))< ( X< ( X11-X-X22)+)+
ZZ√√ (σ (σ2211/n/n11)+ (σ)+ (σ22
22/n/n22))}}
90%CI{90%CI{( 59.8-58.5) ( 59.8-58.5) -1.645 -1.645 √ √ (2)(2)22/10)+ (3)/10)+ (3)22/10)< /10)< (µ(µ11-µ-µ22))< <
( 59.8-58.5)+1.645( 59.8-58.5)+1.645√√ (2) (2)22/10)+ (3)/10)+ (3)22/10)/10)}}
90%CI{90%CI{1.3 1.3 -1.88-1.88< < (µ(µ11-µ-µ22))< 1.3+ 1.88< 1.3+ 1.88}}
90%CI{ 90%CI{ -0.58< -0.58< (µ(µ11-µ-µ22))< 3.18< 3.18}}

CI for population CI for population proportionproportion
In a survey 300 adults were In a survey 300 adults were interviewed , 123 said they had interviewed , 123 said they had yearly medical checkup. Find the yearly medical checkup. Find the 95% for the true proportion of adults 95% for the true proportion of adults having yearly medical checkup.having yearly medical checkup.
~ ~ 123 123 P=-------=0.41P=-------=0.41
300300

CI for population CI for population proportionproportion
~ ~ ~ ~ ~ ~ ~ ~ ~ ~ ~ ~ CICI{P-Z √ {P-Z √ p(1-p)/n<P<P+Z p(1-p)/n<P<P+Z √ √ p(1-p)/np(1-p)/n}=1-α}=1-α
95%CI95%CI{0.41-1.96 √ {0.41-1.96 √ 0.41(1-0.41)/300<P<0.41+1.96 0.41(1-0.41)/300<P<0.41+1.96 √ √ 0.41(1-0.41)/3000.41(1-0.41)/300}}
95%CI95%CI{0.41- 0.06{0.41- 0.06<P<0.41+0.06<P<0.41+0.06}}
95%CI95%CI{0.35{0.35<P<0.47<P<0.47}}
95%CI= 35-47%95%CI= 35-47%

CI for difference between CI for difference between two population proportionstwo population proportions
200 patients suffering from a certain 200 patients suffering from a certain disease were randomly divided into two disease were randomly divided into two equal groups. The first group received equal groups. The first group received NEW treatment, 90 recovered in three NEW treatment, 90 recovered in three days. Out of the other 100 who received days. Out of the other 100 who received the STANDARD treatment 78 recovered the STANDARD treatment 78 recovered within three days. Find the 95% CI for within three days. Find the 95% CI for the difference between the proportion of the difference between the proportion of recovery among the populations recovery among the populations receiving the two treatmentsreceiving the two treatments

AnswerAnswer
~ ~ 90 78~ ~ 90 78 PP11-P-P22=------- - ---------=0.12=------- - ---------=0.12
100 100100 100
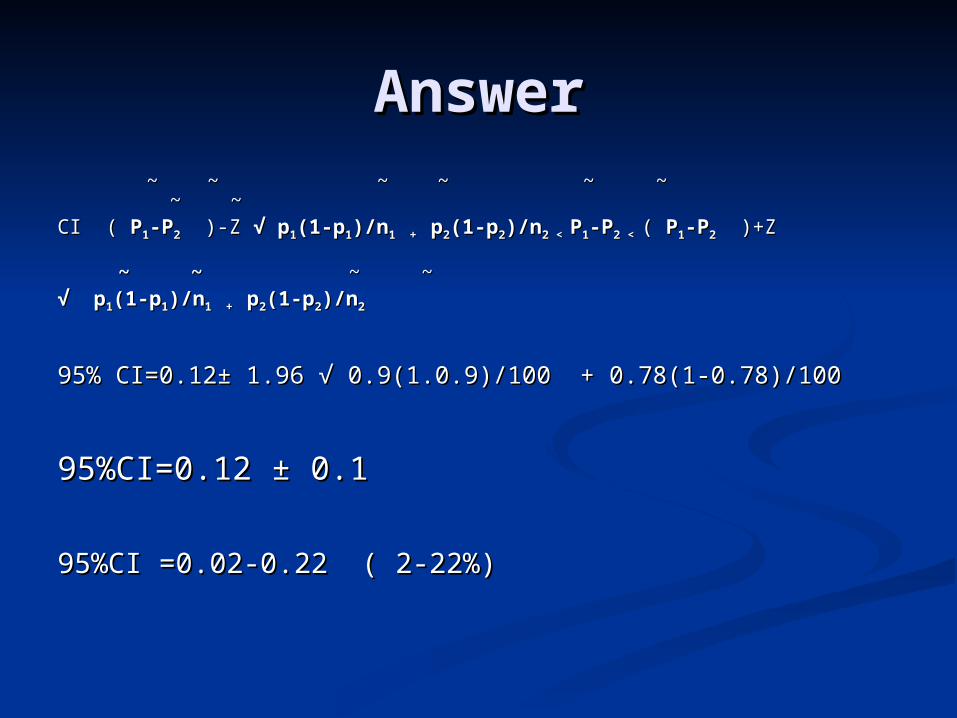
AnswerAnswer ~ ~ ~ ~ ~ ~ ~ ~ ~ ~ ~ ~ ~ ~ ~ ~ CI ( CI ( PP11-P-P22 )-Z )-Z √ √ pp11(1-p(1-p11)/n)/n1 + 1 + pp22(1-p(1-p22)/n)/n2 < 2 < PP11-P-P2 < 2 < ( ( PP11-P-P22 )+Z )+Z
~ ~~ ~ ~ ~ ~ ~ √ √ pp11(1-p(1-p11)/n)/n1 + 1 + pp22(1-p(1-p22)/n)/n22
95% CI=0.1295% CI=0.12± 1.96 √ 0.9(1.0.9)/100 + 0.78(1-0.78)/100± 1.96 √ 0.9(1.0.9)/100 + 0.78(1-0.78)/100
95%CI=0.12 95%CI=0.12 ± 0.1± 0.1
95%CI =0.02-0.22 ( 2-22%)95%CI =0.02-0.22 ( 2-22%)

The width of the interval estimation The width of the interval estimation is increased by:is increased by:
Increasing confidence level (i.e.: Increasing confidence level (i.e.: decreasing alpha value)decreasing alpha value)
Decreasing sample sizeDecreasing sample size

Confidence level can shade the light Confidence level can shade the light on the following information:on the following information:
1.The range within which the true 1.The range within which the true value of the estimated parameter value of the estimated parameter lieslies

2.The statistical significance of a difference 2.The statistical significance of a difference ( in population means or proportions). ( in population means or proportions).
If the ZERO value is included in the If the ZERO value is included in the interval of such differences( i.e.: the range interval of such differences( i.e.: the range lies between a negative value and a lies between a negative value and a positive value), then we can state that positive value), then we can state that there is no statistically significant there is no statistically significant difference between the two population difference between the two population values (parameters), although the sample values (parameters), although the sample values (statistics) showed a differencevalues (statistics) showed a difference

3.The sample size.3.The sample size.
A narrow interval indicates a “large” A narrow interval indicates a “large” sample size,sample size,
while a wide interval indicates a while a wide interval indicates a “small” sample“small” sample
size (with fixed confidence level) size (with fixed confidence level)

EXERCISESEXERCISES
In a study to assess the side effects In a study to assess the side effects of two drugs , 50 animals were given of two drugs , 50 animals were given Drug A (11 showed undesirable side Drug A (11 showed undesirable side effects), and 50 were given Drug B effects), and 50 were given Drug B (8 showed similar side effects).(8 showed similar side effects).
Find the 95% CI for PFind the 95% CI for PAA-P-PBB

EXERCISESEXERCISES
In a random sample of 100 workers , In a random sample of 100 workers , the mean blood lead level was 90 the mean blood lead level was 90 ppm. If the distribution of blood lead ppm. If the distribution of blood lead level in workers population is normal level in workers population is normal with a standard deviation of 10 ppm.with a standard deviation of 10 ppm.
Find the 90,95,and 99% CI for the Find the 90,95,and 99% CI for the population mean. population mean.

EXERCISEEXERCISE
In assessing the relationship between In assessing the relationship between a certain drug and a certain anomaly a certain drug and a certain anomaly in chick embryos, 50 fertilized eggs in chick embryos, 50 fertilized eggs were injected with the drug on the were injected with the drug on the 44thth day of incubation . On the 20 day of incubation . On the 20thth day day the embryos were examined and in the embryos were examined and in 12 the presence of the abnormality 12 the presence of the abnormality was observed. Find the 90,95, and was observed. Find the 90,95, and 99% CI for the population proportion.99% CI for the population proportion.

EXERCISEEXERCISE
If the Hb level of males aged >10 years If the Hb level of males aged >10 years is normally distributed with a variance of is normally distributed with a variance of 1.462 (gm/dl)1.462 (gm/dl)22 , and that of males below , and that of males below 10 years is also normally distributed with 10 years is also normally distributed with a variance of 0.867 (gm/dl)a variance of 0.867 (gm/dl)22 . If a random . If a random sample of 10 older and 20 younger males sample of 10 older and 20 younger males are selected , and showed sample means are selected , and showed sample means of 14.47 gm/dl, and 12.64 gm/dl , of 14.47 gm/dl, and 12.64 gm/dl , respectively. Find the 90, 95, and 99% CI respectively. Find the 90, 95, and 99% CI for the difference in population means.for the difference in population means.