Radar Estimation of Intense Rainfall Rates through Adaptive ...

A. ADACHI et al.June 2015 359Journal of the Meteorological Society of Japan, Vol. 93, No. 3, pp. 359−388, 2015DOI:10.2151/jmsj.2015-020
Estimation of Raindrop Size Distribution and Rainfall Rate fromPolarimetric Radar Measurements at Attenuating Frequency
Based on the Self-Consistency Principle
Ahoro ADACHI
Meteorological Research Institute, Tsukuba, Japan
Takahisa KOBAYASHI
Central Research Institute of Electric Power Industry, Abiko, JapanMeteorological Research Institute, Tsukuba, Japan
and
Hiroshi YAMAUCHI
Meteorological Research Institute, Tsukuba, Japan
(Manuscript received 14 July 2014, in final form 10 February 2015)
Abstract
A method for estimating three parameters of a gamma raindrop size distribution (DSD) model and the rainfall rate from polarimetric radar at attenuating frequency was developed. The algorithm was developed based on the self-consistency principle but was expanded to consider the attenuation effect by describing the interrelation between polarimetric measurements along the range profile. The proposed method does not require any assumptions of relation among DSD parameters or simplifications of equations that describe the relation between the axis ratio and diameter of raindrops, which have been used in previous studies. Moreover, the proposed algorithm needs no external reference data such as two-dimensional video disdrometer measurements for attenuation corrections because it retrieves the co-polar and differential specific attenuation from the interrelation among the polarimetric measurements.
The performance of this algorithm was evaluated by comparison with optical disdrometers and a weighing precip-itation gauge. The evaluation of the algorithm showed that the retrieved three DSD parameters of raindrops, reflec-tivity, and differential reflectivity from actual C-band polarimetric radar data have fairly good agreement with those obtained by surface measurements. Moreover, rainfall rates retrieved using this algorithm have comparable precision with those estimated from the specific differential phase, and outperform those estimated through the so-called Z–R relation, particularly during heavy rainfall. Furthermore, the effects of raindrop temperature and shape parameter on the retrieval of the rainfall rate were examined. The results show that for radar operating at C-band, a raindrop temperature error of 10°C may be negligible in rainfall rate estimations, whereas a shape parameter error of 2 may increase the error of the rainfall rate estimation by 10 %.
Keywords polarimetric radar; attenuation correction; DSD auto-retrieval; autocalibration; raindrop temperature
Corresponding author: Ahoro Adachi, Meteorological Research Institute, 1-1 Nagamine, Tsukuba 305-0052, JapanE-mail: [email protected]©2015, Meteorological Society of Japan

Journal of the Meteorological Society of Japan Vol. 93, No. 3360
1. Introduction
Real-time surveys of rainfall fields and estimation of rainfall rates have constituted the primary objec-tive of operational and research weather radars for a long time because of their relatively high spatial and temporal sampling and ability to cover a relatively large area (Wilson and Brandes 1979; Doviak and Zrnić 1993; Bringi and Chandrasekar 2001). The esti-mation of the rainfall rate, R, using radar has tradi-tionally been accomplished by relating the horizontal reflectivity factor (ZH) to the rainfall rate through a so-called Z–R (hereafter R(ZH)) relation. This relation mostly assumes an a priori power law form of the two parameters determined by comparing radar reflectivity factor data with precipitation gauge observations on the ground. However, it can be shown that there is no universal relation connecting the two parameters because R depends on the raindrop size distribution (DSD), which requires multiple number of parameters to characterize (Doviak and Zrnić 1993).
Significant progress has been achieved in rain-fall measurement since dual-polarized radars were introduced. This kind of radar system provides both backscatter and differential propagation phase infor-mation, and therefore, it can reveal additional char-acteristics of the precipitation medium to constrain the uncertainty of rainfall estimation resulting from DSD variability (Cifelli et al. 2011). The utilization of the differential reflectivity ZDR in combination with radar reflectivity ZH helps mitigate uncertainties related to DSD variability (e.g., Seliga and Bringi 1976; Bringi et al. 1982; Ulbrich and Atlas 1984; Gorgucci et al. 1994), especially for radars operating at S-band. Adachi et al. (2013) showed that the R(ZH, ZDR) algorithm at C-band with attenuation correction performed better than the R(ZH) relation for convec-tive storms that were early in their development, prior to the onset of strong attenuation. However, the R(ZH, ZDR) relation is less efficient at both C- and X-band because ZDR can be strongly biased by differential attenuation, and the quality of its attenuation correc-tion using differential phase is insufficient to ensure the required accuracy of the ZDR measurement to within 0.1–0.2 dB (e.g., Aydin et al. 1989; Illingworth and Blackman 2002; Illingworth 2004) if differen-tial attenuation is significant, as in heavy rainfall (Ryzhkov et al. 2014).
Methods based on specific differential phase, KDP, are less sensitive to DSD variations and are immune to attenuation and radar miscalibration (Sachidananda and Zrnić 1986). Indeed, Sachidananda and Zrnić
(1987) and Chandrasekar et al. (1990) have shown that R(KDP) outperforms R(ZH) and R(ZH, ZDR) at high rainfall rates, although R(KDP) is less reliable at lower rainfall rates because KDP becomes noisy and increasingly susceptible to DSD variability. A typical solution for S-band is a combination of an R(KDP) for high rainfall rates and an R(ZH, ZDR) relation for lower rainfall rates (e.g., Ryzhkov et al. 2005; Cifelli et al. 2011). At C- and X-band, where attenuation is more significant than at S-band (Smyth and Illing-worth 1998), R(KDP) is applied for a larger range of rain intensities and an R(ZH) relation is usually used for lighter rain with polarimetrically corrected reflec-tivity (e.g., Park et al. 2005a; Figueras i Ventura et al. 2012; Vulpiani et al. 2012; Yamauchi et al. 2012). More recently, Ryzhkov et al. (2014) showed that the rainfall rate estimated from the specific attenuation AH is the least sensitive to DSD variations and has some advantages compared with rainfall rates estimated from ZH or ZDR and/or KDP.
Many studies have proposed methods to estimate DSD parameters as a part of rain attenuation correc-tion and/or the rainfall rate estimation algorithms. The DSD parameters may provide information that is useful for exploring rain microphysics in clouds, which is one of the advantages of this type of method. A modified gamma distribution model suggested by Ulbrich (1983) has been used to characterize the natural DSD variation. The parameters that deter-mine the modified gamma DSD are a shape param-eter μ, median volume diameter D0 or slope parameter Λ, and a number concentration N0 or its normalized version NW. By assuming a linear relation between AH and KDP, Testud et al. (2000) estimated normal-ized number concentration NW from the radial profile of measured ZH and the total span of the differential phase for C- and X-band, whereas Bringi et al. (2006) estimated D0 from attenuation-corrected ZDR for C-band. Recently, Thurai et al. (2012) and Kim et al. (2010) estimated NW from attenuation-corrected ZH and D0 obtained from attenuation-corrected ZDR for C- and X-band, respectively.
The β method proposed by Gorgucci and Scarchilli (2001) and Gorgucci et al. (2002) retrieves both NW and D0 from attenuation-corrected ZH, ZDR, and KDP by assuming a simplified linear axis-ratio relation with a coefficient of β (i.e., r = 1.03 ˗ βD, where r is the axis ratio, and D is the equivalent volume diam-eter). This method has been used in numerous studies (e.g., Gorgucci et al. 2002; Bringi et al. 2002; Park et al. 2005b; Gorgucci et al. 2008). On the other hand, the constrained gamma method proposed by Brandes

A. ADACHI et al.June 2015 361
et al. (2003) retrieves NW and D0 from attenua-tion-corrected ZH and ZDR with an empirical μ–Λ rela-tion derived from 2-dimensional video disdrometer (2DVD) measurements. This method has also been extensively used in many studies (e.g., Brandes et al. 2004; Vivekanandan et al. 2004). In addition, Kalo-giros et al. (2013) proposed another algorithm to esti-mate μ and NW from attenuation-corrected ZH, ZDR, and KDP, assuming a statistical μ–D0 relation derived from 2DVD measurements for X-band. More recently, Yoshikawa et al. (2014) proposed a method to retrieve three parameters of the modified gamma DSD using an iterative maximum-likelihood estimation.
Most of the aforementioned methods require external reference data such as disdrometers and/or approximations/simplifications of equations to derive relations that are essential for DSD parameter retrieval algorithms. Using the physical-based ad hoc or empirical relations derived from the reference data may cause errors because of the raindrop tempera-ture, shape, and size distribution dependency when used in different conditions, including seasons, loca-tions, and precipitation types. Moreover, the fact that the sampling volume of the reference data is quite different from that of radar makes it difficult to obtain reliable reference data. On the other hand, simplifica-tion of physical-based empirical relations such as the β method may not be representative of actual raindrop variability because the simplified relations may not capture the true functional form well enough to guar-antee an unbiased estimation (e.g., Anagnostou et al. 2008). Therefore, a DSD retrieval algorithm that does not require external reference DSD data or include any simplification of empirical relations is needed to estimate DSD parameters and the rainfall rate from polarimetric measurements with high reliability.
The DSD retrieval algorithm proposed in the present study is based on an autocalibration of ZH using polarization redundancy introduced by Goddard et al. (1994), which is a variation of the calibration method by Gorgucci et al. (1992). Goddard et al. (1994) showed that for rain, KDP/ZH is a unique func-tion of ZDR, which is virtually independent of μ, and proposed that this self-consistency could be used to provide an automatic calibration of ZH to within 0.5 dB for S-band (Illingworth 2004), where the path-in-tegrated attenuation is negligible. This technique avoids deriving KDP by differentiating an observed noisy ΨDP profile to induce an even noisier gradient (Illingworth 2003); it instead uses the two almost constant values of ΦDP, i.e., initial differential phase and ΦDP at sufficiently large distance, where the
signal-to-noise ratio is roughly several dB (Bringi et al. 2006). Following these pioneering studies, methods to calibrate S-band radar reflectivity using the autocalibration have been demonstrated by Illing-worth and Blackman (2002) and Vivekanandan et al. (2003).
For radars operating at higher frequency, Le Bouar et al. (2001) expressed concern over the attenuation of ZH and ZDR when applying the auto-calibration for C-band. On the other hand, Illing-worth (2004) suggested that the application of the autocalibration for C-band does not pose a problem if the maximum ΦDP is less than 10° and the atten-uation is less than 0.5 dB, although he admitted that the technique fails at X-band. More recently, Gourley et al. (2009) showed that the autocalibra-tion technique can calibrate C-band radar to within 0.6 dB when the maximum ΦDP is less than 12°. In addition, Thurai and Hanado (2005) showed that this technique is available for C-band even in heavy rain if reference DSD data measured by 2DVD are provided to estimate attenuation effects. Moreover, Bringi et al. (2006) retrieved D0 from C-band radar measurements and 2DVD reference data by using the consistency among the polarimetric measurements on which the autocalibration technique is based. This result suggests that the autocalibration can be used to retrieve DSD parameters if reliable corrections for attenuation are applicable. Aydin et al. (1989) proposed an attenuation correction procedure for C-band radar measurements that does not rely on any external reference data, although this method is very sensitive to bias, including calibration errors in ZH and ZDR measurements. Thus, based on these pioneering studies, here, we propose a new algorithm to esti-mate the three DSD parameters and rainfall rate for polarimetric radar at the attenuation frequency using consistency among the polarimetric measurements. The proposed algorithm requires no external reference data such as 2DVD measurements for attenuation corrections because it retrieves co-polar and differen-tial specific attenuation from the interrelation among the polarimetric measurements.
This paper is organized as follows. In Section 2, we describe an outline of the methodology of our approach using the total phase shift in rain to estimate rain parameters by calibrating ZH. The instruments and the reliability obtained by comparing estimations with ground-based measurements of the proposed method are described in Section 3. We discuss the effects of raindrop temperature and shape parameters on the retrieval of the rainfall rate in Section 4, and

Journal of the Meteorological Society of Japan Vol. 93, No. 3362
finally summarize our conclusions in Section 5.
2. Description of the polarimetric method to retrieve DSD based on the consistency theory
2.1 Autocalibration techniqueThis study develops an algorithm to retrieve the
three DSD parameters from polarimetric measure-ments by expanding an autocalibration of Z (Z represents ZH in this paper to simplify notation) proposed by Goddard et al. (1994). They showed that KDP/Z is a unique function of ZDR for rain, as shown in Fig. 1, and proposed an automatic calibration tech-nique of Z for S-band radar using this redundancy relation. The technique is as follows: for given values of μ and raindrop temperature, KDP can be inferred from the observed values of ZDR and Z at each gate along a ray from the consistency curve (Fig. 1), and the predicted KDP at each gate can be summed to obtain the theoretical ΦDP. The theoretical ΦDP can be compared with the smoothed-observed ΨDP (i.e., the pseudo-observed ΦDP), and the value of Z can be scaled until the computed value agrees with the observed value (Illingworth 2004). Figure 1 shows that the consistency curve has low μ and tempera-ture dependency for C-band, but it has slightly higher dependency for X-band. Illingworth and Blackman (2002) were the first to indicate that the consistency curve is virtually independent of the shape parameter for S-band. On the other hand, Gourley et al. (2009) assumed that the consistency curve is independent of both the shape parameter and temperature to calibrate C-band radar.
Since this autocalibration technique does not consider the attenuation effect, it is valid for S-band but limited for C-band to use with weak rain when the attenuation effect is negligibly small. Unfortunately, this technique is practically impossible for radars operating at X-band to use without attenuation correc-tions, as Gourley et al. (2009) indicated. In the case of heavy rainfall, attenuation corrections should be applied in advance for measured ZH and ZDR to yield theoretical KDP from the consistency curve for those radars. Thurai and Hanado (2005) and Bringi et al. (2006) used KDP derived from the measured ΨDP to correct attenuation for ZH and ZDR. However, they needed 2DVD measurements to estimate a relation between KDP and attenuation. Following their studies, we expand the consistency relation, which governs the autocalibration, to include attenuation correction procedures that do not require any external reference DSD data, and develop an automatic DSD parameter retrieval technique for radars at attenuating frequency
with heavy rainfall.
2.2 Expansion of consistency relation and attenua-tion correction
The attenuation correction algorithm used in the present study assumes that the raindrop temperature and operating frequency are given and that all pola-rimetric variables including attenuation are deter-mined by the DSD, which is represented by the modi-fied gamma distribution, as indicated by equations in Appendix A. Moreover, no ice hydrometeors (such as hail and/or graupel) are assumed to be included in the range profile. These issues are addressed in later sections. The theoretical variations of the functions of AH/ZH and ADP/ZH with ZDR at raindrop temperatures of 0°C and 20°C with shape parameters of 0 and 5 are shown in Figs. 2a and 2b, respectively. In the deri-vation of the new consistency curves, the minimum diameter (Dmin) of 0.1 mm and the maximum diam-eter (Dmax) of 8 mm are used based on the results of Cao et al. (2008). The consistency curves are derived as follows.
Horizontal reflectivity ZH and vertical reflectivity ZV can be expressed in terms of the raindrop concen-
Fig. 1. Relation between two-way specific differ-ential phase per unit linear horizontal reflec-tivity as a function of differential reflectivity at raindrop temperatures of 10°C and 20°C at C-band (5.370 GHz) and X-band (9.375 GHz) with shape parameters of 0 and 5 for a modi-fied gamma distribution with the axis ratio of Brandes et al. (2005).

A. ADACHI et al.June 2015 363
tration N0 by substituting Eq. (A6) for Eq. (A10) as
Z N F DH,V H,V= ×0 0( , ),µ (1)
where
F DK
S D D D DD
D
H,V
hh,vv
( , )
( ) exp .min
max
µ λπ
π µµ
018
4
5 2
2
0
10
4 3 67
= ×
− +∫
dD.
(2)
The differential reflectivity ZDR is given from Eqs. (A11) and (1) as follows:
ZN F DN F D G DDR
H
VDR=
××
≡10 10
0 0
0 00log
( , )( , ) ( , ).µµ
µ (3)
Equation (3) clearly shows that ZDR is independent of N0. Similarly, the specific differential phase shift KDP can be expressed in terms of N0 by substituting Eq. (A6) for Eq. (A12) as follows:
K N F DDP DP= ×0 0( , ),µ (4)
where
F D
f D f D
D
D
D
DP
hh vv
( , )
Re { ( ) ( )}
exp .min
max
µπ
λ
µµ
0310 180
3 67
= ×
× −
− +
∫
DD D dD0
( ) .
(5)
The term KDP/ZH is given from Eqs. (1) and (4) by
KZ
N F DN F D G DDP
H
DP
HDP=
××
≡0 0
0 00
( , )( , ) ( , ),µµ
µ (6)
which is also independent of N0. Equations (3) and (6) indicate that KDP/ZH can be expressed as a function of ZDR by using D0 as an intermediate variable for a given value of μ, as shown in Fig. 1.
On the other hand, the specific attenuation of hori-zontal polarization AH can be expressed in terms of N0 by substituting Eq. (A6) for Eq. (A13) as follows:
A N B DH H= ×0 0( , ),µ (7)
where
B D
f D D D D dDD
D
H
hh
( , ) .
Im ( ) exp . .min
max
µ λ
µµ
03
0
8 686 103 67
= ×
× − +( )∫(8)
In addition, the differential specific attenuation ADP can also be expressed in terms of N0 by substituting Eq. (A6) for Eq. (A14) as follows:
A N B DDP DP= ×0 0( , ),µ (9)
where
Fig. 2. (a) Relations of horizontal specific atten-uation per unit linear horizontal reflectivity and (b) specific differential attenuation per unit linear horizontal reflectivity as a function of differential reflectivity at raindrop temperatures of 10°C and 20°C at C-band (5.370 GHz) and X-band (9.375 GHz) with shape parameters of 0 and 5 for a modified gamma distribution with the axis ratio of Brandes et al. (2005).

Journal of the Meteorological Society of Japan Vol. 93, No. 3364
B D
f D
f D D
D
D
DP
hh
vv
( , ) .
Im { ( )
( )} exp .min
max
µ λ
µ
038 686 10
3 67
= ×
×
− − +
∫µµ
D D dD0
( ) .
(10)
The terms of AH/ZH and ADP/ZH are given from Eqs. (1), (7), and (9) by
AZ
N B DN F D L DH
H
H
HH=
××
≡0 0
0 00
( , )( , ) ( , )µµ
µ (11)
and
AZ
N B DN F D L DDP
H
DP
HDP=
××
≡0 0
0 00
( , )( , ) ( , ).µµ
µ (12)
Eqs. (3), (11), and (12) show that both AH/ZH and ADP/ZH can also be expressed as a function of ZDR by using D0 as an intermediate variable for a given value of μ, as shown in Fig. 2.
Figure 2 indicates that the consistency curve of AH/ZH has low temperature and shape-parameter dependencies, especially for C-band, as is the case for KDP/ZH. However, this figure also shows that the consistency curve of ADP/ZH has slightly larger depen-dencies on not only temperature but also shape param-eter, especially for X-band. These small dependencies on both temperature and shape parameter could make large differences in the retrieval of the rainfall rate, particularly in heavy rainfall, because the attenuation effects are defined as path integrals of the co-polar and differential specific attenuation given by
Z r Z r A s ds Cobs truer
rH H H H( ) ( ) ( )= − −∫2
1
(13)
and
Z r Z r A s ds Cobs truer
rDR DR DP DP( ) ( ) ( ) ,= − −∫2
1
(14)
where Z rtrueH dBZ( ) ( ) and Z rtrue
DR dB( ) ( ) represent true reflectivity and differential reflectivity after atten-uation correction at a range of r, respectively; r1 is the distance of the first range resolution volume; and CH and CDP are the correction terms for the reflectivity and differential reflectivity profiles, respectively.
We have opted for a simple gate-to-gate attenua-tion correction scheme based on Aydin et al. (1989) as opposed to the more complicated techniques used, for example, by Testud et al. (2000) or Yoshikawa et al. (2014). In the proposed algorithm, the true reflectivity
and differential reflectivity at range rn can be obtained by recurrence formulas derived from Eqs. (13) and (14) as
Z r Z r
A Z r Z r
truen
obsn
k
ntrue
ktrue
k
H H
H H DR
( ) ( )
( ( ), ( ))
=
+=
− −∑21
1 1 δ ss C+ H ,(15)
Z r Z r
A Z r Z r
truen
obsn
k
ntrue
ktrue
k
DR DR
DP H DR
( ) ( )
( ( ), (
=
+=
− −∑21
1 1))) ,δ s C+ DP(16)
where rn represents the distance of the nth range gate, δ s (km) is the range resolution of the radar measure-ments, and
A Z r Z r
A Z r Z r
true true
true true
H H DR
DP H DR
( ( ), ( ))
( ( ), ( ))0 0
0 0 0
=
=(17)
Note that the co-polar and differential specific atten-uation are inferred from true ZH and ZDR with the consistency curves in Figs. 2a and 2b, respectively. The bias (CH) in the observed ZH corrected with the proposed method is the sum of the radar constant calibration error and any excess attenuation from the radar to the first range resolution volume, including excess attenuation due to rain on the radome, as shown in Eqs. (15) and (17) and as assumed in Bringi et al. (2006) and Thurai and Hanado (2005). Note that the value of CH could vary with the beam direction and time because it contains excess attenuation due to the wet radome of the antenna. Similarly, the term CDP is the sum of relative bias error in ZDR and excess differential attenuation. In the method used here, it is also assumed that the systematic bias in ZDR measure-ments is negligible (by calibrating with vertical measurements in rain) and that excess differential attenuation can be neglected assuming that both the H and V signal powers are affected almost equally by rain on the radome, which is supported by the results of Gorgucci et al. (2013). Therefore, the value of CDP is set to zero, as assumed in Bringi et al. (2006). The effects of the excess differential attenuation by the wet radome in high winds are discussed in Appendix C.
In the proposed method, Eqs. (15) and (16) are initially evaluated assuming CH to be zero. Once values of the true ZH and ZDR so derived at each gate are obtained, they are used to predict the value of KDP at that gate with the original consistency curves (Fig. 1).
A. ADACHI et al.June 2015 365
The theoretical ΦDP can be derived from KDP with Eq. (A15), and the values of measured Z are scaled by CH in Eq. (15) until the total phase change of the theoretical ΦDP along the path agrees with that of the smoothed-observed ΨDP, as is done in the original autocalibration technique.
Since this method requires the total phase change of the smoothed-observed ΨDP at sufficiently large distances, it may not be available under extreme atten-uation conditions wherein the signal is completely lost. Moreover, the attenuation correction proce-dure proposed in this study is based on gate-by-gate recursive estimation through a relation employing the measured ZH and ZDR. This approach is very sensi-tive to any bias on ZH and ZDR (e.g., hail, graupel, ground clutter, and partial beam blockage) and errors in measurements and the DSD parameterization (Gorgucci et al. 2002). Contamination from these biases may result in large errors in the retrievals of rain parameters with the proposed algorithm. However, contamination from these biases in a radial direction can be identified and discarded using this method, because it produces a large error in the theo-retical ΦDP profile and the theoretical ΦDP abruptly diverges from the smoothed-observed ΨDP. Indeed, we observed theoretical ΦDP deviated from the smoothed-observed ΨDP by more than 100° within a few gates behind ground clutter in the observations with an antenna elevation angle of 0.5°. Fortunately, all the theoretical ΦDP profiles analyzed in this study fit the smoothed-observed ΨDP made at an elevation angle of 1.0°, which suggests that the observations were made in pure rain conditions, and biases were negligibly small.
2.3 Retrieval of the DSD parametersThe DSD parameters are derived from the attenua-
tion-corrected ZH and ZDR obtained with the proposed method. The shape parameter is estimated by comparing the theoretical ΦDP with the smoothed-ob-served ΨDP through a rain path in the radial direction, as shown later in Section 3. Once the shape param-eter is determined, the median volume diameter D0 can be derived from the attenuation-corrected ZDR at each range gate, because ZDR is independent of N0 and is a function of D0 and μ as given by Eq. (3). Then, N0 can be derived from the true ZH with the retrieved D0 and μ from Eq. (1), and NW can be obtained from the true ZH, D0, and μ with the retrieved N0 from Eqs. (A3), (A6), and (A9). Other rain parameters including the rainfall rate can be theoretically derived from the DSD parameters using equations in Appendix A.
3. MRI C-band polarimetric radar and retrieval of DSD parameters
The theoretical derivation in the previous section suggests that the proposed method is available for polarimetric radars operating at attenuating frequency to retrieve microphysical characteristics of rain, including DSD parameters, in even heavy rainfall because the method considers attenuation effects by expanding the consistency theory. In this section, we apply the proposed algorithm for actual C-band pola-rimetric radar data collected during different seasons to demonstrate the high reliability of this method by comparing the retrieved data including DSD parame-ters with measurements on the ground.
3.1 MRI C-band polarimetric radarThe Meteorological Research Institute (MRI)
advanced C-band solid-state polarimetric radar (MACS-POL radar) is mounted on top of the MRI building in Tsukuba, Japan (Adachi et al. 2013). The radar routinely collects a full suite of dual-polariza-tion measurements, including the reflectivity factor (ZH), differential reflectivity (ZDR), differential propa-gation phase (ΨDP), and correlation coefficient at zero lag (ρHV(0)). This system employs two solid-state amplifier units to transmit horizontally and vertically polarized waves. The radar is operating in the simul-taneous transmission and reception (STAR) mode for polarized signals, i.e., the system simultaneously transmits horizontal and vertical polarization states and obtains samples of both horizontal and vertical co-polar returns. Since the peak power of the ampli-fiers was slightly weak, observations were made with a long pulse to increase the mean power. A pulse compression technique with a linear FM chirp was used to increase the range resolution. The range side lobe associated with this technique was suppressed to less than −48 dB (Yamauchi et al. 2012). Because radar cannot observe in the vicinity of the antenna with long-pulse observations, this radar alternately transmitted short and long pulses to cover the blind region associated with the long-pulse observations. The operating frequencies deployed for the two pulses were separated to avoid mutual contamination. The configuration and operating parameters of the radar are summarized in Table 1.
The rotation speed sequence of the antenna shown in Table 1 enables a temporal resolution of volu-metric scans of 4 min with 15 elevation observa-tions including the vertical with this system. Vertical measurement in rain was used to calibrate the ZDR

Journal of the Meteorological Society of Japan Vol. 93, No. 3366
measurements to make the uncertainty in the indi-vidual range gate ZDR values less than 0.1 dB, as proposed by Illingworth (2004) and Gourley et al. (2009). Since beam blocking was common at the lowest elevation angle of 0.5°, unblocked data at an elevation angle of 1.0° were used in the evalu-ations below. Because the elevation angle was quite small, the effect of antenna elevation angle on pola-rimetric measurements (Adachi et al. 2013) is not considered in the evaluations. On the other hand, an altitude threshold was imposed to restrict sampling to only liquid hydrometeors below the bright band. In addition, a data mask was generated for each range profile of data based on the standard deviation of ΨDP (≤ 12°) over seven consecutive gates, ρHV (0) (≥ 0.85), and a signal to noise ratio (SNR ≥ 3 dB) to remove non-meteorological data prior to the calculations of theoretical ΦDP and running mean of observed ΨDP. In the evaluations, raindrop axes are assumed to be vertical because instruments that measure the canting angle of raindrops, such as 2DVD, were not available. The optical disdrometers used in this study to eval-uate radar estimations also assume vertical raindrop axes in retrieval of the rainfall rate. Data collected in winter of 2010 and summer of 2011 by the MACS-POL radar were used to evaluate the proposed method.
3.2 Autocalibration and retrievals of rain micro-physical parameters
The radar reflectivity field observed by the
MACS-POL radar at 0754 JST (Japan Standard Time: JST = UTC + 9 h) on December 3, 2010 indicates that a very heavy convective rain line was approaching the MRI site from the southwest with a speed of about 18 m s−1 (Fig. 3). The peak value of Z exceeded 50 dBZ, suggesting high convective activities of the clouds. Indeed, this rain line generated an F1 tornado as it propagated toward the MRI in the region indi-cated by the arrow in the figure about 25 min later (0820 JST). This figure shows that the rain line at this time passed over Sekiyado (SYD), where a Parsivel optical disdrometer (Löffler-Mang and Joss 2000) was installed. Thus, we explore radial profiles of the radar data at an azimuth of 279° in the experiments so that the radial profile extends toward the Sekiyado site, as shown in the figure by the thick line. Note that the Parsivel disdrometer measurements were not used as an external reference in the proposed method; rather, the data were used only for the evaluation, as shown later. Because of the heavy rain, ΨDP in this direction increased more than 120°, suggesting that very heavy attenuation in reflectivity was occurring.
Range profiles of observed ΨDP, running mean of observed ΨDP, theoretical ΦDP without attenua-tion correction procedures (original autocalibration), and theoretical ΦDP and KDP with attenuation correc-tion procedures (DSD auto-retrieval technique) are shown in Fig. 4. The initial differential phase for each profile was determined so that the theoretical value of ΦDP coincides with the running mean of the observed ΨDP at the first range resolution volume. The
Table 1. Operating characteristics of the MRI C-band polarimetric radar.
FrequencyOccupied band widthPeak powerDutyPulse length
Pulse compression Antenna diameterAntenna speedSignal minimumAntenna gain (H and V)Max cross-polar isolationBeam widthAzimuth spacingTransmitterNumber of linear samplingRange Gate SpacingPRFObservation parameters
5370 MHz< 4.5 MHz3.5 kW (for each channel, simultaneous transmission)20 % (Max)1 μs (range < 20 km) and 129 μs (≥ 20 km) for Elv. < 8°1 μs (range < 7.5 km) and 47 μs (≥ 7.5 km) for Elv. ≥ 8°Linear FM chirp for long-pulse observationsParabolic dish, Φ = 4 m4 rpm for Elv. < 8° and 6 rpm for Elv. ≥ 8° (10 rpm Max.)< –110 dBm> 42 dBi< –40 dB1.01°0.7°GaAs Power FET20 150 m624/780 Hz (Elv. < 8°) and 936/1170 Hz (Elv. ≥ 8°) ZH, ZV, ZDR, radial velocity, ρHV (0) and ΨDP

A. ADACHI et al.June 2015 367
backscatter differential phase δ is not considered in the theoretical ΦDP estimations because it may add a high-frequency fluctuation component that makes the range profile of ΦDP unnecessarily noisy. Instead, we applied a running mean to the observed ΨDP to miti-gate the high frequency fluctuations and retain the mean trend for ease of viewing. Note that this running mean applied to the observed ΨDP does not have any influence on the theoretical estimations of ΦDP. The values of measured Z were scaled so that the theoret-ical ΦDP fits the smoothed-observed ΨDP with range. On the other hand, we smoothed the measured ZH and ZV data before the calculation of theoretical ΦDP to mitigate statistical noise of ZDR, including local nega-
tive values (Fig. 6c), because as previously mentioned the proposed method is very sensitive to the bias of ZDR. We found that suppressing the standard devia-tion of the ZDR statistical fluctuations less than 0.2 dB is enough to stabilize the proposed method. In this experiment, we smoothed the ZH and ZDR values by applying a 3-km (= 20-gate) running mean. The running mean was made linearly, and not logarith-mically. The standard deviations of the ZDR in the running window at most of the range bins became less than 0.2 dB as a result of this smoothing. In addi-tion, the attenuation-corrected ZDR with a value of less than 0.1 dB including negative values is set to 0 dB in the attenuation correction procedures to stabilize the
Fig. 3. Radar reflectivity field of the MRI C-band polarimetric radar at an elevation angle of 1.0° at 0754 JST on December 3, 2010. The color scale represents radar reflectivity in dBZ. The thick line in the figure depicts the direction of the radial profiles analyzed in Figs. 4–7, and the open circles with a cross on the line indicate the locations of the Sekiyado (SYD) and Kumagaya (KMG) surface observation stations. The arrow indicates the location of an F1 tornado formed at 0820 JST. The white circular band at 19–20.5 km from the radar is a deficit region resulting from the alternation of short- and long-pulse observations.
Journal of the Meteorological Society of Japan Vol. 93, No. 3368
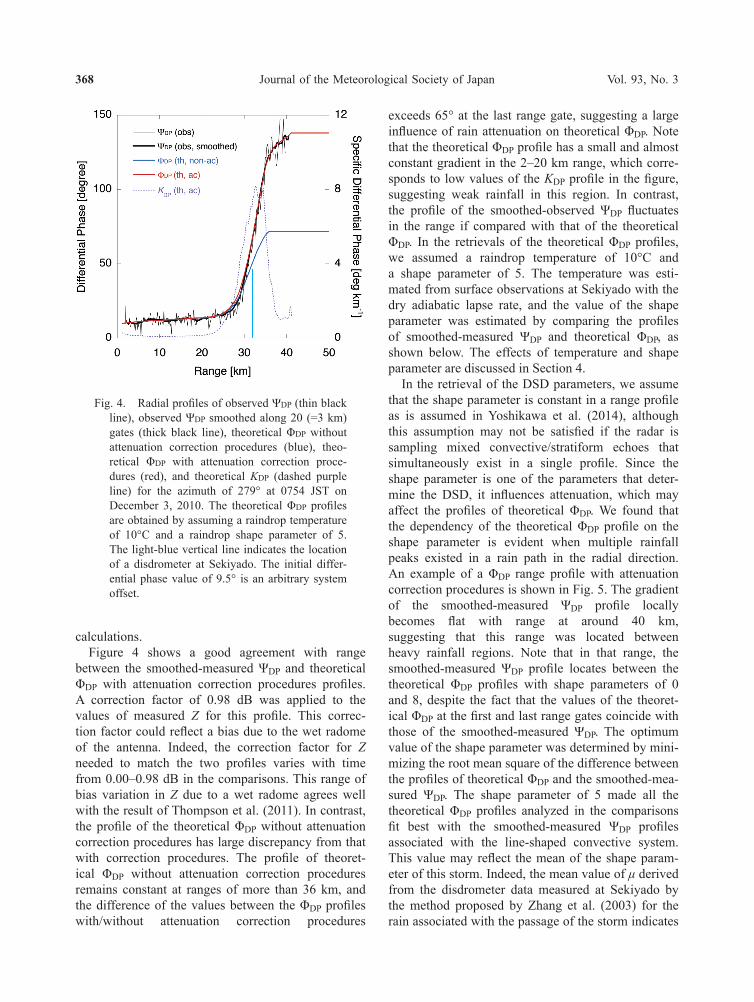
calculations.Figure 4 shows a good agreement with range
between the smoothed-measured ΨDP and theoretical ΦDP with attenuation correction procedures profiles. A correction factor of 0.98 dB was applied to the values of measured Z for this profile. This correc-tion factor could reflect a bias due to the wet radome of the antenna. Indeed, the correction factor for Z needed to match the two profiles varies with time from 0.00–0.98 dB in the comparisons. This range of bias variation in Z due to a wet radome agrees well with the result of Thompson et al. (2011). In contrast, the profile of the theoretical ΦDP without attenuation correction procedures has large discrepancy from that with correction procedures. The profile of theoret-ical ΦDP without attenuation correction procedures remains constant at ranges of more than 36 km, and the difference of the values between the ΦDP profiles with/without attenuation correction procedures
exceeds 65° at the last range gate, suggesting a large influence of rain attenuation on theoretical ΦDP. Note that the theoretical ΦDP profile has a small and almost constant gradient in the 2–20 km range, which corre-sponds to low values of the KDP profile in the figure, suggesting weak rainfall in this region. In contrast, the profile of the smoothed-observed ΨDP fluctuates in the range if compared with that of the theoretical ΦDP. In the retrievals of the theoretical ΦDP profiles, we assumed a raindrop temperature of 10°C and a shape parameter of 5. The temperature was esti-mated from surface observations at Sekiyado with the dry adiabatic lapse rate, and the value of the shape parameter was estimated by comparing the profiles of smoothed-measured ΨDP and theoretical ΦDP, as shown below. The effects of temperature and shape parameter are discussed in Section 4.
In the retrieval of the DSD parameters, we assume that the shape parameter is constant in a range profile as is assumed in Yoshikawa et al. (2014), although this assumption may not be satisfied if the radar is sampling mixed convective/stratiform echoes that simultaneously exist in a single profile. Since the shape parameter is one of the parameters that deter-mine the DSD, it influences attenuation, which may affect the profiles of theoretical ΦDP. We found that the dependency of the theoretical ΦDP profile on the shape parameter is evident when multiple rainfall peaks existed in a rain path in the radial direction. An example of a ΦDP range profile with attenuation correction procedures is shown in Fig. 5. The gradient of the smoothed-measured ΨDP profile locally becomes flat with range at around 40 km, suggesting that this range was located between heavy rainfall regions. Note that in that range, the smoothed-measured ΨDP profile locates between the theoretical ΦDP profiles with shape parameters of 0 and 8, despite the fact that the values of the theoret-ical ΦDP at the first and last range gates coincide with those of the smoothed-measured ΨDP. The optimum value of the shape parameter was determined by mini-mizing the root mean square of the difference between the profiles of theoretical ΦDP and the smoothed-mea-sured ΨDP. The shape parameter of 5 made all the theoretical ΦDP profiles analyzed in the comparisons fit best with the smoothed-measured ΨDP profiles associated with the line-shaped convective system. This value may reflect the mean of the shape param-eter of this storm. Indeed, the mean value of μ derived from the disdrometer data measured at Sekiyado by the method proposed by Zhang et al. (2003) for the rain associated with the passage of the storm indicates
Fig. 4. Radial profiles of observed ΨDP (thin black line), observed ΨDP smoothed along 20 (=3 km) gates (thick black line), theoretical ΦDP without attenuation correction procedures (blue), theo-retical ΦDP with attenuation correction proce-dures (red), and theoretical KDP (dashed purple line) for the azimuth of 279° at 0754 JST on December 3, 2010. The theoretical ΦDP profiles are obtained by assuming a raindrop temperature of 10°C and a raindrop shape parameter of 5. The light-blue vertical line indicates the location of a disdrometer at Sekiyado. The initial differ-ential phase value of 9.5° is an arbitrary system offset.

A. ADACHI et al.June 2015 369
almost the same value, as shown in Fig. 5. However, note that the shape parameter estimated with the disdrometer is an “effective μ” and the estimated value could be slightly higher than “true μ” because the small drop end is not well measured with a disdrometer of this type (e.g., Krajewski et al. 2006).
Profiles of the co-polar and differential specific attenuation, reflectivity, differential reflectivity, and median volume diameter analyzed at 0754 JST are shown in Fig. 6. The values of AH and ADP have their maximum peaks (Fig. 6a) in the range where the value of ΦDP monotonically increases with range (Fig. 4). The values of attenuation-cor-rected reflectivity (Fig. 6b) and differential reflec-tivity (Fig. 6c) were increased from the measured values, especially beyond 28 km in range where the gradient of ΦDP becomes steep, suggesting the exis-tence of heavy rainfalls with strong attenuation in that region as expected. Although the maximum
value of the measured ZH was greater than 50 dBZ, the values of ρHV (0) were ≥ 0.95 in the 4.5–34.5 km range (not shown), suggesting that no ice hydrome-teor was included in that range. In fact, the disdrom-eter at Sekiyado observed no ice hydrometeor during the passage of the storm. Note that the measured ZDR takes negative values beyond 36 km in range, beyond which the profile of theoretical ΦDP without the atten-uation correction procedures remains constant (Fig. 4). The median volume diameter D0 exceeds 2.5 mm in the range where the corrected reflectivity is quite high. These characteristics are consistent with the range profile of the rainfall rate estimated.
Profiles of the rainfall rate estimated with different methods are shown in Fig. 7. The first rainfall-rate profile was estimated using Eq. (A2) from the DSD obtained by attenuation-corrected ZH, ZDR, and theo-retical ΦDP with the proposed method. The drop terminal velocity proposed by Lhermitte (1990) is used in Eq. (A2), which is given as
v D D D( ) . ( exp( . . )),= × − − −9 23 1 0 068 0 4882 (18)
where D (mm) is the equivalent-volume diameter. The effect of air density on the raindrop fall speed (Foote and du Toit 1969) was not considered. The second rainfall-rate profile was estimated using an existing method based on Gorgucci et al. (1994) but with parameters proposed by Bringi and Chan-drasekar (2001) from the attenuation-corrected ZH and ZDR as
R Z Z Z Z( , ) . .. .H DR H
DR= × × −0 0058 100 91 0 209 (19)
The third rainfall-rate profile was obtained from KDP by the method proposed by Bringi and Chandrasekar (2001) as
R K Kf K( ) . ,
..
DPDP
DP= ×( ) =129 30 910 85
0 85 (20)
where f is the operating frequency in GHz (Table 1). Note that the coefficient is assumed to be constant in Eq. (20), although it should depend on the drop axis model and probability distribution function (PDF) of the median diameter. The KDP data are derived in the estimation process of theoretical ΦDP using the proposed method, as mentioned in Section 2.2. The fourth and fifth rainfall rate profiles were derived from uncorrected and attenuation-corrected observed ZH values by using the so-called R(ZH) relation with the coefficients of Marshall et al. (1952) and/or Marshall et al. (1955), which has operationally been used in
Fig. 5. Radial profiles of observed ΨDP (thin black line), observed ΨDP smoothed along 20 gates (thick black line), and attenuation-corrected theo-retical ΦDP with the shape parameters of 0 (light-blue) and 8 (red) for the azimuth of 279° at 0737 JST on December 3, 2010. The blue vertical line indicates the location of a disdrometer at Seki-yado. The mean, standard deviation, and number of samples of the shape parameter derived from the disdrometer data measured on the ground from 0645 to 0810 JST on December 3, 2010 are summarized in the table at the bottom right.

Journal of the Meteorological Society of Japan Vol. 93, No. 3370
many countries (e.g., Makihara 1996; Figueras i Ventura et al. 2012), given by
R Z Z( ) ( . ) ..H H= ×0 00511 6 (21)
Figure 7 clearly shows that the rainfall rate retrieved by the proposed method is consistent with that
derived with the existing methods of rainfall esti-mation. The figure also indicates, as expected, that R(ZH) has a tendency to underestimate, even with attenuation-corrected reflectivity, especially in heavy rain regions, if compared with those derived by the proposed method. However, validation is needed to verify the reliability of the method, although the fact
Fig. 6. Radial profiles of (a) specific attenuation AH (thin line) and specific differential attenuation ADP (thick line), (b) observed reflectivity factor ΖH (thin line), bias-corrected observed reflectivity smoothed along the radial (thick dashed line), and attenuation-corrected reflectivity (thick line), (c) observed differential reflectivity ΖDR (thin line), observed differential reflectivity smoothed along the radial (dashed thick line), and attenuation-corrected differential reflectivity (thick line), and (d) estimated median volume diameter D0 all for the azimuth of 279° at 0754 JST on December 3, 2010. The dashed thin vertical line in each panel indicates the location of a disdrometer at Sekiyado, located 32 km from the MRI site.

A. ADACHI et al.June 2015 371
that the theoretical ΦDP profiles fit the smoothed-mea-sured ΨDP (Fig. 4) suggests that the microphysical characteristics of rain could be well simulated by the proposed method.
3.3 Comparison of the retrieved microphysical parameters of raindrops with disdrometer measurements
To evaluate the reliability of the rain microphys-ical parameters including the rainfall rate retrieved with the proposed DSD auto-retrieval technique, we compared the parameters obtained with those derived from the Parsivel disdrometer measurements at Seki-yado, which is located about 31.8 km west–northwest of the MRI site (Fig. 3). Since this type of disdrometer has been reported to have an overestimation tendency, especially in heavy (e.g., R > 30 mm h−1) rainfall (e.g., Thurai et al. 2011; Tokay et al. 2013), we reprocessed and applied a quality control to the disdrometer data (see Appendix A of Adachi et al. (2013) for the detail)
before the comparisons. The comparisons were made using the data recorded on December 3, 2010. The radar-estimated microphysical parameters available for the single point nearest the Sekiyado station were used for the comparisons. In the comparisons, the differ-ence in observational heights (the radar beam center observed precipitation about 400 m above the Seki-yado station) is not considered.
Figure 8 shows the time series of (a) rainfall rate, (b) reflectivity, (c) differential reflectivity, (d) median volume diameter, (e) normalized number concen-tration, and (f) rainwater content derived from the Parsivel and the radar observations at Sekiyado. The thin line shows the 1-min mean data observed with the Parsivel, and the marks in each panel and the dashed line in Fig. 8a indicate the corresponding data estimated every 4 min from the radar data. The time series of the rainfall rate (Fig. 8a) clearly shows that the proposed method R(ZH, ZDR, ΦDP) is comparable with both R(ZH, ZDR) and R(KDP) and outperforms R(Zobs), particularly in heavy rainfall. The reflec-tivity and differential reflectivity data (Figs. 8b, c) show that the observed data have an underestima-tion tendency, whereas the attenuation-corrected data agree fairly well with the disdrometer estima-tions, particularly in the second half of the compar-ison period, despite the large variations in short time. In the comparison of median diameter (Fig. 8d), we plotted an estimation of the median diameter from the relation proposed by Bringi et al. (2006) as a refer-ence in addition to those derived with the proposed method. This figure clearly shows that the latter has almost the same performance as the former, although the latter is estimated from the attenuation-corrected ZDR retrieved with the proposed method. Note that discrepancies in the first half of the comparison period for both estimation methods are a bit larger than those in the second half of the period, which is consistent with the characteristics of the reflectivity and differ-ential reflectivity data (Figs. 8b, c). The intercept parameters in Fig. 8e were derived with the proposed method and with the empirical method proposed by Thurai et al. (2012). The intercept parameters esti-mated from both methods take reasonable values compared with the disdrometer measurements, espe-cially in the second half of the comparison period. The underestimation tendency in the first half of the period for the proposed method could reflect discrep-ancies of the estimated median diameter in the same period (Fig. 8d). In contrast, rainwater contents esti-mated from both the proposed method and the method introduced by Bringi and Chandrasekar (2001) match
Fig. 7. Radial profiles of the rainfall rate estimated from attenuation-corrected ZH, ZDR, and theo-retical ΦDP (thick line), from attenuation-cor-rected ZH and ZDR (thin line) using the study by Gorgucci (1994), from KDP derived from theoretical ΦDP (dashed thin line), from observed ZH with attenuation corrections (dashed thick line), and from observed ZH without attenuation corrections (dashed-dotted line) for the azimuth of 279° at 0754 JST on December 3, 2010. The thin dashed vertical line indicates the location of a disdrometer.

Journal of the Meteorological Society of Japan Vol. 93, No. 3372
Fig. 8. Time series of (a) rainfall rates, (b) horizontal reflectivities, (c) differential reflectivities, (d) median volume diameters, (e) normalized intercept parameters, and (f) rainwater contents derived from disdrometer measure-ments (thin line) and estimated from polarimetric radar data (circles) at the Sekiyado station from 0645 to 0815 JST on December 3, 2010. R(ZH, ZDR) in (a) was estimated using the results of Gorgucci (1994); D0 (ZDR) in (d) was derived using the results of Bringi et al. (2006); Nw (ZH, D0) in (e) was derived using the results of Thurai et al. (2012); and W(ZH, ZDR) in (f) was estimated using the results of Bringi and Chandrasekar (2001).

A. ADACHI et al.June 2015 373
well with the data derived from the disdrometer measurements (Fig. 8f).
Although the comparisons show that the parameters derived with the proposed method are consistent with several existing methods and generally have good agreement with measurements on the ground, the number of data seems too small to acquire statistical results that show the reliability of this method. This limitation occurred because the observation period for the disdrometer was limited to about 1 h as the prop-agation speed of the line-shaped convective system was very fast. We next analyze rainfall data with a longer period associated with a typhoon to statistically explore the reliability of the proposed method.
3.4 Evaluation of retrieved rainfall rates during the passage of a typhoon
Typhoon Roke passed across the Kanto Plain, on which the MRI is located, in September 2011. The typhoon made landfall at 1400 JST on September 21, 2011 in Hamamatsu, about 270 km west–southwest of MRI, with a pressure as low as 949 hPa at mean sea level (MSL). Precipitation including heavy rainfalls due to spiral rain bands associated with the typhoon was observed in the Kanto Plain and may have caused significant rain attenuation for the radars operating at C-band or higher frequencies. The MACS-POL radar observations indicate that the center of Roke was located within only 10 km northwest of the Sekiyado (SYD) station at 1820 JST. Rainfall associated with the typhoon continued for about 10 h at the Sekiyado site, which may be long enough for the comparison to provide statistical results and evaluate the reliability of the proposed method. In this comparison, however, we did not use the Parsivel measurements at the Seki-yado station because Parsivel was not deployed with other rain gauges as suggested by Friedrich et al. (2013) to qualify the Parsivel measurements in strong winds. Thus, we used the Parsivel measurements at the Kumagaya (KMG) station located about 67.9 km west–northwest of the MRI site (Fig. 3), where a weighing (Pluvio2) precipitation gauge (Nemeth 2008) and an operational tipping-bucket rain gauge were colocated. The time and rain amount resolutions of the tipping-bucket rain gauge (Pluvio) were 10 min (1 min) and 0.5 mm (0.03 mm), respectively. The total rainfall amount measured with the Pluvio (84 mm) at the Kumagaya site during the evaluation period agreed well with that measured with the operational rain gauge (87 mm) despite strong winds associated with the typhoon. The Kumagaya station recorded the highest wind speed of 21.2 m s−1 at 1730 JST and the
lowest pressure of 972.8 hPa MSL at 1819 JST.
a. Time series analysisComparisons were made using data recorded
from 1000 to 2000 JST on September 21, 2011. The radar-estimated rainfall-rate data available for the single point nearest the Kumagaya station were used for the comparisons. In this evaluation, the range profiles of ZH and ZDR were smoothed by applying a 1.5-km (= 10-gate) running mean filter before obtaining theoretical ΦDP profiles to suppress the standard deviation of the ZDR statistical fluctuations less than 0.2 dB in the running window at most of the range bins. In the retrievals, a value of the shape parameter of 0–3 best fit the theoretical ΦDP profiles with those of smoothed-observed ΨDP in the compar-ison period. Indeed, the values of the mean and stan-dard deviation of the shape parameter derived from the disdrometer measurements for rainfall rates exceeding 10 mm h−1 in the period of 1000–2000 JST were 1.8 ± 3.1. A raindrop temperature of 20°C was estimated from the surface observations with the dry adiabatic lapse rate and was used in the retrievals. The deficit region resulting from the alternation of short- and long-pulse observations, seen in Fig. 3, was removed and filled with observation data in the profiles used in this evaluation because a radar system adjustment was applied in August 2011. The type of precipitation was determined from wind profiler measurements at Kumagaya, which was a part of the WInd profiler Network and Data Acquisition System (WINDAS; Ishihara et al. 2006), using the method proposed by Williams et al. (1995).
Time series of (a) rainfall rate, (b) reflectivity, (c) differential reflectivity, (d) median volume diameter, (e) normalized number concentration, and (f) rain-water content derived from the ground measurements and the radar observations at Kumagaya appear in Fig. 9. This figure corresponds to Fig. 8 except that it is for the typhoon and that Pluvio measurements instead of Parsivel measurments were used for the rainfall rate in Fig. 9a. The thin line in each panel shows the 1-min mean rain parameter obtained by the surface observations, and the closed circles indicate the radar estimates with the proposed method every 4 min. This figure shows that the radar estimations by the proposed method generally agree well with the surface measurements of both rainfall rate (Fig. 9a) and rain microphysical parameters (Figs. 9b–d, f), except NW despite several abrupt variations of the rainfall rate and type of precipitation in the time asso-ciated with the passage of rain bands of the typhoon.

Journal of the Meteorological Society of Japan Vol. 93, No. 3374
Fig. 9. Time series of (a) rainfall rates, (b) horizontal reflectivities, (c) differential reflectivities, (d) median volume diameters, (e) normalized intercept parameters, and (f) rainwater contents derived from surface measurements (thin line) and estimated from polarimetric radar data (circles) at the Kumataga station from 1000 to 2000 JST on September 21, 2011. The dashed and thick lines at the bottom of each panel denote the first (P1) and second (P2) periods of bias with high winds from 1644 to 1732 JST and from 1733 to 1820 JST, respectively. The black (white) thick line at the bottom of (a) represents the period of convective (stratiform) rain.
A. ADACHI et al.June 2015 375
The discrepancy of the normalized number concentra-tion in Fig. 9e is slightly distinct, as in Fig. 8e. This could be attributable to the fact that the estimation of NW from radar measurements is difficult, as indi-cated by Kalogiros et al. (2013). This is because for a given W, the NW varies as D0 4− , as given by Eq. (A9), and a small error in D0 gets amplified. On the other hand, the radar estimates without attenuation correc-tion, indicated by the open circles in Figs. 9a–c, have distinct underestimation tendencies. Indeed, Fig. 9a clearly shows that the proposed method outperforms R(Zobs), particularly in heavy rainfall, as in Fig. 8a. However, the reliability of the proposed method is a bit more complicated in specific short periods.
The reflectivity data retrieved with the proposed method (Fig. 9b) show a clear underestimation tendency of up to 5 dB from 1644 to 1820 JST, which could correspond to a 50 % decrease in the rainfall rate. The discrepancy in this time period is also clear in the median volume diameter measurements (Fig. 9d). We divided the duration of this discrepancy into two periods, from 1644 to 1730 JST (P1) and from 1730 to 1820 JST (P2), because the factors that caused the discrepancies in the two periods may be different. In fact, the negative bias of Z in the first period (Fig. 9b) does not affect the rainfall rate (Fig. 9a); rather, the rainfall rate estimated with the proposed method in P1 agrees well with that of the surface observation rather than that with the underestimation of 50 % as expected. In contrast, the negative bias of the rain-fall rate retrieved with the proposed method in P2 is distinct. Because the surface rainfall measurements were not from the Parsivel disdrometer but from the weighing rain gage (Pluvio), the bias shown in P1 in the rain microphysical parameters (Figs. 9b–f) could be attributable to not unreliability of the proposed method but the errors of Parsivel measurements due to sustained strong winds, as shown in Appendix B. On the contrary, in P2, because the radar estimated rain-fall rates have large bias, other microphysical param-eters of raindrops retrieved with the proposed method in this period could also be unreliable. The discrep-ancy in P2 may be attributable to the wet radome being coated inhomogeneously with rainwater due to high winds, as discussed in Appendix C.
b. Statistical resultsScatter diagrams comparing the Pluvio rainfall rate
with those estimated from the radar observations are shown in Fig. 10. The statistics for the sample rain-fall rate shown in Fig. 10 are given in Table 2, along with the corresponding statistics for the data with
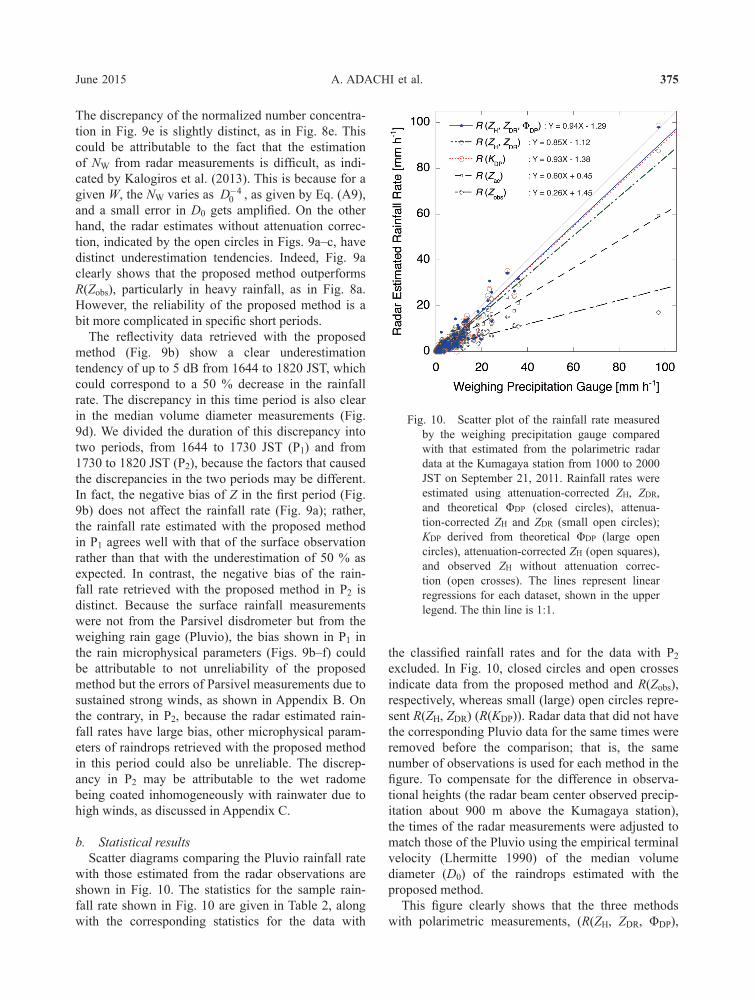
the classified rainfall rates and for the data with P2 excluded. In Fig. 10, closed circles and open crosses indicate data from the proposed method and R(Zobs), respectively, whereas small (large) open circles repre-sent R(ZH, ZDR) (R(KDP)). Radar data that did not have the corresponding Pluvio data for the same times were removed before the comparison; that is, the same number of observations is used for each method in the figure. To compensate for the difference in observa-tional heights (the radar beam center observed precip-itation about 900 m above the Kumagaya station), the times of the radar measurements were adjusted to match those of the Pluvio using the empirical terminal velocity (Lhermitte 1990) of the median volume diameter (D0) of the raindrops estimated with the proposed method.
This figure clearly shows that the three methods with polarimetric measurements, (R(ZH, ZDR, ΦDP),
Fig. 10. Scatter plot of the rainfall rate measured by the weighing precipitation gauge compared with that estimated from the polarimetric radar data at the Kumagaya station from 1000 to 2000 JST on September 21, 2011. Rainfall rates were estimated using attenuation-corrected ZH, ZDR, and theoretical ΦDP (closed circles), attenua-tion-corrected ZH and ZDR (small open circles); KDP derived from theoretical ΦDP (large open circles), attenuation-corrected ZH (open squares), and observed ZH without attenuation correc-tion (open crosses). The lines represent linear regressions for each dataset, shown in the upper legend. The thin line is 1:1.
Journal of the Meteorological Society of Japan Vol. 93, No. 3376
R(ZH, ZDR), and R(KDP)), in the retrieval of rainfall rates outperform R(ZH) and are particularly reliable in heavy rain, which is reflected in the linear regressions for the data. The linear regression for the proposed method is close to that of R(KDP) and is almost on the 1:1 line, despite the difference in observational space and averaging time between the two measurements, whereas the linear regression for R(ZH, ZDR) indicates a slight tendency to underestimate. In contrast, the linear regression for R(Zobs) shows an underestima-tion tendency of more than 70 %. These differences are reflected in the statistics for the radar rainfall esti-mates versus the Pluvio measurements in Table 2.
We computed several statistics to explore the rela-tion between the rainfall rate measurements of the weighing precipitation gauge, Pluvio (Wi), and the
rainfall rate estimations from the radar observations (Ri). The statistics are based on the difference between the two platforms, Di = Ri − Wi. For the rainfall rate retrievals from the radar observations, we used the rate determined by R(ZH, ZDR, ΦDP), R(ZH, ZDR), R(KDP), R(Zac), and R(Zobs). The bias (systematic error) of the rainfall rate is
µD i ii
N
ii
N
N R W N D= − == =∑ ∑1 11 1( ) , (22)
and the standard deviation (precision) is
σ µD i Di
N
N R= −
=∑1 2
1
12
( ) , (23)
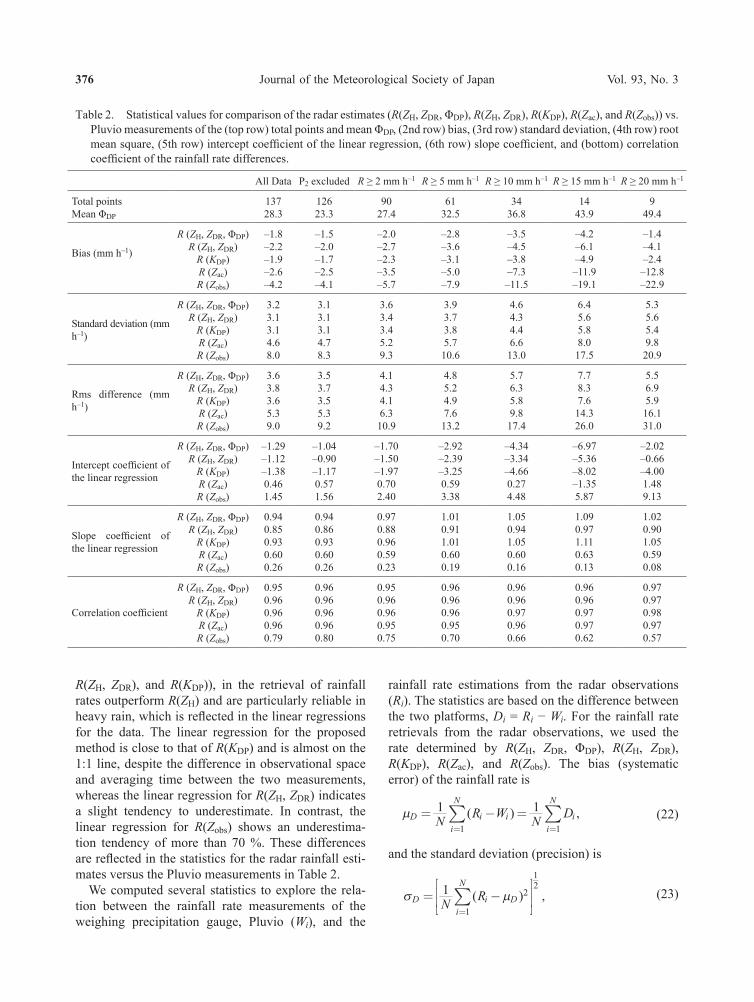
Table 2. Statistical values for comparison of the radar estimates (R(ZH, ZDR, ΦDP), R(ZH, ZDR), R(KDP), R(Zac), and R(Zobs)) vs. Pluvio measurements of the (top row) total points and mean ΦDP, (2nd row) bias, (3rd row) standard deviation, (4th row) root mean square, (5th row) intercept coefficient of the linear regression, (6th row) slope coefficient, and (bottom) correlation coefficient of the rainfall rate differences.
All Data P2 excluded R ≥ 2 mm h–1 R ≥ 5 mm h–1 R ≥ 10 mm h–1 R ≥ 15 mm h–1 R ≥ 20 mm h–1
Total pointsMean ΦDP
13728.3
12623.3
9027.4
6132.5
3436.8
1443.9
949.4
Bias (mm h–1)
R (ZH, ZDR, ΦDP)R (ZH, ZDR)
R (KDP)R (Zac)R (Zobs)
–1.8–2.2–1.9–2.6–4.2
–1.5–2.0–1.7–2.5–4.1
–2.0–2.7–2.3–3.5–5.7
–2.8–3.6–3.1–5.0–7.9
–3.5–4.5–3.8–7.3–11.5
–4.2–6.1–4.9–11.9–19.1
–1.4–4.1–2.4–12.8–22.9
Standard deviation (mm h–1)
R (ZH, ZDR, ΦDP)R (ZH, ZDR)
R (KDP)R (Zac)R (Zobs)
3.23.13.14.68.0
3.13.13.14.78.3
3.63.43.45.29.3
3.93.73.85.710.6
4.64.34.46.613.0
6.45.65.88.017.5
5.35.65.49.820.9
Rms difference (mm h–1)
R (ZH, ZDR, ΦDP)R (ZH, ZDR)
R (KDP)R (Zac)R (Zobs)
3.63.83.65.39.0
3.53.73.55.39.2
4.14.34.16.310.9
4.85.24.97.613.2
5.76.35.89.817.4
7.78.37.614.326.0
5.56.95.916.131.0
Intercept coefficient of the linear regression
R (ZH, ZDR, ΦDP)R (ZH, ZDR)
R (KDP)R (Zac)R (Zobs)
–1.29–1.12–1.380.461.45
–1.04–0.90–1.170.571.56
–1.70–1.50–1.970.702.40
–2.92–2.39–3.250.593.38
–4.34–3.34–4.660.274.48
–6.97–5.36–8.02–1.355.87
–2.02–0.66–4.001.489.13
Slope coefficient of the linear regression
R (ZH, ZDR, ΦDP)R (ZH, ZDR)
R (KDP)R (Zac)R (Zobs)
0.940.850.930.600.26
0.940.860.930.600.26
0.970.880.960.590.23
1.010.911.010.600.19
1.050.941.050.600.16
1.090.971.110.630.13
1.020.901.050.590.08
Correlation coefficient
R (ZH, ZDR, ΦDP)R (ZH, ZDR)
R (KDP)R (Zac)R (Zobs)
0.950.960.960.960.79
0.960.960.960.960.80
0.950.960.960.950.75
0.960.960.960.950.70
0.960.960.970.960.66
0.960.960.970.970.62
0.970.970.980.970.57

A. ADACHI et al.June 2015 377
where N is the number of observations. We also calcu-lated the root mean square of the rainfall rate differ-ences as follows:
rms=
=∑1 2
1
12
N Dii
N. (24)
In addition to the statistics above, we also derived coefficients of the linear regression and correlation between the derived rainfall rates with the two plat-forms. The statistics for the sample rainfall rates are given in Table 2, along with the corresponding statis-tics for the data estimated from the radar measure-ments for different algorithms and thresholds. Rain-fall rates measured with Pluvio are used for the rain-fall rate classifications with a threshold value. Note that the statistics in Table 2 are conditional because rainfall rates estimated by radar that are less than the threshold value can be included in the statistical values. All the data except those in P2 are also consid-ered in the classifications as a reference. Note that the minimum detectable rainfall rate with Pluvio was 1.8 mm h−1, but all the data in the comparison period were considered. However, Pluvio data that did not have corresponding radar data for the same time were removed before the comparison.
All the statistical data show that R(Zobs) has the lowest reliability of the five rainfall retrieval algo-rithms as expected. Indeed, it has the worst bias, standard deviation, root mean square, and coeffi-cients of liner regression and correlation among the methods. In addition, the statistical data for R(Zobs) became worse with the threshold of the rainfall rate. This is likely because the effect of attenuation by precipitation increases with the rainfall rate, which is supported by an increase of mean ΦDP with the threshold of the rainfall rate. Although it has better reliability than R(Zobs), R(Zac) still has an underesti-mation tendency. This could reflect the fact that the exact rainfall rate cannot be determined only from reflectivity. On the other hand, slope coefficients and correlation coefficients for the three methods with polarimetric measurements are close to unity and almost independent of the threshold of the rain-fall rate, although the slope coefficient for R(ZH, ZDR) indicates a slight tendency to underestimate.
Both the standard deviation and root mean square difference of the three methods with polarimetric measurements tend to increase with the threshold of the rainfall rate. The reason for these increases may include the decrease in sample number with the rain-
fall rate. The standard deviations for these methods in the same threshold of the rainfall rate are very similar. However, rainfall rates measured with the proposed method always has the smallest bias among the three, and has a comparable root mean square of difference with R(KDP), which is smaller than R(ZH, ZDR). These results may reflect the characteristics of the slope coefficients. Note that the bias of R(KDP) does not increase when the threshold is decreased, contrary to the results of Chandrasekar et al. (1990). This could be because the KDP data used to estimate the rainfall rate in the present study is not derived by differentiating the smoothed-observed ΨDP profile but is estimated from both ZH and ZDR by the proposed method, and the latter is less noisy even in weak rain regions, as shown in Fig. 4.
The exact reliability of the proposed method could be better than the statistical results shown here. This is because the time adjustment may not be enough to compensate well for the difference in observation height, and because the effect of horizontal winds that cause ground-level droplet deposition to be displaced from the elevated radar resolution cell loca-tion (Doviak and Zrnić 1993) in addition to the differ-ence in observational space and averaging time of the two data sets is not considered in the results. Indeed, Ciach and Krajewski (1999) indicated that the spatial characteristics of rainfall can directly impact the area–point differences synthetically. However, these results provide confidence that the proposed method is suitable for estimating rainfall rates and microphysical parameters of raindrops even in heavy rain since this method retrieves the former by estimating the latter. Because both raindrop temperature and shape param-eter are assumed to be constant for the theoretical retrieval of ΦDP in each range profile, we focus on the effects of the temperature and shape parameter on the rainfall rate estimation in the following section.
4. Discussion
As reported above, we found many instances wherein the proposed method is reliable in even heavy rainfall where large attenuation is expected as proved, for instance, by the statistics derived from the comparison with the Pluvio measurements. In the estimation of rainfall rates, we assumed constant raindrop temperature and shape parameter in each retrieval of the theoretical ΦDP profile. However, both these parameters should vary with range in the actual profile. In this section, we separately examine the effects of raindrop temperature and the shape parameter on the retrieval of the rainfall rate.

Journal of the Meteorological Society of Japan Vol. 93, No. 3378
We use the profile for the line-shaped convective system described in Section 3 rather than that for the typhoon because the former is much simpler, which makes it easier to evaluate the effects.
4.1 Effect of raindrop temperature on retrieval of the rainfall rate
As described in Section 2, the consistency curves are temperature dependent, as shown in Figs. 1 and 2. In the retrieval of rainfall rates with the proposed method, we estimated the raindrop temperature from surface observations and observational heights of the radar beam center based on the assumption that the raindrop temperature is equal to the atmospheric temperature at the same altitude. In the case of the line-shaped convective system observed on December 3, 2010, described in Section 3.2, the temperature was set to 10°C. To diagnose the temperature dependency of the consistency method, we use the profile of rain-fall rates retrieved with the proposed method at 0754 JST (Fig. 7) as a reference and compare it with those retrieved with temperatures of 0°C and 20°C. Note that we assume in the retrieval that the value of the shape parameter for each profile is 5, as in Section 3.2, and that raindrops are liquid even at 0°C.
Scatter diagrams comparing the rainfall rate with a raindrop temperature of 10°C with those of 0°C and 20°C along with corresponding statistics for the data are shown in Fig. 11. The closed and open circles indicate retrieved data assuming temperatures of 0°C and 20°C, respectively. The number of observa-tions for each temperature is equal in the figure. The figure shows that the rainfall rate data with raindrop temperatures of 0°C and 20°C generally agree well with those of 10°C. Both the gradients and correlation coefficients for 0°C and 20°C are close to unity, mean biases are less than 2 mm h−1, and standard devia-tions are about 3 mm h−1. These values are surpris-ingly small when compared with the maximum rain-fall rate (~130 mm h−1) included in the profile. The results suggest that the rainfall rate retrieved with the proposed method is not very sensitive to the rain-drop temperature. This result is promising because it means that the assumption of the constant raindrop temperature in each range profile may be reasonable as long as the elevation angle is small, and that the atmospheric temperature may be used as the raindrop temperature in the retrieval.
4.2 Effect of shape parameter on the retrieval of the rainfall rate
Illingworth and Blackman (2002) demonstrated
that the consistency relation was virtually indepen-dent of variations in μ, as shown in Fig. 1. In contrast, our results indicate that the co-polar and differential specific attenuation have shape parameter dependency (Fig. 2). Although the dependency is relatively small, particularly at C-band, the attenuation effects may not be negligible, as mentioned in Section 2, resulting in large differences in both DSD estimation and retrieval of the rainfall rate. To explore the dependency of the proposed method on the shape parameter, we use the rainfall-rate profile retrieved at 0754 JST with a shape parameter of 5 as a reference (Fig. 7) and compare it with those retrieved with shape parameters of 0, 3, and 7. The last two values correspond to the referenced shape parameter of 5 ± σ, where σ is the measured standard deviation of the parameter (Fig. 5). In the retrievals, we assume a raindrop temperature of 10°C for each profile, as in Section 3.2.
Scatter diagrams comparing the rainfall rate derived
Fig. 11. Scatter plot of the rainfall rate estimated with a raindrop temperature of 10°C compared with those estimated with raindrop temperatures of 0°C and 20°C for the azimuth of 279° in the range of 20–40 km at 0754 JST on December 3, 2010. Rainfall rates with the raindrop tempera-ture of 0°C (20°C) are plotted as closed (open) circles. The shape parameter of 5 is used for each estimation. The lines represent linear regressions for each temperature dataset, as shown in the bottom legend along with correlation coeffi-cients, biases, standard deviations, and numbers of samples.

A. ADACHI et al.June 2015 379
with the shape parameter of 5 with those of 0, 3, and 7 along with corresponding linear regressions through the origin for the data are shown in Fig. 12. The large and small open circles indicate data with the shape parameters of 7 and 3, whereas closed circles and open crosses represent data with the shape parameter of 0 in the range of less than 33 km and equal to or more than 33 km, where the heaviest rainfall rate was analyzed (Fig. 7), respectively. The number of obser-vations is equal for each shape parameter in the figure. This figure shows that the proposed method with the shape parameter of 3 or 7 estimates the rainfall rate accurate to 10 %, compared with that estimated with the shape parameter of 5. However, the accuracy is quite low for the retrieval with the shape parameter of 0. Note that the accuracy (~66 %) behind the heavy rain peak (further than 33 km from the radar site) is much worse than that ahead of it (~38 %). This result suggests that the bias of the rainfall rate by the shape parameter is attributable to rain attenuation because the error is larger behind the heavy rainfall through which heavy attenuation is expected. To further examine the effect of the attenuation on the retrieval rainfall rate, we next explore the dependency of the co-polar and differential specific attenuation on the shape parameter.
Scatter diagrams comparing specific attenuation and specific differential attenuation estimated with the shape parameter of 5 with those estimated with the shape parameters of 0, 3, and 7 are shown in Figs. 13a and 13b, respectively. The large and small open circles indicate data with the shape parame-ters of 7 and 3, whereas the closed circles and open crosses represent data with the shape parameter of 0 in the range of less than 33 km and equal to or more than 33 km, respectively. The number of observations is equal for each shape parameter in the figure. This figure shows that the sensitivities of AH and ADP to the shape parameter are not very large as long as the shape parameter is obtained with an accuracy of 2 as expected. However, the behaviors of AH and ADP with the shape parameter of 0 are quite different. Although the discrepancy of AH with the shape parameter of 0 is comparable with those with the shape parameter of 3 in the range of up to 30 km where very heavy rainfall rate (> 100 mm h−1) was retrieved (Fig. 7), it becomes large behind it. In contrast, the discrepancy of ADP is large ahead of the heavy rain but comparable with those with the shape parameter of 3 in the range behind it. A detailed analysis of the behavior differ-ence between AH and ADP is beyond the scope of this study; however, these discrepancies could be respon-
sible for large error in the retrieval of the rainfall rate by the proposed method when using an inappropriate shape parameter.
5. Conclusions
We developed an algorithm for rain attenuation correction of the reflectivity factor and differential reflectivity measured by polarimetric radar at atten-uating frequency to retrieve DSD parameters and the rainfall rate. The algorithm presented in this study was developed based on the self-consistency prin-ciple, describing the interrelation between polari-metric measurements along the range profile. It does not require any assumptions of relation among DSD parameters and/or simplifications of relation between the axis ratio and diameter of raindrops, which were used in previous studies. Moreover, the proposed algorithm needs no external reference data, such
Fig. 12. Scatter plot of the rainfall rate estimated with a shape parameter of 5 compared with those estimated with shape parameters of 0, 3, and 7 for the azimuth of 279° in the range from 20 to 40 km at 0754 JST on December 3, 2010. Rain-fall rates derived with the shape parameters of 3 and 7 are plotted as small and large open circles, respectively, whereas rainfall data estimated with the shape parameter of 0 in the range less than (equal to or larger than) 33 km are plotted as small closed circles (open crosses). The lines represent regressions through the origin for each dataset, shown in the bottom legend. The dotted and dashed line is 1:1.
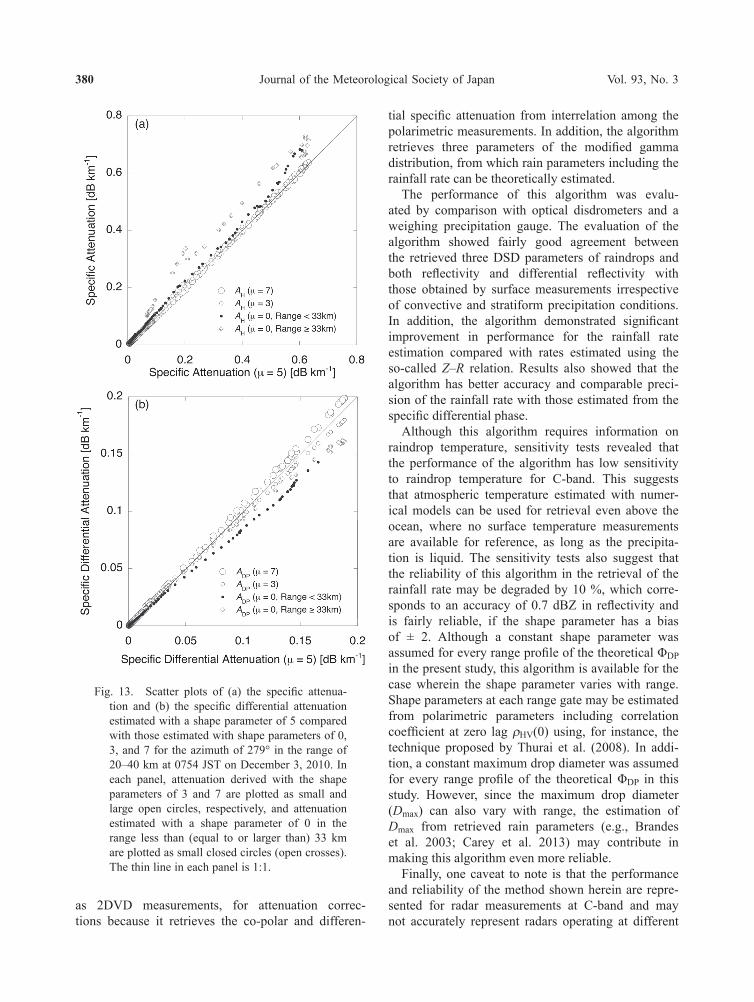
Journal of the Meteorological Society of Japan Vol. 93, No. 3380
as 2DVD measurements, for attenuation correc-tions because it retrieves the co-polar and differen-
tial specific attenuation from interrelation among the polarimetric measurements. In addition, the algorithm retrieves three parameters of the modified gamma distribution, from which rain parameters including the rainfall rate can be theoretically estimated.
The performance of this algorithm was evalu-ated by comparison with optical disdrometers and a weighing precipitation gauge. The evaluation of the algorithm showed fairly good agreement between the retrieved three DSD parameters of raindrops and both reflectivity and differential reflectivity with those obtained by surface measurements irrespective of convective and stratiform precipitation conditions. In addition, the algorithm demonstrated significant improvement in performance for the rainfall rate estimation compared with rates estimated using the so-called Z–R relation. Results also showed that the algorithm has better accuracy and comparable preci-sion of the rainfall rate with those estimated from the specific differential phase.
Although this algorithm requires information on raindrop temperature, sensitivity tests revealed that the performance of the algorithm has low sensitivity to raindrop temperature for C-band. This suggests that atmospheric temperature estimated with numer-ical models can be used for retrieval even above the ocean, where no surface temperature measurements are available for reference, as long as the precipita-tion is liquid. The sensitivity tests also suggest that the reliability of this algorithm in the retrieval of the rainfall rate may be degraded by 10 %, which corre-sponds to an accuracy of 0.7 dBZ in reflectivity and is fairly reliable, if the shape parameter has a bias of ± 2. Although a constant shape parameter was assumed for every range profile of the theoretical ΦDP in the present study, this algorithm is available for the case wherein the shape parameter varies with range. Shape parameters at each range gate may be estimated from polarimetric parameters including correlation coefficient at zero lag ρHV(0) using, for instance, the technique proposed by Thurai et al. (2008). In addi-tion, a constant maximum drop diameter was assumed for every range profile of the theoretical ΦDP in this study. However, since the maximum drop diameter (Dmax) can also vary with range, the estimation of Dmax from retrieved rain parameters (e.g., Brandes et al. 2003; Carey et al. 2013) may contribute in making this algorithm even more reliable.
Finally, one caveat to note is that the performance and reliability of the method shown herein are repre-sented for radar measurements at C-band and may not accurately represent radars operating at different
Fig. 13. Scatter plots of (a) the specific attenua-tion and (b) the specific differential attenuation estimated with a shape parameter of 5 compared with those estimated with shape parameters of 0, 3, and 7 for the azimuth of 279° in the range of 20–40 km at 0754 JST on December 3, 2010. In each panel, attenuation derived with the shape parameters of 3 and 7 are plotted as small and large open circles, respectively, and attenuation estimated with a shape parameter of 0 in the range less than (equal to or larger than) 33 km are plotted as small closed circles (open crosses). The thin line in each panel is 1:1.

A. ADACHI et al.June 2015 381
frequencies, although the theory is applicable to the radars operating at different frequencies. Indeed, we have already confirmed that the proposed method is applicable for X-band radars (Adachi et al. 2014). However, the consistency curves for KDP/Z, AH/Z, and ADP/Z for X-band in Figs. 1 and 2 show that these are more sensitive to raindrop temperature and the shape parameter than those for C-band. Estimations of the shape parameter and raindrop temperature with more accuracy and precision may be needed for X-band radars to achieve comparable reliability with C-band radars using this method.
Note also that this algorithm is available for only pure rain. Contamination by ice hydrometeors, including hail and/or graupel, irrespective of dry or wet conditions along a rain path in a radial direc-tion, may result in large errors in the retrievals of rain parameters with the proposed algorithm. However, contamination other than that from pure rain including ground clutter and/or partial beam blockage in a radial direction can be identified and discarded by this method because it causes a large discrepancy of the theoretical ΦDP profile from the smoothed-ob-served ΨDP. Ice hydrometeors can also be detected to some extent from polarimetric measurements (e.g., Golestani et al. 1989; Park et al. 2009; Cifelli et al. 2011; Adachi et al. 2013). In this case, R(KDP) can be used for the estimation of rainfall rates as long as ice hydrometeors are dry (e.g., Picca and Ryzhkov 2011; Ryzhkov et al. 2009), although DSD parameters cannot be deduced with the method.
It is very encouraging that the proposed method to retrieve both rainfall rate and DSD parameters appears to be reliable in this case study. Whether this method will remain robust in more extreme events and different conditions remains to be tested.
Acknowledgments
The authors express their appreciation to Prof. A. Illingworth of University of Reading for his valuable input and guidance on the auto-calibration technique and to Dr. M. Thurai of Colorado State University for many helpful discussions and comments regarding the research presented. The authors are grateful to Dr. R. Thompson of University of Reading for providing comments on attenuation due to wet radome. The authors also wish to thank Dr. A. Ryzhkov of the NOAA National Severe Storms Laboratory for providing information on retrieving shape parameters from disdrometer measurements, and Dr. Y. Shoji of MRI for variable comments on this study. The first author thanks S. Onogi of MRI for offering source
codes for WINDAS data, and Dr. D. Hudak of Envi-ronment Canada and Prof. F. Fabry of McGill Univer-sity for providing information on the Z–R relation proposed by Marshall et al. (1952). The authors also thank an anonymous reviewer who provided numerous essential comments that substantially improved this paper. Comments from another reviewer also led to several improvements in the paper. This study was partially supported by the funds for integrated promotion of social system reform, research, and development of the Ministry of Education, Culture, Sports, Science and Technology (MEXT) of Japan and by JSPS KAKENHI Grant Number 15K01273.
Appendix A: Theoretical background
A.1 Raindrop size distributionDual polarimetric radar observables depend on the
microphysical characteristics of rain, namely, rain-drop size distribution (DSD), shape, and orientation relative to the local vertical direction, and raindrop temperature (e.g., Bringi and Chandrasekar 2001). For the DSD N(D) (mm−1 m−3), numerous studies on DSD measurements (e.g., Bringi et al. 2003) have shown that a modified Gamma function adequately represents the natural variation in DSD. The un-nor-malized form of the gamma DSD from Ulbrich (1983) is given by
N D N D D( ) exp( ),= −0µ Λ (A1)
where D (mm) is the equivalent-volume spherical raindrop diameter, N0 (mm−1−μ m−3) is the raindrop concentration, and μ (unitless) and Λ (mm−1) repre-sent the shape and slope parameters of the distribu-tion, respectively. Rainfall rate R (mm h−1) can be derived from DSD using
R v D D N D dD= × −∞
∫0 6 10 3 30
. ( ) ( ) ,π (A2)
where v(D) (m s−1) is the raindrop terminal velocity. The rainwater content W (g m−3) can also be derived in terms of DSD using
W D N D dD= −∞
∫10 63 3
0π ρW ( ) , (A3)
where ρW is the density of water (1 g cm−3). The rain-water content can be related to the median volume diameter D0 (mm) of the distribution, which is defined by

Journal of the Meteorological Society of Japan Vol. 93, No. 3382
π ρ
π ρ
612 6
12
30
0
30
W
W
D N D dD
D N D dD W
D( )
( ) .
∫
∫
=
=∞ (A4)
Ulbrich (1983) showed that D0 can be estimated from μ and Λ by
D03 67= +. .µ
Λ(A5)
By substituting (A5) in (A1), we derive the DSD in terms of D0 as
N D N D D D( ) exp . .= − +
0
0
3 67µ µ (A6)
Willis (1984) introduced the concept of normalized N(D), which can re-express (A6) as the normalized gamma distribution (Bringi and Chandrasekar 2001; Testud et al. 2001; Illingworth and Blackman 2002) and is given by
N D N f DD D D( ) ( ) exp . ,= − +
W µ µµ
0 0
3 67 (A7)
where f(μ) is defined as
f ( )( . )
( . )( ) ,µ µµ
µ= +
+
+63 67
3 6744
4
Γ (A8)
and NW (mm−1 m−3) is an intercept parameter defined as
N WDW
W=
( . ) .3 67 104 3
04πρ (A9)
A.2 Polarimetric observablesDual polarimetric radar observables, such as hori-
zontal reflectivity ZH (mm6 m−3), vertical reflectivity ZV (mm6 m−3), and ZDR (dB), can be expressed in terms of DSD (e.g., Bringi and Chandrasekar 2001; Vivekanandan et al. 2003; Vulpiani et al. 2008) as follows:
Z
KS D N D dD
D
D
H,V
hh,vv
=
× ∫
10
4
18
4
5 22λ
ππ ( ) ( ) ,
min
max (A10)
and
Z ZZDRH
V= ( )10 10log , (A11)
where λ (m) is the wavelength, Shh,vv (m) are the backscattering co-polar components of the scat-tering amplitude matrix, Dmin and Dmax (mm) are the minimum and maximum drop diameters, respectively, and K is a constant defined as K = (ε − 1)/(ε + 2), where ε is the complex dielectric constant of water estimated as a function of wavelength and tempera-ture (Ray 1972).
The specific differential phase shift KDP (deg km−1), which represents the propagation phase difference between the two orthogonal polarizations, and the specific attenuation of horizontal polarization AH (dB km−1) and of vertical polarization AV (dB km−1) are defined as follows:
K
f D f D N D dDD
D
DP
hh vv
= ×
× −∫
10 1803π
λ
Re { ( ) ( )} ( ) ,min
max(A12)
and
A
f D N D dDD
D
H,V
hh,vv
= ×
× ∫
8 686 103.
Im ( ) ( ) ,min
max
λ(A13)
where fhh,vv (m) are the forward scattering co-polar amplitudes. In addition, the differential specific atten-uation ADP (dB km−1) and the two-way differential propagation phase ΦDP (deg) between two range loca-tions r1 and r2 (km) are defined as
A A A
f D f D N D dDD
D
DP H V
hh vv
= − = ×
× −∫
8 686 103.
Im { ( ) ( )} ( ) ,min
max
λ(A14)
ΦDP = ∫21
2K r dr
r
rDP ( ) . (A15)
In practice, dual polarimetric radar observes the sum of the differential propagation phase ΦDP and the backscatter differential phase δ (deg) given by
ΨDP DP= +∫21
2K r dr
r
r( ) ,δ (A16)
where
δ = arg( ).*S Shh vv (A17)
The backscatter differential phase δ increases high-frequency gate-to-gate fluctuations in measure-ments of differential phase ΨDP (deg).

A. ADACHI et al.June 2015 383
Note that scattering amplitudes in (A10) and (A12)–(A14) can be calculated using the T-ma-trix method (Mishchenko and Travis 1994) from the equivalent volume diameter D, the wavelength λ, axis ratio of raindrops r, and the complex dielectric constant of water ε. For the axis ratio r, we use the result of Brandes et al. (2005) because Gourley et al. (2009) showed that this is one of the most suitable models for the autocalibration.
Appendix B: Effect of high winds on measurements of the Parsivel disdrometer
The rain parameters retrieved from the C-band dual polarized radar measurements during the passage of a typhoon with the proposed method in Section 3.4 generally showed good agreement with those derived from Parsivel disdrometer data. However, there was a distinct difference in the periods from 1644 to 1732 JST (P1) and from 1733 to 1820 JST (P2), as shown in Fig. 9. Here, by comparing with weighing precip-itation gauge data, we show that the discrepancy in period P1 was not a result of imperfection of the proposed method but was attributable to incorrect measurements of the Parsivel disdrometer, which was deployed in high winds associated with the typhoon.
The rainfall rate estimated with the proposed method agreed well with the surface measurement in period P1, as shown in Fig. 9a, despite the distinct discrepancy in reflectivity in that period (Fig. 9b). Recall that the rainfall measurement was not made by the Parsivel disdrometer but by a weighing precipita-tion gauge (Pluvio). The data measured with Pluvio in P1 may be reliable because the rain amount measured with the operational rain gauge (19.0 mm) in that period was quite close to that observed with Pluvio (18.51 mm), but was different from that obtained by the disdrometer (22.93 mm). Indeed, the time series of the rainfall rate (Fig. A1) clearly shows that the rainfall rate data derived from the Parsivel continu-ously deviated from those measured with Pluvio in P1. This fact suggests that the rain parameters, including reflectivity, obtained with Parsivel during this period were not reliable. Note that this figure also shows that P1 was included in the high-winds (> 15 m s−1) period. Friedrich et al. (2013) suggested that Parsivel disdrometers deployed in sustained strong winds exceeding 15–20 m s−1 tend to lead to misclassifica-tion of the diameter class, resulting in an artifact in DSD measurements. They also showed that the arti-fact is characterized by a large number concentration of raindrops with large diameters and unrealistically low fall velocities.
To explore the effect of strong wind on the Parsivel measurements, we resampled all Parsivel data in P1 with a rainfall rate at least 10 mm h−1 larger than that measured with Pluvio to obtain the means of DSD and terminal velocity (Fig. A2). The number of data sampled was 11. A large number concentra-tion of raindrops with large diameters was not clear because reference observations such as collocated 2DVD measurements were not available, although the number concentration is a bit larger for large rain-drops (> 2 mm) than the empirical DSD by Marshall and Palmer (1948). However, the measured terminal fall velocity is quite different from the fall velocity–diameter relation for rain described by Lhermitte (1990). This figure clearly shows that terminal veloc-ities for raindrops ranging from 1 to 3 mm (more than 3 mm) in diameter tend to take values below (above) the typical fall velocity by up to 12 %. This kind of large discrepancy of terminal velocity was not observed in other evaluation periods. The smaller fall velocity might be attributable to the strong winds, as Friedrich et al. (2013) suggested, and the cause
Fig. A1. Time series of rainfall rates measured with Pluvio (thin line) and Parsivel (open circles), the differences in rainfall rates between the Pluvio and Parsivel measurements in absolute value (crosses), and the wind speed measured at the Kumagaya station (thin line with closed circles) on September 21, 2011. Differences in rainfall rates of less than 4 mm h−1 are set to 0 mm h−1 for ease of viewing. The thick line at the bottom denotes the period with large discrep-ancy in rainfall rate measurements (P1) between Pluvio and Parsivel (1644–1732 JST).
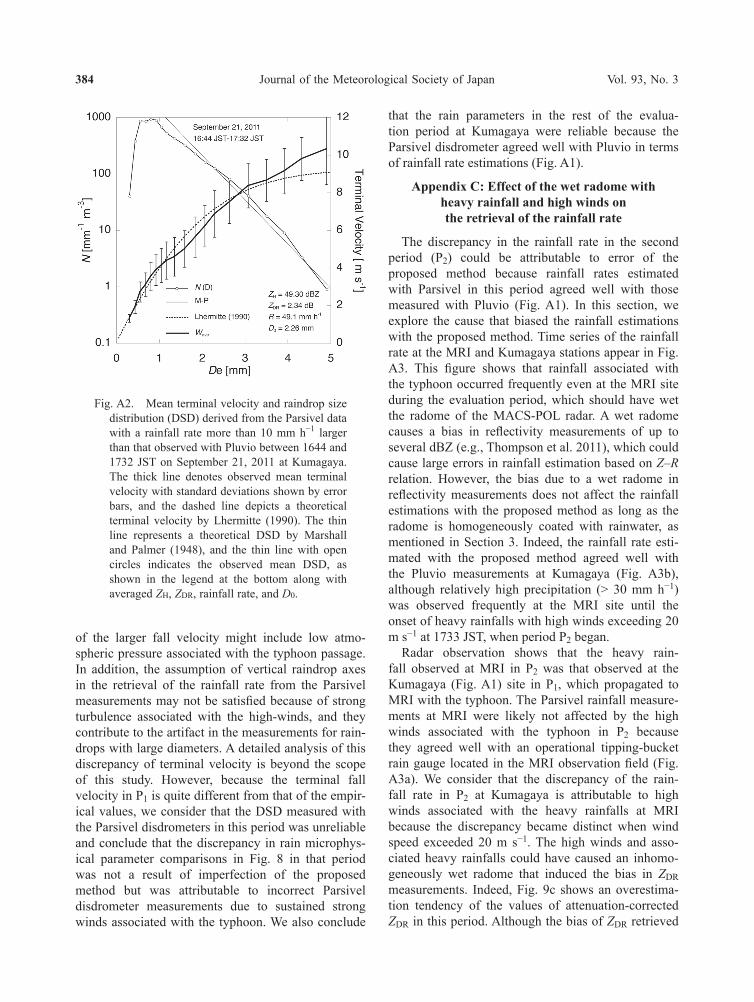
Journal of the Meteorological Society of Japan Vol. 93, No. 3384
of the larger fall velocity might include low atmo-spheric pressure associated with the typhoon passage. In addition, the assumption of vertical raindrop axes in the retrieval of the rainfall rate from the Parsivel measurements may not be satisfied because of strong turbulence associated with the high-winds, and they contribute to the artifact in the measurements for rain-drops with large diameters. A detailed analysis of this discrepancy of terminal velocity is beyond the scope of this study. However, because the terminal fall velocity in P1 is quite different from that of the empir-ical values, we consider that the DSD measured with the Parsivel disdrometers in this period was unreliable and conclude that the discrepancy in rain microphys-ical parameter comparisons in Fig. 8 in that period was not a result of imperfection of the proposed method but was attributable to incorrect Parsivel disdrometer measurements due to sustained strong winds associated with the typhoon. We also conclude
that the rain parameters in the rest of the evalua-tion period at Kumagaya were reliable because the Parsivel disdrometer agreed well with Pluvio in terms of rainfall rate estimations (Fig. A1).
Appendix C: Effect of the wet radome withheavy rainfall and high winds onthe retrieval of the rainfall rate
The discrepancy in the rainfall rate in the second period (P2) could be attributable to error of the proposed method because rainfall rates estimated with Parsivel in this period agreed well with those measured with Pluvio (Fig. A1). In this section, we explore the cause that biased the rainfall estimations with the proposed method. Time series of the rainfall rate at the MRI and Kumagaya stations appear in Fig. A3. This figure shows that rainfall associated with the typhoon occurred frequently even at the MRI site during the evaluation period, which should have wet the radome of the MACS-POL radar. A wet radome causes a bias in reflectivity measurements of up to several dBZ (e.g., Thompson et al. 2011), which could cause large errors in rainfall estimation based on Z–R relation. However, the bias due to a wet radome in reflectivity measurements does not affect the rainfall estimations with the proposed method as long as the radome is homogeneously coated with rainwater, as mentioned in Section 3. Indeed, the rainfall rate esti-mated with the proposed method agreed well with the Pluvio measurements at Kumagaya (Fig. A3b), although relatively high precipitation (> 30 mm h−1) was observed frequently at the MRI site until the onset of heavy rainfalls with high winds exceeding 20 m s−1 at 1733 JST, when period P2 began.
Radar observation shows that the heavy rain-fall observed at MRI in P2 was that observed at the Kumagaya (Fig. A1) site in P1, which propagated to MRI with the typhoon. The Parsivel rainfall measure-ments at MRI were likely not affected by the high winds associated with the typhoon in P2 because they agreed well with an operational tipping-bucket rain gauge located in the MRI observation field (Fig. A3a). We consider that the discrepancy of the rain-fall rate in P2 at Kumagaya is attributable to high winds associated with the heavy rainfalls at MRI because the discrepancy became distinct when wind speed exceeded 20 m s−1. The high winds and asso-ciated heavy rainfalls could have caused an inhomo-geneously wet radome that induced the bias in ZDR measurements. Indeed, Fig. 9c shows an overestima-tion tendency of the values of attenuation-corrected ZDR in this period. Although the bias of ZDR retrieved
Fig. A2. Mean terminal velocity and raindrop size distribution (DSD) derived from the Parsivel data with a rainfall rate more than 10 mm h−1 larger than that observed with Pluvio between 1644 and 1732 JST on September 21, 2011 at Kumagaya. The thick line denotes observed mean terminal velocity with standard deviations shown by error bars, and the dashed line depicts a theoretical terminal velocity by Lhermitte (1990). The thin line represents a theoretical DSD by Marshall and Palmer (1948), and the thin line with open circles indicates the observed mean DSD, as shown in the legend at the bottom along with averaged ZH, ZDR, rainfall rate, and D0.

A. ADACHI et al.June 2015 385
could not be very large, it greatly effects rainfall esti-mation (e.g., Illingworth 2004). This result suggest that the reliability of the proposed method becomes low when heavy rainfall (> 30 mm h−1) with high winds (exceeding 20 m s−1) are observed at the radar site, although the thresholds could vary with condi-tions such as the type of radome mounted and the observation azimuth to wind direction.
References
Adachi, A., T. Kobayashi, H. Yamauchi, and S. Onogi, 2013: Detection of potentially hazardous convective clouds with a dual-polarized C-band radar. Atmos. Meas. Tech., 6, 2741–2760.
Adachi, A., T. Kobayashi, and H. Yamauchi, 2014: Estimation of rainfall rate from polarimetric radar measurements at attenuating frequency based on the self-consistency principle. 2nd international workshop on Tokyo metro-politan area convection study for extreme weather resil-ient cities, 7. [Available at http://mizu.bosai.go.jp/c/c.cgi?key=TOMACS, 2nd_Workshop_program.pdf. ]
Anagnostou, M. N., E. N. Anagnostou, J. Vivekanandan, and F. L. Ogden, 2008: Comparison of two raindrop size distri-bution retrieval algorithms for X-band dual polarization observations. J. Hydrometeor., 9, 589–600.
Aydin, K., Z. Yang, and T. A. Seliga, 1989: Rain-induced attenuation effects on C-band dual-polarization mete-orological radars. IEEE Trans. Geosci. Remote Sens., 27, 57–66.
Brandes, E. A., G. Zhang, and J. Vivekanandan, 2003: An evaluation of a drop distribution-based polarimetric radar rainfall estimator. J. Appl. Meteor., 42, 652–660.
Brandes, E. A., G. Zhang, and J. Vivekanandan, 2004: Drop size distribution retrieval with polarimetric radar: Model and application. J. Appl. Meteor., 43, 461–475.
Brandes, E. A., G. Zhang, and J. Vivekanandan, 2005: Corrigendum. J. Appl. Meteor., 44, 186–186.
Bringi, V. N., and V. Chandrasekar, 2001: Polarimetric Doppler Weather Radar: Principles and Applications. Cambridge University Press., 636 pp.
Bringi, V. N., T. A. Seliga, and E. A. Mueller, 1982: First comparisons of rainfall rates derived from radar differential reflectivity and disdrometer measure-ments. IEEE Trans. Geosci. Remote Sens., 20, 201–204.
Bringi, V. N., G.-J. Huang, V. Chandrasekar, and E. Gorgucci, 2002: A methodology for estimating the parameters of a gamma raindrop size distribution model from polarimetric radar data: Application to a squall-line event from the TRMM/Brazil campaign. J. Atmos. Oceanic Technol., 19, 633–645.
Bringi, V. N., V. Chandrasekar, D. Zrnić, and C. W. Ulbrich, 2003: Comments on “The need to represent raindrop size spectra as normalized gamma distributions for the interpretation of polarization radar observations”. J. Appl. Meteor, 42, 1184–1189.
Bringi, V. N., M. Thurai, K. Nakagawa, G. J. Huang, T. Kobayashi, A. Adachi, H. Hanado, and S. Sekizawa, 2006: Rainfall estimation from C-band polarimetric radar in Okinawa, Japan: Comparison with 2D-video disdrometer and 400 MHz wind profiler. J. Meteor. Soc. Japan, 84, 705–724.
Cao, Q., G. Zhang, E. Brandes, T. Schuur, A. Ryzhkov, and K. Ikeda, 2008: Analysis of video disdrometer and polarimetric radar data to characterize rain micro-physics in Oklahoma. J. Appl. Meteor. Climatol., 47, 2238–2255.
Carey, L. D., W. A. Petersen, and P. N. Gatlin, 2013: Esti-mating the concentration of large raindrops from polarimetric radar and disdrometer observations. 36th Conf. on Radar Meteorology, Breckenridge, CO, Amer. Meteor. Soc., 3A.1.
Chandrasekar, V., V. N. Bringi, N. Balakrishnan, and D. S. Zrnić, 1990: Error structure of multiparameter radar and surface measurements of rainfall. Part III: Specific differential phase. J. Atmos. Oceanic Technol., 7, 621–629.
Fig. A3. Time series of (a) rainfall rates measured with Parsivel (thick line) and the rain gauge (open circles), and the wind speed measured at the MRI site (thin line with open squares) and (b) rainfall rates measured with Pluvio (thin line) and those estimated from the radar measure-ments (closed circles) at the Kumagaya station (KMG) on September 21, 2011. The thick line at the bottom of each panel denotes the period with large discrepancy in rainfall rate (P2) between the Pluvio measurements and radar estimations at Kumagaya (1733–1820 JST) defined in (b).

Journal of the Meteorological Society of Japan Vol. 93, No. 3386
Ciach, G. J., and W. F. Krajewski, 1999: Radar-rain gauge comparisons under observational uncertainties. J. Appl. Meteor., 38, 1519–1525.
Cifelli, R., V. Chandrasekar, S. Lim, P. C. Kennedy, Y. Wang, and S. A. Rutledge, 2011: A new dual-polariza-tion radar rainfall algorithm: Application in Colorado precipitation events. J. Atmos. Oceanic Technol., 28, 352–364.
Doviak, R. J., and D. S. Zrnić, 1993: Doppler Radar and Weather Observations. Academic press, inc., 562 pp.
Figueras i Ventura, J., A.-A. Boumahmoud, B. Fradon, P. Dupuy, and P. Tabary, 2012: Long-term monitoring of French polarimetric radar data quality and evalua-tion of several polarimetric quantitative precipitation estimators in ideal conditions for operational imple-mentation at C-band. Quart. J. Roy. Meteor. Soc., 138, 2212–2228.
Foote, G. B., and P. S. du Toit, 1969: Terminal velocity of raindrops aloft. J. Appl. Meteor., 8, 249–253.
Friedrich, K., S. Higgins, F. J. Masters, and C. R. Lopez, 2013: Articulating and stationary PARSIVEL disdrometer measurements in conditions with strong winds and heavy rainfall. J. Atmos. Oceanic Technol., 30, 2063–2080.
Goddard, J. W. F., J. Tan, and M. Thurai, 1994: Technique for calibration of meteorological radars using differ-ential phase. Electron. Lett., 30, 166–167.
Golestani, Y., V. Chandrasekar, and V. N. Bringi, 1989: Intercomparison of multiparameter radar measure-ments. Preprints, 24th Conf. on radar meteorology, Amer. Meteor. Soc., 309–314.
Gorgucci, E., and G. Scarchilli, 2001: Rainfall estimation from polarimetric radar measurements: Composite algorithms immune to variability in raindrop shape–size relation. J. Atmos. Oceanic Technol., 18, 1773–1786.
Gorgucci, E., G. Scarchilli, and V. Chandrasekar, 1992: Calibration of radars using polarimetric techniques. IEEE. Trans. Geosci. Remote Sens., 30, 853–858.
Gorgucci, E., G. Scarchilli, and V. Chandrasekar, 1994: A robust estimator of rainfall rate using differential reflectivity. J. Atmos. Oceanic Technol., 11, 586–592.
Gorgucci, E., V. Chandrasekar, V. N. Bringi, and G. Scarchilli, 2002: Estimation of raindrop size distri-bution parameters from polarimetric radar measure-ments. J. Atmos. Sci., 59, 2373–2384.
Gorgucci, E., V. Chandrasekar, and L. Baldini, 2008: Micro-physical retrievals from dual-polarization radar measurements at X band. J. Atmos. Oceanic Technol., 25, 729–741.
Gorgucci, E., R. Bechini, L. Baldini, R. Cremonini, and V. Chandrasekar, 2013: The influence of antenna radome on weather radar calibration and its real-time assess-ment. J. Atmos. Oceanic Technol., 30, 676–689.
Gourley, J. J., A. J. Illingworth, and P. Tabary, 2009: Abso-lute calibration of radar reflectivity using redun-
dancy of the polarization observations and implied constraints on drop shapes. J. Atmos. Oceanic Technol., 26, 689–703.
Illingworth, A. J., 2003: Reply. J. Appl. Meteor., 42, 1190–1195.
Illingworth, A. J., 2004: Improved precipitation rates and data quality by using polarimetric measurements. Weather Radar: Principles and Advanced Applica-tions. Meischner, P. (ed.), Springer-Verlag, 130–166.
Illingworth, A. J., and T. M. Blackman, 2002: The need to represent raindrop size spectra as normalized gamma distributions for the interpretation of polarization radar observations. J. Appl. Meteor., 41, 286–297.
Ishihara, M., Y. Kato, T. Abo, K. Kobayashi, and Y. Izumi-kawa, 2006: Characteristics and performance of the operational wind profiler network of the Japan Mete-orological Agency. J. Meteor. Soc. Japan, 84, 1085–1096.
Kalogiros, J., M. N. Anagnostou, E. N. Anagnostou, M. Montopoli, E. Picciotti, and F. S. Marzano, 2013: Optimum estimation of rain microphysical parame-ters from X-band dual-polarization radar observables. IEEE Trans. Geosci. Remote Sens., 51, 3063–3076.
Kim, D. S., M. Maki, and D. I. Lee, 2010: Retrieval of three-dimensional raindrop size distribution using X-band polarimetric radar data. J. Atmos. Oceanic Technol., 27, 1265–1285.
Krajewski, W. F., A. Kruger, C. Caracciolo, P. Golé, L. Barthes, J.-D. Creutin, J.-Y. Delahaye, E. I. Nikol-opoulos, F. Ogden, and J.-P. Vinson, 2006: DEVEX—Disdrometer evaluation experiment: Basic results and implications for hydrologic studies. Adv. Water Resour., 29, 311–325.
Le Bouar, E., J. Testud, and T. D. Keenan, 2001: Valida-tion of the rain profiling algorithm “ZPHI” from the C-band polarimetric weather radar in Darwin. J. Atmos. Oceanic Technol., 18, 1819–1837.
Lhermitte, R., 1990: Attenuation and scattering of milli-meter wavelength radiation by clouds and precipita-tion. J. Atmos. Oceanic Technol., 7, 464–479.
Löffler-Mang, M., and J. Joss, 2000: An optical disdrometer for measuring size and velocity of hydrometeors. J. Atmos. Oceanic Technol., 17, 130–139.
Makihara, Y., 1996: A method for improving radar estimates of precipitation by comparing data from radars and raingauges. J. Meteor. Soc. Japan, 74, 459–480.
Marshall, J. S., and W. M. K. Palmer, 1948: The distribution of raindrops with size. J. Meteor., 5, 165–166.
Marshall, J. S., T. W. R. East, and K. L. S. Gunn, 1952: The microwave properties of precipitation particles. Sci. Rep. MW-7, Stormy Weather Research Group, McGill Univ., Montreal, 40 pp.
Marshall, J. S., W. Hitschfeld, and K. L. S. Gunn, 1955: Advances in radar weather. Acvances in Geophysics, 2. Landsberg, H. E. (ed.), Academic Press Inc., 1–56.
Mishchenko, M. I., and L. D. Travis, 1994: T-matrix compu-
A. ADACHI et al.June 2015 387
tations of light scattering by large spheroidal parti-cles. Opt. Commun., 109, 16–21.
Nemeth, K., 2008: OTT Pluvio²: Weighing precipitation gauge and advances in precipitation measurement technology. TECO-2008 - WMO Technical Confer-ence on Meteorological and Environmental Instru-ments and Methods of Observation (TECO-2008).
Park, H. S., A. V. Ryzhkov, D. S. Zrnić, and K.-E. Kim, 2009: The hydrometeor classification algorithm for the polarimetric WSR-88D: Description and applica-tion to an MCS. Wea. Forecasting, 24, 730–748.
Park, S. G., V. N. Bringi, V. Chandrasekar, M. Maki, and K. Iwanami, 2005a: Correction of radar reflectivity and differential reflectivity for rain attenuation at X band. Part I: Theoretical and empirical basis. J. Atmos. Oceanic Technol., 22, 1621–1632.
Park, S. G., M. Maki, K. Iwanami, V. N. Bringi, and V. Chandrasekar, 2005b: Correction of radar reflectivity and differential reflectivity for rain attenuation at X band. Part II: Evaluation and application. J. Atmos. Oceanic Technol., 22, 1633–1655.
Picca, J., and A. Ryzhkov, 2011: A dual-wavelength pola-rimetric analysis of the 16 May 2010 Oklahoma city extreme hailstorm. Mon. Wea. Rev., 140, 1385–1403.
Ray, P. S., 1972: Broadband complex refractive indices of ice and water. Appl. Opt., 11, 1836–1844.
Ryzhkov, A. V., T. J. Schuur, D. W. Burgess, P. L. Hein-selman, S. E. Giangrande, and D. S. Zrnić, 2005: The joint polarization experiment: Polarimetric rainfall measurements and hydrometeor classification. Bull. Amer. Meteor. Soc., 86, 809–824.
Ryzhkov, A. V., S. Giangrande, A. Khain, M. Pinsky, and A. Pokrovsky, 2009: Polarimetric characteristics of melting hail at S and C bands. Proc. 34th Conf. on Radar Meteorology, Williamsburg, VA, Amer. Meteor. Soc., 4A.6.
Ryzhkov, A., M. Diederich, P. Zhang, and C. Simmer, 2014: Potential utilization of specific attenuation for rainfall estimation, mitigation of partial beam blockage, and radar networking. J. Atmos. Oceanic Technol., 31, 599–619.
Sachidananda, M., and D. S. Zrnić, 1986: Differential prop-agation phase shift and rainfall rate estimation. Radio Sci., 21, 235–247.
Sachidananda, M., and D. S. Zrnić, 1987: Rain rate esti-mates from differential polarization measurements. J. Atmos. Oceanic Technol., 4, 588–598.
Seliga, T. A., and V. N. Bringi, 1976: Potential use of radar differential reflectivity measurements at orthogonal polarizations for measuring precipitation. J. Appl. Meteor., 15, 69–76.
Smyth, T. J., and A. J. Illingworth, 1998: Correction for attenuation of radar reflectivity using polarization data. Quart. J. Roy. Meteor. Soc., 124, 2393–2415.
Testud, J., E. Le Bouar, E. Obligis, and M. Ali-Mehenni, 2000: The rain profiling algorithm applied to polari-
metric weather radar. J. Atmos. Oceanic Technol., 17, 332–356.
Testud, J., S. Oury, R. A. Black, P. Amayenc, and X. Dou, 2001: The concept of “Normalized” distribution to describe raindrop spectra: A tool for cloud physics and cloud remote sensing. J. Appl. Meteor, 40, 1118–1140.
Thompson, R., A. J. Illingworth, and J. Ovens, 2011: Emis-sion: a simple new technique to correct rainfall esti-mates from attenuation due to both the radome and heavy rainfall. 8th International Symposium on Weather Radar and Hydrology. Exeter, UK, Interna-tional Association of Hydrological Sciences, 39–44.
Thurai, M., and H. Hanado, 2005: Absolute calibration of C-band weather radars using differential propagation phase in rain. Electron. Lett., 41, 1405–1406.
Thurai, M., D. Hudak, and V. N. Bringi, 2008: On the possible use of copolar correlation coefficient for improving the drop size distribution estimates at C band. J. Atmos. Oceanic Technol., 25, 1873–1880.
Thurai, M., W. A. Petersen, A. Tokay, C. Schultz, and P. Gatlin, 2011: Drop size distribution comparisons between Parsivel and 2-D video disdrometers. Adv. Geosci., 30, 3–9.
Thurai, M., V. N. Bringi, L. D. Carey, P. Gatlin, E. Schultz, and W. A. Petersen, 2012: Estimating the accuracy of polarimetric radar–based retrievals of drop-size distri-bution parameters and rain rate: An application of error variance separation using radar-derived spatial correlations. J. Hydrol., 13, 1066–1079.
Tokay, A., W. A. Petersen, P. Gatlin, and M. Wingo, 2013: Comparison of raindrop size distribution measure-ments by collocated disdrometers. J. Atmos. Oceanic Technol., 30, 1672–1690.
Ulbrich, C. W., 1983: Natural variations in the analytical form of the raindrop size distribution. J. Climate Appl. Meteor., 22, 1764–1775.
Ulbrich, C. W., and D. Atlas, 1984: Assessment of the contribution of differential polarization to improved rainfall measurements. Radio Sci., 19, 49–57.
Vivekanandan, J., G. Zhang, S. M. Ellis, D. Rajopadhyaya, and S. K. Avery, 2003: Radar reflectivity calibration using differential propagation phase measurement. Radio Sci., 38, 8049.
Vivekanandan, J., G. Zhang, and E. Brandes, 2004: Pola-rimetric radar estimators based on a constrained Gamma drop size distribution model. J. Appl. Meteor., 43, 217–230.
Vulpiani, G., P. Tabary, J. Parent du Chatelet, and F. S. Marzano, 2008: Comparison of advanced radar pola-rimetric techniques for operational attenuation correc-tion at C band. J. Atmos. Oceanic Technol., 25, 1118–1135.
Vulpiani, G., M. Montopoli, L. D. Passeri, A. G. Gioia, P. Giordano, and F. S. Marzano, 2012: On the use of dual-polarized C-band radar for operational rain-

Journal of the Meteorological Society of Japan Vol. 93, No. 3388
fall retrieval in mountainous areas. J. Appl. Meteor. Climatol., 51, 405–425.
Williams, C. R., W. L. Ecklund, and K. S. Gage, 1995: Clas-sification of precipitating clouds in the tropics using 915-MHz wind profilers. J. Atmos. Oceanic Technol., 12, 996–1012.
Willis, P. T., 1984: Functional fits to some observed drop size distributions and parameterization of rain. J. Atmos. Sci., 41, 1648–1661.
Wilson, J. W., and E. A. Brandes, 1979: Radar measurement of rainfall—Summary. Bull. Amer. Meteor. Soc., 60, 1048–1058.
Yamauchi, H., A. Adachi, O. Suzuki, and T. Kobayashi, 2012: Precipitation estimate of a heavy rain event
using a C-band solid-state polarimetric radar. 7th European Conference on Radar in Meteorology and Hydrology.
Yoshikawa, E., V. Chandrasekar, and T. Ushio, 2014: Rain-drop size distribution (DSD) retrieval for X-band dual-polarization radar. J. Atmos. Oceanic Technol., 31, 387–403.
Zhang, G., J. Vivekanandan, E. A. Brandes, R. Meneghini, and T. Kozu, 2003: The shape-slope relation in observed gamma raindrop size distributions: Statis-tical error or useful information? J. Atmos. Oceanic Technol., 20, 1106–1119.