ESTIMATION OF MAxIMUM ANNUAL DISCHARGES By …
10
ESTIMATION OF MAXIMUM ANNUAL DISCHARGES BY FREQUENCY ANALYSIS WITH FOUR PROBABILITY DISTRIBUTIONS IN CASE OF NON-HOMOGENEOUS TIME SERIES (KAZANI KARST SPRING IN REPUBLIC OF MACEDONIA) OCENA MAKSIMALNIH LETNIH PRETOKOV S FREKVENčNO ANALIZO S šTIRIMI VERJETNOSTNIMI PORAZDELITVAMI V PRIMERU NEHOMOGENIH čASOVNIH SERIJ (KRAšKI IZVIR KAZANI V REPUBLIKI MAKEDONIJI) Ivan RADEVSKI 1 , Svemir GORIN 1 , Olgica DIMITROVSKA 1 , Ivica MILEVSKI 1 , Biljana APOSTOLOVSKA-TOSHEVSKA 1 , Milena TALESKA 1 & Vladimir ZLATANOSKI 1 Izvleček UDK 911.2:551.44:556(495.6) 556.36:556.16(495.6) Ivan Radevski, Svemir Gorin, Olgica Dimitrovska, Ivica Mi- levski, Biljana Apostolovska-Toshevska, Milena Taleska & Vladimir Zlatanoski: Ocena maksimalnih letnih pretokov s frekvenčno analizo s štirimi verjetnostnimi porazdelitvami v primeru nehomogenih časovnih serij (kraški izvir Kazani v Republiki Makedoniji) Običajno uporabljamo v hidrologiji frekvenčno analizo za oceno verjetnosti in velikosti ekstremnih pretokov, še posebej nizkih tokov ali poplavnih značilnosti na določenih merilnih mestih. V članku je predstavljena frekvenčna analiza, ki je bila izvedena na seriji maksimalnih letnih pretokov izmerjenih na merilni postaji na kraškem izviru Kazani v obdobju 51 let (1961-2011). Glede na rezultate testa kumulativnih odklonov (Q = 1,531) in testa SNHT ( = 10,543) je časovna serija neho- mogena. Po prilagoditvi letnih maksimalnih pretokov pred letom spremembe (1995) z uporabo programske opreme An- Clim je bila izvedena frekvenčna analiza z uporabo štirih ver- jetnostnih porazdelitev. Dobljeni rezultati kažejo na verjetnost pojava poplav na kraškem izviru za različne povratne dobe. Po izračunu so bile z uporabo grafičnih in statističnih primerjav med empirično in teoretično razporeditvijo podatkov določene porazdelitve z najboljšim ujemanjem. Ker je izvir naravna vrednota in pomemben vir za družbo, je zelo pomembno iz- brati ustrezno verjetnostno porazdelitev za maksimalne letne pretoke kraškega izvira Kazani. Zato je bila izvedena prim- erjava z uporabo grafičnih in statističnih testov (Kolmogorov- Smirnov, χ 2 in Anderson-Darling). Najboljše ujemanje glede na te tri teste je bilo doseženo pri Gumbelovi porazdelitvi z mak- simalnim letnim pretokom 4,54 m 3 /s za povratno dobo 10 let, 6,06 m 3 /s za povratno dobo 100 let in 7,56 m 3 /s za povratno dobo 1000 let. Ključne besede: kraški izvir, maksimalni letni pretok, hidrologija, homogenost, frekvenčna analiza. 1 Institute of Geography, Faculty of Natural Sciences and Mathematics, Ss. Cyril and Methodius University, Arhimedova 3, 1000, Skopje, Republic of Macedonia, e-mail: [email protected] Received/Prejeto: 14.09.2015 COBISS: 1.01 ACTA CARSOLOGICA 45/3, 253–262, POSTOJNA 2016 Abstract UDC 911.2:551.44:556(495.6) 556.36:556.16(495.6) Ivan Radevski, Svemir Gorin, Olgica Dimitrovska, Ivica Mi- levski, Biljana Apostolovska-Toshevska, Milena Taleska & Vladimir Zlatanoski: Estimation of maximum annual dis- charges by frequency analysis with four probability distribu- tions in case of non-homogeneous time series (Kazani karst spring in Republic of Macedonia) Frequency analysis is usually used in hydrology for the pos- sibility and scale of discharge extremes, especially low flows or flood features of concrete gauge. e paper presents a fre- quency analysis carried out on a 51 year period (1961-2011) series of maximum annual discharge, on Kazani karst spring gauge station. e time series were non-homogenous accord- ing to Cumulative deviations test (Q = 1.531) and Standard normal homogeneity test ( = 10.543). Aſter adjusting of annual maximum discharges (AMD) before the year of change (1995), with using AnClim soſtware, the frequency analysis was made using four probability distributions. Obtained results show possibility of karst spring flood occurrence for different return periods. Aſter their calculation the best fitting distribution was chosen using graphical and statistical testing between empiri- cal and theoretical data distribution. According to the spring significance for nature and humanity, it was crucial to choose a right probability distribution for annual maximum discharges of Kazani karst spring. erefore, a comparison using graphical and statistical testing (Kolmogorov-Smirnov, χ 2 and Anderson- Darling test) was made. e best fit according to three tests was the Gumbel distribution with AMD of 4.54 m 3 /s for return pe- riod of 10 years, 6.06 m 3 /s for return period of 100 years and 7.56 m 3 /s for return period of 1000 years, respectively. Key words: karst spring, annual maximum discharge, hydrol- ogy, homogeneity, frequency analysis.
Transcript of ESTIMATION OF MAxIMUM ANNUAL DISCHARGES By …

ESTIMATION OF MAxIMUM ANNUAL DISCHARGES By FREqUENCy ANALySIS wITH FOUR PROBABILITy
DISTRIBUTIONS IN CASE OF NON-HOMOGENEOUS TIME SERIES (KAZANI KARST SPRING IN REPUBLIC OF MACEDONIA)
OCENA MAKSIMALNIH LETNIH PRETOKOV S FREKVENčNO ANALIZO S šTIRIMI VERJETNOSTNIMI PORAZDELITVAMI V PRIMERU NEHOMOGENIH čASOVNIH SERIJ (KRAšKI IZVIR
KAZANI V REPUBLIKI MAKEDONIJI)Ivan RADEVSKI1, Svemir GORIN1, Olgica DIMITROVSKA1, Ivica MILEVSKI1,
Biljana APOSTOLOVSKA-TOSHEVSKA1, Milena TALESKA1 & Vladimir ZLATANOSKI1
Izvleček UDK 911.2:551.44:556(495.6)556.36:556.16(495.6)
Ivan Radevski, Svemir Gorin, Olgica Dimitrovska, Ivica Milevski, Biljana ApostolovskaToshevska, Milena Taleska & Vladimir Zlatanoski: Ocena maksimalnih letnih pretokov s frekvenčno analizo s štirimi verjetnostnimi porazdelitvami v primeru nehomogenih časovnih serij (kraški izvir Kazani v Republiki Makedoniji)Običajno uporabljamo v hidrologiji frekvenčno analizo za oceno verjetnosti in velikosti ekstremnih pretokov, še posebej nizkih tokov ali poplavnih značilnosti na določenih merilnih mestih. V članku je predstavljena frekvenčna analiza, ki je bila izvedena na seriji maksimalnih letnih pretokov izmerjenih na merilni postaji na kraškem izviru Kazani v obdobju 51 let (1961-2011). Glede na rezultate testa kumulativnih odklonov (q = 1,531) in testa SNHT ( = 10,543) je časovna serija neho-mogena. Po prilagoditvi letnih maksimalnih pretokov pred letom spremembe (1995) z uporabo programske opreme An-Clim je bila izvedena frekvenčna analiza z uporabo štirih ver-jetnostnih porazdelitev. Dobljeni rezultati kažejo na verjetnost pojava poplav na kraškem izviru za različne povratne dobe. Po izračunu so bile z uporabo grafičnih in statističnih primerjav med empirično in teoretično razporeditvijo podatkov določene porazdelitve z najboljšim ujemanjem. Ker je izvir naravna vrednota in pomemben vir za družbo, je zelo pomembno iz-brati ustrezno verjetnostno porazdelitev za maksimalne letne pretoke kraškega izvira Kazani. Zato je bila izvedena prim-erjava z uporabo grafičnih in statističnih testov (Kolmogorov-Smirnov, χ2 in Anderson-Darling). Najboljše ujemanje glede na te tri teste je bilo doseženo pri Gumbelovi porazdelitvi z mak-simalnim letnim pretokom 4,54 m3/s za povratno dobo 10 let, 6,06 m3/s za povratno dobo 100 let in 7,56 m3/s za povratno dobo 1000 let.Ključne besede: kraški izvir, maksimalni letni pretok, hidrologija, homogenost, frekvenčna analiza.
1 Institute of Geography, Faculty of Natural Sciences and Mathematics, Ss. Cyril and Methodius University, Arhimedova 3, 1000, Skopje, Republic of Macedonia, e-mail: [email protected]
Received/Prejeto: 14.09.2015
COBISS: 1.01
ACTA CARSOLOGICA 45/3, 253–262, POSTOJNA 2016
Abstract UDC 911.2:551.44:556(495.6)556.36:556.16(495.6)
Ivan Radevski, Svemir Gorin, Olgica Dimitrovska, Ivica Milevski, Biljana ApostolovskaToshevska, Milena Taleska & Vladimir Zlatanoski: Estimation of maximum annual discharges by frequency analysis with four probability distributions in case of nonhomogeneous time series (Kazani karst spring in Republic of Macedonia)Frequency analysis is usually used in hydrology for the pos-sibility and scale of discharge extremes, especially low flows or flood features of concrete gauge. The paper presents a fre-quency analysis carried out on a 51 year period (1961-2011) series of maximum annual discharge, on Kazani karst spring gauge station. The time series were non-homogenous accord-ing to Cumulative deviations test (q = 1.531) and Standard normal homogeneity test ( = 10.543). After adjusting of annual maximum discharges (AMD) before the year of change (1995), with using AnClim software, the frequency analysis was made using four probability distributions. Obtained results show possibility of karst spring flood occurrence for different return periods. After their calculation the best fitting distribution was chosen using graphical and statistical testing between empiri-cal and theoretical data distribution. According to the spring significance for nature and humanity, it was crucial to choose a right probability distribution for annual maximum discharges of Kazani karst spring. Therefore, a comparison using graphical and statistical testing (Kolmogorov-Smirnov, χ2 and Anderson-Darling test) was made. The best fit according to three tests was the Gumbel distribution with AMD of 4.54 m3/s for return pe-riod of 10 years, 6.06 m3/s for return period of 100 years and 7.56 m3/s for return period of 1000 years, respectively.Key words: karst spring, annual maximum discharge, hydrol-ogy, homogeneity, frequency analysis.

ACTA CARSOLOGICA 45/3 – 2016254
I. RADEVSKI, S. GORIN, O. DIMITROVSKA, I. MILEVSKI, B. APOSTOLOVSKA-TOSHEVSKA, M. TALESKA & V. ZLATANOSKI
The “frequency analysis” method is one of the most used statistical techniques when analyzing hydrologic data. Flow frequency analysis relates the magnitude of a giv-en flow event with the frequency or probability of that event’s occurrence with special emphasis on the extremes (the probability that various size events will be exceeded or not exceeded from a given sample of recorded events). Therefore, according to Maidment (1993) the analysis of extremes in hydrological data, such as the annual dis-charge series, is fundamental for the design of different engineering structures. Hence, a truly efficient design of any hydraulic structure can only be achieved as a result of studies which are based on an accurate frequency analy-sis.
The applicability of frequency methods has been widely recognized by numerous researchers in the field. There are several types of theoretical probability distri-butions (or frequency distribution functions) that have been successfully applied to hydrologic data (Mays 2004 as cited in Selaman et al. 2007). Some of the probability distributions commonly used for hydrologic variables were Normal Distribution, Lognormal Distribution, Ex-
ponential Distribution, Gamma Distribution, Pearson Type III Distribution, Log-Pearson Type III Distribution and Extreme Value Distribution. Extreme Value Distri-bution which is further subdivided into three form – EVI (Gumbel Distribution), EVII (Frechet Distribution) and EVIII (weibull Distribution) (Chow et al. 1988 as cited in Guru & Jha 2015).
However, within the scope of this study, we used the four most popularly used theoretical distribution models, the Lognormal, Pearson Type III, Log-Pearson Type III and Gumbel distribution. The paper presents a frequency analysis carried out on a 51 year period (1961−2011) series of maximum annual discharge, on Kazani karst spring gauge station, and the reason for this study was that the current literature does not provide a comprehensive study related to the frequency analysis of peak annual discharge in karst basins in Republic of Macedonia. Therefore, the purpose of this study was to compare the results obtained by applying each of the four methods of frequency analysis to identical sets of discharge data and to seek the best fitting distribution through graphical and statistical testing.
INTRODUCTION
STUDy AREA
Kazani karst spring is located in the western part of the Republic of Macedonia, in the upstream area of the Tres-ka River which is the second largest right tributary of the Vardar River (Fig. 1). The spring belongs to the Aegean water basin. The exposition of the spring is southeast, on the Bistra Mountain, with an altitude of 1040 m a.s.l.. Downstream from the Kazani spring, Studenchica River is a permanent stream, and upstream is called Gazoechka River, which is a temporary stream.
Kazani spring is the starting point for the Stu-denchica River (left tributary of Treska River). The topographical drainage basin of the spring is 25.5 km², which is inappropriate for catchment run-off, so the real hydrogeological catchment has an area of 80 km2, with presumed directions of underground flow (Vasileski 1997). A large area in the western part of the drainage basin is karstified with marbles and limestones. The eastern part of the drainage basin is not karstified, which makes a complex hydrological feature with predominantly surface runoff from the eastern part of the basin, and underground hydro-logical connection from the western part of the basin (Vasileski 1997).
The Fig. 1 with basic hydrogeological data (Gjuzelk-ovski & Kotevski 1977) presents wider area around Ka-zani spring on Bistra Mountain. The main presumed un-derground connection comes from the western peaks on Bistra Mountain, which consists of karstified limestones and marbles (Vasileski 1997). Along the Studenchica River there is one detected fault which is a good base for larger water collection, downstream to the Kazani spring, located on the contact between impermeable flysch on the east and permeable marbles on the west.
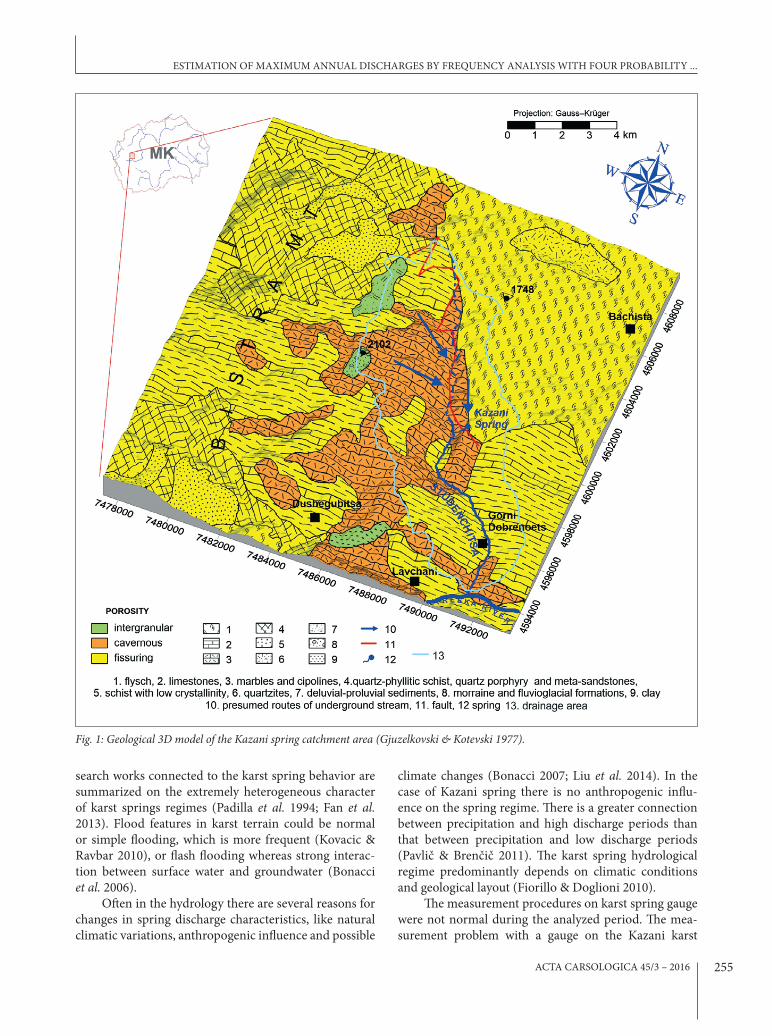
The long-term average annual, minimum and maximum discharges for analyzing period 1961-2011 are 1.474 m3/s, 0.294 m3/s, and 5.400 m3/s (in 2010), respectively. But after adjusting of the time series in the extension of the text, the long-term maximum dis-charge is obtained as 5.900 m3/s in 1963. The Kazani spring (Fig. 2) has a great importance and it is a basic water supply source for the 160,000 inhabitants of towns Kichevo, Makedonski Brod, Krushevo and Prilep and near villages.
Karst springs and catchments display heteroge-neity, variability and vulnerability of their hydrologic parameters in time and space (Bonacci 2004). The re-
ACTA CARSOLOGICA 45/3 – 2016 255
search works connected to the karst spring behavior are summarized on the extremely heterogeneous character of karst springs regimes (Padilla et al. 1994; Fan et al. 2013). Flood features in karst terrain could be normal or simple flooding, which is more frequent (Kovacic & Ravbar 2010), or flash flooding whereas strong interac-tion between surface water and groundwater (Bonacci et al. 2006).
Often in the hydrology there are several reasons for changes in spring discharge characteristics, like natural climatic variations, anthropogenic influence and possible
climate changes (Bonacci 2007; Liu et al. 2014). In the case of Kazani spring there is no anthropogenic influ-ence on the spring regime. There is a greater connection between precipitation and high discharge periods than that between precipitation and low discharge periods (Pavlič & Brenčič 2011). The karst spring hydrological regime predominantly depends on climatic conditions and geological layout (Fiorillo & Doglioni 2010).
The measurement procedures on karst spring gauge were not normal during the analyzed period. The mea-surement problem with a gauge on the Kazani karst
ESTIMATION OF MAxIMUM ANNUAL DISCHARGES By FREqUENCy ANALySIS wITH FOUR PROBABILITy ...
Fig. 1: Geological 3d model of the Kazani spring catchment area (Gjuzelkovski & Kotevski 1977).

ACTA CARSOLOGICA 45/3 – 2016256
METHODOLOGy
The basic problem before the frequency analysis was done was the non-homogeneity of the annual maximum discharges of Kazani karst spring, because of the changes of gauge location and type of measurement. Before the frequency analysis, the homogeneity test of time series was made (Lammersen et al. 2002; Chbab et al. 2006).
For data homogenization was used AnClim soft-ware, which is a comprehensive tool for processing monthly time series from transformations through qual-ity control and homogenization to time series analysis (štěpánek 2008), used first for homogeneity testing by using Cumulative deviations test (Buishand 1982).
The statistics Q and R are an indication of non-homogeneity (values which presents homogeneity), if they are higher than critical values from table (Buishand 1982).
The Standard Normal Homogeneity test - SNHT (Alexandersson 1986; Alexandersson & Moberg 1997;
Sahin & Cigizoglu 2010; Milošević et al. 2012), then ad-justed with SNHT, which was used in previous studies for data homogenization for river discharges (Pekarova & Pekar 2006; Reihan et al. 2007). According to Alexan-dersson and Moberg (1997), is:
where z1 and z2 are the arithmetic averages of the {z1} sequence before and after the year of change. The value “a” is year which is most probably the year of change. The critical values for this test are given in the same article.
The frequency analysis in karst spring gauges is cor-rectly made by asymmetrical probability distributions: LogNormal, Pearson type III, Log Pearson type III and Gumbel distribution, and not often Normal or Gauss distribution (Benzeden et al. 1993; Vasileski & Radevs-ki 2011; Sarauskiene & Kriauciuniene 2011; Vasileski & Radevski 2015). Gumbel distribution, also known as Generalized Extreme Value I distribution was particular-ly used for frequency analysis of karst springs (Liu et al. 2014). From the previous researches, there are factors that limit maximum annual discharges of karst springs, like the size of the karst conduit, intercatchment over-flow, pressure flow and features of intermittent springs in the same catchment (Bonacci 2001).
One of the basic principles of flood frequency analysis is the estimation of probability distribution’s
spring was solved with continuous, limnigraph type gauge station “Kaptaza” in 1992 and additional works on the gauge station in 1995. The gauge altitude is 1039 m a.s.l.. Before that period in the measurement procedure, there are several changes of gauge location and it was the reason to express doubt about the homogeneity in the data. The main subject of this research is frequency anal-ysis of annual maximum discharge (AMD) of Kazani karst spring, after the adjusting of the non-homogeneous time series. The main reason for this research is that the current literature does not provide a comprehensive re-search of the maximum discharges of karst springs, es-pecially in the Republic of Macedonia. The frequency analysis for this study is necessary for determination of the theoretical maximum discharges of the Kazani karst spring. This spring contributes a large amount of water in the recipient Treska River. The Treska River is a main hydrological object and causes flooding in the Kichevo Basin.
Fig. 2: Kazani karst spring.
I. RADEVSKI, S. GORIN, O. DIMITROVSKA, I. MILEVSKI, B. APOSTOLOVSKA-TOSHEVSKA, M. TALESKA & V. ZLATANOSKI

ACTA CARSOLOGICA 45/3 – 2016 257
parameters (David & Davidova 2014). According to the time series length, the temporal information is enough for correct frequency analysis (Merz & Blöschl 2008). Besides, there are studies with a shorter analysis period (Abida & Ellouze 2008), according to measurement pos-sibilities that were obtained 51 year annual maximum discharge time series (1961-2011) from gauge station, which is located near to karst spring (30 m distance).
The time series were plotted on probability paper with points according to weibull formula. After that, four probability distributions (with their parameters) were calculated and used for frequency analysis (Gum-bel, Lognormal, Pearson type III and Log Pearson type III), which are most frequently used for flood frequen-cy analysis (Mujere 2011; Sarauskiene & Kriauciuniene 2011; Gavrilovic et al. 2012; Vasileski & Radevski 2015). Their lines were also plotted on probability paper.
The three statistical tests were carried out to inves-tigate whether the empirical data follow the suggested theoretical distributions. The Kolmogorov-Smirnov (K-S) test (Rahman et al. 2013) was used to identify the best fitting distribution, with basic parameter maximum difference (dmax) between weibull data points and each probability distribution. The Kolmogorov–Smirnov sta-tistic for a given cumulative distribution function F(x) is:
The Chi-Squared test (χ2 test) is used to determine if a sample comes from a given distribution. It should be noted that this is not considered a high power statisti-cal test and is not very useful (Cunnane 1989). The test is based on binned data, and the number of bins (k) is determined by:
where, χ2 is Pearson’s parameter, Oi is number of observa-tions with i-type, n is total number of observations, Ei is the theoretical frequency of type i. For obtaining the critical value of x-square test in necessary to calculate the degree of freedom, d = n-1, and after that use the Pear-son table. If the chi-squared statistic exceeds the critical value, we reject the null hypothesis for theoretical distri-bution fitting on weibull points.
Additionally, the Anderson-Darling test (AD test) was used because of its weight on the distribution tails, which makes it stronger than K-S test. The main statistic in AD test is A2, with critical value of 2.5018 for a signifi-cance level of α = 0.05 (Anderson & Darling 1952). If the estimated A–D test statistic at the 0.05 significance level is greater than the critical value of the selected distribu-tion function, the distribution function is accepted as a suitable candidate to describe the observed data (Gamage et al. 2013). The A–D test is implemented in modern computer software EasyFit (Mathwave Technologies), which allows easily and automatically or manually fit of distributions to your data and select the best model in seconds. The software allows fitting analysis, of the 3 of 4 chosen probability distributions: Lognormal, Gumbel and Log Pearson type III distribution. The statistic A2 depends on distribution frequency (F) and number of observations (n):
The formula for the test statistic A2 to assess the data putted in order, which comes from a distribution with cumulative distribution function (CDF). The F is func-tion tested for fitting.
RESULTS AND DISCUSSION
In this chapter, we have tested the homogeneity of maxi-mum annual discharge data series for the Kazani karst spring in the period 1961-2011. The doubt about data se-ries comes from the fact of location changes of the gauge in 1992 and 1995.
The Cumulative deviations test is based on the ad-justed partial sums (S*) or cumulative deviations from the mean, and rescaled adjusted partial sums (Sk
**), Dx is the sample standard deviation.
The results from AnClim software presents values for q (1.531) and R (1.688), which are higher than the critical value of q (1.27), and critical value of R (1.55) for n = 51, and the year of change is 1995, which was previ-ously detected according to gauge measurement history information. According to the cumulative deviations test the time series are non-homogenous.
Another testing was made with SNHT. The math-ematical details of SNHT method can be seen in the two
ESTIMATION OF MAxIMUM ANNUAL DISCHARGES By FREqUENCy ANALySIS wITH FOUR PROBABILITy ...
ACTA CARSOLOGICA 45/3 – 2016258
studies (Alexanderson 1986; Alexandersson & Moberg 1997). The critical value for, according to the table (Al-exandersson 1986) for n = 51 is 8.38 and the calculated
is 10.543, so the AMD time series according to SNHT is non-homogenous. Alternative hypothesis says that some time series mean value changes abruptly.
Fig. 3: Measured and adjusted AMd (m3/s) of Kazani karst spring.
Tab. 1: Probability distribution results for different return period in years (m3/s).
Distribution/return period 5 10 20 50 100 1000LogNormal 4.10 4.55 4.96 5.47 5.83 6.99Pearson III 4.07 4.57 5.03 5.60 6.01 7.33Log Pearson III 4.06 4.54 5.00 5.60 6.06 7.64Gumbel Max 4.05 4.54 5.01 5.61 6.06 7.56
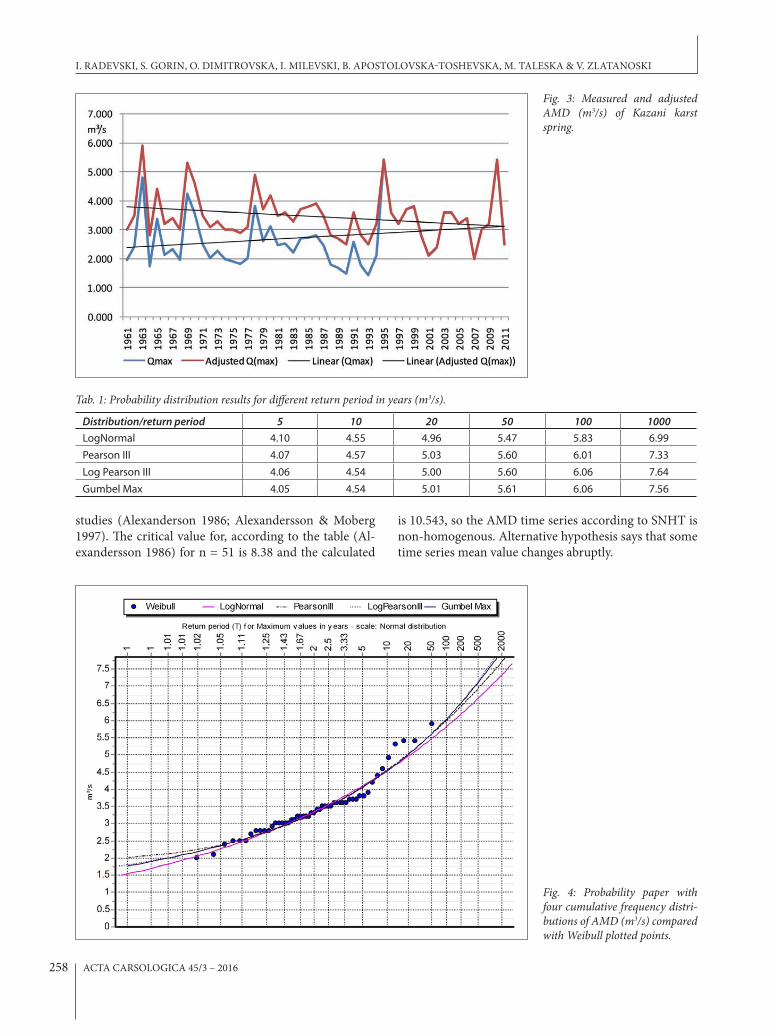
Fig. 4: Probability paper with four cumulative frequency distri-butions of AMd (m3/s) compared with Weibull plotted points.
I. RADEVSKI, S. GORIN, O. DIMITROVSKA, I. MILEVSKI, B. APOSTOLOVSKA-TOSHEVSKA, M. TALESKA & V. ZLATANOSKI

ACTA CARSOLOGICA 45/3 – 2016 259
According to calculation in AnClim software cal-culation, also 1995 was the year of change, so after that, there is the possibility to adjust the AMD time series before or after the year change. Because of the historical conditions of gauge measurement, non-homogeneity be-fore year of change, the period before 1995 (blue line in Fig. 3), was adjusted with AnClim (red line in Fig. 3) to the period after 1995, which was correctly measured.
The adjusted time series of AMD were used for fre-quency analysis after determining of the main param-eters for each distribution. For the frequency analysis we used Hydrognomon, software developed free applica-tion for the analysis and processing of hydrological data, mainly in the form of time series. In this software there is Module Pythia, which allows frequency analysis and testing with K-S and χ2 tests (Kozanis et al. 2005), with calculating of possibility discharges according to four probability distributions, for return periods of 5, 10, 20, 50, 100 and 1000 years.
The obtained results in Tab. 1, for theoretical AMD of Kazani karst spring are in range 4.05 m3/s for return period of 5 years to 7.56 m3/s for return period of 1000 years according to Gumbel distribution. The results are calculated for 6 different return periods. The Log Pear-son distribution type III has the highest value of return period of 1000 years as 7.64 m3/s.
Probability paper in Fig. 4 can clearly notice satis-factory correspondence with Gumbel distribution and Log Pearson type III distribution, especially for high val-ues of discharge, which suits a small probability. There is also satisfactory correspondence with the LogNormal distribution and the Pearson distribution III type. These two distributions do not show good correspondence with the empirical distribution of points on small prob-abilities of the gauge station at Kazani karst spring. This case of correspondence of logarithmic distributions with the empirical distribution is a common phenomenon in water courses with torrential character.
From the results obtained in Tab. 2, by the Kolm-ogorov-Smirnov test it is clear that it accepts four prob-ability distributions with dmax values lower than a critical value of 0.19 for critical value a = 5 %, so it means that four distributions, according to the K-S test, are adjusted
to the weibull points. The maximum difference between probability distribution and weibull points has a lower value in case of Gumbel probability distribution (0.087) and Log Pearson III distribution (0.089), which means these two distributions have better comparison with weibull points.
From the results obtained in Tab. 3, by the χ-square test with 6 classes of AMD time series, we can conclude that it accepts Log Pearson distribution type III with at-tained “a” 22.31 % and Pearson parameter is equal to 3 and Gumbel distribution with attained “a” of 56.03 % and Pearson parameter 2.06 were accepted for critical value of 5 %. The Pearson distribution type III was rejected.
From the results obtained in Tab. 4, the A2 statistic, we can conclude that it accepts three distributions with values lower than critical (2.5018), but Gumbel distribu-tion has a lowest value, which means that this distribu-tion has the best fitting with AMD time series. Consider-ing that this test is more sensitive in distribution tails, we will choose Gumbel distribution as the best fitting distri-bution for AMD on Kazani karst spring.
Tab. 2: Kolmogorov Smirnov test for four probability distribu-tions.
Kolmogorov-Smirnov test α = 5 % Attained a (attained
threshold) Dmax
LogNormal ACCEPT 56.51 % 0.110
Pearson III ACCEPT 77.62 % 0.092
Log Pearson III ACCEPT 80.39 % 0.089
EV1-Max (Gumbel) ACCEPT 82.52 % 0.087
Tab. 3: χ-square test for four probability distributions.
χ -Square test for All data α=5 % Attained a (attained
threshold)Pearson Param.
LogNormal ACCEPT 5.25 % 7.71Pearson III REJECT 4.30 % 6.29Log Pearson III ACCEPT 22.31 % 3.00EV1-Max (Gumbel) ACCEPT 56.03 % 2.06
Tab. 4: Anderson darling test for Lognormal, Log Pearson type III and Gumbel probability distribution.
AD test for All data α = 5 % A² statistic
LogNormal ACCEPT 0.679
Log Pearson III ACCEPT 0.553
EV1-Max (Gumbel) ACCEPT 0.532
ESTIMATION OF MAxIMUM ANNUAL DISCHARGES By FREqUENCy ANALySIS wITH FOUR PROBABILITy ...
ACTA CARSOLOGICA 45/3 – 2016260
The study aimed at understanding of the frequency anal-ysis of maximum annual discharges for long term period. The results of frequency analysis (theoretical maximum of 7.56 m3/s for 1000 years return period), shows the range of maximum possible discharge of Kazani karst spring, like a constant karst spring, without larger am-plitudes of maximum annual discharges, which is very adequate for water supply of populated settlements. Be-cause of the historical conditions of gauge measurement, non-homogeneity before the year of change, the period before 1995, was adjusted by AnClim software for the period after 1995, which was correctly measured. After frequency analysis of AMD, the best fitting distribution is the Gumbel distribution, which is proved with graphi-cal comparison on probability paper and statistical tests (K-S, χ2 and Anderson-Darling test). The best fitting is
the Gumbel distribution with a result of 4.54 m3/s for re-turn period of 10 years, 6.06 m3/s for return period of 100 years and 7.56 m3/s for return period of 1000 years. The paper shows one way of determination of flood scale in function of protection from flood features, building of safe objects on karst areas and of course sustainable de-velopment of the wider spring area. Those methods can be implemented in the same catchments with non-ho-mogeneous data in gauges with natural or anthropogenic changes of discharge also. The study results are useful in spatial planning studies and regional plans and for im-provement of the infrastructure on karst spring Kazani and downstream the Studenchica River, related to this study and regarding to different return periods of calcu-lated AMD.
CONCLUSION
REFERENCES
Abida, H., & M. Ellouze, 2008: Probability distribution of flood flows in Tunisia.- Hydrology and Earth System Sciences, 12, 3, 703-714.
Alexandersson, H., 1986: A homogeneity test applied to precipitation data.- Journal of climatology, 6, 6, 661-675.
Alexandersson, H. & A. Moberg, 1997: Homogenization of Swedish temperature data. Part I: Homogeneity test for linear trends.- International Journal of Cli-matology, 17, 1, 25-34.
Anderson, T.w. & D.A. Darling, 1952: Asymptotic theo-ry of certain "goodness-of-fit" criteria based on sto-chastic processes.- Annales of Mathematical Statis-tics, 23, 193-212. doi:10.1214/aoms/1177729437
Benzeden, E., Olcay, M.S. & K. Bagali, 1993: Flood fre-quency analysis in karst river basins.- In: Gunay, G., Johnson A.I. & w. Black (eds.) Hydrological Pro-cesses in Karst Terranes, Proceedings of the Antalya Symposium and Field Seminar, October 1990, IAHS Publ., 207, 187–202, Antalya.
Bonacci, O., 2001: Analysis of the maximum discharge of karst springs.- Hydrogeology Journal, 9, 4, 328-338. doi:10.1007/s100400100142
Bonacci, O., 2004: Hazards caused by natural and an-thropogenic changes of catchment area in karst.- Nat. Hazards and Earth Syst. Sci., 4, 5-6, 655-661. doi:10.5194/nhess-4-655-2004
Bonacci, O., 2007: Analysis of long-term (1878-2004) mean annual discharges of the karst spring Fontaine de Vaucluse (France).- Acta carsologica, 36, 1, 151-156. doi: http://dx.doi.org/10.3986/ac.v36i1.217
Bonacci, O., Ljubenkov, I. & T. Roje-Bonacci, 2006: Karst flash floods: an example from the Dinaric karst (Croatia).- Nat. Hazards Earth Syst. Sci., 6, 195–203. doi:10.5194/nhess-6-195-2006
Buishand, T.A., 1982: Some methods for testing the ho-mogeneity of rainfall records.- Journal of Hydrol-ogy, 58, 1, 11-27.
Chbab, E.H., Buiteveld, H. & F. Diermanse, 2006: Esti-mating exceedance frequencies of extreme river discharges using statistical methods and physically based approach.- Österreichische wasser - und Ab-fallwirtschaft, 58, 3-4, 35-43.
Chow, V.T., Maidment, D.R. & L.w. Mays, 1988: Applied Hydrology.- McGraw-Hill, pp. 572, New york.
Cunnane, C., 1989: Statistical distributions for flood fre-quency analysis.- Operational Hydrology Report (wMO), Report number: 33.
David, V. & T. Davidova, 2014: Methodology for flood frequency estimations in small catchments.- Natu-ral Hazards and Earth System Sciences, 14, 10, 2655-2669. doi:10.5194/nhess-14-2655-2014
I. RADEVSKI, S. GORIN, O. DIMITROVSKA, I. MILEVSKI, B. APOSTOLOVSKA-TOSHEVSKA, M. TALESKA & V. ZLATANOSKI
ACTA CARSOLOGICA 45/3 – 2016 261
Fan, y., Huo, x., Hao, y., Liu, y., wang, T., Liu, y. & T.J. yeh, 2013: An assembled extreme value statistical model of karst spring discharge.- Journal of Hy-drology, 504, 57-68. http://dx.doi.org/10.1016/j.jhydrol.2013.09.023
Fiorillo, F. & A. Doglioni, 2010: The relation between karst spring discharge and rainfall by cross-corre-lation analysis (Campania, southern Italy).- Hy-drogeology Journal, 18, 8, 1881-1895. doi:10.1007/s10040-010-0666-1
Gamage, S.H.P.w., Hewa, G.A. & S. Beecham, 2013: Probability distributions for explaining hydrologi-cal losses in South Australian catchments.- Hydrol-ogy and Earth System Sciences, 17, 11, 4541-4553.
Gavrilovic, L., Milanovic Pesic, A. & M. Urosev, 2012: A hydrological analysis of the greatest floods in Ser-bia in the 1960-2010 period.- Carpathian Journal of Earth and Environmental Sciences, 7, 4, 107-116.
Gjuzelkovski, D. & G. Kotevski, 1977: Hidrogeoloska kar-ta na SR Macedonia, 1:200 000.- Macedonia.
Guru, N. & R. Jha, 2015: Flood frequency analysis for Tel sub-basin of Mahanadi River, India using weibull, Gringorten and L-moments formula.- International Journal of Innovative Research and Creative Tech-nology, 1, 2, 220-223.
Kovacic, G. & N. Ravbar, 2010: Extreme hydrological events in karst areas of Slovenia, the case of the Unica River basin.- Geodinamica Acta, 23, 1-3, 89-100. doi:10.3166/ga.23.89-100
Kozanis, S., Christofides, A., Mamassis, N., Efstrati-adis, A. & D. Koutsoyiannis, 2005: Hydrognomon: A hydrological data management and processing software tool.- Geophysical Research Abstracts, 7, 04644.
Lammersen, R., Engel, H., Van de Langemheen, w. & H. Buiteveld, 2002: Impact of river training and re-tention measures on flood peaks along the Rhine.- Journal of Hydrology, 267, 1, 115-124. http://dx.doi.org/10.1016/S0022-1694(02)00144-0
Liu, y., Hao, y., Fan, y., wang, T., Huo, x., Liu, y. & T.C.J. yeh, 2014: A nonstationary extreme value distribu-tion for analysing the cessation of karst spring dis-charge.- Hydrological Processes, 28, 20, 5251-5258. doi: 10.1002/hyp.10013
Maidment, D.R., 1993: Handbook of Hydrology.- McGraw-Hill Professional, pp. 1424, New york.
Mays, L.w. (ed.), 2004: Urban Stormwater Management Tools.- McGraw-Hill, pp. 320, New york.
Merz, R. & G. Blöschl, 2008: Flood frequency hydrol-ogy: 1. Temporal, spatial, and causal expansion of information.- water Resources Research, 44, 8. doi: 10.1029/2007wR006744
Milošević, D., Savić, S., Marković, V. & R. Kujundžić-Dačović, 2012: Homogenisation of Mean Air Tem-perature Time Series from Vojvodina (North Ser-bia).- Geographica Pannonica, 16, 2, 38-43.
Mujere, N., 2011: Flood frequency analysis using the Gumbel distribution.- International Journal on Computer Science & Engineering, 3, 7, 2774-2778.
Padilla, A., Pulido-Bosch, A. & A. Mangin, 1994: Rela-tive importance of baseflow and quickflow from hydrographs of karst spring.- Ground water, 32, 2, 267-277. doi: 10.1111/j.1745-6584.1994.tb00641.x
Pavlič, U. & M. Brenčič, 2011: Application of sequen-tial trend analysis for discharge characterisation of Vipava karstic springs, Slovenia.- Acta Carsologica, 40, 2, 283-291.
Pekarova, P. & J. Pekar, 2006: Long-term discharge pre-diction for the Turnu Severin station (the Danube) using a linear autoregressive model.- Hydrological processes, 20, 5, 1217-1228. doi: 10.1002/hyp.5939
Rahman, A.S., Rahman, A., Zaman, M.A., Haddad, K., Ahsan, A. & M. Imteaz, 2013: A study on selection of probability distributions for at-site flood fre-quency analysis in Australia.- Natural hazards, 69, 3, 1803-1813. doi:10.1007/s11069-013-0775-y
Reihan, A., Koltsova, T., Kriauciuniene, J., Lizuma, L. & D. Meilutyte-Barauskiene, 2007: Changes in water discharges of the Baltic States rivers in the 20th cen-tury and its relation to climate change.- Nordic Hy-drol., 38, 4-5, 401-412.
Sahin, S. & H.K. Cigizoglu, 2010: Homogeneity analysis of Turkish meteorological data set.- Hydrological Processes, 24, 8, 981-992. doi: 10.1002/hyp.7534
Sarauskiene, D. & J. Kriauciuniene, 2011: Flood frequen-cy analysis of Lithuanian rivers.- In: Cygas, D. & K.D. Froehner (eds.) 8th International Conference on Environmental Engineering, 19th-20th May 2011, Vil-nius, Lithuania. VGTU Press “Technika”, 666-671, Vilnius.
Selaman, O.S., Said, S. & F.J. Putuhena, 2007: Flood fre-quency analysis for Sarawak using weibull, Grin-gorten and L-Moments formula.- Journal-The Insti-tution of Engineers, 68, 1, 43-52.
štěpánek, P., 2008: AnClim - software for time series anal-ysis. Dept. of Geography, Fac. of Natural Sciences, MU, Brno.- [Online] Available from: http://www.climahom.eu/software-solution/anclim [Accessed 30th September 2016].
Vasileski, D., 1997: Studenchica - Physical geography Study [In Macedonian].- EkoRitam, pp. 135, Sko-pje.
ESTIMATION OF MAxIMUM ANNUAL DISCHARGES By FREqUENCy ANALySIS wITH FOUR PROBABILITy ...

ACTA CARSOLOGICA 45/3 – 2016262
Vasileski, D. & I. Radevski, 2011: Implementation of Gauss function in determing probability of floods at the gauge station “Dolenci” on the Crna Reka in Republic of Macedonia.- Geographica Pannonica, 15, 4, 113-118.
Vasileski, D. & I. Radevski, 2015: Analysis of high wa-ters on the Kriva Reka River, Macedonia.- Acta Geographica Slovenica, 54, 2, 363-377. doi: http://dx.doi.org/10.3986/AGS54209
I. RADEVSKI, S. GORIN, O. DIMITROVSKA, I. MILEVSKI, B. APOSTOLOVSKA-TOSHEVSKA, M. TALESKA & V. ZLATANOSKI