
ESTIMATION OF CONSUMER PREFERENCES FOR COWPEA VARIETIES IN KUMI
102
ESTIMATION OF CONSUMER PREFERENCES FOR COWPEA VARIETIES IN KUMI AND SOROTI DISTRICTS, UGANDA BY MUNDUA JOEL Bsc.Agric (MUK) A THESIS SUBMITTED TO SCHOOL OF GRADUATE STUDIES IN PARTIAL FULFILMENT OF THE AWARD OF MASTERS OF SCIENCE DEGREE IN AGRICULTURAL AND APPLIED ECONOMICS OF MAKERERE UNIVERSITY OCTOBER 2010
Transcript of ESTIMATION OF CONSUMER PREFERENCES FOR COWPEA VARIETIES IN KUMI

ESTIMATION OF CONSUMER PREFERENCES FOR COWPEA
VARIETIES IN KUMI AND SOROTI DISTRICTS, UGANDA
BY
MUNDUA JOEL
Bsc.Agric (MUK)
A THESIS SUBMITTED TO SCHOOL OF GRADUATE STUDIES IN
PARTIAL FULFILMENT OF THE AWARD OF MASTERS OF
SCIENCE DEGREE IN AGRICULTURAL AND APPLIED
ECONOMICS OF MAKERERE UNIVERSITY
OCTOBER 2010

i
DECLARATION AND APPROVAL
Declaration
I hereby declare that this thesis is my original work and effort and has not been presented in
this or any other University for any award. Information from other sources has been duly
acknowledged.
Joel Mundua
Sign:…………………………………….
Date:………………………………………
Approval
This thesis has been submitted with my approval as supervisor.
Ass. Prof. Theodora Hyuha (Department of Agricultural Economics and Agribusiness,
Makerere University, Kampala Uganda)
Sign:…………………………………………
Date:……………………………………….

ii
DEDICATION
To my beloved wife, Tumwesige Pauline, my children, Angel, Grace, Edgar and Edmond-
Thanks for being there for me.
To my beloved mother Candiru Edisa, who out of the ordinary brought up eight children
with income from subsistence agriculture.
And to the children and communities in the Northern and Eastern part of Uganda, who
treasure and derive their livelihood from Cowpeas.

iii
ACKNOWLEDGEMENTS
I would like to give sincere thanks and glory to the almighty God for his faithfulness and
seeing me through my studies. It has been a long journey but he has made it possible for me.
Thank you Jesus!
I am deeply thankful to Ass. Prof. Hyuha Theodora and Mr. Tayebwa Bernard for tirelessly
supervising the whole research work. Their parental and technical guidance has been a key
to the success of this thesis and my studies at large. I am also grateful to all the staff of
Makerere University for their invaluable support and contribution. Special thanks go to Dr.
John Mburu, Paulrech Severin, Dr. Kajobe Robert, Ms Harriet Musoke and Dr. Mangisoni
for their continued encouragements and support even though miles away.
I am grateful to World Vision Uganda, for allowing me study while working, especially the
team of Kammengo ADP, Central regional office and the national office, most especially,
Mr. Bazilio Okello and Ms Kagimba Margaret.
I would like to express my fond gratitude to my wife, Pauline and children, Edmond, Edgar,
Grace, Angel, Peace and Sophie for enduring my busy, expensive schedule during my
studies.
Mr. Kalule Okello David, Omadi Bob and other staff of Serere Agricultural Research
Institute for all the support during data collection. The men and women of Soroti and Kumi
who participated in the household interviews, market survey and focus group discussions
To my friends, Sam, Rollins, Mike, Dorothy, Ollen, Walter, Lubega, Jude, Swaib,
Rosemary, Sarah, Lule and the entire postgraduate student‘s body of Makerere University,
thanks for the good times, your support and the smiles you brought unto my face even
during hard times.

iv
TABLE OF CONTENTS
DECLARATION AND APPROVAL ............................................................................................. i
DEDICATION ................................................................................................................................ ii
ACKNOWLEDGEMENTS ........................................................................................................... iii
TABLE OF CONTENTS .............................................................................................................. iv
LIST OF TABLES ....................................................................................................................... vii
LIST OF FIGURES ...................................................................................................................... vii
ABSTRACT ................................................................................................................................. ix
CHAPTER ONE ............................................................................................................................ 1
INTRODUCTION ......................................................................................................................... 1
1.0 Background .......................................................................................................................... 1
1.1 Uganda‘s Economy .............................................................................................................. 1
1.2 World Production ................................................................................................................. 3
1.3 Cowpeas Production in Uganda ........................................................................................... 4
1.4 Market Performance of Cowpeas ........................................................................................ 8
1.5 Research ............................................................................................................................... 8
1.6 Problem Statement ............................................................................................................. 10
1.7 Objective of the Study ....................................................................................................... 12
1.7.1 Specific Objectives ............................................................................................................ 12
1.8 Hypothesis ......................................................................................................................... 12
1.9 Significance of the Study ................................................................................................... 12
1.10 Scope of the Study ............................................................................................................. 14
CHAPTER TWO ......................................................................................................................... 15
LITERATURE REVIEW ........................................................................................................... 15
2.0 Introduction ........................................................................................................................ 15
2.1 Markets and Marketing ...................................................................................................... 15
2.1.1 Markets .............................................................................................................................. 15
2.1.2. Cowpea Production and Marketing ................................................................................... 16

v
2.1.3 Quality of the Product ........................................................................................................ 19
2.2 Demand Theory and Consumption .................................................................................... 20
2.3 Consumer willingness to pay (WTP) ................................................................................. 21
2.4 Analytical Methods to Estimate Willingness to Pay ......................................................... 24
CHAPTER THREE ..................................................................................................................... 28
METHODOLOGY ...................................................................................................................... 28
3.0 Introduction ....................................................................................................................... 28
3.1 Study Area ......................................................................................................................... 28
3.2 Sampling Techniques ......................................................................................................... 28
3.3 Data Sources and Collection .............................................................................................. 30
3.4 Preparation of Sample and Data Collection ....................................................................... 30
3.5 Data Collection and Data Types ........................................................................................ 31
3.6 Data Analysis ..................................................................................................................... 31
3.6.1 Analytical Approach .......................................................................................................... 31
3.6.2 Model Specification ........................................................................................................... 32
3.6.3 Hedonic Model Frame Work ............................................................................................. 32
3.6.4 Estimation .......................................................................................................................... 34
CHAPTER FOUR ....................................................................................................................... 36
RESULTS AND DISCUSION .................................................................................................... 36
4.1 Introduction ........................................................................................................................ 36
4.2 Socio-economics Characteristics of Urban Cowpea Consumers ....................................... 37
4.3 Consumer Awareness and Attitudes towards Cowpeas ..................................................... 39
4.3.2. Attitude towards Cowpea .................................................................................................. 40
4.3.3 Consumption by Age Groups and Sex ............................................................................... 43
4.4 Seed Property Consumers Value for Meal Making ........................................................... 45
4.5 Consumer Evaluation of Cowpea Attributes ..................................................................... 46
4.6 Willingness-to-pay for Cowpea Varieties ......................................................................... 50
4.6.2 Market Performance of Cowpeas in Soroti and Kumi....................................................... 51
4.7 Determinants of Consumers willingness to pay for the different Cowpea Varieties ........ 54

vi
CHAPTER FIVE ......................................................................................................................... 51
SUMMARY, CONCLUSIONS AND RECOMMENDATIONS ............................................. 51
5.0 Summary ............................................................................................................................ 51
5.1 Conclusions........................................................................................................................ 53
5.2 Recommendations of the Study ......................................................................................... 55
5.3 Recommendations for further Research ............................................................................ 56
REFERENCES .............................................................................................................................. 57
APPENDICES
APPENDIX 1: Questionnaire ........................................................................................................ 70
APPENDIX 2: Market Data Collection Template ......................................................................... 79
APPENDIX 3: Farm Gate Data Collection Template ................................................................... 80
APPENDIX 4: Map of Uganda Showing Study Area ................................................................. 81

vii
LIST OF TABLES
Table 3.1: Attributes in the Model ................................................................................................. 35
Table 4.1: Samples Used in the Model .......................................................................................... 36
Table 4.2: Socio-economic Characteristics of Urban Cowpea Consumers ................................... 37
Table 4.3: Gender of Respondents ................................................................................................. 38
Table 4.4: Food Decision in the Household. ................................................................................. 38
Table 4.5: Response (%) of Consumer awareness of Cowpea Varieties ....................................... 39
Table 4. 6: Meal Production out of Cowpeas ................................................................................ 41
Table 4.7: Parents Teaching their Children to Prepare Cowpeas .................................................. 44
Table 4.8: Mean sensory scores for cowpea variety attributes by consumers in Kumi and
Soroti district ................................................................................................................. 46
Table 4.9: Mean Willingness To Pay (WTP) for Cowpea Varieties ............................................. 50
Table 4.10: Mean prices consumers were willing to pay and actual mean market price for
cowpea in Soroti and Kumi markets ............................................................................. 53
Table 4.11a: Results from Estimated Hedonic Model for Cowpea Varieties ................................ 46
Table 4.11b: Results from Estimated Hedonic Model for Cowpea Varieties .............................. 47

viii
LIST OF FIGURES
Fig. 2.1: Quantities of Cowpeas Produced, Marketed and acreage under Production in Soroti
District. .......................................................................................................................... 17
Fig. 2.2: Quantities of cowpeas produced, marketed and acreage under production in
Kumi district. ................................................................................................................. 18
Fig. 4.1: Serving Cowpeas to Visitors .......................................................................................... 41
Fig. 4.2: Serving Cowpeas on Special Occasions.......................................................................... 42
Fig. 4.3: Cowpea Consumption by Age Group ........................................................................... 44
Fig. 4.4: Seed Property Valued by Consumers for Meal Making Suitability ............................... 45
Fig 4.5: Mean Rank Scores of Cowpea variety in Soroti and Kumi Districts .............................. 49
Fig. 4.6: Cowpea Price fluctuations in Kumi ................................................................................ 52

ix
ABSTRACT
Cowpea (Vigna Unguiculata L. Walp) is one of the most important indigenous legumes of
the tropics and sub tropics. In Africa information on cowpea marketing and trade is lacking
and data on cowpea production and consumption economics scattered, yet the urban
population in developing world are undergoing a nutritional transition characterized by
decline in consumption of traditional food crops, and increasing consumption of refined and
processed foods, fats, sugars, and animal foods. There is need for a shift in philosophy of
―here‘s what we produce‖ to a situation where farmers take note of food products the
consumer wants in order for their products to have a place in the market.
This study focused on consumer preference for cowpea in Soroti and Kumi district, as these
produce 90% of Uganda‘s cowpea crop. Using structured questionnaire 161 households
were reached and 4 focus group discussions held in Soroti and Kumi. Hedonic price model
was used to estimate preference for attributes.
Study results showed that cowpeas are important part of diet as is consumed by up to 99.4%
of the households and served on important occasions (73%) like funerals, child naming and
to visitors, (71%). This popularity, and extensive current consumption, could translate in to a
good market potential for the crop, if tapped well. It‘s more cherished by women (65.84%)
and is consumed by over 90% of all the age groups. However, less and less parents teach
their children how to prepare the crop, this being a potential danger of extinction of the crop
in the future.
Consumers have preference for white and tan testa cowpea and large seeded crop, associated
with Ebalat, SECOW 2W and Icirikukwai. Results show that seed color (56%) and seed size
are the most important quality parameters consumers consider in their decision to purchase.
Consumers are willing to pay a premium for white grain color, the coefficients for all the
other 4 varieties except Kenyan being positive and statistically significant. The Ugandan
consumers discounted the black seeded cowpeas. These results suggest that efforts to
improve upon grain size and the white testa color will be worthwhile in Uganda as
consumers seem to be more interested in large seeds and white testa. Consumers are willing
to pay more for a pure product and therefore it is recommended that traders and producers
sort their seeds before sale. Awareness creation campaigns on nutritional importance of
cowpeas and a study in regional preference and demand are recommended.
1
CHAPTER ONE
INTRODUCTION
1.0 Background
African economies are increasingly confronted with changing food and commodity markets,
due to globalization, economic liberalization and urbanization. Subsequently, consumer
preferences change. This poses new opportunities but also challenges to small-scale
producers, traders and processors along agricultural value chains. In recent years, the
international debate has refocused some attention to agricultural and rural development,
particularly in Africa. There is broad consensus that for instance the Millennium
Development goals can only be reached if the rural population‘s economic status is lifted.
Rural economic development involves the transformation of agricultural based economies
into more urban-industrial and service-based economies. This can be achieved through
ensuring their active participation in the value chain and producing what the market
demands (Hoeffler, 2006).
1.1 Uganda’s Economy
Although the contribution of the agricultural sector to total GDP has continued to decline
over the years, it still remains pre-dominant in the economy of Uganda. It contributed about
21 percent of the total GDP in 2007. The sector also provides approximately 70 percent of
the employment and most industries and services in the country are dependent on this sector
(UBOS, 2008). Agriculture is still the most important sector of Uganda‘s economy, as
according to 2002 census 79% of households are engaged in agriculture.
2
While development efforts in terms of policy and priority was focused on traditional crops,
like cotton, coffee, tobacco; there is a reverse trend where non traditional crops have
attracted attention of policy makers and researchers in Africa specifically in Uganda, more
so due to decline in world trade and falling commodity prices. According to 2009/2010
Uganda Government National Budget Frame work, although the growth of Uganda‘s
exports remained strong in the first half of FY2008/09 compared to the same period a year
ago (14% increase), the terms of trade, which reflects the relative price of exports to import
prices, worsened as global demand and prices for coffee and cotton declined. For example,
by December 2008, world coffee and cotton prices had fallen by about 25% from a peak in
February 2008. However, within the region, demand for Uganda‘s goods and services
remained strong more so in the non traditional export crops that among others include
flowers, fish and food items like pulses/legumes, banana‘s as well as cereals. This provides
an excellent opportunity for the country to mitigate the effect of falling global demand for
traditional exports.
The Agricultural sector still faces challenges that relate to uncoordinated interventions
which have resulted into ineffective and inefficient use of resources. This is compounded by
lack of reliable agricultural statistics for effective planning and monitoring besides the
derisory markets for the products and lack of a clear framework for regulation and quality
assurance. Under Poverty Eradication Action Plan-Government‘s framework paper, under
the agricultural sector, the priorities are to improve production and marketing under PMA in
order to harness the regional export market, where cowpeas are already making impact.

3
1.2 World Production
Cowpea (Vigna Unguiculata L. Walp) is one of the most important indigenous legumes of
the tropics and sub tropics (NRC, 2006). An estimated 7.6 million tons of cowpea is
produced annually worldwide, estimated to be on about 12.8 million hectares of land of
which about 64% is in Africa, 21% in the America‘s and the rest in Europe and Asia.
Nigeria is the largest cowpea producer accounting for about 22% of the total, followed by
Brazil which produces 10% on 1.144 million hectares of land annually (Pereira, et al.,
2001). In the United states during the 1990‘s, about 21,000 ha of cowpea were grown
annually for commercial dry grain production, mainly in California and Texas, with about
41,000tons of dry grain produced annually (Hall et al., 1996). About 11,000 ha of cowpea
were grown per year for frozen and canned southern peas, mainly in the south eastern U.S.,
and about 30,000 ha of cowpea grown in home gardens mainly for fresh southern peas, but
with some dry grain production.
In Africa information on cow pea marketing and trade is lacking and data on cowpea
production and consumption economics not readily available. In part this is because
marketing research has focused on export crops such as cocoa, coffee, cotton, and
groundnut, and to a lesser extent cereals (Van der Laan, 1999). The main use of cow pea as
a vegetable crop is as a legume, especially for small scale farmers in rural areas. It is very
palatable, highly nutritious and relatively free of metabolites or other toxins and provides an
inexpensive source of protein in their diet (Aveling, 2000)

4
Virtually, every developing country has a chronic protein deficiency. According to Mellor,
(1990), Morley and Hermione (1994), there are increasing cases of malnutrition and many
deaths of infants have been attributed to it. It is thus necessary to suggest, that increasing
consumption of foods rich in proteins is needed (Emaju, 2000). Cowpea constitutes sub
Saharan Africa‘s most widely planted native legumes. At the present, it is the second most
important grain legume continent wide (NRC, 2006).
Beyond its nutritional value, cowpea has a high potential for rural development. Because of
combination of benefits cowpeas offer, it is perhaps the most vital of all Africa's native
vegetables. It seems thus likely that it has the best potential for boosting the nutrition in
African (NRC, 2006).
1.3 Cowpeas Production in Uganda
Cow pea is a short season crop which grows in two seasons during the year as practiced in
cowpea growing areas in Uganda. How ever, 90% of the crop is grown in the second rains
which normally lie between September and December. This is because the distribution of
rainfall often exceeds the optimal requirement of the crop during the early season (March-
May). Danger also exists of having insufficient sunlight to secure ripening and drying of the
pods of the early crop. Disease and pest prevalence are also high during the first rains
(Adipala et al., 1999).

5
Cowpea grain contains between 20-25 percent protein according to McFarlane (1983) and
64 percent carbohydrate (Bressani, 1985). It therefore has a tremendous potential to
contribute to the alleviation of malnutrition. The crop serves to bridge the hunger gap
between planting and harvesting periods of main food crops. It is an inexpensive source of
protein for both rural and urban consumers. In addition, cowpea contributes to the
sustainability of cropping systems and soil fertility improvements in marginal lands by
providing ground cover and plant residues, fixing nitrogen and suppressing weeds (Inaizumi
et al., 1999). They help to maintain yield of agricultural crops in areas where fertilizers are
hard to obtain or are not affordable (Golop et al., 1996). According to Inaizumi et al., (1999)
cowpeas also cause suicidal germination of Striga hermonthica, which is a devastating,
parasitic weed of cereals. Cowpea has been described as an ideal crop for the semi arid
regions of the tropics where other food legumes may not perform well (Afolami, 2002).
Cowpeas differ in characteristics depending on the variety. There are usually 8-20 seeds per
pod. Seeds vary considerably in size, shape and color. They are relatively large (2-12 mm
long) and weigh 5-30 g/100 seeds. Seed shape is correlated with that of the pod. Where
individual seeds are separate from adjacent ones during development, they become
deformed. But as crowding within the pod increases, the seeds become globular. The testa
may be smooth or wrinkled; white, green, off-white, red, brown, black, speckled, blotched,
eyed helium white surrounded by a dark ring) or mottled in color.
According to Adipala et al., (1999), choice of variety by a farmer depends on production
goal (subsistence, commercial or dual purpose) and locality. The cowpea varieties grown in

6
the study region include Icirikukwai (semi-spreading, indeterminate, white seeded), Ebelat
(erect, determinate, white seeded) and a black seeded variety called Kenyan. Two improved
cowpea cultivars were recently introduced (SECOW 1T and SECOW 2 W) according to
reports at Serere agricultural research centre. Traditionally, Icirikukwai was grown solely
for local consumption of leaves and grain. The Kenyan variety was grown solely for sale in
Kenya. Local consumers do not consume the leaves or grain produced by this variety
because of the higher market value when sold in Kenya. Ebelat was grown by subsistence,
dual purpose (transition) and commercial farmers. Earlier studies by Adipala et al., (1999),
amongst farmers, put market value for Icirikukwai being less than for the other varieties
(The costs per unit kilogram for Icirikukwai, Ebelat and Kenyan were; 800, 1350 and 2500
Uganda shillings respectively). Explanations for the low market value of Icirikukwai from
farmer‘s point of view were that it produced a small seed, took longer to cook and had low
yield potential.
Cowpea, though widely grown in Uganda is a crop of the north and east, where it provides
an estimated 60% of all the protein diets to the population (Adipala, 1994). These areas are
the main sources of cowpea to the rest of the country. Edible forms comprise the green
tender shoots and the leaves, unripe whole pods, the green peas and the dry seeds (Aveling,
2000). Dry seeds represent one of the least expensive protein rich foods for both the rural
and urban use. Most of the trade in cowpea takes place in grain form. On a limited scale,
green shoots are also popular in the markets.

7
In Uganda, cowpea is increasingly becoming an important cash crop (Sabiti et al, 1994).
Legumes and pulses including, cowpeas have brought for the small holder farmers in eastern
Uganda some hope as cash crops, especially for varieties demanded by the export market
(NARO/DFID, 2002).
Since the Uganda government policy is to diversify exports and introduce non traditional
cash crops, in the economy, cowpea in this regard presents a great economic potential.
Cowpea is the third most important legume crop in Uganda and is grown in all regions of
Uganda more so in the drier districts. It is most common in the Northern and Eastern
regions, specifically in the districts of Arua, Nebbi, Lira, Soroti, Kumi, Pallisa and Tororo
(Sabiti et al., 1994). For many farmers in eastern Uganda where nearly 90% of the countries
crop is produced Adipala et al., (1997), it has become a major cash crop with the demise of
cotton as the main cash crop and the emergence of important external markets (Sabiti et al.,
1994).
As production and consumption do not occur simultaneously, producers and traders need
efficient storage and transportation systems to ensure timeliness of cowpea availability for
consumers. Consumers, on other hand, want to buy cowpeas at the cheapest price without
compromising quality characteristics such as texture of the skin, color of eye and ease of
cooking. Production, marketing and consumption are, therefore, inseparably linked
(Langyintuo et al., 2002)

8
1.4 Market Performance of Cowpeas
Marketing is a prime mover and stimulator of production. The marketing system is a major
tool of integrating the farming community into the market economy. It links various rural
areas as well as rural and urban areas with a network for communication and exchange,
which forms the basis for co-ordination of social and economic activities. The provision of
secured market outlets gives the incentive to increase output and to diversify subsistence
production into commercial farming. Marketing also provides for the transfer of preferences
and pressures, (through the price system), from consumers to producers, thus supporting
further quality improvement, diversification and specialization in agriculture (Bibangambah,
2002).
1.5 Research
Cowpea is an important food crop in many parts of the semi arid tropics (Jackai et al.,
1985). In eastern Uganda, where nearly 90% of the country‘s crop is produced Adipala et
al., (1997), cowpea production is in transition. It was traditionally grown almost exclusively
as a food crop for domestic consumption; however, with the demise of cotton as the main
cash crop and the emergence of important external markets, many farmers in the region
since grow cowpea for cash markets (Sabiti et al., 1994). Amidst this transition, most
research in Uganda has focused mainly on production, Adipala et al., (1997), pest and
diseases complex (Sabiti et al., 1994; Adipala et al., 1997; Omongo et al., 1997; Omongo et
al., 1998). There are only handfuls of research efforts focusing on the demand side of
cowpeas more so on consumer preference, for example Adipala et al., (1997) which brought
out aspects of producer preference for varieties.

9
However, in recent years, there is evidence that the ‗nutrition transition‘ has reached
developing countries, particularly the urban population there (Millstone and Lang, 2003).
This transition is characterized by a decline in consumption of traditional food crops, and
increasing consumption of refined and processed foods, fats, sugars, and animal foods and
sensitivity to quality (Weinberger and Msuya, 2004).The increasing number of informed and
affluent consumers has led to elevated demand for high quality food products. This
escalating demand for high quality and high status products and a desire for cultural
identification have created a growing market for value-added products that carry a strong
identification with a particular geographical region or consumer preference. Consumers
today are demanding much more than choice – they also want quality, consistency and
value. Much of agriculture has therefore to shift from a philosophy of ―here‘s what we
produce‖ to a situation where farmers take note of what the consumer wants (Mylene and
Kirsten, 2001). New technology should ensure agricultural and food products do have the
characteristics consumers want (Drabenstott, 1995; Boehlje, 2000).
Acceptance and intention to purchase measures like willingness to pay regarding foods as
associated with consumption and purchase process can be used as an indirect way of
obtaining data to understand consumer behavior. Intrinsic variables such as color, aroma,
flavor and texture in food acceptance and choice are very well recognized, several studies
have shown that they play an important role in food acceptance, preference, choice and
intention to purchase (Iop et al., 2006).

10
1.6 Problem Statement
Eradication of poverty and hunger still rank high on the Millennium Development Goals
(UN., 2005). There is broad consensus that for instance the Millennium Development goals
can only be achieved if the rural areas are promoted through appropriate development
programmes. Rural economic development involves the transformation of agricultural based
economies into more urban industrial and service-based economies through value addition to
the agricultural outputs. This changes the flow of resources and the trade of goods, services,
knowledge and information whereby globally coordinated and integrated value chains will
gain increasing importance (Humphrey, 2005).
In the efforts to eradicate poverty, the Uganda Government came up with PEAP, where
modernization of Agriculture is one of the major focuses (PEAP, 2004). Government policy
to diversify exports and thus introduction of non traditional cash crops in to the economy,
cowpea in this regard presents a great economic potential and so worth promoting.
Cow pea is among the major cash and food crops in Africa, Uganda inclusive given the fact
that they mature early on as little as 300mm of rain, there by reducing farmers‘ exposure to
yield risk and serve as important sources of inexpensive protein and income especially for
women, urban and rural poor. It is grown and consumed by many rural and urban
populations besides becoming a major source of income especially in eastern Uganda for the
small holder farmers (Sabiti et al., 1994, and NARO/DFID, 2002). Indeed, the current
structure of income and consumption among the African poor, suggest that significant
reductions in poverty will hinge in large part on the collective ability of African farmers,
Governments and agricultural specialists to stimulate and sustain broad-based agricultural
growth with strong focus on improving marketing conditions for the producers (IFPRI,
2006).

11
Consumer characteristics, behavior and attitudes are ultimate determinants of market
conditions (Jhingan, 1979). Consumption and hence demand next to price and income
largely depends on food preferences of individuals, thus targeting cow pea research at
characteristics that meet consumers‘ tastes and preferences is important. Farmers will be
reluctant to grow varieties that consumers will not buy. Producers and merchants will be
more likely to adopt storage and post-harvest handling technologies that improve the
characteristics that consumer‘s value. Consumer tastes and preferences are reflected in the
market through price discounts and premiums that consumers pay for visible characteristics
(Langyintuo et al., 2002).
However, there is limited information about consumer desired attributes of cowpeas in
Uganda; most research done by Adipala et al., (1997)Sabiti et al.,(1994) and others focused
on production or technology adoption aspects, yet consumers tastes and preferences are ever
changing worsened more so in the current globalized and modernizing cultures in
developing countries . For producers to be assured of the market for their products under
such environment there is important to take care of consumers changing tastes and
preferences. (Weinberger and Msuya, 2004). This therefore calls for a shift in philosophy of
production on side of farmers and researchers by taking note of what the consumer wants as
was also noted by Mylene and Kirsten ( 2001), hence the need for this study.
12
1.7 Objective of the Study
To evaluate consumer preference for cowpea varieties and attributes.
1.7.1 Specific Objectives
1. To describe the socio-economic characteristics of urban consumers of cowpeas
2. Estimate the prices consumers are willing to pay for the given attributes and cowpea
varieties
3. To determine the consumer preferred cowpea attributes
4. Determine the factors that influence willingness to pay for cowpea varieties
1.8 Hypothesis
Cowpea attributes like, seed size, seed color, color mixes significantly influence
consumer‘s willingness to pay for the different varieties.
There is no significant difference in consumer preference in terms of prices
consumers are willing to offer for all the varieties of cowpeas.
Socio-economic characteristics of cowpea consumers does influence willingness to
pay for cowpea varieties
1.9 Significance of the Study
In recent years, the international debate has refocused some attention to agricultural and
rural development, particularly in Africa. There is broad consensus that for instance the
Millennium Development goals can only be achieved if the economic conditions of rural
population are improved. Rural economic development involves the transformation of
13
agricultural based economies into more urban industrial and service-based economies.
Cowpea being an important crop for the poor and the more disadvantaged, promotion of
consumption of such a crop can lead to increased demand which can lead to expanded
supply (Kirsten and Vink, 2005), thus increased incomes of the rural poor.
Uganda Government‘s plan to eradicate poverty through agriculture modernization can be
realized for the rural poor, when the markets for the farmer‘s products are defined and
certain. This can be achieved through understanding what the consumers want and
producing what the market demands. This is being the contribution of this study for cowpeas
in eastern Uganda. This will further inform the efforts to modernize agriculture.
Consumer preferences information will be of great value to researchers to help target their
efforts to traits and practices that lead to cowpea products having characteristics that
consumers demand. The benefit of this new product will be felt directly by producers as they
are able to have better market for their products.
The findings of this study will contribute to the understanding of the factors that affect
domestic cowpea consumption in Uganda and provide a basis for formulation of appropriate
policies and programmes for promotion of local consumption for cowpea.
The findings of this study also will contribute to the existing stock of knowledge on
consumer behavior and can serve as a stepping stone for further research.

14
1.10 Scope of the Study
The study was limited to 161 cowpea consumers, 20 traders in Soroti and Kumi districts
focusing on Soroti and Kumi town councils. Two townships of Bukedea (Kumi district) and
Serere (Soroti district) were also sampled. Soroti and Kumi districts are located in eastern
part of Uganda. It is hoped that this sample is representative of the country given that these
districts produce about 90% of the countries cowpea.
The study delved in consumer, attitudes, preference for cowpea varieties, the desired
attributes and consumer characteristics.

15
CHAPTER TWO
LITERATURE REVIEW
2.0 Introduction
This section presents relevant literature about cowpeas and consumer demand. It presents
studies that are related to the study and the theory upon which it is based.
2.1 Markets and Marketing
2.1.1 Markets
Many developing countries rely on one or a few primary agricultural commodities for the
bulk of their export earnings, though they remain net importers of food on balance. For these
commodity-dependent, low-income, food-deficit economies, the price instability that is
characteristic of agricultural commodity markets can have pronounced impacts on
employment, income, government revenue, and food security. Current efforts to liberalize
trade policies, to the extent that they have increased households‘ exposure to risk, have
arguably exacerbated the problem of price fluctuations for the world‘s poor ( Sarris and
Hallam, 2006). The availability of market for cowpea both domestically and regionally
according to Adipala et al., (1999) makes it a potential income and food security crop for the
rural poor and so the need to understand its consumers, hence defining the market.
From a marketing perspective, a potential market consists of a group of people with similar
needs for a particular good or service, sufficient resources to make a purchase, and the
willingness and ability to buy. Market is said to exist when ever buyers and sellers of a
particular resource or good freely come together leading to a flow of information that creates

16
the opportunity for trade and exchange of resources and goods. Essentially, buyers and
sellers need not come together. How ever, it has been observed that most African markets
for Agricultural goods involve physical contact between buyers and sellers hence the
markets have a clearly defined geographic location. Most Villages have small markets where
traders‘ regularly gather to market their produce. Ferris and Robbins (1999) were able to
identify such markets as road side markets, rural markets/village markets, assembly markets
and direct selling to traders. These same kinds of market play an important role in cowpea
marketing in Uganda (Bibagambah, 2002).
According to Samuelson and Nordhau (1995), the critical characteristic of a market is that it
brings buyers and sellers together to set prices and quantities; leading to their definition of a
market as a mechanism by which buyers and sellers interact to determine the price and
quantity of a good or service.
2.1.2. Cowpea Production and Marketing
Subsistence farmers in the semi-arid and sub humid regions of Africa are the major
producers and consumers of cowpeas. These farmers not only grow cowpeas for dry seed for
human consumption and fodder for animal feed, but also utilize the leaves and fruits for
vegetables. Cowpeas are widely grown in eastern Africa and Southeast Asia primarily as a
leafy vegetable. The protein content of the leafy cowpea parts consumed annually in Africa
and Asia is equivalent to 5 million tones of dry cowpea seeds representing as much as 30%
of the total food legume production in the lowland tropics( Fery, 2002).

17
Over 2.2million small holder farmers grow the crop on an average2.5ha in Uganda. Simple
traditional methods are used. Traditionally, food crop production has been primarily for own
subsistence and local market sales with less than 10 percent entering the market for urban
consumption (Emaju, 2000). Seasonal supply with associated rise and descent in prices also
characterize production. Cowpea prices therefore keep fluctuating through out the year
mostly associated with the harvest season.
The marketing of cowpeas like other crops is mainly confined to local markets and farm
gate. This is attributed largely to lack of access to urban markets by farmers partly because
of the poor road net work and poor modes of transportation. Considerable local trade in
cowpea therefore exists. Inter -regional trade in cowpea too exists and it is a profitable crop
to produce according to Sabiti (1995) and a lot of the crop finds its way to the Kenyan
markets.
Cowpea production and Sale ( 2001-2008) in Soroti district
0
2000
4000
6000
8000
10000
12000
2001
2002
2003
2004
2005
2006
2007
2008
Year
Are
a, Y
ield
& Q
uan
tity
mark
ete
d
Acreage planted
Mts produced
Mts marketed
Fig. 2.1: Quantities of Cowpeas Produced, Marketed and acreage under Production in
Soroti District.
Source: Office of DAO, Soroti

18
Cowpea Production and Sale in Kumi district 2003-2008
0
1000
2000
3000
4000
5000
6000
7000
2003 2004 2005 2006 2007 2008
Year
Hacta
res p
rod
, m
ts p
rod
uced
&m
ark
ete
d
Hectares planted
Mts produced
Mts marketed
Fig. 2.2: Quantities of cowpeas produced, marketed and acreage under production in
Kumi district.
Source: Office of DAO, Kumi
As is shown in figures 2.1 and 2.2, the production, acreage and marketed quantities of cow
peas have been on the increase in both Kumi and Soroti with a drop in 2006-2007 season
due to the flooding as a result of Elnino rains, however after this period, there has been
dramatic increase in both districts with the corresponding increases in the marketed
quantities due to the increasing value attached to the crop. Studies by Adipala et al., (1999),
revealed that, commercial producers invest largest land holdings to the crop than subsistence
and dual purpose producers.

19
District production records for both districts revealed that on the average, the commercial
producers invest more land under cowpea production (2.4 ha), followed by the dual purpose
(0.9 ha), and subsistence category (0.5 ha), which could be explained by the shift towards
commercialization of the crop, due to better profit margins. Adipala et al., (1999), also
observed that the farmers that could afford to buy pesticides cultivate more land for cowpea
production than those who can not afford.
Available land to farmers appeared not to be an issue with regard to size of cowpea fields.
However, lack of capital and inadequate labor seemed to be the main factor restricting
cultivation of larger acreage (Isubikalu, 1998).
2.1.3 Quality of the Product
Storage plays a significant role in product quality and thus grain prices. However, quality-
price relationships are less significant during the dry season when poor quality product may
sell at a higher price than good quality grain at harvest. Prices tend to be positively
correlated over time with damage because damage levels increase with grain scarcity
(Langyintuo et al., 1999). These dynamic effects of grain damage on price can be analyzed
through multivariate approaches like the regression based hedonic price analysis as has been
adapted for this study.
20
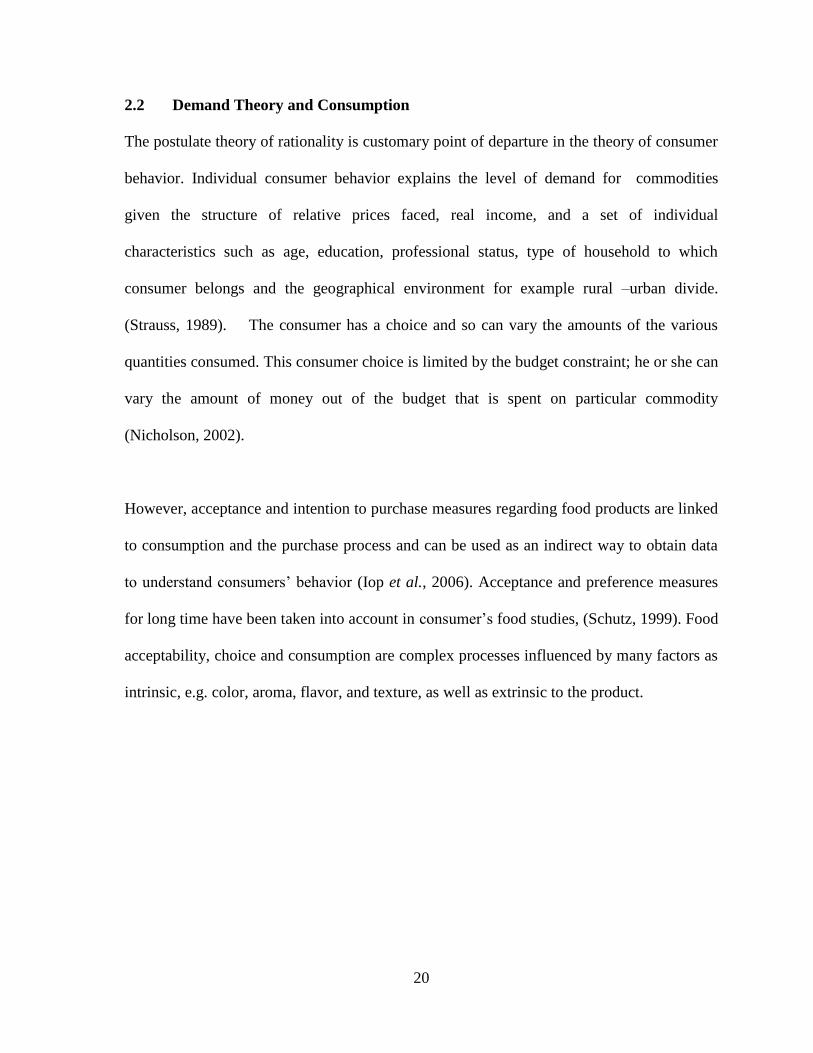
2.2 Demand Theory and Consumption
The postulate theory of rationality is customary point of departure in the theory of consumer
behavior. Individual consumer behavior explains the level of demand for commodities
given the structure of relative prices faced, real income, and a set of individual
characteristics such as age, education, professional status, type of household to which
consumer belongs and the geographical environment for example rural –urban divide.
(Strauss, 1989). The consumer has a choice and so can vary the amounts of the various
quantities consumed. This consumer choice is limited by the budget constraint; he or she can
vary the amount of money out of the budget that is spent on particular commodity
(Nicholson, 2002).
However, acceptance and intention to purchase measures regarding food products are linked
to consumption and the purchase process and can be used as an indirect way to obtain data
to understand consumers‘ behavior (Iop et al., 2006). Acceptance and preference measures
for long time have been taken into account in consumer‘s food studies, (Schutz, 1999). Food
acceptability, choice and consumption are complex processes influenced by many factors as
intrinsic, e.g. color, aroma, flavor, and texture, as well as extrinsic to the product.

21
2.3 Consumer willingness to pay (WTP)
Willingness to pay (WTP) for a product, is defined as the maximum price that can be
charged without reducing the individual‘s welfare and utilization of the product. Marginal
WTP (MWTP) is the WTP for the marginal user (Dossani and Ranganathan, 2003).
Hall et al., (2004) describe the array of techniques available to valuations of the whole set of
goods and services provided by agriculture. They outline five possibilities: (1) opinion
surveys; (2) the use of proxies to estimate public preferences; (3) consensus methods (focus
groups, public juries, interviews, Delphi method); (4) monetary valuation; and (5) multi-
criteria techniques. Of these techniques, in line with Hall et al., (2004), this study will favor
monetary valuation since, unlike the alternatives; this technique relies on the same
theoretical axioms as those that underpin consumers‘ decision processes. Within the range of
monetary valuation techniques some alternatives are available for assessing consumer
preference for agricultural product namely, the contingent valuation (CV) and the choice
experiment , in line with Pattanayak et al.,( 2006) this study favors CV for its ability in
identification of heterogeneity in consumer behavior and segments in agribusiness studies
that serves specialized niche market, where consumers preference are quite different from
aggregate markets (Lusk and Hudson, 2004). This quite well defines this study.
Consumer stated preference (WPT) values are useful in estimating demand where there is no
data on consumer demand for quality improvements. In addition to solving the problem of
missing ‗behavioral data‘, WTP seeks households‘ opinions and preferences during the
planning and design stage which approach is widely viewed as an important ingredient of

22
the economic development process, as rightly put by Sen (1998),- participation is
development. WTP survey also presents an important form of experimentation which lies
somewhere along the spectrum of laboratory experiments and observational studies. Such
survey based ‗field experiments‘ represent a practical mix of control and realism. Control
comes from the design of the survey sample and the structure of the survey instrument.
Contrasted to the laboratory settings of experimental economics, realism comes from
interviewing people in their homes about goods and services that are familiar and important
to their daily life (Houtven et al., 2006).
The use of willingness to pay (WTP) in economic evaluation is becoming increasingly
popular. The technique has become a well-established tool for the evaluation of policies
relating to safety and the environment Jones-Lee, (1989); Arrow et al., (1993) and its
application to health care and other fields is becoming more widespread (Diener et al., 1998;
Klose, 1999; Olsen and Smith, 2001). Although Contingent valuation (CV) is a method
primarily used for monetary evaluation of consumer preferences for non market goods (e.g.
unpriced natural resources), it is also useful in this context and has been applied to value
organic food products Boccaletti and Nardella, (2000); Fu et al.,(1999); Gil et al., (2000),
rice, Dalton, (2004) and Indigenous vegetables Weinberger, and Msuya, (2004) and was
used in this study.
Contingent valuation practitioners, experimental economists, and psychologists have long
recognized that the use of different contingent valuation elicitation formats can result in
divergent value estimates. Comparisons of field and laboratory elicitation studies, for

23
example, indicate that there are systematic and significant differences between values
elicited using continuous e.g., open-ended or payment card and discrete choice contingent
valuation formats. While there are some exceptions values collected using dichotomous
choice (DC) formats typically exceed values collected using open-ended (OE) formats.
Comparisons of discrete choice values and payment card values show a similar relationship,
with discrete choice values exceeding those obtained from payment card (PC) (Houtven et
al., 2006).
Evidence of elicitation effects has played a role in the continuing controversy over the use of
contingent valuation. Some experts suggest that the discrete choice format is the preferred
format. Others have suggested that failure to demonstrate consistency across value
elicitation formats forms a basis for rejecting the validity of contingent valuation altogether
(Welsh and Poe, 1998). However, the authors‘ further studies show that these approaches
are relevant in understanding consumer preferences and both the open-ended and the
payment card techniques elicit WTP measures that are consistent with a higher level of
certainty.
The questions used in WTP survey can be either open ended or closed ended. In an open
ended question, the respondent is asked to state the monetary amount that he or she is
willing to pay for the service that is being valued. With a closed ended CV question (also
referred to as a "dichotomous choice" or "referendum" question), the respondent is asked
whether he or she is willing to pay a specified, shilling amount for the good being valued.
24
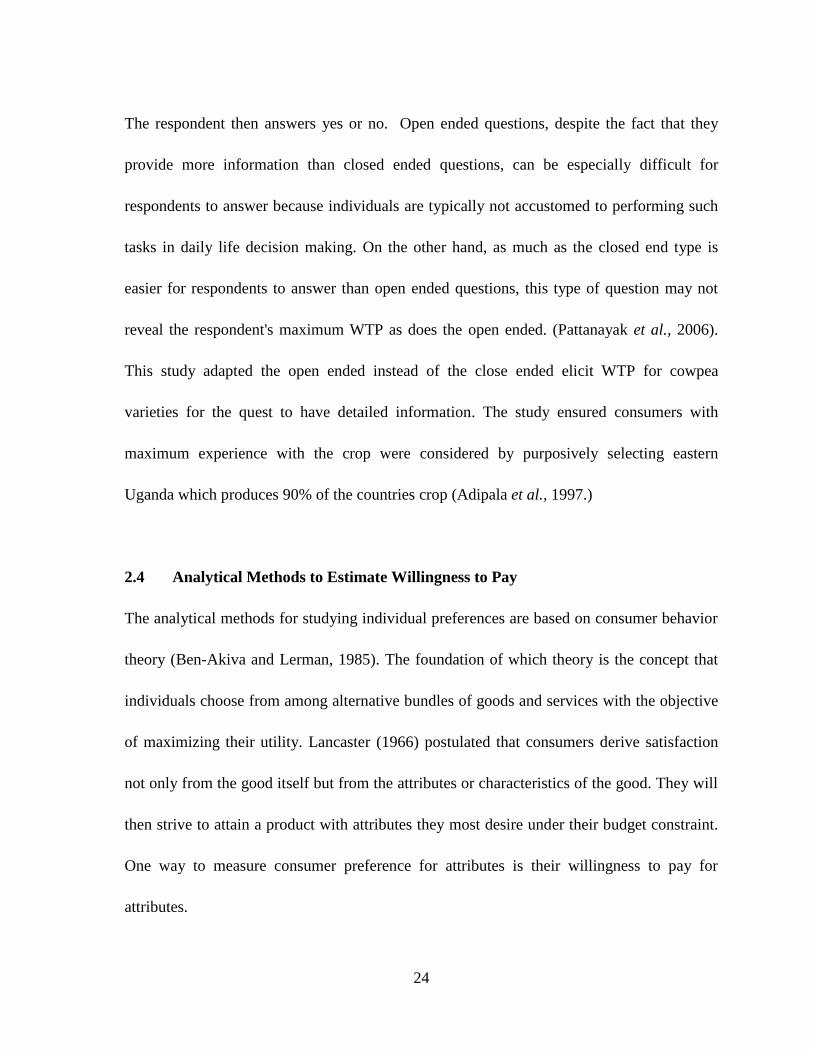
The respondent then answers yes or no. Open ended questions, despite the fact that they
provide more information than closed ended questions, can be especially difficult for
respondents to answer because individuals are typically not accustomed to performing such
tasks in daily life decision making. On the other hand, as much as the closed end type is
easier for respondents to answer than open ended questions, this type of question may not
reveal the respondent's maximum WTP as does the open ended. (Pattanayak et al., 2006).
This study adapted the open ended instead of the close ended elicit WTP for cowpea
varieties for the quest to have detailed information. The study ensured consumers with
maximum experience with the crop were considered by purposively selecting eastern
Uganda which produces 90% of the countries crop (Adipala et al., 1997.)
2.4 Analytical Methods to Estimate Willingness to Pay
The analytical methods for studying individual preferences are based on consumer behavior
theory (Ben-Akiva and Lerman, 1985). The foundation of which theory is the concept that
individuals choose from among alternative bundles of goods and services with the objective
of maximizing their utility. Lancaster (1966) postulated that consumers derive satisfaction
not only from the good itself but from the attributes or characteristics of the good. They will
then strive to attain a product with attributes they most desire under their budget constraint.
One way to measure consumer preference for attributes is their willingness to pay for
attributes.

25
Several analytical methods have been used in measuring consumer‘s acceptance and
willingness to pay for products. These include; product improvement index model Thomas
(2002), Analysis of Variance (ANOVA) Mead et al., (1993) and hedonic pricing method
(Ladd and Martin, 1976).
The concept underlying hedonic models is that the price of a heterogeneous good is a
function of the attributes of that Good (Lancaster, 1966 and Larue, 1991). The model then
tries to capture the relative importance of each attribute in determining the price of the good
(Ladd and Martin, 1976). A hedonic model suggests that the price consumers are willing to
pay for a product is a function of attributes (Hayes and Lence, 2002). The approach is based
on the assumption of perfect competition and utility maximization and that, participants are
price takers and have full information and the product is assumed to be purchased by
consumers for its attributes (Ladd and Martin, 1976).
This approach has been applied in many contexts to estimate the implicit prices or values of
non market goods (attributes). In agricultural markets, the approach has been used to
estimate the attribute value of cotton by Bowman and Ethridge, (1984); Ethridge and
Nipper, (1987), rice by Brorsen et al., (1984); Dalton, (2004). Williams and Longworth,
(1989) used the hedonic pricing approach to determine critical characteristics for yellow fin
and bigeye tuna pricing at the Tsukiji market in Japan. Rosen, (1974) estimated hedonic
pricing models to examine how product attributes affect price in perfectly competitive
markets. Unnevehr and Gounzou, (1998) used hedonic modeling to investigate retail
premiums for honey products. Price was regressed as a function of flavor, size of bottle, type

26
of container and brand. The model explained up to 77% variation in honey price. Gillmeister
et al., (1996) used a hedonic price analysis to examine milk prices at farm level in USA and
found out that demographic and socioeconomic variables influence the price paid for a
particular product. In the U.S wine market, a hedonic pricing model based on sensory
quality ratings was estimated (Schamel et al., 1998). Studies by Deodhar and Intodia, (2002)
on ghee indicated that consumers were willing to pay premium for branded over non
branded ghee. Flavor was an important attribute valued by consumers.
Hedonic models as shown above have been widely used in consumer economics to evaluate
the characteristics of food products. Following the standard hedonic price model, the price
of cowpeas, P, is assumed to be described by a hedonic price function, P(x), where x is a
vector of product characteristics. Consumers observe, at the moment of purchase, the
intrinsic and extrinsic product quality cues but not the quality attributes. Intrinsic cues are
characteristics of the product such as color, freshness, and aroma, while extrinsic
characteristics affect quality perceptions such as price of the product, store, label, and
popularity of the product. Steenkamp, (1990) writes, ―Quality cues are what consumer
observes, and quality attributes are what consumer wants.‖
Fewer hedonic studies, Tronstad et al., (1992); Harper and Greene, (1993); Kajikawa,
(1998) specifically look at price–quality relationships of legumes such as cowpea. Apart
from hedonic models, techniques such as conjoint analysis and choice models have been
used to examine consumer preferences for agricultural commodities like, legumes, apples,
and livestock with differing characteristics (Manalo, 1990; Cheng et al., 1996). The lack of

27
empirical work related to cowpeas characteristics is somewhat surprising; given the
evidently growing importance of cowpea varieties and product attributes in it is marketing
system both nationally and regionally.
While hedonic prices for cowpeas can provide interesting insights into the role of product
quality in cowpea markets, a complete understanding of the relationship between cowpea
prices and other product characteristics including variety, storage method, grain size, can
provide important information to market traders regarding appropriate marketing strategies
to manage inventories, and for assigning priority to factors that augment price premiums.
Furthermore, such information can allow plant breeders to assess the importance of key
variety characteristics for strengthening the competitive position of cowpeas. A hedonic
price model was therefore selected for this study.

28
CHAPTER THREE
METHODOLOGY
3.0 Introduction
This section handles the method used to for the study. It consists of a brief on the study area,
the techniques used to come up with the sample, the data collection and analysis methods
used.
3.1 Study Area
This survey study was conducted in the districts of Soroti and Kumi. These districts are
found in the eastern region of Uganda. They were selected because it is where nearly 90% of
the country‘s cowpea crop is produced Adipala et al., (1997), and Cowpea production here
is in transition- It was traditionally grown almost exclusively as a food crop for domestic
consumption; however, with the demise of cotton as the main cash crop and the emergence
of important external markets, many small holder farmers in the region now grow cowpea
for cash markets (NARO/DFID, 2002, Sabiti et al., 1994).
3.2 Sampling Techniques
A multi-stage sampling technique was used. The first stage involved purposive selection of
the two districts. Within each district, two towns were purposively selected basing on
consumption figures. Soroti and Kumi towns were then selected within which wards with
highest number of consumers were selected. This was done to increase chances of having
respondents with high experience with the crop. Household participation in market
transactions depends on market existence and completeness and the type and magnitude of

29
transaction costs they encounter, the study focused on Soroti and Kumi urban consumers as
they access most of their grains from the market. This selection was done with help of
district production office, local council officials and Serere Agricultural Research Institute
researchers. Many criticisms of contingent valuation(CV) methods focus on the intangibility
of valuing the good in question and hence this criterion ensured that consumers with high
experience with the crop attributes were considered in order to minimize any bias introduced
through unfamiliar and abstract traits (Dalton, 2004., CIE., 2001).
Forty households were then randomly sampled from a list of all households prepared in
consultation with local councils using the bowl and fish method. The unit of analysis was a
household. A total of eighty one respondents were selected from Soroti (Serere and Soroti
towns) and eighty from Kumi (Kumi and Bukedia towns). This depended on the population
of the districts. A total of one hundred and sixty one consumers were interviewed.
From a list of local markets two that handle highest volumes of cowpeas in each district
were selected. From these markets a list of cowpea traders were prepared with the assistance
of market administration. Ten traders were selected from each market giving a total of
twenty traders from each district. Each trader was presented the samples for sensory
evaluation. From the list of ten respondents, two traders were selected as representatives
from which to collect market information as contact traders for one week. Two focus group
meetings were held with these traders and one for consumers in each district (Soroti and
Kumi), both male and female in attempt to understand the way the grains are prepared and
the consumer attitudes.

30
3.3 Data Sources and Collection
The primary data from households was collected through interviews using semi and
structured questionnaires. The secondary data were collected from office of DAO, Soroti
and Kumi Districts.
Two trained research assistants were employed in data collection and the researcher
supervised them as he moderated the four focus group discussions. From the field,
information on household characteristics, tastes and preferences for cowpeas were collected
for analysis. Other relevant information was collected from the district production offices.
The study relied more on primary data collected from the field.
3.4 Preparation of Sample and Data Collection
Consumers were shown samples of each variety (Icirikukwai, Ebalat, SECOW1T, SECOW
2W and Kenyan) Adipala et al., (1999), NARO/DFID, (2002) and asked to rate each variety
according to its provision of attributes. Experimental samples were prepared, coded (Sample
5, sample2, sample4 sample3 and sample 1, respectively) with the help of Serere
Agricultural Research Institute researchers to eliminate name bias and presented to
respondents. The attribute information provided by respondents for each variety was then
cross checked against taxonomic information on cowpea varieties, which is well
documented, to verify whether consumer‘s perceptions of variety attributes are consistent
with established scientific records (Svetlana, 2007).
31
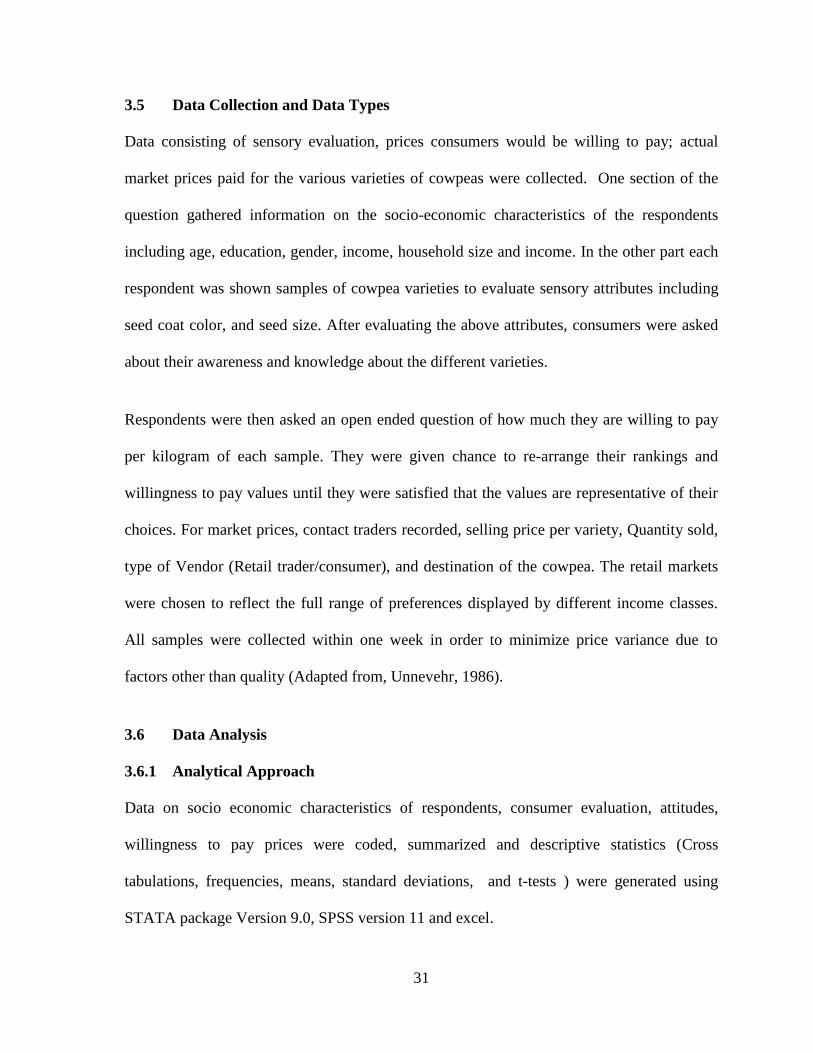
3.5 Data Collection and Data Types
Data consisting of sensory evaluation, prices consumers would be willing to pay; actual
market prices paid for the various varieties of cowpeas were collected. One section of the
question gathered information on the socio-economic characteristics of the respondents
including age, education, gender, income, household size and income. In the other part each
respondent was shown samples of cowpea varieties to evaluate sensory attributes including
seed coat color, and seed size. After evaluating the above attributes, consumers were asked
about their awareness and knowledge about the different varieties.
Respondents were then asked an open ended question of how much they are willing to pay
per kilogram of each sample. They were given chance to re-arrange their rankings and
willingness to pay values until they were satisfied that the values are representative of their
choices. For market prices, contact traders recorded, selling price per variety, Quantity sold,
type of Vendor (Retail trader/consumer), and destination of the cowpea. The retail markets
were chosen to reflect the full range of preferences displayed by different income classes.
All samples were collected within one week in order to minimize price variance due to
factors other than quality (Adapted from, Unnevehr, 1986).
3.6 Data Analysis
3.6.1 Analytical Approach
Data on socio economic characteristics of respondents, consumer evaluation, attitudes,
willingness to pay prices were coded, summarized and descriptive statistics (Cross
tabulations, frequencies, means, standard deviations, and t-tests ) were generated using
STATA package Version 9.0, SPSS version 11 and excel.

32
To determine the effect of cowpea attributes, and consumer characteristics on willingness to
pay for cowpea varieties, a hedonic pricing model was used. It was used to estimate the
extent to which attributes like grain size, eye color, grain color, meal making suitability and
consumer socio economic characteristics like gender, education income, and household size
affect willingness to pay for cowpeas.
3.6.2 Model Specification
Willingness to pay responses were screened for validity and consistency with several tests.
A test of the mean willingness to pay for varieties that the consumer wished to purchase,
versus those that are not to be consumed. Secondly for each consumer, ordinal preference
rankings of the varieties were compared against stated willingness to pay for a crop of
choice to determine whether stated varietals preferences coincided with expressed
expenditure patterns for crop. Under the axiom of revealed preference, a variety is weakly
preferred over another if expenditure for the variety is non-decreasing when compared with
an inferior variety and strictly increasing if the variety is strongly preferred. This stated
willingness to pay for each sample was used as the dependent variable in the hedonic model.
3.6.3 Hedonic Model Frame Work
This is based on Lancaster‘s (1966a, b) model of consumption theory. He regards the
characteristics of the good and not the good it is self as the direct object of utility. This
concept has widely been used to estimate demand for quality of goods. Thus, price
differences across different units of transactions are due mainly to quality differences that
can be measured in terms of the characteristics. Ladd and Suvannunt (1976) used this

33
concept to develop the consumer goods characteristics model which describes the price of a
good as a linear summation of the implicit value of its attributes. They showed that;
dEdU
jdXdU
dqi
jdXpi
M
j
00
1
…………………………………………………….. (1)
Where;
Pi is the market price of product i, X0j the total amount of the mth
product characteristic
provided by consumption of all goods, qi the amount consumed of product i, and E is total
expenditure.
dX0j/dqi is the marginal yield of the jth
product characteristic by the ith product.
The marginal utilities of the jth product characteristic and of income are respectively
dU/dX0j and dU/dE.
If we assume that expenditure equals income, ((dU/dX0j)/ (dU/dE)) can be regarded as the
marginal implicit price of the jth characteristic. This may be represented by βij if we assume
a constant marginal implicit price.
Given that most product characteristics are constant, the marginal yield
(dU/dX0j =Xij) ,may be assumed constant.
In terms of the current cowpea demand analysis,
Eq. (1) can be expressed as:
vijXijPi …………………………………………………………………… (2)
Where Pi = price, (WTP) of cowpea varity i (Ug.sh)
Xij the quantity of cowpea grain characteristic j, such as:
size of grain, Testa colour, testa texture and eye colour
βij the implicit price of characteristic j, to be measured and v is a stochastic error term.

34
Regressing product characteristics as measured by the Xij provides a test of the hypothesis
that pi is linearly related to the Xij‘s.
Stated willingness to pay (WTP) for cowpea grain was used as the dependent variable in the
hedonic model. (Pi)
The estimates of implicit values of characteristics can be used to estimate the price of an
unobserved product by valuing embodied characteristics (Dulberger, 1989). Hence the
implicit prices for characteristics derived from hedonic estimation help highlight areas for
future cowpea research and policy initiatives.
3.6.4 Estimation
Most researchers have estimated the hedonic function above through regression analysis. By
regressing consumer good prices on characteristics, a coefficient representing the implicit
price of characteristics can be derived. This is the approach that has been pursued by Uri et
al., (1994), Veeman, and Adomowiez (2000), Brorsen et al., (1984), Ladd and Suvannut,
(1976) Triplett, (1986), Lowenberg-DeBoer, (2002) Dalton, (2004),Waugh, (1928, 1929)
and was adapted for this study.
For each of the Varieties, the following hedonic equation was specified:
YiiXiPi ……………………………………………… (3)
Where;
Pi = Willingness to pay for a Kilogram cowpea grains of variety i in Uganda Shillings.
Xi = Consumption attributes as defined in table 3.1
βi = is the estimated coefficient on the consumption attributes,
Yi = Household socio-economic characteristics as defined in table 3.1
ψi i = 1…..40, is coefficient for household socio- economic characteristics.
υ = Stochastic error term.

35
Table 3.1: Attributes in the Model
Attribute(X) Measurement
Seed coat Color (5) Excellent (4) Good (3) Fair (2) Bad (1) Very bad
Seed shape (5) Excellent (4) Good (3) Fair (2) Bad (1) Very bad.
Seed meal making suitability properties:
(SMS)
(5) Excellent (4) Good (3) Fair (2) Bad (1) Very bad.
Grain size (5) Excellent (4) Good (3) Fair (2) Bad (1) Very bad.
Grain eye color (5) Excellent (4) Good (3) Fair (2) Bad (1) Very bad
Time taken for grain to cook. In minutes
Grain damage tolerance 1 (does not tolerate), 2(1-10%), 3 (10- 20%), 5(Not
important).
Grain color mixes(GCM); Important = 0, Not important = 1
Grain size mixes Important = 0, Not important = 1
Socio economic characteristics(Y) Measurement
Education Number of years of schooling of household head
(Measured in years spent in school)
Income of respondent Respondents were asked /guided to estimate their
annual cash earnings (Ug. Shillings)
Gender Female = 1, male =0
Household size Number of family members in the household.
Awareness Aware of the Variety = 1, Not aware = 0
To ensure validity of the data, multicollineality was tested using two methods; Covariance
matrix and Variance inflation tests. None of the variables were highly correlated with each
other and the researcher went ahead to estimate the model in equation 3 above using
ordinary least squares (OLS).

36
CHAPTER FOUR
RESULTS AND DISCUSION
4.1 Introduction
This chapter presents and discusses the empirical results based on the data collected from
161 urban households and traders of Soroti and Kumi districts. The results are summarized
as means, percentages and coefficients. This chapter has four sub sections, the first looks at
the socio economic characteristics of the urban cowpea consumers and their knowledge and
attitude towards the different varieties of cowpeas. The second part looks at cowpea
attributes considered by consumers when buying cowpeas. The third part deals with
consumer willingness to pay for different varieties in terms of mean prices and then the last
part focuses on the factors that influence willingness to pay for cowpea varieties using
Hedonic pricing model. The Varieties grown in the study area and considered in the study
are presented in table 4.1
Table 4.1: Samples Used in the Model
Sample label Actual Name Characteristics
1 Kenyan Black testa, white eye color and small seeded.
2 Ebalat White testa color, small seeded, white eye
color, traditional variety
3 SECOW 2W White testa, relatively large seeded, white eye
color, improved new variety
4 SECOW1T Tan seeded and large sized white eye color.
improved new variety
5 Icirikukwai
White seeded and small sized, white eye
color, traditional variety

37
4.2 Socio-economics Characteristics of Urban Cowpea Consumers
Characteristics of consumers of cowpeas such as age, household size, gender and education
are important in conducting product market acceptance studies because they influence
consumption patterns and willingness to pay (Campiche, et al, 2004). Certain foods be it,
animal source foods, legumes or fruits and vegetables may be consumed in insufficient
quantities either because they are given low preference due to lack of nutritional knowledge,
or because they are not affordable. Food and nutritional policies therefore require detailed
knowledge of the interaction between household socio economic characteristics, food prices,
and food and nutrient choice (Abdulai and Aubert, 2003). Some socio-economic
characteristics of the respondents are as presented in table 4.2.
Table 4.2: Socio-economic Characteristics of Urban Cowpea Consumers
Variable Mean(n= 161) Standard deviation
Age ( years) 37.9 15.458
Education (years of schooling) 7 3.826
Household size 5 2.223
Income (Mean annual income Ug.
Shillings)
2,210,000 2569.513
The average age of the respondents was 37.9 years, this being the economically active age
group in Uganda and are likely to have some disposable income. The mean educational level
for the respondents was primary seven. They on the average have five members in their
family and earn monthly income of about 184, 000/= (US$ 93.4) which translates in to daily
income of 6000/= (US$ 3.11), which is higher than the poverty line of 1US$ a day meaning
high purchasing power of the interviewed group.

38
Table 4.3 shows that 65.8% respondents were female and 34.2% male. This could imply
women appreciate the crop more than their male counterparts, being a food security crop.
IFPRI, (2001) describes equity concerns for economic growth in terms of helping vulnerable
groups; women and smallholder farmers improve food security. This could imply that
cowpeas play key role in economic growth as it is a food security crop that supports the
families immediately after dry season Adipala et al.,(1999) and cherished by women as they
are charged with the responsibility of providing and making food decision for about 55% of
families (table 4.4).
Table 4.3: Gender of Respondents
Gender of respondent Freq. Percentage
Male 55 34.16
Female 106 65.84
Total 161 100.00
In line with gender roles, in this study, 55% of the mothers were found to be concerned with
household chores in terms of food decision in the household while 45 % of the male are
involved in the same decision (table 4.4). This finding is in line with traditional institutions
and sexual divisions of labor as much as this thinking is being influenced by western
influences (Plattnum, 1989 and Ravnborg, et al., 2004).
Table 4.4: Food Decision in the Household.
Who decides what to eat at
home
Frequency Percentage
Father 73 45.3
Mother 88 54.7
Total 161 100

39
The study revealed that decisions within the households pertaining what to consume for the
day is made by 55% of the mothers and 45% by fathers. In accordance with previous
studies, experience, exposure and knowledge Hallman (2000), values and beliefs Baker and
Burnham (2001), socio economic status and demographic characteristics are important in
determining food decision of individuals and should be of interest to policy makers and
planners. For example, according to Abdulai and Aubert (2003) women‘s schooling and
income have significant influence on the consumption of foods with high nutritional value.
These results suggest women are a key avenue for food related policy interventions targeting
the family.
4.3 Consumer Awareness and Attitudes towards Cowpeas
Consumer awareness is important in creating an environment for consumers to develop
product familiarity and the ability to evaluate different alternatives available for satisfying
want. According to Zellner (1991), familiar foods are generally liked more than unfamiliar
foods. Krishnan et al., (1999) in a study on consumer willingness to pay for sea foods and
domestic market development indicated that, good knowledge, and awareness by consumers
have a positive influence on willingness to pay for sea foods and domestic market
development. Therefore consumer‘s awareness and attitude of the varieties were
investigated and the results are reported in table 4.5.
Table 4.5: Response (%) of Consumer awareness of Cowpea Varieties
Variety Sample Percentage aware of the
Variety(%)(N= 161)
Kenyan 1 70.25
Ebalat 2 98.09
SECOW 2W 3 93.59
SECOW 1T 4 62.26
Icirikukwai 5 99.38

40
In the efforts to find consumer knowledge of the crop and its varieties and the value of the
knowledge, 92.6% of the respondents emphasized the importance of the need to be able to
identify the different varieties of cowpeas, while only 7.41% did not feel the need. Focus
group discussion with market vendors in Soroti and Kumi revealed that the type of cowpeas
grown or purchased is important depending on the intended purpose, for example, those
buying for re- sale would want types that have high demand, but for home consumption
normally go for the common varieties.
The percentage awareness for Ebalat, SECOW 2W and Icirikukwai varieties, according to
table 4.5 is over 90%. This could imply that the respondents were conversant and familiar
with the samples. Similarly, considering all the 5 samples from table 4.5, at least all the
samples scored over 60% as far as awareness is concerned. Focus group discussions with
women in Kumi did reveal that many of the consumers find it hard to differentiate between,
Ebalat, Icirikukwai and the newly introduced SECOW 2W, this could be true due to the fact
that these three have white seed coat color and almost same size, which according to figure.
4.4 are the most important qualities valued by consumers for meal making suitability.
4.3.1. Attitude towards Cowpea
The researcher also attempted to assess the attitude that respondents have towards cowpeas
by asking a range of yes/ no questions. As indicated in figure 4.3 and table 4.6,
overwhelming majority of respondents (99.4%) stated that they do prepare a meal out of
cowpeas.

41
Table 4. 6: Meal Production out of Cowpeas
Meal production out of Cowpeas Frequency percentage
Yes 160 99.38
No 01 0.62
Total 161 100
As shown in Figure.4.2, 71% serve cowpeas to visitors. This finding is in agreement with
that of Weinberger and Msuya (2004) in a study on vegetables in Tanzania, where 90% of
the consumers serve vegetables like cowpeas to visitors. Women in focus group discussion
in Kumi revealed that visitors are served with the best the family can offer, which normally
takes the form of chicken, slaughtering goat or purchasing meat from the market. In all the
servings‘ they said, cowpea, pasted in simsim or groundnuts is a given. It is almost served
by every family for all visitors most especially visitors that come from towns or the city.
This expression means a lot for local market potential for the crop, if promoted and
strengthened, it can become a stable delicacy for all income and age groups, as there are
signs that those from urban settings or cities still treasure it.
Serving Cowpea meal to Visitor
47
29%
114
71%
No
Yes
Fig. 4.1: Serving Cowpeas to Visitors

42
Cowpeas value could further be expressed with the help of figure 4.2 which shows that up to
73 % of the respondents would serve it on special occasions, such as weddings, burials and
religious holidays. Key informant discussions with contact traders also revealed that
cowpeas are still being used culturally by the elders to thank and appease the gods, by
offering the first pinch of food to them. This in a way helps in perpetuation of biodiversity.
Serving and consumption of Cowpeas on special Occations
43
27%
118
73%
No
Yes
Fig. 4.2: Serving Cowpeas on Special Occasions
Similar to findings by Weinberger and Msuya (2004) in a study on vegetables in Tanzania,
all focus groups in Soroti and Kumi reported overwhelmingly that cowpeas make important
contribution to their diet when there is food shortage. ‗cowpeas are a real friend in need,
within 2 to 3 weeks of planting it can save your life, its here to stay as expressed by a lady in
focus group discussion in Kumi’. This popularity and positive attitude towards the crop can
be explained by the fact that cowpea is a drought-tolerant crop, ideal for the dry conditions
in the study area. Cowpeas have high protein content, sources of energy and micronutrients
as is associated in diets of isolated communities Grivetti and Ogle, (2000) characteristic of
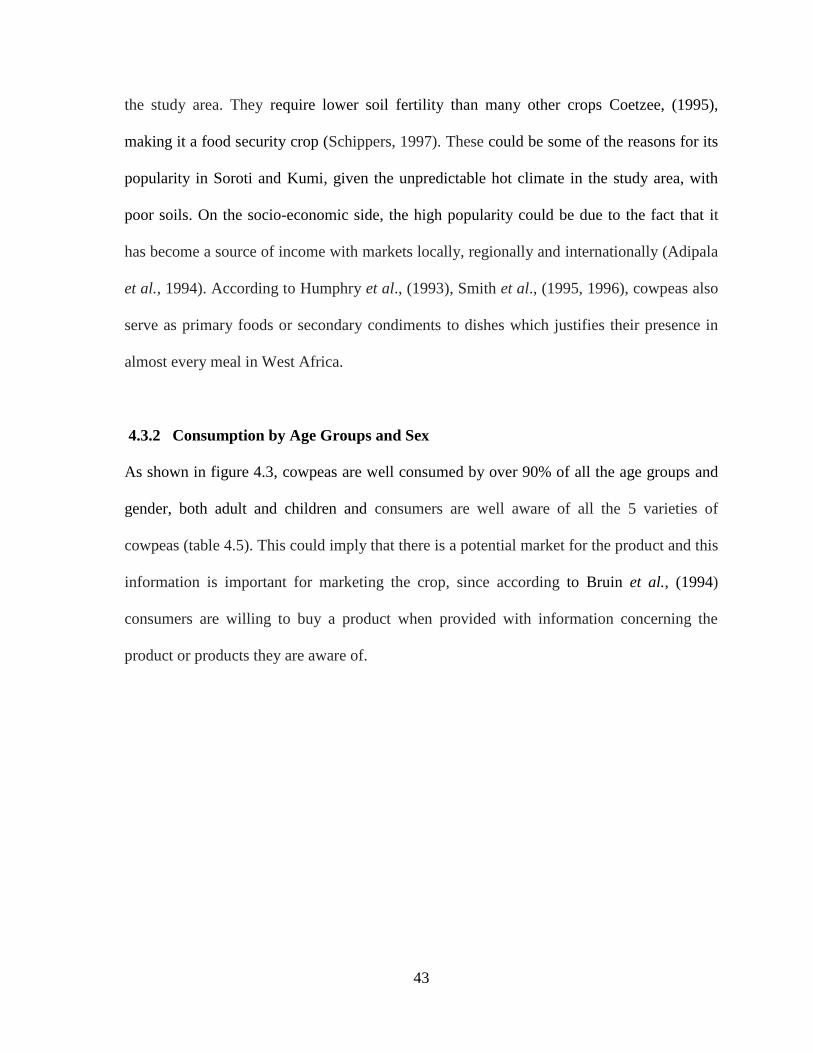
43
the study area. They require lower soil fertility than many other crops Coetzee, (1995),
making it a food security crop (Schippers, 1997). These could be some of the reasons for its
popularity in Soroti and Kumi, given the unpredictable hot climate in the study area, with
poor soils. On the socio-economic side, the high popularity could be due to the fact that it
has become a source of income with markets locally, regionally and internationally (Adipala
et al., 1994). According to Humphry et al., (1993), Smith et al., (1995, 1996), cowpeas also
serve as primary foods or secondary condiments to dishes which justifies their presence in
almost every meal in West Africa.
4.3.2 Consumption by Age Groups and Sex
As shown in figure 4.3, cowpeas are well consumed by over 90% of all the age groups and
gender, both adult and children and consumers are well aware of all the 5 varieties of
cowpeas (table 4.5). This could imply that there is a potential market for the product and this
information is important for marketing the crop, since according to Bruin et al., (1994)
consumers are willing to buy a product when provided with information concerning the
product or products they are aware of.

44
Fig. 4.3: Cowpea Consumption by Age Group
However, study results in table 4.7 also show that it is only 80% of the parents who teach
their children how to prepare a meal out of the crop, meaning one out of five households do
not teach their children how to prepare the crop. This could imply that the skill to produce,
store and prepare a meal out of the product may be lost to the future generation.
Table 4.7: Parents Teaching their Children to Prepare Cowpeas
Parents teaching Children Frequency percentage
Yes 129 80.12
No 32 19.88
Total 161 100
According to Weinberger and Msuya (2004) in a study on vegetables in Tanzania, when
vegetables like cowpeas are not prepared and consumed, this is the first step to their
extinction especially when the young generations are not taught to embrace the crop. This
has grave implications for the future of cowpeas in Uganda and it could mean that less and
less of the younger generation will develop love for the crop.
95.65 96.27 93.17
4.35 3.73 6.83
0
20
40
60
80
100
120
Males Females Children
Age group & Gender category
%Yes %NO
Pe
rce
nta
ge
Re
sp
on
se

45
4.4 Seed Property Consumers Value for Meal Making
Seed color is considered by 56% of the interviewed households as the most important
quality factor for meal making while 39 % consider seed size as most important quality
characteristics for making decision on consumption and seed suitability (Figure. 4.4).
Seed Property important for meal making
56%
4%
39%
1%
Seed colour
Seed shape
Seed size
Others
Fig. 4.4: Seed Property Valued by Consumers for Meal Making Suitability
Studies by Wolfson et al., (1989) on farmer‘s preference for cowpeas and then repeated by
Lowenberg-Deboer, (1996) in Cameroon, revealed the preference of farmers for and
importance of seed size and color as selection criteria for a good seed with market potential.
Their reports indicate that large white-seeded cowpeas are more readily marketed and are
typically sold at a premium amongst a wide array of landraces varying in seed type and
color. They concluded that it is an indication of increasingly important role of cowpea as a
cash crop. Further studies by Langyintuo et al., (2004) on consumer preference for cowpeas
in Cameroon and Ghana revealed that most consumers there prefer large grain size. They
further noted that consumer tastes and preferences are reflected in the market through price
discounts and premiums that consumers pay for visible grain characteristics. In some cases,

46
these visible indicators are proxies for some biochemical characteristic, such as cooking
time, sucrose level or protein content. In other cases, the visible characteristics are directly
related to the way cowpeas are used in food preparation.
The women in Kumi focus group discussion seem to prefer large white or brown seeded for
the reason that it mixes well with their traditional way of pasting with simsim or ground nut
paste, giving rise to eye-catching source. They also at times roast the grains to be consumed
as a snack and they said the white color is better for this purpose.
4.5 Consumer Evaluation of Cowpea Attributes
In order for consumers to accept and pay for a product, that particular product must contain
attributes that are considered most important and attractive to their attention and they form
the basis for their preferences (Benedict et al., 1996). The results of urban consumer
evaluation for grain color, eye color, and seed size are presented in table 4.8
Table 4.8: Mean sensory scores for cowpea variety attributes by consumers in Kumi
and Soroti district
Cowpea
Variety
Grain
Color
Grain
shape
Grain
size
Grain eye
color
Meal making
suitability
Kenyan 1.53c 2.32
d 1.72
d 2.31
e 2.22
e
Ebalat 4.15a 4.46
b 4.24
a 2.64
d 4.19
d
SECOW 2W 4.15a 4.46
c 4.22
a 3.07
c 4.18
c
SECOW 1T 3.19b 3.89
a 3.29
c 3.03
b 2.61
b
Icirikukwai 4.15a 4.47
a 4.23
b 4.41
a 4.17
a
C.V (%) 28.89
26.27
27.59
36.86
31.92
F-Value
17.70***
2.04
** 4.57
*** 2.44
*** 3.38
***
NB: means with the same letter in the same column are not significantly different.
***, significance at 1%, **, significance at 5%
Scale: 1= very bad, 2= Bad, 3= Fair, 4= Good, 5= Excellent
47
Ebalat, SECOW 2W and Icirikukwai had significantly (P =0.000) higher average score for
grain color, while Kenyan had the least score. The Kenyan variety black seed coat color
could have been the influencing factor, while SECOW1T being tan in color, and less
preferred to the three. In a related study, Watters et al., (2002), noted that color plays crucial
role in first impression and evaluation of food based on visual assessment and found a
positive implication on acceptance of raw apples. Adipala et al., (2002) also found out that
farmers in the study area would select white seeded cowpeas for local consumption and only
grow the black seeded for export market. This connects very well with the findings of this
study that consumers in the study area too prefer white seeded cowpea, which agrees with
studies done by Kitch et al., (1998) in West Africa concluding that the importance of seed
size and color as selection criteria appears to reflect the increasingly important role of
cowpea as a cash crop, which also agrees with previous studies by Sabiiti (1994) in the study
area on farmers seed selection.
The grain shapes for the four varieties with exception of Kenyan were consistently above the
score 3.5 (between fair and good) which could imply that all have acceptable grain shape
(figure 4.5). The Kenyan scored least (2.32). Icirikukwai and SECOW 1T did not score
significantly different from each other, so did Ebalat and SECOW 2W. However, Focus
Group Discussions (FGD) in Soroti and Kumi and figure. 4.4 indicate that consumers did
not take grain size as key factor that influences their choice for meal making suitability.
Icirikukwai was scored highest and best as regards grain shape, followed by Ebalat and
SECOW 2W.

48
The results of evaluation of grain size showed, Ebalat, and icirikukwai to be more superior
to all the varieties, followed by SECOW2W. However, all the other 4 varieties except the
Kenyan scored above 3.0, possibly implying are acceptable by consumers as opposed to the
Kenyan variety, which scored, barely 1.72. These results agree with studies by Kitch et al.,
(1998) in West Africa which indicate that large white-seeded cowpeas are more readily
marketed and are typically sold at a premium.
From Figure. 4.4, seed eye color did not appear as important factor in consumer
consumption decision, how ever, all the samples under consideration had white eye color
which varied in size and consumers scored Kenyan and ebalat varieties rather lower than the
other three. How ever these results were not statistically significant except for Icirikukwai
and SECOW 2W.
Consumers scored Ebalat, Icirikukwai and SECOW 2W significantly (P= 0.01, 0.019 and
0.096 respectively) highest as being most suitable for meal making while the black seeded
Kenyan type and the tan colored introduced SECOW1T were scored least. This is in line
with earlier studies by Adipala et al., (1999) who found that farmers in eastern Uganda,
made choice of variety depending on production goal, Icirikukwai and Ebalat being
preferred by farmers to satisfy household and local demand, while the Kenyan for external
market.

49
Mean rank score for cowpea varieties
0
1
2
3
4
5
Kenyan Ebalat SECOW 2W SECOW 1T Icirikukwai
Variety
Me
an
ra
nk
sc
ore
Mean Rank
Figure 4.5: Mean Rank Scores of Cowpea variety in Soroti and Kumi Districts
Among all the varieties available in the study area, as shown in figure. 4.5, consumers
ranked Icirikukwai as the leading variety, followed by Ebalat and SECOW 2W (A newly
introduced Variety). The black seeded Kenyan variety was least ranked by consumers.
Icirikukwai, is a local variety popularly grown by locals for consumption according to
Adipala, et al., (1999) and more preferred probably because the consumers are familiar with
it (Zellner, 1991). The secondly ranked SECOW 2W being a newly introduced variety very
similar to ebalat. SECOW 2W is likely to have marked impact in terms of market potential
since consumers seem to like it, and so the more reasons for promoting it.

50
Among the two newly introduced varieties, the white seeded SECOW 2W was the leading
choice as compared to the tan seeded, SECOW 1T, and the black seeded Kenyan showing the
value Ugandan consumers attach to seed color in their decision to purchase or consume.
Among the local varieties, Icirikukwai was rated higher than Ebalat.
4.6 Willingness-to-pay for Cowpea Varieties
Consumers reported considerable price differences for the five analyzed varieties. Prices for
Icirikukwai, ebalat and SECOW 2W being higher than that of Kenyan and SECOW 1T
Table 4.9: Mean Willingness To Pay (WTP)1 for Cowpea Varieties
Samples(Variety) n=161 Mean (Ug. Sh) S.D
WPT1(Kenyan) 584.9b 240.6
WPT2(Ebalat) 1439a 564.3
WPT3(SECOW 2W) 1453a 598
WPT4 (SECOW 1T) 920b 262.6
WPT5( Icirikukwai) 1456a 598
Means with same letter (a or b) are not significantly different (Pr (T<t) = 0.00) by pair wise t test of least
squares.
Table 4.9 reveals that the absolute difference in willingness-to-pay being less dramatic
across Icirikukwai, Ebalat and SECOW 2W and is quite distinct between these three and
Kenyan and SECOW 1T. The results from the study show that consumer willingness to pay
for Ebalat, Icirikukwai and the introduced SECOW 2W are not significantly (Pr (T<t) = 0.00)
different from each other and that between the Kenyan and SECOW 1T were also not
significantly (Pr (T<t) = 0.00) different. The similarity in consumer preference for ebalat and
1 WTP1-WTP5 Are prices consumers were Willing To Pay for Varieties 1- 5
51
icirikukwai could be as a result of the fact that consumers are familiar with these traditional
varieties. It is important to note that SECOW 2W has similar physical properties as these two
traditional varieties and according to focus group discussions; consumers can not easily
differentiate it from ebalat.
4.6.2 Market Performance of Cowpeas in Soroti and Kumi
Marketing is a prime mover and stimulator of production. The marketing system is a major
tool of integrating the farming community into the market economy. It links various rural
areas as well as rural and urban areas with a network for communication and exchange,
which forms the basis for co-ordination of social and economic activities. The provision of
secured market outlets gives the incentive to increase output and to diversify subsistence
production into market farming. Marketing also provides for the transfer of preferences and
pressures, (through the price system), from consumers to producers, thus supporting further
diversification and specialization in agriculture.
The increased integration of the economy along the marketing channels opens the way for
spreading modernization to traditional rural areas (Bibangambah, 2002). For these
commodity-dependent, low-income, food-deficit economies, the price instability that is
characteristic of agricultural commodity markets can have pronounced impacts on
employment, income, government revenue, food security and market performance (Sarris
and Hallam, 2006). The researcher traced price trends to give a view of performance of
cowpea in the market.

52
Annual Average Cowpea price fluctuations in Kumi
0
200
400
600
800
1000
1200
1400
2003 2004 2005 2006 2007 2008
Year
Farm
gate
& m
ark
et
pri
ces
Farm gate price/kg
Market price/kg
Fig. 4.6: Cowpea Price fluctuations in Kumi
Source: Kumi District Production Department
According to studies on cowpeas by Afolami (2002) in West Africa, despite the many
advantages of cowpeas to consumers and producers, a major problem of cowpea production
is price differential over space and time among varieties. This study endeavored to examine
the trend of prices of cowpeas over six year‘s period as well and results discussed with
traders. According to focus group discussion held in Soroti with traders, price varied over
space in excess of transportation costs. This could be the result of inadequate market
information, poor road networks and inadequate market infrastructure. There is also price
variation over time in excess of storage cost. This could be the result of inefficient storage
facilities, yet the grains are prone to weevil attack.

53
The general price trends for farm gate and market price shown in Figure 4.6 depict price
series that tend to both to be upward moving over the years. The general trend of steady
increase in prices according to Sarris and Hallam (2006) as associated with agricultural
commodities could be indicator of how important cowpeas have become in terms of trade
and household income in Uganda.
In all the markets studied traders did not make a distinction between their products in terms
of variety during the time of study, which they felt the consumers did not mind except for
the Kenyan Variety. This situation was also observed by Svetlana and Melinda (2006) in a
study on bananas and they concluded that; although output markets for crop products exist
in rural Uganda, they are often incomplete, failing to capture quality differentials among
varieties, further leading to product market failure, and portrays a non tradability constraint
that could have existed. All the grain had all the varieties mixed up in terms of shape and
size. The traders were only keen to remove the Kenyan variety which actually was not
available in the local markets studied during the study period.
Table 4.10: Mean prices consumers were willing to pay and actual mean market price
for cowpea in Soroti and Kumi markets
Variety Mean prices
consumers were
willing to
pay(Ug.Sh/Kg)
Mean
Actual
Market
price(Ug.Sh/
Kg)
Diff mean(WPT)-
mean(mktprce)(Ug.
Sh)
t-value Df
Kenyan 584.9 1148 -561.0435 29.5871***
160
Ebalat 1439 1148 291.441 6.5534***
160
SECOW 2W 1453 1148 305.1056 6.4735***
160
SECOW 1T 920 1148 -227.8137 11.0060***
160
Icirikukwai 1456 1148 308.8323 6.5494***
160
*** Mean differences(Diff) statistically different from zero at 1%, using pair wise t test
(Ho: diff = 0, Ha: diff < 0 Ha: diff! = 0 Ha: diff > 0)

54
Comparison of prices consumers were willing to pay for individual grain varieties and the
market grain prices showed there were significant differences. The results showed that
consumers would pay more for grains of Ebalat, Icirikukwai and SECOW2W if traders or
producers sorted out their produce according to variety compared to what the market offered
during the data collection time (Different varieties all mixed up). As shown in table 4.10 the
market price for what was available in the market during time of study, was significantly (Pr
(T < t) = 0.0000) higher than what consumers were willing to offer for pure grains of
Kenyan and SECOW1T varieties. The consumers indicated that they were willing to pay
significantly (Pr (T > t) = 0.000) higher price for pure grains of ebalat, icirikukwai and
SECOW 2W than the market price during time of study.
4.7 Determinants of Consumers willingness to pay for the different Cowpea
Varieties
The estimated models fitted the data reasonably well given the variables used. The R-square
values for the five samples being, 61%, 42%, 35%, 35% and 37% for Kenyan, SECOW 1T,
Icirikukwai, SECOW 2T and Ebalat respectively. The results are consistent with that of
Commer (1990) and that of Lansford et al., (1995) who worked on explaining the prices of
race-bred yearling quarter horses, and obtained R-square value of 0.38 and
0.40, respectively, Akankwasa (2007), who estimated consumer willingness to pay for
introduced desert bananas in Uganda obtained R-squared values of 21%, 23% and 17%.
Given the fairly good performance of the linear model in terms of fit and the logical
consistency of the estimated parameters, it was adapted for use in the subsequent discussion.

46
Table 4.11a: Results from Estimated Hedonic Model for Cowpea Varieties (Socio-economic Variables)
Cowpea Variety
Kenyan SECOW1T Icirikukwai SECOW 2W Ebalat
Variable Coef t. Value Coeff. t. Value Coeff t. Value Coeff t.Value Coeff t.Value
Age -0.17 -0.19 2.47 2.13**
0.99 0.36 0.55 0.2 1.92 0.74
Household
Income
-6.60E-06 -1.27 -1.50E-
05
-2.24**
3.60E-
05
-2.23**
-4E-05 -2.23** -3E-05 -2.29**
Education
of H/H
head
-2.79 -0.74 7.98 1.62 -1.12 -0.09 1.61 0.13 -0.348 -0.03
Gender 36.86 1.2 80.71 2.01**
138.52 1.39 162.1 1.61 101.92 1.12
H/H size 9.67 1.59 -4.73 -0.6 -32.26 -1.67* -37.43 -1.92* -32.88 -1.84*
NB;* Significant at 10% ** Significant at 5% *** Significant at 1%
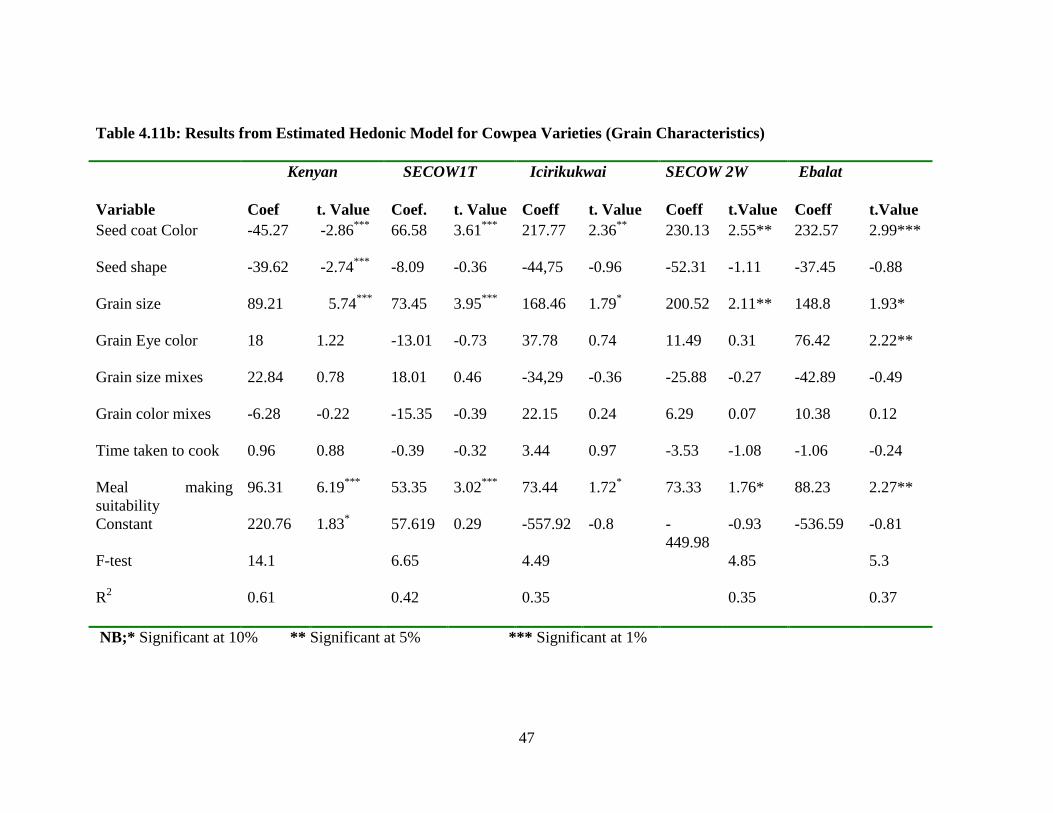
47
Table 4.11b: Results from Estimated Hedonic Model for Cowpea Varieties (Grain Characteristics)
Kenyan SECOW1T Icirikukwai SECOW 2W Ebalat
Variable Coef t. Value Coef. t. Value Coeff t. Value Coeff t.Value Coeff t.Value
Seed coat Color -45.27 -2.86***
66.58 3.61***
217.77 2.36**
230.13 2.55** 232.57 2.99***
Seed shape -39.62 -2.74***
-8.09 -0.36 -44,75 -0.96 -52.31 -1.11 -37.45 -0.88
Grain size 89.21 5.74***
73.45 3.95***
168.46 1.79* 200.52 2.11** 148.8 1.93*
Grain Eye color 18 1.22 -13.01 -0.73 37.78 0.74 11.49 0.31 76.42 2.22**
Grain size mixes 22.84 0.78 18.01 0.46 -34,29 -0.36 -25.88 -0.27 -42.89 -0.49
Grain color mixes -6.28 -0.22 -15.35 -0.39 22.15 0.24 6.29 0.07 10.38 0.12
Time taken to cook 0.96 0.88 -0.39 -0.32 3.44 0.97 -3.53 -1.08 -1.06 -0.24
Meal making
suitability
96.31 6.19***
53.35 3.02***
73.44 1.72* 73.33 1.76* 88.23 2.27**
Constant 220.76 1.83* 57.619 0.29 -557.92 -0.8 -
449.98
-0.93 -536.59 -0.81
F-test 14.1 6.65 4.49 4.85 5.3
R2 0.61 0.42 0.35 0.35 0.37
NB;* Significant at 10% ** Significant at 5% *** Significant at 1%

46
The results from the hedonic models (table 4.11a and 4.11b) for all the five samples indicate
that some of the socio-economic characteristics and cowpea attributes significantly
influenced the consumer willingness to pay depending on the variety.
Age was positively associated with all the other four varieties, Icirikukwai, Ebalat, SECOW
2W and SECOW 1T except for Kenyan variety, The Hedonic pricing model suggested that
consumers were willing to pay 2.5%, more for SECOW 1T, 0.9%, for Icirikukwai, 1.9% for
Ebalat and 0.5% for SECOW 2W for every one year increase in age, mean while they were
less willing to pay 0.2% for the Kenyan Variety for every one year increase in age.
However, it was only SECOW 1T which showed significant results for age. As shown in
figure.4.3, all age groups consume cowpeas except Kenyan variety which according to key
informant interview with a scientist at Serere Agricultural Research Centre, and focus group
discussions with traders is less consumed in the area but grown for export to neighboring
Kenya, which finding is also akin to that by Adipala et al., (1999) in a study on influence of
farmer production goal on pest management option in eastern Uganda. These results could
mean well for cowpeas since amidst the nutritional transition amongst the urban population
more so the youth preferring western foods, the crop is still popular. This popularity could
easily be translated in to better incomes for the producers
Household income was negatively associated with all the other five varieties, the implicit
willingness to pay price being very small akin to zero. This means that as income increases,
the willingness to pay for the crop decreases as is the case for inferior goods. How ever, the
decrease in implicit price is negligible. This negative relationship could be pointing to

47
transition in consumers‘ behavior which should not be ignored. The possible explanation
for the negative behavior for the high income class would be the fact that many families
grow surviving on the crop and when their economic status changes they move to a higher
indifference curve under the influence of nutritional transition. This as mentioned by
Weinberger and Msuya (2004) is characterized by decline in consumption of traditional
food crops, and increasing consumption of refined and processed foods, fats, sugars, and
animal foods especially the urban population.
Many economists and scientist have always referred to cowpeas as pro-poor crop, for
example, studies done by Dovlo et al.,(1976), and Langyintuo et al., (2004) described
cowpea (Vigna unguiculata (L.) Walp) as source of relatively low cost, high quality protein
important in the nutrition of the poor both in rural and urban areas. Abdulai and Aubert
(2003) noted that as income increases consumers tend to spend proportionately less on
cereals, pulses, fruits, vegetables and more on meat, fish, and eggs, milk and milk products,
as well as other foods, further confirming the negative relationship with income in this
study.
Gender is positively associated with willingness to pay for all the varieties of Cowpeas.
Women seem to be more associated with the crop. This could be due to the fact that women
are more involved in the household food decision as reflected in table five. Women too do
play major role in household shopping decision than their male counterparts as reflected in
table 4.4. This finding agrees with that of Bruin et al.,(1994), Wang et al., (1997) who
found out that women were able to pay more than male respondents for recombinant Bovine

48
Growth Hormony milk in America. Akwankwasa, (2007), also found out that women in
Uganda were more willing to pay than their male counterparts for introduced banana
species. All these findings are in line with previous studies by NRC, (2006), Schippers,
(1997) and Lowenberg-DeBoer, (1999) confirm cowpea as an important food security crop
particularly for women.
The estimated coefficients on cowpea grain color variable are all statistically significant and
bear positive sign as expected except the negative sign for the case of Kenyan. Seed color
was positively associated with Ebalat, SECOW2W, SECOW1T and Icirikukwai except for
Kenyan Variety. The hedonic pricing model suggested that consumers were willing to pay
66.6%, more for SECOW 1T, 217.8%, for Icirikukwai, 230.1% for SECOW 2W, 232.6% for
Ebalat for, a white to brown seed color. How ever, they were less willing to pay by 45.3%
for the black seed coat color associated with the Kenyan variety. Ebalat had the highest
implicit price as much as grain color is concerned. This finding is in agreement with studies
in Ghana and Cameroon by Langyintuo et al., (2004), where consumers there too had
preference for white testa. Focus Group discussion with traders in Soroti revealed that the
most popular method of cooking cowpeas in ground nut paste goes well with the white testa.
The black seeded Kenyan variety is grown for export to Kenya.
Cowpea grain size is statistically significant in all the five samples. Consumers‘ were
willing to pay a premium of Ug. Shillings 89, 73, 168, 200 and 148 per unit increase grain
size for Ebelat, SECOW 2W, SECOW1T, Icirikukwai and Kenyan Varieties respectively.
Grain size was positively associated with all the varieties. Meaning consumers did not mind
49
the size of the existing five varieties. This seems to be in line with studies by Wolfson et
al.,(1989) and Kitch, et al., (1998) in Cameroon indicating that large white-seeded cowpeas
being more readily marketed and are typically sold at a premium, which influenced farmers
decision to place about equal value on seed size and color as selection criteria as they did on
grain yield.
Seed shape was negatively associated with all the varieties. The hedonic pricing model
(table 4.11b)suggested that consumers were less willing to pay 39.62%, for Kenyan, 8.09%
SECOW 1T, 44.75%, for Icirikukwai, 52.31% for SECOW 2W and 37.45% for Ebalat. As
much as consumers did not think of seed shape being an important property in determining
meal making suitability, the study results seem to show that the consumers may not be
comfortable with the existing shape of cowpea grains.
Eye color for varieties, Kenyan, Ebalat, SECOW 2W and Icirikukwai were positively
associated with the consumer‘s willingness to pay unlike for SECOW1T. The hedonic
regression shows that, consumers were willing to pay up an additional, 18%, for Kenyan
37.78% for Icirikukwai, 11.49% for SECOW 2W and 76.42% for Ebalat and less by 13% for
SECOW 1T with respect to eye color. Ebalat had the highest implicit price, which could
imply it being the most preferred eye color.
Consumers were less willing to pay by 6.28% and 15.35% for Kenyan and SECOW1T mixes
with others. Mixes of ebalat, Icirikukwai and SECOW 2W had positive relationship with
WTP. This could be due their preference for these colors and the fact that they are all white

50
seeded. Mean while the black and tan color associated with the Kenyan and SECOW1T do
not mix well with others and were discounted by consumers.
Consumer willingness to pay has a positive relationship with time taken to cook for Kenyan
and Icirikukwai, which could mean they take shorter time to cook while that of Ebalat,
SECOW 2W and SECOW 1T had negative relationship, meaning they take long time to cook
(table 4.11b)
All the samples had positive seed making suitability relationship with consumer WTP; this
implies that consumers are willing to pay a premium for all the varieties, as regards their
meal making suitability. Focus group discussion with women in Kumi revealed that, all the
varieties produce tasty meals.
Estimated coefficients on the damage tolerance for Kenyan, Icirikukwai and SECOW 1T had
negative sign unlike ebalat and SECOW 2W. None of the coefficients are statistically
significant. This suggests that consumers in eastern Uganda are less sensitive to damaged
grains. Focus group discussion with women in Kumi indicated that, it is rare to find damage
free cowpea; consumption of damaged cowpeas has become normal, especially during off
season.

51
CHAPTER FIVE
SUMMARY, CONCLUSIONS AND RECOMMENDATIONS
5.0 Summary
Consumer preference information is essential for targeting research to attributes desired by
consumers. This study examined cowpea consumer preference and characteristics in Soroti
and Kumi Districts. Up to 161 households were interviewed guided a questionnaire and
Focus Group Discussions held with traders and consumers as well. Five labeled samples
were presented to 161 consumers for sensory evaluations. Market prices and consumer
socio-economic characteristic information were collected. Results indicate that grain size
and color are the most important characteristics. The white-tan seed color command
premium price in Soroti and Kumi, while the black seeded Kenyan type is discounted. This
study indicates that quality characteristics play an important role in Ugandan food markets.
The average age of cowpea consumers reached was 37.9 years; the mean educational level
for the respondents was primary seven. The respondents, on the average have five members
in their family and earn monthly income of about 184, 000/= (US$ 93.4) which translates in
to daily income of 6000/= (US$ 3.11), which is higher than the poverty line of 1US$ a day
meaning high purchasing power of the interviewed group.
Cow peas are quite popular in the study area. The percentage awareness for Ebalat, SECOW
2W and Icirikukwai varieties, being over 90%. To emphasize how important the crop is, over
99% stated that they do prepare a meal out of the crop and is well consumed by over 90% of

52
all the age groups and gender, both adult and children and consumers are well aware of all
the 5 varieties of cowpeas.
Seed color is considered by 56% of the interviewed households as the most important
quality factor for meal making while 39 % consider seed size as most important quality
characteristics for making decision on consumption and seed suitability.
Consumers ranked Icirikukwai as the leading variety, followed by Ebalat and SECOW 2W
(A newly introduced Variety). The black seeded Kenyan variety was least ranked by
consumers.
The absolute difference in willingness-to-pay for the varieties is less dramatic across
Icirikukwai, Ebalat and SECOW 2W and is quite distinct between these three and Kenyan
and SECOW 1T. The results from the study show that consumer willingness to pay for
Ebalat, Icirikukwai and the introduced SECOW 2W are not significantly (Pr (T<t) = 0.00)
different from each other and that between the Kenyan and SECOW 1T were also not
significantly (Pr (T<t) = 0.00) different.
Consumers would pay more for grains of Ebalat, Icirikukwai and SECOW2W if traders or
producers sorted out their produce according to variety compared to what the market offered
during the data collection time (Different varieties all mixed up). The market price for what
was available in the market during time of study, was significantly (Pr (T < t) = 0.0000)
higher than what consumers were willing to offer for pure grains of Kenyan and SECOW1T

53
varieties. The consumers indicated that they were willing to pay significantly (Pr (T > t) =
0.000) higher price for pure grains of ebalat, icirikukwai and SECOW 2W than the market
price during time of study.
5.1 Conclusions
The adoption of foods by a population is based on a complex interaction of existing
customs, availability, costs, convenience, sensory quality, and to some degree nutritional
quality. Over all findings from this study have important implications for national and
international institutions involved in developing new plant varieties for small scale
producers. The study was conducted to find out about consumer acceptability and preference
for cowpea varieties and the following are the conclusions from the study;
Consumers in eastern Uganda (Soroti and Kumi districts) have preference for white and tan
testa cowpea and large seeded crop. Results show that seed color (56%) and seed size are the
most important qualities consumers consider in their decision to purchase. Consumers are
willing to pay a premium for white grain color, the coefficients for all the other four
varieties except Kenyan is positive and statistically significant. The consumers were willing
to pay low premium for the black seeded cowpeas.
In the study area, most consumers seem to prefer large grain size. They are willing to pay a
premium of up to 200% for large seeds associated with new varieties SECOW 2W for unit
increase in grain size. How ever local preference for small-seeded traditional cowpea
varieties is apparently very strong. Consumers seem to endorse the existing grain sizes
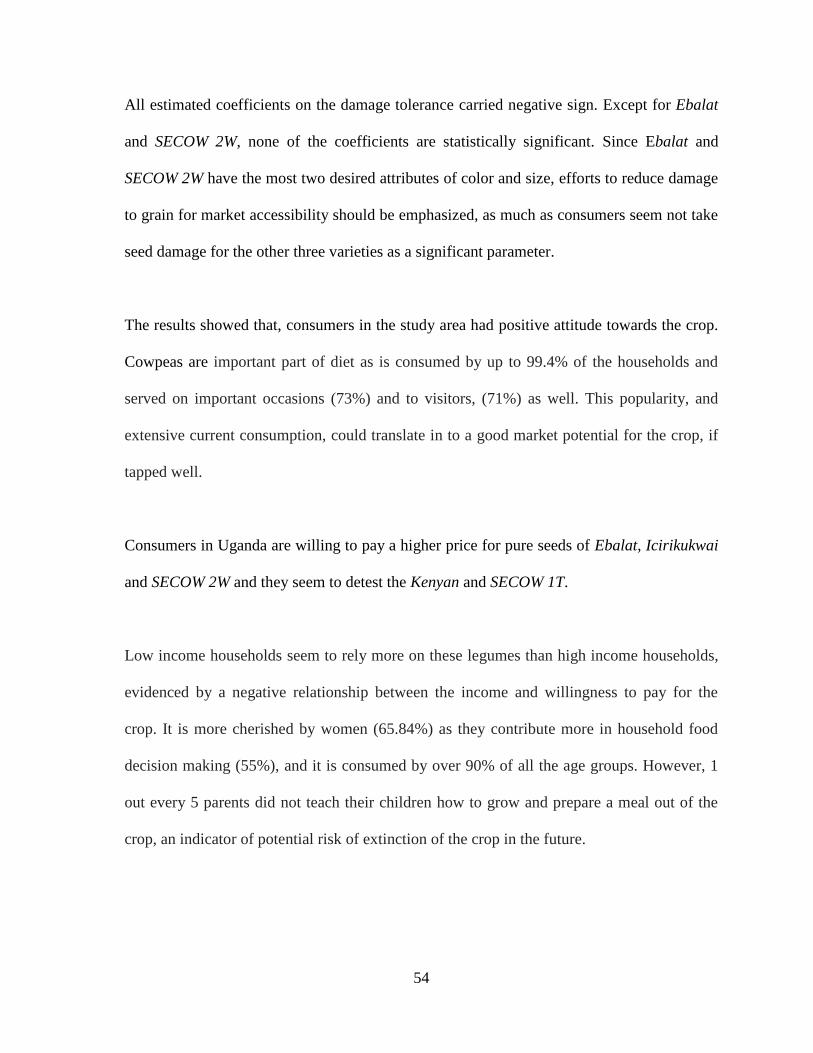
54
All estimated coefficients on the damage tolerance carried negative sign. Except for Ebalat
and SECOW 2W, none of the coefficients are statistically significant. Since Ebalat and
SECOW 2W have the most two desired attributes of color and size, efforts to reduce damage
to grain for market accessibility should be emphasized, as much as consumers seem not take
seed damage for the other three varieties as a significant parameter.
The results showed that, consumers in the study area had positive attitude towards the crop.
Cowpeas are important part of diet as is consumed by up to 99.4% of the households and
served on important occasions (73%) and to visitors, (71%) as well. This popularity, and
extensive current consumption, could translate in to a good market potential for the crop, if
tapped well.
Consumers in Uganda are willing to pay a higher price for pure seeds of Ebalat, Icirikukwai
and SECOW 2W and they seem to detest the Kenyan and SECOW 1T.
Low income households seem to rely more on these legumes than high income households,
evidenced by a negative relationship between the income and willingness to pay for the
crop. It is more cherished by women (65.84%) as they contribute more in household food
decision making (55%), and it is consumed by over 90% of all the age groups. However, 1
out every 5 parents did not teach their children how to grow and prepare a meal out of the
crop, an indicator of potential risk of extinction of the crop in the future.

55
5.2 Recommendations of the Study
These results suggest that efforts to improve upon grain size and promulgating the white
seed color will be worthwhile in eastern Uganda as consumers seem to be more interested in
large seeds and white seed color. Choice of grain eye color and grain cooking suitability
should reflect consumers demand. That is, cowpea breeding programs for Ugandan markets
should emphasize maintaining the grain cooking suitability associated with all the five
existing varieties.
This study of five cowpea varieties has led to certain recommendations for producers,
traders and researchers/policy markers. They point out the possibility of expanded market
and growth of Icirikukwai, Ebalat and SECOW1T varieties. They show the need to grow and
market pure crops of Ebalat, Icirikukwai and SECOW 2W. Any varietal development
programme should take in to consideration the consumer‘s desire for larger seeds and the
white testa color for a crop for the local market.
Basing on the study findings and conclusions, the following recommendations can be made;
1. A cowpea breeding programme should endeavor to breed a white testa, large seeded,
cowpeas for the Ugandan market, as associated with Ebalat and SECOW 2W, since these
were found to affect consumer acceptance and preference.
2. There is need for increasing awareness on the nutritional and economic value of the
crop. The success of promoting cowpeas for nutritional health in Uganda will depend on
strong promotional activities. Production related information, should be packaged to

56
include consumer preferred varieties and made available to extension personnel,
progressive farmers and seed companies who may have a greater outreach to farmers.
3. Producers and traders need to select their produce in to variety specific products, for the
consumers seem to be more willing to pay higher premium for a pure product as opposed
to the mixed as is in today‘s market.
5.3 Recommendations for further Research
1. There is need to conduct a consumer preference study at a regional level since this
crop is marketed regionally to exactly understand and compare preferences amongst
regional actors.
2. There is need to undertake a value chain analysis study for the crop to help map all
products, actors and possible products along the chain.

57
REFERENCES
Abansi, C.L., Lantica, F.A., Duff, B., Catedral, I.G., (1990). Hedonic model estimation:
application to consumer demand for rice grain quality. Trans. Acad. Sci.
Technol. 12, 235–256.
Abdulai A., D., Aubert,(2003) A cross-section analysis of household demand for food and
nutrients in Tanzania.
Adamowicz, W., Louviere, J. and Swait, J. (1998), Introduction to attribute-based stated
choice methods, Final Report submitted to: Resource Valuation Branch,
Damage Assessment Centre NOAA (National Oceanic and Atmospheric
Administration, US Department of Commerce).
Adamowicz, W., Louviere, J. and Williams, M. (1994), ‗Combining revealed and stated
preference methods for valuing environmental amenities‘, Journal of
Environmental
Adipala E. Cowpea improvement in Uganda. Current Status and Dideases and pest
management half year Report for the period September 1993-march 1994.
Makerere University Kampala Uganda 1994.
Adipala E., Isubikalu, P., Erbaugh, J.M A.R. Semana A R (1999); Influence of Farmer
Production Goals on Cowpea Pest Management in Eastern Uganda: Implications
for Developing IPM Programmes
Adipala, E (1994) ‗Cowpea improvement in Uganda. Current status and disease and pest
management‘ Half yearly Report for the period Sept 1993-March 1994.
Makerere University Kampala Uganda.
Adipala, E., Obuo, J.E. and Osiru, D.S.O.( 1997). A survey of cowpea cropping systems in
some districts of Uganda. African Crop Science Conference Proceedings 3:
665-672.
Adipala, E., Omongo, C.A., Sabiti, A., Obuo, J.E., Edema, R., Bua, B., Atyang, A.,
Nsubuga, E.N. and Ogenga-Latigo, M.W. (1999). Pests and diseases on
cowpea in Uganda: Experiences from a diagnostic survey. African Crop Science
Journal 7:465-478. African Crop Science Journal, Vol. 10. No. 3, 2002, pp.
263-270
Afolami C.A (2002) An empirical analysis of variety price premium attributes, spatial and
temporal pricing patterns for cowpeas in Ogun state, Nigeria. African Crop
Science Journal, Vol. 10. No. 3, 2002, pp. 263-270
Afolami,C.A. (2000). Inter-temporal and spatial pricing efficiency in maize marketing in
Nigeria. Moor Journal of Agricultural Research 1(1):77-85. Agricultural
Economics 36 (2007) 405–41

58
Akankwasa K (2007) Consumer Acceptability and Willingness to Pay for Introduced
Dessert bananas. Makerere University Msc. Thesis (2007)
Arrow, K.R., Solow, P.R., Portney, E.E., Leamer, R., Radner, R. and Schuman, H. (1993).
Report of the NOAA Panel on Contingent Valuation, Federal Register. January
15, vol. 58, no. 10, 4601–4614.
Lowenberg-DeBoer J., Augustine, L., G. Ntoukam, and L. Murdock, (2000). The Market
Value of Cowpea Characteristics in Cameroon and Ghana, presentation at the
World Cowpea Conference, Ibadan, Nigeria, September.
Aveling T. (2000) Cowpea Pathology Research
Bakar, G.A, and Bumham.(2001) Consumer Response to Genetically Modified Foods:
Market Segment Analysis and Implications for producers and Policy Makers. J.
Agr.Res. 26
Ben-Akiva & Lernam,S.R.(1985) Descrete Choice analysis. Cambridge, MA: The MIT
Press
Benedict J. and Steekamp E. M (1996) Quality guidance: A consumer based approach to
food quality improvement using partial least squares. European Review of
Agricultural Economics 23 195-215
Bibangambah J.R (2002) Review of information on marketing, processing and storage of
Uganda‘s Agricultural commodities. Final report for PMA sub-committee on
agro-processing and marketing
Boccaletti, S and Nardella, M. (2000). Consumer willingness to pay for pesticide-free fresh
fruit and vegetables in Italy. The International Food and Agribusiness
Management Review 3(3):297 310.
Boehlje, M (2000).Critical dimensions of structural change. Unpublished document,
Department of Agricultural economics. West Layafette: Purdue University
Boehlje, M. & Doering, O. (2000). Farm policy in an industrialized agriculture. Journal of
Agribusiness (special issue, 18(1): 53-60
Bonifacio, E.P., Duff, B., (1989). The impact of post-harvest operations on paddy and milled
rice quality. In: Proceedings of the 12th ASEAN Technical Seminar on Grain
Post harvest Technology held at Surabaya, Indonesia, pp. 29–31.
Bowman, K.R., Ethridge, D.E., (1984). Prices paid by textile manufacturers for cotton fiber
properties. In: Proceedings of the Beltwide Cotton Production Research
Conference Memphis, Tenn, National Cotton Council and the Cotton
Foundation, pp. 446–448.

59
Bressani, R. (1985). Nutritive value of cowpea. In Cowpea Research, Production and
Utilization, edited by B.B. Singh and K.O. Rachie. John Wiley and Sons, N.Y,
U.S.A. pp. 353-360
Breusch, T.S., Pagan, A.R., (1979). A simple test for heteroskedasticity and random
coefficient variation. Econometrica 47, 1287–1294.
Brorsen, B.W., Grant, W.R., Rister, N.E.,(1987). A hedonic price model for rough rice
bid/acceptance markets. Am. J. Agric. Econ. 66, 164–169.
Campiche. J Holcomb R.B and Ward C.E (2004): Impacts of consumer characteristics and
perceptions on willingness to pay for natural beef in the southern plains.
Oklahoma Food and Agricultural Products Research and Technology centre.
Oklahoma State University.
Cheng, H.T., G. Criner and A. Keziz. (1996). The impact of consumer characteristics on
perfernce for selected apple varieties. Journal of food products marketing 3(4) 1-
11
CIE. (2001), Review of Willingness to pay methodologies Report, Independent pricing and
Regulatory Tribunal of NSW
Cranfield J.A.L and Magnusson E (2003), Cannadian Consumers willingness to pay for
pesricide free food products: An ordered probit analysis. International Food and
Agribussiness management review, Volume 6, Number 4 2003.
Dalton T.J, (2004) A household hedonic model of rice traits: economic values from farmers
in West Africa Agricultural Economics Elsevier B.V Economics and
Management, 26, 271–292.
De Janvry, A., Fafchamps, M., Sadoulet, E., (1991). Peasant household behaviour with
missing markets: some paradoxes explained. Econ. J. 101, 1400–1417.
Deodha, S.Y. and V. Intodia (2002). Does Ghee sold by any brand smell as Sweden quality
attributes and Hedonic Price analysis of Ghee, Indian Food industries Vol. 21,
No.2, March-April.
Diener, A., O‘Brien, B., Gafni, A., (1998). Health care contingent valuation studies: a
review and classification of the literature. Health Economics 7, 313–326.
Dossani R, and V Ranganathan (2003) Farmers‘ Willingness to Pay for Power in India:
Conceptual Issues, Survey Results, and Implications for Pricing
Dovlo, F. E., Williams, C. E., Zoaka, L. (1976). Cowpeas: Home Preparation and Use in
West Africa. International Development Center. Ottawa, Canada. 96pp

60
Drabenstone, M.. (1995). Agricultural Industrialization: Implications for Economics
Development and Public Policy. Journal of Agricultural and Applied economics,
Vol, 27(1): 13-20.
Dulberger, E.R., ( 1989). The application of a hedonic model to a quality-adjusted price
index for computer processors. In: Jorgenson, D.W., Landau, R. (Eds.),
Technology and Capital
Edema, R., Adipala, E. and Florini, D.A. (1997). Influence of season and cropping system
on occurrence of cowpea diseases in Uganda. Plant Disease 81:465-468.
Edmeades, S., (2003). Variety attributes and attribute trade-offs within the framework of
agricultural householdmodels: the case of bananas in Uganda. Ph.D.
Dissertation, North Carolina State University, Raleigh.
Eleni Z., Gabre-Madhin and S. Haggblabe (2001) Successes in African Agriculture: Results
of an Expert Survey, Internatinal Food Policy Research Institute, 2033K street
NW Washington, DC
Emaju E.(2000), Cowpea Marketing in Uganda Msc. Thesis Makerere University Kampala
2000.
Erbaugh, J.M. (1997). Factors associated with the use of pesticides and implications for the
development of IPM: A Ugandan case study. African Crop Science Conference
Proceedings 3:1453-1463.
Erbaugh, J.M., Willson, H. and Kyamanywa, S. (1995). Participatory Appraisal: Iganga and
Kumi districts, Uganda. Working paper 95-96 of the IPM/CRSP, Virginia
Polytechnic Institute and State University, Blacksburg, Virginia. pp. 28-30.
Ethridge, D.E., Neeper, J.T., (1987) Producer returns from cotton strength and uniformity:
an hedonic approach. So. J. Agric. Econ. 9, 91–97.
Evans, J.R & Barry, B (1985): Marketing, Macmillan Publishing. United Kingdom.
Evenson, Robert E. & Carl E. Pray (1994), "Measuring Food Production (With Reference to
South Asia)" (Reprinted from Journal of Development Economics, 44, (1994),
pp. 173-197, ©1994 Elsevier Science B.V.).
Fery, R.L. (2002). New opportunities in Vigna. p. 424–428. In: J. Janick and A. Whipkey
(eds.), Trends in new crops and new uses. ASHS Press, Alexandria, VA
Fu, T-T; Liu, J-T and Hammitt, JK. (1999). Consumer willingness to pay for low-pesticide
fresh produce in Taiwan. Journal of Agricultural Economics 50(2):220–233.
Gil, JM; Gracia, A and Sanchez, M. (2000). Market segmentation and willingness to pay for
organic products in Spain. The International Food and Agribusiness
Management Review 3(2):207–226.

61
Giles (1990): Marketing. Longman Group LTD, United Kingdom, 1990
Gilmeister, W.J, Yonkers, R.D & Dum, W.J.(1996) Hedonic pricing of Milk components at
the farm level review of Agriclutural Economics. Manhattan, Kanasasa state
University. 18(2): 181-192
Golob P., Andan, H.F., Atarigiya, J. and Tran B.M.D. (1998). On-farm Storage losses
of cowpea in Northern Ghana. Research project funded by UK Department of
International Department (DFID) R6503 Crop Post Harvest Research
Programme.
Golob P., Gudrups, I. and Moss, C. (1996).The storage and marketing of cowpea in
Ghana.
Greene, W.H., (1993). Econometric Analysis. Macmillan Publishing Company. New York,
791 pp.
Greene, WH. (2000). Econometric Analysis, 4th Edition. Upper Saddle River, New Jersey:
Prentice-Hall, Inc.
Grivetti, LE and Ogle, BM. (2000). Value of Traditional Foods in Meeting Macro- and
Micronutrient Needs: The Wild Plant Connection. Nutrition Research Reviews
13(1):31–46.
Hall, A. E., Frate, C. A. (eds). 1996. Black eye Bean Production in California, Division of
Agriculture and Natural Resources, Oakland, CA publication 21518. pp. 23.
Hall, C., McVittie, A., Moran, D.,( 2004). What does the public want from agriculture and
the countryside? A review of evidence and methods. J. Rural Stud. 20, 211–225.
Hallman, William K (1995) Public perception of Agrcultural Biotechnology. Geneteng-
newsv.15 (13):p.4-5
Hallman, W. K. (2000). Consumer Concerns about Biotechnology: International
Perspectives. Food Policy Institute Report, Rutgers University, New Brunswick,
NJ.
Halvorsen, R. and Pollakowski, H.O. (1981). Choice of functional form for hedonic price
equations. Journal of Urban Economy 10:37-49.
Harper, J. and G. Greene 1993. Frut quality characteristics influence prices received for
processing apples. Horticultural science 28; 1125-28
Hayes, D..J. and S.H Lence (2002). A new Brand of Agriculture: Farmer-owned Brands
Reward Innovation.‘ 2p

62
Hoeffler, H (2006) Promoting The Kenyan Potatto Value Chain: Can Contract Farming Help
Build Trust and Reduce Transaction Risks. 99th
EU Seminar of the European
Association of Agricultural Economics(EAAE)
Houtven G.V, Pattanayak S. K., Van den Berg C., Yang J.(2006) The Use of Willingness
to Pay Experiments: Estimating demand for piped water connections in Sri
Lanka
Humphry, C., Clegg, M.S., Keen, C. and Grivetti, L.E., (1993), Food Diversity and Drought
Survival. The Hausa Example. International Journal of Food Sciences and
Nutrition 44(1).
Humphrey, J., (2005). Shaping Value Chains for Development. GTZ Publication, Eschborn,
Germany.
IFFPRI, (2006) Policy distortions in segmented rice market. Markets, trade and Institutions
Division. MTID Discussion paper 94.
Inaizumi, H., Singh, B.B., Sanginga, P.C., Manyong, V.M., Adesina, A.A. and Tarawali,
S.( 1999). Adoption and impact of dry season dual purpose cowpea in the semi
arid zone of Nigeria‖. IITA and Meg.Comm. Network 14pp.
Iop S.C.F, E. Teixeira, R. Deliza( 2006) Consumer research: extrinsic variables in food
studies Federal Center of Technological Education of Paraná, Ponta Grossa,
Brazil. British Food Journal, Vol. 108, No.11 pp 894-903
Isubikalu, P. (1998), Understanding farmer knowledge of cowpea production and pest
management: A case study in eastern Uganda. MSc. Thesis, Makerere
University, Kampala. 152 pp.
Jackai, L.E.N., Singh, S.R., Raheja, A.K., Wiedijk, F., (1985). Recent trends in the control
of cowpea pests in Africa. In: Cowpea Research Production and Utilisation.
Singh, S.R. and Rachie, K.O. (Eds.), pp. 233-343. John Wiley and Sons Ltd,
Chichester.
Jayson L.Lusk and Darren Hudson (2004), Willingness to pay Estimates and their
Relevancy to Agribusssines Descision making.
Jhingan M. L, (1979) Micro Economic Theory. Vikas Pub. House PVT Ltd, 671pgs
Jones-Lee, M.W., (1989). The Economics of Safety and Physical Risk. Basil Blackwell,
Oxford.
Judge, G.G., Griffiths, W.E., Hill, R.C., Lutkepoh, H., Lee, T., (1985). The Theory and
Practice of Econometrics, second ed. Wiley, New York, 1019 pp.
Kajikawa, C (1998) Quality level and price in Japanese apple market. Agribusiness 14(3) 227-
34.

63
Karungi, J., Adipala, E., Kyamanywa, S., Ogenga-Latigo, M.W. and Obuo, J.E. (2000). Pest
management in cowpea. Part 2. Influence of time and frequency of insecticide
application on cowpea field insect pests infestation in eastern Uganda. Crop
Protection (in press).
Karungi, J., Nampala, M.P., Adipala, E., Kyamanywa, S. and Ogenga-Latigo, M.W. (1999).
Population dynamics of selected cowpea insect pests as influenced by different
management strategies in eastern Uganda. African Crop Science Journal 7:487-
495.
Kirsten J. and Vink N. (2005). The economics of Institutions: Theory and Applications to
African Agriculture.
Kitch L. W, O. Boukar, C. Endondo and L. L. Murdock (1998). Farmer acceptability criteria
in breeding cowpea Cambridge University Press
Kitch, L., Ntoukam, G., (1992). Airtight storage of cowpea in triple plastic bags (triple
bagging), Tech. Bull. 3, Agronomic Research Institute of Cameroon, Maroua
Research Center, CRSP Storage Project, Cameroon.
Klose, T., (1999). The contingent valuation method in health care. Health Policy 47, 97 123.
Ladd, G., Martin, M., (1976). Prices and demands for input characteristics. Am. J. Agric.
Econ. 58, 21–30.
Ladd, G., Suvannunt, V.,( 1976). A model of consumer goods characteristics. Am. J. Agric.
Econ. 58, 504 510.
Lancaster, K., (1966). A new approach to consumer theory. J. Polit. Econ. 74, 132–157.
Lancaster, K., (1966a). Change and innovation in the technology of consumption. Am. Econ.
Rev. 56, 14–23.
Langyintuo, A. S. (1999). ―Ghana and Burkina Faso Trip Report‖. Purdue University,
Department of Agricultural Economics & Bean/Cowpea CRSP.
Langyintuo, A. S. (2000) ―Summer Research Program in Ghana, Togo, Benin and Burkina
Faso,‖ Purdue University, Department of Agricultural Economics &
Bean/Cowpea CRSP.
Langyintuo, A. S. (2001). ―Summer Research Program in Ghana, Togo, Benin, Nigeria,
Cameroon and Gabon,‖ Purdue University, Department of Agricultural
Economics & Bean/Cowpea CRSP,
Langyintuo, A. S. Murdock, L., Lowenberg-DeBoer, J., Ntoukam, G., Miller, D. (2000).
The Market Value of Cowpea Characteristics in Cameroon and Ghana. Paper
presented at the World Cowpea Conference III. Organized by the International
Institute of Tropical Agriculture (IITA), Ibadan, Nigeria. September 4-7.

64
Langyintuo, A., Ntoukam, G., Murdock, L., Lowenberg-DeBoer, J.,Miller, D., (2004).
Consumer preferences for cowpea in Cameroon and Ghana. Agric. Econ. 30,
203 213.
Larue, B. (1991). Is wheat a homogenouse Product? Canadian Journal of Agricultural
Economics39:103-17
Loureiro M.L and McCluskey J.J. (2002), Assessing Consumer Response to Protected
Geographical Identification Labeling Department of Agricultural Economics,
Washington State University.
Louviere, J., (1988). Analyzing Individual Decision-Making: Metric Conjoint Analysis.
Sage University Paper Series on Quantitative Applications in the Social
Sciences, No. 07-067, Sage Publications, Beverly Hills.
Louviere, J., Hensher, D., Swait, J., (2001). Stated choice methods: analysis and applications
in marketing, transportation and environmental valuation, Cambridge University
Press, Cambridge.
Lowenberg-DeBoer, J. (2001). Trip Report - Bean/Cowpea Collaborative Research Support
Progam, Purdue University, January.
Lowenberg-DeBoer, J. and O. Coulibaly. (2000). The Economics of Cowpea in West Africa,
Keynote Address for the Cowpea Postharvest and Socioeconomic Studies
Session, World Cowpea Conference, Ibadan, Nigeria, September.
LuskJ.L and D. Hudson (2004), Willingness to pay Estimates and their Relevance to
Agribussiness Decision Making
Manalo, A.B. (1990) Assessing the importance of apple attributes: an agricultural
application of conjoint analysis. N.E J Agr. Res.Econ. 19(2):118-124
McFarlane, J.A. (1983) Food Storage Manual. WFP/FAO/HMSO U.S. Publication number
Q 1547. 263pp
Mead R., Curnow R.N and Harsted A.M. (1993). Statistical methods in Agriculture and
Experimental Biology. Chapman and Hall, London. 415pp
Mellor & John W (1990) ―Ending Hunger‖ An Implementable Programme for Self-reliant
growth in the World Food Crisis. Food Secuirty in Comperative Perspective.
Bakker, J L Hans (ed). Canadian Scholard. Press Inc. Canada
Melton, B., Colette, W., Willham, R., (1994) Imputing input characteristic values from
optimal commercial breed or variety choice decisions. Am. J. Agric. Econ. 76,
478–491.
Michael P. Welsh, Gregory L. Poe (1998), Elicitation Effects in Contingent Valuation:
Comparisons to a Multiple Bounded Discrete Choice Approach Journal of

65
environmental economics and management 36, 170]185_1998. article no.
ee981043.
Millstone, E. and Lang, T., (2003). The atlas of food: who eats what, where and why.
London: Earthscan.
Minot, N; Rosegrant, M.; Weinberger, K and Wada, N. (forthcoming). Fruit and vegetables
to 2020: Expanding opportunities for small farmers in developing countries.
Washington DC: International Food Policy Research Institute.
Morley D. & Hermione L (1994): An Illustrated Discussion of child health, Society and
Poverty in Less Developed Countries. The Macmillan Press LTD. USA
Mylene K & Kirsten J. (2001). The New Institutional Economics: Applications for
Agricultural Policy Reseacrh in developing Countries. MSSD Discussion paper
No. 41. International Food Policy Research Institute
NARO/DFID (2002), ―Potential agricultural market opportunities and enterprise
development for the Teso and Lango regions”, Client-oriented Agricultural
Research and Dissemination Project.
National Research Council (2006). ‗Lost Crops of Africa’. Vegetables, Volume II: The
National Academies Press, Washington, D.C.
Nicholson W. (2002) Microeconomic Theory. Basics Principles and Extensions. Thomson‘s
Learning‘s Inc.
Olsen, J.A. and Smith, R.D., (2001). Theory versus practice: A review of ‗Willingness To
Pay‘ in health and health care. Health Economics 10, 39–52.
Omongo, C.A., Ogenga-Latigo, M.W., Kyamanywa, S. and Adipala, E., (1997). Effects of
seasons and cropping systems on occurrence of cowpea pests in Uganda.
African Crop Science Conference Proceedings 3:1111-1116.
Omongo, C.A., Ogenga-Latigo, M.W., Kyamanywa, S. and Adipala, E.( 1998). Insecticide
application to reduce pest infestation and damage on cowpea in Uganda. African
Plant Protection 4:91-100.
Palis, F.G.,( 1998). Changing farmers' perceptions and practices: the case of insect pest
control in Central Luzon, Phillippines. Crop Protection 17:599-608.
Park H. M (2008) Comparing Group Means: T-tests and One-way ANOVA Using Stata,
SAS, and SPSS
Pattanayak, S., C. Van den Berg, J. Yang and G. Van Houtven (2006). The Use of
Willingness to Pay Experiments: Estimating demand for piped water
connections in Sri Lanka. World Bank Policy Research Working Paper 3818.

66
Patterson, S.P., McWatters, K.H., Hung, Y.-C., Chinnan, M.S. & Phillips, R.D. (2002).
Physico-chemical properties and consumer acceptability of akara (fried paste)
made from three cowpea cultivars. Food Research International, 35, 691–696.
Pereira, P. A. A., Del Peloso, M. J., da Costa, J. G. C., Ferreira, C. M., Yokoyama, L. P.
(2001). Beans Product: Perspectives for Production, Consumption and Genetic
Improvement. Paper presented at the Cowpea Research National Meeting.
Embrapa Rice and Beans. Teresina, PIAUÍ, Brazil.
Poverty Eradication Action Plan 2004/5-2007/8- Ministry of Finance, Planning and
Economic Development
Plattner S. (1989). Economic Anthropology. Stanford University Press. Stanford California.
Raje DV, P.S. Dhobe, A.W. Deshpande (2002), Consumer‘s willingness to pay more for
municipal supplied water: a case study National Environmental Engineering
Research Institute (NEERI), Nehru Marg, Nagpur 440 020, Indi
Ravnborg H.M., J Boesen, A. Sorensen, Z. Akello, B. Bashaasha, S. Kasozi, M Kidoido and
V. Wabukawo (2004) Gendered district poverty profiles and poverty monitoring
Kabarole, Masaka, Pallisa, Rakai and saka, Tororo districts, Uganda DIIS
Working Paper 2004:1.
Robbins P. and Ferris, S. (1999) ―The Impact of Globalization on the Agricultural sectors of
East and Central African countries‖.
Rodolfo M, Nayiga Jr., Fisher M.G., Onyango B. (2005) Acceptance of genetically
modified food: comparing consumer perspectives in the United States and South
Korea
Roe, B., Boyle, K. and Teisl, M. (1996) ‗Using conjoint analysis to derive estimates of
compensating variation’, Journal of Environmental Economics and
Management, 31, pp. 145-159. South Australia Independent Industry Regulator
(2000), Information Paper no.1, Electricity Tariffs and Security of Supply.
Rosen, S.,(1974) Hedonic prices and implicit markets: product differentiation in pure
competition. JPE 82, 34–55.
Ruthenberg, H. (1980). Farming systems in the tropics. Clarendon Press, Oxford.
Sabiti, A.G., Nsubuga, E.N.B., Adipala, E. and Ngambeki, D.S. (1994). A socio-economic
aspect of cowpea production in Uganda: A rapid rural appraisal. Uganda
Journal of Agricultural Sciences 2: 59-99.
Sabiti, J (1995): An economic Analysis of cowpea production in Nothern and Eastern
Uganda. Msc thesis of Makerere University Kampala Uganda.

67
Samuelson, P.A & Nordhaus, W.D (1995): Economics. MacGraw-Hill Company, New
York; USA.
Sandry, R. (1996). ‗Non market valuation in New Zealand: An empirical analysis of vehicle
bias’, New Zealand Economic Papers, 20.
Sarris A., D. Hallam, (2006) Agricultural Commodity Markets and Trade; A new Approach
to analyzing market structure and Instability. FAO
Schamel, G.,Gabbert,& H. Witzke(1998) Wine quality and price: A hedonic Approach. In
Daniel Pick et al(Ed.). Global markets for processed foods
Schippers, R. (1997). Domestication of Indigenous Vegetables for Sub-Saharan Africa: A
Strategy Paper. R. Schippers and Budds, African Indigenous Vegetables,
Workshop Proceedings, January 13- 18, 1997, Limbe, Cameroon.
Schutz, H.G. (1999), ―Consumer data – sense and nonsense‖, Food Quality and Preference,
Vol. 10 No. 4, pp. 245-51.
SCN. (2004). 5th Report on the World Nutrition Situation. Geneva: United Nations Sub-
Committee on Nutrition.
Seckler, D.,(1993). Agricultural transformation in Africa. Winrock International Institute for
Agricultural Development. pp. 153-156.
Sen, A., (1998) Development as Freedom.
Sentumbwe S., Mugisha J and Kiiza B.A (2005), Household labour resource allocation
among cowpea and ground nut producers in eastern Uganda.
Siemonsma, JS and Piluek, K (eds). (1994). Vegetables. Bogor: Plant Resources of South-
East Asia.
Ferris S. and P. Robins (1999); Food-net, Stakeholders Meetings for strengthening the
Market Information Service in Uganda, Dec.
Smith, GC; Clegg, MS; Keen, CL and Grivetti, LE. (1995). Mineral Values of Selected
Plant Foods Common to Southern Burkina Faso and to Niamey, Niger, West
Africa. International Journal of Food Sciences and Nutrition 47:41–53.
Smith, GC; Dueker, SR; Clifford, AJ and Grivetti, LE. (1996). Carotenoid Values of
Selected Plant Foods Common to Southern Burkina Faso, West Africa. Ecology
of Food and Nutrition 35:43–58.
Steenkamp, J.B.E.M. (1990). Conceptual models of the quality perception process. Journal
of Business Research, 21, 309–333.

68
Strauss, J., and D. Thomas ( 2000). ―Nutrition and Economic Development.‖ Journal of
Economic Literature.
Svetlana E. (2007). A hedonic approach to estimating the supply of variety attributes of a
subsistence crop. IFPRI Washington DC Agricultural Economics 37 (2007) 19–
28
Svetlana E., and S. Melinda (2006). A trait-based model of the potential demand for a
genetically engineered food crop in a developing economy IFPRI, Washington,
DC, USA
Thomas. W.J. (2002). Product testing in Decision analysis
http://www.decisionanalyst.com/service/concept.asp
Triplett, J. (1986), Handbook on Hedonic Indexes and Quality Adjustments in Price Indexes:
Special Application to Information Technology Products OECD Science,
Technology and Industry
Tronstad, R., L. Huthoefer and E. Monke. (1992). Market windows and Hedonic price
analysis: An application to the apple industry. Journal of Agricultural and
Resource Economics 17: 314-22
UBoS (2008), Statistical Abstracts; GoU
Unnevehr, L.J.,(1986) Consumer demand for rice grain quality and returns to research for
quality improvement in south-east Asia. Am. J. Agric. Econ. 68, 634–641.
Unnvehr, L.J and F.C Gounzou, (1998). Retail Premiums for Honey Characteristics‖
Agribussiness: An international Journal 14(1998) 49-54
United Nations 2005 Millenium Devolopment Goals Report
Uri, N.D, Hyberg, B, Mercier, S, Lyford, C. (1994), The Marketing valuation of the FGIS grain
quality characteristics‘‘ Applied Economics, Vol. 26 pp 201-12
Van der Laan, H. L., (1999). Agricultural Marketing in Tropical Africa: Obstacles to
Systematic Study. In: Van der Laan, H. L., Dijkstra, T. and van Tilburg, A.
(Eds). Agricultural Marketing in Tropical Africa. Contributions from the
Netherlands. Africa Studies Centre, Leiden. Ashgate Publishing Limited. pp.1-
18.
Van Houtven, G., S.K. pattanayak, A. Richter, D. Whittington, J. Freiberger, K. Komives,
A. de Nazelle and O. Matsui-Santana (2000). The Willingness to pay and the
Demand for Triple Drug Therapy in Mexico. Report Submited to Glaxo-smith
Kline. RTI International.

69
Veeman, M. and V. Adomowiez, (2000). Consumers perceptions of environmental risks and
the demand for food safety. Project Report 00-01. Edmonton: University of
Alberta, Department of Rural Economy.
Waugh. F. V. (1929) Quality as a Determinant of Vegetable Prices. New York: Columbia
University Press.
Waugh. Frederick V. (1928) ―Quality Factors Influencing Vegetable Prices." J. Farm Econ.
I0: 185-96.
Weinberger, K. and J. Msuya (2004) Indigenous Vegetables in Tanzania—Significance and
Prospects. Shanhua, Taiwan: AVRDC—The World Vegetable Center,
Technical Bulletin No. 31, AVRDC Publication 04-600. 70 pp.
Welsh, M.P., Poe, G.L., (1998) Elicitation effects in contingent valuation: comparisons to a
multiple bounded discrete choice approach. J. Environ. Econ. Manage. 36, 170–
185.
William W.W (1989) Differentiated and Implicit Prices in Export wheat markets. Western
Journal of Agricultural Economics, 14(1): 67-77
Williams, C.H., J.W Longworth, (1989) The choice of functional form for hedonic price
function: An application of the Box-Cox transformation to cattle prices in
Queensland. Discussion paper 16, Department of Economics, Univ. of
Queensland.
Wolfson, J. L. Murdock, L., Kitch, L., Shade, R. E. & Ntoukam, G. (1989). Preservation of
Post harvest Cowpeas by Subsistence Farmers in Cameroon. Bean/Cowpea
CRSP Cameroon Project Annual Report. East Lansing, Michigan: Michigan
State University. World Bank Policy Research Working Paper 3818.
www.elsevier.com/locate/ecolecon
Zellner, D.A.(1991) How foods get to be liked: Some general mechanics and special
Cases,in : Hedonics of taste (Ed. Rc. Bolles), pp199-217. Lawrence Erlbaum,
Hillsdale, New Jersey.

70
APPENDIX 1- QUESTIONNAIRE
CONSUMER PREFERENCES FOR COWPEAS IN UGANDA
QUESTIONNAIRE
Enumerator: introduce your self and explain the purpose of this survey, which is to collect information on the
status and use of Cowpea in the region. Please explain that all information solicited is for research purposes only.
1.0 Basic Data
Date form filled (mm/dd/yyyy)
Form filled at: Site
1= ; 2= ; 3= ; 4= ; 5= 1 2 3 4 5 6
Name of the
village/LC1
Parish Name of Town
Division
Name of H/H head
Name of Interviewer
Name of respondent
2.0. Demographic characteristics of the household.

71
No Names Gender
1 =Male
2=
Female
Age in
years
Relationship
to
Household
head.
1=Husband
2=Wife
3=Child
4=Brother
5=Sister
6=In-law
7=Farther
8=Mother
10=Others(
Specify)
…………
Educatio
n in
years
Who decides
what food to buy
at home?
1=Father
2=Mother
3=Wife
4=Husband
5=Others(Specif)
…………..
Occupation.
1=Teacher
2=Trader
3=Housewife.
4=Manual
labour
5=House girl
6=Chief
7=Student
8=Unemployed.
9=
Others(Specify)
…………….
Income
per year
1
2
3
4
5
6
7

72
3.0 Attitude towards cowpea consumption
3.1 Do you produce a meal out of cowpea seeds?
0 no
1 yes
3.2 If yes, which seed property you consider most important for seed meal suitability? (Tick
one)
1 colour
2 shape
3 size
99 other, please specify ______________________________________
3.3 Do you offer Cowpeas when visitors come to your home?
0 no
1 yes
3.4 Do you consume Cowpeas at special occasions?
0 no
1 yes
3.5 Are Cowpeas an important contribution to the diet when there is food shortage?
0 no 1 yes
3.6 Do adult males in your house- hold eat Cowpeas?
0 no
1 yes
3.7 Do adult females in your house- hold eat Cowpeas?
0 no
1 yes
3.8 Generally, do your children like eating Cowpeas?
0 no
1 yes
3.8b If No why?..................................................................................................................
3.9 Are you teaching your children how to prepare Cowpeas?
0 no
1 yes
3.10a Is it important to be able to identify the different varieties of cowpeas?
0 no
1 yes

73
3.10b How many Varieties are you aware of?................................
3.11 Are fewer varieties of Cowpeas to be found nowadays than 5-10 years back?
0 no
1 yes
4.0 Sensory Evaluations
4.1 With me, I have different types of cowpeas you might be familiar with, please have a
look and answer the questions that follow.
Use the scale below;
Seed coat Color___________( 5) excellent ( 4) good ( 3) fair (2) Bad ( 1) Very bad
Seed shape________________ (5 ) excellent ( 4 )good ( 3) fair (2 )Bad ( 1) Very bad
Seed meal making suitability properties; ____________ 5 excellent 4 good 3 fair 2 Bad 1
Very bad
Grain size, ___________ 5 excellent 4 good 3 fair 2 Bad 1 Very bad
Grain eye color, _____________5 excellent 4 good 3 fair 2 Bad 1 Very bad
Time taken for grain to cook in minutes
Acceptability______________ (5) Very acceptable (4) acceptable (3) fairly acceptable (2)
Not acceptable (1) Not acceptable at all
4.2 Incase you got a grain in the market with the following characteristics which of the
statements below would describe your preference?
Weevil Grain damage tolerance.__________ 1 (does not tolerate), 2 tolerates (1-10%), 3 can
tolerate up to (10- 20%), 5 (Not important).
Grain color mixes; Important = 0, Not important = 1
Grain size mixes; Important = 0, Not important = 1

74
Evaluate for me the attributes indicated in the table per sample using the above scale.
Attribute
Sample 1
Sample 2
Sample 3
Sample4
Sample 5
Seed coat Color
Seed shape
Grain size
Grain eye color
Grain size mixes
Grain colour mixes
Time taken for
grain to cook in
minutes
Seed meal making
suitability
properties
Grain damage
tolerance
Any additional comments on tested
characteristics______________________________________________________________
__________________________________________________________________________
__________________________________________________________________________
__________________________________________________________________________
__________________________________________________________________________
______________________________________________________________

75
4.3 How much would you consume and pay for each of the samples above in Uganda
Shillings if you were to buy?
Type of
Cowpeas
Unit Measure
Quantity consumed Unit price Total cost
Amount Unit time
1= Day
2= Weak
3=Month
Sample 1
Kgs
Sample2
Kgs
Sample 3
Kgs
Sample 4 Kgs
Sample 5
Kgs
5.0 Assessment of Cowpea Substitutes
5.1 How much do you consume and pay for each of the products described below in Uganda
shillings?
Type of grain Unit Measure
Quantity consumed Unit price Total cost
Amount Unit time
1= Day
2= Weak
3=Month
Beans
Kgs
Soya beans
Kgs
Pigeon peas
Kgs
Field peas Kgs
Others

76
5.2 Which of the following best describes your preference for cowpea samples?
Description
Sample 1
Sample 2
Sample 3
Sample 4
Sample 5
Very good
Good
Fair
Poor
Very poor
5.3 Based on the descriptions of the samples would you be interested in buying them if
priced within your budget?
Description
Sample 1 Sample 2 Sample 3 Sample 4 Sample 5
Very interested
Interested
Not interested
Not decided
5.4 Please tell us whether you have ever seen any of the described samples on the market
(Identify them for the respondent)
Description
Sample 1
Sample 2
Sample 3
Sample 4
Sample 5
1 = Aware
2=Not aware
3= Just seen it

77
If yes, where did you see
it?________________________________________________________________________
__________________________________________________________________________
__________________________________________________________________________
__________________________________________________________________
6.0 Household income information
6.1. Please tell us your sources of Cash income since this year started
Type of income Type of activity Period
1= Daily
2= weakly
3= monthly
4= others
Amount of income
received (Ug. Sh)
Salaries/Wages
Renting building
Remittances
Gifts
Trade/profit
Selling livestock
products
Crop produce sales
Asset/land sales
Land rent
Others( Please specify)

78
6.2 Type of house as an income indicator (To be collected by the Interviewer).
House
ownership
Walls Floor Roof Geographic
location of the
house
1= Renting
2=Owned
Bricks Tiles Iron sheets
Concrete blocks Concrete
Grass or
thatch
Mud Mud
Tiles
Thank you for your collaboration!

79
APPENDIX 2-MARKET DATA COLLECTION TEMPLATE
Data sheet for tracking market sales of cowpea Varieties
Enumerator: introduce your self and explain the purpose of this survey, which
is to collect information on the status and use of Cowpea in the region. Please
explain that all information solicited is for research purposes only. Name of Contact trader__________________________Name of market_____________________________ Dat
e
Name of
Custom
er
Who buys
1= trader
2=Consum
er
Variet
y
Price
sold/kilogra
m
Quanti
ty sold
Where does
he/she take
the
cowpeas(Na
me of
market/zone
Commen
ts
Thank you for your collaboration!

80
APPENDIX 3-FARM GATE DATA COLLECTION TEMPLATE
Data sheet for farm gate prices of cowpea Varieties
Enumerator: introduce your self and explain the purpose of this survey, which is to collect
information on the status and use of Cowpea in the region. Please explain that all
information solicited is for research purposes only.
We request you provide for us information on your cowpea production and sales in the last
season (August –December 2007)
The following samples could help you differentiate the varieties.
SN Name of
Farmer
Who
buys
1=
trader
2=Consu
mer
Varieties
Grown
Quanti
ty
harves
ted
Quantity
sold
Price
sold/kilogra
m
Ug,
shillings
Where does
he/she take
the
cowpeas(N
ame of
market/zon
e
Any
Comments
?
Thank you for your collaboration!
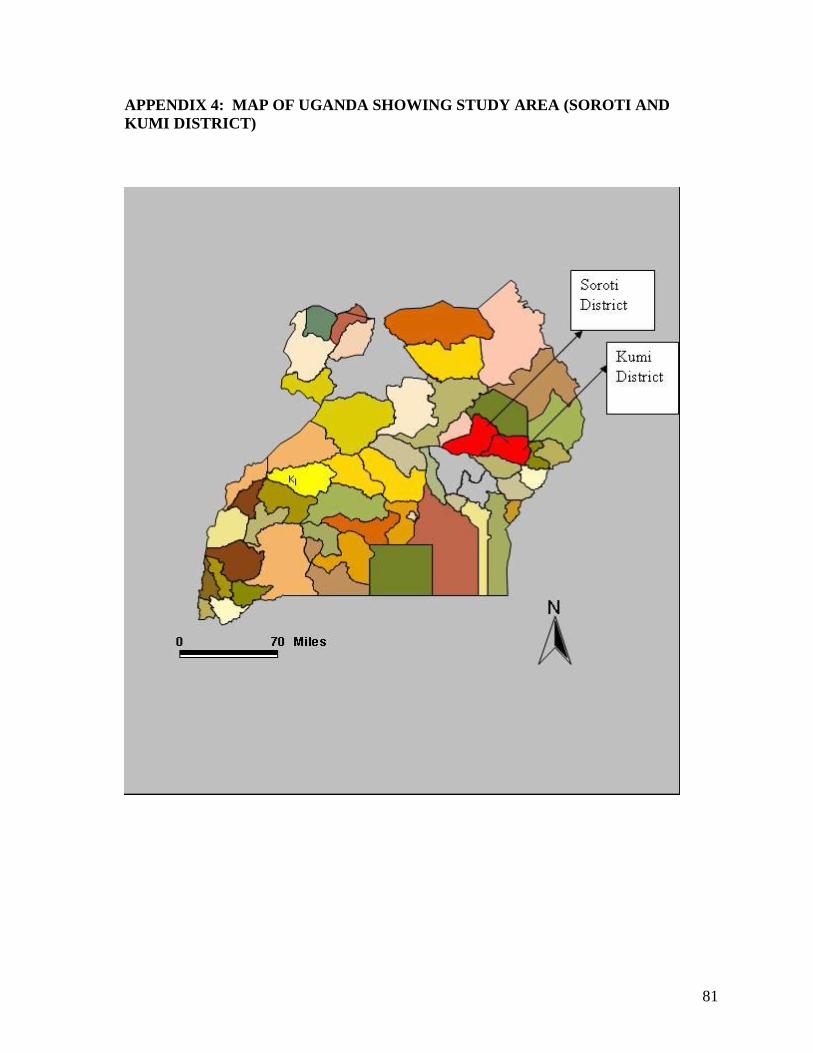
81
APPENDIX 4: MAP OF UGANDA SHOWING STUDY AREA (SOROTI AND
KUMI DISTRICT)


![滋賀報知新聞デジタル版 · 461 program Sweet Morning [H] Kumi Kumi Twilight Breeze MUSIC BOX RUI tc-F5— & 25 Radio Sweet 81.5 MHz , Sweet Morning Tuesday Kumi Twilight](https://static.fdocuments.in/doc/165x107/606ff357c3578421e27b35f9/eceffc-461-program-sweet-morning-h-kumi-kumi-twilight.jpg)


