Estimation of carbon and their fluxes in tropical ... · -The Agency For the Assessment and...
22
SBSTA 38 Research Dialogue -Developments in research activities relevant to the needs of the Convention- 4 June 2012, 15:00 - 18:00, Maritim Hotel, Bonn, Germany Plenary II: Emerging scientific findings: Ecosystems and GHG emissions and removals from sources, sinks and reservoirs, including from terrestrial ecosystems Estimation of carbon and their fluxes in tropical peatlands: Results from a Japan-Indonesia joint project Prof. Mitsuru Osaki, PhD Research Faculty of Agriculture, Hokkaido University, Japan
-
Upload
truongthuy -
Category
Documents
-
view
217 -
download
0
Transcript of Estimation of carbon and their fluxes in tropical ... · -The Agency For the Assessment and...

SBSTA 38 Research Dialogue -Developments in research activities relevant to the needs of the
Convention- 4 June 2012, 15:00 - 18:00, Maritim Hotel, Bonn, Germany
Plenary II: Emerging scientific findings: Ecosystems and GHG
emissions and removals from sources, sinks and reservoirs, including from terrestrial ecosystems
Estimation of carbon and their fluxes in tropical peatlands:
Results from a Japan-Indonesia joint project
Prof. Mitsuru Osaki, PhD
Research Faculty of Agriculture, Hokkaido University, Japan

http://www.jst.go.jp/global/english/about.html
SATREPS: Science and Technology Research Partnership for Sustainable Development
funded by 1) the Japan Science and Technology Agency (JST) and 2) the Japan International Cooperation Agency (JICA).
SATREPS is a Japanese government program that promotes international joint research
targeting global issues, involving partnerships between researchers in Japan and researchers in developing countries.
SATREPS projects are expected to lead to outcomes with potential for practical utilization,
and to enhance research capacity in the developing country.

http://www.census.hokudai.ac.jp/html/JSTJICA/index.html

Total amount of CO2 emission

COP15 Poster
Amount of carbon dioxide emitted annually from the tropical peatland per 1 million ha.(Indonesia has 20 times the size of this tropical peatland.) Amount of carbon
dioxide emitted by microbial degradation (About 3 % of the total emission from Japan in 1990.)
About 13% of the total emission from Japan in 1990.
Amount of carbon dioxide emitted by peat fire (About 10 % of the total emission from Japan in 1990.)

Central Kalimantan, Indonesia Peatland area in Mega Rice Project site
CO2 observation towers at
UDF:(Un-drained Peat)
DF:(Drained Peat )
BC:(Burnet Peat)
Various Study Topics: ・GHG Flux (CO2, CH4, N2O) measuring
・Fire Detection and Protection ・Water Table Monitoring and Management
・Peatland Ecology ・Soluble Carbon Monitoring
・Peatland Subsidence Monitoring ・etc.
→Monitoring was started from 1997
UDF
DF BC
Main Project Sites

Implementation Agency -National Standardization Agency(BSN)
Executing Agencies -Forestry Research and Development Agency (FORDA)
-Indonesian Institute of Sciences (LIPI) -Indonesian National Institute of Aeronautics and Space (LAPAN)
-University of Palangka Raya (UNPAR) -State Ministry of Research and Technology (RISTEK)
Collaboration Agencies -National Council for Climate Change (Dewan Nasional Perubahan Iklim, DNPI)
-The Agency For the Assessment and Application Technology (Badan Pengkajian Dan Penerapan Teknologi, BPPT)
-Ministry of Energy and Mineral Resources (ESDM)
Collaboration with Indonesia Institutes
Collaboration University ITB, IPB, UGM, UI

Kalimantan University Consortium Education, Capacity Building, and Networking

What Factors Regulate Carbon in Tropical Peat?
Carbon Emission by Fire
Water
Carbon Emission by Microorganisms
Degradation
Deforestation
・Dryness of ground surface
・Decrease water holding capacity
Forest Degradation
・Decreasing water table by Drainage
Carbon Loss through Water
Land Use, Land-Use Change and Forestry (LULUCF)
・Farming/ Vegetation
Tree Growth/Mortality

PALSAR, AMSR-E (4), (5), (6), (7)
GOSAT (1)
Satellite
Airborne /***UAV
Ground Tower(1)
Terra & Aqua MODIS (2)
LiDAR (4), (6), (7) UAV*3(1), (3)
ASTER, Hisui (3), (4), (8)
(7)Peat subsidence
(5)Water level, & Soil moisture
(3) Forest degradation & Species mapping
(1) CO2 Flux & Concentration
FES-C*1 (1)
*1:FES-C : Fiber Etalon Solar measurement of CO2 *2:VHR : Very High Resolution Remote Sensing Data
*3:UAV: Unmanned Aerial Vehicle *4:LCTF: Liquid Crystal Tunable Filter
Lateral CO2 Flux
Vertical CO2 Flux
DGPS(7) DGPS(7)
Chamber(1)
Water Gauge(5) (6)Peat dome detection
& Peat thickness
Drilling(6)
(2) Wildfire detection & Hotspot
(8)Water soluble organic carbon
Red: Instrument Black: Target
(4) Deforestation & Forest biomass
change
Landsat, SPOT, TerraSAR,
AVNIR-2, VHR*2 Sensors (3), (4)
Key Elements of Tropical Peatland MRV System
Micro-Satellite & LCTF*4

02 03 04 05 06 07 08 09-2-1012345
Year
Mon
tly-m
ena
NE
E(g
C m
-2 d
-1)
NEE UFDFBD
Seasonal variation in net CO2 exchange (NEE)
Large increases in NEE in the dry seasons of 2002, 2004 and 2006, El Niño years, because of shading by dense smoke and the enhancement of
aerobic peat decomposition due to low GWL.
NEE = RE - GPP

Hirano Model Annual NEE vs. Annually Mean GWL
-0.7 -0.6 -0.5 -0.4 -0.3 -0.2 -0.1 0.0-100
0100200300400500600700
GWL (m)
NE
E (g
C m
-2 y
-1)
UFDFDB
Hirano et al.(2012), GCB
●UF NEE=-2376GWL-151 ●DF NEE=-1609GWL-510 ●DB NEE=-789GWL-378
NEE: Net Ecosystem CO2 Exchange
Ground Water Table
GSMaP MTSAT In-situ ground water
table
Drought Index
Precipitation Land Surface
Temp.
AMSR
Takeuchi Model GWT estimation by
Remote Sensing Data
Takeuchi, Hirano, Anggraini and Roswintiarti (2010)

By Wataru Takeuchi, University of Tokyo, Japan
Tuning
Modeling Algorism
Satellite Sensing
Coefficiency between Water Table Level and 1) CO2 emission by Oxidation 2) CO2 emission by Fire Factors
Input
Water Table Mapping
Output
Mapping of 1) CO2 emission by Oxidation 2) CO2 emission by Fire Factors
Water Table Mapping
388
384
380
376
372
Mar
2009 2010 2011
Jul
Okt
Jan
May
Aug
Nov
Feb
Jun
Sep
Dec
Month
Con
cent
ratio
n C
O2 (
ppm
v)
Sep.2009
Sep.2012
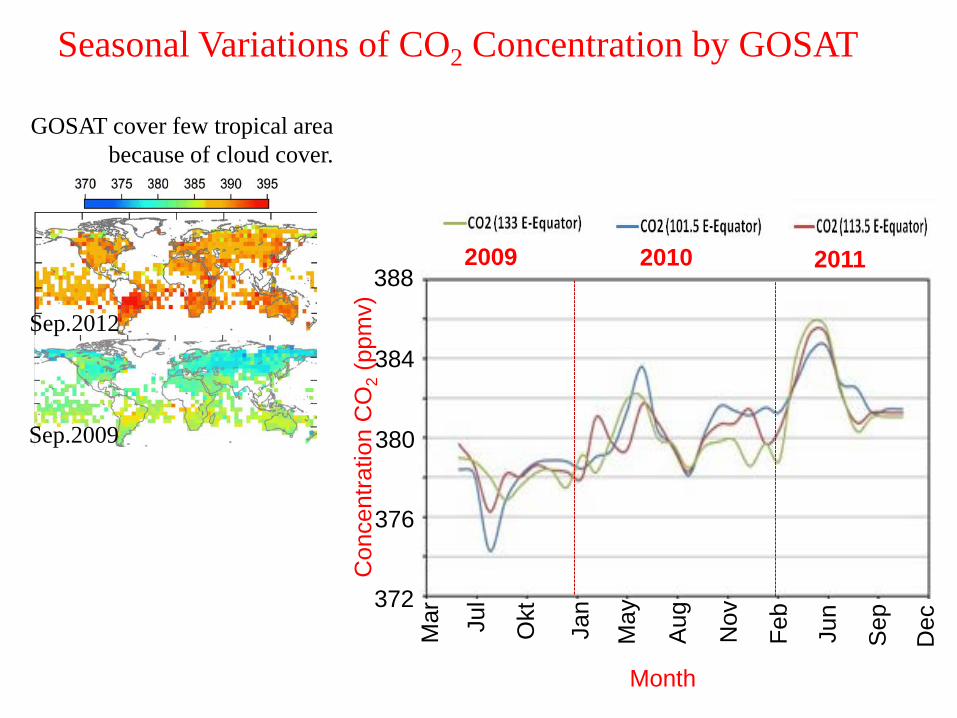
GOSAT cover few tropical area because of cloud cover.
Seasonal Variations of CO2 Concentration by GOSAT

There are notable difference in the CO2 mixing ratios (ppm) between the out-flow point of Parangka Raya and the in–flow point of Banjaru Baru, which were obtained with use of FES-C in August , 2011.
CO2 flux estimation from peat fire
In-flow
Out-flow
The ground base column concentration sensor with optical fiber technology (FES-C)

Simulator: SimCycle-Visit for East Asia
Column averaged dry air mole fraction distribution of carbon dioxide for the month of September, 2009, obtained from IBUKI observation data (unvalidated) By JAXA
Satellite GOSAT “IBUKI” Senescing: CO2
Top-down • satellite • airplane
• inverse model
Bottom-up • field survey
• flux obs. • process model
Integrated, practical carbon
budget map
・Carbon Emission by Fire
・Carbon Loss through Water ・Carbon Emission by Microorganisms
Degradation ・Tree Growth/Mortality
Carbon-Water Simulator
Simulation on CO2 Mapping

■Indonesia CTC (Climate Technology Center) at BPPT
Outcomes of SATREPS ・Real Time Monitoring System
・Integrated MRV System ・ Real Time CO2 Emission Mapping

Kalampangan area, Central Kalimantan
Thank you for your attention!

Appendix: Q: How to estimate Forest Degradation and LULUCF? A: HISUI (Hyper-spectral Imager SUIte) will be available for these estimation soon.


Using NDWI as a indicator of water stress, blast disease of oak tree is detected in the early stages. This result shows that the analysis using hyperspectral data can monitor the health condition which multispectral analysis (or visual examination) can not detect.
(a) 2008/8/12 (b) 2009/6/12 (c) 2009/8/26
Normalized Difference Water Index(NDWI)
(NIR:880nm,SWIR:1240nm)
Red:Dead trees in Fig.(c) Green:water stressed
trees in Fig.(b) Yellow:Corresponding
area of estimated water stressed trees in June
and dead tress in August.
Extract water stressed trees using NDWI
(NDWI<-0.2)
Extract dead trees
Validation of extraction result
HISUI-Hyper

HISUI-Hyper
Many species mix
Tumih, Grungang
Low density
・Mitsubishi Research Institute, Inc ・Japan Space System ・Hokkaido University ・Agency for the Assessment and Application of Technology, Indonesia (BPPT)
Forest type in tropical forest in peatland