Estimating!age+!and!size+specific!natural!mortality!rates ...sedarweb.org/docs/wpapers/S42...
35
Estimating age and sizespecific natural mortality rates for Gulf of Mexico red grouper (Epinephelus morio) using the ecosystem model OSMOSEWFS A. Grüss, M. J. Schirripa, D. Chagaris, P. Verley, Y.J. Shin, L. Velez, C. H. Ainsworth, S. R. Sagarese, and L. LombardiCarlson SEDAR42AW05 11 March 2015 This information is distributed solely for the purpose of pre-dissemination peer review. It does not represent and should not be construed to represent any agency determination or policy.
Transcript of Estimating!age+!and!size+specific!natural!mortality!rates ...sedarweb.org/docs/wpapers/S42...

Estimating age-‐ and size-‐specific natural mortality rates for Gulf of Mexico red grouper (Epinephelus morio) using the ecosystem
model OSMOSE-‐WFS
A. Grüss, M. J. Schirripa, D. Chagaris, P. Verley, Y.-‐J. Shin, L. Velez, C. H. Ainsworth, S. R. Sagarese, and L. Lombardi-‐Carlson
SEDAR42-‐AW-‐05
11 March 2015
This information is distributed solely for the purpose of pre-dissemination peer review. It does not represent and should not be construed to represent any agency determination or policy.

Please cite this document as:
Grüss, A., M. J. Schirripa, D. Chagaris, P. Verley, Y.-J. Shin, L. Velez, C. H. Ainsworth, S. R. Sagarese, and L. Lombardi-Carlson. 2015. Estimating age- and size-specific natural mortality rates for Gulf of Mexico red grouper (Epinephelus morio) using the ecosystem model OSMOSE-WFS. SEDAR42-AW-05. SEDAR, North Charleston, SC. 33 pp.

1
SEDAR42-AW-05
Estimating age- and size-specific natural mortality rates for Gulf of Mexico red grouper (Epinephelus morio) using the ecosystem model OSMOSE-WFS
A. Grüss1,2, M. J. Schirripa2, D. Chagaris3, P. Verley4, Y.-J. Shin4,5, L. Velez4, C. H. Ainsworth6, S. R. Sagarese1,2, and L. Lombardi-Carlson7
1University of Miami, Rosenstiel School of Marine and Atmospheric Science, Cooperative Institute for Marine and Atmospheric Studies, 4600 Rickenbacker Causeway, Miami, FL,
33149, USA
2Southeast Fisheries Science Center, Sustainable Fisheries Division, 75 Virginia Beach Drive, Miami, FL, 33149-1099, USA
3Florida Fish and Wildlife Conservation Commission, Fish and Wildlife Research Institute, 100 8th Ave SE, St. Petersburg, FL 33701, USA
4Institut de Recherche pour le Développement, UMR EME 212, Centre de Recherche Halieutique Méditerranéenne et Tropicale, Avenue Jean Monnet, CS 30171, 34203 Sète
cedex, France 5University of Cape Town, Marine Research Institute Ma-Re, Department of Biological
Sciences, Private Bag X3, Rondebosch, Cape Town 7701, South Africa 6University of South Florida, College of Marine Science, 140 7th Avenue South, St.
Petersburg, FL 33701, USA 7National Marine Fisheries Service, SEFSC, Panama City Laboratory, 3500 Delwood Beach
Road, Panama City, FL 32408, USA
2
Introduction
A comprehensive integrated ecosystem assessment (IEA) program of the Gulf of
Mexico (GOM) has been initiated by the National Oceanic and Atmospheric Administration
(NOAA) to support ecosystem-based management (EBM) in the region (Samhouri et al.,
2013; Schirripa et al., 2013; http://www.noaa.gov/iea/regions/gulf-of-mexico/index.html).
The GOM IEA program aims, inter alia, to integrate environmental and ecosystem
considerations into fisheries stock assessments and to inform decisions in fisheries
management (http://www.noaa.gov/iea/regions/gulf-of-mexico/index.html). In March 2013,
the GOM Fishery Management Council’s Standing and Ecosystem Scientific and Statistical
Committees (SSCs) passed motions requesting incorporation of IEA products into single-
species stock assessments and living marine resource management decisions on a regular
basis (http://www.noaa.gov/iea/transfer-knowledge/gulf-of-mexico-council-support.html).
In 2013-2014, the GOM IEA program informed the stock assessment of GOM gag
grouper (Mycteroperca microlepis) conducted under the auspices of Southeast Data
Assessment and Review (SEDAR) (SEDAR 33; http://www.sefsc.noaa.gov/sedar/). In
particular, three ecosystem simulation models of the West Florida Shelf, including two
Ecopath with Ecosim (EwE) models (‘WFS Reef fish EwE’; Chagaris, 2013; Chagaris and
Mahmoudi, 2013; and ‘WFS Red tide EwE’; Gray et al., 2013; Gray, 2014) and one
OSMOSE model (‘OSMOSE-WFS’; Grüss et al., 2015), were employed to produce estimates
of natural mortality rates for different life stages (stanzas) of gag grouper. Ecopath is a trophic
mass-balance modeling approach, which is widely used worldwide to study the trophic
structure of marine ecosystems (Christensen and Walters, 2004; Christensen et al., 2008).
Ecosim builds upon Ecopath to simulate the dynamics of marine ecosystems over time by
modifying fishing mortality and environmental forcing functions (Walters et al., 1997;
Christensen and Walters, 2004). The WFS Reef fish Ecopath model allowed to analyze

3
trophic interactions and to quantify trophic flows in the West Florida Shelf ecosystem in
2005-2009 (Chagaris, 2013; Chagaris and Mahmoudi, 2013). The WFS Red tide EwE model
was built upon Okey and Mahmoudi (2002)’s EwE model – which is also the basis of WFS
Reef fish EwE - to assess the effects of red tide (Karenia brevis) events on socio-
economically important reef fish species (Gray et al., 2013; Gray, 2014).
OSMOSE (Object-oriented Simulator of Marine ecOSystem Exploitation) is a
spatially-structured, individual-based and multispecies modeling approach, which is
increasingly being used by marine ecosystem modelers (Shin and Cury, 2001, 2004; Travers-
Trolet et al., 2014; http://www.osmose-model.org). The key features of OSMOSE are the
consideration of size-based predator-prey interactions, and the explicit representation of the
whole life cycle of the major high trophic level (HTL) groups of fish and invertebrate species
of a given ecosystem (Shin and Cury, 2001, 2004). OSMOSE-WFS is a steady-state
application of the OSMOSE modeling approach with a monthly time step, which describes
the trophic structure of the West Florida Shelf ecosystem in the 2000s (Fig. 1; Grüss et al.,
2015). OSMOSE-WFS shares a number of characteristics with WFS Reef fish Ecopath (e.g.,
the spatial domain considered, reference biomasses), for the purpose of comparisons between
the two models (Grüss et al., 2015).
In 2014-2015, the GOM IEA program is informing the stock assessment of GOM red
grouper (Epinephelus morio) conducted under the auspices of SEDAR 42 using, inter alia, the
OSMOSE-WFS model. In June 2014, a new version of the OSMOSE modeling approach
(‘OSMOSE version 3 update 1’ or ‘OSMOSE v3u1’) was released (http://www.osmose-
model.org). One of the differences between OSMOSE v3u1 and earlier versions of OSMOSE
is the use of a recently developed mortality algorithm, called the ‘stochastic mortality
algorithm’, which assumes that all types of mortalities are processes that are simultaneous,
and that there is competition and stochasticity in the predation process (http://www.osmose-

4
model.org). The OSMOSE-WFS model was updated in Grüss et al. (2014) to meet the
specifics of OSMOSE v3u1 and, therefore, had to be recalibrated so that biomasses of the
HTL groups represented in the model keep matching observed biomasses over the period
2005-2009.
The updated OSMOSE-WFS model presented in Grüss et al. (2014) did not produce
satisfactory diet compositions for some HTL groups. Therefore, the model needed to be
recalibrated. In the present study, we explain how we recalibrated OSMOSE-WFS, and then
employ the model to produce definitive natural mortality estimates for GOM red grouper for
SEDAR 42. In the following, we: (1) briefly remind the structure and main assumptions of the
new version of the OSMOSE-WFS model meeting the specifics of OSMOSE v3u1; (2) fit the
model to the biomasses observed in the West Florida Shelf in 2005-2009; (3) validate the
calibrated OSMOSE-WFS model by comparing the predicted diets to observed diets, and the
predicted trophic levels (TLs) to TLs from the WFS Reef fish Ecopath model; and (4)
evaluate annual natural mortality estimates for different age classes and life stages of red
grouper and compare these estimates to those produced for SEDAR 42 using Lorenzen
(2005)‘s approach and to those predicted by WFS Reef fish Ecopath.
Material and methods
Structure and main assumptions of OSMOSE-WFS
OSMOSE-WFS is a two-dimensional individual-based and multispecies model with a
monthly time step providing a representation of trophic interactions in the West Florida Shelf
ecosystem in the 2000s. OSMOSE-WFS explicitly represents the whole life cycle of the
major pelagic-demersal and benthic HTL groups of fish and invertebrate species of the West
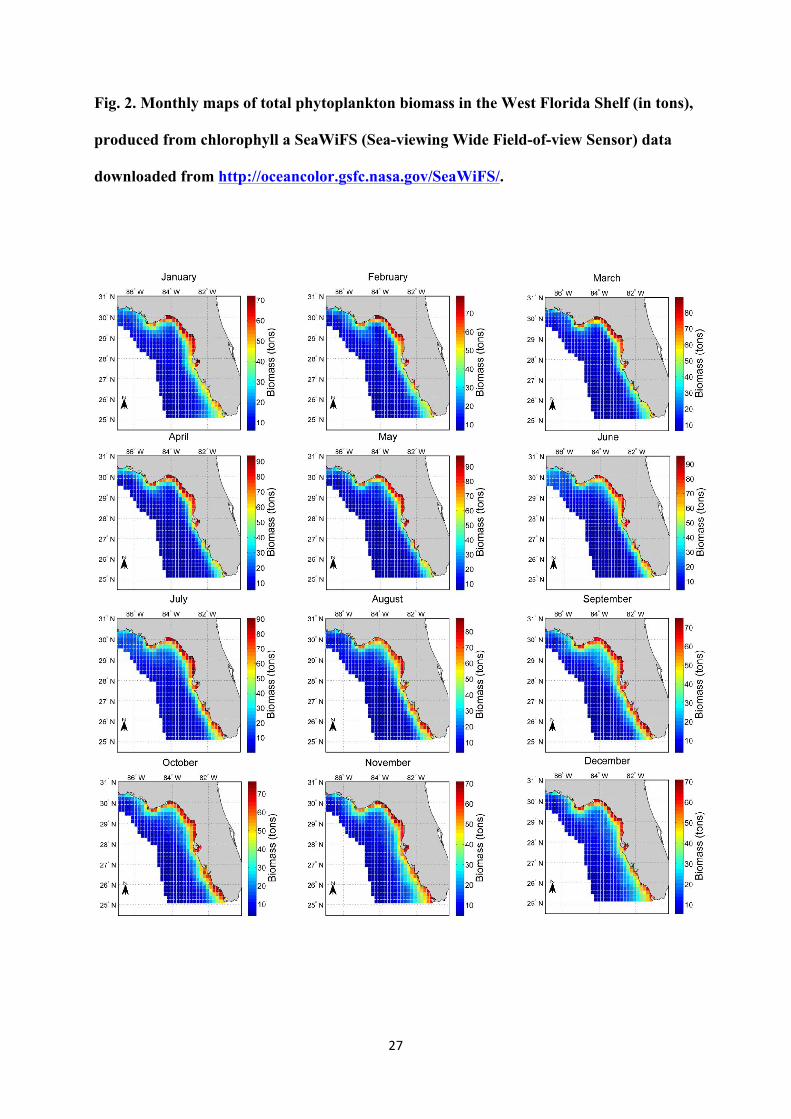
Florida Shelf (Fig. 1). The model is forced by the biomasses of low trophic level (LTL)
5
groups of species (plankton and benthos), which were estimated from SeaWiFS (Sea-viewing
Wide Field-of-view Sensor) data and the WFS Reef fish Ecopath model (Table 1 and Fig. 2).
In OSMOSE-WFS, basic units are schools, which are composed of animals belonging to the
same HTL group, that have the same age, body size, food requirements and, at a given month,
the same spatial coordinates. The central assumption in OSMOSE-WFS is that predation is an
opportunistic process, which depends on: (1) the overlap between predators (HTL groups
only) and potential prey items (HTL and/or LTL groups) in the horizontal dimension; (2) size
adequacy between the predators and the potential prey (determined by ‘predator/prey size
ratios’); and (3) the accessibility of prey items to predators, which depends on their vertical
distribution and morphology (this being determined by means of ‘accessibility coefficients’).
Thus, in OSMOSE-WFS, the food web structure of the West Florida Shelf ecosystem and,
therefore, predation and starvation mortality rates, emerge from local trophic interactions.
Ten fish and two crustacean HTL groups are explicitly represented in OSMOSE-WFS
as either single species or groups of species: (1) king mackerel (Scomberomorus cavalla); (2)
amberjacks; (3) red grouper; (4) gag grouper; (5) red snapper (Lutjanus campechanus); (6) the
sardine-herring-scad complex; (7) anchovies and silversides; (8) coastal omnivores; (9) reef
carnivores; (10) reef omnivores; (11) shrimps; and (12) large crabs (Table 2). Within each
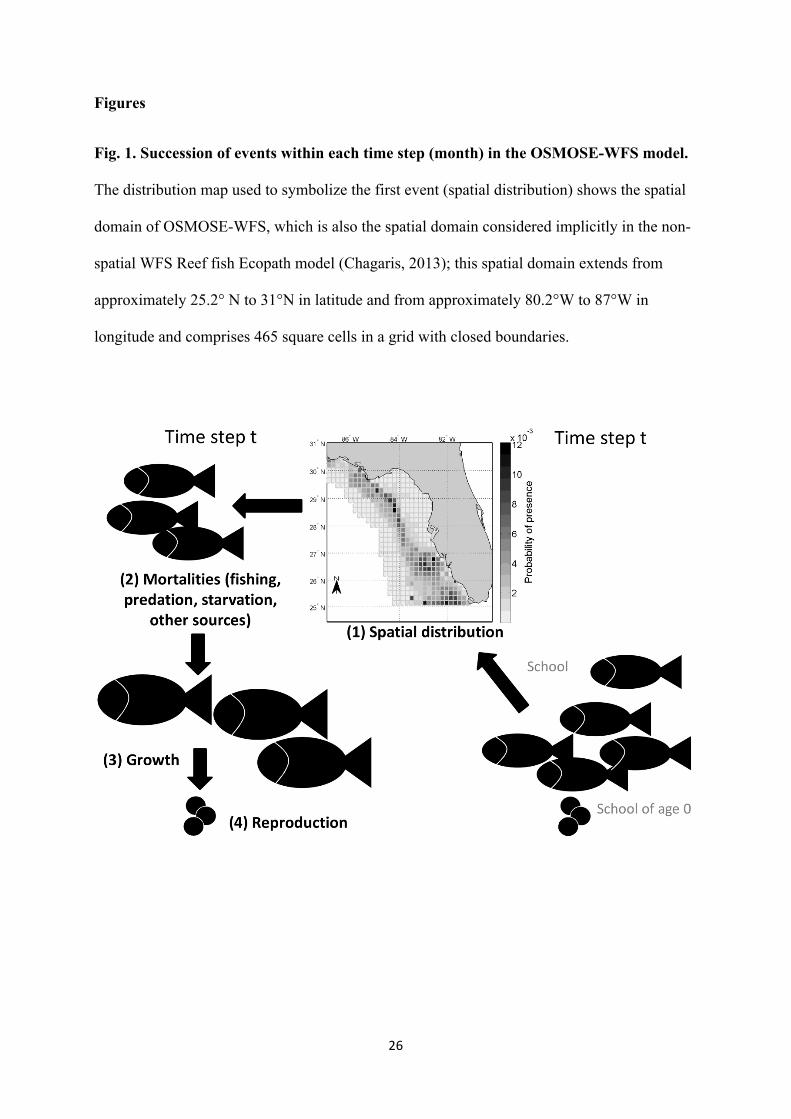
time step (month), four successive events occur in OSMOSE-WFS, as depicted in Fig. 1: (1)
distribution of the schools over space using specific distribution maps; (2) mortalities
(predation mortality, starvation mortality, diverse natural mortality, and fishing mortality); (3)
somatic growth of fish that is estimated based on their predation success; and (4)
reproduction. The assumptions, details and parameterization of OSMOSE-WFS are described
in details in Grüss et al. (2014).
6
Calibration of OSMOSE-WFS
We used a specific evolutionary algorithm (EA; Oliveros-Ramos and Shin, submitted
for publication) to recalibrate OSMOSE-WFS to a reference state corresponding to the mean
observed conditions in the West Florida Shelf region over the period 2005-2009. The
recalibration process involved the adjustment of some of the minimum and maximum
predator/prey size ratios (Lpred/Lprey’s) of HTL groups (Table 3), so as to ensure that all the
diet compositions predicted by OSMOSE-WFS are satisfactory.
In brief, the calibration process of the OSMOSE-WFS model: (1) ensures that the
biomasses of the HTL groups predicted by OSMOSE-WFS are on average within valid
intervals (see Table 4 for the minimum and maximum biomass values in 2005-2009); and (2)
allows the estimation of unknown parameters, i.e., the mortality rates of the eggs and larvae
(0-1 month old individuals) of HTL groups (referred to as ‘larval mortality rates’; Mdiverse0
parameters) and the availability coefficients of LTL groups to all HTL groups (α parameters)
(see Grüss et al. (2014, 2015) for further details).
Validation of OSMOSE-WFS
To validate the OSMOSE-WFS model, we compared the diets predicted by the
calibrated model to observed diets, and the predicted trophic levels (TLs) to TLs from the
WFS Reef fish Ecopath model, as in Grüss et al. (2014, 2015).
As OSMOSE is a stochastic modeling approach, 10 simulation replicates were
considered to estimate diet compositions and TLs. Moreover, the systems that are modeled in
OSMOSE generally stabilize after a period equal to around twice the maximum age of the
7
longest-lived HTL group being explicitly considered. The longest-lived HTL group currently
represented in OSMOSE-WFS is red snapper, which lives up to 57 years (SEDAR 7, 2005).
Therefore, OSMOSE-WFS was run for 134 years to ensure that the model reaches a steady
state and only the outcomes of the last 20 years of simulation were analyzed. The maximum
number of schools per annual cohort was set to 240. The same set-up applied for the
simulations presented in the next subsection.
Evaluation of natural mortality rates for GOM red grouper
We estimated the following annual natural mortality rates for GOM red grouper with
OSMOSE-WFS: (1) its total annual predation mortality rate (Mpredation); (2) its annual rate of
natural mortality unexplained by predation (Mothers); and (3) its total annual natural mortality
rate (M). Mothers was evaluated for the purpose of comparison with WFS Reef fish Ecopath,
and is given by:
Starvationdiverseothers MMM += (1)
where diverseM is mortality due to marine organisms and events (e.g., red tide events, diseases)
that are not explicitly considered in OSMOSE-WFS; and Mstarvation is the annual starvation
mortality rate. The total annual natural mortality rate M is given by:
otherspredation MMM += (2)
An age-specific vector of M for GOM red grouper was estimated with OSMOSE-WFS
and compared to the age-specific vector of M produced for SEDAR 42 by the ‘Life History
group’ using Lorenzen (2005)‘s approach. Age 0 in OSMOSE-WFS includes all red grouper
individuals that are older than 1 month and younger than 1 year; 0-1 month old red groupers

8
belong to the ‘ichthyoplankton’. The Lorenzen (2005)‘s approach employed for SEDAR 42
relates M-at-age to the mean length-at-age by an exponential decay, and takes into
consideration: (i) von Bertalanffy growth parameters (the maximum length, instantaneous
growth rate at small size and theoretical age of zero length estimated for SEDAR 42; (ii) first
age of vulnerability into the fishery (assumed to be age 5 in SEDAR 42); (iii) maximum age
(29 years; SEDAR, 2009a); and (iv) target M at maximum age (0.14 year-1; calculated for
SEDAR 42 from Hoenig (1983)).
Moreover, M, Mpredation and Mothers were estimated for younger juveniles (individuals
older than 1 month and smaller than 14.8 cm), older juveniles (individuals larger than 14.8 cm
TL and smaller than 34.1 cm) and adults (individuals larger than 34.1 cm) of red grouper, and
compared to natural mortality rates estimated for these red grouper stanzas in the WFS Reef
fish Ecopath model (Chagaris, 2013). In WFS Reef fish Ecopath, M is the sum of Mpredation
and unexplained mortality (i.e., mortality unexplained by fishing and predation, and due to
starvation, diseases, etc.), which is comparable to Mothers evaluated with OSMOSE-WFS.
Results
Calibration of OSMOSE-WFS
The minimum and maximum Lpred/Lprey’s of a number of HTL groups needed to be
adjusted to obtain satisfactory diet compositions, while helping the EA to converge to a
satisfactory solution (Table 3).
The calibration of OSMOSE-WFS model converged to a satisfactory solution with all
biomasses of HTL groups falling on average within valid intervals after 115 to 134 years of
simulation (Fig. 3). Among the different simulation replicates, the biomasses of all HTL

9
groups were always on average within valid intervals, except in a few replicates for king
mackerel, amberjacks and gag grouper. OSMOSE-WFS reached a steady state after around 60
years of simulation (Fig. 4).
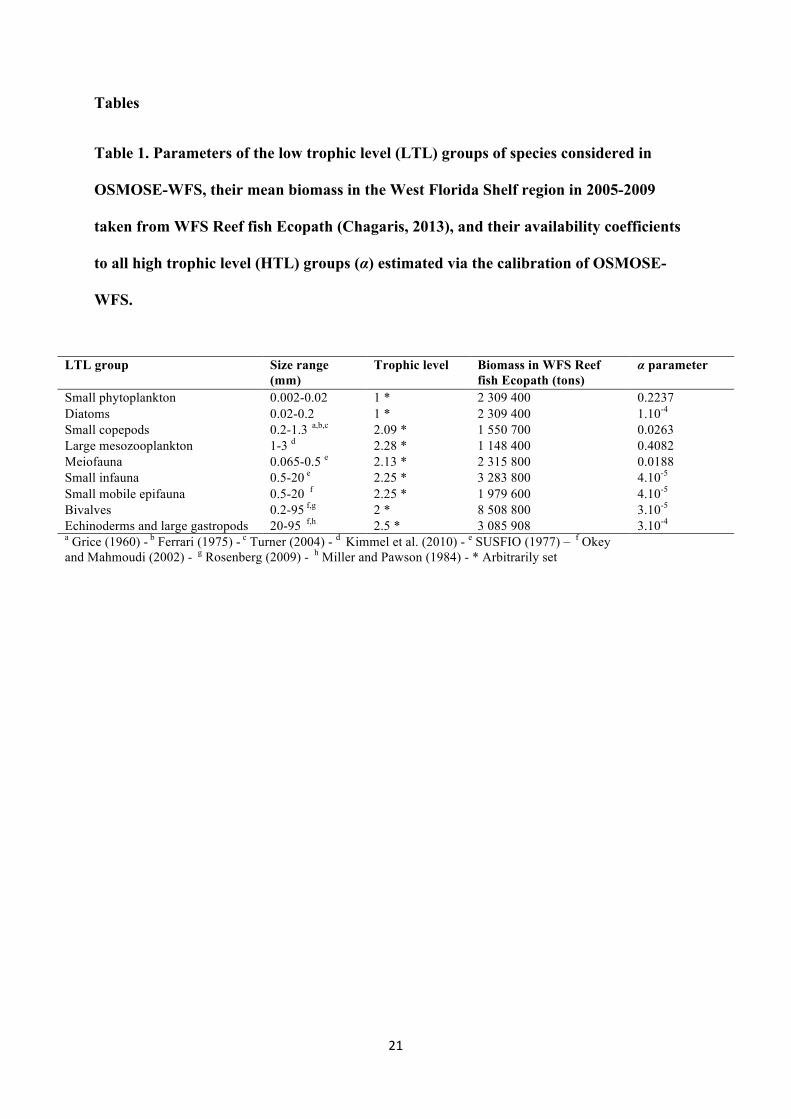
The availability coefficients of LTL groups to all HTL groups (α parameters)
estimated by the EA can be divided into three categories. Small phytoplankton and large
mesozooplankton constitute the first category and are characterized by a high α (Table 1). The
second category includes small copepods and meiofauna, whose α is low. Finally, the third
category consists of diatoms, small infauna, small mobile epifauna, bivalves and
echinoderms/large gastropods, whose α is very low.
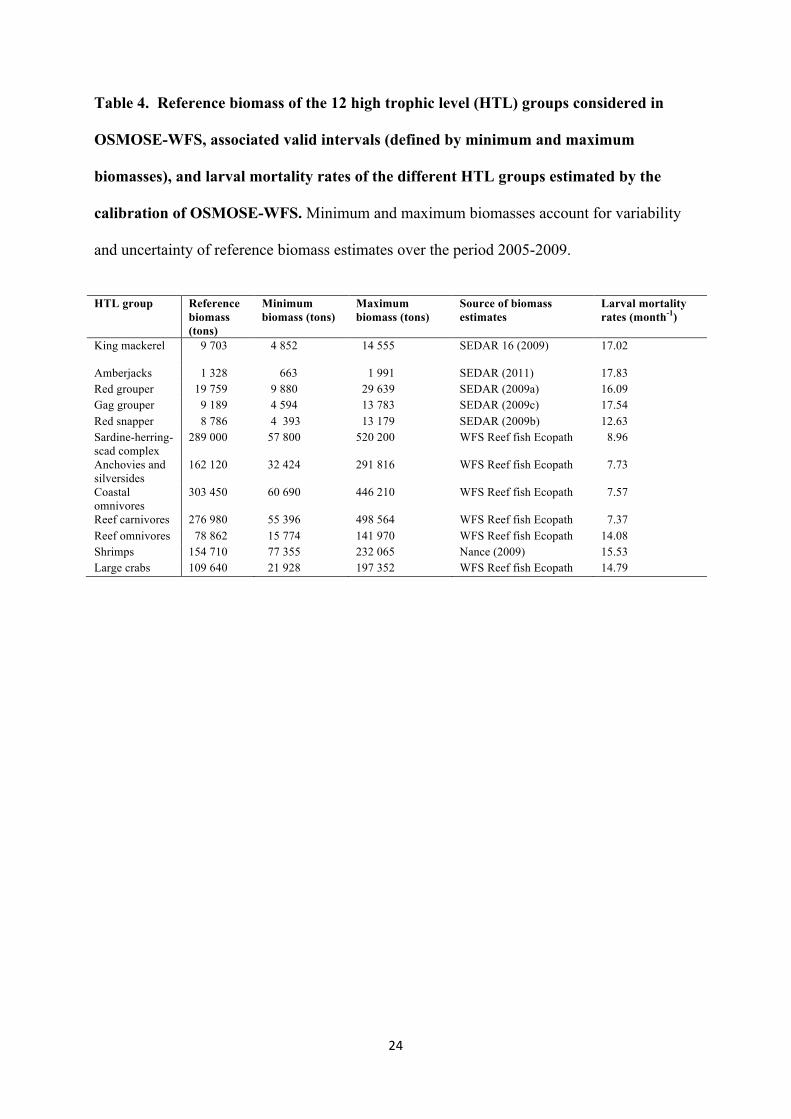
We can distinguish between two categories of monthly larval mortality rates (i.e.,
Mdiverse0 parameters for the first eggs-larvae stage; Table 4). The first category includes king
mackerel, amberjacks, red grouper, gag grouper, red snapper, reef omnivores, shrimps and
large crabs, which have a very high Mdiverse0 (> 12 month-1). The sardine-herring-scad
complex, anchovies/silversides, coastal omnivores and reef carnivores make up the second
category and are characterized by a relatively low Mdiverse0 (< 9 month-1).
Validation of OSMOSE-WFS
The new calibrated OSMOSE-WFS model provided in output the diet composition of
18 HTL groups and stanzas for the period 2005-2009. As was the case in Grüss et al. (2015),
OSMOSE-WFS and observations partially agree as to the species composition of the diet of
HTL groups and stanzas, and fully as to the body size and ecological niche of prey of the
different HTL groups (Results not shown here).
10
The mean TLs of HTL groups predicted by the new version of OSMOSE-WFS are
close to those predicted by WFS Reef fish Ecopath. However, mean TLs in OSMOSE-WFS
are usually higher than those in WFS Reef fish Ecopath (Fig. 5). This is especially the case for
those species groups that belong to the base of the food web, i.e., the sardine-herring-scad
complex, anchovies/silversides, coastal omnivores, reef omnivores and shrimps. On the other
hand, the ranks of the TL values in OSMOSE-WFS are akin to those in WFS Reef fish
Ecopath: king mackerel, amberjacks, red grouper, gag grouper and red snapper have the
highest TLs, followed by reef carnivores and large crabs, and then by the sardine-herring-scad
complex, anchovies/silversides, coastal omnivores, reef omnivores and shrimps (Fig. 5). In
OSMOSE-WFS, the biomass of all HTL groups but shrimps distributes across a large range
of TLs (Fig. 5).
Evaluation of natural mortality rates for GOM red grouper
The annual natural mortality rate M of GOM red grouper provided in output of
OSMOSE-WFS decreases exponentially with age, as is the case for that estimated using
Lorenzen (2005)‘s approach (Figs. 6a and b and Table 5). However, the M-at-age curve
predicted by OSMOSE-WFS differs markedly from that produced for SEDAR 42. The M’s
estimated by OSMOSE-WFS are significantly higher than those constructed for SEDAR 42
for 0 to 5 years old red grouper, especially for 0-1 year old red grouper (1.73±0.38 year-1 in
OSMOSE-WFS vs. 0.58 year-1 with Lorenzen’s approach; Fig. 6a). On the other hand, the
M’s of 5+ years old red grouper are higher in Lorenzen’s model than in OSMOSE-WFS (Fig.
6b). In OSMOSE-WFS, predation mortality (Mpredation) dominates other sources of natural
mortality (Mothers) for 0-4 year old red grouper, whereas the opposite occurs for 4+ years old
red grouper (Figs. 6c and d). The Mpredation of red grouper decreases exponentially with age
11
(Fig. 6c). The Mpredation of 0-1 year old red grouper (excluding individuals less than one month
old) is extremely high (1.63±0.36 year-1), while the Mpredation of 7+ years old red grouper is
extremely low (≤ 0.01 year-1 on average). The Mothers of red grouper increases from 0.10±0.02
year-1 to 0.20±0.03 year-1 from age 0 to age 2, and then decreases exponentially with age (Fig.
6d).
The M of younger juvenile red grouper (i.e., 0-1 year old individuals in Fig. 6) is very
high in both WFS Reef fish Ecopath and OSMOSE-WFS (2 year-1 and 1.73±0.38 year-1,
respectively; Fig. 7a). The total natural mortality of younger juvenile red grouper essentially
results from predation in OSMOSE-WFS vs. ‘unexplained’ causes in WFS Reef fish Ecopath
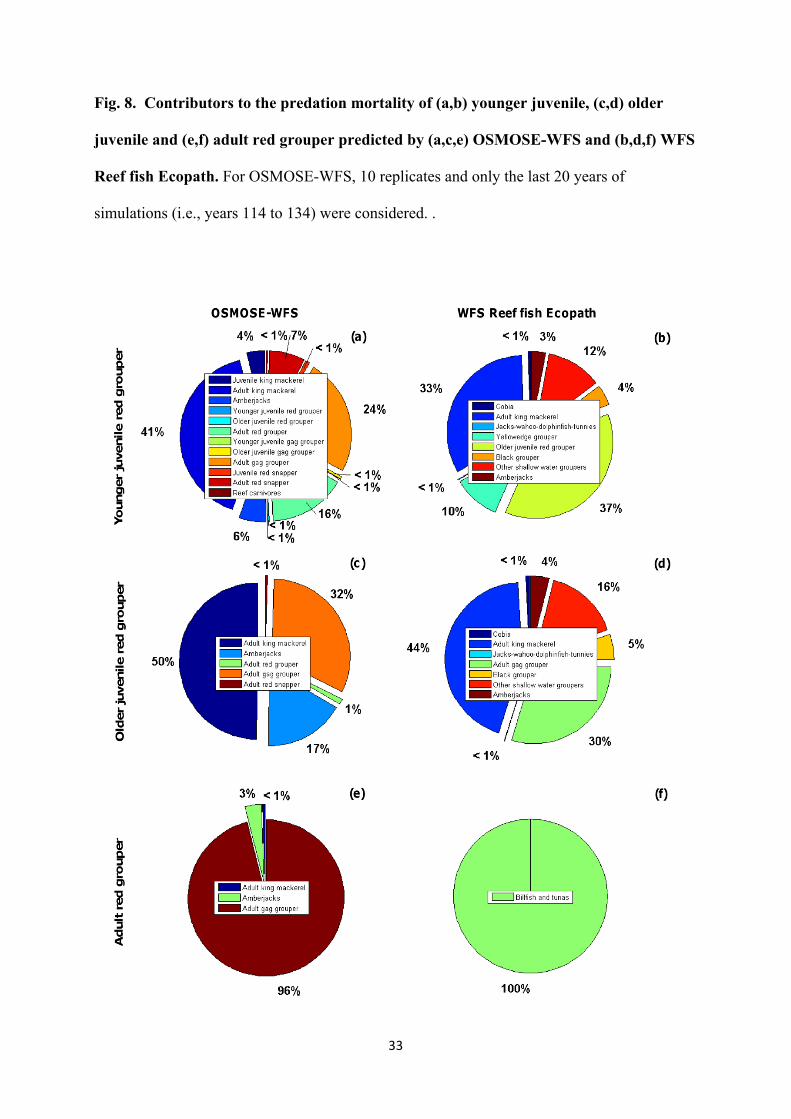
(Fig. 6a). The main predators of younger juvenile red grouper in OSMOSE-WFS are, in order
of importance: adult king mackerel (responsible for 41% of the predation mortality of younger
juvenile red grouper), adult gag grouper (24%), adult red grouper (16%), adult red snapper
(7%) and amberjacks (6%) (Fig. 8a). In WFS Reef fish Ecopath, older juvenile red grouper,
adult king mackerel and amberjacks are responsible for, respectively, 37%, 33% and 3% of
the total predation mortality of younger juvenile red grouper (Fig. 8b). 27% of the total
predation mortality of younger juvenile red grouper in WFS Reef fish Ecopath is caused by
HTL groups that are not represented in OSMOSE-WFS, of which mainly ‘other shallow water
groupers’ (Epinephelus sp. and Mycteroperca sp.) and yellowedge grouper (Epinephelus
flavolimbatus).
The M of older juvenile red grouper is high in both OSMOSE-WFS and WFS Reef
fish Ecopath (0.74 ± 0.20 year-1 and 0.77 year-1, respectively; Fig. 7b). This mortality rate
results mainly from predation in OSMOSE-WFS vs. ‘unexplained’ causes in WFS Reef fish
Ecopath (Fig. 7b). In both models, major predators of older juvenile red grouper include adult
king mackerel (responsible for 50% of the total predation mortality of the stanza in
OSMOSE-WFS and 44% in WFS Reef fish Ecopath) and adult gag grouper (32% in

12
OSMOSE-WFS and 30% in WFS Reef fish Ecopath) (Figs. 8c and d). Another major predator
of older juvenile red grouper in OSMOSE-WFS is the amberjacks’ group (responsible for
17% of the total predation mortality of the stanza; Fig. 8c). 22% of the total predation
mortality of older juvenile red grouper in WFS Reef fish Ecopath is caused by HTL groups
that are not represented in OSMOSE-WFS, of which mainly ‘other shallow water groupers’
and black grouper (Mycteroperca bonaci) (Fig. 8d).
The M of adult red grouper is relatively low and almost entirely due to causes other
than predation in both OSMOSE-WFS and WFS Reef fish Ecopath (0.10 ± 0.02 year-1 and
0.14 year-1, respectively; Fig. 7c). In OSMOSE-WFS, the M of adult red grouper is mainly
due to starvation plus Mothers due to organisms and events (e.g., red tide events) not
represented in OSMOSE-WFS. In WFS Reef fish Ecopath, adult red grouper is preyed upon
by the billfish and tunas’ group only, and its predation mortality rate is negligible compared to
its mortality rate due to ‘unexplained’ causes (Fig. 7c and 8f). The Mothers of adult red grouper
in OSMOSE-WFS was estimated from the predation mortality rate due to those animals
which are modelled in WFS Reef fish Ecopath but not in OSMOSE-WFS. Therefore, the bulk
of the M of red grouper in OSMOSE-WFS is caused by starvation. Only three HTL groups
and stanzas feed on adult red grouper in this model: adult gag grouper, amberjacks and adult
king mackerel, which contribute, respectively, to 96%, 3% and less than 1% of the total
predation mortality of the stanza (Fig. 8e).
Discussion
Calibration and validation of OSMOSE-WFS
While making sure that the mean biomasses predicted by OSMOSE-WFS at steady-
state are on average within valid intervals, the recalibration of OSMOSE-WFS allowed a re-

13
estimation of unknown parameters, i.e., the availability coefficients of LTL groups to all HTL
groups and the mortality rates of eggs and larvae of HTL groups ( ‘larval mortality rates’).
The availability coefficients of LTL groups are all estimated to be low except for small
phytoplankton and large mesozooplankton. These parameters account for a lot of processes
not explicitly represented in OSMOSE-WFS, including, inter alia, micro- and meso-scale
turbulence, diel migration and avoidance of predators, which are all highly difficult to
quantify (Travers-Trolet et al., 2014). However, the low value estimated for most of these
parameters may also reflect an overestimation of the LTL biomasses input in OSMOSE-WFS
(Marzloff et al., 2009). The larval mortality rates estimated during calibration are generally
very high, except those of the sardine-herring-scad complex, anchovies/silversides, coastal
omnivores and reef carnivores. Larval mortality rates also depend on numerous processes not
considered in OSMOSE-WFS (e.g., non-fertilization of eggs, sinking, advection away from
suitable habitat), which are all hard to quantify. The lowest larval mortality rates estimated
during calibration may merely reflect the fact that most of the mortality of the sardine-
herring-scad complex, anchovies/silversides, coastal omnivores and reef carnivores is
accounted for explicitly in OSMOSE-WFS (Travers-Trolet et al., 2014).
Updating an OSMOSE model entails its recalibration, but also its validation in its new
configuration. As in Grüss et al. (2014, 2015), OSMOSE-WFS's output were confronted to
observed diet data, and to TLs from the WFS Reef fish Ecopath model. With regards to diet
compositions, OSMOSE-WFS is in full agreement with observations as to the body size and
ecological niche of prey of the different HTL groups represented in the model. Nonetheless,
OSMOSE-WFS and observations partially agree as to the species composition of the diet of
HTL groups and stanzas, as was the case in Grüss et al. (2015). This should not necessarily be
viewed as a flaw of OSMOSE-WFS since empirical diet studies have many sources of
uncertainty, including the small number of stomach contents sampled, with generally very
14
limited spatio-temporal coverage, and the frequent presence of unidentifiable and inseparable
partially digested material in the stomachs analyzed (Scharf et al., 1997; McQueen and
Griffiths, 2004; Baker et al., 2014; J. Simons, Center for Coastal Studies, Texas A&M
University-Corpus Christi, pers. comm.). In this context, well-calibrated OSMOSE models
offer a means to complement or question our knowledge of the diet composition of life stages
of species and functional groups due to: (1) their ability to provide millions of stomachs for
diet analyses, over broad spatial and temporal scales, and under different ecological,
environmental and exploitation scenarios; and (2) their fundamental structure and
assumptions, i.e., size-based and opportunistic predation and the representation of whole life
cycles; these features of OSMOSE allow the simulation of patterns observed in the real world,
including: (i) the possibility for species to be simultaneously predators and prey of one
another, cultivation/depensation effects and cannibalism (e.g., Alheit, 1987; Valdés et al.,
1987; Walters and Kitchell, 2001); and (ii) variations of predation and competition
interactions between species according to their relative abundances (e.g., Crawford, 1987;
Bax, 1998).
With regards to TLs, OSMOSE-WFS and WFS Reef fish Ecopath are globally in
agreement, though mean TLs are usually higher in the former model than in the latter. This is
probably due to the representation of a smaller number of functional (HTL and LTL) groups
in OSMOSE-WFS (21 vs. 70 in WFS Reef fish Ecopath), and, especially, of a smaller number
of functional groups belonging to the base of the West Florida Shelf food web (i.e., species
groups with a small TL, and LTL groups). In OSMOSE-WFS, the broad distribution of the
TLs of all HTL groups but shrimps reflects their opportunism and a high level of omnivory.
The high level of omnivory of the species of the snapper-grouper complex is mainly due to
ontogenetic changes in their feeding behaviour (Results not shown here).

15
Natural mortality rates of GOM red grouper
The total annual natural mortality rate M of GOM red grouper decreases exponentially
with age both in OSMOSE-WFS and in the empirical model based on Lorenzen (2005)’s
approach that is used to inform SEDAR 42. However, juveniles of red grouper are subject to a
considerably higher total natural mortality in OSMOSE-WFS, due to (1) the simulation of
predation events in OSMOSE-WFS; and (2) the use of a target M at maximum age equal to
0.14 year-1 in the empirical model. Differences in total natural mortality between OSMOSE-
WFS and the empirical model are striking for 0-1 year old individuals, whose mean M is
equal to 1.73 year-1 in OSMOSE-WFS due to predation by a diversity of large and small
predators (Fig. 8a). Adults of red grouper older than 5 years undergo higher total natural
mortality in the empirical model than in OSMOSE-WFS, essentially because of the use of a
target M at maximum age in the Lorenzen (2005)‘s approach. Red grouper which are 5 years
old or older are subject to extremely low predation pressure in OSMOSE-WFS, and their low
M is mostly due to starvation events. Discussing the use of OSMOSE-WFS M estimates in
SEDAR 42 is beyond the scope of the present study. Nevertheless, it is likely that employing
the very high M estimate of 0-1 year old red grouper predicted by OSMOSE-WFS in SEDAR
42 may complicate the calibration of the red grouper assessment model.
OSMOSE-WFS and WFS Reef fish Ecopath agree on the magnitude of the
instantaneous total natural mortality rate M of the younger juveniles and older juveniles of red
grouper, but not on the main causes of this mortality. In both models, the annual natural
mortality M is very high for younger juvenile red grouper, and high for older juvenile red
grouper. However, the bulk of the M of red grouper juveniles is due to explicit predation in
OSMOSE-WFS, while it is due to ‘unexplained causes’ in WFS Reef fish Ecopath.
Differences between the two models are due to the fact that predation mortality is conditioned
by a diet matrix in Ecopath, whereas food web structure emerges from local predation and

16
competition interactions in OSMOSE (Shin et al., 2004; Travers et al., 2010; Travers-Trolet et
al., 2014; Grüss et al., 2015). Due to their relatively small body size, juvenile life stages of red
grouper are potential prey of different stanzas of a diversity of small and large predators in
OSMOSE-WFS (Figs. 8a and c).
By contrast, both OSMOSE-WFS and WFS Reef fish Ecopath indicate that the M of
adult red grouper is relatively low and that the bulk of this M is due to causes other than
explicit predation: (i) starvation in the former model; and (ii) ‘unexplained’ causes in the
latter, which could include predator-prey interactions not considered in WFS Reef fish
Ecopath. In OSMOSE-WFS, the predation mortality of adult red grouper is due to adult gag
grouper and, to a much lesser extent, to amberjacks and adult king mackerel. In WFS Reef
fish Ecopath, only the billfish and tunas’ group feeds upon adult red grouper; this relates to
the fact that it is possible to collect only a limited number of stomachs of large offshore
predators on the West Florida Shelf (Chagaris, 2013; Chagaris and Mahmoudi, 2013). Results
concerning the predation mortality of adult red grouper are similar to those obtained for adult
gag grouper in Grüss et al. (2015). These, and other similarities between red grouper and gag
grouper noted above, support the groupings of the two species into common ‘shallow-water
grouper’ and ‘snapper-grouper’ complexes (Farmer et al., in revision).
In July 2014, the West Florida Shelf experienced severe red tides, which resulted in
the death of a large and uncertain number of numerous fish species, including red grouper and
gag grouper (http://myfwc.com/research/redtide). These events led the GOM Fishery
Management Council’s Standing and Ecosystem SSCs to postpone recommendations of
acceptable biological catch for GOM gag grouper and to request additional analyses from
NOAA to model the potential impact of the red tide event on future projections (S. Atran,
GOM Fishery Management Council, Tampa, Florida, pers. comm.). The ‘unexplained causes’
of natural mortality for adult gag grouper and red grouper in WFS Reef fish Ecopath are

17
likely to be red tide events mainly (Gray, 2014). The majority of the natural mortality of adult
gag grouper due to causes other than predation in OSMOSE-WFS is currently due to
starvation events. The explicit representation of the impacts of red tide events on the natural
mortality of red grouper, gag grouper and other pertinent HTL groups in OSMOSE-WFS may
provide a more accurate description of the natural mortalities in the model, and would help
NOAA to inform the GOM Fishery Management Council’s Standing and Ecosystem SSCs.
Perspectives
The OSMOSE-WFS model considered in the present study will benefit from a number
of improvements. In the current version of OSMOSE-WFS, an annual fishing mortality rate
and a seasonality of this annual fishing mortality rate are defined for each HTL group. In the
GOM, species of the grouper-snapper complex are managed through annual catch limits
determined using specific harvest control rules. OSMOSE-WFS is currently being coupled to
a management model implementing harvest control rules for species of the snapper-grouper
complex. These ongoing efforts will give us the opportunity to evaluate the impacts of
managing the snapper-grouper complex as a whole rather than species of the complex
individually to inform the GOM Fishery Management Council.
As highlighted earlier, red tides are a growing concern in the GOM. For this reason,
we are planning, in the near future, to explicitly represent the impacts of red tide events on the
natural mortality of species of the snapper-grouper complex and other HTL groups in
OSMOSE-WFS. Such an endeavor will allow us to provide information to the GOM Fishery
Management Council about the performance of harvest control rules implemented for species
of the snapper-grouper complex or the complex as a whole in the face of episodic
environmental events leading to massive natural mortality.

18
Acknowledgments
We are grateful to Nick Farmer, Steven Atran, Monique Simier, Denis Croizé-Fillon, Michael
Drexler, James Simons, Behzad Mahmoudi and Ricardo Oliveros-Ramos for their help and/or
advice at different levels of this study.
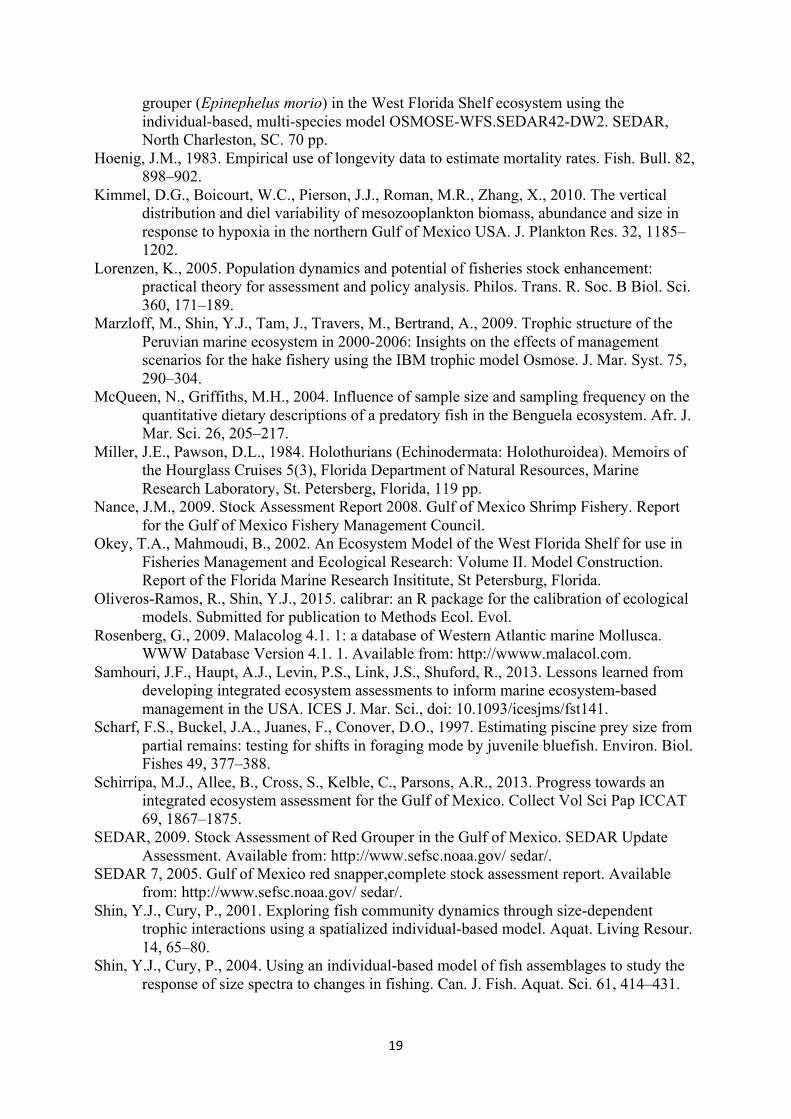
References
Alheit, J., 1987. Egg cannibalism versus egg predation: their significance in anchovies. South Afr. J. Mar. Sci. 5, 467–470.
Baker, R., Buckland, A., Sheaves, M., 2014. Fish gut content analysis: robust measures of diet composition. Fish Fish. 15, 170–177.
Bax, N.J., 1998. The significance and prediction of predation in marine fisheries. ICES J. Mar. Sci. J. Cons. 55, 997–1030.
Chagaris, D., Mahmoudi, B., 2013. Natural mortality of gag grouper from 1950 to 2009 generated by an Ecosim model. SEDAR 33-DW07. SEDAR, North Charleston, SC. 23 pp.
Chagaris, D.M., 2013. Ecosystem-based evaluation of fishery policies and tradeoffs on the West Florida Shelf. PhD thesis, University of Florida, Gainesville, Florida.
Christensen, V., Walters, C.J., 2004. Ecopath with Ecosim: methods, capabilities and limitations. Ecol. Model. 172, 109–139.
Christensen, V., Walters, C.J., Pauly, D., Forrest, R., 2008. Ecopath with Ecosim version 6 user guide. Fisheries Centre, University of British Columbia, Vancouver, BC, Canada.
Crawford, R.J.M., 1987. Food and population variability in five regions supporting large stocks of anchovy, sardine and horse mackerel. South Afr. J. Mar. Sci. 5, 735–757.
Farmer, N.A., Malinowski, R.P., McGovern, M.F., Rubec, P.J. Fisheries stock complexes in the Gulf of Mexico. Sumitted for publication to Mar. Coast. Fish., in review.
Ferrari, F.D., 1975. Taxonomic notes of the genus Oncaea (Copepoda: Cyclopoida) from the Gulf of Mexico and northern Caribbean Sea. Proc. Biol. Soc. Wash. 88, 217–232.
Gray, A., 2014. Karenia brevis harmful algal blooms: Their role in structuring the organismal community on the West Florida Shelf. M.S. thesis. University of South Florida. 76 pp.
Gray, A., Ainsworth, C., Chagaris, D., Mahmoudi, B., 2013. Red tide mortality on gag grouper 1980-2009. SEDAR 33-AW21. SEDAR, North Charleston, SC. 6 pp.
Grice, G.D., 1960. Copepods of the genus Oithona from the Gulf of Mexico. Bull. Mar. Sci. 10, 485–490.
Grüss, A., Schirripa, M.J., Chagaris, D., Drexler, M., Simons, J., Verley, P., Shin, Y.-J., Karnauskas, M., Oliveros-Ramos, R., Ainsworth, C.H., 2015. Evaluation of the trophic structure of the West Florida Shelf in the 2000s using the ecosystem model OSMOSE. J. Mar. Syst. 144, 30–47.
Grüss, A., Schirripa, M.J., Chagaris, D., Verley, P., Shin, Y.J., Velez, L., Ainsworth, C.H., Sagarese, S.R., Karnauskas, M., 2014. Evaluation of the natural mortality rates of red
19
grouper (Epinephelus morio) in the West Florida Shelf ecosystem using the individual-based, multi-species model OSMOSE-WFS.SEDAR42-DW2. SEDAR, North Charleston, SC. 70 pp.
Hoenig, J.M., 1983. Empirical use of longevity data to estimate mortality rates. Fish. Bull. 82, 898–902.
Kimmel, D.G., Boicourt, W.C., Pierson, J.J., Roman, M.R., Zhang, X., 2010. The vertical distribution and diel variability of mesozooplankton biomass, abundance and size in response to hypoxia in the northern Gulf of Mexico USA. J. Plankton Res. 32, 1185–1202.
Lorenzen, K., 2005. Population dynamics and potential of fisheries stock enhancement: practical theory for assessment and policy analysis. Philos. Trans. R. Soc. B Biol. Sci. 360, 171–189.
Marzloff, M., Shin, Y.J., Tam, J., Travers, M., Bertrand, A., 2009. Trophic structure of the Peruvian marine ecosystem in 2000-2006: Insights on the effects of management scenarios for the hake fishery using the IBM trophic model Osmose. J. Mar. Syst. 75, 290–304.
McQueen, N., Griffiths, M.H., 2004. Influence of sample size and sampling frequency on the quantitative dietary descriptions of a predatory fish in the Benguela ecosystem. Afr. J. Mar. Sci. 26, 205–217.
Miller, J.E., Pawson, D.L., 1984. Holothurians (Echinodermata: Holothuroidea). Memoirs of the Hourglass Cruises 5(3), Florida Department of Natural Resources, Marine Research Laboratory, St. Petersberg, Florida, 119 pp.
Nance, J.M., 2009. Stock Assessment Report 2008. Gulf of Mexico Shrimp Fishery. Report for the Gulf of Mexico Fishery Management Council.
Okey, T.A., Mahmoudi, B., 2002. An Ecosystem Model of the West Florida Shelf for use in Fisheries Management and Ecological Research: Volume II. Model Construction. Report of the Florida Marine Research Insititute, St Petersburg, Florida.
Oliveros-Ramos, R., Shin, Y.J., 2015. calibrar: an R package for the calibration of ecological models. Submitted for publication to Methods Ecol. Evol.
Rosenberg, G., 2009. Malacolog 4.1. 1: a database of Western Atlantic marine Mollusca. WWW Database Version 4.1. 1. Available from: http://wwww.malacol.com.
Samhouri, J.F., Haupt, A.J., Levin, P.S., Link, J.S., Shuford, R., 2013. Lessons learned from developing integrated ecosystem assessments to inform marine ecosystem-based management in the USA. ICES J. Mar. Sci., doi: 10.1093/icesjms/fst141.
Scharf, F.S., Buckel, J.A., Juanes, F., Conover, D.O., 1997. Estimating piscine prey size from partial remains: testing for shifts in foraging mode by juvenile bluefish. Environ. Biol. Fishes 49, 377–388.
Schirripa, M.J., Allee, B., Cross, S., Kelble, C., Parsons, A.R., 2013. Progress towards an integrated ecosystem assessment for the Gulf of Mexico. Collect Vol Sci Pap ICCAT 69, 1867–1875.
SEDAR, 2009. Stock Assessment of Red Grouper in the Gulf of Mexico. SEDAR Update Assessment. Available from: http://www.sefsc.noaa.gov/ sedar/.
SEDAR 7, 2005. Gulf of Mexico red snapper,complete stock assessment report. Available from: http://www.sefsc.noaa.gov/ sedar/.
Shin, Y.J., Cury, P., 2001. Exploring fish community dynamics through size-dependent trophic interactions using a spatialized individual-based model. Aquat. Living Resour. 14, 65–80.
Shin, Y.J., Cury, P., 2004. Using an individual-based model of fish assemblages to study the response of size spectra to changes in fishing. Can. J. Fish. Aquat. Sci. 61, 414–431.

20
Shin, Y.J., Shannon, L.J., Cury, P.M., 2004. Simulations of fishing effects on the southern Benguela fish community using an individual-based model: learning from a comparison with Ecosim. Afr. J. Mar. Sci. 26, 95–114.
SUSFIO, 1977. Baseline monitoring studies, Mississippi, Alabama, Florida, outer continental shelf, 1975-1976. Volume III. Results. State University System of Florida Institution of Oceanography, St. Petersburg. Prepared for the Bureau of Land Management, Washington, DC, 28 June 1977.
Travers, M., Watermeyer, K., Shannon, L.J., Shin, Y.J., 2010. Changes in food web structure under scenarios of overfishing in the southern Benguela: Comparison of the Ecosim and OSMOSE modelling approaches. J. Mar. Syst. 79, 101–111.
Travers-Trolet, M., Shin, Y.J., Field, J.G., 2014. An end-to-end coupled model ROMS-N2P2Z2D2-OSMOSE of the southern Benguela foodweb: parameterisation, calibration and pattern-oriented validation. Afr. J. Mar. Sci. 36, 11–29.
Turner, J.T., 2004. The importance of small planktonic copepods and their roles in pelagic marine food webs. Zool Stud 43, 255–266.
Valdés, E.S., Shelton, P.A., Armstrong, M.J., Field, J.G., 1987. Cannibalism in South African anchovy: egg mortality and egg consumption rates. South Afr. J. Mar. Sci. 5, 613–622.
Walters, C., Christensen, V., Pauly, D., 1997. Structuring dynamic models of exploited ecosystems from trophic mass-balance assessments. Rev. Fish Biol. Fish. 7, 139–172.
Walters, C., Kitchell, J.F., 2001. Cultivation/depensation effects on juvenile survival and recruitment: implications for the theory of fishing. Can. J. Fish. Aquat. Sci. 58, 39–50.
21
Tables
Table 1. Parameters of the low trophic level (LTL) groups of species considered in
OSMOSE-WFS, their mean biomass in the West Florida Shelf region in 2005-2009
taken from WFS Reef fish Ecopath (Chagaris, 2013), and their availability coefficients
to all high trophic level (HTL) groups (α) estimated via the calibration of OSMOSE-
WFS.
LTL group Size range (mm)
Trophic level Biomass in WFS Reef fish Ecopath (tons)
α parameter
Small phytoplankton 0.002-0.02 1 * 2 309 400 0.2237 Diatoms 0.02-0.2 1 * 2 309 400 1.10-4 Small copepods 0.2-1.3 a,b,c 2.09 * 1 550 700 0.0263 Large mesozooplankton 1-3 d 2.28 * 1 148 400 0.4082 Meiofauna 0.065-0.5 e 2.13 * 2 315 800 0.0188 Small infauna 0.5-20 e 2.25 * 3 283 800 4.10-5 Small mobile epifauna 0.5-20 f 2.25 * 1 979 600 4.10-5 Bivalves 0.2-95 f,g 2 * 8 508 800 3.10-5 Echinoderms and large gastropods 20-95 f,h 2.5 * 3 085 908 3.10-4 a Grice (1960) - b Ferrari (1975) - c Turner (2004) - d Kimmel et al. (2010) - e SUSFIO (1977) – f Okey and Mahmoudi (2002) - g Rosenberg (2009) - h Miller and Pawson (1984) - * Arbitrarily set

22
Table 2. High trophic level (HTL) groups explicitly considered in OSMOSE-WFS.
Species of a given HTL group exhibit similar life history traits, body size ranges, diets and
exploitation patterns. Some individual species constitute their own group, as they are
emblematic to the West Florida Shelf and of high economic importance. A reference species
was identified for each of the HTL groups (indicated in bold). Growth, reproduction,
mortality and diet parameters of each group are those of the reference species of the group.
HTL group Species King mackerel King mackerel (Scomberomorus cavalla) Amberjacks Greater amberjack (Seriola dumerili) , banded rudderfish (Seriola zonata), lesser
amberjack (Seriola fasciata) Red grouper Red grouper (Epinephelus morio) Gag grouper Gag grouper (Mycteroperca microlepis) Red snapper Red snapper (Lutjanus campechanus) Sardine-herring-scad complex Scaled sardine (Harengula jaguana), Spanish sardine (Sardinella aurita), Atlantic
thread herring (Opisthonema oglinum), round scad (Decapterus punctatus) Anchovies and silversides Bay anchovy (Anchoa mitchilli), striped anchovy (Anchoa hepsetus), silversides
(Atherinidae spp.), alewife (Alosa sp.) Coastal omnivores Pinfish (Lagodon rhomboides), spottail pinfish (Diplodus holbrooki), orange filefish
(Aluterus schoepfii), fringed filefish (Monacanthus ciliatus), planehead filefish (Monacanthus hispidus), orangespotted filefish (Cantherhines pullus), honeycomb filefish (Acanthostracion polygonius), Atlantic spadefish (Chaetodipterus faber), scrawled cowfish (Lactophrys quadricornis), pufferfish (Tetraodontidae spp.)
Reef carnivores White grunt (Haemulon plumieri), black sea bass (Centropristis striata), rock sea bass (Centropristis philadelphica), belted sandfish (Serranus subligarius), longtail bass (Hemanthias leptus), butter hamlet (Hypoplectus unicolor), creole fish (Paranthias furcifer), splippery dick (Halichoeres bivittatus), painted wrasse (Halichoeres caudalis), yellowhead wrasse (Halichoeres garnoti), bluehead (Thalassoma bifasciatum), reef croaker (Odontoscion dentex), jackknife-fish (Equetus lanceatus), leopard toadfish (Opsanus pardus), scopian fish (Scorpaenidae spp.), bigeyes (Priacanthidae spp.), littlehead porgy (Calamus proridens), jolthead porgy (Calamus bajonado), saucereye progy (Calamus calamus), whitebone progy (Calamus leucosteus), knobbed progy (Calamus nodosus), French grunt (Haemulon flavolineatum), Spanish grunt (Haemulon macrostomum), margate (Haemulon album), bluestriped grunt (Haemulon sciurus), striped grunt (Haemulon striatum), sailor’s grunt (Haemulon parra), porkfish (Anisotremus virginicus), neon goby (Gobiosoma oceanops)
Reef omnivores Doctorfish (Acanthurus chirurgus), other surgeons (Acanthuridae spp.), blue angelfish (Holacanthus bermudensis), gray angelfish (Pomacanthus arcuatus), cherubfish (Cantropyge argi), rock beauty (Holacanthus tricolor), cocoa damselfish (Pomacentrus variabilis), bicolor damselfish (Pomacentrus partitus), beau gregory (Pomacentrus leocostictus), yellowtail damselfish (Microspathodon chrysurus), seaweed blenny (Parablennius marmoreus), striped parrotfish (Scarus croicensis), bibled goby (Coryphopterus glaucofraenum), Bermuda chub (Kyphossus sectarix)
Shrimps Pink shrimp (Farfantepenaeus duorarum), brown shrimp (Farfantepenaeus aztecus), white shrimp (Litopenaeus setiferus), other shrimp species
Large crabs Blue crab (Callinectes sapidus), stone crabs (Menippe mercenaria and Menippe adina), horseshoe crab (Limulus polyphemus), hermits crab (e.g., Pylopagurus operculatus and Clibanaris vittatus), spider crabs (e.g., Stenocionops furcatus), arrow crabs (e.g., Stenorynchus seticornis)

23
Table 3. Feeding size ranges of the high trophic level (HTL) groups explicitly considered
in OSMOSE-WFS expressed as predator/prey size ratios; adapted from Grüss et al.
(2014). Lthres is the body size threshold that separates two sets of predator/prey size ratios for
some HTL groups, one set for the juvenile individuals and one set for adult individuals -
(Lpred/Lprey)min: minimum predator to prey body size ratio - (Lpred/Lprey)max: maximum predator
to prey body size ratio. The values of some of the (Lpred/Lprey)min and (Lpred/Lprey)max reported
here result from adjustments operated during the calibration process of OSMOSE-WFS
(initial values used in Grüss et al. (2014) are indicated in parentheses).
Lthres (cm TL)
(Lpred/Lprey)min
(Lpred/Lprey)max
Juveniles Adults Juveniles Adults King mackerel 73.4 5 5 (6.5) 5 (6.5) 8 (11) 9 (11) Amberjacks 90.3 4.5 (6.5) 4.5 (6.5) 8 (12) 8 (12) Red grouper 34.1 6.5 6.5 40 (30) 30 Gag grouper 46.8 4 (5.5) 4 (5.5) 18 (23) 16 (23) Red snapper 34.6 3.5 6.5 (9) 28 (30) 21 (30) Sardine-herring-scad complex 9.3 20 (10) 100 200 (150) 10000 Anchovies and silversides 4.6 20 20 300 (500) 300 (500) Coastal omnivores 15.3 20 (50) 20 (50) 50 (80) 50 (80) Reef carnivores 17.4 5.5 (4.5) 5.5 (4.5) 30 (50) 30 (50) Reef omnivores 15.5 100 100 300 (1000) 300 (1000) Shrimps 8 4.5 4.5 (7.5) 10000 100 (242) Large crabs 13.1 9 (1.1) 9 (1.1) 60 (50) 60 (50)
24
Table 4. Reference biomass of the 12 high trophic level (HTL) groups considered in
OSMOSE-WFS, associated valid intervals (defined by minimum and maximum
biomasses), and larval mortality rates of the different HTL groups estimated by the
calibration of OSMOSE-WFS. Minimum and maximum biomasses account for variability
and uncertainty of reference biomass estimates over the period 2005-2009.
HTL group Reference biomass (tons)
Minimum biomass (tons)
Maximum biomass (tons)
Source of biomass estimates
Larval mortality rates (month-1)
King mackerel 9 703 4 852
14 555 SEDAR 16 (2009) 17.02
Amberjacks 1 328 663 1 991 SEDAR (2011) 17.83 Red grouper 19 759 9 880 29 639 SEDAR (2009a) 16.09 Gag grouper 9 189 4 594 13 783 SEDAR (2009c) 17.54 Red snapper 8 786 4 393 13 179 SEDAR (2009b) 12.63 Sardine-herring-scad complex
289 000 57 800 520 200 WFS Reef fish Ecopath 8.96
Anchovies and silversides
162 120 32 424 291 816 WFS Reef fish Ecopath 7.73
Coastal omnivores
303 450 60 690 446 210 WFS Reef fish Ecopath 7.57
Reef carnivores 276 980 55 396 498 564 WFS Reef fish Ecopath 7.37 Reef omnivores 78 862 15 774 141 970 WFS Reef fish Ecopath 14.08 Shrimps 154 710 77 355 232 065 Nance (2009) 15.53 Large crabs 109 640 21 928 197 352 WFS Reef fish Ecopath 14.79

25
Table 5. Total annual mortality rate (M) of different age classes of red grouper predicted
by OSMOSE-WFS. Note that 0-1 year old individuals exclude 0-1 month individuals, which
belong to the ichthyoplankton. 10 replicates and only the last 20 years of simulation (i.e.,
years 115 to 134) were considered to produce the estimates reported here.
Age (years) M (year-1) CV of M 0-1 1.73 0.22 1-2 1.10 0.01 2-3 0.62 0.28 3-4 0.55 0.01 4-5 0.27 0.28 5-6 0.20 0.37 6-7 0.17 0.01 7-8 0.10 0.28 8-9 0.08 0.37 9-10 0.08 0.49 10-11 0.06 0.01 11-12 0.06 0.28 12-13 0.06 0.37 13-14 0.05 0.49 14-15 0.05 0.46 15-16 0.05 0.01 16-17 0.04 0.28 17-18 0.04 0.37 18-19 0.04 0.49 19-20 0.04 0.56 20+ 0.03 0.44
26
Figures
Fig. 1. Succession of events within each time step (month) in the OSMOSE-WFS model.
The distribution map used to symbolize the first event (spatial distribution) shows the spatial
domain of OSMOSE-WFS, which is also the spatial domain considered implicitly in the non-
spatial WFS Reef fish Ecopath model (Chagaris, 2013); this spatial domain extends from
approximately 25.2° N to 31°N in latitude and from approximately 80.2°W to 87°W in
longitude and comprises 465 square cells in a grid with closed boundaries.
27
Fig. 2. Monthly maps of total phytoplankton biomass in the West Florida Shelf (in tons),
produced from chlorophyll a SeaWiFS (Sea-viewing Wide Field-of-view Sensor) data
downloaded from http://oceancolor.gsfc.nasa.gov/SeaWiFS/.

28
Fig. 3. Biomasses observed over the period 2005-2009 (gray boxplots) and predicted by
OSMOSE-WFS (black boxplots) for the 12 high trophic level (HTL) groups explicitly
considered in OSMOSE-WFS. Mean observed biomasses (gray dots) are associated with
valid intervals, i.e., minimum and maximum possible values, accounting for variability and
uncertainty of mean biomass estimates over the period 2005-2009. Biomasses simulated with
OSMOSE-WFS correspond to mean biomasses (black dots) +/- standard deviations for 10
replicates after 115 to 134 years of simulation. Note the change of scale of the y-axis between
the left and right panels. (a) km: king mackerel – am: amberjacks – rg: red grouper – gg: gag
grouper – rs: red snapper; (b) shs: sardine-herring-scad complex – as: anchovies and
silversides – co: coastal omnivores – rc: reef carnivores – ro: reef omnivores – shr: shrimps –
lc: large crabs.

29
Fig. 4. Mean trajectories of biomasses in OSMOSE-WFS after 0 to 134 years of
simulation (a) for all HTL groups; and (b) for king mackerel, amberjacks, red grouper,
gag grouper and red snapper. 10 simulation replicates were run to produce these plots.

30
Fig. 5. Mean trophic levels (TLs) predicted by OSMOSE-WFS (black diamonds) and by
WFS Reef fish Ecopath (grey circles). For OSMOSE-WFS, 10 replicates and only the last
20 years of simulations (i.e., years 114 to 134) were considered to estimate TLs. km: king
mackerel – am: amberjacks – rg: red grouper – gg: gag grouper – rs: red snapper - shs:
sardine-herring-scad complex – as: anchovies and silversides – co: coastal omnivores – rc:
reef carnivores – ro: reef omnivores – shr: shrimps – lc: large crabs.

31
Fig. 6. Annual natural mortality rates at age of red grouper predicted by OSMOSE-
WFS. (a) Total natural mortality at age of red grouper predicted by OSMOSE-WFS
compared to that produced for SEDAR 42 using Lorenzen (2005)’s approach. (b) Total
natural mortality at age of red grouper from age 1 predicted by OSMOSE-WFS compared to
that produced for SEDAR 42. (c) Total predation mortality at age of red grouper predicted by
OSMOSE-WFS. (d) Natural mortality at age of red grouper due to causes other than predation
(Mothers) predicted by OSMOSE-WFS. For OSMOSE-WFS, 10 replicates and only the last 20
years of simulations (i.e., years 114 to 134) were considered. Note that age 0 in OSMOSE-
WFS includes all red grouper individuals that are older than 1 month and younger than 1 year;
0-1 month old red groupers belong to the ‘ichthyoplankton’.

32
Fig. 7. Annual natural mortality rates of (a) younger juvenile, (b) older juvenile and (c)
adult red grouper predicted by OSMOSE-WFS (black boxplots) and WFS Reef fish
Ecopath (large gray dots). Mean natural mortality rates predicted by OSMOSE-WFS are
indicated by small black dots. For OSMOSE-WFS, 10 replicates and only the last 20 years of
simulations (i.e., years 114 to 134) were considered. M: total natural mortality rate - Mpredation:
total predation mortality rate - Mothers: natural mortality rate due to all other causes.
33
Fig. 8. Contributors to the predation mortality of (a,b) younger juvenile, (c,d) older
juvenile and (e,f) adult red grouper predicted by (a,c,e) OSMOSE-WFS and (b,d,f) WFS
Reef fish Ecopath. For OSMOSE-WFS, 10 replicates and only the last 20 years of
simulations (i.e., years 114 to 134) were considered. .