Estimating the Specularity Coefficient for the … the Specularity Coefficient for the Accurate...
22
Estimating the Specularity Coefficient for the Accurate Simulation of Fluidized Beds of Different Surface-to-Volume Ratios Akhilesh Bakshi, Christos Altantzis, Richard Bates, Ahmed F. Ghoniem Reacting Gas Dynamics Lab Department of Mechanical Engineering Massachusetts Institute of Technology, USA NETL Workshop on Multiphase Flow Science August 5-6 2014 The authors gratefully acknowledge BP for funding this research
Transcript of Estimating the Specularity Coefficient for the … the Specularity Coefficient for the Accurate...
Estimating the Specularity Coefficient for the Accurate Simulation of Fluidized Beds of
Different Surface-to-Volume Ratios
Akhilesh Bakshi, Christos Altantzis, Richard Bates, Ahmed F. Ghoniem
Reacting Gas Dynamics Lab
Department of Mechanical Engineering
Massachusetts Institute of Technology, USA
NETL Workshop on Multiphase Flow ScienceAugust 5-6 2014
The authors gratefully acknowledge BP for funding this research

NETL Workshop on Multiphase Flow Science, August 5-6 2014 2
Present Study
Objectives
i. To develop suitable metrics for quantifying the mixing of the solid phase
ii. To investigate the impact of wall boundary condition (specularity coefficient) on the
hydrodynamics for fluidized beds of different surface-to-volume ratios
Overall
i. Circulation flux and bubble statistics tools to quantify hydrodynamics and mixing
ii. Wall boundary condition has significant impact on thin rectangular bed and
cylindrical beds (diameters 14.5 and 30 cm)

• Solid and gas phases fully interpenetrating continua using generalized NS equations
• Computationally efficient
• Conservation equations coupled with constitutive relationships
The TFM has been implemented using MFiX (Multiphase Flow with Interphase eXchanges)
NETL Workshop on Multiphase Flow Science, August 5-6 2014 3
The Two-Fluid Model
Plastic Flow Viscous Flow
Blend function
Solid Phase Stress Tensor
Particle-Particle Interactions
Drag Law
Particle-Gas Interactions
𝜕
𝜕𝑡𝜀𝑠𝑚𝜌𝑠𝑚 𝑣𝑠𝑚 + 𝛻 ∙ 𝜀𝑠𝑚𝜌𝑠𝑚 𝑣𝑠𝑚 𝑣𝑠𝑚 = 𝛻 ∙ 𝑆𝑠𝑚 + 𝜀𝑠𝑚𝜌𝑠𝑚 𝑔 + 𝐼𝑔𝑚

• Particle slip velocity at wall using Johnson-Jackson[1]
• φ = fraction of particle tangential momentum transferred to wall through collisions
• Friction neglected for simplification ⇒ φ includes frictional effects
• Indicative of wall roughness; also affected by superficial velocity, particle size
• φw∈ [0,1] such that φw = 0 ⇒ Free slip along the wall, minimum hindrance
φw = 1 ⇒ Zero tangential velocity, maximum hindrance
NETL Workshop on Multiphase Flow Science, August 5-6 2014 4
Boundary Condition
φw = 0
en = 1
φw = 1
en = 1
φw < 1
en < 1
en = 1
φw
= 1
Specularity Coefficient

NETL Workshop on Multiphase Flow Science, August 5-6 2014 5
Parametric Analysis
100 c
m
14.5 cm
Lab-Scale Model
Rudisuli et al. , 2012
100 c
m
30 cm
Pilot-Scale Model
100 c
m
50 cm
Lab-Scale Model
Delgado et al. 2013
• Lack of experimental data on φw => φw is a fitting parameter
φw tuned to 2D simulations is not appropriate for 3D simulations
• Thin rectangular beds
extensively used in
experimental studies
employing non-intrusive
measurements techniques
• Cylindrical beds more
realistic geometries for
scale-up and different
hydrodynamics compared
to pseudo-2D beds
• Variation of specularity
coefficient to evaluate
impact on simulation of
pilot-scale model

NETL Workshop on Multiphase Flow Science, August 5-6 2014 6
Metrics for Fluidization
Bubble statistics Dense phase statistics
Time mean
solids holdup
Size vs heightVelocity vs Height
Original CFD data f(x,y,z,t)
Circulation flux

NETL Workshop on Multiphase Flow Science, August 5-6 2014 7
Metrics for Fluidization
CS 1
CS 2
CS 1
Simulation
2D Vertical Slice or Cross
Section using simulation data
Digital Image Analysis
Bubble detection using ImageJ
Threshold void fraction = 0.7
Min bubble diameter = 1 cm
Bubble statistics using MATLAB
Lagrangian Velocimetry
Bubble numbering based on
lateral and axial positions
Velocity using identical numbered
bubbles in consecutive frames
Filters to remove unphysical
bubble velocities
Bubble Statistics

NETL Workshop on Multiphase Flow Science, August 5-6 2014 8
Metrics for Fluidization
Circulation Flux and Time
Time mean solid’s circulation flux up 𝐽𝑐+(𝑦) based on the upflow area 𝐴+(𝑦) i.e.
𝐽𝑐+ 𝑦 =
1
𝐴+(𝑦, 𝑡) 𝜌𝑠 ∙ 𝜀𝑠
+ ∙ 𝑉𝑠+ 𝑑𝑧+𝑑𝑥+
Define incremental positive circulation time such that
∆𝑡𝑐+(𝑦) =
1
𝐴+(𝑦, 𝑡)
𝑚+(𝑥, 𝑦, 𝑧, 𝑡)
𝑚+(𝑥, 𝑦, 𝑧, 𝑡)𝑑𝑧+𝑑𝑥+ =
1
𝐴+(𝑦, 𝑡)
∆𝑦 𝑑𝑧+𝑑𝑥+
𝑣𝑚 (𝑥, 𝑦, 𝑧, 𝑡)
Positive circulation time 𝑡𝑐+ is the average time taken by particles to reach axial
height 𝑦1 from the bottom of the bed i.e.
𝑡𝑐+|𝑦1 =
0
𝑦1
∆𝑡𝑐+ 𝑦 𝑑𝑦
The total solid’s circulation time 𝑡𝑐|𝑦1 = 𝑡𝑐+|𝑦1 + 𝑡𝑐
−|𝑦1 is representative of the
mixing time scale
𝑨+
𝑨−

NETL Workshop on Multiphase Flow Science, August 5-6 2014 9
Thin Rectangular Bed
Column 50 cm x 100 cm x 0.5 cm
Particles Glass - dp=678 μm, ρp=2500 kg/m3
Static Bed Height 30 cm
Experimental Conditions
Schematic of the
experimental setup by
Sanchez-Delgado et al 2013 [2]
Time mean void fraction and
pressure drop profiles for
U=2.5Umf
NETL Workshop on Multiphase Flow Science, August 5-6 2014 10
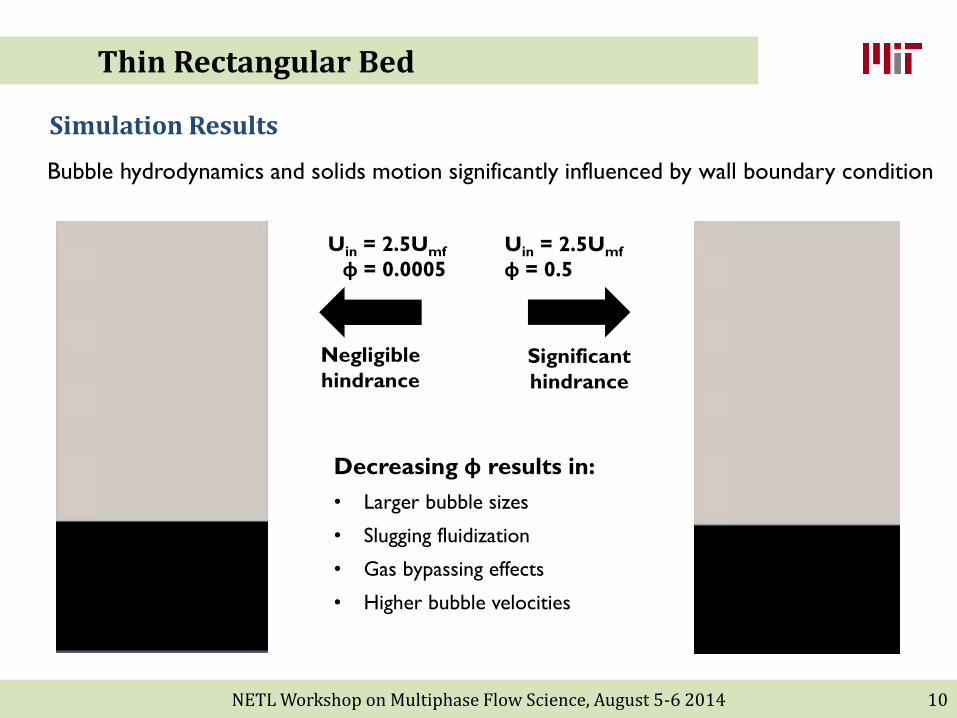
Thin Rectangular Bed
Decreasing φ results in:
• Larger bubble sizes
• Slugging fluidization
• Gas bypassing effects
• Higher bubble velocities
Uin = 2.5Umf
φ = 0.0005
Negligible
hindrance
Uin = 2.5Umf
φ = 0.5
Significant
hindrance
Simulation Results
Bubble hydrodynamics and solids motion significantly influenced by wall boundary condition

Φ = 0.05 Φ = 0.4
Experiment Experiment
Cir
cula
tio
n t
ime
[s]
Cir
cula
tio
n t
ime
[s]
Uin=2.5Umf Uin=1.75Umf
NETL Workshop on Multiphase Flow Science, August 5-6 2014 11
Thin Rectangular Bed
• Circulation time ↑ when
• Uin ↓ - closer to Umf and less bubbling
• φ ↑ - wall resistance increases ⇒ less solid motion close to walls and smaller bubbles
• Appropriate φ ↓ as Uin ↑. For the range, 1.5Umf – 2.5Umf, Φ ∈ [0.05,0.5]
Choosing Φ
Thin Rectangular Bed

NETL Workshop on Multiphase Flow Science, August 5-6 2014 12
Thin Rectangular Bed
1E-11E-3 1E-2 5E-2
• Time average probability of solids phase based in the bed
• Distinct bubble pathways identified in all cases
• Cross validation study to verify appropriate specularity coefficient based on time mean metrics
Qualitative agreement for Uin = 2.5Umf using Φ = 0.05
Experiment [2]
Solids Concentration Map

NETL Workshop on Multiphase Flow Science, August 5-6 2014 13
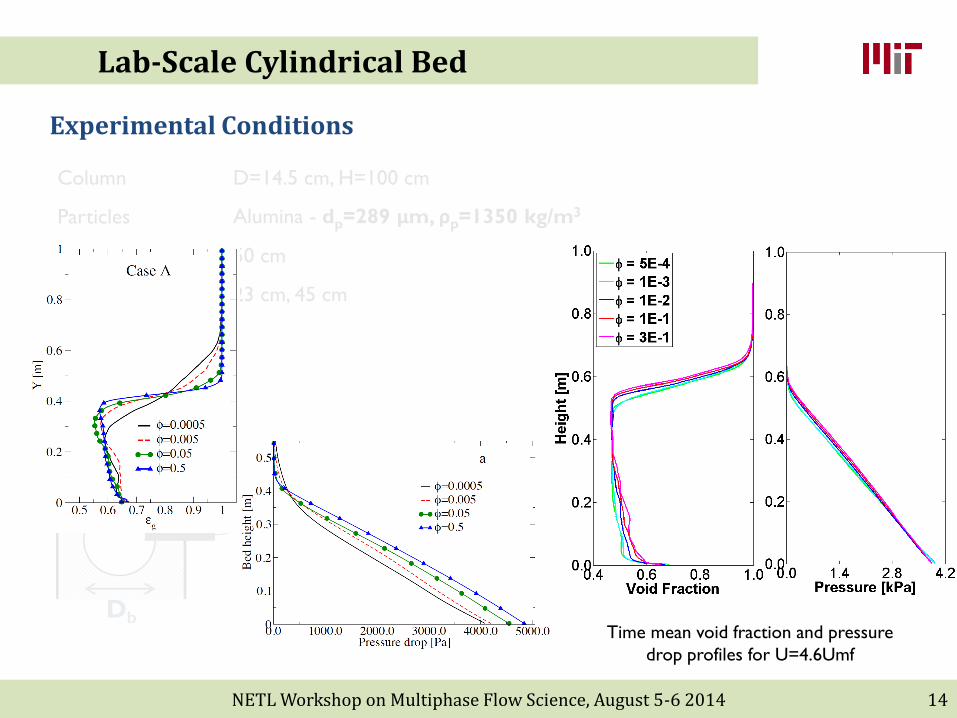
Lab-Scale Cylindrical Bed
Column D=14.5 cm, H=100 cm
Particles Alumina - dp=289 μm, ρp=1350 kg/m3
Static Bed Height 50 cm
Measuring Level 23 cm, 45 cm
Experimental Conditions
Optical probes used to
study bubble growth and
bubble velocity in the
experimental setup by
Rudisuli et al 2012 [3]
Time mean void fraction and pressure
drop profiles for U=4.6Umf
NETL Workshop on Multiphase Flow Science, August 5-6 2014 14
Lab-Scale Cylindrical Bed
Column D=14.5 cm, H=100 cm
Particles Alumina - dp=289 μm, ρp=1350 kg/m3
Static Bed Height 50 cm
Measuring Level 23 cm, 45 cm
Experimental Conditions
Optical probes used to
study bubble growth and
bubble velocity in the
experimental setup by
Rudisuli et al 2012 [3]
Time mean void fraction and pressure
drop profiles for U=4.6Umf

Vertical
Slice
Cross
Section
NETL Workshop on Multiphase Flow Science, August 5-6 2014 15
Lab-Scale Cylindrical Bed
Simulation Results
Data collected at 100 Hz for 3-30 s (2700 frames) for bubble statistics for 3.5, 4.6, 6.8 Umf
3D statistics on 2D planes ?
Bubble diameter
plots predict same
trends although VS
yields cord length
while CS yields
bubble area
VS bubble count
qualitatively matches
CS bubble count
(actual)

NETL Workshop on Multiphase Flow Science, August 5-6 2014 16
Lab-Scale Cylindrical Bed
Simulation Results
• Significant impact of specularity coefficient on bubble statistics and circulation fluxes
• Unlike rectangular bed, higher Φ => more bubbles and bigger bubbles
• Higher Φ => More resistance from walls => Lower solid circulation

NETL Workshop on Multiphase Flow Science, August 5-6 2014 17
Lab-Scale Cylindrical Bed
Simulation Results
• Significant impact of specularity coefficient on bubble statistics and circulation fluxes
• Unlike rectangular bed, higher Φ => bigger bubbles (and more bubbles)
• Higher Φ => More resistance from walls => Lower solid circulation

NETL Workshop on Multiphase Flow Science, August 5-6 2014 18
Lab-Scale Cylindrical Bed
• Important for predicting residence time of various components in different parts of the bed
∆𝑡𝑐+(𝑦) =
1
𝐴+(𝑦,𝑡)
∆𝑦 𝑑𝑧+𝑑𝑥+
𝑣𝑚 (𝑥,𝑦,𝑧,𝑡)
𝑡𝑐|𝑦1 = 𝑡𝑐+|𝑦1 + 𝑡𝑐
−|𝑦1 = 0𝑦1 ∆𝑡𝑐
+ 𝑦 + ∆𝑡𝑐+ 𝑦 𝑑𝑦
• tcdown , tcup and tc decrease with increasing Uin
• No effect of Φ on tcup => bubbling behavior
does not directly affect solid bulk motion !
• tcdown is more sensitive to Φ since solid
particles fall along the walls
• Similar trends for 3.5 Umf , 6.8Umf
U = 4.6Umf
Cylindrical Bed
Circulation Time
U = 2.5Umf Rectangular Bed
Bed Height

NETL Workshop on Multiphase Flow Science, August 5-6 2014 19
Pilot-Scale Cylindrical Bed
Influence of 𝜑 on flow
metrics for cylindrical bed
with diameter = 30 cm and
U = 4.6 Umf (18.9 cm/s)
• Cylindrical grid - 40x200x20 for 30 cm bed (average dr = 12 dp)
• Time mean pressure and void fraction profiles show negligible differences
• Circulation flux about 25% higher for lower φ
NETL Workshop on Multiphase Flow Science, August 5-6 2014 20
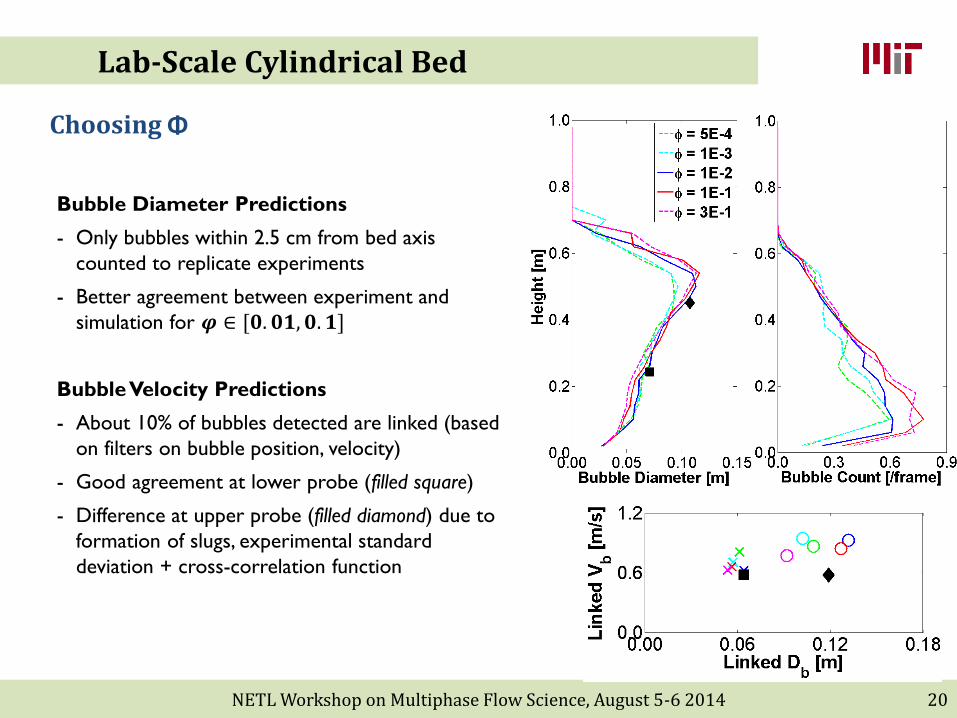
Lab-Scale Cylindrical Bed
Bubble Diameter Predictions
- Only bubbles within 2.5 cm from bed axis
counted to replicate experiments
- Better agreement between experiment and
simulation for 𝝋 ∈ [𝟎. 𝟎𝟏, 𝟎. 𝟏]
Bubble Velocity Predictions
- About 10% of bubbles detected are linked (based
on filters on bubble position, velocity)
- Good agreement at lower probe (filled square)
- Difference at upper probe (filled diamond) due to
formation of slugs, experimental standard
deviation + cross-correlation function
Choosing Φ

NETL Workshop on Multiphase Flow Science, August 5-6 2014 21
Conclusions and Future Work
i. Circulation flux and bubble statistics must supplement time mean solid holdup
and pressure profiles to quantify hydrodynamics and mixing
ii. Wall boundary condition is critical for simulating fluidization and may even impact
predictions in pilot-scale simulations
iii. Studies on both thin rectangular bed and cylindrical beds indicate appropriate
specularity coefficient for bubbling fluidization in the range 0.01-0.1
Future Work
i. Validation with different experimental setup / particle size / flow parameters
ii. Experimental data to quantify circulation time for cylindrical beds
iii. Using bubble statistics to predict residence times in reactive simulations

NETL Workshop on Multiphase Flow Science, August 5-6 2014 22
References
[1] Johnson, P.C. and Jackson, R. “Frictional-collisional constitutive relations for granular materials,
with application to plane shearing.” J. Fluid Mech. 176 (1987): 67–93.
[2] Sánchez-Delgado, S. et al. “Estimation and Experimental Validation of the Circulation Time in a
2D Gas–solid Fluidized Beds.” Powder Technology 235.0 (2013): 669–676.
[3] Rüdisüli, Martin et al. “Comparison of Bubble Growth Obtained from Pressure Fluctuation
Measurements to Optical Probing and Literature Correlations.” Chemical Engineering
Science 74.0 (2012): 266–275.
[4] Bakshi, A., C. Altantzis, and A.F. Ghoniem. “Towards Accurate Three-dimensional Simulation of
Dense Multi-phase Flows Using Cylindrical Coordinates.” Powder Technology 264.0
(2014): 242–255.
[5] Altzantis, C., R. B. Bates, and A.F. Ghoniem. “3D Eulerian modeling of thin rectangular gas-solid
fluidized beds: Estimation of the specularity coefficient and its effects on bubbling
dynamics and circulation times.” Submitted to Powder Technology (2014).