
Estimating the Numbers of End Users and End User Programmers
22
Estimating the Numbers of End Users and End User Programmers Christopher Scaffidi Brad Myers Mary Shaw Carnegie Mellon University EUSES Consortium VL/HCC ’05, Sep 23, 2005
-
Upload
emily-ramsey -
Category
Documents
-
view
51 -
download
1
description
Estimating the Numbers of End Users and End User Programmers. Christopher Scaffidi Brad Myers Mary Shaw Carnegie Mellon University EUSES Consortium VL/HCC ’05, Sep 23, 2005. The Old 55M Estimate. - PowerPoint PPT Presentation
Transcript of Estimating the Numbers of End Users and End User Programmers
Estimating the Numbers of End Users and End User Programmers
Christopher ScaffidiBrad MyersMary Shaw
Carnegie Mellon UniversityEUSES Consortium
VL/HCC ’05, Sep 23, 2005
The number of end-user programmers
in the U.S. alone is expected to reach
55 million by 2005,
as compared to only 2.75 million
professional programmers.
The Old 55M Estimate
The number of users
in U.S. businesses is expected to exceed
90 million by 2012,
including over 55 million users of
spreadsheets and/or databases,
as compared to under 3 million
professional programmers.
Our New 90M Estimate
1. The Basic 55M Estimation Method– 55M End User Programmers in 2005
2. Extending the Method– 90M Users in 2012– 55M Spreadsheet and/or Database Users in 2012
3. Conclusions
Outline
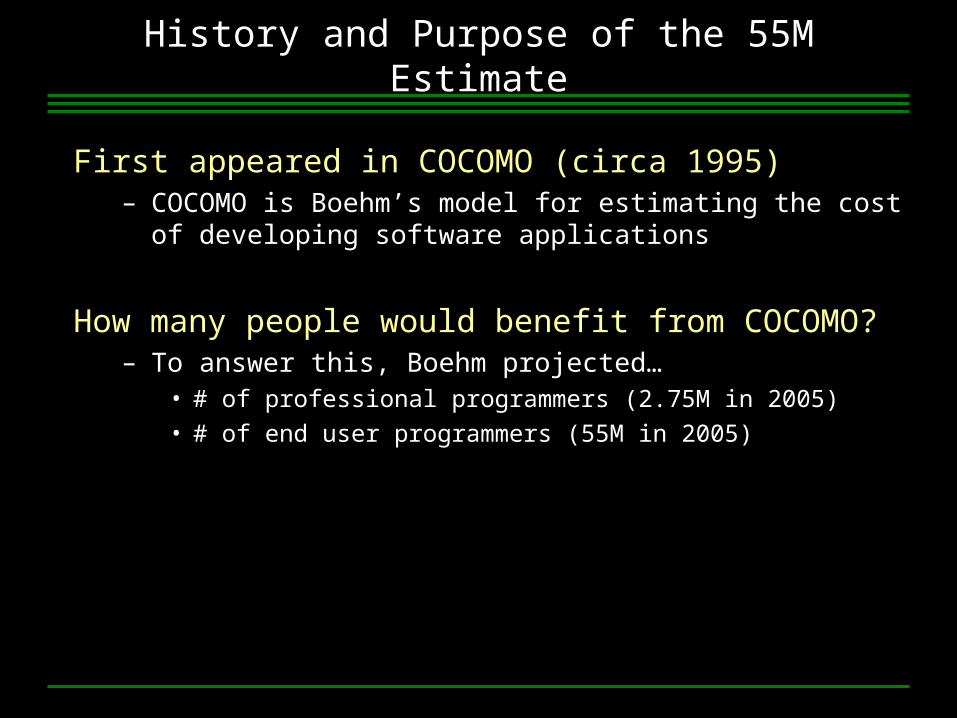
First appeared in COCOMO (circa 1995)– COCOMO is Boehm’s model for estimating the cost of
developing software applications
How many people would benefit from COCOMO?– To answer this, Boehm projected…
• # of professional programmers (2.75M in 2005)• # of end user programmers (55M in 2005)
– .
History and Purpose of the 55M Estimate
Step #1: Project Worker Counts for 2005
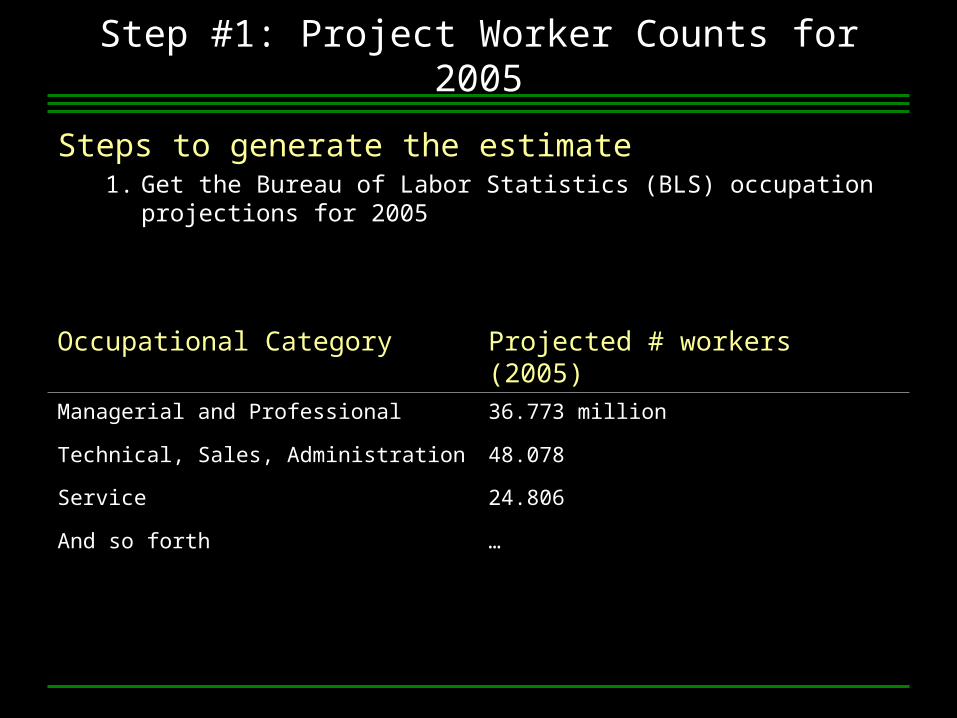
Steps to generate the estimate1. Get the Bureau of Labor Statistics (BLS) occupation projections
for 2005
Occupational Category Projected # workers (2005)Managerial and Professional 36.773 million
Technical, Sales, Administration 48.078
Service 24.806
And so forth …
Step #2: Estimate what Fraction of Workers Use the Computer
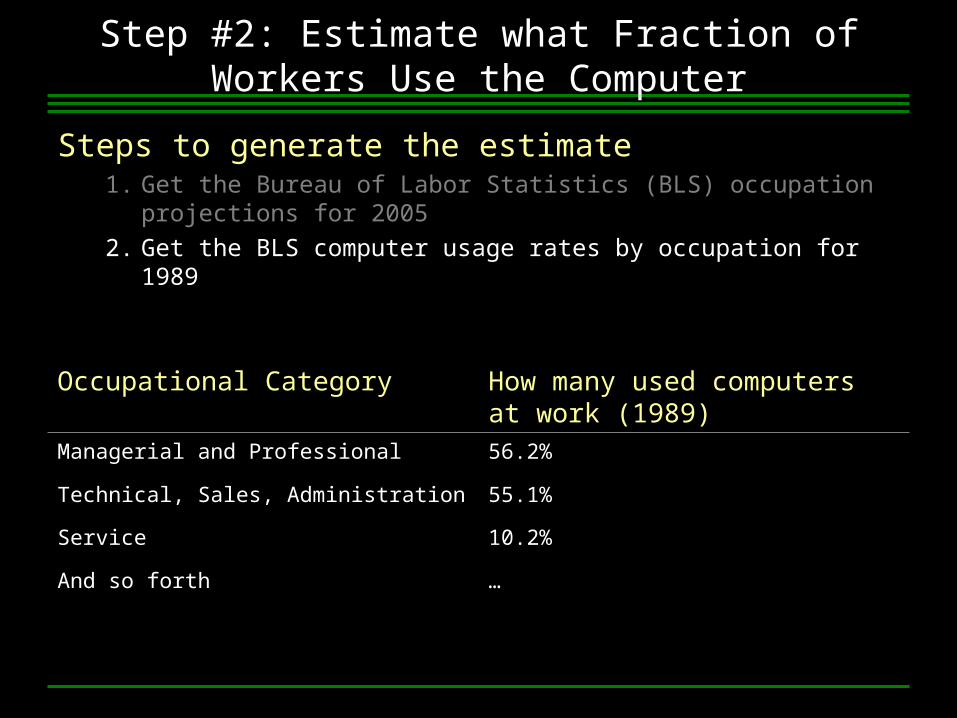
Steps to generate the estimate1. Get the Bureau of Labor Statistics (BLS) occupation projections
for 20052. Get the BLS computer usage rates by occupation for 1989
Occupational Category How many used computers at work (1989)
Managerial and Professional 56.2%
Technical, Sales, Administration 55.1%
Service 10.2%
And so forth …
Step #3: Multiply and Sum Up
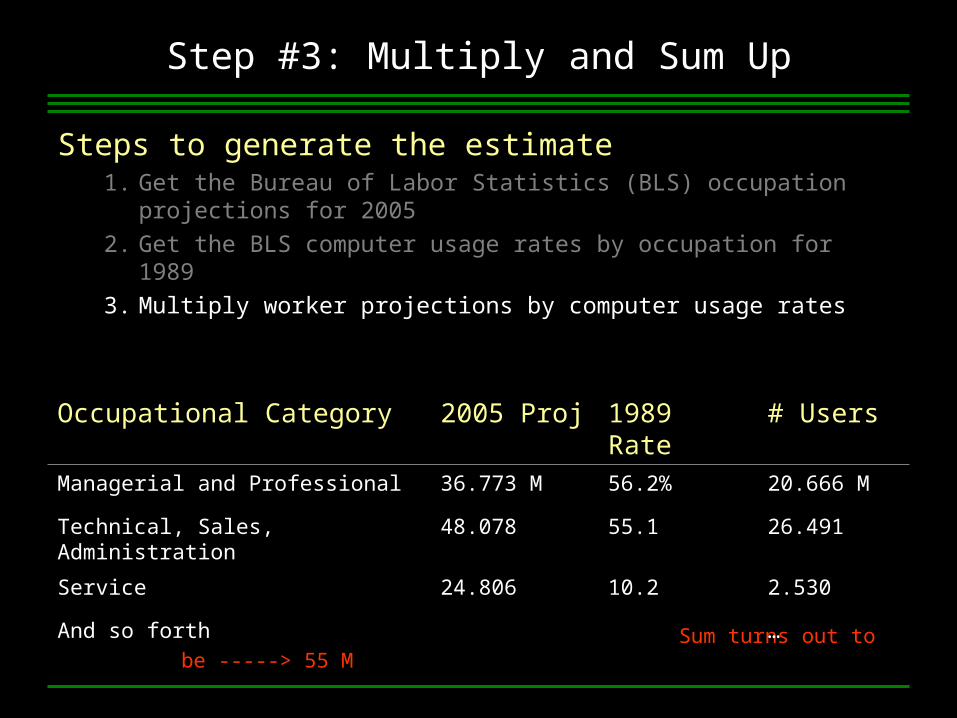
Steps to generate the estimate1. Get the Bureau of Labor Statistics (BLS) occupation projections
for 20052. Get the BLS computer usage rates by occupation for 19893. Multiply worker projections by computer usage rates
Sum turns out to be -----> 55 M
Occupational Category 2005 Proj 1989 Rate # UsersManagerial and Professional 36.773 M 56.2% 20.666 M
Technical, Sales, Administration 48.078 55.1 26.491
Service 24.806 10.2 2.530
And so forth …
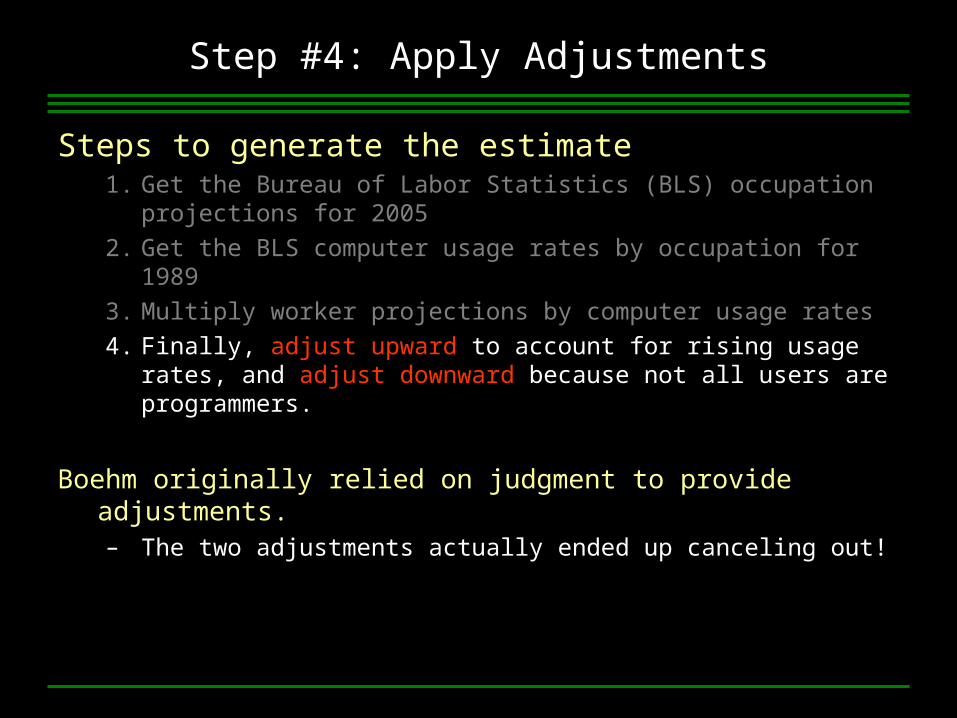
Step #4: Apply Adjustments
Steps to generate the estimate1. Get the Bureau of Labor Statistics (BLS) occupation projections
for 20052. Get the BLS computer usage rates by occupation for 19893. Multiply worker projections by computer usage rates4. Finally, adjust upward to account for rising usage rates, and
adjust downward because not all users are programmers.
Boehm originally relied on judgment to provide adjustments.– The two adjustments actually ended up canceling out!
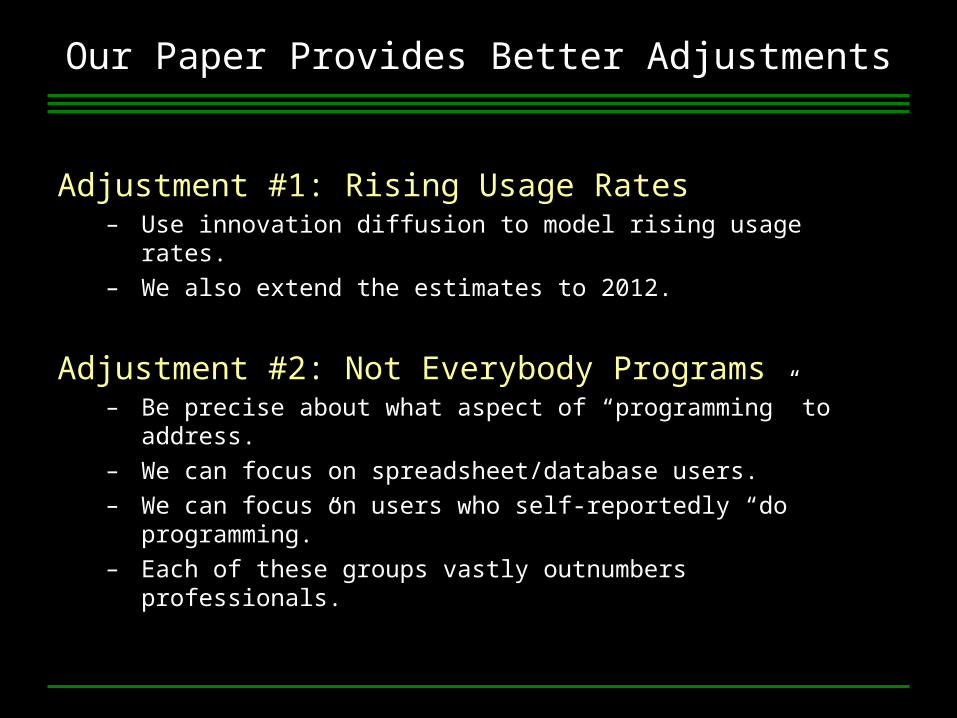
Our Paper Provides Better Adjustments
Adjustment #1: Rising Usage Rates– Use innovation diffusion to model rising usage rates.– We also extend the estimates to 2012.
Adjustment #2: Not Everybody Programs– Be precise about what aspect of “programming” to address.– We can focus on spreadsheet/database users.– We can focus on users who self-reportedly “do programming.”– Each of these groups vastly outnumbers professionals.
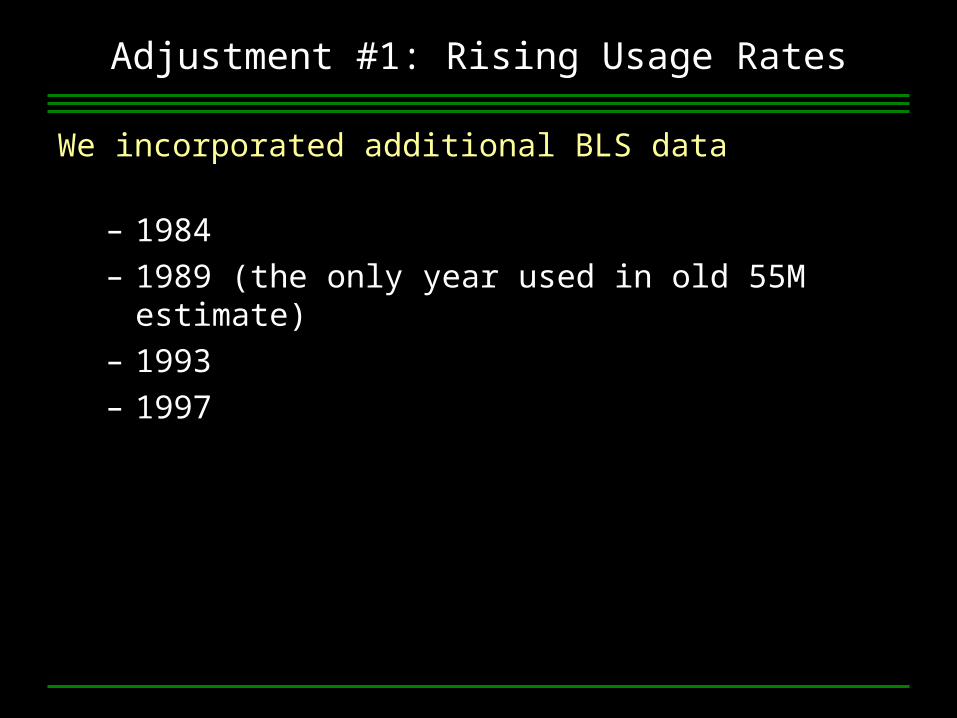
Adjustment #1: Rising Usage Rates
We incorporated additional BLS data
– 1984– 1989 (the only year used in old 55M estimate)– 1993– 1997
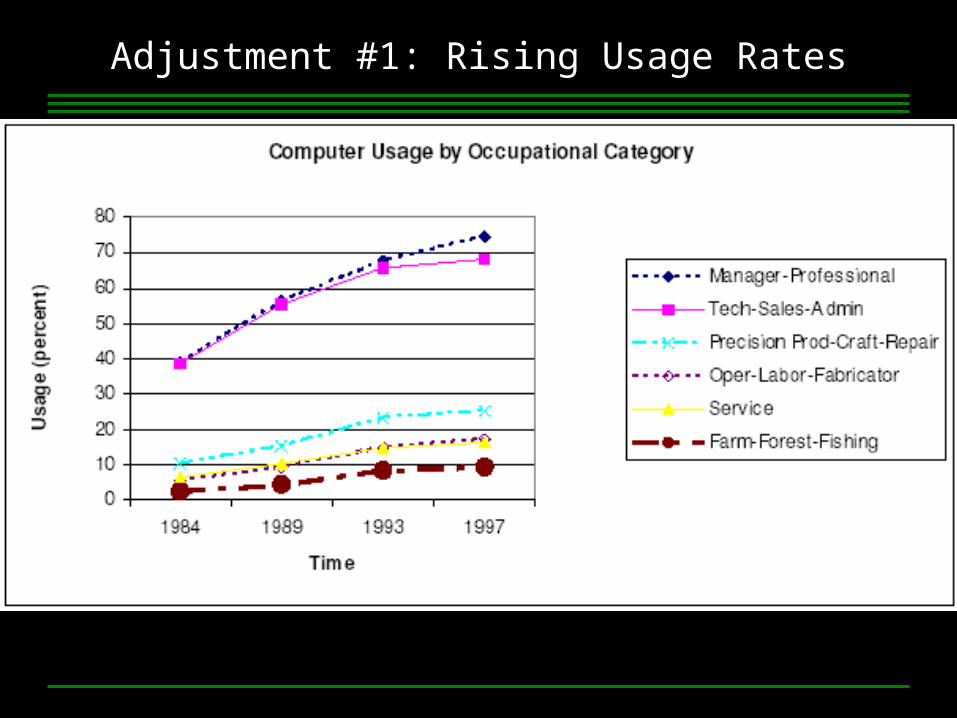
Adjustment #1: Rising Usage Rates
Adjustment #1: Rising Usage Rates
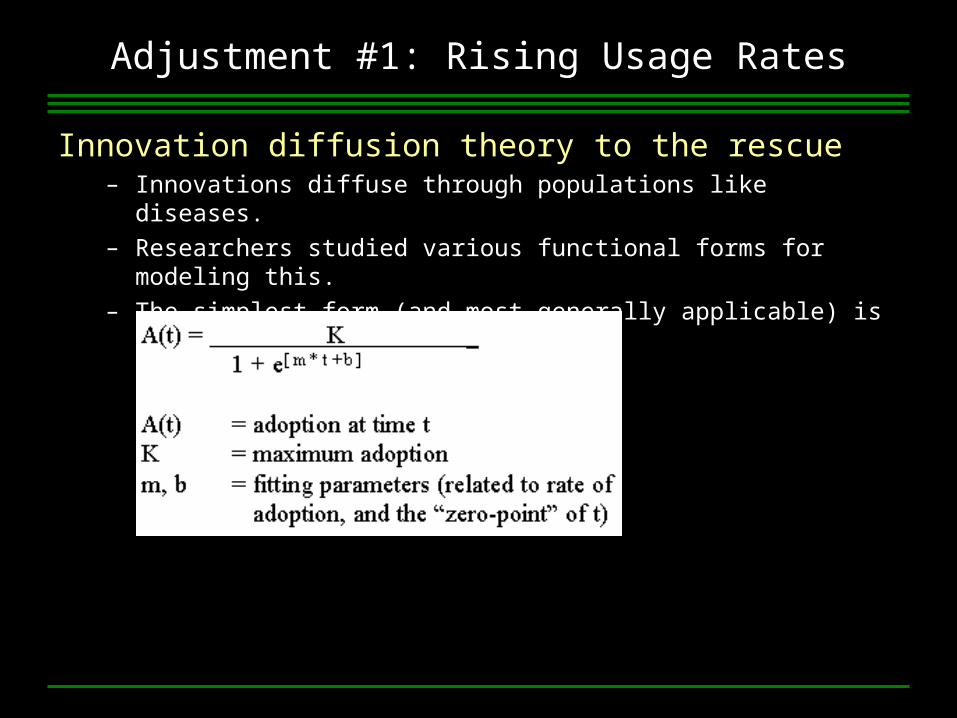
Innovation diffusion theory to the rescue– Innovations diffuse through populations like diseases.– Researchers studied various functional forms for modeling this.– The simplest form (and most generally applicable) is S-shaped
Adjustment #1: Rising Usage Rates
Projecting the computer usage rates– The S-shaped functional form had 3 free parameters (K, m, b)– We have 4 measurements from BLS (1984, 1989, 1993, 1997)– So we can fit to functional form for each occupation category– (Note that with so few points, “goodness of fit” means little.)
A somewhat better estimate– Get the BLS’s latest occupation projection
(which happens to be for the year 2012)– Plug in t=2012 to forecast future computer usage rates– Multiply and sum as Boehm did– Result: 90M users in 2012
Validation
Does it match 2001 BLS count of workplace users?– BLS modified their questions slightly in 2001– Our fit predicts 71.9M users; actual = 72.3M– Incorporating this 2001 BLS data into our fit raises our
estimate for 2012 from 90M users to 96M users
Does it match 2003 Forrester count?– They found 129M users (work or home) age 18-64– Our fit predicts 80M workplace users for 2003– Use BLS 2001 to adjust for age, add in home (non-work) users– Our result for comparison: a little over 123M (to their 129M)
Excellent match.
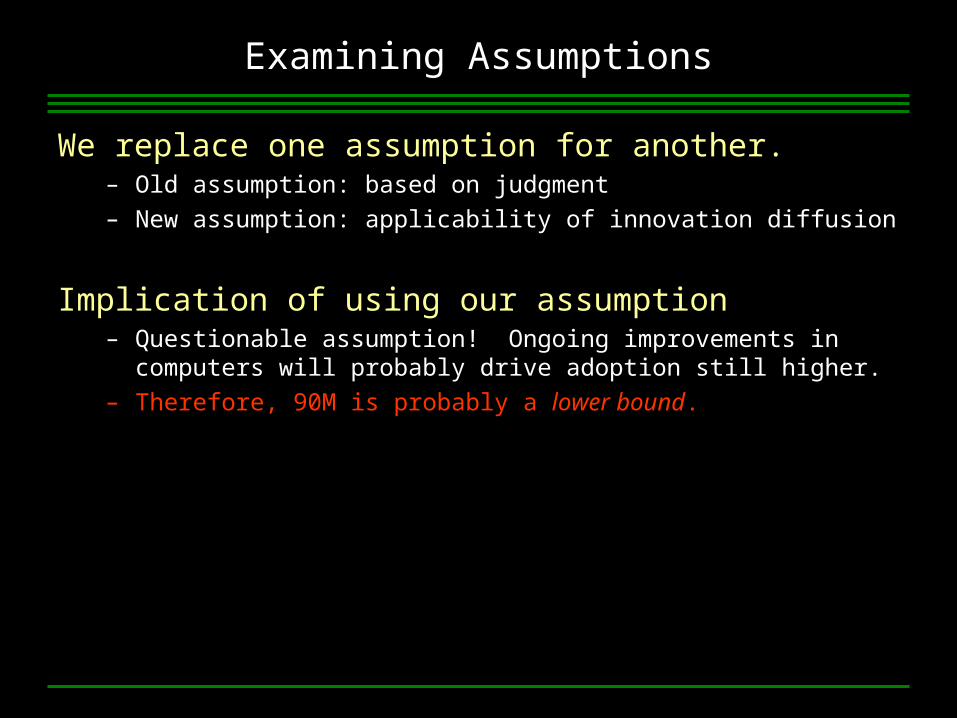
Examining Assumptions
We replace one assumption for another.– Old assumption: based on judgment– New assumption: applicability of innovation diffusion
Implication of using our assumption– Questionable assumption! Ongoing improvements in
computers will probably drive adoption still higher.– Therefore, 90M is probably a lower bound.
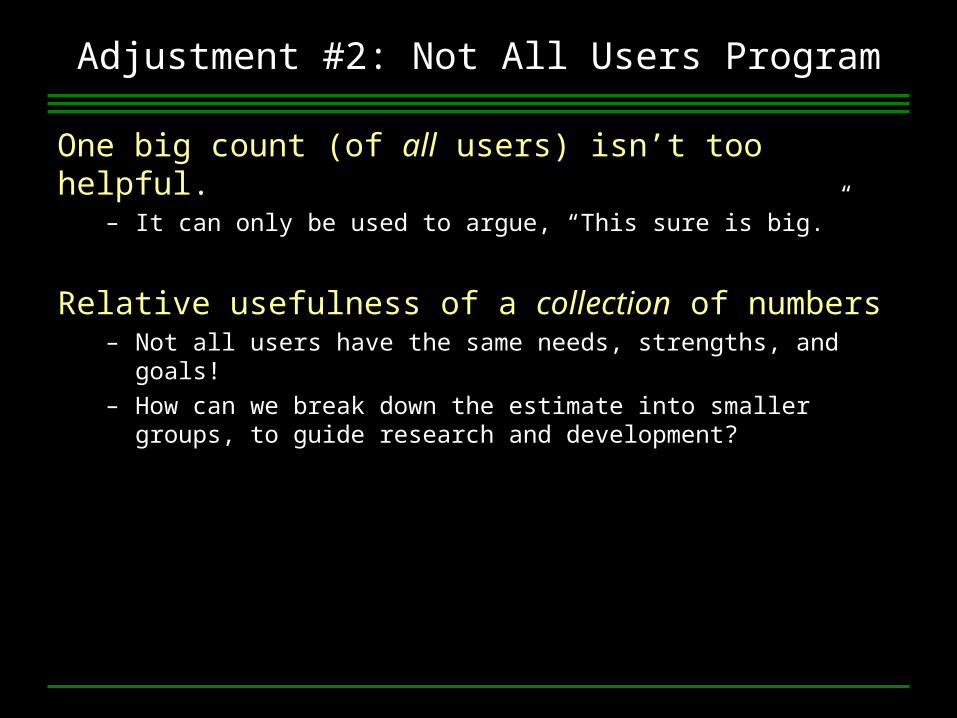
Adjustment #2: Not All Users Program
One big count (of all users) isn’t too helpful.– It can only be used to argue, “This sure is big.”
Relative usefulness of a collection of numbers– Not all users have the same needs, strengths, and goals!– How can we break down the estimate into smaller groups, to
guide research and development?
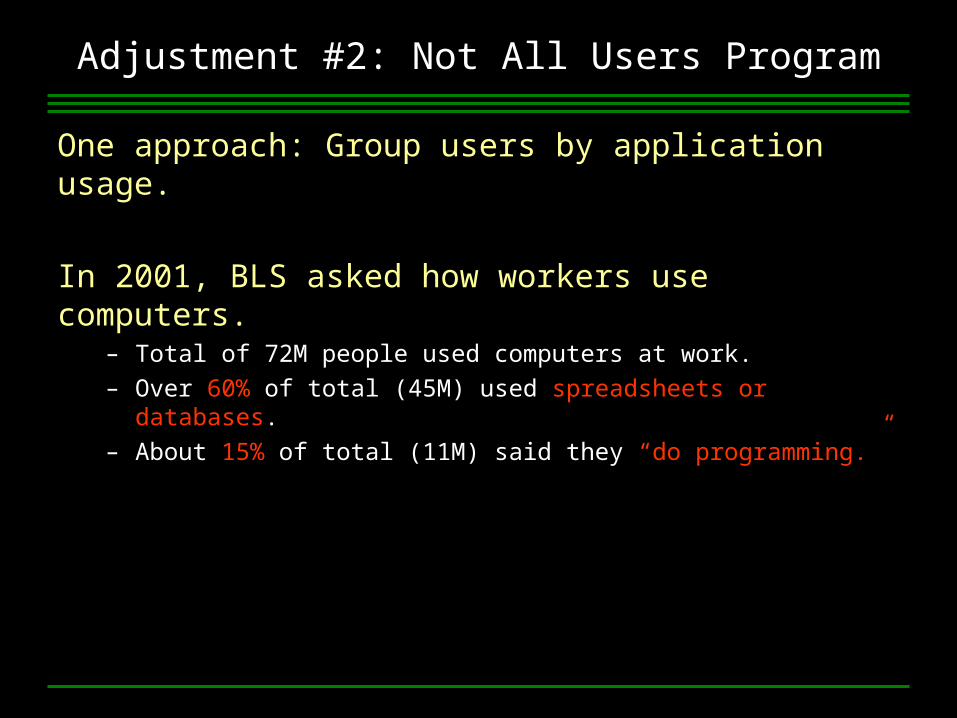
Adjustment #2: Not All Users Program
One approach: Group users by application usage.
In 2001, BLS asked how workers use computers.– Total of 72M people used computers at work.– Over 60% of total (45M) used spreadsheets or databases.– About 15% of total (11M) said they “do programming.”
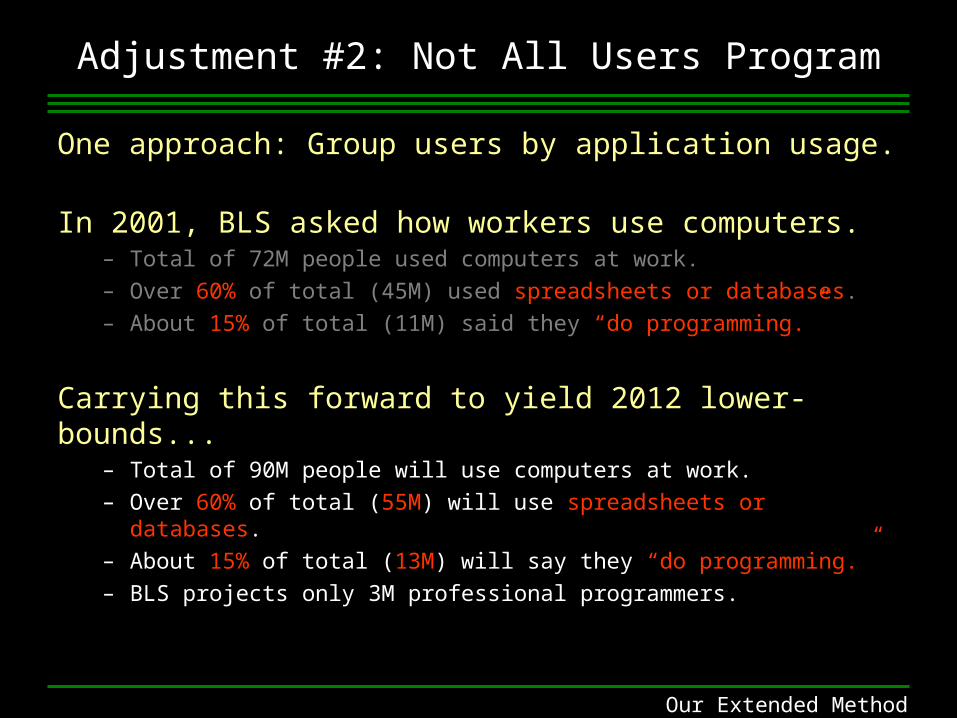
Adjustment #2: Not All Users Program
One approach: Group users by application usage.
In 2001, BLS asked how workers use computers.– Total of 72M people used computers at work.– Over 60% of total (45M) used spreadsheets or databases.– About 15% of total (11M) said they “do programming.”
Carrying this forward to yield 2012 lower-bounds...– Total of 90M people will use computers at work.– Over 60% of total (55M) will use spreadsheets or databases.– About 15% of total (13M) will say they “do programming.”– BLS projects only 3M professional programmers.
Our Extended Method
Conclusions
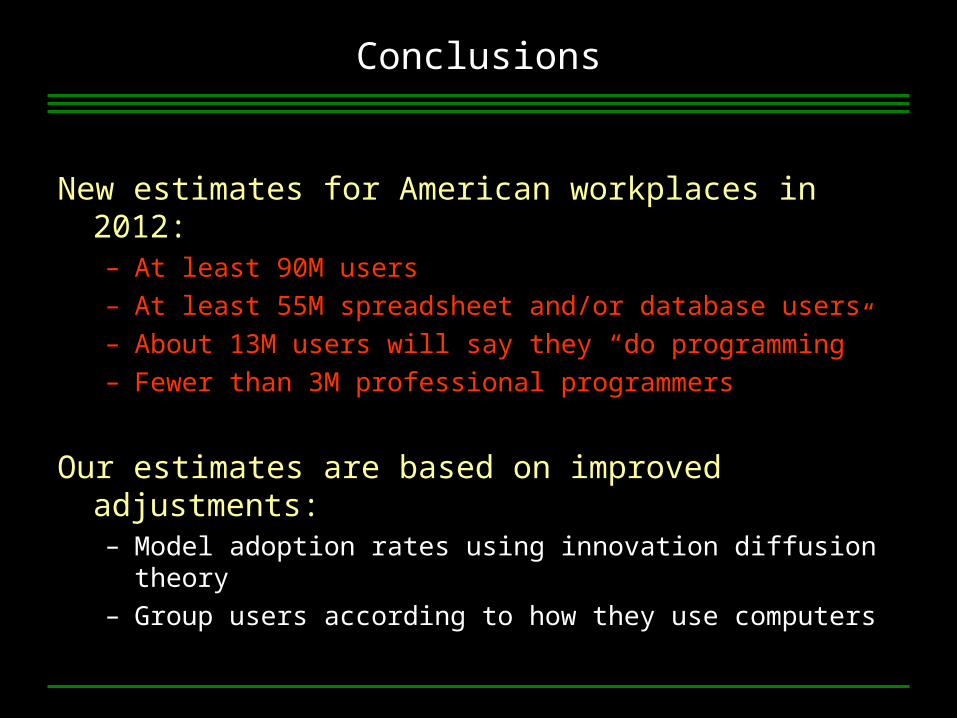
New estimates for American workplaces in 2012:– At least 90M users– At least 55M spreadsheet and/or database users– About 13M users will say they “do programming”– Fewer than 3M professional programmers
Our estimates are based on improved adjustments:– Model adoption rates using innovation diffusion theory– Group users according to how they use computers

Thank You
To VL/HCC for the opportunity to present
To NSF, Sloan, and NASA for funding
To Barry Boehm for discussions of his 55M estimate


![[MBG00]a New End-To-End Probing and Analysis Method for Estimating Bandwidth Bottlenecks](https://static.fdocuments.in/doc/165x107/577d1d611a28ab4e1e8c2559/mbg00a-new-end-to-end-probing-and-analysis-method-for-estimating-bandwidth.jpg)


