Estimating the magnitude of pre-European Maori marine ...
73
New Zealand Aquatic Environment and Biodiversity Report No. 82 2011 ISSN 1176-9440 Estimating the magnitude of pre-European Maori marine harvest in two New Zealand study areas I.W.G. Smith
Transcript of Estimating the magnitude of pre-European Maori marine ...

New Zealand Aquatic Environment and Biodiversity
Report No. 82 2011
ISSN 1176-9440 Estimating the magnitude of pre-European Maori marine harvest in two New Zealand study areas I.W.G. Smith
Estimating the magnitude of pre-European Maori marine harvest in two New Zealand study areas
I.W.G. Smith
Department of Anthropology and Archaeology University of Otago
PO Box 56 Dunedin 9054
New Zealand Aquatic Environment and Biodiversity Report No. 82 2011

Published by Ministry of Fisheries
Wellington
2011
ISSN 1176-9440
©
Ministry of Fisheries
2011
Smith, I.W.G. (2011).
Estimating the magnitude of pre-European Maori marine harvest in two New Zealand study areas
New Zealand Aquatic Environment and Biodiversity Report No. 82.
This series continues the
Marine Biodiversity Biosecurity Report series
which ceased with No. 7 in February 2005.

3
EXECUTIVE SUMMARY
Smith, I.W.G. (2011). Estimating the magnitude of pre-European Maori marine harvest in
two New Zealand study areas.
New Zealand Aquatic Environment and Biodiversity Report No. 82.
This report forms part of the Taking Stock project which is seeking to understand the long-term effects
of climate variations and human impacts on the structure and functioning of New Zealand’s marine
shelf ecosystems. It uses archaeological data to estimate the numbers and biomass of marine animals
used as food by people in two New Zealand study areas during the period before European settlement.
The study areas are Greater Hauraki, on the northeast coast of the North Island, and Otago-Catlins, on
the southeast coast of the South Island. For each area estimates are made for three points in time; ca.
1400 AD, ca. 1550 AD, and ca. 1750 AD.
The method used to generate the estimates is novel, and involves three steps. First, archaeological
data were analysed to determine the range of marine animal species harvested by Maori at each focal
date in each study area, and the proportional contribution of each species to the total energy harvest
from animals. Second, the scale of the total energy harvest from animals was approximated by
estimating the size of human population, the energy required to sustain them, and the proportion of
that derived from animal foods. Finally, the number of each marine animal species required to
contribute the proportions derived in the first step to the total energy harvest from animals estimated
in the second step was calculated using an estimate of the calorific value of the meat derived from an
individual of the species concerned. Three estimates were made for each species; a minimum estimate
which used the lowest probable values for each variable in the second step of analysis, a maximum
estimate using the highest probable values, and a best estimate based on the most realistic or well-
supported values. Cumulative calculation errors were applied to each set of estimates.
Estimates are presented for 101 taxa from the Greater Hauraki study area (46 shellfish, 28 fish, 22
birds and 5 mammals) and 96 from the Otago-Catlins study area (36 shellfish, 25 fish, 28 birds and 7
mammals). In a small number of cases estimates are available for only one or two of the focal dates,
either because of changes in the availability of the species concerned or the pattern of harvesting by
Maori.
For the majority of species the minimum, best and maximum estimates all indicate increased
harvesting over time. For example, at ca. 1400 AD in Greater Hauraki the best estimate of harvested
biomass of snapper (Pagrus auratus) is 72.1 ± 21.6 tonnes (minimum 12.1 ± 3.6 t; maximum 107.5 ±
32.3 t), which rose to 938.8 ± 281.7 t (min. 354.8 ± 106.4 t; max. 1354.7 ± 406.4 t) at ca. 1550 AD,
and then 997.2 ± 299.2 (min. 560.1 ± 168.0 t; max. 1393.9 ± 418.2 t) at ca. 1750 AD. In contrast,
marine mammals and some marine and coastal bird exhibit declining trends under all three sets of
estimates. For example, the fur seal (Arctocephalus forsteri) which yielded a best estimate of 284.9 ±
85.5 t (min. 47.9 ± 14.4 t; max. 425.1 ± 127.5 t) at ca. 1400 AD in Greater Hauraki was no longer
harvested at the two later focal dates. In Otago-Catlins harvests of the same species fall successively
from best estimates of 237.0 ± 71.1 t (min. 55.2 ± 16.6 t; max. 383.5 ± 115.1 t) to 103.3 ± 31.0 t (min.
24.0 ± 7.2; max. 173.8 ± 52.1 t) then 77.0 ± 23.1 t (min. 57.4 ± 17.2; max. 99.7 ± 29.9 t) in ca. 1400,
1550 and 1750 AD, respectively.

4
In the Greater Hauraki region growth of the human population was one of two main reasons for the
increased harvests of most marine animals. In addition, the demand placed on most fish, shellfish and
some bird species increased over time because seals, moas and some of the marine and coastal birds
that made important contributions to earlier Maori diets ceased to be available. This process of
replacement of one food source by another was the single most important driver of change in Otago-
Catlins, where the human population remained more or less stable throughout the study period.
As well as contributing to understanding of long-term changes in the structure and functioning of
New Zealand’s marine shelf ecosystems, the estimates provide baseline data against which modern
customary and commercial harvests of marine animals can be measured.

5
1. INTRODUCTION
1.1 Overview
New Zealand was the last major land mass to be settled by humans, their arrival dated to around 1280
AD (Wilmshurst et al. 2011). Consequently, New Zealand has a short and reasonably complete
archaeological, historical and contemporary record of human exploitation of marine resources
compared to most other places where the earliest evidence of human impacts on marine ecosystems is
difficult to discern because of climate fluctuations and changes in sea level (MacDiarmid 2011). The
collaborative multi-disciplinary Taking Stock project, funded by the Ministry of Fisheries, has the
overall objective of determining the effects of climate variation and human impact on the structure
and functioning of New Zealand shelf ecosystems over the timescale of human occupation. To
achieve this it set out to build a mass balance model of current coastal and marine shelf ecosystems in
each of two study areas, and then to estimate how each of these operated at five earlier intervals: ca.
1950 AD (before modern industrial fishing), ca. 1750 AD (before European whaling and sealing), ca.
1550 AD (about the middle of the Maori period of occupation), ca. 1400 AD (soon after Maori arrival
in New Zealand) and ca. 1000 AD (before human settlement). For each of the earlier intervals
reconstruction depends in part on estimation of the taxonomic composition and biomass of removals
from the marine environment through human activities. This report draws upon archaeological data
for the exploitation of marine resources by Māori in the Hauraki Gulf and along the Otago-Catlins
coast to estimate what they harvested from the sea at three intervals between earliest settlement and
European arrival at the end of the 18th century AD (ca. 1400, 1550, 1750 AD).
1.2 Previous Research
There is a long history of using archaeological data to infer changes in past ecosystems. Numerous
instances of animal extinctions and distributional changes have been detected, dated and examined
through archaeological research (e.g. Grayson 2001, Rick & Erlandson 2008). In New Zealand, as
elsewhere in the world, most of these examples concern terrestrial fauna, and in many cases predation
by people and their commensals or human-induced habitat modification have been implicated
(Anderson 1989, Anderson 1997, Holdaway 1999, McGlone 1989).
For the marine environment, evidence is much more equivocal. New Zealand seals provide one well-
explored case of pre-industrial human impacts (Smith 1989, Smith 2005), and internationally there are
others for terrestrial-breeding marine mammals (Bryden et al. 1999, Burton et al. 2001). Equally,
there are cases of apparently stable, long-term exploitative relationships (Etnier 2007), and for
marine-breeding animals there is little undisputed evidence of dramatic human impact before the
emergence of commercial whaling in the 18th and 19
th centuries (Reeves & Smith 2006) and more
recent industrial-scale fisheries (Myers & Worm 2003, Pauly et al. 1998). Indeed, the New Zealand
data for pre-European shell and fin fisheries show that it is difficult to separate potential effects of
human predation and climate without intensive and closely targeted archaeological research (Leach
2006).
Direct estimation of animal population biomass from archaeological data is not generally possible. The
archaeological window into past ecological systems is blurred by transformative processes that influence
the creation of the archaeological record. These include harvesting and carcass processing, which are
largely determined by cultural patterns, along with natural taphonomic processes of decay, and
variations in the accuracy with which different items are amenable to archaeozoological analysis (Reitz

6
& Wing 2008). Furthermore archaeologists are primarily concerned with determining long-term patterns
and regularities in human behaviour, rather than reconstructing past ecosystems, and their data
acquisition and analytical methods are designed accordingly. In order to be useful in palaeoecological
reconstruction, archaeozoological data must be interpreted with due regard to the cultural and natural
formation processes that shaped them, and the archaeological filters through which they have passed.
In the case of pre-European New Zealand, one of the key cultural factors that must be accommodated is
the mobile nature of human settlement, whereby members of a community are hypothesised (Anderson
& Smith 1996, Walter et al. 2006) to have made regular intra-annual shifts of residence to facilitate the
exploitation of dispersed, seasonally available resources, and communities made occasional territorial
shifts over time. Thus no single site can be considered to provide a complete picture of the pattern of
marine resource exploitation by a community, and some sites may represent multiple phases of
exploitation with differing return intervals. In these circumstances it is essential to aggregate data at a
regional level from a judiciously selected range of sites.
With these cautions in mind, some inferences about palaeoecology are possible. The presence of
physical remains of an animal species in a regional set of archaeological sites can generally be used to
infer that this species occurred in the catchment area of those sites at the time of their occupation, and
thus provides a basis for reconstructing the distribution of that species in the past. Similarly, where age
or sex can be determined from physical remains, the presence of animals of specific age or sex classes
allows some inferences to be made about the age composition and breeding status of exploited
populations. Potential confounding factors include long-distance transportation of preserved food
remains, industrial usage of bones, teeth or shells from distant sources or older archaeological deposits,
and disturbance of archaeological deposits introducing taxa from earlier or later time periods. Where
recovery and analytical procedures are adequate, problems of this kind can usually be identified and
ameliorated. In contrast, the absence of a species, age or sex class in the archaeological record is not so
clear cut. Cultural factors such as dietary preference and harvesting technology, or analytical factors
such as sample size, may have intervened. These must be accounted for before archaeological absences
can be used to infer lacunae in past animal distributions.
Caution is required in making inferences about the abundance of various species in the past from
archaeological data. The relative abundance of taxa in archaeozoological assemblages is primarily a
record of the frequency with which they were harvested, modified over time by taphonomic decay.
Nonetheless it is reasonable to infer that species which are regularly represented in high frequencies in a
regional sample of sites were relatively commonly available. Furthermore, where there is a significant
decline in the relative abundance of a species over time, without any evidence for changes in harvesting
technology, a decline in their availability can be inferred. Relative abundances of archaeofauna can also
be used to derive quantitative assessments of the relative importance of various animals in the diet of the
people exploiting them by converting them into the weights of meat that they represent, from which can
be derived estimates of the nutritional and energy yields derived from each exploited species (Smith
2004, Smith 2011).
Two broad approaches were taken to generate information useful to the Taking Stock project. First, an
overview of marine resource utilisation was constructed for each study area based upon the
presence/absence of marine taxa in archaeozoological assemblages and, where suitable data was
available, their relative abundance. The second approach involved estimating the magnitude of marine
biomass removals through human exploitation in each study area. This was undertaken using estimates
of the size of human populations, their energy requirements and the relative contributions of marine
foods to their diet.

7
1.3 Objectives
The purpose of this report is to assess and collate existing archaeological data on human removals
from the marine environment in two New Zealand study areas in order to address the archaeological
aspects of Objective 2 of the Taking Stock Project ZBD200505, which was “To assess and collate
existing archaeological, historical and contemporary data (including catch records and stock
assessments) on relevant components of the marine ecosystem to provide a detailed description of
change in the shelf marine ecosystem in two areas of contrasting human occupation over last 1000
years”. The specific objective for the archaeological component of this project was to provide
detailed estimates of the magnitude of human removals from the marine shelf ecosystems of two
study areas at three points in times between first human arrival in New Zealand and European
settlement.
2. METHODS
2.1 Study Areas and Selection of Study sites
Two study areas were utilized for the Taking Stock project, Greater Hauraki on the east coast of the
North Island and Otago-Catlins on the east coast of the South Island, in each case extending from
mean high water out to a depth of 250 m (Figure 1). To derive archaeological information relevant to
human exploitation of these areas data was drawn from archaeological sites on the adjacent coasts.
More than 10 000 sites presumed to derive from the pre-European period have been recorded adjacent
to the Greater Hauraki coast and some 800 in Otago-Catlins (CINZAS 2008), the difference reflecting
the marked concentration of pre-European Maori population in the northern third of the country.
Only a small proportion of recorded sites in each area have been investigated by archaeological
excavation, and information from these was assessed through a review of published literature, theses
and dissertations in archaeology from University of Auckland and University of Otago, and
excavation reports lodged in the NZ Historic Places Trust’s Archaeological Report Digital Library. A
sample for each study area was selected for detailed analysis on the basis of two criteria: the
availability of data on faunal remains suitable for the methodology described below; and the
availability of reliable chronological information enabling the sites, or specific assemblages from
them to be placed securely in time.
The requirements for data on faunal remains were (a) that taxonomic identifications had been reported
for all animal remains in the excavated sample, and (b) the number of animals assigned to each taxon
was reported. In this context identifications include determinations to species level along with
assignments to genus, family or higher-level designations as necessitated by the nature of
archaeozoological material. Identification data were accepted as reported, except where assemblages
or components of them had been re-examined (e.g. Leach & Boocock 1993, Millener 1981, Smith
1985, Worthy 1998) any revisions of identification were incorporated. Where necessary
identifications were updated to accommodate revisions of nomenclature, based on the following
sources: for shellfish, Spencer et al. (2009); finfish, Froese & Pauly (2010); birds, Checklist
Committee (OSNZ) (2010); and mammals, King (1995) and Baker et al. (2010). Quantification of
identified taxa was in terms of the minimum number of individuals (MNI): the smallest number of
individual animals necessary to account for all of the remains of a taxon in an archaeological
assemblage (Reitz & Wing 2008). While NISP (number of identified specimens) is sometimes
preferred for inter-assemblage comparisons (Lyman 2008), this measure was not reported for the
majority of assemblages under consideration here. Initially assemblages were selected for analysis
only if MNI were reported for all classes of fauna represented at the site. However this did not
provide sufficiently large datasets for some time periods in each study area, and additional

8
assemblages for which some taxa were noted as present but not quantified were also included. All the
taxonomic identifications, MNI values and presence data utilised in this study, along with the data
sources that they were drawn from, are reported in detail by Smith & James-Lee (2010).
With regard to chronology, the primary requirement was for radiocarbon determinations that closely
dated formation of the occupation deposit from which the faunal sample under analysis derived. All
dates reported in publications were treated according to protocols that are set out in detail elsewhere
(Smith 2010). In brief these involved checking data accuracy; culling dates that did not meet sample
suitability criteria (Anderson 1991, Petchey 1999, Schmidt 2000a); recalibration using the SH04
calibration curve (McCormac et al. 2004) for terrestrial samples, and for marine samples the Marine
04 calibration curve (Hughen et al. 2004) with delta R set at -7±45, as recommended by the Waikato
Radiocarbon Dating Laboratory (Petchey pers. com.); and, where appropriate, combining multiple
determinations from the same context into pooled mean ages (Ward & Wilson 1978). The 126
admissible dates and 29 pooled mean ages employed in this study are reported in Smith & James-Lee
(2010).
Together the selection criteria admitted a total of 107 assemblages from 67 sites for analysis. For the
Greater Hauraki area a total of 75 assemblages from 48 sites were included and 32 assemblages from
19 sites in the Otago-Catlins area (Figure 1). In order to provide data relevant to Taking Stock’s ca.
AD 1400, ca. AD 1550 and ca. AD 1750 time slices, and bearing in mind the uncertainties inherent in
radiocarbon dating, assemblages were grouped according to three broad period designations: Early
(ca. AD 1250–1450), Middle (AD 1450–1650), and Late (AD 1650–1800). Assemblages were
allocated to time periods using Smith’s (2010) protocol which uses both 1σ and 2σ calibrated age
ranges to distinguish those that can be assigned with confidence to a discrete period from those that
overlap the period boundaries. On this basis almost two thirds of the assemblages were assigned to
one of the target periods, and the remainder to one of the two overlap zones (Table 1). Although the
latter do not represent discrete time spans, they usefully group assemblages that cluster in age around
the arbitrary period boundaries, and for assessment of general trends in faunal assemblage
composition during the initial steps of the analysis described below (2.3.1, 2.3.2) they are used as if
they were discrete periods. However estimation of the magnitude of Maori marine harvest was
undertaken only for the three formal periods.
2.2 Analytical Method: Overview
Estimates of the magnitude of marine biomass removals by people in the prehistoric past are
necessarily speculative, as they depend upon variables that cannot be known with precision. However
it is possible to deduce reasonable bounds for these, and thereby constrain the limits of speculation.
The approach used here builds upon that employed by Leach (2006: 277-279) to calculate the scale of
the Maori snapper fishery in Northland. It has been adapted to incorporate the full range of marine
taxa harvested by Maori in each study region. There were three major steps involved in this analysis
(Figure 2).
1. The archaeological assemblage data discussed above were scrutinized to establish the range of animal species harvested by Maori in each study area during each study period, the relative
frequencies with which this occurred, and proportional contributions of each species to the total
energy harvest from animals.
2. The scale of the total energy harvest from animals during each period in each study area was approximated by estimating the size of the human population, the energy required to sustain them,
and the proportion of this derived from animal foods.
9
3. The number of each marine animal species required to contribute the proportions derived in (1) to the total energy harvest from animals estimated in (2) was calculated using an estimate of the
calorific value of meat derived from an individual of the species concerned.
Each of these steps is discussed further below.
2.3 Analysis of archaeological data
Although the final outputs of this project concern the harvesting of marine animals, preliminary
analysis of archaeological data incorporated both marine and terrestrial fauna, as it is necessary to
reconstruct the contributions of all sources of food in pre-European Maori diet in order to apply the
model described above. Archaeological data from each time period in each study area were analysed
in five steps.
2.3.1 Determining the range of species harvested.
The species of animals harvested was established by summarising the full suite of assemblages in
each area/period data set. This enabled incorporation of taxa represented only in assemblages for
which quantified data were incomplete. The proportion of assemblages in which each species was
represented during each study period was calculated to provide the broadest level analysis of changes
in harvest patterns over time. Analysis of these data disclosed taxa that are likely to be either under-
or over-represented in quantified archaeofaunal samples, and also highlighted variations in species
representation between sites of different functional types, both factors relevant to defining overall
regional patterns. Further details and results of this analysis are presented elsewhere (Smith in press).
2.3.2 Determining the frequency with which species were harvested.
The frequency with which species were harvested was investigated through analysis of the data sets
quantified via MNI. This is a derived measure, and presents some difficulties as variations in
calculation methodology can influence data outputs, especially when, as here, information is drawn
from a range of different researchers (Reitz & Wing 2008). However it was the only measure
available for a wide range of assemblages, and the only one from which estimates of harvested
biomass across all classes of fauna could be generated. The uncertainties that this introduces into
calculations are considered further below (Section 2.3.5).
MNI for each assemblage were first subdivided into seven faunal classes (fish, shellfish, marine and
coastal birds, marine mammals, moas, smaller terrestrial birds, and terrestrial mammals) and %MNI
within each class calculated. This procedure provides a much finer-grained assessment of within-class
frequency than is possible when assemblages are treated as a whole, due to wide variations in faunal
class abundance between sites of different functional types, such as specialised shell fishing camps or
generalised occupation sites (Smith in press).
Mean %MNI across all assemblages in each period/area data set were then calculated. For two data
sets (Greater Hauraki, Middle/Late and Late period marine/coastal birds) comprising a small number
of assemblages with low species MNI, %sum MNI was preferred as a better estimate of relative
abundance. Where the taxa list for a period/area set included imprecisely identified taxa (e.g.
Phalacrocorax melanoleucos?; Trachurus ?sp.; ‘elephant seal or leopard seal’; etc.) in addition to
positively identified species of the same sort(s), frequencies for the former were redistributed to the
latter. Where the latter included more than one positively identified species, their relative abundance
was factored into the redistribution so as to maintain proportionality of positively identified taxa.

10
For several data sets adjustments were made to incorporate taxa known to be present from analysis in
2.3.1 above, but not present in the quantified samples. This was required for all classes of fauna for
the Middle period in Otago-Catlins for which there were only two study assemblages, neither having
quantified data. In these cases the average of mean %MNI in each of the adjacent overlap periods
(Early/Middle, Middle/Late) was calculated for the species noted as present in the Middle period
assemblages, and the resulting values were adjusted so that each faunal class summed to 100%. For
the Middle period in Greater Hauraki none of the assemblages, quantified or otherwise, yielded
marine or coastal birds, but as argued elsewhere (Smith in press) this is more likely to reflect
sampling variation than lack of harvesting. For the present analysis, the range of species represented
in the subsequent overlap period (Middle/Late) was utilised, with their frequency derived from the
average of mean %MNI in the Early/Middle and Middle/Late overlap periods, adjusted to total 100%.
Finally, adjustments were made to the Late period frequencies for marine/coastal bird in both study
areas where Diomedeidae appeared to be over-represented through bones from beach wrecks being
collected as raw material for artefact manufacture (Smith in press). Comparison with earlier periods
suggests remains of this family are about twice as common as expected, and on this basis %MNI for
species in this family were reduced by half and all other taxon frequencies increased proportionately.
The adjusted %MNI values for each taxon are referred to as taxon frequencies when incorporated in
subsequent steps of the analysis. Values for the Early, Middle and Late periods in each study area are
listed in Appendix 1.
2.3.3 Determining the energy yield per species in study assemblages
The importance of each species as a source of energy in the human diet was evaluated for each
assemblage using procedures set out in detail elsewhere (Smith 2011). In brief this involved
converting the frequency of each species in an assemblage first to the weight of meat that they
represented and then to the calorific value of energy that this would produce (Figure 3).
For smaller-sized classes of fauna it was presumed that all usable meat on each animal would have
been available for consumption, and MNI were used as the starting point for calculation. Mean adult
body weights, and a conservative estimate of the proportion likely to have been usable meat in the
prehistoric New Zealand setting were used to generate meat yields, and data from proximate
composition analysis for the species concerned or the nearest comparable taxon were used to derive
calorific yields. Details of the values adopted for each species, the rationale for their selection, and the
sources that they are drawn from are given elsewhere (Smith 2011).
For larger-sized animals, archaeological evidence frequently discloses only partial carcass
representation, hence assuming that complete animals were present risks over-estimating their dietary
importance. Except where skeletal element representation in an assemblage indicated that a complete
or near complete individual was present, species frequency for the larger animal classes was measured
in terms of the minimum number of butchery units (MNBU): the smallest number of butchery units
necessary to account for all of the remains of a taxon in an archaeological assemblage. Age and sex
related size differences are also relevant to accurate estimation of dietary importance in large animals,
and where adequate data were available for archaeological remains (in the present context, only for
some seal species) these were incorporated into calculations (Smith 2011).
These procedures were applied to the subset of study assemblages with quantified data for all classes
of fauna. In each case the proportion of total energy from animals (%Kcal) derived from each of the
seven major classes of fauna was calculated, and incorporated into the following step.

11
2.3.4 Determining the relative energy yields of each faunal class per area/period
The relative contributions to the energy harvest from each faunal class during each formal period (i.e.
Early, Middle, Late) in each study area was estimated from mean energy contributions (%Kcal) of
each major faunal class in either the total area/period data set, or a subset thereof. A series of
adjustments were then made to each set of calculated values to take account of probable under-
representation of some classes of fauna. Both the rationale for the selection of most appropriate data
suites and justification for subsequent adjustments are discussed in detail in a manuscript currently in
preparation (Smith n.d.). Key elements of these are summarised below.
For the Early period in both study areas all the sample sites appear to have been villages at which a
wide range of subsistence activities were represented, indicating that the best estimate of the relative
importance of each faunal classes could be derived from its mean %Kcal in the total data set for each
area. Sites from the Middle period in Greater Hauraki included a small number of generalised village
sites along with a greater number of specialised shellfish gathering and/or fishing camps. Most of the
latter represented comparatively small volumes of food energy, and if incorporated directly into an
area/period average would over-estimate the importance of shellfish and fish. The best estimate for
this period was drawn from the mean %Kcal of the five largest assemblages, which included two
villages and three short-term camps. For the Middle period in Otago-Catlins, which had no quantified
data sets, mean %Kcal for each of the two adjacent overlap periods were averaged to provide a best
estimate. Quantified assemblages from the Late period in both study areas were relatively few in
number, of greatly unequal sizes and did not well represent the expected range of site types. The
addition of Middle/Late overlap period assemblages largely resolved these problems, hence the best
estimate for the Late period in each study area was derived from mean %Kcal of all Middle/Late and
Late assemblages.
Adjustments were made to the calculated values for each area/period so that they would better
represent the overall makeup of human dietary patterns. These are summarised below.
1. Due to the coastal location of nearly all study sites, it is likely that terrestrial animals exploited by the Maori communities of each study area are under-represented. It is difficult to estimate the
magnitude of this as there are as yet no comprehensive analyses of energy yields per taxa at
inland sites. A semi-quantitative analysis of relative frequencies of the main faunal classes in
Early period sites in the southern South Island (Anderson 1982: Table 5) shows that when inland
sites are added to those on the coast, the weighted abundance of terrestrial taxa increases by about
7%. In view of the generally lower energy yields from terrestrial animals compared to those from
the sea, a lower value was used here, and 5% was added to the total calculated value for terrestrial
animals, distributed proportionately to each component (moas, terrestrial birds, terrestrial
mammals), and 5% deducted from the total for marine animals, subtracted proportionately from
each component (fish, shellfish, marine and coastal birds, marine mammals).
2. While marine mammals were totally absent from the study assemblages from the Middle and Late periods in Greater Hauraki, analysis in 2.3.1 showed that small numbers of dolphins had almost
certainly been exploited. To accommodate this 0.05% of total Kcal was transferred from fish to
marine mammals in those two data sets.
3. Both marine/coastal and terrestrial small birds appear to be under-represented in the archaeological record, especially after the Early period, with the most likely explanation relating
to the manner in which bird carcasses were processed for preservation and transport (Smith in
press). There is as yet no quantified measure of the magnitude of under-representation, and the
values used here are estimates. The calculated values for marine/coastal and terrestrial small birds
were increased by 1% in Early period assemblages and 1.5% in Middle and Late period

12
assemblages, with equivalent amounts subtracted from the marine and terrestrial components with
the highest values. This adjustment was not applied to the Otago-Catlins Late period
marine/coastal birds, which were already well represented in the calculated value.
4. Dogs appeared to be under-represented in the Early period data sets from both study areas, with relative frequencies lower than those reported for other sites of this age (Allo Bay-Petersen 1979;
Clark 1995). On current data it is difficult to quantify the impact of this on relative energy yields
and an arbitrary value of 1% is used here, with this proportion of total Kcal transferred from the
moa component to terrestrial mammals.
5. Sharks and rays are almost certainly under-represented in the archaeological record due to poor survival of their predominantly cartilaginous skeletons, while ethnohistorical evidence indicates
that they were likely to have been a significant component of Late period Greater Hauraki Maori
fisheries (Smith in press). If at least one taxon from this class had been represented in each Late
period assemblage, the energy yield for fish would have been at least 4% higher than the
calculated values. On this basis, 4% of total Kcal was transferred from shellfish to fish.
6. Shellfish appear to have been under-represented in the Late period Otago-Catlins data set, with higher relative frequencies at sites not able to be included in the present study (Davies 1980). As
with dogs, it is difficult to quantify the extent of under-representation, and an estimate was
employed, with 2.5% of total Kcal was transferred from fish to shellfish.
Table 2 lists both the initial calculated values and final adjusted values for the Early, Middle and Late
Periods in each study area. The final adjusted values are referred to as faunal component energy
proportions when incorporated into subsequent steps of the analysis.
2.3.5 Calculating the contributions of each species to total energy harvested from animals
The contribution of each species to the total energy harvest from animal foods during each of the
three formal periods in each study area was calculated as follows (also see Figure 2).
a. Taxon frequencies determined in 2.3.2 were multiplied by energy yield per animal using the procedures described in 2.3.3 to derive an energy output per species. Note that for fur seals, these
calculations were undertaken by age-sex class, and that for Pilot whales, energy yield per animal
assumed that only 10% of available meat weight was consumed, following protocols established
elsewhere (Smith 1985, 2004).
b. The energy output for each species calculated in (a) was divided by the sum of energy outputs for all species represented within the major faunal component to which it belonged to determine the
proportion which that species contributed to total energy derived from that faunal component.
c. The proportional contribution of each species calculated in (b) was multiplied by the relevant faunal component energy proportion determined in 2.3.4 to derive a final proportional energy
contribution per species. The values calculated for each species are listed in Appendix 1.
Cumulative calculation errors involved in deriving the proportional energy contribution per species
were determined from estimates of the size of error associated with the three key input variables in the
calculation. The taxon frequencies were based upon MNI data, which have inherent uncertainty
(section 2.3.2) and calculated as means across variable sized sample sets of assemblages suggesting
an error of ± 5% is in order. Energy yields per individual animal were derived from a mean body

13
weight, an estimate of the proportion typically eaten, and a value for the energy yield per kg of flesh.
Each of these is likely to have varied due to a range of factors including the age, size and condition of
the animal concerned along with day-to-day variations in the butchery and consumption practices of
the communities harvesting the animals. Again, ± 5% is allowed for each component, giving a
cumulative error of ± 15% for the estimate of energy yield per animal. The faunal component energy
proportions were the most difficult to derive from the archaeological data because they involved
judgement about composition of an appropriate regional data set, and incorporated several
adjustments to calculated values to correct for perceived biases in the archaeological record. For these
an error of ± 10% is proposed. With the final proportional energy contribution per species derived
from the product of these three variables, an error of ± 30% should be applied to the calculated values.
2.4 Estimating the scale of the total energy harvest from animals
The scale of the total energy harvest from animals during the focal year of each period in each study
area was calculated from estimates of (a) the size of human population, (b) average energy needs per
person per day, and (c) the proportion of that energy derived from animal foods. There are
considerable uncertainties about these variables, described below, and different values for these
produce widely different totals for the estimate of total energy from animals. For these reasons an
attempt has been made to give a good indication of upper and lower limits as well as what is
considered a ‘best estimate’. Minimum estimates of total energy from animals use the lowest likely
values for (a), (b) and (c); maximum estimates use the highest acceptable values; while best estimates
are based on what are considered here to be the most well supported or realistic values. These values
are summarised in Table 3 and the rationale for their selection given below in sections 2.4.1 to 2.4.3.
2.4.1 Estimating the size of human population
The size of the human population is most reliably determined for the Late period (ca. 1750 AD) based
upon detailed analysis by Pool (1991) who gave a best estimate of ca. 100,000 for the total New
Zealand population in 1769, with ca. 90% of that in the North Island. It is estimated here that the
Greater Hauraki study area population was about 13.5% of the North Island total, based on Urlich’s
(1969) estimate that 5% were in Thames-Coromandel and 7% in Auckland, to which has been added
one tenth of the 15% she estimated for the whole of Northland. This yielded the best estimate value of
12 150. Minimum and maximum values were calculated using total North Island populations of 80
000 and 100 000 respectively, giving estimates for Greater Hauraki of 10 800 and 13 500. Anderson
(1998: 196–7) has estimated that in the early 19th century the population of Ngai Tahu in the southern
two thirds of the South Island was no more than 5000. Anderson’s analysis of the distribution of this
population, along with the distribution of Late period archaeological sites suggests a population at ca.
1750 AD for Otago-Catlins of about 1800, with ± 200 allowed for minimum and maximum estimates.
Population estimates for the Early period (ca. 1400 AD) are based on the likelihood that the initial
colonising population would have grown rapidly from a founding population of ca. 300-500 at 1280
AD increasing exponentially at rates in the order of 2% to 3.5% per annum. This would give
nationwide totals of at least 4000, and possibly up to 20 000 by 1400 AD, with the best estimate
towards the upper end of this range. Based on what is known of the nationwide distribution of Early
period archaeological sites, it is estimated that this population was more or less evenly distributed
between the North and South Islands, and about a quarter of the North Island total was in Greater
Hauraki. This gives minimum, best and maximum estimates of 500, 2000 and 2500. Likewise, it is
likely that about a quarter of the South Island population were in Otago-Catlins. The same minimum
and maximum estimates used for Greater Hauraki have been adopted, but a slightly lower best
estimate of 1800.

14
For the Middle period (ca. 1550 AD) in Greater Hauraki population size was estimated using the
trend line for population growth in prehistoric New Zealand indicated by cumulative frequency of
radiocarbon dates, adjusted for calibration stochastic distortion effect (McFadgen et al. 1994: Figure
3). This suggests that at ca. 1550 AD the population would have reached about 90% of its ca. 1750
AD level (Figure 4). This factor was applied to the North Island population estimates for the Late
period given above, giving a minimum of 72 000, best estimate of 80 000, and a maximum of 90 000.
The proportion of these within Greater Hauraki is difficult to assess, but a range of values were used
here; 8.5% for the minimum estimate, 12.6% for the best estimate, and 13% for the maximum; giving
population estimates of 6100, 10 200 and 11 700.
It is widely recognised that the population in southern New Zealand took a much lower trajectory,
perhaps even declining after the Early period (Jacomb et al. 2010, McGlone et al. 1994). Examination
of the median ages of radiocarbon dated study assemblages from Otago-Catlins used in this study
supports this view (Figure 4), although it needs to be noted that both there are additional dated sites
from both Middle and Late periods that were excluded from the present study because they lacked
fully identified and/or quantified fauna. The best estimate used here (1800) assume that the population
at ca. 1550 AD was no greater than at ca. 1400 AD, while the maximum estimate (2600) is slightly
higher than that of the earlier period and the minimum estimate (500) maintains the same lower limit
as at ca. 1400 AD.
2.4.2 Estimating average energy needs per person per day
The daily energy requirements of a person depend upon a wide range of factors including gender,
body weight, activity levels and the energy demands of the environmental conditions in which they
live. The estimates used here are drawn from data compiled and reviewed in detail elsewhere (Leach
2006, Leach et al. 1996) which focused explicitly on determining an appropriate range for prehistoric
populations in the Pacific and New Zealand. For Greater Hauraki the minimum value (1800) is that
accepted by Leach et al. (1996: 24) as the lowest viable for a 70 kg woman with low activity levels.
The best estimate (2150) is the mean value suggested for pre-European Maori by Leach (2006: 277).
The maximum (2172) is the midpoint between that mean and the value derived by stochastic
modelling of pre-European diet in the Chatham Islands (Leach et al. 2003), where the environmental
conditions are likely to have placed greater energy demands on individuals than was the case in
Greater Hauraki.
Values adopted for Otago-Catlins are set slightly higher to accommodate the greater energy demands
of a colder climate. The minimum value (2150) is Leach’s mean for pre-European Maori; the best
estimate (2172) is the value adopted above for the upper limit in Greater Hauraki; and the maximum
value (2193) is that derived for the Chatham Islands.
2.4.3 Estimating the proportion of energy derived from animal foods
Estimates of the proportion of the total energy consumed by people that derived from animal foods
are based upon analysis of δ13C, δ
15N and δ
34S isotopes from the small number of archaeologically-
derived samples of human bone collagen thus-far analysed from the Pacific region (Leach et al. 2000,
Leach et al. 2003). These exhibit wide variation: the lowest value (0.4) is from Watom Island in the
tropical Pacific with a horticultural and fishing economy; a moderately high value (0.66) derives from
Wairau Bar, South Island New Zealand, where horticulture was combined with hunting of large
animals; and the highest value (0.9) is from the Chatham Islands where subsistence relied upon
hunting, fishing and the gathering of wild plants.
15
In Greater Hauraki archaeological data for the Middle and Late periods indicate an economy based on
horticulture, fisheries and a very modest level of hunting (Smith in press, Smith n.d.). On this basis
the Watom and Wairau Bar values are adopted for minimum and maximum values respectively, and
the mid-point between these is used for the best estimate. Archaeological data for the early period
indicate a much greater reliance on hunting, hence the Wairau Bar value is adopted for the best
estimate, with midpoints between that and each of the higher and lower measured values used for
minimum and maximum estimates.
The Otago-Catlins region was beyond the growing limits for pre-European horticultural crops, with
wild plant foods contributing to a diet that archaeological data indicates relied heavily on both hunting
and fishing throughout the prehistoric sequence (Smith in press, Smith n.d.). On this basis a single set
of values is used for all periods with the Wairau Bar and Chatham Islands values adopted for the
minimum and maximum estimates respectively, and the midpoint between these used as the best
estimate.
2.4.4 Calculating total energy harvest from animals
Estimates for the total energy harvest (Kcal) from animals in each study area during each of the target
years (1400 AD, 1550AD, 1750) were calculated as follows. The estimate of human population size
was multiplied by the estimated energy needs per person per day, which was multiplied by 365 to
determine the total energy needs for the year, and this was then multiplied by the estimated proportion
of energy derived from animal foods. In doing this minimum input values were combined to produce
minimum estimates, and likewise for best and maximum values. Calculated values, referred to as
energy from animals, are shown in Table 4.
2.5 Estimating the number and biomass of marine animals harvested
The final step of analysis involved using the variables and values calculated or estimated in the
preceding sections to estimate the number and biomass of animals harvested during the focal year in
each study area. This was undertaken in three steps.
a. The proportional energy contribution per species (2.3.5) was multiplied by the energy from animals (2.4.4) to derive the total energy harvested from that species.
b. Total energy harvested from species was divided by the energy yield per individual of that species (2.3.3) to determine the number of animals harvested.
c. The number of animals harvested was multiplied by the mean body weight per individuals of that species (2.3.3) to determine the biomass harvested.
The estimated cumulative error (± 30%) in calculating proportional energy per species was applied to
the number and biomass estimates (b and c), with uncertainties about the scale of the energy harvest
from animals expressed in the minimum, best and maximum estimates. Results of this are presented
below.
3. RESULTS
Analysis of the archaeological study assemblages demonstrated that at least 210 marine or coastal
species had been harvested by Maori in Greater Hauraki (147 shellfish, 35 fish, 22 birds, 6 mammals),
and at least 159 in Otago-Catlins (90 shellfish, 32 fish, 30 birds, 7 mammals). Estimates made of the

16
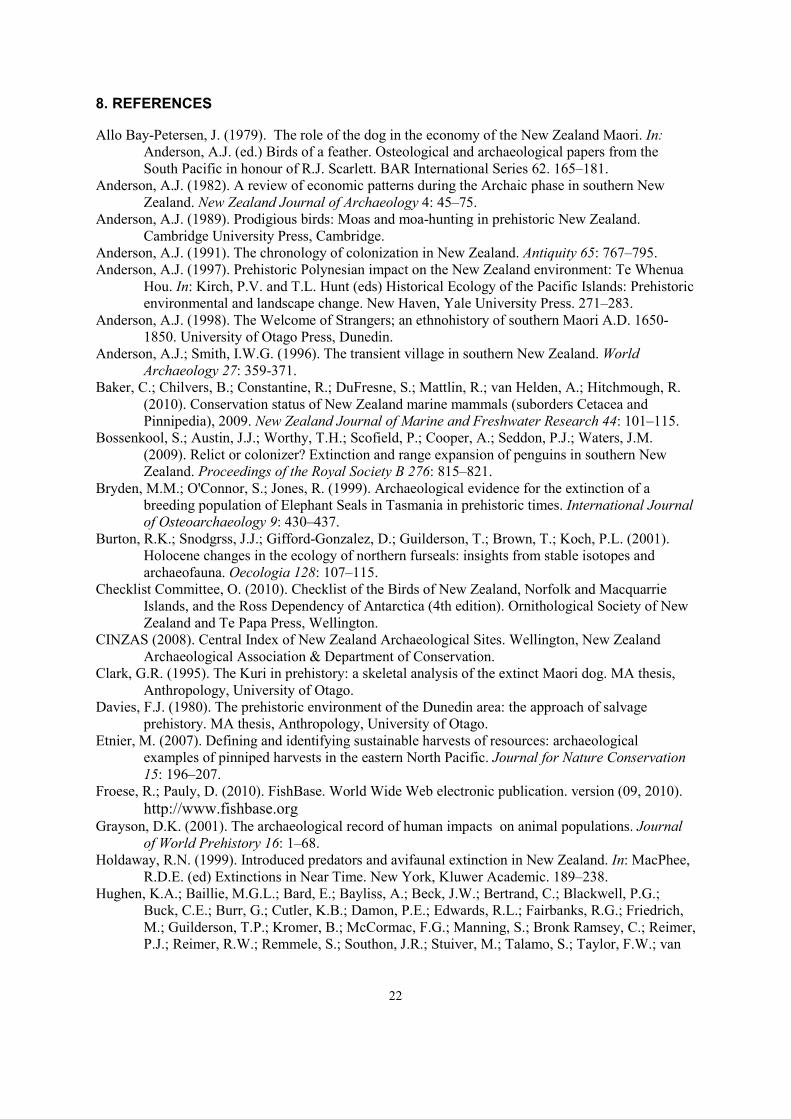
number and biomass harvested from each of these are presented in Tables 5 – 28. Within each of
these tables taxa are arranged by systematic order after the following authorities: for fish, Froese &
Pauly (2010); shellfish, Spencer et al. (2009); birds, Checklist Committee (OSNZ) (2010); and
mammals, Baker et al. (2010). This enables placement of taxa identified only to genus or higher
levels, and those less securely identified, alongside the positively identified species to which they are
most closely related. Common names for taxa in these tables are listed in Appendix 1. For shellfish
the tables list individually only the 22 species with highest harvested biomass in each area/period with
the remainder grouped as ‘all others’. In the following presentation of results, only the best estimate
values are used in text; minimum and maximum can be found in the Tables. The latter exhibit parallel
trends to those identified using the best estimate values.
3.1 Fish
3.1.1 Greater Hauraki
A total of 35 fish taxa are recorded archaeologically as harvested by Maori in Greater Hauraki. These
included some genus, family or higher level groupings necessitated by the nature of archaeological
data: it is virtually impossible to identify the various species of Labridae on the basis of skeletal
morphology, so they are treated as a single family group; Anguilla species are also indistinguishable,
so are treated as a genus group; Carangidae are often difficult to distinguish, and only sometimes
identified to species level; and the poor survival of elasmobranch remains frequently precludes
specific identification.
At ca. 1400 AD 22 of these taxa were included in a total fish harvest best estimated at 128.5 ± 44.3
tonnes (Table 5). The taxonomic range narrowed to 16 at ca. 1550 AD in a total harvest of 2328.2 ±
698.5 t (Table 6). By ca. 1750 AD, the total fish take of 2607.1 ± 782.1 t was drawn from 15 taxa
(Table 7).
Snapper (Pagrus auratus) were the largest single contributor to the fish harvest at each time period,
rising from 72.0 ± 21.6 t to 938.8 ± 281.6 t and then 997.2 ± 299.2 t, although as a proportion of total
harvested fish biomass this represents a falling trend from 56% to 40% then 38%. At ca. 1400 AD
only three other taxa other than snapper made up significant proportions of harvested biomass;
kahawai (Arripis trutta) 19.2 ± 5.8 t (15%), wrasses (Labridae) 13.5 ± 4.0 t (10.5%), and leatherjacket
(Meuschenia scaber) 11.3 ± 3.4 t (8.8%). At ca. 1550 AD there were four main contributors to
harvested biomass in addition to snapper; sharks (Carcharhiniformes) not positively identified to
species, 511.4 ± 153.4 t (22%); horse mackerel (Trachurus novaezelandiae), 323.1 ± 96.9 t (13.9%);
kahawai, 227.9 ± 68.4 t (9.8%); and barracouta (Thyrsites atun) 169.3 ± 50.8 t (7.3%). The harvest of
wrasses (23.1 ± 6.9 t) was now only 6.9% of the total, while leatherjackets were not represented in
any of the study sites from this era. At ca. 1750 AD the harvested biomass of sharks not positively
identified to species (959 ± 287.8 t, 36.8%) was almost equal to that of snapper, and would just
outstrip it if combined with the 39.9 ± 12 t identified as from northern dogfish (Squalus blainvillei).
The eagle ray (Myliobatis tenuicaudatus) was the only other significant component of the fishery at
ca. 1750 AD, contributing 319.3 ± 95.8 t (12.2%).
1.1.2 Otago-Catlins
A total of 32 taxa were identified in study sites from the Otago-Catlins region, including the genus
and higher-level groupings noted for Greater Hauraki, along with Nototheniidae, as it is difficult to
distinguish various species of black cods on skeletal morphology.

17
In total 22 of these taxa were included in a total fish harvest best estimated at 78.3 ± 23.5 t at ca. 1400
AD (Table 8). The taxonomic range narrowed to 14 at ca. 1550 AD in a total harvest of 797.5 ± 239.3
t (Table 9). By ca. 1750 AD, the total fish take of 725.1 ± 217.5 t was drawn from 9 taxa (Table 10).
Barracouta (Thyrsites atun) formed the largest part of harvested fish biomass at each time period,
contributing 43.2 ± 13.0 t (55.2%) at ca. 1400 AD, 361.4 ± 108.4 t (45.3%) at ca. 1550 AD, and 363.3
± 109.0 t (50.1%) at ca. 1750 AD. Three further species made important contributions to harvested
biomass at ca. 1400 AD; ling (Genypterus blacodes) 7.8 ± 2.3 t (9.9%), hapuku (Polyprion oxygenios)
7.7 ± 2.3 t (9.8%), and red cod (Pseudophycis bachus) 6.8 ± 2.0 t (8.7%). The same three species
were the major components in addition to barracouta at ca. 1550 AD, although in differing order;
hapuku 141.0 ± 42.3 t (17.7%), red cod 128.3 ± 38.5 t (16.1%), and ling 68.2 ± 20.5 t (8.5%). This
order was maintained at ca. 1750 AD; hapuku 230.9 ± 69.3 t (31.8%), red cod 68.4 ± 20.5 (9.4%), and
ling 56.8 ± 17 t (7.8%).
3.2 Shellfish
3.2.1 Greater Hauraki
The archaeological study sites provided records of 147 shellfish taxa harvested by Maori in the
Greater Hauraki region, with 31 of these being identifications only to genus or family level leaving
the possibility that the total number of species may have been slightly more than this. Of these taxa,
88 were represented in the estimated harvest of 6.6 ± 2.0 t at ca. 1400 AD (Table 11), 66 in the
estimate of 1736.3 ± 520.9 t at ca. 1550 AD (Table 12), and 38 in the estimate of 2294.7 ± 688.4 t at
ca. 1750 AD (Table 13).
Three species dominate the shellfish biomass harvested at ca. 1400 AD, making up two thirds of the
total; paua (Haliotis iris) 2.2 ± 0.7 t (34%), cats eye (Lunella smaragdus) 1.2 ± 0.4 t (18.2%), and
green-lipped mussel (Perna canaliculus) 0.9 ± 0.3 t (14.3%). At ca. 1550 AD two species made up
more than 84% of the total biomass harvested: cockle (Austrovenus stutchburyi) 1103.2 ± 331.0 t
(63.5%), and pipi (Paphies australis) 358.2 ± 107.5 t (20.6%). Of the three formerly dominant species
(paua, cats eye and green lipped mussel), only cats eyes at 5% made a notable contribution with the
others providing less than 0.1% of harvested biomass. The same two species, cockle and pipi
continued to dominate the shellfish harvest at ca. 1750 AD as they did at ca. 1550; cockle providing
1358.0 ± 407.4 t (59.2%), and pipi 594.5 ± 178.4 t (25.9%). Tuatua (Paphies subtriangulata) with
250.5 ± 75.2 t (10.9%) was the only additional species at ca. 1750 to provide more than 1 % total
biomass harvested.
3.2.2 Otago-Catlins
The shellfish identified from study sites in Otago-Catlins include 90 taxa, including 25 identifications
to only to genus or family level. At ca. 1400 AD 55 taxa were represented in the total shellfish harvest
estimated at 9.1 ± 2.7 t (Table 14), with just 12 taxa in the estimated 43.0 ± 12.9 t harvested at ca.
1550 AD (Table 15), but 29 were included in the estimated harvest of 51.4 ± 15.4 t at ca. 1750 AD
(Table 16). The reduced taxonomic range at ca. 1550 is almost certainly due to the restricted sample
of study sites available for that time period; ten study assemblages were available for ca. 1400 AD
and nine for ca. 1750 AD , but only two for ca. 1550 AD.
At ca. 1400 AD four species made up 82.4% of the total harvested biomass; cockle (Austrovenus
stutchburyi) 2.4 ± 0.7 t (26.9%), paua (Haliotis iris) 2.3 ± 0.7 t (24.8%), blue mussel (Mytilus
galloprovincialis) 1.5 ± 0.5 t (16.6%), and pipi (Paphies australis) 1.3 ± 0.3 t (14.1%). Two of these
four species also dominate harvested shellfish biomass at ca. 1550 AD; blue mussels providing 16.1 ±

18
4.8 t (37.4%), and paua 14.2 ± 4.3 t (33%). Mudsnails (Amphibola crenata) added another 4.2 ± 1.3 t
(9.8%), cockles 2.3 ± 0.2 t (5.4%), and pipi 1.7 ± 0.5 t (4%) to the total harvested biomass in ca. 1550
AD. At ca. 1750 AD the rank order of the two leading shellfish species reverses; paua yielding 35.1 ±
10.5 t (68.4%), and blue mussels 8.2 ± 2.5 t (15.9%). None of the other previously important species
contributed more than 2.5% of total harvested biomass at ca. 1750 AD.
3.3 Marine and Coastal Birds
3.3.1 Greater Hauraki
A total of 22 marine and coastal bird species were positively identified in the study sites from Greater
Hauraki, along with identifications to five higher-level taxonomic groupings. Twenty two taxa were
represented in the estimated harvest of 19.2 ± 5.8 t in ca. 1400 AD (Table 17). Only seven taxa were
among the harvest of 28.3 ± t at ca. 1550 AD (Table 18), while at ca. 1750 AD there were ten in the
56.2 ± 16.9 t harvested (Table 19).
At ca. 1400 AD four taxa together made up 70.1% of the biomass harvested from marine and coastal
birds; little penguin (Eudyptula minor) 4.7 ± 1.4 t (24.4%), spotted shag (Stictocarbo punctatus) 4.0 ±
1.2 t (20.7%), albatrosses (Diomedeidae) 2.5 ± 0.8 t (13.2%), and pied shag (Phalacrocorax varius)
2.3 ± 0.7 t (11.9%). Three of these taxa together yielded 90.2% of the harvested biomass in ca. 1550
AD; albatrosses 17.6 ± 5.3 t (62.2%), little penguin 5.1 ± 1.5 t (185), and spotted shag 2.8 ± 0.8 t
(10%). At ca. 1750 AD the same three taxa provided 71.6% of the harvested biomass; albatrosses
17.6 ± 5.3 t (31.3%), spotted shag 14.1 ± 4.2 t (25%), and little penguin 8.6 ± 2.6 t (15.3%).
3.3.2 Otago-Catlins
Thirty taxa of marine and coastal birds species were identified in the study sites from Otago Catlins.
These include penguins listed as Megadyptes sp. as virtually all were identified prior to recent
separation of the smaller extinct Waitaha penguin (M. waitaha) from the larger extant yellow-eyed
penguin (M. antipodes) (Bossenkool et al. 2009). The date at which the former replaced the latter in
the study area is not yet clearly known. At ca. 1400 25 marine and coastal bird taxa formed part of a
total estimated harvest of 32.1 ± 9.6 t (Table 20). Only sixteen were among the harvest of 46.9 ± 14.1
t in ca. 1550 AD (Table 21), while 18 contributed to the 80.3 ± 24.1 t harvested in ca. 1750 AD
(Table 22).
At ca. 1400 AD four species made up 76% of the total biomass harvested from marine and coastal
birds; Megadyptes, at this time almost certainly the waitaha penguin, 8.8 ± 2.6 t (27.2%), Fiordland
crested penguin (Eudyptes pachyrhynchus) 8.5 ± 2.5 t (26.4%), white-capped albatross (Thalassarche
cauta) 4.7 ± 1.4 t (14.5%), and little penguin (Eudyptula minor) 2.5 ± 0.8 t (7.8%). Five taxa,
including the four above, made up 74% of the biomass harvested at ca. 1550 AD; spotted shag
(Stictocarbo punctatus) 9.9 ± 3.0 t (21%), white-capped albatross 6.9 ± 2.1 t (14.6%), Megadyptes sp.
penguin 6.8 ± 2.1 t (14.6%), Fiordland crested penguin 5.8 ± 1.8 t (12.5%), and little penguin 5.3 ±
1.6 t (11.3%). At ca. 1750 AD the leading four taxa contributed 67.9% of the total biomass harvested;
white capped albatross 20.6 ± 6.2 t (25.6%), Stewart Island shag (Leucocarbo chalconotus) 15.1 ± 4.5
t (18.8%), spotted shag 9.9 ± 3.0 t (12.3%), and Megadyptes, by this time probably yellow-eyed
penguin, 9.0 ± 2.7 t (11.2%).
19
3.4 Marine Mammals
3.4.1 Greater Hauraki
At least five marine mammal taxa are recorded as part of the Maori marine harvest in Greater
Hauraki. These include the fur seal (Arctocephalus forsteri), sea lion (Phocarctus hookeri) and
elephant seal (Mirounga leonina), along with at least one species of pilot whale (Globicephala) and
dolphins that have not been identified to species level.
All these taxa were represented in the total harvest estimated at 414.5 ± 124.3 t in ca. 1400AD (Table
23). Fur seals made up the largest part of this, 284.9 ± 85.5 t (68.7%), followed by sea lions, 63.4 ±
19.0 t (15.3%), and pilot whales, 57.5 ±17.3 t (13.9%). By ca. 1550 AD the total harvest had fallen to
1.79 ± 0.54 t, derived entirely from dolphins (Table 24). Dolphins were also the sole contributor to the
marine mammals harvest of 2.13 ± 0.64 t in ca. 1750 AD (Table 25).
3.4.1 Otago-Catlins
The archaeological record shows that at least eight marine mammal taxa were harvested in Otago-
Catlins, including the fur seal (Arctocephalus forsteri), sea lion (Phocarctus hookeri), elephant seal
(Mirounga leonina), leopard seal (Hydrurga leptonyx), at least one species of pilot whale
(Globicephala) and dolphins that include the common dolphin (Delphinus delphis) and Hectors
dolphin (Cephalorhynchus hectori). The latter are treated here as a single group as the majority of
dolphin remains have not been identified to species level.
At ca. 1400 AD five taxa were included in the total harvest of 371.3 ± 111.4 t (Table 26). This was
dominated by two species; fur seals providing 237.0 ± 71.1 t (63.8%), and sea lions 126.2 ± 37.8 t
(34%). Four of the same taxa, plus another, made up the considerably smaller harvest of 144.5 ± 43.4
t at ca. 1550 AD (Table 27). Fur seals, at 103.3 ± 31 t (71.5%), and sea lions, at 47.2 ± 11.2 t (25.8%),
were again dominant at ca. 1550 AD. At ca. 1750 AD the total harvest had fallen further to 121.6 ±
36.5 t derived from just three taxa (Table 28). The main contributors to the total harvested biomass at
ca. 1750 AD were fur seals, at 77.0 ± 23.1 t (63.4%), and pilot whales at 44.0 ± 13.2 t (36.2 %).
4. DISCUSSION
There has been only one previous attempt to calculate the numbers and biomass of marine animals
harvested by Maori, and this was concerned solely with the numbers of snapper harvested at ca. 1769
in the Northland region (Leach 2006). This utilised an analytical method broadly similar to that
employed here, but with some differences in input values. Leach’s estimate of 1919 ± 1612 t of
snapper harvested for the whole of Northland is almost exactly double that given by the best estimate
here for the Greater Hauraki region. The latter has a coastline approximately half the length of the
Northland region, suggesting that the methods produce broadly comparable results.
One of the major difference between the two approaches is the use here of minimum, best and
maximum estimates to provide a narrower band of greatest likelihood within the necessarily wide
error margins that must apply to calculations this sort. The differences between the minimum, best
and maximum estimates of harvested biomass are illustrated for snapper in the Greater Hauraki region
(Figure 5), which shows that at ca. 1750 AD the upper end of the error limit for the maximum
estimate is 4.6 times greater than the lower error limit for the minimum value. As noted in section 2.4
the extent of these differences is driven largely by the choice of values selected for human population
size, daily energy requirements and proportion derived from animals. While values considered most
likely to reflect the situation in each study area at each focal date were employed for calculation of the

20
best estimates, these still need to be considered with some caution and are best viewed as indicators of
the order of magnitude of Maori harvests, rather than precise descriptors.
In both study areas the total biomass harvested for three of the four major classes of fauna increased
over time, with only marine mammals exhibiting a declining trend (Figure 6). In Greater Hauraki this
can be attributed partly to growth of the human population, for which the best estimate at ca. 1750
AD is 6.1 times greater than that at ca. 1400 AD. However both the fish and shellfish harvests
expanded at considerably greater rates than this (20.3 and 347.7 times respectively). The primary
driver of this was the need for Maori to compensate for the loss of two major sources of food
following the extinction of moa and extirpation of fur seals and sea lions from northern New Zealand
between 1400 and 1550 AD (Schmidt 2000b, Smith 2005). Fish and shellfish have significantly lower
energy yields per kilogram than the animals they were replacing, further increasing demand upon
these fisheries. The harvest of marine and coastal birds expanded at less than half the rate of human
population growth, indicating an overall diminution of their part in the human diet, which is likely to
reflect reduced availability through both hunting pressure and the impact of introduced mammalian
predators (Holdaway 1999, Smith in press).
Otago-Catlins provides an even clearer demonstration of the replacement process, as the best
estimates of human population postulate no growth between ca. 1400 and ca. 1750 AD. Over the
same period fish and shellfish harvests expanded by 9.9 and 5.6 times respectively, while the marine
mammal harvest fell to a third of its initial level. In this case the modest growth in the harvest of
marine and coastal birds indicates that they played an increasingly important part in human diet over
time. This divergence from the pattern observed in Greater Hauraki may reflect the important role that
growth of the human population played in depleting marine and coastal bird resources in the latter
area.
There is a strong trend through time in all four major classes of fauna from both study areas towards
exploitation of a narrower taxonomic range. The number of taxa within each class harvested at ca.
1750 AD ranges between 20% and 72% of those exploited at ca. 1400 AD (Table 29). Detailed
analysis elsewhere (Smith in press) shows that for fish and shellfish, at least, this cannot be attributed
to the size of archaeological samples under analysis; there are insufficient datasets to conduct similar
tests for birds and mammals. Only a small part of this trend is attributable to reduction of available
taxonomic breadth. Of marine taxa represented in the study assemblages only one has become extinct,
and the Waitaha penguin appears to have been rapidly replaced by the yellow-eyed penguin
(Bossenkool et al. 2009). Localised depletions were somewhat more common. As already noted, fur
seals and sea lions were extirpated from northern New Zealand, and at least some petrels, prions and
shearwaters ceased breeding on one or both of the main islands (Holdaway 1999) restricting
opportunities for anything other than opportunistic harvesting of these taxa to distant offshore islands.
Neither extinction nor serious depletion of populations has been documented for any of the fish or
shellfish taxa. For these classes of fauna, explanations for the narrowing of the range of species
harvested can be found in the cultural sphere. In the case of shellfish it can been attributed largely to
shifts in human settlement patterns which, in Greater Hauraki focussed increasingly on land suitable
for horticulture in the vicinity of estuaries, which typically support a high abundance but restricted
range of edible species (Smith in press). Otago-Catlins settlements of the later period appear to be
more strongly clustered than those of earlier periods, especially in the vicinity of rocky headlands,
although the driving forces in this case are less clearly understood. Declining diversity of fish catches
may have been influenced by these changes in settlement pattern, but there are also indications that
Maori fishing practice became more specialised with the dominant species in each region, snapper in
Greater Hauraki and barracouta in Otago-Catlins, forming an increasingly large proportion of the total
number of fish caught. It may be that the reliability with which these species could be located and

21
harvested in large numbers became a critical factor when the demise of seals and moas placed
increasing demand on fishing as a source of dietary energy.
Although there are broad similarities in some trends over time, the patterns of species exploitation and
timing of changes in these varies considerably between the two study areas. This is not unexpected as
regional differences in pre-European Maori subsistence patterns are widely recognised (Leach 2006,
Smith 2004). It does indicate, however, that the harvest estimates generated here should not be
applied to other areas or more generally across the country. There are also some indications of
subregional variations within the datasets used here. For example the relative importance of
leatherjackets at ca. 1400 AD in Greater Hauraki can be correlated with the concentration of Early
period sites in the region on the east coast of the Coromandel, while the rise to prominence of
mackerel fisheries at ca. 1550 AD coincides with a greater number of sites around the shores of the
Hauraki Gulf (Smith in press).
One further feature of the species-by-species estimates is worthy of further comment. In several cases
there is a considerable difference between the relative abundance of taxa and their relative
contributions to harvested biomass, due to differences in body size. For example sharks make up only
6.2 % of the number of fish harvested in Greater Hauraki at ca. 1750 AD, but contributed 36.8% of
harvested biomass, almost equal to that from snapper which made up 59% of the total number of fish.
With only a small number of exceptions, previous analyses of the archaeological evidence for Maori
fishing have relied solely on estimates of abundance, and for this reason they have been unable to
detect the late prehistoric rise in the importance of shark fishing in northern New Zealand.
Finally, this study has relied entirely upon pre-existing data of variable and sometimes unknown
quality. There are several ways in which future research could enhance the accuracy with which
estimates could be made regarding marine harvests in the past. Most importantly, existing
archaeological data is least adequate for the Middle and Late periods of New Zealand’s prehistory,
largely because so much research effort has been focussed on the study of the initial colonisation
phase. Furthermore, much of what is available for later periods has derived from small-scale
development-driven rescue excavations, rather than properly resourced research investigations.
Targeted research on the nature and consequences of later phases of occupation has the potential to
provide greater clarity regarding the breadth, magnitude and consequences of Maori exploitation of
the marine environment.
5. MANAGEMENT IMPLICATIONS
The data presented in this report makes available for the first time a suite of numerical estimates for
the levels of customary harvest of a wide range of New Zealand's marine resources covering a
substantial portion of the period prior to European settlement in New Zealand. These provide baseline
data against which modern customary and commercial harvests can be assessed, and will have value
in future stock assessments. Once integrated with other suites of data from the Taking Stock project,
they will contribute to greater understanding of the long-term structure and functioning of New
Zealand's marine shelf ecosystems.
7. ACKNOWLEDGMENTS
This research was funded by the Ministry of Fisheries through the Taking Stock Project ZBD200505. I
am grateful to Alison MacDiarmid for the opportunity to participate in this project, Foss Leach for
inspiration and support, and Tiffany James-Lee for assistance with data collection. Richard Walter
and Richard Ford provided useful comments on the manuscript.
22
8. REFERENCES
Allo Bay-Petersen, J. (1979). The role of the dog in the economy of the New Zealand Maori. In:
Anderson, A.J. (ed.) Birds of a feather. Osteological and archaeological papers from the
South Pacific in honour of R.J. Scarlett. BAR International Series 62. 165–181.
Anderson, A.J. (1982). A review of economic patterns during the Archaic phase in southern New
Zealand. New Zealand Journal of Archaeology 4: 45–75.
Anderson, A.J. (1989). Prodigious birds: Moas and moa-hunting in prehistoric New Zealand.
Cambridge University Press, Cambridge.
Anderson, A.J. (1991). The chronology of colonization in New Zealand. Antiquity 65: 767–795.
Anderson, A.J. (1997). Prehistoric Polynesian impact on the New Zealand environment: Te Whenua
Hou. In: Kirch, P.V. and T.L. Hunt (eds) Historical Ecology of the Pacific Islands: Prehistoric
environmental and landscape change. New Haven, Yale University Press. 271–283.
Anderson, A.J. (1998). The Welcome of Strangers; an ethnohistory of southern Maori A.D. 1650-
1850. University of Otago Press, Dunedin.
Anderson, A.J.; Smith, I.W.G. (1996). The transient village in southern New Zealand. World
Archaeology 27: 359-371.
Baker, C.; Chilvers, B.; Constantine, R.; DuFresne, S.; Mattlin, R.; van Helden, A.; Hitchmough, R.
(2010). Conservation status of New Zealand marine mammals (suborders Cetacea and
Pinnipedia), 2009. New Zealand Journal of Marine and Freshwater Research 44: 101–115.
Bossenkool, S.; Austin, J.J.; Worthy, T.H.; Scofield, P.; Cooper, A.; Seddon, P.J.; Waters, J.M.
(2009). Relict or colonizer? Extinction and range expansion of penguins in southern New
Zealand. Proceedings of the Royal Society B 276: 815–821.
Bryden, M.M.; O'Connor, S.; Jones, R. (1999). Archaeological evidence for the extinction of a
breeding population of Elephant Seals in Tasmania in prehistoric times. International Journal
of Osteoarchaeology 9: 430–437.
Burton, R.K.; Snodgrss, J.J.; Gifford-Gonzalez, D.; Guilderson, T.; Brown, T.; Koch, P.L. (2001).
Holocene changes in the ecology of northern furseals: insights from stable isotopes and
archaeofauna. Oecologia 128: 107–115.
Checklist Committee, O. (2010). Checklist of the Birds of New Zealand, Norfolk and Macquarrie
Islands, and the Ross Dependency of Antarctica (4th edition). Ornithological Society of New
Zealand and Te Papa Press, Wellington.
CINZAS (2008). Central Index of New Zealand Archaeological Sites. Wellington, New Zealand
Archaeological Association & Department of Conservation.
Clark, G.R. (1995). The Kuri in prehistory: a skeletal analysis of the extinct Maori dog. MA thesis,
Anthropology, University of Otago.
Davies, F.J. (1980). The prehistoric environment of the Dunedin area: the approach of salvage
prehistory. MA thesis, Anthropology, University of Otago.
Etnier, M. (2007). Defining and identifying sustainable harvests of resources: archaeological
examples of pinniped harvests in the eastern North Pacific. Journal for Nature Conservation
15: 196–207.
Froese, R.; Pauly, D. (2010). FishBase. World Wide Web electronic publication. version (09, 2010).
http://www.fishbase.org Grayson, D.K. (2001). The archaeological record of human impacts on animal populations. Journal
of World Prehistory 16: 1–68.
Holdaway, R.N. (1999). Introduced predators and avifaunal extinction in New Zealand. In: MacPhee,
R.D.E. (ed) Extinctions in Near Time. New York, Kluwer Academic. 189–238.
Hughen, K.A.; Baillie, M.G.L.; Bard, E.; Bayliss, A.; Beck, J.W.; Bertrand, C.; Blackwell, P.G.;
Buck, C.E.; Burr, G.; Cutler, K.B.; Damon, P.E.; Edwards, R.L.; Fairbanks, R.G.; Friedrich,
M.; Guilderson, T.P.; Kromer, B.; McCormac, F.G.; Manning, S.; Bronk Ramsey, C.; Reimer,
P.J.; Reimer, R.W.; Remmele, S.; Southon, J.R.; Stuiver, M.; Talamo, S.; Taylor, F.W.; van

23
der Plicht, J.; Weyhenmeyer, C.E. (2004). Marine04 marine radiocarbon calibration, 0-26 cal
kyr BP. Radiocarbon 46: 959–966.
Jacomb, C.; Walter, R.K.; Jennings, C. (2010). A review of the archaeology of Foveaux Strait, New
Zealand. Journal of the Polynesian Society 119: 25–59.
King, C.M. (1995). The Handbook of New Zealand Mammals. Oxford University Press, Auckland.
600 p.
Leach, B.F. (2006). Fishing in Pre-European New Zealand. New Zealand Journal of Archaeology, and
Archaeofauna, Wellington. 359 p.
Leach, B.F.; Boocock, A.S. (1993). Prehistoric Fish Catches in New Zealand. British Archaeological
Reports, International Series 584, Oxford. 38 p.
Leach, B.F.; Quinn, C.; Lyon, G.L. (1996). A stochastic approach to the reconstruction of prehistoric
human diet in the Pacific region from bone isotope signatures. Tuhinga: Records of the
Museum of New Zealand Te Papa Tongarewa 8: 1–54.
Leach, B.F.; Quinn, C.; Lyon, G.L.; Haystead, A.; Myers, D.B. (2000). Evidence of prehistoric Lapita
diet at Watom Island, Papua New Guinea, using stable isotopes. New Zealand Journal of
Archaeology 20: 149–159.
Leach, B.F.; Quinn, C.; Morrison, J.; Lyon, G. (2003). The use of multiple isotope signatures in
reconstructing prehistoric human diet from archaeological bone from the Pacific and New
Zealand. New Zealand Journal of Archaeology 23: 31–98.
Leach, B.F.; Quinn, C.; Morrison, J.; Lyon, G.L. (2003b). The use of multiple isotope signatures in
reconstructing prehistoric human diet from archaeological bone from the Pacific and New
Zealand. New Zealand Journal of Archaeology 23: 31–-98.
Lyman, R.L. (2008). Quantitative Paleozoology. Cambridge University Press, Cambridge. 348 p.
MacDiarmid, A.B. (2011). Large, isolated late-settled islands: potential tests of human impacts on
marine ecosystems. Final Research Report, Project ZBD200505, MS31 Part A, to the
Ministry of Fisheries. NIWA, Wellington. 13 p.
McCormac, F.G.; Hogg, A.G.; Blackwell, P.G.; Buck, C.E.; Higham, T.F.G.; Reimer, P.J. (2004).
SHCal04 Southern Hemisphere Calibration 0 - 1000 cal BP. Radiocarbon 46: 1087–1092.
McFadgen, B.G.; Knox, F.B.; Cole, T.R.L. (1994). Radiocarbon calibration curve variations and their
implications for the interpretation of New Zealand prehistory. Radiocarbon 36: 221–236.
McGlone, M.S. (1989). The Polynesian settlement of New Zealand in relation to environmental and
biotic changes. New Zealand Journal of Ecology 12: 115–129.
McGlone, M.S.; Anderson, A.J.J.; Holdaway, R.N. (1994). An Ecological Approach to the Polynesian
Settlement of New Zealand. In: Sutton, D.G. (ed) The Origins of the First New Zealanders.
Auckland, University of Auckland Press. 136–163.
Millener, P.R. (1981). The Quaternary Avifauna of the North Island, New Zealand. University of
Auckland, University of Auckalnd. 897 p.
Myers, R.A.; Worm, B. (2003). Rapid worldwide depletion of predatory fish communities. Nature
423: 280–283.
Pauly, D.; Christensen, V.; Dalsgaard, J.; Froese, R.; Torres, F.J. (1998). Fishing down marine food
webs. Science 279: 860–863.
Petchey, F.J. (1999). New Zealand bone dating revisited: A radiocarbon discard protocol for bone.
New Zealand Journal of Archaeology 19: 81–124.
Pool, I. (1991). Te Iwi Maori: A New Zealand Population, Past, Present and Future. Auckland
University Press, Auckland.
Reeves, R.R.; Smith, T.D. (2006). A taxonomy of world whaling: operations and eras. In: Estes, J.A.,
D.P. DeMaster, D.F. Doak, T.M. Williams and R.L.J. Brownell (eds) Whales, Whaling, and
Ocean Ecosystems. Berkeley, University of California Press. 82–101.
Reitz, E.J.; Wing, E.S. (2008). Zooarchaeology. Cambridge University Press, Cambridge. 533 p.
Rick, T.C.; Erlandson, J.M. (2008). Human Impacts of Ancient Marine Ecosystems: A Global
Perspective. University of California Press, Berkley. 336 p.

24
Schmidt, M.D. (2000a). Radiocarbon Dating New Zealand Prehistory Using Marine Shell. BAR
International Series, Oxford.
Schmidt, M.D. (2000b). Radiocarbon dating the end of moa-hunting in New Zealand prehistory.
Archaeology in New Zealand 43: 314–329.
Smith, I.W.G. (1985). Sea mammal hunting and prehistoric subsistence in New Zealand. PhD thesis,
Anthropology, University of Otago. 576 p.
Smith, I.W.G. (1989). Maori impact on the marine megafauna: pre-European distributions of New
Zealand sea mammals. In: Sutton, D.G. (ed) Saying So Doesn't Make It So: Papers in Honour
of B. Foss Leach. Dunedin, New Zealand Archaeological Association Monograph 17. 76–
108.
Smith, I.W.G. (2004). Nutritional perspectives on prehistoric marine fishing in New Zealand. New
Zealand Journal of Archaeology 24: 5–31.
Smith, I.W.G. (2005). Retreat and resilience: Fur seals and human settlement in New Zealand. In:
Monks, G.G. (ed) The Exploitation and Cultural Importance of Marine Mammals. Oxford,
Oxbow Books. 6–18.
Smith, I.W.G. (2010). Protocols for organising radiocarbon dated assemblages from New Zealand
archaeological sites for comparative analysis. Journal of Pacific Archaeology 1: 184–187.
Smith, I.W.G. (2011). Meat Weights and Nutritional Yield Values for New Zealand Archaeofauna.
Otago Archaeological Laboratory Report, No. 8. 23 p.
Smith, I.W.G. (in press). Pre-European Maori exploitation of marine resources in two New Zealand
case study areas: species range and temporal change. Journal of the Royal Society of New
Zealand
Smith, I.W.G. (n.d.). Regional and temporal variations in energy harvests from prehistoric fauna in
New Zealand. Manuscript in preparation
Smith, I.W.G.; James-Lee, T. (2010). Data for an Archaeozoological Analysis of Marine Resource
Use in Two New Zealand Study Areas (revised edition). Otago Archaeological Laboratory
Report, No 7. 85 p.
Spencer, H.G.; Willan, R.C.; Marshall, B.; Murray, T.J. (2009). Checklist of the Recent Mollusca
recorded from the New Zealand Exclusive Economic Zone.
http://www.molluscs.otago.ac.nz/index.html. Urlich, D.U. (1969). The Distribution and Migrations of the North Island Maori Population about
1800-1840. MA thesis, Geography, University of Auckland,
Walter, R.K.; Smith, I.W.G.; Jacomb, C. (2006). Sedentism, subsistence and socio-political
organization in prehistoric New Zealand. World Archaeology 38: 274–290.
Ward, G.K.; Wilson, S.R. (1978). Procedures for comparing and combining radiocarbon age-
determinations - critique. Archaeometry 20: 19–31.
Wilmshurst, J.M.; Hunt, T.L.; Lipo, C.P.; Anderson, A.J. (2011). High precision radiocarbon dating
shows recent rapid initial human colonisation of east Polynesia. Proceedings of the National
Academy of Sciences 108: 1815–1820.
Worthy, T.H. (1998). Quaternary fossil faunas of Otago, South Island, New Zealand. Journal of the
Royal Society of New Zealand 28: 421–521.

25
Table 1: Number of study assemblages per area and period.
Period Greater Hauraki Otago-Catlins Total
Early 8 10 18
Early/Middle 11 9 20
Middle 25 2 27
Middle/Late 18 2 20
Late 13 9 22
Total 75 32 107
Table 2: Faunal component energy proportions (% total Kcal from animals): initial calculated
values and final adjusted values.
Area/period Value Shellfish Fish
Marine/coastal
bird
Marine
mammal Moa
Terrestrial
bird
Terrestrial
mammal
Greater Hauraki
Early initial 0.66 11.50 3.39 59.77 21.10 1.46 2.11
Early final 0.62 10.74 4.16 54.80 23.38 2.76 3.54
Middle initial 43.13 51.72 0 0 0 0 5.15
Middle final 40.11 48.19 1.50 0.05 0 1.50 8.65
Late initial 51.95 43.16 1.05 0 0 0.51 3.33
Late final 44.50 44.12 2.50 0.05 0 2.67 6.17
Otago-Catlins
Early initial 0.61 5.81 5.92 57.21 27.05 0.77 2.63
Early final 0.57 5.39 6.49 52.10 29.49 1.90 4.06
Middle initial 3.38 59.07 8.42 21.10 3.15 1.95 2.93
Middle final 3.20 54.36 9.46 19.95 4.36 4.66 4.00
Late initial 1.89 57.36 17.73 12.00 0 2.25 8.77
Late final 4.28 52.49 16.22 10.98 0 4.77 11.25
Table 3: Maximum, minimum and best estimate values for variables used in estimating total
energy from animals.
Human population size (n) Energy/person/day (kcal) Proportion from animals
Area/year Min Best Max Min Best Max Min Best Max
Greater Hauraki
ca. 1400 500 2 000 2 500 1 800 2 150 2 172 0.53 0.66 0.78
ca. 1550 6 100 10 200 11 700 1 800 2 150 2 172 0.40 0.53 0.66
ca. 1750 10 800 12 150 13 500 1 800 2 150 2 172 0.40 0.53 0.66
Otago-Catlins
ca. 1400 500 1 800 2 500 2 150 2 172 2 193 0.66 0.78 0.90
ca. 1550 500 1 800 2 600 2 150 2 172 2 193 0.66 0.78 0.90
ca. 1750 1 600 1 800 2 000 2 150 2 172 2 193 0.66 0.78 0.90

26
Table 4: Estimated total energy (Kcal x 106) harvested from animals during focal years in each
study area.
Area/year Minimum estimate Best estimate Maximum estimate
Greater Hauraki
ca. 1400 174.11 1 035.87 1 545.92
ca. 1550 1 603.08 4 242.36 6 121.85
ca. 1750 2 838.24 5 053.40 7 063.67
Otago-Catlins
ca. 1400 258.97 1 113.06 1 801.00
ca. 1550 388.45 1 236.74 1 873.04
ca. 1750 828.70 1 113.06 1 440.80

27
Table 5:
Estimated numbers (N) and biomass (tonnes) of fish harvested in Greater Hauraki at ca. 1400 AD.
Minimum estimate
Best estimate
Maximum estimate
N
Biomass
± 30%
N
Biomass
± 30%
N
Biomass
± 30%
Carcharhiniforme ?sp
24
0.485
0.146
144
2.886
0.866
215
4.307
1.292
Myliobatis tenuicaudatus
3
0.051
0.015
15
0.304
0.091
23
0.453
0.136
Elasmobranchii ?sp
27
0.268
0.080
159
1.595
0.478
238
2.380
0.714
Callorhinchus milii
3
0.011
0.003
15
0.064
0.019
23
0.095
0.029
Anguilla spp.
27
0.024
0.007
159
0.144
0.043
238
0.214
0.064
Pseudophycis bachus
27
0.040
0.012
159
0.239
0.072
238
0.357
0.107
Zeus faber
52
0.073
0.022
311
0.436
0.131
465
0.651
0.195
Chelidonichthys kumu
92
0.064
0.019
547
0.383
0.115
816
0.571
0.171
Pseudocaranx dentex
6
0.010
0.003
38
0.061
0.018
57
0.091
0.027
Trachurus declivis
3
0.003
0.001
15
0.020
0.006
23
0.029
0.009
Trachurus novaezelandiae
3
0.003
0.001
15
0.015
0.005
23
0.023
0.007
Arripis trutta
1 795
3.231
0.969
10 679
19.221
5.766
15 937
28.686
8.606
Pagrus auratus
5 504
12.110
3.633
32 750
72.049
21.615
48 875
107.525
32.258
Nem
adactylus macropterus
448
0.358
0.108
2 666
2.133
0.640
3 978
3.183
0.955
Latridopsis ciliaris
79
0.214
0.064
471
1.271
0.381
703
1.897
0.569
Mugil cephalus
3
0.003
0.001
15
0.015
0.005
23
0.023
0.007
Aldrichetta forsteri
544
0.109
0.033
3 235
0.647
0.194
4 829
0.966
0.290
Labridae
1 508
2.261
0.678
8 970
13.455
4.036
13 386
20.079
6.024
Parapercis colias
119
0.083
0.025
706
0.494
0.148
1 054
0.738
0.221
Thyrsites atun
111
0.255
0.077
661
1.520
0.456
986
2.268
0.680
Serollela brama
24
0.056
0.017
144
0.332
0.100
215
0.495
0.149
Meuschenia scaber
2 365
1.892
0.568
14 074
11.259
3.378
21 003
16.803
5.041
TOTAL
12 765
21.605
7.448
75 950
128.542
44.316
113 347
191.835
66.137

28
Table 6:
Estimated numbers (N) and biomass (tonnes) of fish harvested in Greater Hauraki at ca. 1550 AD.
Minimum estimate
Best estimate
Maximum estimate
N
Biomass
± 30%
N
Biomass
± 30%
N
Biomass
± 30%
Carcharhiniforme ?sp
9 663
193.267
57.980
25 572
511.436
153.431
36 901
738.017
221.405
Anguilla spp.
5 815
5.234
1.570
15 389
13.850
4.155
22 207
19.987
5.996
Chelidonichthys kumu
1 355
0.949
0.285
3 587
2.511
0.753
5 176
3.623
1.087
Pseudocaranx dentex
12 724
20.359
6.108
33 671
53.874
16.162
48 589
77.742
23.323
Trachurus declivis
219
0.284
0.085
579
0.752
0.226
835
1.085
0.326
Trachurus novaezelandiae
122 082
122.082
36.625
323 061
323.061
96.918
466 186
466.186
139.856
Arripis trutta
47 836
86.104
25.831
126 586
227.855
68.357
182 667
328.801
98.640
Pagrus auratus
161 260
354.772
106.432
426 736
938.820
281.646
615 793
1354.745
406.423
Mugil cephalus
5 815
5.815
1.745
15 389
15.389
4.617
22 207
22.207
6.662
Aldrichetta forsteri
9 663
1.933
0.580
25 572
5.114
1.534
36 901
7.380
2.214
Labridae
5 815
8.723
2.617
15 389
23.084
6.925
22 207
33.311
9.993
Genyagnus monopterygius
44
0.022
0.007
116
0.058
0.017
167
0.083
0.025
Parapercis colias
44
0.031
0.009
116
0.081
0.024
167
0.117
0.035
Thyrsites atun
27 809
63.962
19.189
73 591
169.260
50.778
106 194
244.247
73.274
Scomber australasicus
11 631
11.631
3.489
30 779
30.779
9.234
44 415
44.415
13.324
Rhombosolea ?sp
15 479
4.644
1.393
40 961
12.288
3.687
59 108
17.732
5.320
TOTAL
437 256
879.811
263.943 1 159 561
2 328.213
698.464
1 669 721
3 359.679 1 007.904

29
Table 7:
Estimated numbers (N) and biomass (tonnes) of fish harvested in Greater Hauraki at ca. 1750 AD.
Minimum estimate
Best estimate
Maximum estimate
N
Biomass
± 30%
N
Biomass
± 30%
N
Biomass
± 30%
Squalus blainvillei
8 966
22.415
6.725
15 964
39.910
11.973
22 314
55.786
16.736
Carcharhiniforme ?sp
26 941
538.829
161.649
47 968
959.369
287.811
67 051
1 341.011
402.303
Myliobatis tenuicaudatus
8 966
179.322
53.797
15 964
319.278
95.783
22 314
446.289
133.887
Anguilla spp.
20 950
18.855
5.656
37 300
33.570
10.071
52 139
46.925
14.077
Chelidonichthys kumu
8 966
6.276
1.883
15 964
11.175
3.352
22 314
15.620
4.686
Pseudocaranx dentex
20 950
33.519
10.056
37 300
59.680
17.904
52 139
83.422
25.026
Trachurus declivis
8 966
11.656
3.497
15 964
20.753
6.226
22 314
29.009
8.703
Carangidae ?sp
8 966
9.863
2.959
15 964
17.560
5.268
22 314
24.546
7.364
Arripis trutta
17 975
32.356
9.707
32 005
57.608
17.282
44 736
80.525
24.158
Pagrus auratus
254 586
560.089
168.027
453 283
997.222
299.166
633 601
1 393.922
418.177
Mugil cephalus
8 966
1.793
0.538
15 964
3.193
0.958
22 314
4.463
1.339
Labridae
8 966
13.449
4.035
15 964
23.946
7.184
22 314
33.472
10.041
Odax pullus
8 966
8.070
2.421
15 964
14.368
4.310
22 314
20.083
6.025
Thyrsites atun
8 966
20.622
6.187
15 964
36.717
11.015
22 314
51.323
15.397
Meuschenia scaber
8 966
7.173
2.152
15 964
12.771
3.831
22 314
17.852
5.355
TOTAL
431 063
1 464.288
439.286
767 495
2 607.119
782.136
1 072 809
3 644.247 1 093.274

30
Table 8:
Estimated numbers (N) and biomass (tonnes) of fish harvested in Otago-Catlins at ca. 1400 AD.
Minimum estimate
Best estimate
Maximum estimate
N
Biomass
± 30%
N
Biomass
± 30%
N
Biomass
± 30%
Elasmobranchii ?sp
1
0.008
0.002
3
0.034
0.010
6
0.055
0.017
Anguilla spp.
1
0.016
0.005
3
0.068
0.020
6
0.110
0.033
Pseudophycis bachus
1 058
1.587
0.476
4 546
6.819
2.046
7 356
11.033
3.310
Lotella rhacinus
1
0.001
0.000
3
0.003
0.001
6
0.006
0.002
Genypterus blacodes
362
1.810
0.543
1 556
7.779
2.334
2 517
12.587
3.776
Helicolenus barathris
3
0.001
0.000
14
0.005
0.002
22
0.009
0.003
Scorpaena cardinalis
32
0.032
0.010
139
0.139
0.042
225
0.225
0.067
Chelidonichthys kumu
0
0.000
0.000
2
0.001
0.000
3
0.002
0.001
Polyprion oxygenios
89
1.789
0.537
385
7.691
2.307
622
12.444
3.733
Trachurus declivis
1
0.001
0.000
2
0.002
0.001
3
0.004
0.001
Trachurus novaezelandiae
16
0.016
0.005
69
0.069
0.021
112
0.112
0.034
Pagrus auratus
238
0.525
0.157
1 025
2.255
0.676
1 658
3.649
1.095
Nem
adactylus macropterus
34
0.027
0.008
146
0.117
0.035
236
0.189
0.057
Latridopsis ciliaris
28
0.074
0.022
118
0.320
0.096
192
0.517
0.155
Latris lineata
191
0.572
0.172
820
2.459
0.738
1 326
3.979
1.194
Aldrichetta forsteri
1
0.000
0.000
3
0.001
0.000
6
0.001
0.000
Labridae
212
0.318
0.095
911
1.366
0.410
1 474
2.211
0.663
Parapercis colias
750
0.525
0.157
3 222
2.256
0.677
5 214
3.650
1.095
Nototheniidae
524
0.838
0.252
2 252
3.603
1.081
3 644
5.830
1.749
Thyrsites atun
4 373
10.058
3.018
18 796
43.232
12.970
30 414
69.952
20.985
Rexea solandri
2
0.007
0.002
10
0.031
0.009
17
0.050
0.015
Hyperoglyphe antarctica
1
0.003
0.001
3
0.014
0.004
6
0.022
0.007
TOTAL
7 917
18.209
5.463
34 029
78.264
23.479
55 061
126.636
37.991

31
Table 9:
Estimated numbers (N) and biomass (tonnes) of fish harvested in Otago-Catlins at ca. 1550 AD.
Minimum estimate
Best estimate
Maximum estimate
N
Biomass
± 30%
N
Biomass
± 30%
N
Biomass
± 30%
Elasmobranchii ?sp
238
2.375
0.713
1 021
10.209
3.063
1 718
17.180
5.154
Pseudophycis bachus
19 906
29.859
8.958
85 559
128.338
38.501
143 977
215.965
64.789
Genypterus blacodes
3 172
15.861
4.758
13 634
68.170
20.451
22 943
114.716
34.415
Helicolenus barathris
31
0.012
0.004
132
0.053
0.016
222
0.089
0.027
Scorpaena papillosus
31
0.031
0.009
132
0.132
0.040
222
0.222
0.067
Scorpaena cardinalis
460
0.460
0.138
1 976
1.976
0.593
3 325
3.325
0.998
Neophrynichthys latus
31
0.058
0.017
132
0.250
0.075
222
0.421
0.126
Polyprion oxygenios
1 640
32.794
9.838
7 048
140.951
42.285
11 860
237.190
71.157
Nem
adactylus macropterus
46
0.037
0.011
198
0.158
0.047
333
0.266
0.080
Latris lineata
590
1.770
0.531
2 536
7.607
2.282
4 267
12.802
3.840
Labridae
4 682
7.022
2.107
20 122
30.183
9.055
33 861
50.791
15.237
Parapercis colias
3 984
2.789
0.837
17 125
11.987
3.996
28 817
20.172
6.052
Nototheniidae
5 256
8.410
2.523
22 592
36.147
10.844
38 017
60.827
18.248
Thyrsites atun
36 556
84.079
25.224
157 121
361.379
108.414
264 401
608.121
182.436
TOTAL
76 622
185.557
55.667
329 325
797.541
239.262
554 183
1 342.086
402.626

32
Table 10:
Estimated numbers (N) and biomass (tonnes) of fish harvested in Otago-Catlins at ca. 1750 AD.
Minimum estimate
Best estimate
Maximum estimate
N
Biomass
± 30%
N
Biomass
± 30%
N
Biomass
± 30%
Elasmobranchii ?sp
170
1.702
0.511
229
2.286
0.686
296
2.960
0.888
Callorhinchus milii
170
0.715
0.214
229
0.960
0.288
296
1.243
0.373
Pseudophycis bachus
3 3928
50.891
15.267
45 570
68.355
20.506
58 988
88.481
26.544
Genypterus blacodes
8461
42.303
12.691
11 364
56.819
17.046
14 710
73.550
22.065
Polyprion oxygenios
8597
171.936
51.581
11 547
230.935
69.281
14 947
298.934
89.680
Latridopsis ciliaris
51
0.138
0.041
69
0.185
0.056
89
0.240
0.072
Labridae
1021
1.532
0.460
1 372
2.058
0.617
1 776
2.664
0.799
Parapercis colias
221
0.155
0.046
297
0.208
0.062
385
0.269
0.081
Thyrsites atun
11 7614
270.513
81.154
157 974
363.339
109.002
204 488
470.323
141.097
TOTAL
17 0233
539.885
161.965
228 649
725.146
217.544
295 974
938.663
281.599
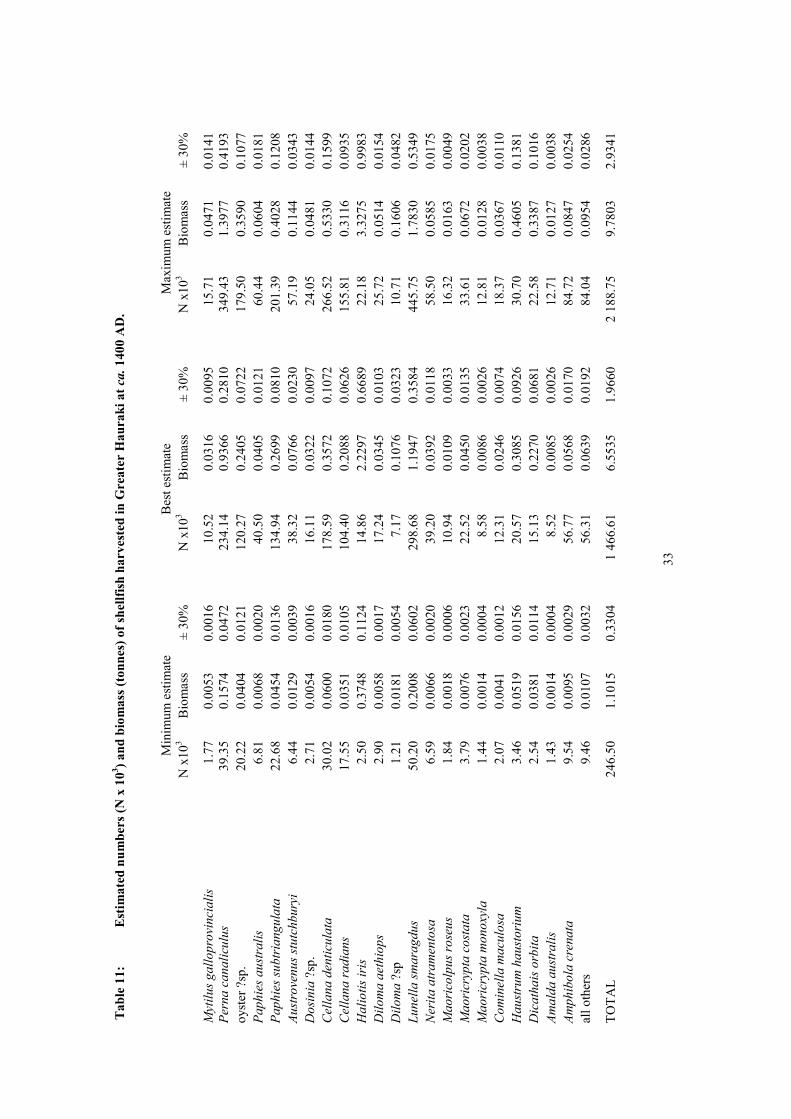
33
Table 11:
Estimated numbers (N x 103) and biomass (tonnes) of shellfish harvested in Greater Hauraki at ca. 1400 AD.
Minimum estimate
Best estimate
Maximum estimate
N x103
Biomass
± 30%
N x103
Biomass
± 30%
N x103
Biomass
± 30%
Mytilus galloprovincialis
1.77
0.0053
0.0016
10.52
0.0316
0.0095
15.71
0.0471
0.0141
Perna canaliculus
39.35
0.1574
0.0472
234.14
0.9366
0.2810
349.43
1.3977
0.4193
oyster ?sp.
20.22
0.0404
0.0121
120.27
0.2405
0.0722
179.50
0.3590
0.1077
Paphies australis
6.81
0.0068
0.0020
40.50
0.0405
0.0121
60.44
0.0604
0.0181
Paphies subtriangulata
22.68
0.0454
0.0136
134.94
0.2699
0.0810
201.39
0.4028
0.1208
Austrovenus stutchburyi
6.44
0.0129
0.0039
38.32
0.0766
0.0230
57.19
0.1144
0.0343
Dosinia ?sp.
2.71
0.0054
0.0016
16.11
0.0322
0.0097
24.05
0.0481
0.0144
Cellana denticulata
30.02
0.0600
0.0180
178.59
0.3572
0.1072
266.52
0.5330
0.1599
Cellana radians
17.55
0.0351
0.0105
104.40
0.2088
0.0626
155.81
0.3116
0.0935
Haliotis iris
2.50
0.3748
0.1124
14.86
2.2297
0.6689
22.18
3.3275
0.9983
Diloma aethiops
2.90
0.0058
0.0017
17.24
0.0345
0.0103
25.72
0.0514
0.0154
Diloma ?sp
1.21
0.0181
0.0054
7.17
0.1076
0.0323
10.71
0.1606
0.0482
Lunella smaragdus
50.20
0.2008
0.0602
298.68
1.1947
0.3584
445.75
1.7830
0.5349
Nerita atramentosa
6.59
0.0066
0.0020
39.20
0.0392
0.0118
58.50
0.0585
0.0175
Maoricolpus roseus
1.84
0.0018
0.0006
10.94
0.0109
0.0033
16.32
0.0163
0.0049
Maoricrypta costata
3.79
0.0076
0.0023
22.52
0.0450
0.0135
33.61
0.0672
0.0202
Maoricrypta monoxyla
1.44
0.0014
0.0004
8.58
0.0086
0.0026
12.81
0.0128
0.0038
Cominella maculosa
2.07
0.0041
0.0012
12.31
0.0246
0.0074
18.37
0.0367
0.0110
Haustrum haustorium
3.46
0.0519
0.0156
20.57
0.3085
0.0926
30.70
0.4605
0.1381
Dicathais orbita
2.54
0.0381
0.0114
15.13
0.2270
0.0681
22.58
0.3387
0.1016
Amalda australis
1.43
0.0014
0.0004
8.52
0.0085
0.0026
12.71
0.0127
0.0038
Amphibola crenata
9.54
0.0095
0.0029
56.77
0.0568
0.0170
84.72
0.0847
0.0254
all others
9.46
0.0107
0.0032
56.31
0.0639
0.0192
84.04
0.0954
0.0286
TOTAL
246.50
1.1015
0.3304
1 466.61
6.5535
1.9660
2 188.75
9.7803
2.9341

34
Table 12:
Estimated numbers (N x 103) and biomass (tonnes) of shellfish harvested in Greater Hauraki at ca. 1550 AD.
Minimum estimate
Best estimate
Maximum estimate
N x103
Biomass
± 30%
N x103
Biomass
± 30%
N x103
Biomass
± 30%
Perna canaliculus
114.8
0.459
0.138
303.9
1.216
0.365
438.5
1.754
0.526
Saccostrea cuccullata glomerata
336.8
0.337
0.101
891.4
0.891
0.267
1 286.2
1.286
0.386
Ostrea chilensis
108.5
0.217
0.065
287.1
0.574
0.172
414.3
0.829
0.249
Pecten novaezelandiae
334.3
0.334
0.100
884.7
0.885
0.265
1 276.7
1.277
0.383
Pecten ?sp.
365.6
0.366
0.110
967.6
0.968
0.290
1 396.3
1.396
0.419
Cardita aoteana
271.5
0.272
0.081
718.6
0.719
0.216
1 037.0
1.037
0.311
Purpurocardia ?sp.
417.9
0.418
0.125
1 105.8
1.106
0.332
1 595.7
1.596
0.479
Paphies australis
135 349.3
135.349
40.605
358 185.7
358.186
107.456
516 872.4
516.872
155.062
Paphies subtriangulata
20 255.1
40.510
12.153
53 602.6
107.205
32.162
77 350.1
154.700
46.410
Austrovenus stutchburyi
208 439.5
416.879
125.064
551 610.0
1 103.220
330.966
795 989.3
1591.979
477.594
Cellana radians
488.8
0.978
0.293
1 293.5
2.587
0.776
1 866.5
3.733
1.120
Diloma aethiops
5 818.3
11.637
3.491
15 397.4
30.795
9.238
22 218.9
44.438
13.331
Lunella smaragdus
8 228.0
32.912
9.874
21 774.3
87.097
26.129
31 420.9
125.684
37.705
Zeacumantus ?sp.
246.1
0.246
0.074
651.3
0.651
0.195
939.9
0.940
0.282
Struthiolaria papulosa
1 078.5
2.157
0.647
2 854.2
5.708
1.713
4 118.7
8.237
2.471
Maoricrypta ?sp.
320.2
0.320
0.096
847.5
0.847
0.254
1 223.0
1.223
0.367
Argobuccinum pustulosum tumidum
201.5
0.403
0.121
533.2
1.066
0.320
769.4
1.539
0.462
Janthina janthina
1 100.7
1.101
0.330
2 913.0
2.913
0.874
4 203.5
4.204
1.261
Cominella adspersa
630.4
1.261
0.378
1 668.3
3.337
1.001
2 407.3
4.815
1.444
Cominella ?sp.
930.5
0.931
0.279
2 462.6
2.463
0.739
3 553.6
3.554
1.066
Alcithoe arabica
162.7
0.488
0.146
430.6
1.292
0.388
621.4
1.864
0.559
Amphibola crenata
6 171.6
6.172
1.851
16 332.5
16.332
4.900
23 568.2
23.568
7.070
all others
739.7
2.373
0.712
1957.6
6.279
1.884
2824.8
9.061
2.119
TOTAL
393 626.5
656.118
196.835
1 041 685.3
1 736.337
520.901
1 503 182.3
2505.585
751.675

35
Table 13:
Estimated numbers (N x 103) and biomass (tonnes) of shellfish harvested in Greater Hauraki at ca. 1750 AD.
Minimum estimate
Best estimate
Maximum estimate
N x103
Biomass
± 30%
N x103
Biomass
± 30%
N x103
Biomass
± 30%
Perna canaliculus
723.6
2.895
0.868
1 288.4
5.154
1.546
1 800.9
7.204
2.161
Purpurocardia ?sp.
11 131.7
11.132
3.340
19 819.6
19.820
5.946
27 704.0
27.704
8.311
Paphies australis
333 923.2
333.923
100.177
594 539.9
594.540
178.362
831 051.4
831.051
249.315
Paphies subtriangulata
70 348.8
140.698
42.209
125 253.8
250.508
75.152
175 080.5
350.161
105.048
Austrovenus stutchburyi
381 349.4
762.699
228.810
678 980.7
1 357.961
407.388
949 083.4
1 898.167
569.450
Mactra discors
4 783.9
14.352
4.305
8 517.5
25.553
7.666
11 905.8
35.718
10.715
Dosinia anus
92.0
0.184
0.055
163.8
0.328
0.098
229.0
0.458
0.137
Dosinia ?sp.
261.8
0.524
0.157
466.1
0.932
0.280
651.5
1.303
0.391
Myadora striata
261.8
0.262
0.079
466.1
0.466
0.140
651.5
0.652
0.195
Haliotis iris
8.2
1.231
0.369
14.6
2.192
0.658
20.4
3.064
0.919
Zethalia zelandica
2 879.7
2.880
0.864
5 127.2
5.127
1.538
7 166.8
7.167
2.150
Cookia sulcata
8.2
0.123
0.037
14.6
0.219
0.066
20.4
0.306
0.092
Lunella smaragdus
386.5
1.546
0.464
688.2
2.753
0.826
962.0
3.848
1.154
Zeacumantus lutulentus
1 914.7
1.915
0.574
3 409.0
3.409
1.023
4 765.2
4.765
1.430
Struthiolaria papulosa
772.6
1.545
0.464
1 375.6
2.751
0.825
1 922.8
3.846
1.154
Aethocola glans
115.0
0.230
0.069
204.7
0.409
0.123
286.1
0.572
0.172
Cominella adspersa
679.0
1.358
0.407
1 209.0
2.418
0.725
1 690.0
3.380
1.014
Cominella glandiform
is
460.0
0.460
0.138
819.0
0.819
0.246
1 144.8
1.145
0.343
Cominella virgata
574.8
0.575
0.172
1 023.4
1.023
0.307
1 430.5
1.431
0.429
Xym
ene ambiguous
1 580.2
1.580
0.474
2 813.4
2.813
0.844
3 932.6
3.933
1.180
Dicathais orbita
8.2
0.123
0.037
14.6
0.219
0.066
20.4
0.306
0.092
Amphibola crenata
834.4
0.834
0.250
1 485.7
1.486
0.446
2 076.7
2.077
0.623
all others
7 363.0
7.726
2.318
13 109.5
13.755
4.127
18 324.5
19.227
5.768
TOTAL
820 708.4 1 288.793
386.638
1 461 245.6
2 294.655
688.397
2 042 537.9
3 207.483
962.245

36
Table 14:
Estimated numbers (N x 103) and biomass (tonnes) of shellfish harvested in Otago-Catlins at ca. 1400 AD.
Minimum estimate
Best estimate
Maximum estimate
N x103
Biomass
± 30%
N x103
Biomass
± 30%
N x103
Biomass
± 30%
Mytilus galloprovincialis
116.9
0.351
0.105
502.3
1.507
0.452
812.8
2.438
0.732
Perna canaliculus
11.5
0.046
0.014
49.3
0.197
0.059
79.8
0.319
0.096
Aulacomya maoriana
0.4
0.001
0.000
1.7
0.003
0.001
2.8
0.006
0.002
Mactra discors
1.0
0.003
0.001
4.4
0.013
0.004
7.1
0.021
0.006
Paphies australis
298.0
0.298
0.089
1 280.7
1.281
0.384
2 072.2
2.072
0.622
Austrovenus stutchburyi
284.8
0.570
0.171
1 224.2
2.448
0.734
1 980.8
3.962
1.188
Protothaca crassicostata
1.2
0.001
0.000
5.2
0.005
0.002
8.3
0.008
0.003
Dosinia ?sp.
2.0
0.004
0.001
8.8
0.018
0.005
14.2
0.028
0.009
Cellana ornata
0.4
0.001
0.000
1.7
0.003
0.001
2.7
0.005
0.002
Cellana strigilis
7.6
0.015
0.005
32.5
0.065
0.019
52.5
0.105
0.032
Patelloida corticata
1.7
0.002
0.001
7.2
0.007
0.002
11.7
0.012
0.003
Haliotis iris
3.5
0.525
0.157
15.0
2.255
0.676
24.3
3.648
1.094
Haliotis australis
0.7
0.069
0.021
3.0
0.296
0.089
4.8
0.479
0.144
Diloma aethiops
24.3
0.049
0.015
104.5
0.209
0.063
169.1
0.338
0.101
Diloma ?sp
1.0
0.015
0.005
4.4
0.066
0.020
7.1
0.107
0.032
Cookia sulcata
4.2
0.062
0.019
17.8
0.268
0.080
28.9
0.433
0.130
Lunella smaragdus
4.1
0.017
0.005
17.8
0.071
0.021
28.8
0.115
0.035
Maoricrypta ?sp
2.6
0.003
0.001
11.4
0.011
0.003
18.4
0.018
0.006
Argobuccinum pustulosum tumidum
1.0
0.002
0.001
4.4
0.009
0.003
7.1
0.014
0.004
Paratrophon patens
0.4
0.000
0.000
1.7
0.002
0.001
2.7
0.003
0.001
Amphibola crenata
78.6
0.079
0.024
337.7
0.338
0.101
546.5
0.546
0.164
Siphonaria ?sp
1.0
0.001
0.000
4.2
0.004
0.001
6.9
0.007
0.002
all others
4.0
0.004
0.001
17.3
0.017
0.005
28.0
0.028
0.008
TOTAL
850.9
2.116
0.635
3 657.1
9.094
2.728
5 917.5
14.714
4.414

37
Table 15:
Estimated numbers (N x 103) and biomass (tonnes) of shellfish harvested in Otago-Catlins at ca. 1550 AD
Minimum estimate
Best estimate
Maximum estimate
N x103
Biomass
± 30%
N x103
Biomass
± 30%
N x103
Biomass
± 30%
Mytilus galloprovincialis
1 246.0
3.738
1.121
5 355.5
16.066
4.820
9 012.1
27.036
8.111
Perna canaliculus
25.1
0.100
0.030
107.9
0.432
0.130
181.6
0.727
0.218
Aulacomya maoriana
3.8
0.008
0.002
16.2
0.032
0.010
27.2
0.054
0.016
Ostrea chilensis
2.6
0.005
0.002
11.1
0.022
0.007
18.7
0.037
0.011
Purpurocardia ?sp
36.4
0.036
0.011
156.4
0.156
0.047
263.2
0.263
0.079
Paphies australis
402.1
0.402
0.121
1 728.1
1.728
0.518
2 908.0
2.908
0.872
Paphies subtriangulata
14.8
0.030
0.009
63.6
0.127
0.038
107.0
0.214
0.064
Austrovenus stutchburyi
269.5
0.539
0.162
1 158.5
2.317
0.695
1 949.6
3.899
1.170
Cellana strigilis
13.0
0.026
0.008
55.7
0.111
0.033
93.8
0.188
0.056
Notoacm
ea elongata
3.6
0.004
0.001
15.3
0.015
0.005
25.8
0.026
0.008
Patelloida corticata
11.5
0.011
0.003
49.3
0.049
0.015
83.0
0.083
0.025
Haliotis iris
22.0
3.298
0.990
94.5
14.177
4.253
159.0
23.857
7.157
Haliotis australis
1.0
0.099
0.030
4.2
0.425
0.127
7.1
0.715
0.214
Cantharidus ?sp
14.9
0.015
0.004
64.0
0.064
0.019
107.6
0.108
0.032
Diloma aethiops
43.6
0.087
0.026
187.2
0.374
0.112
315.1
0.630
0.189
Diloma subrostrata
3.5
0.004
0.001
15.2
0.015
0.005
25.6
0.026
0.008
Diloma ?sp
12.7
0.190
0.057
54.5
0.818
0.245
91.7
1.376
0.413
Cookia sulcata
13.9
0.208
0.063
59.7
0.896
0.269
100.5
1.507
0.452
Lunella smaragdus
35.3
0.141
0.042
151.9
0.608
0.182
255.6
1.023
0.307
Maoricrypta ?sp
3.2
0.003
0.001
13.6
0.014
0.004
22.8
0.023
0.007
Amphibola crenata
977.3
0.977
0.293
4 200.5
4.201
1.260
7 068.5
7.069
2.121
Siphonaria ?sp
4.0
0.004
0.001
17.0
0.017
0.005
28.6
0.029
0.009
all others
27.3
0.080
0.024
117.5
0.344
0.103
197.8
0.579
0.174
TOTAL
3 186.9
10.007
3.002
13 697.6
43.009
12.903
23 050.1
72.375
21.713

38
Table 16:
Estimated numbers (N x 103) and biomass (tonnes) of shellfish harvested in Otago-Catlins at ca. 1750 AD.
Minimum estimate
Best estimate
Maximum estimate
N x103
Biomass
± 30%
N x103
Biomass
± 30%
N x103
Biomass
± 30%
Mytilus galloprovincialis
2 032.6
6.098
1.829
2 730.0
8.190
2.457
3 533.9
10.602
3.180
Perna canaliculus
69.1
0.276
0.083
92.8
0.371
0.111
120.1
0.480
0.144
Aulacomya maoriana
13.0
0.026
0.008
17.5
0.035
0.011
22.7
0.045
0.014
Mytilidae ?sp.
99.0
0.099
0.030
132.9
0.133
0.040
172.1
0.172
0.052
Ostrea chilensis
5.5
0.011
0.003
7.3
0.015
0.004
9.5
0.019
0.006
Paphies australis
34.6
0.035
0.010
46.4
0.046
0.014
60.1
0.060
0.018
Paphies subtriangulata
33.7
0.067
0.020
45.3
0.091
0.027
58.6
0.117
0.035
Paphies ventricosa
5.0
0.020
0.006
6.7
0.027
0.008
8.6
0.034
0.010
Austrovenus stutchburyi
109.1
0.218
0.065
146.6
0.293
0.088
189.7
0.379
0.114
Cellana radians
427.1
0.854
0.256
573.7
1.147
0.344
742.6
1.485
0.446
Cellana ?sp.
467.6
0.468
0.140
628.0
0.628
0.188
812.9
0.813
0.244
Haliotis iris
174.4
26.164
7.849
234.3
35.142
10.543
303.3
45.490
13.647
Scutus breviculus
144.4
2.166
0.650
194.0
2.910
0.873
251.1
3.766
1.130
Zethalia zelandica
2.5
0.003
0.001
3.4
0.003
0.001
4.4
0.004
0.001
Cookia sulcata
16.7
0.250
0.075
22.4
0.336
0.101
29.0
0.435
0.131
Lunella smaragdus
244.3
0.977
0.293
328.1
1.312
0.394
424.7
1.699
0.510
Haustrum lacunosum
4.7
0.009
0.003
6.4
0.013
0.004
8.2
0.016
0.005
Amphibola crenata
511.7
0.512
0.154
687.3
0.687
0.206
889.6
0.890
0.267
all others
4.0
0.004
0.001
5.4
0.005
0.002
7.0
0.007
0.002
TOTAL
4 398.9
38.257
11.477
5 908.4
51.385
15.416
7 648.2
66.515
19.955

39
Table 17:
Estimated numbers (N) and biomass (tonnes) of marine and coastal birds harvested in Greater Hauraki at ca. 1400 AD.
Minimum estimate
Best estimate
Maximum estimate
N Biomass
± 30%
N
Biomass
± 30%
N
Biomass
± 30%
Eudyptula minor
714
0.785
0.236
4 248
4.673
1.402
6 340
6.974
2.092
Diomedeidae ?sp
94
0.425
0.128
562
2.530
0.759
839
3.775
1.133
Macronectes halli
30
0.134
0.040
177
0.798
0.239
264
1.190
0.357
Pterodroma macroptera
115
0.057
0.017
682
0.341
0.102
1 018
0.509
0.153
Pachyptila vitata
51
0.010
0.003
306
0.061
0.018
457
0.091
0.027
Puffinus griseus
177
0.142
0.043
1 054
0.844
0.253
1 574
1.259
0.378
Puffinus gavia
327
0.098
0.029
1 944
0.583
0.175
2 901
0.870
0.261
Puffinus assimilis
144
0.029
0.009
854
0.171
0.051
1 274
0.255
0.076
Pelecanoides urinatrix
181
0.024
0.007
1 076
0.140
0.042
1 606
0.209
0.063
Morus serrator
8
0.017
0.005
45
0.103
0.031
67
0.154
0.046
Phalacrocorax melanoleucos
48
0.034
0.010
288
0.202
0.061
430
0.301
0.090
Phalacrocorax carbo
102
0.225
0.068
609
1.339
0.402
908
1.998
0.600
Phalacrocorax varius
191
0.383
0.115
1 139
2.277
0.683
1 699
3.398
1.019
Stictocarbo punctatus
555
0.667
0.200
3 305
3.966
1.190
4 932
5.918
1.775
Calidras canutus rogersi
4
0.000
0.000
23
0.002
0.001
35
0.003
0.001
Charadrius obscurus
4
0.001
0.000
23
0.003
0.001
35
0.005
0.002
Anarhyncus frontalis
4
0.000
0.000
23
0.001
0.000
35
0.002
0.001
Larus dominicanus
202
0.171
0.051
1 199
1.019
0.306
1 790
1.521
0.456
Larus novaehollandiae
4
0.001
0.000
23
0.006
0.002
35
0.009
0.003
Hydroprogne caspia
25
0.017
0.005
149
0.104
0.031
222
0.155
0.047
Childonias albostriata
25
0.002
0.001
149
0.012
0.004
222
0.018
0.005
Sterna striata
4
0.001
0.000
23
0.004
0.001
35
0.006
0.002
TOTAL
3 009
3.223
0.967
17 902
19.178
5.753
26 716
28.620
8.586

40
Table 18:
Estimated numbers (N) and biomass (tonnes) of marine and coastal birds harvested in Greater Hauraki at ca. 1550 AD.
Minimum estimate
Best estimate
Maximum estimate
N Biomass
± 30%
N
Biomass
± 30%
N
Biomass
± 30%
Eudyptula minor
1 753
1.928
0.578
4 639
5.103
1.531
6 694
7.364
2.209
Diomedeidae ?sp
1 480
6.659
1.998
3 916
17.622
5.287
5 651
25.430
7.629
Pterodroma macroptera
823
0.411
0.123
2 177
1.088
0.327
3 141
1.571
0.471
Phalacrocorax melanoleucos
370
0.259
0.078
979
0.686
0.206
1 413
0.989
0.297
Stictocarbo punctatus
892
1.070
0.321
2 360
2.832
0.849
3 405
4.086
1.226
Larus dominicanus
370
0.315
0.094
979
0.833
0.250
1 413
1.201
0.360
Sterna striata
370
0.059
0.018
979
0.157
0.047
1 413
0.226
0.068
TOTAL
6 057
10.701
3.210
16 030
28.320
8.496
23 132
40.867
12.260
Table 19:
Estimated numbers (N) and biomass (tonnes) of marine and coastal birds harvested in Greater Hauraki at ca. 1750 AD.
Minimum estimate
Best estimate
Maximum estimate
N Biomass
± 30%
N
Biomass
± 30%
N
Biomass
± 30%
Eudyptula minor
4 392
4.831
1.449
7 819
8.601
2.580
10 929
12.022
3.607
Diomedeidae ?sp
2 196
9.881
2.964
3 909
17.593
5.278
5 465
24.591
7.377
Pterodroma macroptera
4 392
2.196
0.659
7 819
3.909
1.173
10 929
5.465
1.639
Puffinus gavia
6 587
1.976
0.593
11 728
3.519
1.056
16 394
4.918
1.475
Pelecanoides urinatrix
2 196
0.285
0.086
3 909
0.508
0.152
5 465
0.710
0.213
Procellariidae ?sp
2 196
0.751
0.225
3 909
1.337
0.401
5 465
1.869
0.561
Phalacrocorax melanoleucos
2 196
1.537
0.461
3 909
2.737
0.821
5 465
3.825
1.148
Stictocarbo punctatus
6 587
7.905
2.371
11 728
14.074
4.222
16 394
19.673
5.902
Larus dominicanus
2 196
1.866
0.560
3 909
3.323
0.997
5 465
4.645
1.393
Sterna striata
2 196
0.351
0.105
3 909
0.626
0.188
5 465
0.874
0.262
TOTAL
35 132
31.579
9.474
62 552
56.226
16.868
87 435
78.593
23.578

41
Table 20:
Estimated numbers (N) and biomass (tonnes) of marine and coastal birds harvested in Otago-Catlins at ca. 1400 AD.
Minimum estimate
Best estimate
Maximum estimate
N Biomass
± 30%
N
Biomass
± 30%
N
Biomass
± 30%
Eudyptes pachyrhynchus
493
1.974
0.592
2 121
8.484
2.545
3 432
13.727
4.118
Megadyptes ?sp
388
2.036
0.611
1 667
8.752
2.626
2 697
14.161
4.248
Eudyptula minor
533
0.586
0.176
2 291
2.520
0.756
3 707
4.077
1.223
Diomedea exulans
19
0.149
0.045
80
0.640
0.192
130
1.036
0.311
Thalassarche bulleri
16
0.003
0.001
69
0.014
0.004
112
0.022
0.007
Thalassarche cauta
242
1.087
0.326
1 039
4.674
1.402
1 681
7.562
2.269
Pterodroma inexpecta
58
0.019
0.006
248
0.081
0.024
401
0.130
0.039
Pterodroma cookii
55
0.011
0.003
237
0.047
0.014
384
0.077
0.023
Pachyptila vitata
42
0.008
0.003
183
0.037
0.011
295
0.059
0.018
Pachyptila turtur
186
0.023
0.007
800
0.100
0.030
1 295
0.162
0.049
Puffinus griseus
314
0.251
0.075
1 351
1.081
0.324
2 186
1.748
0.525
Puffinus tenuirostris
42
0.025
0.008
180
0.108
0.032
291
0.175
0.052
Puffinus gavia
69
0.021
0.006
295
0.089
0.027
478
0.143
0.043
Pelagodroma marina
22
0.001
0.000
95
0.004
0.001
153
0.007
0.002
Pelecanoides urinatrix
225
0.029
0.009
967
0.126
0.038
1 565
0.204
0.061
Pelecanoides georgicus
98
0.012
0.004
420
0.050
0.015
680
0.082
0.024
Phalacrocorax melanoleucos
28
0.020
0.006
122
0.085
0.026
197
0.138
0.041
Phalacrocorax carbo
29
0.064
0.019
124
0.273
0.082
201
0.442
0.133
Phalacrocorax varius
132
0.265
0.079
569
1.138
0.341
921
1.842
0.553
Leucocarbo chalconotus
170
0.425
0.127
731
1.827
0.548
1 182
2.956
0.887
Stictocarbo punctatus
338
0.406
0.122
1 454
1.745
0.524
2 353
2.824
0.847
Larus dominicanus
59
0.050
0.015
255
0.217
0.065
413
0.351
0.105
Larus novaehollandiae
21
0.005
0.002
90
0.023
0.007
146
0.036
0.011
Childonias albostriata
11
0.001
0.000
48
0.004
0.001
78
0.006
0.002
Sterna striata
45
0.007
0.002
195
0.031
0.009
315
0.050
0.015
TOTAL
3 637
7.480
2.244
15 632
32.149
9.645
25 294
52.018
15.605

42
Table 21:
Estimated numbers (N) and biomass (tonnes) of marine and coastal birds harvested in Otago-Catlins at ca. 1550 AD.
Minimum estimate
Best estimate
Maximum estimate
N Biomass
± 30%
N
Biomass
± 30%
N
Biomass
± 30%
Eudyptes pachyrhynchus
340
1.358
0.408
1 460
5.838
1.751
2 456
9.825
2.947
Megadyptes ?sp
303
1.591
0.477
1 303
6.839
2.052
2 192
11.509
3.453
Eudyptula minor
1 118
1.230
0.369
4 804
5.285
1.585
8 085
8.893
2.668
Thalassarche cauta
354
1.595
0.479
1 524
6.856
2.057
2 564
11.537
3.461
Pachyptila turtur
238
0.030
0.009
1 333
0.128
0.038
1 724
0.215
0.065
Puffinus griseus
249
0.200
0.060
584
0.858
0.257
1 804
1.444
0.433
Puffinus gavia
349
0.105
0.031
2 685
0.450
0.135
2 526
0.758
0.227
Puffinus assimilis
190
0.133
0.040
1 167
0.571
0.171
1 373
0.961
0.288
Pelagodroma marina
175
0.008
0.002
584
0.034
0.010
1 266
0.057
0.017
Pelecanoides urinatrix
971
0.126
0.038
2 666
0.543
0.163
7 024
0.913
0.274
Phalacrocorax melanoleucos
214
0.150
0.045
8 497
0.643
0.193
1 546
1.082
0.325
Phalacrocorax carbo
260
0.572
0.172
1 117
2.458
0.737
1 880
4.136
1.241
Phalacrocorax varius
234
0.468
0.140
1 997
2.010
0.603
1 691
3.383
1.015
Leucocarbo chalconotus
354
0.886
0.266
1 524
3.809
1.143
2 564
6.410
1.923
Stictocarbo punctatus
1 912
2.294
0.688
8 216
9.860
2.958
13 826
16.592
4.978
Larus dominicanus
185
0.158
0.047
1 566
0.677
0.203
1 341
1.140
0.342
TOTAL
7 447
10.902
3.271
47 447
46.859
14.058
53 862
78.854
23.656

43
Table 22:
Estimated numbers (N) and biomass (tonnes) of marine and coastal birds harvested in Otago-Catlins at ca. 1750 AD.
Minimum estimate
Best estimate
Maximum estimate
N Biomass
± 30%
N
Biomass
± 30%
N
Biomass
± 30%
Eudyptes pachyrhynchus
318
1.272
0.382
427
1.709
0.513
553
2.212
0.664
Megadyptes ?sp
1 272
6.680
2.004
1 709
8.972
2.692
2 212
11.614
3.484
Diomedea exulans
590
4.723
1.417
793
6.344
1.903
1 026
8.212
2.463
Diomedea epomorpha
405
3.239
0.972
544
4.350
1.305
704
5.631
1.689
Thalassarche chrysostoma
648
2.917
0.875
871
3.918
1.175
1 127
5.072
1.521
Thalassarche bulleri
70
0.014
0.004
94
0.019
0.006
121
0.024
0.007
Thalassarche cauta
3 403
15.311
4.593
4 570
20.565
6.170
5 916
26.621
7.986
Pterodroma cookii
824
0.107
0.032
1 107
0.144
0.043
1 433
0.186
0.056
Pachyptila vitata
1 031
0.206
0.062
1 385
0.277
0.083
1 793
0.359
0.108
Puffinus gavia
318
0.095
0.029
427
0.128
0.038
553
0.166
0.050
Pelagodroma marina
181
0.008
0.002
243
0.011
0.003
314
0.014
0.004
Pelecanoides urinatrix
496
0.065
0.019
667
0.087
0.026
863
0.112
0.034
Phalacrocorax carbo
916
2.015
0.604
1 230
2.706
0.812
1 592
3.503
1.051
Phalacrocorax varius
359
0.718
0.215
482
0.965
0.289
624
1.249
0.375
Leucocarbo chalconotus
4 506
11.265
3.380
6 052
15.131
4.539
7 835
19.586
5.876
Stictocarbo punctatus
6 118
7.342
2.203
8 218
9.861
2.958
10 637
12.765
3.829
Larus dominicanus
1 627
3.578
1.074
2 185
4.806
1.442
2 828
6.222
1.866
Larus novaehollandiae
1 014
0.264
0.079
1 363
0.354
0.106
1 764
0.459
0.138
TOTAL
24 097
59.819
17.946
32 366
80.346
24.104
41 896
104.004
31.201

44
Table 23:
Estimated numbers (N) and biomass (tonnes) of marine mammals harvested in Greater Hauraki at ca. 1400 AD.
Minimum estimate
Best estimate
Maximum estimate
N Biomass
± 30%
N
Biomass
± 30%
N
Biomass
± 30%
Arctocephalus forsteri
- pup
74
0.639
0.192
442
3.799
1.140
659
5.670
1.701
- juvenile
233
5.837
1.751
1 389
34.729
10.419
2 073
51.830
15.549
- sub adult male
202
20.166
6.050
1 200
119.979
35.994
1 791
179.055
53.716
- adult female
42
2.125
0.637
253
12.642
3.793
377
18.866
5.660
- adult male
127
19.111
5.733
758
113.705
34.111
1 131
169.692
50.907
- total
679
47.877
14.363
4 042
284.853
85.456
6 032
425.112
127.534
Phocarctus hookeri
95
10.663
3.199
564
63.443
19.033
842
94.682
28.405
Mirounga leonina
1
0.790
0.237
5
4.700
1.410
7
7.013
2.104
Globicephala ?sp
7
9.668
2.900
42
57.522
17.257
63
85.845
25.754
Dolphin ?sp
8
0.667
0.200
47
3.971
1.191
70
5.926
1.778
Total
790
69.666
20.900
4 700
414.489
124.347
7 013
618.579
185.574
Table 24:
Estimated numbers (N) and biomass (tonnes) of marine mammals harvested in Greater Hauraki at ca. 1550 AD.
Minimum estimate
Best estimate
Maximum estimate
N Biomass
± 30%
N
Biomass
± 30%
N
Biomass
± 30%
Dolphin ?sp
8
0.667
0.200
21
1.791
0.537
31
2.584
0.775
Table 25:
Estimated numbers (N) and biomass (tonnes) of marine mammals harvested in Greater Hauraki at ca. 1750 AD.
Minimum estimate
Best estimate
Maximum estimate
N Biomass
± 30%
N
Biomass
± 30%
N
Biomass
± 30%
Dolphin ?sp
14
1.198
0.359
25
2.133
0.640
35
2.981
0.894

45
Table 26:
Estimated numbers (N) and biomass (tonnes) of marine mammals harvested in Otago-Catlins at ca. 1400 AD.
Minimum estimate
Best estimate
Maximum estimate
N Biomass
± 30%
N
Biomass
± 30%
N
Biomass
± 30%
Arctocephalus forsteri
- pup
64
0.549
0.165
274
2.355
0.706
443
3.810
1.143
- juvenile
492
12.303
3.691
2 112
52.795
15.839
3 417
85.426
25.628
- sub adult male
191
19.140
5.742
821
82.135
24.640
1 329
132.899
39.870
- adult female
82
4.104
1.231
352
17.612
5.283
570
28.497
8.549
- adult male
128
19.140
5.742
548
82.135
24.640
886
132.899
39.870
- total
957
55.235
16.571
4 107
237.030
71.109
6 645
383.529
115.059
Phocarctus hookeri
260
29.262
8.779
1 121
126.163
37.849
1 815
204.140
61.242
Mirounga leonina
1
1.227
0.368
5
5.265
1.580
9
8.519
2.556
Hydrurga leptonyx
1
0.153
0.046
5
0.658
0.197
9
1.065
0.319
Dolphin ?sp
6
0.518
0.156
26
2.224
0.667
43
3.599
1.080
Total
1 226
86.396
25.919
5 265
371.341
111.402
8 519
600.852
180.256

46
Table 27:
Estimated numbers (N) and biomass (tonnes) of marine mammals harvested in Otago-Catlins at ca. 1550 AD.
Minimum estimate
Best estimate
Maximum estimate
N Biomass
± 30%
N
Biomass
± 30%
N
Biomass
± 30%
Arctocephalus forsteri
- pup
22
0.192
0.058
96
0.826
0.248
162
1.390
0.417
- juvenile
215
5.374
1.612
924
23.098
6.929
1 555
38.869
11.661
- sub adult male
84
8.416
2.525
362
36.171
10.851
609
60.867
18.260
- adult female
30
1.509
0.453
130
6.484
1.945
218
10.911
3.273
- adult male
57
8.538
2.561
245
36.696
11.009
412
61.751
18.525
- total
409
24.028
7.208
1 756
103.274
30.982
2 955
173.788
52.136
Phocarctus hookeri
77
8.664
2.599
331
37.240
11.172
557
62.666
18.800
Hydrurga leptonyx
0.5
0.061
0.018
2
0.263
0.079
4
0.442
0.133
Globicephala ?sp
0.5
0.665
0.200
2
2.858
0.858
4
4.810
1.443
Dolphin ?sp
2
0.207
0.062
11
0.888
0.266
18
1.494
0.448
Total
489
33.625
10.088
2 102
144.523
43.357
3 537
243.201
72.960
Table 28:
Estimated numbers (N) and biomass (tonnes) of marine mammals harvested in Otago-Catlins at ca. 1750 AD.
Minimum estimate
Best estimate
Maximum estimate
N Biomass
± 30%
N
Biomass
± 30%
N
Biomass
± 30%
Arctocephalus forsteri
- juvenile
555
13.880
4.164
745
18.613
5.584
964
24.093
7.228
- sub adult male
218
21.802
6.541
292
29.235
8.771
378
37.843
11.353
- adult male
145
21.756
6.527
194
29.173
8.752
252
37.763
11.329
- total
918
57.437
17.231
1 231
77.021
23.106
1 594
99.700
29.910
Globicephala ?sp
24
32.772
9.832
32
44.018
13.205
42
56.979
17.094
Dolphin ?sp
5
0.390
0.117
6
0.523
0.157
8
0.677
0.203
Total
947
90.600
27.180
1 270
121.562
36.469
1 644
157.356
47.207

47
Table 29: Taxa harvested at ca. 1750 AD as a proportion of taxa harvested at ca. 1400 AD.
Greater Hauraki Otago-Catlins
Fish 0.68 0.41
Shellfish 0.43 0.53
Marine and coastal bird 0.45 0.72
Marine mammal 0.20 0.60

48
Figure 1: Greater Hauraki and Otago-Catlins, showing location of study sites and other pre-European
Maori sites.

49
Figure 2: Simplified model of analytical procedure.

50
Figure 3: Procedures used in determining energy yield per species in study assemblages.

51
Figure 4: (A) Estimated growth rate for total New Zealand population based on cumulative frequency of
radiocarbon dates (after McFadgen et al. 1994: Figure 4) showing proportion of population at
ca. 1550 AD. (B) Frequency of radiocarbon dated assemblages in Otago-Catlins study dataset.

52
Figure 5: Minimum, best and maximum estimates for biomass of snapper harvested in Greater Hauraki.
53
Figure 6: Best estimates for biomass harvested from four classes of marine fauna in each study area

54
APPENDIX 1 DATA INPUTS FOR MARINE ANIMAL SPECIES
The following tables list for each taxon at each of three focal dates in each study area (1) its frequency as a proportion of all animals in the faunal classes to
which it belongs (taxon frequency, as defined in section 2.3.2), and (2) its proportional contribution to total energy derived from all animal foods
(proportional energy contribution as defined in section 2.3.5).
Appendix 1.1
Fish – Greater Hauraki
ca 1400 AD
ca 1550 AD
ca 1750 AD
Taxon
Taxon
frequency
Proportional
energy
contribution
Taxon
frequency
Proportional
energy
contribution
Taxon
frequency
Proportional
energy
contribution
Squalus blainvillei
northern dogfish
2.08
0.8475
Carcharhiniforme ?sp
shark ?sp
0.19
0.2231
2.21
9.6544
6.25
15.2029
Myliobatis tenuicaudatus
eagle ray
0.02
0.0315
2.08
6.7799
Elasmobranchii ?sp
Elasmobranch ?sp
0.21
0.1443
Callorhinchus milii
ghost shark
0.02
0.0066
Anguilla spp
eel spp.
0.21
0.0104
1.33
0.2461
4.86
0.5008
Pseudophycis bachus
red cod
0.21
0.0131
Zeus faber
john dory
0.41
0.0300
Chelidonichthys kumu
red gurnard
0.72
0.0262
0.31
0.0420
2.08
0.1568
Pseudocaranx dentex
trevally
0.05
0.0049
2.91
1.0570
4.86
0.9829
Trachurus declivis
jack mackerel
0.02
0.0017
0.05
0.0159
2.08
0.3688
Trachurus novaezelandiae
horse mackerel
0.02
0.0013
27.92
6.8394
Carangidae ?sp
carangidae
2.08
0.2882
Arripis trutta
kahawai
14.06
2.3744
10.94
6.8730
4.17
1.4587
Pagrus auratus
snapper
43.12
5.7160
36.88
18.1870
59.06
16.2171
Nem
adactylus macropterus
terakihi
3.51
0.2502

55
Appendix 1.1 continued
ca 1400 AD
ca 1550 AD
ca 1750 AD
Taxon
frequency
Proportional
energy
contribution
Taxon
frequency
Proportional
energy
contribution
Taxon
frequency
Proportional
energy
contribution
Latridopsis ciliaris
blue moki
0.62
0.1114
Mugil cephalus
grey mullet
0.02
0.0018
1.33
0.4446
Aldrichetta forsteri
yellow-eyed mullet
4.26
0.0503
2.21
0.0971
2.08
0.0509
Labridae
wrasses
11.81
0.9092
1.33
0.3809
2.08
0.3317
Odax pullus
butterfish
2.08
0.1990
Genyagnus monopterygius
spotted stargazer
0.01
0.0009
Parapercis colias
blue cod
0.93
0.0301
0.01
0.0012
Thyrsites atun
barracouta
0.87
0.1180
6.36
3.2091
2.08
0.5844
Scomber australasicus
blue mackerel
2.66
0.9502
Serollela brama
common warehou
0.19
0.0395
Meuschenia scaber
leatherjacket
18.53
0.6459
2.08
0.1502
Rhombosolea ?sp
flounder ?sp
3.54
0.1932
Total
100
10.74
100
48.19
100
44.12

56
Appendix 1.2
Fish – Otago-Catlins
ca 1400 AD
ca 1550 AD
ca 1750 AD
Taxon
frequency
Proportional
energy
contribution
Taxon
frequency
Proportional
energy
contribution
Taxon
frequency
Proportional
energy
contribution
Elasmobranchii ?sp
elasmobranch ?sp
0.010
0.0029
0.31
0.8597
0.10
0.1925
Callorhinchus milii
ghost shark
0.10
0.0926
Anguilla spp
eel spp
0.010
0.0066
Pseudophycis bachus
red cod
13.359
0.3474
25.98
6.5376
19.93
3.4820
Lotella rhacinus
rock cod
0.010
0.0002
Genypterus blacodes
ling
4.572
0.4320
4.14
3.7856
4.97
3.1553
Helicolenus barathris
sea perch
0.040
0.0002
0.04
0.0023
Scorpaena papillosus
red rock cod
0.04
0.0058
Scorpaena cardinalis
red scorpion fish
0.408
0.0061
0.60
0.0864
Neophrynichthys latus
dark toadfish
0.04
0.0170
Chelidonichthys kumu
red gurnard
0.005
0.0001
Polyprion oxygenios
hapuku
1.130
0.6379
2.14
11.6921
5.05
19.1564
Trachurus declivis
jack mackerel
0.005
0.0002
Trachurus novaezelandiae
horse mackerel
0.204
0.0056
Pagrus auratus
snapper
3.012
0.1665
Nem
adactylus macropterus
terakihi
0.428
0.0127
0.06
0.0173
Latridopsis ciliaris
blue moki
0.348
0.0261
0.03
0.0151
Latris lineata
trumpeter
2.409
0.2006
0.77
0.6205
Aldrichetta forsteri
yellow-eyed mullet
0.010
0.0000
Labridae
wrasses
2.677
0.0859
6.11
1.8982
0.60
0.1294
Nototheniidae
black cods
6.618
0.2039
6.86
2.0459
Parapercis colias
blue cod
9.469
0.1277
5.20
0.6785
0.13
0.0118

57
Appendix 1.2 continued
ca 1400 AD
ca 1550 AD
ca 1750 AD
Taxon
frequency
Proportional
energy
contribution
Taxon
frequency
Proportional
energy
contribution
Taxon
frequency
Proportional
energy
contribution
Thyrsites atun
barracouta
55.236
3.1239
47.71
26.1132
69.09
26.2549
Rexia solandri
gemfish
0.030
0.0025
Hyperoglyphe antarctica
bluenose warehou
0.010
0.0010
Total
100.000
5.39
100.000
54.36
100.000
52.49
Appendix 1.3
Shellfish – Greater Hauraki
ca 1400
ca 1550
ca 1750
Taxon
Taxon
frequency
Proportional
energy
contribution
Taxon
frequency
Proportional
energy
contribution
Taxon
frequency
Proportional
energy
contribution
Linucula hartvigiana
nut shell
0.008
0.000010
Mytilus galloprovincialis
blue mussel
0.718
0.002722
0.001
0.000642
Perna canaliculus
green-lipped mussel
15.965
0.080051
0.029
0.043792
0.088
0.153952
Limnoperna pulex
little black mussel
0.004
0.000006
Barbatia novaezealandiae
ark shell
0.002
0.000002
Glycerm
is modesta
small dog cockle
0.001
0.000001
Tucetona laticostata
large dog cockle
0.015
0.000019
Ostrea chilensis
mud oyster/bluff oyster
0.028
0.026970
0.001
0.001138
Saccostrea cuccullata glomerata
rock oyster
0.080
0.000101
0.086
0.032395
oyster ?sp.
8.201
0.020743
0.030
0.022491

58
Appendix 1.3 continued
ca 1400 AD
ca 1550 AD
ca 1750 AD
Taxon
frequency
Proportional
energy
contribution
Taxon
frequency
Proportional
energy
contribution
Taxon
frequency
Proportional
energy
contribution
Anomia trigonopsis
golden oyster
0.043
0.000054
Pecten novaezelandiae
queen scallop
0.055
0.000073
0.085
0.033485
0.011
0.005141
Pecten ?sp.
0.022
0.000028
0.093
0.036623
Talochlamys zelandiae
fan scallop
0.002
0.000002
Divalucina cumingi
lace cockle
0.062
0.000079
Cardita aoteana
dog foot cockle
0.069
0.026117
Purpurocardia purpurata
purple cockle
0.025
0.000032
Purpurocardia ?sp.
0.106
0.040190
1.356
0.597315
Myllita stowei
0.002
0.000002
Cyclomactra ovata
oval trough shell
0.006
0.004210
Mactra discors
large trough shell
0.003
0.003548
0.583
0.770092
Mactra ?sp.
0.007
0.004937
Paphies australis
pipi
2.761
0.001796
34.385
6.696830
40.687
9.217530
Paphies subtriangulata
tuatua
9.201
0.032120
5.146
5.377563
8.572
10.419895
Paphies ventricosa
toheroa
0.018
0.027131
Diplodonta striatula
0.001
0.000001
Felaniella zelandica
0.004
0.000006
Austrovenus stutchburyi
cockle
2.613
0.003566
52.954
21.632550
46.474
22.084135
Protothaca crassicostata
ribbed venus
0.406
0.000513
0.001
0.000440
Tawera spissa
morning star
0.096
0.000121
Tawera ?sp.
0.031
0.000039
0.028
0.010587
Dosinia anus
ringed venus shell
0.261
0.000660
0.016
0.011878
0.011
0.009873
Dosinia subrosea
fine dosinia
0.014
0.010593
Dosinia ?sp.
1.099
0.002779
0.001
0.000513
0.032
0.028095
Irus reflexus
irregular cockle
0.025
0.000031
Myadora striata
battleaxe
0.032
0.014047

59
Appendix 1.3 continued
ca 1400 AD
ca 1550 AD
ca 1750 AD
Taxon
frequency
Proportional
energy
contribution
Taxon
frequency
Proportional
energy
contribution
Taxon
frequency
Proportional
energy
contribution
Cellana denticulata
denticulate limpet
12.177
0.030800
Cellana ornata
ornate limpet
0.028
0.000035
Cellana radians
radiate limpet
7.119
0.018006
0.124
0.094021
Asteracm
ea suteri
0.001
0.000001
Patelloida corticata
encrusted limpet
0.315
0.000398
Haliotis iris
paua
1.014
0.238822
0.000
0.031834
0.001
0.082054
Haliotis australis
silver paua
0.013
0.002075
Haliotis ?sp.
0.140
0.000178
Scutus breviculus
shield limpet
0.013
0.000251
0.004
0.021550
Tugali elegans
grooved limpet
0.043
0.000054
Coelotrochus viridius
green top shell
0.016
0.000020
Cantharidus ?sp.
0.003
0.000003
Diloma aethiops
spotted top shell
1.175
0.002972
1.478
1.119211
0.001
0.000881
Diloma bicanaliculata
knobbed topshell
0.001
0.000001
Diloma subrostrata
mudflat top shell
0.317
0.000400
Diloma ?sp
0.489
0.009279
Antisolarium egenum
0.194
0.000245
Zethalia zelandica
wheel shell
0.010
0.003876
0.351
0.154521
Trochidae ?sp.
0.003
0.000969
Calliostoma pellucidum
0.002
0.000002
Calliostoma punctulatum
spotted tiger shell
0.004
0.001437
Cookia sulcata
cooks turban
0.140
0.002664
0.001
0.006606
Lunella smaragdus
cats eye
20.366
0.103023
2.090
3.165479
0.047
0.082961
Herpetopoma bella
0.002
0.000002
Nerita atramentosa
black nerita
2.673
0.003380
Zeacumantus lutulentus
horn shell
0.006
0.000008
0.031
0.011752
0.233
0.102740

60
Appendix 1.3 continued
ca 1400 AD
ca 1550 AD
ca 1750 AD
Taxon
frequency
Proportional
energy
contribution
Taxon
frequency
Proportional
energy
contribution
Taxon
frequency
Proportional
energy
contribution
Zeacumantus subcarinatus
brown horn shell
0.005
0.002078
Zeacumantus ?sp.
0.063
0.023673
Maoricolpus roseus
turret shell
0.746
0.000943
0.040
0.015299
Maoricrypta ?sp.
0.081
0.030801
Rissoina ?sp.
0.003
0.000003
Struthiolaria papulosa
ostrich foot
0.274
0.207
0.094
0.082912
Maoricrypta costata
ribbed slipper shell
1.536
0.003884
Maoricrypta monoxyla
white slipper shell
0.585
0.000740
Sigapatella novaezelandiae
circular slipper shell
0.108
0.000272
Sigapatella tenuis
small circular slipper shell
0.131
0.000166
Lamellaria ophione
0.003
0.000003
Argobuccinum pustulosum
swollen trumpet shell
0.051
0.038758
Cabestana spengleri
spenglers trumpet shell
0.005
0.005814
Janthina janthina
violet snail
0.280
0.105870
Aethocola glans
knobbed whelk
0.258
0.000653
0.004
0.002924
0.014
0.012337
Buccinulum pallidum powelli
lined whelk
0.001
0.000002
Buccinulum vittatum vittatum
0.002
0.000002
Buccinulum ?sp.
0.029
0.010833
Cominella adspersa
speckled whelk
0.008
0.000020
0.160
0.121263
0.083
0.072874
Cominella glandiform
is
purple-mouthed whelk
0.086
0.000108
0.013
0.004937
0.056
0.024682
Cominella maculosa
spotted whelk
0.839
0.002122
0.023
0.017365
Cominella quoyana quoyana
quoy's whelk
0.008
0.000010
Cominella virgata
red mouthed whelk
0.018
0.000022
0.042
0.015803
0.070
0.030844
Cominella ?sp.
0.124
0.000157
0.236
0.089501
Penion sulcatus
siphon whelk
0.001
0.000003
0.008
0.008580
Zem
itrella ?sp.
0.001
0.000001

61
Appendix 1.3 continued
ca 1400 AD
ca 1550 AD
ca 1750 AD
Taxon
frequency
Proportional
energy
contribution
Taxon
frequency
Proportional
energy
contribution
Taxon
frequency
Proportional
energy
contribution
Taron ?sp.
0.005
0.000007
0.002
0.000676
0.013
0.005750
Haustrum haustorium
dark rock shell
1.402
0.026605
0.018
0.100685
0.001
0.006606
Haustrum scobina
oyster borer
0.226
0.000286
Murexsul mariae
0.002
0.000002
Murexsul octogonus
octagonal murex
0.002
0.000004
Xym
ene ambiguous
large trophon
0.064
0.000081
0.000
0.000169
0.193
0.084790
Xym
ene plebeius
0.055
0.000070
Xym
ene traversi
0.070
0.000088
Dicathais orbita
white rock shell
1.032
0.019570
0.018
0.100710
0.001
0.006606
Austromitra rubiginosa
0.043
0.000054
Alcithoe arabica
arabic volute
0.041
0.046954
0.001
0.001321
Amalda australis
southern olive shell
0.581
0.000735
Phenatoma rosea
pink tower shell
0.003
0.000003
Turbonilla zealandica
0.065
0.000082
Acteonidae ?sp
0.129
0.000163
Amphibola crenata
mudsnail
3.871
0.004895
1.568
0.593590
0.102
0.044774
Amuarochiton glaucus
0.022
0.000027
Antalis nana
tusk shell
0.028
0.000036
gastropod ?sp.
gastropod ?sp
0.193
0.073
0.897
0.395088
Total
100
0.62
100
40.11
100
44.50

62
Appendix 1.4
Shellfish – Otago-Catlins
ca 1400 AD
ca 1550 AD
ca 1750 AD
Taxon
frequency
Proportional
energy
contribution
Taxon
frequency
Proportional
energy
contribution
Taxon
frequency
Proportional
energy
contribution
Mytilus galloprovincialis
blue mussel
13.736
0.107401
39.098
1.154553
46.206
0.586416
Perna canaliculus
green-lipped mussel
1.348
0.013925
0.788
0.030769
1.570
0.026332
Aulacomya maoriana
ribbed mussel
0.047
0.000244
0.118
0.002324
0.297
0.002509
Limnoperna pulex
little black mussel
0.006
0.000062
Modiolus areolatus
bearded mussel
0.003
0.000093
Mytilidae sp.
2.250
0.009519
Barbatia novaezealandiae
ark shell
0.000
0.000000
Glycerm
is modesta
small dog cockle
0.001
0.000004
0.003
0.000028
Ostrea chilensis
mud oyster
0.000
0.000001
0.081
0.002050
0.124
0.001357
Purpurocardia ?sp.
false cockle ?sp
1.142
0.011240
Lasaea hinem
oana
0.004
0.000038
Mactra discors
large trough shell
0.120
0.000940
0.003
0.000084
Zenatia acinaces
scimitar mactra
0.000
0.000004
Paphies australis
pipi
35.018
0.046950
12.616
0.063885
0.786
0.001711
Paphies subtriangulata
tuatua
0.464
0.012617
0.767
0.008951
Paphies ventricosa
toheroa
0.113
0.001906
Macomona liliana
large wedge shell
0.007
0.000036
Serratina charlottae
wedge shell
0.003
0.000014
Austrovenus stutchburyi
cockle
33.473
0.094134
8.458
0.089839
2.481
0.011325
Protothaca crassicostata
ribbed venus
0.141
0.000367
Tawera spissa
morning star
0.012
0.000114
Tawera ?sp.
0.004
0.000038
Dosinia ?sp.
0.240
0.001253

63
Appendix 1.4 continued
ca 1400 AD
ca 1550 AD
ca 1750 AD
Taxon
frequency
Proportional
energy
contribution
Taxon
frequency
Proportional
energy
contribution
Taxon
frequency
Proportional
energy
contribution
Ruditapes largillierti
oblong venus
0.025
0.000064
0.028
0.000278
Myadora striata
battleaxe
0.000
0.000004
Cellana ornata
ornate limpet
0.046
0.000121
0.031
0.000305
Cellana radians
radiate limpet
0.035
0.000182
0.023
0.000457
9.710
0.082152
Cellana strigilis
striated limpet
0.888
0.004627
0.407
0.008012
0.017
0.000140
Cellana ?sp.
0.020
0.000052
0.007
0.000064
10.629
0.044966
Notoacm
ea elongata
0.012
0.000030
0.112
0.001105
Notoacm
ea pileopsis
black edged limpet
0.019
0.000190
Notoacm
ea scopulina
0.012
0.000030
0.004
0.000038
Patelloida corticata
encrusted limpet
0.197
0.000515
0.360
0.003543
Radiacm
ea inconspicua
0.004
0.000011
0.009
0.000084
Haliotis iris
paua
0.411
0.199726
0.690
1.266069
3.965
3.125533
Haliotis virginea
virgin paua
0.012
0.001880
0.004
0.002366
Haliotis australis
silver paua
0.081
0.026326
0.031
0.037352
Haliotis ?sp.
paua sp.
0.032
0.000083
0.014
0.000140
Emarginula ?sp
0.000
0.000002
Scutus breviculus
shield limpet
0.012
0.000454
0.010
0.001441
3.283
0.208336
Coelotrochus viridius
green top shell
0.012
0.000030
0.011
0.000107
0.008
0.000035
Cantharidius sanguineus
oval top shell
0.035
0.000343
Cantharidus ?sp.
0.432
0.004257
0.008
0.000035
Diloma aethiops
spotted top shell
2.858
0.014896
1.367
0.026917
0.017
0.000140
Diloma arida
0.031
0.000305
Diloma bicanaliculata
knobbed topshell
0.004
0.000038
Diloma nigerrima
bluish top shell
0.012
0.000030
0.063
0.000622
Diloma subrostrata
mudflat top shell
0.001
0.000004
0.111
0.001096
Diloma zelandica
0.025
0.000064
0.025
0.000243

64
Appendix 1.4 continued
ca 1400 AD
ca 1550 AD
ca 1750 AD
Taxon
frequency
Proportional
energy
contribution
Taxon
frequency
Proportional
energy
contribution
Taxon
frequency
Proportional
energy
contribution
Diloma ?sp
0.120
0.004695
0.398
0.058709
Zethalia zelandica
wheel shell
0.001
0.000004
0.084
0.000823
0.058
0.000245
Cookia sulcata
cooks turban
0.488
0.019082
0.436
0.064340
0.379
0.024064
Lunella smaragdus
cats eye
0.486
0.005066
1.109
0.043645
5.553
0.093963
Modelia granosa
southern cats eye
0.031
0.000243
0.004
0.000114
Maoricolpus roseus
turret shell
0.001
0.000004
0.005
0.000045
Maoricrypta ?sp.
0.311
0.000810
0.099
0.000972
Zeaculpus symmetricus
Stewart Island turret shell
0.023
0.000229
Risellopsis varia
0.004
0.000038
Littorinidae ?sp
0.017
0.000165
Struthiolaria ?sp
0.001
0.000007
0.000
0.000004
Sigapatella novaezelandiae
circular slipper shell
0.006
0.000116
Argobuccinum pustulosum
swollen trumpet shell
0.120
0.000627
Aethocola glans
knobbed whelk
0.008
0.000070
Buccinulum linea
many-lined whelk
0.012
0.000229
Buccinulum vittatum littorinoides
0.019
0.000190
Buccinulum ?sp.
0.000
0.000001
0.015
0.000299
Cominella glandiform
is
purple-mouthed whelk
0.003
0.000007
0.012
0.000118
Cominella ?sp.
0.003
0.000007
0.003
0.000028
Haustrum lacunosum
white whelk
0.005
0.000026
0.039
0.000770
0.108
0.000910
Haustrum scobina
oyster borer
0.009
0.000089
Xym
ene ambiguous
large trophon
0.001
0.000009
Xym
ene huttoni
0.003
0.000028
Xym
ene ?sp.
0.012
0.000030
0.012
0.000114
Paratrophon patens
rock trophon
0.046
0.000121
0.031
0.000305
Muricidae ?sp
0.009
0.000087
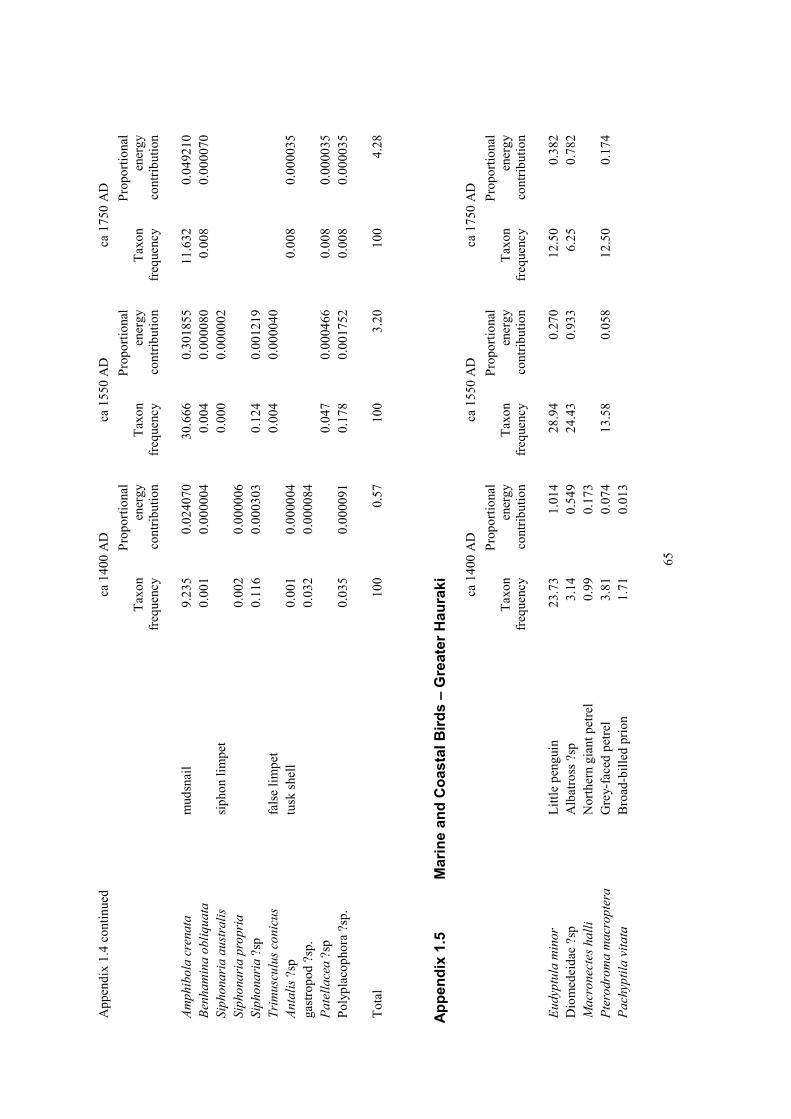
65
Appendix 1.4 continued
ca 1400 AD
ca 1550 AD
ca 1750 AD
Taxon
frequency
Proportional
energy
contribution
Taxon
frequency
Proportional
energy
contribution
Taxon
frequency
Proportional
energy
contribution
Amphibola crenata
mudsnail
9.235
0.024070
30.666
0.301855
11.632
0.049210
Benhamina obliquata
0.001
0.000004
0.004
0.000080
0.008
0.000070
Siphonaria australis
siphon limpet
0.000
0.000002
Siphonaria propria
0.002
0.000006
Siphonaria ?sp
0.116
0.000303
0.124
0.001219
Trimusculus conicus
false limpet
0.004
0.000040
Antalis ?sp
tusk shell
0.001
0.000004
0.008
0.000035
gastropod ?sp.
0.032
0.000084
Patellacea ?sp
0.047
0.000466
0.008
0.000035
Polyplacophora ?sp.
0.035
0.000091
0.178
0.001752
0.008
0.000035
Total
100
0.57
100
3.20
100
4.28
Appendix 1.5
Marine and Coastal Birds – Greater Hauraki
ca 1400 AD
ca 1550 AD
ca 1750 AD
Taxon
frequency
Proportional
energy
contribution
Taxon
frequency
Proportional
energy
contribution
Taxon
frequency
Proportional
energy
contribution
Eudyptula minor
Little penguin
23.73
1.014
28.94
0.270
12.50
0.382
Diomedeidae ?sp
Albatross ?sp
3.14
0.549
24.43
0.933
6.25
0.782
Macronectes halli
Northern giant petrel
0.99
0.173
Pterodroma macroptera
Grey-faced petrel
3.81
0.074
13.58
0.058
12.50
0.174
Pachyptila vitata
Broad-billed prion
1.71
0.013

66
Appendix 1.5 continued
ca 1400 AD
ca 1550 AD
ca 1750 AD
Taxon
frequency
Proportional
energy
contribution
Taxon
frequency
Proportional
energy
contribution
Taxon
frequency
Proportional
energy
contribution
Puffinus griseus
Sooty shearwater
5.89
0.183
Puffinus gavia
Fluttering shearwater
10.86
0.127
18.75
0.156
Puffinus assimilis
Norfolk little shearwater
4.77
0.037
Pelecanoides urinatrix
Common diving petrel
6.01
0.030
6.25
0.023
Procellariidae ?sp
petrel ?sp
6.25
0.059
Morrus serrator
Australasian gannet
0.25
0.022
Phalacrocorax melanoleucos
Little shag
1.61
0.044
6.11
0.036
6.25
0.122
Phalacrocorax carbo
Black shag
3.40
0.290
Phalacrocorax varius
Pied shag
6.36
0.494
Stictocarbo punctatus
Spotted shag
18.46
0.860
14.72
0.150
18.75
0.626
Calidras canutus
Lesser knot
0.13
0.000
Charadrius obscurus
NZ dotterel
0.13
0.001
Anarhynchus frontalis
Wrybill
0.13
0.000
Larus dominicanus
Southern black-backed gull
6.70
0.221
6.11
0.044
6.25
0.148
Larus novaehollandiae
Red-billed gull
0.13
0.001
Hydroprogne caspia
Caspian tern
0.83
0.023
Childonias albostriata
Black-fronted tern
0.83
0.003
Sterna striata
White-fronted tern
0.13
0.001
6.11
0.008
6.25
0.028
Total
100
4.16
100
1.50
100
2.50
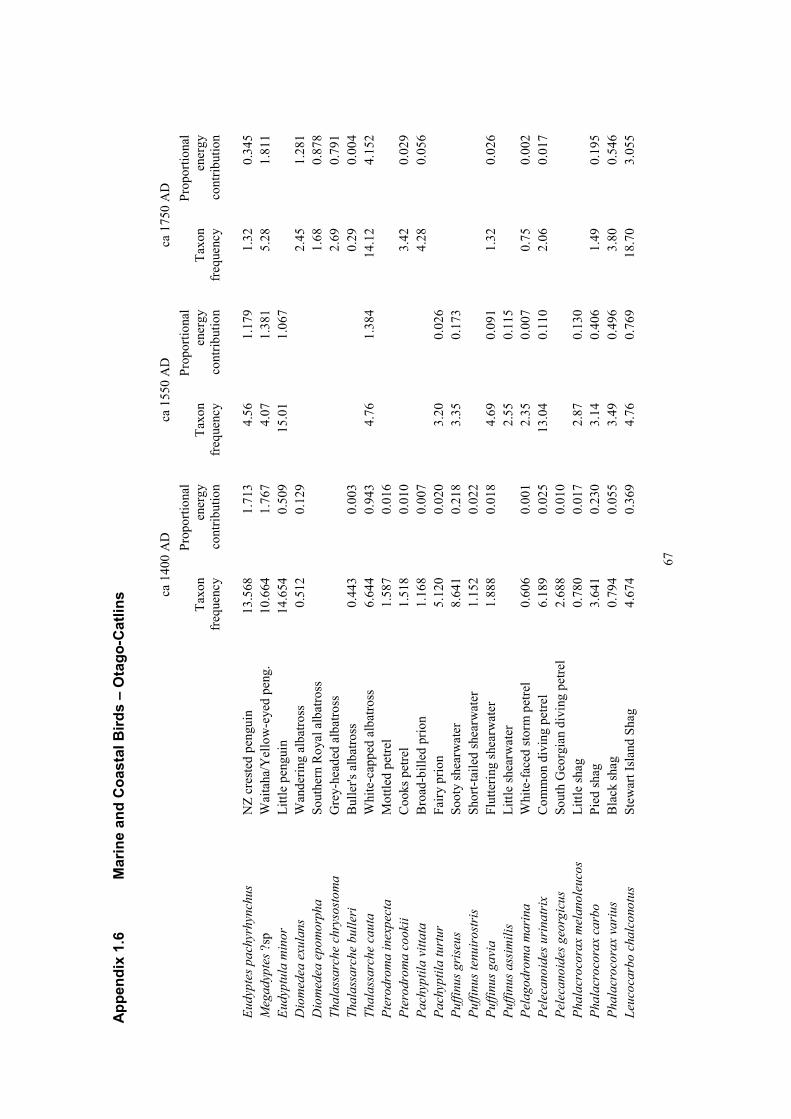
67
Appendix 1.6
Marine and Coastal Birds – Otago-Catlins
ca 1400 AD
ca 1550 AD
ca 1750 AD
Taxon
frequency
Proportional
energy
contribution
Taxon
frequency
Proportional
energy
contribution
Taxon
frequency
Proportional
energy
contribution
Eudyptes pachyrhynchus
NZ crested penguin
13.568
1.713
4.56
1.179
1.32
0.345
Megadyptes ?sp
Waitaha/Yellow-eyed peng.
10.664
1.767
4.07
1.381
5.28
1.811
Eudyptula minor
Little penguin
14.654
0.509
15.01
1.067
Diomedea exulans
Wandering albatross
0.512
0.129
2.45
1.281
Diomedea epomorpha
Southern Royal albatross
1.68
0.878
Thalassarche chrysostoma
Grey-headed albatross
2.69
0.791
Thalassarche bulleri
Buller's albatross
0.443
0.003
0.29
0.004
Thalassarche cauta
White-capped albatross
6.644
0.943
4.76
1.384
14.12
4.152
Pterodroma inexpecta
Mottled petrel
1.587
0.016
Pterodroma cookii
Cooks petrel
1.518
0.010
3.42
0.029
Pachyptila vittata
Broad-billed prion
1.168
0.007
4.28
0.056
Pachyptila turtur
Fairy prion
5.120
0.020
3.20
0.026
Puffinus griseus
Sooty shearwater
8.641
0.218
3.35
0.173
Puffinus tenuirostris
Short-tailed shearwater
1.152
0.022
Puffinus gavia
Fluttering shearwater
1.888
0.018
4.69
0.091
1.32
0.026
Puffinus assimilis
Little shearwater
2.55
0.115
Pelagodroma marina
White-faced storm petrel
0.606
0.001
2.35
0.007
0.75
0.002
Pelecanoides urinatrix
Common diving petrel
6.189
0.025
13.04
0.110
2.06
0.017
Pelecanoides georgicus
South Georgian diving petrel
2.688
0.010
Phalacrocorax melanoleucos
Little shag
0.780
0.017
2.87
0.130
Phalacrocorax carbo
Pied shag
3.641
0.230
3.14
0.406
1.49
0.195
Phalacrocorax varius
Black shag
0.794
0.055
3.49
0.496
3.80
0.546
Leucocarbo chalconotus
Stewart Island Shag
4.674
0.369
4.76
0.769
18.70
3.055
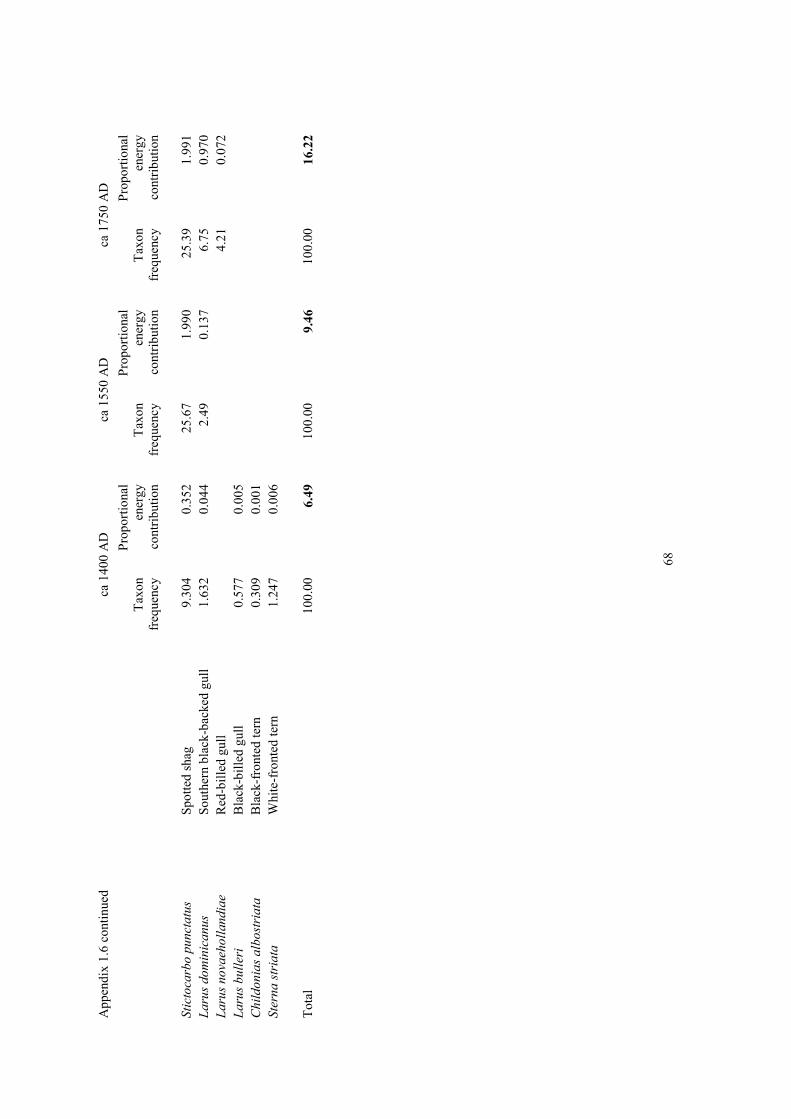
68
Appendix 1.6 continued
ca 1400 AD
ca 1550 AD
ca 1750 AD
Taxon
frequency
Proportional
energy
contribution
Taxon
frequency
Proportional
energy
contribution
Taxon
frequency
Proportional
energy
contribution
Stictocarbo punctatus
Spotted shag
9.304
0.352
25.67
1.990
25.39
1.991
Larus dominicanus
Southern black-backed gull
1.632
0.044
2.49
0.137
6.75
0.970
Larus novaehollandiae
Red-billed gull
4.21
0.072
Larus bulleri
Black-billed gull
0.577
0.005
Childonias albostriata
Black-fronted tern
0.309
0.001
Sterna striata
White-fronted tern
1.247
0.006
Total
100.00
6.49
100.00
9.46
100.00
16.22
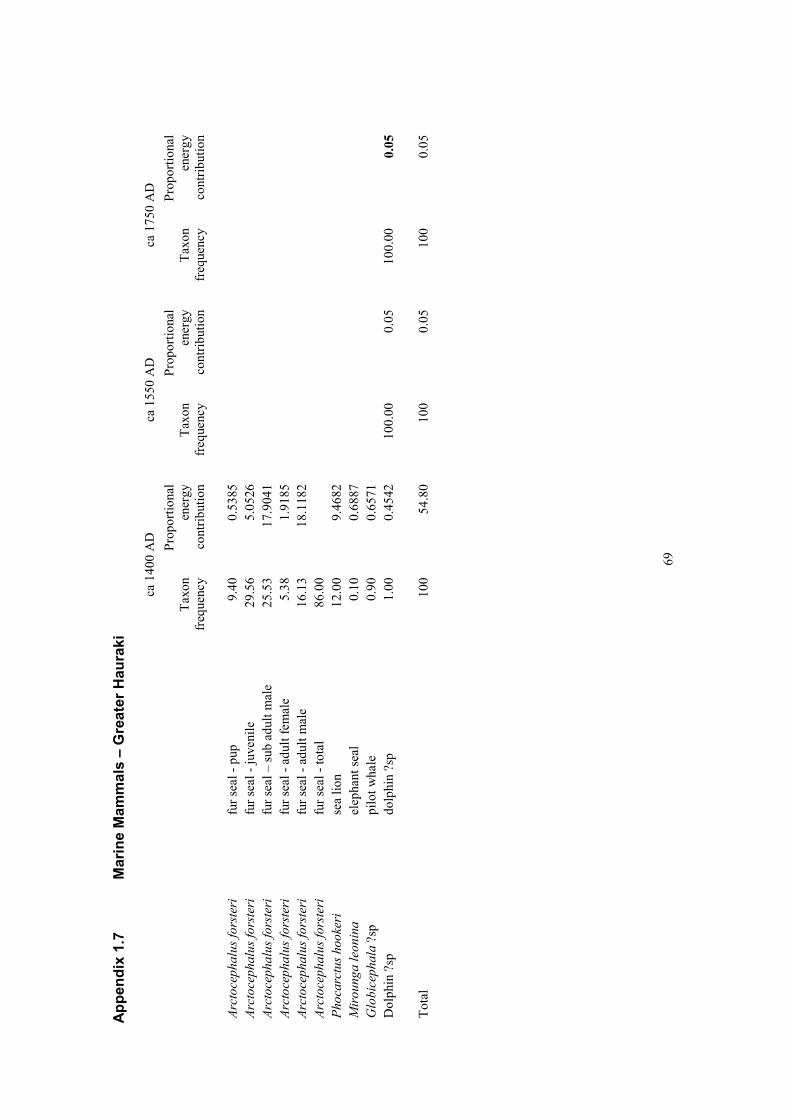
69
Appendix 1.7
Marine Mammals – Greater Hauraki
ca 1400 AD
ca 1550 AD
ca 1750 AD
Taxon
frequency
Proportional
energy
contribution
Taxon
frequency
Proportional
energy
contribution
Taxon
frequency
Proportional
energy
contribution
Arctocephalus forsteri
fur seal - pup
9.40
0.5385
Arctocephalus forsteri
fur seal - juvenile
29.56
5.0526
Arctocephalus forsteri
fur seal – sub adult male
25.53
17.9041
Arctocephalus forsteri
fur seal - adult female
5.38
1.9185
Arctocephalus forsteri
fur seal - adult male
16.13
18.1182
Arctocephalus forsteri
fur seal - total
86.00
Phocarctus hookeri
sea lion
12.00
9.4682
Mirounga leonina
elephant seal
0.10
0.6887
Globicephala ?sp
pilot whale
0.90
0.6571
Dolphin ?sp
dolphin ?sp
1.00
0.4542
100.00
0.05
100.00
0.05
Total
100
54.80
100
0.05
100
0.05

70
Appendix 1.8
Marine Mammals – Otago-Catlins
ca 1400 AD
ca 1550 AD
ca 1750 AD
Taxon
frequency
Proportional
energy
contribution
Taxon
frequency
Proportional
energy
contribution
Taxon
frequency
Proportional
energy
contribution
Arctocephalus forsteri
fur seal - pup
5.20
0.3111
4.57
0.1090
Arctocephalus forsteri
fur seal - juvenile
40.11
7.1595
43.96
3.1273
60.10
2.5242
Arctocephalus forsteri
fur seal – sub adult male
15.60
11.4247
17.21
5.0233
23.60
4.0668
Arctocephalus forsteri
fur seal – adult female
6.69
2.4912
6.17
0.9157
Arctocephalus forsteri
fur seal – adult male
10.40
12.1993
11.64
5.4418
15.70
4.3333
Arctocephalus forsteri
fur seal - total
78.00
83.55
99.40
Phocarctus hookeri
sea lion
21.20
17.4680
15.75
5.1722
Mirounga leonina
elephant seal
0.10
0.7192
Hydrurga leptonyx
leopard seal
0.10
0.0899
0.10
0.0358
Globicephala ?sp
pilot whale ?sp
0.10
0.0762
0.10
0.0304
0.10
0.4680
Dolphin ?sp
dolphin ?sp
0.50
0.2371
0.50
0.0945
0.50
0.0558
Total
100.00
52.10
100.00
19.95
100.00
10.98

71