Estimating the Effective Population of Nantucket...Estimating the Effective Population of Nantucket...
93
Estimating the Effective Population of Nantucket An Interactive Qualifying Project submitted to the Faculty of WORCESTER POLYTECHNIC INSTITUTE in partial fulfilment of the requirements for the degree of Bachelor of Science. Authors: Frank Campanelli Tyler Donovan Alec Wehse Samuel Winter Advisors: Dominic Golding Richard Vaz Sponsors: Nantucket Data Platform Alan Worden Joe Smialowski Peter Morrison December 13, 2017 This report represents the work of WPI undergraduate students submitted to the faculty as evidence of completion of a degree requirement. WPI routinely publishes these reports on its website without editorial or peer review. For more information about the projects program at WPI, please see: http://www.wpi.edu/academics/ugradstudies/project-learning.html.
Transcript of Estimating the Effective Population of Nantucket...Estimating the Effective Population of Nantucket...

Estimating the Effective Population of Nantucket An Interactive Qualifying Project
submitted to the Faculty of
WORCESTER POLYTECHNIC INSTITUTE
in partial fulfilment of the requirements for the
degree of Bachelor of Science.
Authors:
Frank Campanelli
Tyler Donovan
Alec Wehse
Samuel Winter
Advisors:
Dominic Golding
Richard Vaz
Sponsors:
Nantucket Data Platform
Alan Worden
Joe Smialowski
Peter Morrison
December 13, 2017
This report represents the work of WPI undergraduate students submitted to the faculty as
evidence of completion of a degree requirement. WPI routinely publishes these reports on its
website without editorial or peer review. For more information about the projects program at
WPI, please see: http://www.wpi.edu/academics/ugradstudies/project-learning.html.

i
ABSTRACT
This project, in collaboration with the Nantucket Data Platform (NDP), studied the
effective population of the Nantucket community. We gathered data from several sources on
Nantucket and the StreetLight Data service to gain insight into the dynamic population changes
Nantucket experiences every year. The main deliverables from these endeavors were to
communicate to the NDP viable methods for estimating the Nantucket population,
recommendations for future analyses, and more specific population and travel data requested by
community stakeholders.

ii
ACKNOWLEDGEMENTS
We have been very fortunate to work with a wide variety of individuals throughout the course of
this project. We would like to acknowledge all their efforts and contributions that have assisted
our endeavors through the course of this study.
First, we would like to thank the Nantucket Data Platform (NDP) for sponsoring our project
team. They helped us to see out the progression of this project, and guided us with their insight
and experience.
Alan Worden, the founder of the NDP, was extremely helpful in creating the framework and
guiding our team as needed towards the advancement the NDP’s mission.
Peter Morrison, the NDP’s chief demographer, provided us with many answers to our never-
ending questions pertaining to population estimation, and was willing to provide us with his
input about our discoveries.
Joseph Smialowski, the Chairman of the NDP advisory board, presented us with many
suggestions for analyses to conduct and was a key contributor to our understanding of population
dynamics during our time on Nantucket.
Catherine Stover, the Nantucket Town Clerk, was instrumental in providing us with the Street
Census information and providing us with details to its intricacies so that we could further
progress and develop our analyses.
We would also like to thank all the members of the community that we interviewed and anyone
else that furthered our research.
Finally, we would like to thank our advisors, Professors Dominic and Richard Vaz of Worcester
Polytechnic Institute, also deserve great recognition for their supportive guidance and feedback
on our entire project. Both Dominic and Rick spent countless hours reviewing and making
suggestions on every document included in this report. They also aided in developing our critical
thinking, organizational skills, and fostered a drive to produce quality work.

iii
EXECUTIVE SUMMARY
Public, private, and nonprofit sectors need population data to make informed decisions on
everything from marketing and planning strategies to policy decisions. Most towns and cities
rely on government census data, but census data is insufficient for resort towns like Nantucket
that experience highly variable seasonal populations. There is a lack of accurate population data
on Nantucket, which can cause policies and planning decisions to be implemented with
inadequate supporting evidence. In 2017, the editor of the Nantucket Inquirer & Mirror, Joshua
Balling, wrote “The Town of Nantucket is essentially a $100 million corporation. Yet the Board
of Selectmen, Finance Committee, and other agencies are often forced to make decisions on the
fly, relying on outdated or incomplete information, particularly about the island’s population
size” (Balling, 2017).
The Nantucket Data Platform (NDP) was founded in the spring of 2017 with the goal of
collecting population and demographic data on Nantucket and making it publicly available to
organizations for use in the decision-making process. The NDP plans to consolidate data from a
variety of local and other data sources. The goal of this project, in cooperation with the NDP,
was to determine effective methods of evaluating population data specific to the region of
Nantucket. We primarily investigated methods of population and demographic data collection
within the StreetLight Data platform. StreetLight is a third-party company that purchases cell
phone mobility data from service providers and provides it to customers for analysis. We
compared our findings from StreetLight to sources on Nantucket, such as the Steamship
Authority passenger counts and municipal solid waste reports, in an effort to validate the
information collected from StreetLight. To summarize, we worked with the NDP to complete the
following objectives:
1. Objective 1: Determine best practices for the collection, analysis, and use of population
data in resort communities
2. Objective 2: Evaluate stakeholder needs for demographic data to strengthen evidence-
based decision making, and to learn about seasonal employment on Nantucket
3. Objective 3: Evaluating the usefulness of Streetlight data, combined with other data
sources, for population estimation.
During our study of the Nantucket population, we analyzed a variety of data sources to determine
their effectiveness and reliability. We deemed the following sources of data relevant to
determining the effective population of Nantucket:
1. Nantucket Street Census: The Street Census from the Nantucket Town Clerk’s office is
the most complete count of permanent residents on Nantucket, as it is the most recent and
the most thorough.

iv
2. Transportation Data: Ferry and airport transportation data from the Nantucket Town
Planning Office displays total ferry ridership and airport departures for each month of the
year.
3. Solid Waste: Solid waste data from the Nantucket Department of Public Works (DPW)
shows municipal solid waste generation going back to July of 2014.
4. StreetLight Data: Cell phone mobility data from StreetLight depicts the movements and
certain characteristics of people to make inferences about the demographic
characterization.
StreetLight tracks people that use certain cell phone applications and will present information on
these people when they pass through zones that are set by the user. Zones are areas of interest
that can be set to any shape and size for analysis. StreetLight takes the data from the selected
zones and represents it on a Visitor Activity Index, a metric used by StreetLight to display data
while maintaining strict privacy for the individuals tracked. StreetLight defines the Visitor
Activity Index as “a measure of the relative volume of visitors to the zones” (StreetLight). The
values are provided on an index and do not indicate the exact number of visitors. Values can be
compared to other Zones in the same Project, or to Zones in other Visitor Projects for scaling and
comparative purposes.
The analyses in this report relied on both direct and indirect approaches to population estimation.
Direct approaches include methods that individually count a population. Many of the analyses
conducted are based around one such direct approach which is the yearly street census conducted
by the Nantucket Town Clerk. This census is the most complete list of permanent residents on
Nantucket, and is the backbone for many of our estimations. Indirect approaches use
symptomatic variables, which refer to measurable factors affected by population fluctuations.
We produced population estimates using two different symptomatic variables: StreetLight
Visitor Activity Index and solid waste production.
When extrapolating these two data sets, we anchored the two estimates to the same point in time,
as well as the same base population number, in order to have comparable results. We used an
“anchor month” to relate Street Census population counts to the population during a single
month of the year. Based on solid waste data, we determined that the population was lowest in
February each year, making February a suitable anchor month to relate to the known permanent
resident population. We regard solid waste as a valid benchmark, given its consistency over
several years. The anchor month was used to scale data, such as the StreetLight activity index
and solid waste production, from a symptomatic variable into total population counts.
Our best estimate for the February population in 2016 was our middle estimate calculation,
which was 18,627 people. We scaled the Street Census population of 13,200 by a 77.7% non-
response rate to get 16,984 as a total permanent resident estimate, which also acts as the lower

v
bound for the population of Nantucket. We then utilized ferry and airport travel data, and
assuming an average visitor stay of 2 days, estimated that on average there were 1,643 visitors on
Nantucket at any given time. This then increases the lower bound to our 18,627 middle estimate.
Figure 1 displays the StreetLight and solid waste population estimates, scaled up using our
middle estimate.
FIGURE 1: STREETLIGHT VS: WASTE POPULATION ESTIMATES FOR 2016
We reached these estimates using the following set of assumptions:
• Each head of household on Nantucket is documented by the Town Clerk and received a
copy of the Street Census survey.
• The Town Clerk’s office maintains a complete list of non-respondents for each census
year.
• The non-respondents to the Street Census have the same average family size as the
respondents.
• All permanent residents are present on Nantucket and are counted as spending the
majority of February on Nantucket.
• Solid waste data is a reliable symptomatic variable of population, which indicates that the
population is lowest in February for 2015-2017.
• Equal trash generation occurs across the demographic spectrum.
• Visitors to Nantucket in February stay an average of 2 days.
• Arrivals and departures are equal across all modes of transportation to and from
Nantucket in February.
• There are no permanent residents using the ferry in February.
• The number of visitors traveling to and from Nantucket using private boats and aircraft in
February is negligible.
0
10000
20000
30000
40000
50000
60000
70000
80000
Jan Feb Mar Apr May Jun Jul Aug Sep Oct Nov Dec
Po
pu
lati
on
Streetlight vs. Solid Waste Population Estimates Using the Middle Estimate
StreetLight Solid Waste
vi
The use of StreetLight to estimate the population of Nantucket will require better understanding
of how subpopulations are proportionally represented in StreetLight data. Population estimates
using Streetlight deviate considerably from population estimates using solid waste during the
summer months, when many visitors are on the island. This implies that StreetLight may track
visitors more often that permanent residents. One of the main assumptions used when analyzing
data from StreetLight was that StreetLight collects a representative sampling across the different
demographic groups. This means that every increment on the Visitor Activity Index represents
the same number of people. There is currently no information on whether StreetLight tracks
various demographic groups at different rates. This is because StreetLight collects its data
through mobile device applications, some of which may be used by visitors more than permanent
residents. For example, a tourist visiting Nantucket may tend to use navigational applications
more often, as they will more often need assistance getting from place to place, compared to a
year-round resident who already knows their way around the island.
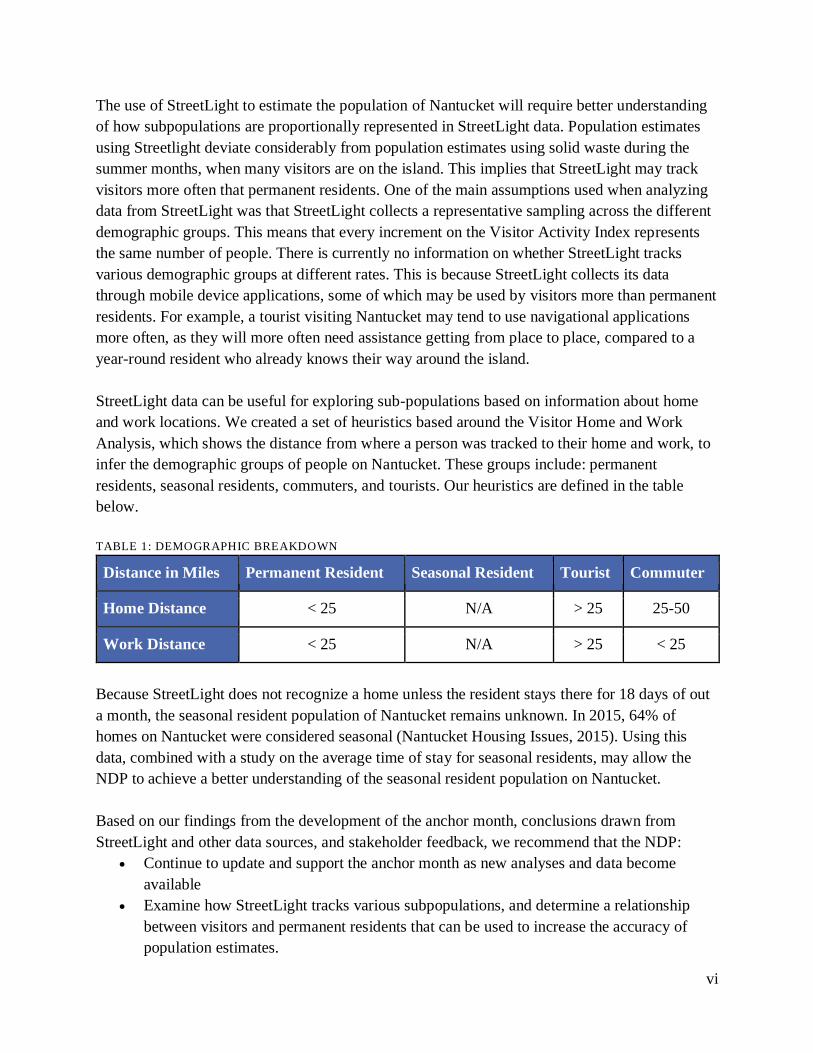
StreetLight data can be useful for exploring sub-populations based on information about home
and work locations. We created a set of heuristics based around the Visitor Home and Work
Analysis, which shows the distance from where a person was tracked to their home and work, to
infer the demographic groups of people on Nantucket. These groups include: permanent
residents, seasonal residents, commuters, and tourists. Our heuristics are defined in the table
below.
TABLE 1: DEMOGRAPHIC BREAKDOWN
Distance in Miles Permanent Resident Seasonal Resident Tourist Commuter
Home Distance < 25 N/A > 25 25-50
Work Distance < 25 N/A > 25 < 25
Because StreetLight does not recognize a home unless the resident stays there for 18 days of out
a month, the seasonal resident population of Nantucket remains unknown. In 2015, 64% of
homes on Nantucket were considered seasonal (Nantucket Housing Issues, 2015). Using this
data, combined with a study on the average time of stay for seasonal residents, may allow the
NDP to achieve a better understanding of the seasonal resident population on Nantucket.
Based on our findings from the development of the anchor month, conclusions drawn from
StreetLight and other data sources, and stakeholder feedback, we recommend that the NDP:
• Continue to update and support the anchor month as new analyses and data become
available
• Examine how StreetLight tracks various subpopulations, and determine a relationship
between visitors and permanent residents that can be used to increase the accuracy of
population estimates.

vii
• Refine and further develop the heuristics associated with home and work distance to
more accurately define the demographic groups, with particular interest in separating out
seasonal residents using StreetLight in conjunction with other available data sources
• Attempt to recover departure and arrival data for Hy-Line and Steamship ferries, as well
as Nantucket Memorial Airport passengers, organized by trip
• Consider studies on the amount of solid waste produced per capita to compare the derived
use per capita used in our solid waste analysis.

viii
AUTHORSHIP
Section Author 1 Editor 1 Editor 2
Abstract Frank/Alec Tyler All
Acknowledgements Alec Tyler All
Executive Summary Tyler Alec All
Introduction Alec Tyler All
2.0 Alec All All
2.1 Tyler Alec All
2.2 Tyler Alec All
2.2.1 Tyler Alec All
2.2.2 Tyler Alec All
2.2.3 Tyler Alec All
2.2.4 Tyler Alec All
2.2.5 Tyler Alec All
2.2.6 Frank Tyler Alec
2.3 Alec All All
2.4 Sam Alec Frank
3.0 Sam Alec All
3.1 Sam Alec Tyler
3.2 Alec Tyler Tyler
3.3 Frank Tyler Alec
4.0 Frank All All
4.1 Alec/Tyler Frank All
4.2 Alec Tyler All
4.2.1 Tyler Alec Frank
4.2.2 Alec Tyler All
4.2.3 Alec Tyler All
4.2.4 Tyler Alec All
4.3 Sam/Tyler Alec All
4.4 Sam Alec All
4.4.1 Sam Tyler Alec
4.4.2 Frank Tyler Alec
4.4.3 Tyler Alec Sam
4.4.4 Tyler Alec All
4.4.5 Tyler Alec All
4.5 Alec All All
4.5.1 Alec Tyler Alec

ix
4.5.2 Alec Tyler Alec
4.5.3 Alec Tyler Alec
5 Tyler Alec All
5.1 Tyler Alec All
5.2 Tyler Alec All
5.3 Alec Tyler All
Appendix A Sam Alec All
Appendix B Frank Alec All
Appendix C Tyler Alec All
Appendix D Tyler Alec Frank
Appendix E Alec Tyler Frank
Appendix F Alec Frank All
Appendix G Sam All All
Appendix H Alec Frank All
Appendix I Tyler Alec All
Appendix J Sam Alec Frank
Appendix K Sam Alec Frank
Appendix L Alec Tyler All
Appendix M Sam Frank Alec
Appendix N Alec Tyler All
Appendix O Alec Tyler All
Appendix P Alec Tyler All
Appendix Q Alec Tyler All
Appendix R Sam Frank Alec
Appendix S All All All

x
CONTENTS
Abstract ............................................................................................................................................ i
Acknowledgements ......................................................................................................................... ii
Executive Summary ....................................................................................................................... iii
Authorship.................................................................................................................................... viii
List of Figures ............................................................................................................................... xii
List of Tables ............................................................................................................................... xiii
1.0 Introduction ....................................................................................................................... 14
2.0 Background ....................................................................................................................... 16
2.1 Challenges in Estimating the Population of Nantucket ................................................ 16
2.2 Population Estimation Techniques ............................................................................... 17
2.2.1 Direct vs. Indirect Approaches ................................................................................. 17
2.2.2 Public Record Analysis ............................................................................................. 18
2.2.3 Utility Analysis ......................................................................................................... 19
2.2.4 Wastewater Analysis ................................................................................................. 19
2.2.5 Traffic Analysis ........................................................................................................ 20
2.2.6 Cell Phone Data Analysis ......................................................................................... 21
2.3 Efforts to Estimate the Population of Nantucket .......................................................... 27
2.4 The Nantucket Data Platform ....................................................................................... 30
3.0 Methodology ..................................................................................................................... 32
3.1 Objective 1: Determine Best Practices in Collection, Analysis, and Use of Population
Data in Resort Communities ..................................................................................................... 33
3.2 Objective 2: Evaluate stakeholder needs for demographic data to strenghten evidence-
based decision making on nantucket ......................................................................................... 33
3.3 Objective 3: Evaluating the usefulness of streetlight data, combined with other data
sources, for population estimation ............................................................................................ 35
4.0 Findings............................................................................................................................. 38
4.1 The Reliability of Data Sources for Estimating Populations on Nantucket.................. 38
4.2 Introductory Explanation to Streetlight ........................................................................ 41
4.2.1 Definition of a Zone .................................................................................................. 41
4.2.2 Types of Analyses Streetlight Provides .................................................................... 41
4.2.3 Time Selection .......................................................................................................... 42
4.2.4 Data Analysis ............................................................................................................ 42
4.3 Advantages and Limitations of Streetlight Data ........................................................... 43
4.4 Population Analyses Using StreetLight Data ............................................................... 46

xi
4.4.1 Heuristics for Nantucket demographics .................................................................... 46
4.4.2 Development of an Anchor Month ........................................................................... 48
4.4.3 Streetlight Population and Demographic Analysis ................................................... 52
4.4.4 Solid Waste Analysis ................................................................................................ 54
4.4.5 Comparing Population Estimates .............................................................................. 57
4.5 Stakeholder Feedback and Future Data Needs ............................................................. 58
4.5.1 Using Data to Start Making Decisions Based on Reliable Data ............................... 58
4.5.2 Demographics and Travel Patterns of People Visiting Nantucket ............................ 59
4.5.3 Knowing the Community on Nantucket ................................................................... 60
5.0 Conclusions & Recommendations .................................................................................... 62
5.1 Anchor Population Recommendations ......................................................................... 63
5.2 Future Population Estimates Recommendations .......................................................... 63
5.3 Community Feedback Recommendations .................................................................... 65
References ..................................................................................................................................... 66
Appendix A: Further Background Research on Data Platforms:.................................................. 70
Appendix B: Project Timeline ...................................................................................................... 71
Appendix C: List of Businesses and Contact Persons Interviewed .............................................. 72
Appendix D: Interview Preamble and Questions/Topics .............................................................. 73
Appendix E: Survey Preamble and Questions .............................................................................. 74
Appendix F: Survey Results ......................................................................................................... 77
Appendix G: Streetlight Privacy Statement: ................................................................................. 78
Appendix H: Nantucket Solid Waste Production ......................................................................... 79
Appendix I: Middle Estimate Calculation .................................................................................... 80
Appendix J: Percentage of demographic groups based on Streetlight heuristics ......................... 81
Appendix K: Summary of Anchor Calculations ........................................................................... 82
Appendix L: Lower, Middle, and Upper Nantucket Population Estimates .................................. 83
Appendix M: Commuter Calculation............................................................................................ 84
Appendix N: Solid waste Populations Using the middle Estimate (2015-2017) .......................... 85
Appendix O: Solid Waste Estimate for 2016 using the lower, middle, and upper population
estimates ........................................................................................................................................ 86
Appendix P: StreetLight vs. solid waste using the middle estimate ............................................. 87
Appendix Q: Summarized Consolidation of Interview Notes ...................................................... 88
Appendix R: Where People Are Coming From ............................................................................ 90
Appendix S: Summative Team Assesment ................................................................................... 92

xii
LIST OF FIGURES
Figure 1: StreetLight vs: Waste Population Estimates for 2016 ..................................................... v Figure 2: Spatial correlations of the first factor—summer tourism areas (Ahas et al., 2007). ..... 21 Figure 3: Visitor dynamics in summer tourism areas: (A) Pärnu and (B) distribution of call
events of two predominating tourist nationalities in Narva-Jõesuu (Ahas et al., 2007). .............. 22 Figure 4: Visitor dynamics on weekdays (1–7) of two types of weekly tourism: business travelers
(Factor 3) and weekend tourists (Factor 13) (Ahas et al., 2007). ................................................. 22 Figure 5: Visitor dynamics on weekdays (1-7) of two types of weekly tourism: business
travellers (Factor 3) and weekend tourists (Factor 13) (Ahas et al., 2007). ................................. 23 Figure 6: Population Dynamics between the Main Holiday Period (July and August) and
Working Periods in France (Deville et al., 2014) ......................................................................... 23 Figure 7: Percentage of trips starting and ending in Napa County by hour of day (fehr & peers,
2014). ............................................................................................................................................ 25 Figure 8: Napa County population inferred traffic patterns (Fehr & Peers, 2014) ....................... 26 Figure 9: Estimates of Nantucket’s Combined Effective Population (Full-Time & Seasonal), by
Month, 2006-2010. (Recreated from data taken from Beliveau et al., 2010) ............................... 28 Figure 10: Nantucket Memorial Airport, Departures (Paper Crane, 2016) .................................. 29 Figure 11: Steamship Authority, People serviced (Paper Crane, 2016) ....................................... 29 Figure 12: Project Overview Flowchart ........................................................................................ 32 Figure 13: Shows an example of where home and work locations are for the groups of people
tracked by Streetlight .................................................................................................................... 42 Figure 14: Streetlight providing segmented data based on the Visitor Activity Distance ............ 43 Figure 15: Visualization of 25- and 50-mile rules centered around Nantucket ............................ 47 Figure 16: Solid Waste in Tonnage per month (Data in Appendix H) ......................................... 49 Figure 17: Streetlight Population Estimates Using the Three Population Estimates (Data in
Appendix L) .................................................................................................................................. 52 Figure 18: Streetlight Population Estimates with Demographic Breakdown using the middle
Population estimate (Data in Appendix J) .................................................................................... 53 Figure 19: Solid Waste Population Middle Estimates from 2015 to 2017 (data in appendix N) . 55 Figure 20: Solid Waste Population Estimates using all three of the anchor points (Data O) ....... 56 Figure 21: Streetlight vs. Waste Population using the middle population estimate (Data in
Appendix P) .................................................................................................................................. 57 Figure 22: Project Timeline .......................................................................................................... 71 Figure 23: Commuter Calculation Graph ..................................................................................... 84 Figure 24: Percentage of people visiting nantucket by metro area ............................................... 90 Figure 25: State Breakdown.......................................................................................................... 91

xiii
LIST OF TABLES
Table 1: Demographic Breakdown ................................................................................................ vi Table 2: Demographic breakdown based on home and work heuristics ...................................... 46 Table 3: demographic breakdown using the 25 mile rule ............................................................. 48 Table 4: Interviewed Organizations with Lead Contact ............................................................... 72 Table 5: Nantucket Solid Waste Production ................................................................................. 79 Table 6: Middle Population Estimate Calculation ........................................................................ 80 Table 7: Demographic Percentages for 2016 ................................................................................ 81 Table 8:Anchor Calculations ........................................................................................................ 82 Table 9: lower, middle, and upper nantucket population estimates .............................................. 83 Table 10: Solid Waste Populations using the middle bound (2015-2017) ................................... 85 Table 11: Solid Waste Estimate for 2016 Using the Lower, Middle, and Upper Population
Estimates ....................................................................................................................................... 86 Table 12: Streetlight Vs. Solid Waste Using the Middle Estimate ............................................... 87

14
1.0 INTRODUCTION
Public, private, and nonprofit sectors need population data to make informed decisions on
everything from marketing and planning strategies to policy decisions. Most towns and cities
rely on census data, but census data is insufficient for resort towns like Nantucket that experience
highly variable seasonal populations. As discussed in Section 2.1, there is a lack of accurate
population data on Nantucket. This lack of data can cause policies and planning decisions to be
implemented with inadequate supporting evidence. In 2017, the editor of the Nantucket Inquirer
& Mirror, Joshua Balling, wrote “The Town of Nantucket is essentially a $100 million
corporation. Yet the Board of Selectmen, Finance Committee and other agencies are often forced
to make decisions on the fly, relying on outdated or incomplete information, particularly about
the island’s population size” (Balling, 2017). In the same article, Balling interviews a previous
member of the Nantucket Board of Selectmen, Bruce Miller. In their discussion, Miller states, “it
was pretty obvious that we made a lot of big decisions... without a basis of solid information,”
(Balling, 2017). Unfortunately, absent better data, town offices and businesses are often forced to
make important decisions based on inadequate or incomplete data.
United States census data provide an incomplete picture of the year-round population in
Nantucket, and estimates of summer peak population are based on simple ‘back-of-the-envelope’
calculations and surrogate measures, such as estimates imputed from household trash generation.
Currently, the Nantucket Steamship Authority and Nantucket Memorial Airport record arrivals
and departures for their respective services; however, these data are inadequate for estimating
actual populations at any given time. Many individuals on Nantucket arrive via private charter,
and the arrival and departures of each vehicle are not always recorded, nor is the number of
individuals on each vehicle. A simple arrival-and-departures-based estimation also does not lend
itself to more detailed demographic analyses such as the number of visitors during the summer
months, the duration of each visitor’s stay on Nantucket, second home-owners that live on
Nantucket seasonally, the seasonal workforce (especially those on work visas), and workers that
commute to the island.
Many resort towns analogous to Nantucket experience similar obstacles due to the large
influx of visitors during the summer months. The ability to account for the corresponding
population increase significantly aids local governments in creating effective policies and

15
services. Population is often estimated using various indirect methods including the analysis of
wastewater, garbage, cell phone data, and utility usage. Each of these approaches has distinct
advantages and disadvantages, and each can be used in different situations. Often, a mix of
approaches is required to validate the available data and associated analyses.
The Nantucket Data Platform (NDP) was founded in the spring of 2017 with the goal of
collecting population and demographic data on Nantucket and making it publicly available to
organizations for use in the decision-making process. The NDP plans to consolidate data from a
variety of local and other data sources. The goal of this project, in cooperation with the NDP,
was to determine effective methods of evaluating population data specific to the region of
Nantucket. We investigated methods of population and demographic data collection within the
StreetLight Data platform. StreetLight is a third-party company that purchases cell phone and
mobile data from service providers and provides it to customers for analysis. We compared our
findings to sources on Nantucket, such as the Steamship Authority and the Nantucket Memorial
Airport, to validate the information collected from StreetLight. To summarize, we have worked
with the NDP to complete the following objectives:
1. Objective 1: Determine best practices for the collection, analysis, and use of population
data in resort communities
2. Objective 2: Evaluate stakeholder needs for demographic data to strengthen evidence-
based decision making in the public and private sectors on Nantucket
3. Objective 3: Evaluating the usefulness of Streetlight data, combined with other data
sources, for population estimation
These objectives led to findings and recommendations that intend to help the NDP
continue in the future.
16
2.0 BACKGROUND
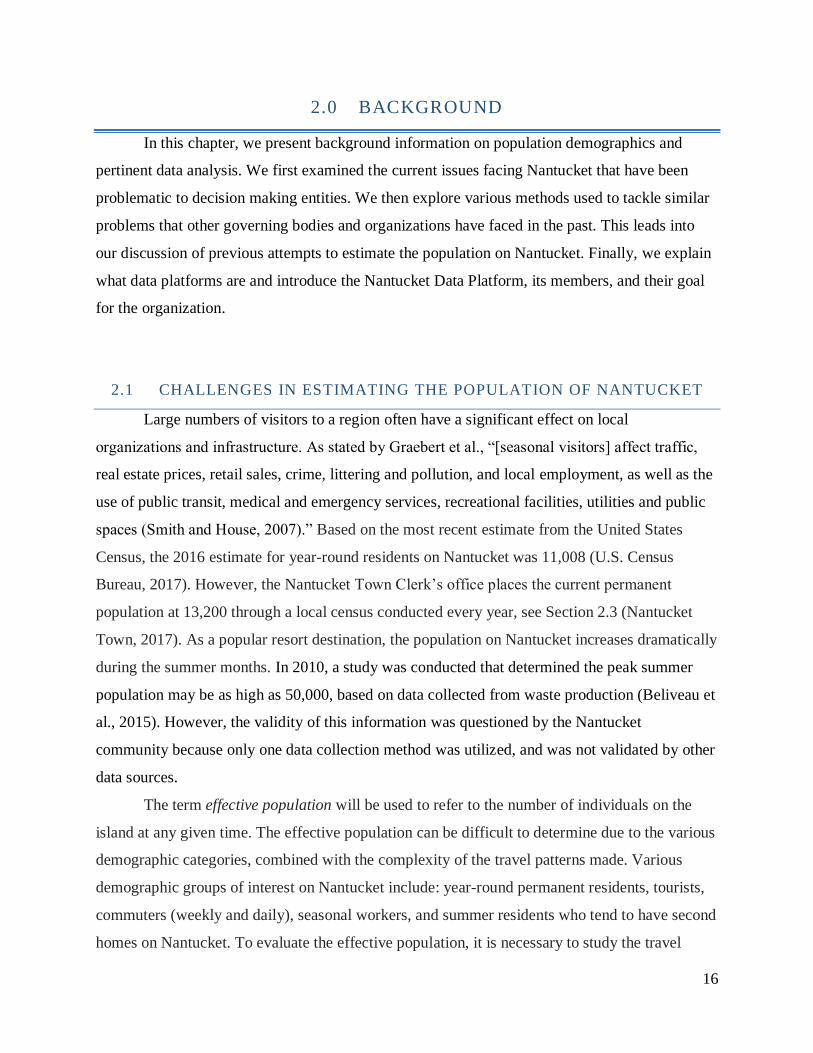
In this chapter, we present background information on population demographics and
pertinent data analysis. We first examined the current issues facing Nantucket that have been
problematic to decision making entities. We then explore various methods used to tackle similar
problems that other governing bodies and organizations have faced in the past. This leads into
our discussion of previous attempts to estimate the population on Nantucket. Finally, we explain
what data platforms are and introduce the Nantucket Data Platform, its members, and their goal
for the organization.
2.1 CHALLENGES IN ESTIMATING THE POPULATION OF NANTUCKET
Large numbers of visitors to a region often have a significant effect on local
organizations and infrastructure. As stated by Graebert et al., “[seasonal visitors] affect traffic,
real estate prices, retail sales, crime, littering and pollution, and local employment, as well as the
use of public transit, medical and emergency services, recreational facilities, utilities and public
spaces (Smith and House, 2007).” Based on the most recent estimate from the United States
Census, the 2016 estimate for year-round residents on Nantucket was 11,008 (U.S. Census
Bureau, 2017). However, the Nantucket Town Clerk’s office places the current permanent
population at 13,200 through a local census conducted every year, see Section 2.3 (Nantucket
Town, 2017). As a popular resort destination, the population on Nantucket increases dramatically
during the summer months. In 2010, a study was conducted that determined the peak summer
population may be as high as 50,000, based on data collected from waste production (Beliveau et
al., 2015). However, the validity of this information was questioned by the Nantucket
community because only one data collection method was utilized, and was not validated by other
data sources.
The term effective population will be used to refer to the number of individuals on the
island at any given time. The effective population can be difficult to determine due to the various
demographic categories, combined with the complexity of the travel patterns made. Various
demographic groups of interest on Nantucket include: year-round permanent residents, tourists,
commuters (weekly and daily), seasonal workers, and summer residents who tend to have second
homes on Nantucket. To evaluate the effective population, it is necessary to study the travel

17
patterns of the various demographic groups. The effective population is of great importance in
decision-making procedures by local organizations because implemented policies can then be
tailored to reflect the needs of the population.
2.2 POPULATION ESTIMATION TECHNIQUES
Determining the effective population in seasonally popular areas can often be challenging
because of the many demographics involved. These demographic categories include permanent
residents, seasonal residents, tourists, and commuters. Permanent residents are often accounted
for using government and local census data. Other demographics are more difficult to evaluate
due to the variability of their complex travel patterns. However, many studies have implemented
methods to gain reasonably accurate population estimates in seasonally popular communities.
2.2.1 DIRECT VS. INDIRECT APPROACHES
There are many methods used to estimate populations, all of which can be separated into
two groups: direct and indirect. Direct approaches rely on “censuses and surveys that have
collected information directly from temporary residents” (Smith, 1989). While the direct
approach is widely used, the data collected is often drawn from a small sample size and can be
difficult to obtain. In 1986, Fifield et al. conducted a study that estimated the winter population
of temporary residents in Arizona mobile home parks using a direct approach. Owners of the
parks were interviewed to determine the total number of lot spaces for mobile homes and the
occupancy rate of seasonal residents. The study then utilized a survey to find the percentage of
temporary residents living in the mobile homes, which allowed for seasonal population to be
calculated (Fifield et al., 1986).
Indirect approaches use “symptomatic variables that reflect changes in temporary
populations” (Smith, 1989). The term “symptomatic” refers to measurable variables that are
affected by population fluctuations. These include, but are not limited to: retail sales tax, utility
usage, wastewater production, and cell phone data. Indirect approaches are often more efficient
because data sets regarding symptomatic variables are usually more complete, as well as more

18
readily available than local and government census data (Smith, 1989). The remainder of section
2.2 discusses indirect approaches to population estimation.
2.2.2 PUBLIC RECORD ANALYSIS
The Monmouth County Planning Board conducted a population study in 2008 to “support
emergency and non-emergency transportation” in a region with a significant increase in summer
population. Monmouth’s 26 miles of coastal roads are subject to flooding during storms. The
study gathered data on different groups of people, including permanent residents, day trippers,
and overnight visitors. Maintaining accurate data on these groups of people allowed Monmouth
County to estimate how many people were in a certain area on any given day, and therefore plan
for traffic restrictions that would inhibit evacuation.
The Monmouth County Planning Board considered a variety of techniques to produce a
summertime population estimate. The first proposed approach was to compile existing
information collected by town government in the region, as a well as state and county tourism
departments. While population data collected from town government is usually organized and
requires little analysis, the data is often outdated or incomplete (Monmouth, 2008). However,
this method can still be valid provided that a region keeps data up to date.
A Michigan population study in 2014 conducted by Graebert et al. used local government
records in combination with studies in the region to produce an estimate of seasonal residents
(second homeowners) and their effect on the population at any time. The study utilized a basis
that “the average household size of primary seasonal residents is 3.3, with 2.6 adults and 0.7
children, as well as 2.8 additional guests per trip.” When Graebert et al. combined this basis with
information regarding the occupancy rate for seasonal homes in the region, they were able to
produce an estimate of the number of second homeowners and their visitors in the region during
every season of the year. The data used in the study was too limited to assess the seasonal
homeowner population by month (Graebert et. al., 2014).
Graebert et al. also examined the number of visitors that made overnight
accommodations in hotels to gain a better understanding of the seasonal tourist population. The
study used occupancy data to compose an estimate of the number tourists that were staying
overnight in the region at any time (Graebert et al, 2014).

19
The Monmouth County Planning Board considered a similar method to that of Graebert
et al., an analysis of retail sales in the form of tax information. The volume of transactions
completed by retailers indirectly reflects the number of consumers in the region at any given
time. With a large enough sample size, the average sale volume can be extrapolated to estimate
the number of people in the area (Monmouth, 2008).
2.2.3 UTILITY ANALYSIS
The Monmouth County Planning Board also considered the analysis of utility
consumption, including electricity, gas, and water. Using a per capita average consumption for
each utility, the Planning Board would be able to generate a population estimate for each. One
problem that arises with this method is that tourists, especially day-trippers, are unlikely to use
any electricity or gas, which would make it difficult to account for these groups. Because of this,
it is unlikely that electricity and gas analyses are an effective method to use for evaluating
seasonal population variations. However, all utility information can be useful in tracking the
number of seasonal residents (second homeowners) that are using their homes at any point in
time. Water use also can provide indirect estimates of tourist populations from the services and
facilities that tourists would typically use (Monmouth, 2008).
2.2.4 WASTEWATER ANALYSIS
After the consideration of other methods, the Monmouth County Planning Board
concluded that a wastewater analysis was the most viable method for Monmouth County because
“it [varied] most directly with population. People generate wastewater through the course of
bathing, washing, cooking, and flushing the toilet, and these activities are fairly constant
throughout the year” (Monmouth, 2008). Even so, the correlation of wastewater to population
can be skewed by water that enters the system from natural sources. Environmental factors like
groundwater and surface runoff inflow are minimized during periods of drought, so the planning
board selected wastewater data from 2002, a major drought year, for the population study
(Monmouth, 2008).
The wastewater data was evaluated on the basis that the average resident uses 60 gallons
of water per day, while the average overnight visitor and day tripper uses 40 gallons and 7

20
gallons of water per day respectively. The data evaluated for the month of January provided
insight regarding the number of year-round residents. This meant that the difference between
January wastewater production and summer wastewater production would be attributed to day
trippers and overnight visitors only. Wastewater data was analyzed for any given day by dividing
total wastewater produced by averages of wastewater production per capita, yielding the
population estimate.
In a 1976 report, Goldschmidt and Dahl examined how a population study in Ocean City,
Maryland, allowed health services in the city to plan ahead to handle the high volume of seasonal
visitors. According to the US Census, the popular vacation city had a year-round population of
approximately 2,000 people, but wastewater analysis suggested that the peak summer population
was as large as 110,000. With this information, it was possible for the Greater Ocean City Area
Health Services Corporation to “be in a position to develop medical facilities to cope with both
the projected increase in the resort’s population and its seasonal distribution” (Goldschmidt,
1976). More specifically, the health services entities of Ocean City were able to seasonally staff
hospitals and build more facilities to accommodate the growing number of patients. Population
analysis in Ocean City led to a more efficient medical response procedure, improving the
chances of providing adequate care to those in need (Goldschmidt).
2.2.5 TRAFFIC ANALYSIS
In 1999, Greg Lamb of the University of Wisconsin conducted a population study of
Door County. Lamb began by dividing the total volume of taxable retail and service sales by the
average sales per capita to yield a maximum seasonal population, which is similar to the
approach considered by the Monmouth County Planning Board discussed in Section 2.2.2. From
there, Lamb accounted for seasonal variation using data from traffic counters, assuming that in
January there were zero seasonal residents. The total traffic activity measured in each month
provided multipliers to use in conjunction with the maximum and minimum (census of
permanent residents) population data (Lamb, 1999).
A population study conducted by Fehrs & Peers in 2014 examined travel behavior in
Napa County, California, an area well known for its wineries. The study used a variety of
approaches to infer the purposes of vehicle trips in the region. First, a baseline number of
vehicles was established using traffic counters for comparison to other methods. Next, the study

21
established multiple zones where photographs of license plates were captured. If a vehicle passed
through two or more zones based on matching license plates, then the purpose of the trip could
be inferred. For example, if a vehicle was observed entering Napa County at one zone, and then
leaving Napa County at a different zone a short time later, the trip could be classified as a “pass-
through trip” (Fehrs & Peers, 2014).
2.2.6 CELL PHONE DATA ANALYSIS
A 2007 study utilized the cell phones of foreign tourists to track seasonal tourism in
Estonia. The study used a depersonalized data set collected by the mobile positioning company
Positium from the EMT network, the largest cellular network in the country (Ahas, 2007). The
results of the study showed the number of tourists during the summer was above the annual
average, with a high correlation between cell phone activity and summer tourist areas along the
north and eastern borders of the country. Figure 2 shows the strong correlation between tourist
areas and activity, as shown by factor loadings closer to 1.0.
FIGURE 2: SPATIAL CORRELATIONS OF THE FIRST FACTOR—SUMMER TOURISM AREAS (AHAS ET
AL., 2007).
The study found that a significant number of summer tourism parishes increased cell
phone activity, including parishes along the main highways connecting important tourist routes.
Ahas et al. also found that the majority of tourists in northern and western Estonia are mostly
Finns and Russians, as shown in Figure 3 (Ahas et al, 2007).
22
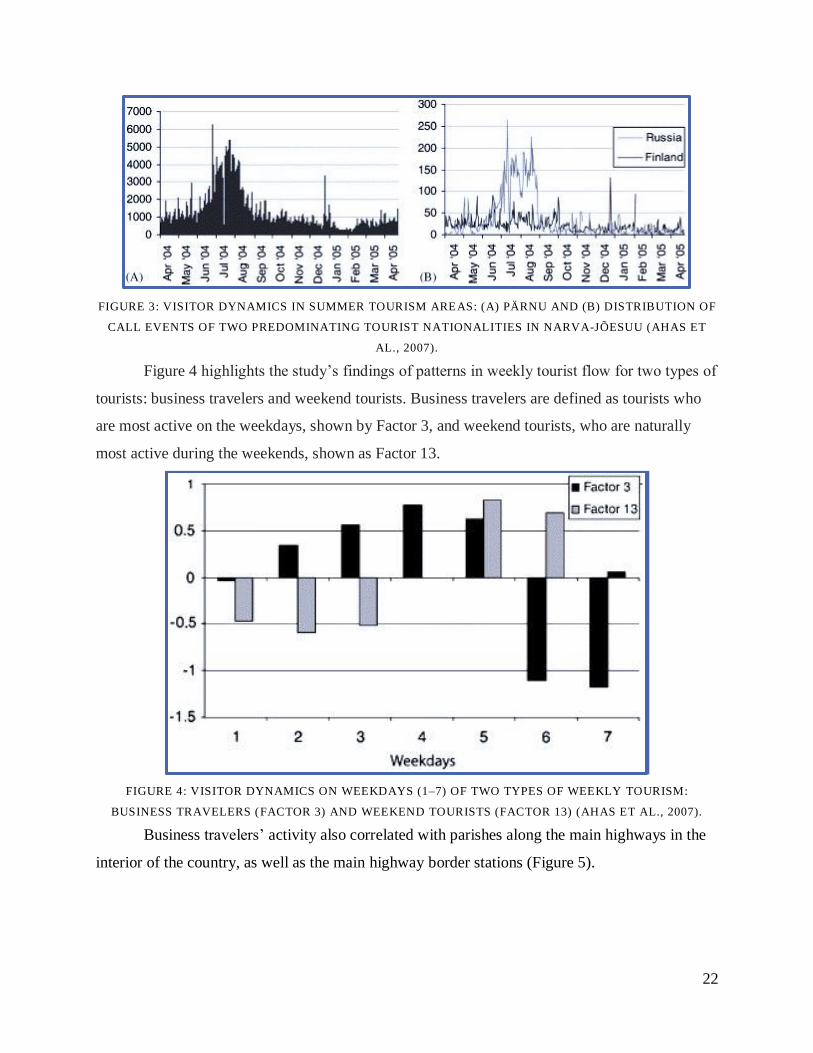
FIGURE 3: VISITOR DYNAMICS IN SUMMER TOURISM AREAS: (A) PÄRNU AND (B) DISTRIBUTION OF
CALL EVENTS OF TWO PREDOMINATING TOURIST NATIONALITIES IN NARVA-JÕESUU (AHAS ET
AL., 2007).
Figure 4 highlights the study’s findings of patterns in weekly tourist flow for two types of
tourists: business travelers and weekend tourists. Business travelers are defined as tourists who
are most active on the weekdays, shown by Factor 3, and weekend tourists, who are naturally
most active during the weekends, shown as Factor 13.
FIGURE 4: VISITOR DYNAMICS ON WEEKDAYS (1–7) OF TWO TYPES OF WEEKLY TOURISM:
BUSINESS TRAVELERS (FACTOR 3) AND WEEKEND TOURISTS (FACTOR 13) (AHAS ET AL., 2007).
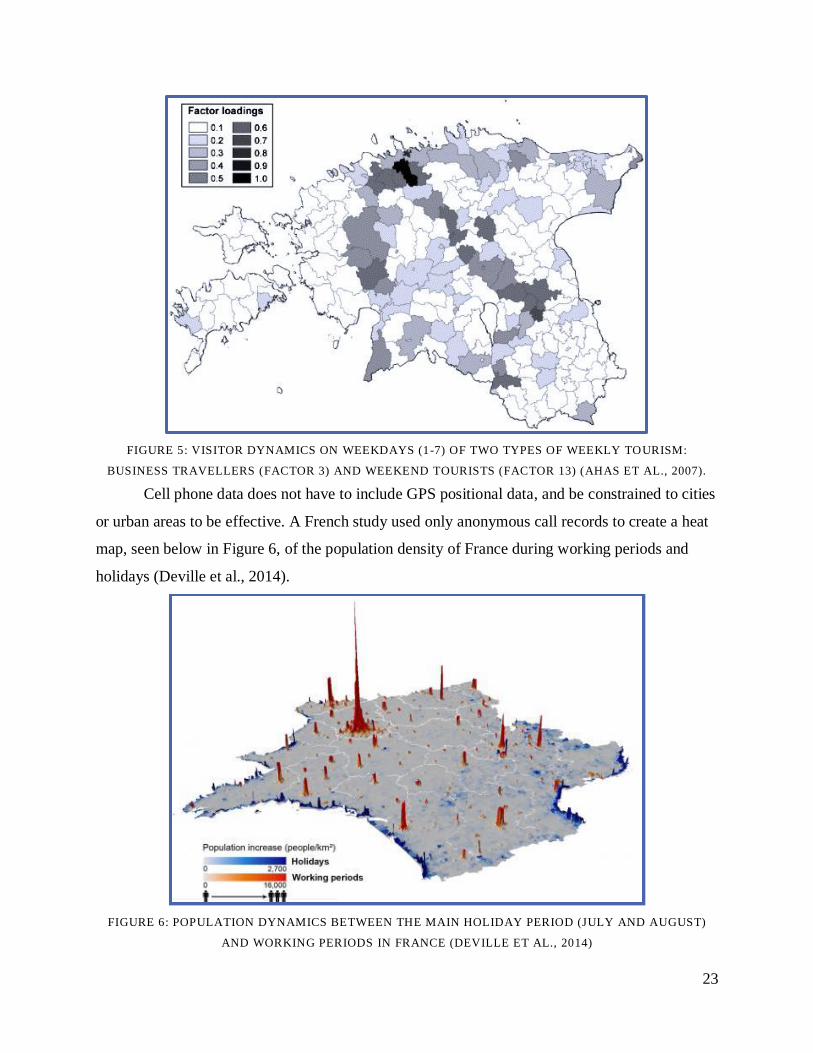
Business travelers’ activity also correlated with parishes along the main highways in the
interior of the country, as well as the main highway border stations (Figure 5).
23
FIGURE 5: VISITOR DYNAMICS ON WEEKDAYS (1-7) OF TWO TYPES OF WEEKLY TOURISM:
BUSINESS TRAVELLERS (FACTOR 3) AND WEEKEND TOURISTS (FACTOR 13) (AHAS ET AL., 2007).
Cell phone data does not have to include GPS positional data, and be constrained to cities
or urban areas to be effective. A French study used only anonymous call records to create a heat
map, seen below in Figure 6, of the population density of France during working periods and
holidays (Deville et al., 2014).
FIGURE 6: POPULATION DYNAMICS BETWEEN THE MAIN HOLIDAY PERIOD (JULY AND AUGUST)
AND WORKING PERIODS IN FRANCE (DEVILLE ET AL., 2014)

24
This study highlights the increased population density in the urban areas during working
periods, namely during business hours of the work week. It also depicts the holiday population
distribution around the coastline, where people are placing calls while on the beach. This study,
which only consisted of call record data, was able to produce “spatially and temporarily explicit
estimates of population densities at the national scale, comparable with outputs produced using
alternative human population mapping methods” (Deville et. al., 2014). It shows that even the
basic call record data collected from cell phones is enough to produce a usable population
estimate based on the subset of the population that used their cell phones, accounting for
dynamic weekly density changes from urban areas to the coastline beaches.
Tracking travel patterns is a crucial component to the analysis of effective population and
demographics. Seasonal variations in population often make travel patterns complex. A study of
the travel behavior in Napa County, California by Fehr & Peers gives insight into effective ways
to track travel patterns in resort locations with season population. As mentioned in Section 2.2.5,
Fehr & Peers used vehicle classification counts and license plate matching to track sheer
numbers of people headed in a certain direction, but this is prone to human error and provides a
small sample size. Using mobile device data to track the movements of a population allows for a
larger, more dynamic sample of information, and is much more time efficient (Fehr & Peers,
2014). Fehr & Peers explain that “INRIX and StreetLight Data [services] are able to collect and
analyze [mobile data] while the device is in use to record the anonymous location and movement
of mobile devices” (Fehr & Peers., 2014).
Fehr & Peers utilized the StreetLight Data service to collect and analyze different types
of recognizable trips, and used this information to infer the purpose of each trip. Shown below in
Figure 7 is an example of how StreetLight can gather and present travel data.

25
FIGURE 7: PERCENTAGE OF TRIPS STARTING AND ENDING IN NAPA COUNTY BY HOUR OF DAY
(FEHR & PEERS, 2014).
The Napa Valley study used StreetLight data and was able to infer the purpose of
individual trips. The destinations and travel patterns of people in Napa Valley tracked by
StreetLight could be associated with a certain demographic. For instance, if a group of cell
phones was repeatedly detected in a residential area, and then again in a commercial area, one
could infer that those phones belong to people that are residents in that area, who commute
within Napa Valley to go to work. These patterns are displayed below in Figure 8.

26
FIGURE 8: NAPA COUNTY POPULATION INFERRED TRAFFIC PATTERNS (FEHR & PEERS, 2014)
Figure 8 shows the movement of people into and out of Napa County, as captured via
their mobile devices. By studying the origin and destination of each route, Fehr & Peers inferred
the type of person taking each route. For example, the orange route represents groups that started

27
their trips in the middle of Napa County, with a destination to the north. Knowledge of the area
revealed that the origin of these trips is in a residential area, and the destination is located
downtown, where many residents work. Fehr & Peers then inferred that based on these results,
the traffic between these points represented Residents of Napa County (Fehr & Peers, 2014). The
same was concluded for the other traffic data. Analyzing the origin and destinations of certain
traffic groups gave insight as to what type of person they were. They were categorized as being
from across county lines, workers who traveled outside Napa County for work, and groups that
just passed through the county.
To conduct an effective population study, it is important to consider many different
approaches. As discussed earlier in this section, the Monmouth County Planning Board weighed
the pros and cons of the analysis of wastewater, retail tax, utilities, and compiling local
government information before deciding on a wastewater analysis as their primary method.
Often, a variety of direct and indirect approaches of population estimation are required to ensure
the validity of data.
2.3 EFFORTS TO ESTIMATE THE POPULATION OF NANTUCKET
The Town of Nantucket has used several methods to estimate population. One simple
method is a yearly census survey conducted by the Town Clerk. Each year during the winter
months, the Town Clerk sends a survey to all the registered “head of households” on Nantucket.
The survey asks about people living at that address, and if that is their permanent residence.
Through this method, the Town Clerk reported a permanent population of 13,200 year-round
residents of Nantucket in 2016 (Nantucket Town). However, this can only be considered as a
minimum value because it cannot be assumed all residents on Nantucket return the yearly census
survey every year. While this method is useful for acquiring an estimate for the permanent
population, it does not account for Nantucket’s population throughout the year. Due to the
dynamic nature of Nantucket’s seasonal population, a count of permanent residents is only
relevant during the tourism offseason.
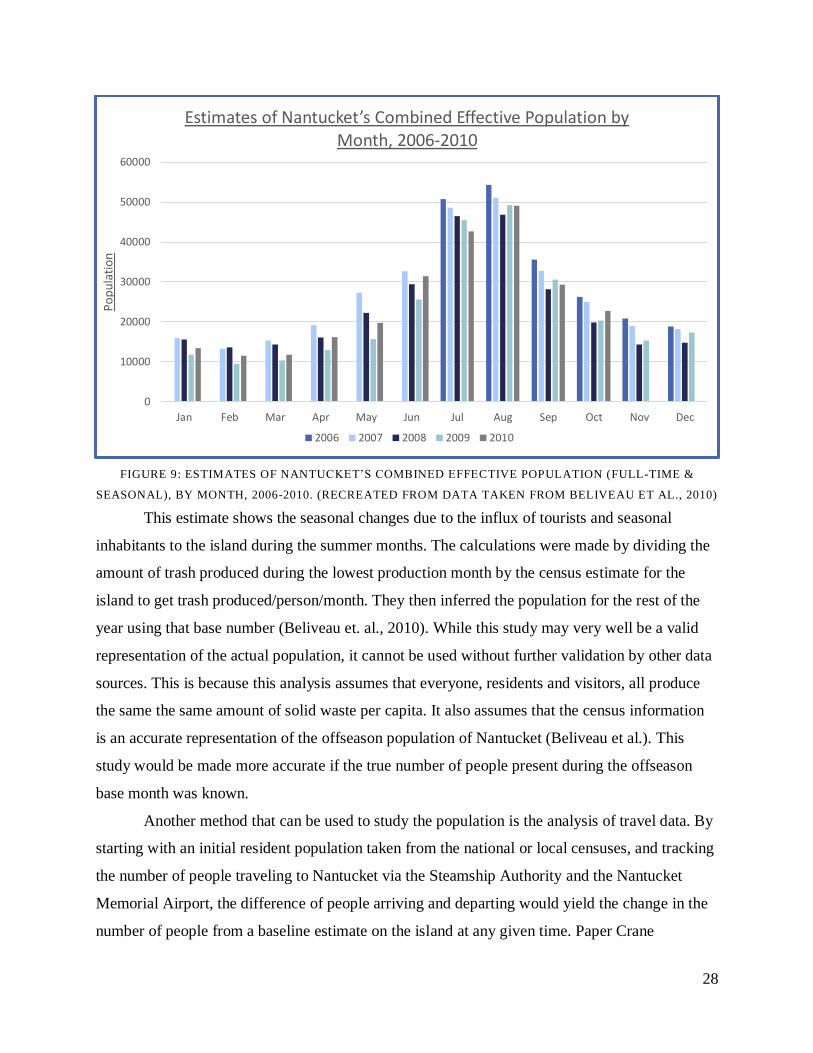
One study carried out by Beliveau et al. used existing waste production data from the
Nantucket Department of Public Works to compute an estimate of the effective population, as
seen below in Figure 9.
28
FIGURE 9: ESTIMATES OF NANTUCKET’S COMBINED EFFECTIVE POPULATION (FULL-TIME &
SEASONAL), BY MONTH, 2006-2010. (RECREATED FROM DATA TAKEN FROM BELIVEAU ET AL., 2010)
This estimate shows the seasonal changes due to the influx of tourists and seasonal
inhabitants to the island during the summer months. The calculations were made by dividing the
amount of trash produced during the lowest production month by the census estimate for the
island to get trash produced/person/month. They then inferred the population for the rest of the
year using that base number (Beliveau et. al., 2010). While this study may very well be a valid
representation of the actual population, it cannot be used without further validation by other data
sources. This is because this analysis assumes that everyone, residents and visitors, all produce
the same the same amount of solid waste per capita. It also assumes that the census information
is an accurate representation of the offseason population of Nantucket (Beliveau et al.). This
study would be made more accurate if the true number of people present during the offseason
base month was known.
Another method that can be used to study the population is the analysis of travel data. By
starting with an initial resident population taken from the national or local censuses, and tracking
the number of people traveling to Nantucket via the Steamship Authority and the Nantucket
Memorial Airport, the difference of people arriving and departing would yield the change in the
number of people from a baseline estimate on the island at any given time. Paper Crane
0
10000
20000
30000
40000
50000
60000
Jan Feb Mar Apr May Jun Jul Aug Sep Oct Nov Dec
Po
pu
lati
on
Estimates of Nantucket’s Combined Effective Population by Month, 2006-2010
2006 2007 2008 2009 2010
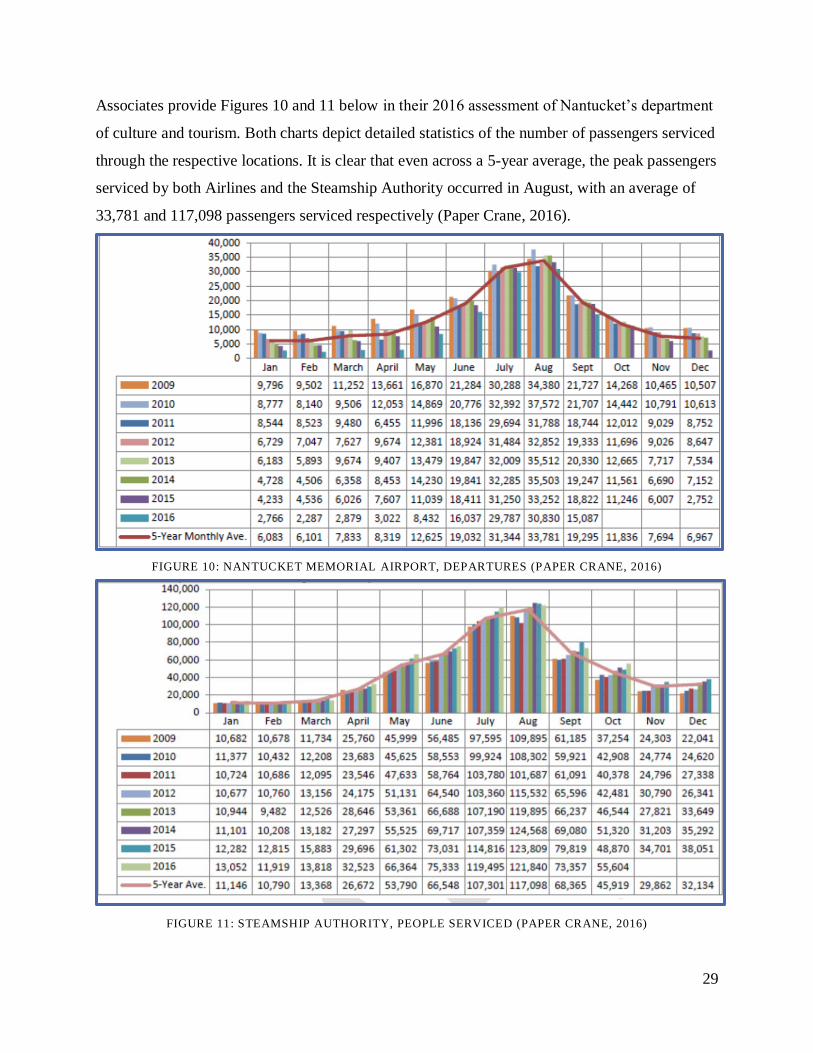
29
Associates provide Figures 10 and 11 below in their 2016 assessment of Nantucket’s department
of culture and tourism. Both charts depict detailed statistics of the number of passengers serviced
through the respective locations. It is clear that even across a 5-year average, the peak passengers
serviced by both Airlines and the Steamship Authority occurred in August, with an average of
33,781 and 117,098 passengers serviced respectively (Paper Crane, 2016).
FIGURE 10: NANTUCKET MEMORIAL AIRPORT, DEPARTURES (PAPER CRANE, 2016)
FIGURE 11: STEAMSHIP AUTHORITY, PEOPLE SERVICED (PAPER CRANE, 2016)
30
However, the simple addition of arrivals and subtraction of departures from both services
does not reveal the effective population for a few reasons. The data is supplied in total ridership
per month, which is too long of a period to accurately track how many people are moving
through the island. As it also only displays total ridership (the number of passengers serviced),
we do not have data on the arrivals and departures. A more detailed analysis of demographic
groups, such as tracking visitors and commuters is not possible using this data set, as there is also
no method to tag individuals. Simple plus-minus analyses like this do not lend themselves to
extracting this kind of demographic information (see discussion in Section 2.1 above). Another
issue at play is that Nantucket is an extremely affluent community, with many individuals
owning second homes that they commute to using a personal plane or boat. These crafts are not
required to report their occupancy upon arrival or departure, creating a discrepancy in the
previous method described above.
2.4 THE NANTUCKET DATA PLATFORM
Data platforms are “centralized computing system[s] for collecting, integrating and
managing large sets of structured and unstructured data from disparate sources” (Rouse). Data
platforms started to form due to more data becoming available at an increasing rate. With the
start of the digital age, more detailed information became widely available and trackable. As
discussed in Section 2.1, data can be used for informed decision making in various organizations,
which makes data platforms powerful analytical tools.
To better understand modern data platforms, we looked into three platforms: the
Connecticut Data Collaborative, the Boston Data Platform, and the Venice Open Data Project.
These platforms collect and house data from various sources, such as state and national
government departments, as well as academic research projects. These sites allow for the public
to either download data, or visualize it with interactive maps and figures. This data helps the
public understand what is going on in their area and assists local organization in making
informed decisions. For more information on each of the individual data platforms, see Appendix
A.
The Nantucket Data Platform (NDP) is an organization that was founded in the spring of
2017 by Alan Worden, Joe Smialowski, and Peter Morrison, three active members of

31
Nantucket’s community, with backgrounds in demographic analysis. They recognize the
importance of data informed decision making, and want to gather more reliable data for the
people of Nantucket. The mission statement of the Nantucket Data Platform, similar to other
platforms, is “to acquire, consolidate and make available a continuously-updated reservoir of
reliable data to help government leaders, nonprofits and businesses make more informed
decisions about issues impacting the community” (Balling, 2017). They plan to accomplish this
by creating a site where the public can find organized and accessible data, with their first project
being an effective population study of Nantucket. The NDP is working with Civis and
StreetLight, two data collection and visualization companies, to form the base of their available
data for analysis. In the past, Civis has provided data for organizations such as Boeing, Verizon,
and the Obama 2012 presidential campaign (Civis). They will provide the NDP with a large
assortment of data sets that deal primarily with population demographics. Their services include
market research tools, demographic targeting, and resource allocation.
The Nantucket Data Platform is interested in pursuing a more accurate population
estimate through the use of anonymous cell phone data. Thus, the Nantucket Data Platform will
be working with StreetLight, the data collection and aggregation site used in the Napa Valley
work described in Section 2.2. Their datasets include three main types of data: Location-Based
Services (LBS), Geographic Positioning Services (GPS), and contextual data. LBS data comes
from smartphone applications that track a device's location to provide specific services. GPS data
comes from devices that help people navigate, whether it be connected to vehicles, or
navigational applications like Google Maps. Contextual data is location data sets that are used in
combination with the previous sources to provide additional information. The provided data is
anonymized and decentralized from the personalized data that streetlight obtains to ensure that
the StreetLight data cannot be used to track the movement on any one specific person. The NDP
plans to use StreetLight to study the mobility of people on Nantucket to make estimates
regarding population trends. This will be used to gain a deeper understanding of the population
and demographics on Nantucket.

32
3.0 METHODOLOGY
The goal of this project was to determine effective methods of evaluating population data for
the NDP. To accomplish this, we developed the following research objectives:
I. Objective 1: Determine best practices for the collection, analysis, and use of population
data in resort communities
II. Objective 2: Evaluate stakeholder needs for demographic data to strengthen evidence-
based decision making in the public and private sectors on Nantucket
III. Objective 3: Evaluating the usefulness of Streetlight data, combined with other data
sources, for population estimation
The tasks chosen to achieve each of these objectives are presented in Figure 11 and discussed
in more detail below. A timeline for the completion of the different tasks of this project can be
found in Appendix B.
FIGURE 12: PROJECT OVERVIEW FLOWCHART

33
3.1 OBJECTIVE 1: DETERMINE BEST PRACTICES IN COLLECTION,
ANALYSIS, AND USE OF POPULATION DATA IN RESORT COMMUNITIES
Our first objective was to determine effective methods for collecting, analyzing, and
using data to estimate population characteristics in resort communities. We set out to determine
what methods were relevant, how they were conducted, and the limitations of each. To determine
best practices, we looked through different reports published by resort communities reporting
how they estimated population. We also examined different methods used by demographers and
statisticians to estimate population and population demographics. This research guided our
methods on Nantucket and provided insight on relevant analyses. Further building on our
background research, we communicated with demographers, scientists who study the field of
human population dynamics, and other experts to refine our understanding of best practices.
We considered a variety of indirect approaches to population estimation, all of which
used existing census data in conjunction with a symptomatic variable. StreetLight Index and
solid waste production were symptomatic variables that we obtained population estimates from,
using methods that we examined in Section 2.2. We searched for any additional sources of data
on Nantucket that contained symptomatic variables that would enable us to produce population
estimates.
3.2 OBJECTIVE 2: EVALUATE STAKEHOLDER NEEDS FOR
DEMOGRAPHIC DATA TO STRENGHTEN EVIDENCE-BASED DECISION
MAKING ON NANTUCKET
Our second objective was to solicit feedback about how demographic information may be
used from a broad range of stakeholders spanning the public and private sectors who are likely to
utilize the NDP’s resources in the future. We wished to know more about the demographic
information people desired, how they wanted it to be presented, and how it should be analyzed.
To gain this insight, we interviewed potential stakeholders. The feedback we received was drawn
on when proposing analyses to the Nantucket Data Platform that would be useful to local
organizations.
We interviewed 5 private sector representatives, 8 public sector representatives, and 2
nonprofit sector representatives. The specific individuals to be interviewed, in consultation with

34
the Nantucket Data Platform, were selected with regards to their engagement in the conversation
of demographic data on Nantucket, as well as their potential to benefit from this information.
The categories and organizations that we interviewed is located in Appendix C. We determined
that it would be important to gauge the opinions from three distinct viewpoints. The private
sector and certain nonprofits would lend their opinions on how data could be used to run a more
efficient operation and increase profits, while various town offices from the public sector would
be able to describe how population data could be used for planning town projects, regulations,
and funding.
We contacted potential interviewees by email or phone initially to introduce ourselves,
explain our research and solicit participation. We scheduled face-to-face meetings at the
individual’s earliest convenience, or conducted the interview via phone, Skype, or email if the
respondent preferred. Prior to an interview, we conducted some preliminary background research
on the organization to learn about its business and role on Nantucket. From this information, we
prepared and reviewed a set of questions and key talking points to address with the specific
organization at hand. We read an interview preamble (See Appendix D) to the individual(s)
present in full before the interview began to introduce them to the topic and verify their consent
to participate.
During an interview, no more than two interviewers were present with one or two
interviewees at a time. During each interview, one person took the main role as the lead
interviewer, while the other primarily focused on taking notes.
After each interview, those that participated from the group came together to discuss their
recorded minutes. A digital record/file was kept with the notes of each interview. Primary themes
and ideas that rose as being predominant across the interviews conducted were noted and listed
as an easy reference for commonalities between interviews.
Very little is known about the process by which employers hire seasonal workers, how
many workers are hired each year, and the difficulties employers face in finding enough seasonal
staff. We conducted a survey of employees to seek answers to these questions.
We identified that the Nantucket Chamber of Commerce email contact list of its
associated members provided a sufficient sample. In cohort with the Nantucket Data Platform,
we asked the Chamber of Commerce to send an email cover note on behalf of the team and the
Nantucket Data Platform. The cover note explained the nature of the research and contained a

35
link to an online survey (See Appendix E). We anticipated that we would receive a substantial
response from a cross-section of employers under the auspices of the Chamber. The survey was
sent to 660 employers on the Chamber of Commerce mailing list.
In consultation with the Nantucket Data Platform, we developed a set of questions to that
we believed would provide meaningful insights into the seasonal workforce on Nantucket (See
Appendix E). We pretested the survey with a small sample of business owners on Nantucket to
improve clarity and comprehension. Based on the feedback we received, we consulted with the
Nantucket Data Platform to make the necessary changes and ensure that the survey will provide
the desired information. The survey was developed online in Qualtrics and we anticipated that it
would take less than five minutes to complete.
As noted, we asked the Chamber to email their members on our behalf with a URL link
to the survey. The cover email and preamble at the beginning of the survey explained that the
survey is entirely voluntary and anonymous. We avoided including identifying information in
our final report, which includes only aggregated, anonymous data. We monitored the responses
in Qualtrics and asked the Chamber to send out multiple reminder emails.
The survey returns were insufficient to allow any findings other than a modest number of
anecdotes. The results of the survey can be found in Appendix F.
3.3 OBJECTIVE 3: EVALUATING THE USEFULNESS OF STREETLIGHT
DATA, COMBINED WITH OTHER DATA SOURCES, FOR POPULATION
ESTIMATION
Our third objective was to assemble, integrate, and evaluate different types of data to
determine their efficacy in gaining a better understanding of Nantucket’s dynamic population.
We conducted estimates of the total population, as well as examined the following
subpopulations:
• Permanent (year-round) resident: A person who lives on Nantucket during every month
of the year.
• Seasonal resident: A person who owns a second home on Nantucket and resides on
Nantucket for a portion of the year.

36
• Commuter: A person who travels to and from the island on either a daily or weekly basis
to work on Nantucket.
• Tourist: A person who visits Nantucket for a short period of time (days to weeks).
As outlined above in Section 2.1, the nature of island population is not conducive to any
one means of population estimation, which is why we integrated multiple methods into our
analysis.
We used and evaluated StreetLight LBS data to estimate the population on Nantucket. As
discussed in Section 2.2.6, StreetLight provides data collected anonymously from mobile devices
and connected vehicles, which then provides relative demographic and population amounts (See
Section 4.2). We attempted to evaluate if these data are representative of the population of
Nantucket. We also attempted to determine how data obtained from StreetLight may be used in
conjunction with other data sources to estimate the relative and absolute size of the Nantucket
population and demographics of interest. StreetLight data is reported as groupings of users to
protect individual privacy. The nature of the location data keeps users anonymous, and is
reported as relative percentages rather than individual cell phones. StreetLight represents
approximately 10-15% of personal and commercial travel data in the US (StreetLight).
StreetLight’s privacy statement can be found in Appendix G.
While StreetLight Data was used extensively as a method to determine the effective
population of Nantucket, various other methods were used as well. We conducted the following
analyses to produce population estimates, as well as to validate StreetLight population estimates:
• StreetLight data analysis: We examined possible uses of StreetLight as a tool to provide
insights regarding the population of Nantucket.
• Solid waste analysis: We used solid waste production data as a symptomatic variable of
population in conjunction with the Street Census to produce a population estimate. Solid
waste analysis was used as a main comparison to StreetLight.
• Travel data analysis: We utilized ferry and airport ridership data to as a validation check
for different population analyses.

37
To conduct the analyses listed above, we utilized certain sets of data from a variety of
sources. We chose to investigate the viability of the following data sources based on the variety
and availability of sources present on Nantucket:
• StreetLight LBS mobility data
• Street Census from the Nantucket Town Clerk (See Section 2.3)
• Ferry and airport travel data from the Town Planning Office
• Solid waste data from the Nantucket Department of Public Works (DPW)
• Cell phone mobility data from the StreetLight Data service
• Stop and Shop scan data from Nielsen Datasets
• Electricity consumption from National Grid
• Water consumption
• Nantucket public school enrollment
We needed a reliable base of population data to use for our analyses, as well as to
compare to our results. More specifically, we required data sources that would allow us to relate
our methods of population estimation to the population of Nantucket. We hoped by analyzing
these data sets according to the previous methods detailed in Section 2.2, we could provide
reliable population data, as well as outline reasonable approaches to determine the effective
population of Nantucket.
38
4.0 FINDINGS
In this chapter, we analyze the information gathered from StreetLight and other data
sources. From this, we have developed the following findings concerning the effective
population of Nantucket, and the various assumptions that affected our analysis:
1. There are many useful sources of data about Nantucket, each with its own strengths and
limitations, which can be combined to make inferences about the total population of the
island.
2. StreetLight is an effective platform for stratifying the Nantucket population into the
various demographic groups (listed below).
3. Basing population estimates on an “anchor month” is a promising method for scaling up
the StreetLight activity index and waste production into actual population numbers.
4. Solid waste data provides high confidence population estimates that we can use to
compare to StreetLight trends
5. Many Nantucket public offices and businesses on the island are enthusiastic about the
possible availability of data regarding population trends and subpopulations.
For each analysis conducted, we provide explanations to support our findings, and
document any assumptions used.
4.1 THE RELIABILITY OF DATA SOURCES FOR ESTIMATING
POPULATIONS ON NANTUCKET
We deemed the following sources of data relevant to determining the effective population of
Nantucket:
1. Street Census from the Nantucket Town Clerk
2. Ferry and airport transportation data from the Nantucket Town Planning Office
3. Solid waste data from the Nantucket Department of Public Works (DPW)
4. Cell phone mobility data from the StreetLight Data service
In this section, we discuss the reliability of these and other data sources for population
estimation.

39
The 2016 Street Census conducted by the Nantucket Town Clerk’s office (Section 2.3) is
the most complete count of permanent residents on Nantucket, as it is the most recent and the
most thorough. Catherine Stover, the Town Clerk, informed us that the 2016 Street Census had a
return rate of 77.7% (Stover). This implies that there are residents who have not registered with
the Town Clerk, which results in a much lower count than reality. The 2016 Street Census places
the population at 13,200 individuals, while the 2010 decennial United States census projected
that the resident population of Nantucket was 11,008 in 2016. Using the Street Census with its
response rate of 77.7%, we projected the permanent resident population to be 16,984 residents
(See Section 4.4.2 for assumptions of permanent resident calculation). Our projection assumes
the non-responding households have the same average household size as those who did respond.
Ridership data from the two ferry services, Hy-Line Cruises and the Steamship
Authority, provided useful representations of the total travel activity to and from Nantucket. The
data does not separate ridership into arrivals and departures, but is likely a credible source to
compare the ebbs and flows of visitor activity to our analysis using StreetLight Data (Section
4.2). However, ridership data organized by trip for the Steamship and Hy-Line ferries would
allow the Nantucket Data Platform to calculate the population, barring private transportation to
and from the island, down to a daily basis (assuming we know the anchor population, see Section
4.4.2). We have not yet obtained this data, but realize it may be available for future use.
School enrollment data obtained from the Nantucket public school system provided us
with little insight into the number of permanent residents on Nantucket. For the 2017-2018
school year, there were 1,627 students enrolled. Enrollment does not include private schools,
which is currently a large source of error. Acquiring private school enrollment totals would
account for this error. Using a national average taken from the US Census of children between
ages 5 and 18 of 16.6% (U.S. Census), applying this average to the school enrollment gave a
permanent resident count of 9,801. We know that this estimate is low, due to there being at least
13,200 residents registered on the Street Census. We believe this number to be a much lower
representation of the permanent resident population, due to Nantucket being home to a much
higher retirement-age population.
We believe that Stop and Shop scanner data, provided by Nielsen Datasets, would
provide valuable information for estimating the effective population of Nantucket throughout the
year. We were unable to obtain and analyze this data due to financial and time constraints. One

40
of the caveats with this data set is that visitors and tourists to the island would be much less
likely to go to Stop and Shop for food, and be more inclined to eat out at local restaurants.
However, we believe that it would still provide information about the offseason populations.
We considered water consumption analysis as a method to estimate the population of
Nantucket, but determined that this was not feasible. There are many seasonal variations in water
use on Nantucket that would skew consumption to the point where it would no longer be a
reliable symptomatic variable. For instance, many seasonal residents have very large lawns that
require regular watering in the summer. The extra water consumed from watering lawns would
inflate an estimate of the population drastically.
We also considered electricity consumption as a population estimation method, but
electricity consumption has a set of limitations that are very similar to water consumption. The
unknown use of electricity for air conditioning in summer and heating in winter makes the data
set unsuitable for analyzing seasonal variations in population.
We obtained Solid waste data from the Nantucket Department of Public Works,
providing us with a studied method to use for population estimation for part of 2014 and the full
years of 2015-2017. Using the same methodology as the 2010 report by Beliveau et al, we were
able to derive complete population trends for the past three years. While waste production is a
symptomatic variable of population (See Section 2.2.1), different demographic groups may
produce different amounts of waste due to everyday habits. Because we do not have evidence
comparing the amount of waste generated for each categorized group (permanent resident,
tourist, commuter, etc.), for the purposes of this analysis, we chose to assume equal trash
generation across the demographic spectrum. This assumption may lead to the over or under
representation of certain groups. As an example, tourists, especially day-trippers, may not
produce as much solid waste as permanent residents, leading them to be underrepresented in the
data.

41
4.2 INTRODUCTORY EXPLANATION TO STREETLIGHT
Before we begin to describe the findings and discoveries made using StreetLight data, as
well as from other sources. We will present a brief overview of how to use StreetLight to give a
better understanding of how it works and the information that can be gathered from it.
4.2.1 DEFINITION OF A ZONE
StreetLight tracks people that use certain cell phone applications, and provide
information on these people when they pass through zones created by the user. Zones are areas
of interest that the user can draw to any shape and size, and are normally small segments of land.
Zones can be either set to track trips that start or end in a certain location, or to characterize the
total activity of people that pass through zones.
4.2.2 TYPES OF ANALYSES STREETLIGHT PROVIDES
When creating a project in StreetLight, there are varieties of types one can choose from,
which provide different types of information dependent on the project chosen. For the purposes
of this report, we will only describe the two types of projects primarily used over the course of
this project.
1. Origin Destination (O-D) Analysis: This analysis looks at devices that originated a trip in
one zone, and then ended that trip in another zone. For this analysis, there must always be
at least one origin zone and at least one destination zone. However, there can be more if
desired.
2. Visitor Home Work Analysis: A home and work analysis describes the home and work
locations of devices that pass through a single zone, or a set of zones. Home and work
locations are determined based on where a device spends most its time over the course of
a month. A home location is the place where a device spends the majority of nighttime
hours in for at least 18 night out of a month. A work location is the place a device spends
the majority of daylight hours in for at least 18 days out of a month.
Due to how the home and work analysis infers home and work locations, seasonal
residents are indistinguishable from either residents or visitors. If they stay long enough, they
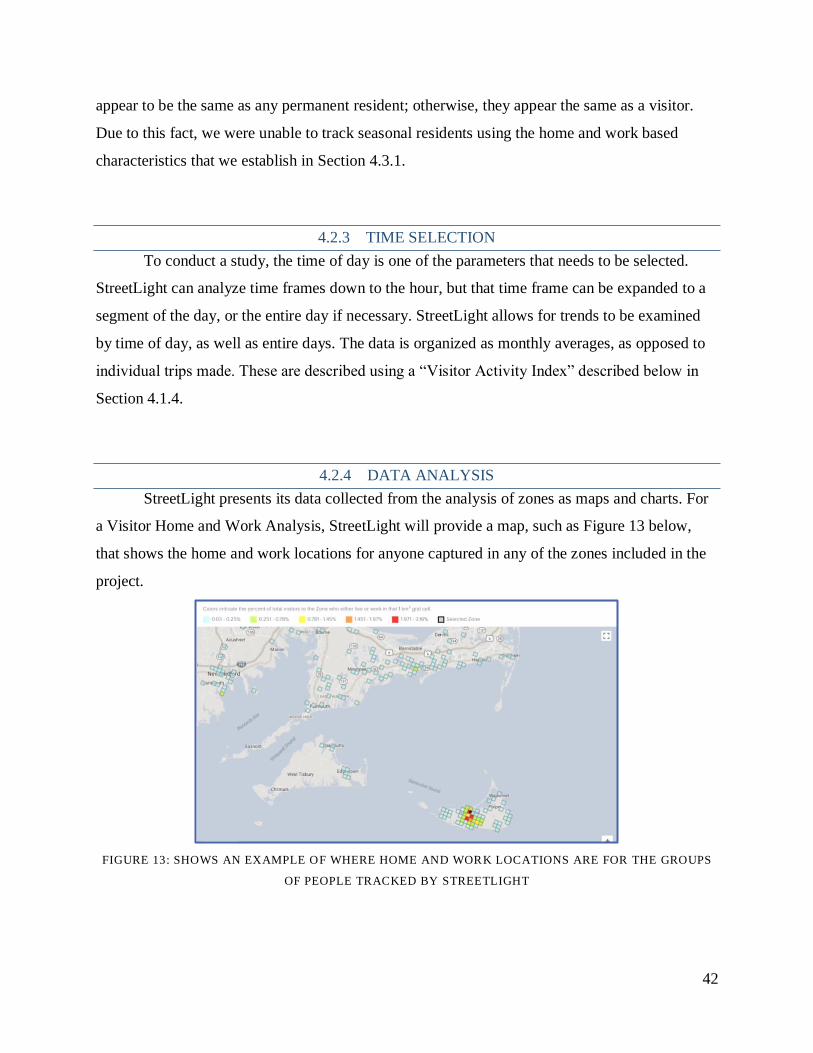
42
appear to be the same as any permanent resident; otherwise, they appear the same as a visitor.
Due to this fact, we were unable to track seasonal residents using the home and work based
characteristics that we establish in Section 4.3.1.
4.2.3 TIME SELECTION
To conduct a study, the time of day is one of the parameters that needs to be selected.
StreetLight can analyze time frames down to the hour, but that time frame can be expanded to a
segment of the day, or the entire day if necessary. StreetLight allows for trends to be examined
by time of day, as well as entire days. The data is organized as monthly averages, as opposed to
individual trips made. These are described using a “Visitor Activity Index” described below in
Section 4.1.4.
4.2.4 DATA ANALYSIS
StreetLight presents its data collected from the analysis of zones as maps and charts. For
a Visitor Home and Work Analysis, StreetLight will provide a map, such as Figure 13 below,
that shows the home and work locations for anyone captured in any of the zones included in the
project.
FIGURE 13: SHOWS AN EXAMPLE OF WHERE HOME AND WORK LOCATIONS ARE FOR THE GROUPS
OF PEOPLE TRACKED BY STREETLIGHT

43
StreetLight will also display home and work locations in the form of a chart using a
relative index, as shown in Figure 14. The chart displays the relative weight of ranges of
distances between work and home.
FIGURE 14: STREETLIGHT PROVIDING SEGMENTED DATA BASED ON THE VISITOR ACTIVITY
DISTANCE
The Visitor Activity Index is a metric used by StreetLight to display data on visitors to
zones while maintaining strict privacy for those tracked. StreetLight defines the Visitor Activity
Index as “a measure of the relative volume of visitors to the Zones. The values are provided on
an index, and do not indicate the exact number of visitors. Values can be compared to other
Zones in the same Project, or to Zones in other Visitor Projects, to understand how the relative
volumes of visitors at different Zones match up.”
4.3 ADVANTAGES AND LIMITATIONS OF STREETLIGHT DATA
StreetLight Data yields large amounts of information (home and work distances, origins
and destinations of trips) that can be used to infer the demographic characteristics of groups of
people, as well as analyze relative visitor activity in specific zones. StreetLight also provides
many useful options for analysis and visualization tools, as mentioned in Section 4.2, that allow

44
the user to draw meaningful conclusions. For instance, the user can specify the month and time
of day for the analysis.
A fundamental limitation of StreetLight is that for privacy concerns, the number of
people tracked in a specific analysis is not provided. The data collected is presented by a relative
activity index that can be compared to other StreetLight indexes. This allows for relative
percentages of inferred demographic groups, but not the number of people associated with each
demographic.
StreetLight does not allow users to create projects with zones larger than 16 km2 without
approval by an administrator, which is likely to prevent their systems from being overworked by
analyzing too much data. The project is automatically flagged for review by an administrator,
and in our experience, is usually approved promptly.
As mentioned in Section 4.1.3, StreetLight presents its data as monthly averages, which
is not useful for analyzing the population and demographics of holidays, such as July 4th. It is
likely that many businesses and local government organization would like data that provides
daily visitor activity and population estimate, but this is unobtainable through StreetLight.
We learned through an email exchange with a StreetLight Senior Support Engineer that
of the people StreetLight tracks, each person is weighted representatively by the number of
instances in which they are tracked as being in a certain zone per month (Douglass, 2017).
StreetLight weighs its indexes by counting the number days that someone is present in a zone,
and then presenting the monthly average of time spent in the zone. For example, a tourist on a
weekend trip may be tracked in a zone 3 days out of a month, while a permanent resident will be
tracked for all 30 days out of a month. This means that the tourist would represent one tenth of
what the permanent resident represents in the final Visitor Activity Index provided by
StreetLight.
While StreetLight presents data that is representative of the tracked persons, there is not
currently information on whether StreetLight tracks various demographic groups at different
rates. This is because StreetLight collects its data through mobile device applications, some of
which may be used by visitors more than permanent residents. For example, a tourist visiting
Nantucket may tend to use navigational applications more often, as they will more often need
assistance getting from place to place, compared to a year-round resident who already knows
their way around the island.

45
Below is a summary of the advantages and limitations of StreetLight:
Advantages:
• Provides the home and work distances of people that pass through specified zones.
• Provides data on household income, education, race, and family status of groups of
people it tracks.
• Can focus on specific times of day for the analysis of heavy traffic hours.
• Displays data using intuitive visuals such as charts and maps to improve data
comprehension
• Can compare the Visitor Activity Index for different projects to obtain a relative count.
• Can scale data using existing forms of population data to convert indexes to population.
• Can track traffic using origin destination analysis.
• Has multiple ways of locating homes, such as distance from zone, zip codes, census
blocks, and metro areas
Limitations:
• Provides data using a Visitor Activity Index, which does not correlate to a certain number
of people, but can be compared to other Visitor Activity Indexes in the same project or
other projects.
• It is in question whether StreetLight tracks one demographic more favorably over others
(groups described in Section 4.0).
• Provides data on a monthly average, which prevents the user from examining certain
holidays or important days.
• If a zone has less than 100 visitor activity no data is provided (for privacy concerns).
• Cannot obtain current data, as it is usually trails by about 2 months.
• Cannot obtain any data from before 2016
• Home and work analysis projects that use zones larger than 16 km2 must be approved by
admins of StreetLight
• People that work night shifts will have their home and work locations reversed
• Seasonal residents are indistinguishable from either residents or visitors by our current
heuristics (Section 4.4.1).
• Because StreetLight is a new company, some basic features are still being added.

46
4.4 POPULATION ANALYSES USING STREETLIGHT DATA
In the following sections, we describe our findings from analyses using the data sets
described above. The analyses were done to answer questions about the total population on
Nantucket, as well as demographic subgroups of year-round residents, tourists, commuters, and
seasonal residents.
4.4.1 HEURISTICS FOR NANTUCKET DEMOGRAPHICS
To track demographic groups, we developed a set of heuristics based on travel and living
patterns to identify them using parameters provided by StreetLight. We created a profile for each
of the demographics we wished to observe. For instance, a person who works on Nantucket, but
lives elsewhere is considered a commuter. Key features of StreetLight that allowed us to infer
demographic classifications were home distance and work distance. This is shown below in
Table 2.
TABLE 2: DEMOGRAPHIC BREAKDOWN BASED ON HOME AND WORK HEURISTICS
N (Nantucket Worker) O (Outside Worker)
R (Nantucket Resident) RN (Permanent Resident) RO (Seasonal Resident)
V (Visitor to Nantucket) VN (Commuter) VO (Tourist)
Permanent residents, seasonal resident, commuters, and tourists are the four demographic
groups that we recognized as being distinguishable using home and work parameters. To infer
the demographic group of a certain person, we established heuristics that were based on their
home and work distances. We created a 25 and 50-mile rule that assumes the following:
• Resident: Home is within 25 miles
• Visitor: Home is more than 25 miles
• Nantucket Worker: Work is within 25 miles
• Outside Worker: Work is more than 25 miles
• Tourist: Home is more than 50 miles

47
This rule is graphically shown in Figure 15 below, which shows Nantucket with 25 and
50-mile rings from the center of Nantucket. While the 25-mile ring encompasses some of
Martha’s Vineyard, after checking the zip codes picked up by StreetLight, we found that the
activity tracked from Martha’s Vineyard was insignificant
FIGURE 15: VISUALIZATION OF 25- AND 50-MILE RULES CENTERED AROUND NANTUCKET
Table 3 below details the heuristics for use with Streetlight for all four demographic
groups.

48
TABLE 3: DEMOGRAPHIC BREAKDOWN USING THE 25 MILE RULE
Distance in Miles Permanent Resident Seasonal Resident Tourist Commuter
Home Distance < 25 N/A > 25 25-50
Work Distance < 25 N/A > 25 < 25
Due to the amount of time it takes for the ferry to depart Hyannis and arrive in Nantucket
(About 2 hours for Steamship Traditional Ferry, 1 hour for the high-speed ferries), it is unlikely
that any daily commuters would logistically be able to travel from greater than 50 miles away.
Weekly commuters, or commuters that stay on Nantucket for a few days and then leave the
island, would be impossible to distinguish from percentage of permanent residents or tourists
using this analysis.
We also note that this method is unable to identify seasonal residents, as their activity is
indistinguishable from permanent residents or visitors as far as StreetLight can discern.
According to our current StreetLight heuristics, other data sources would be required to estimate
the seasonal resident population. In 2015, 64% of homes on Nantucket were considered seasonal
(Nantucket Housing Issues). Using this data, combined with a study on the average time of stay
for seasonal residents, may help define the seasonal resident population on Nantucket.
4.4.2 DEVELOPMENT OF AN ANCHOR MONTH
During our analyses, our team utilized what we referred to as an “anchor month”. An
anchor month is a month with a population we could most closely relate to known population
data. Since the Street Census only accounts for permanent residents, we determined that a winter
month, during Nantucket’s tourism off season, would be the strongest candidate. We made this
assumption because a month during the offseason contained the highest percentage of permanent
residents compared to other visitors to the island, and we assumed that there would be no
seasonal residents living on the island during the winter. The goal of the anchor month is to
ensure that our population estimates were conducted with a reliable base of data and clearly
stated assumptions, and to make them comparable across the different metrics we analyzed.
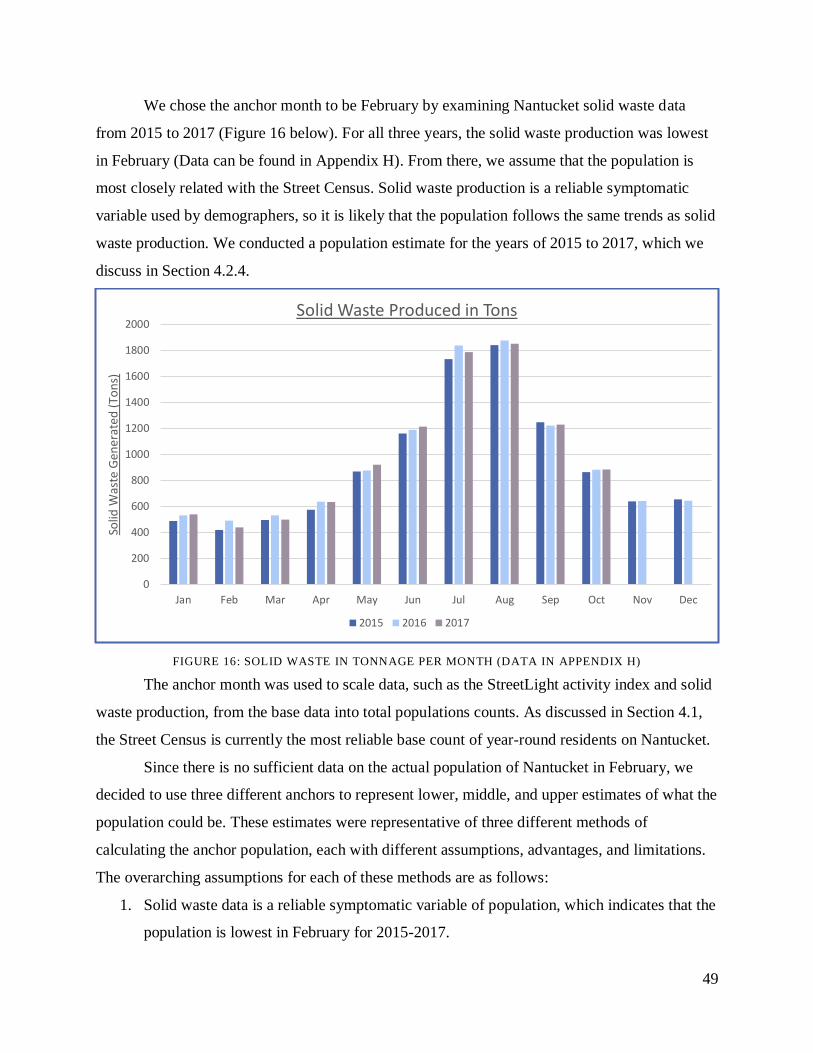
49
We chose the anchor month to be February by examining Nantucket solid waste data
from 2015 to 2017 (Figure 16 below). For all three years, the solid waste production was lowest
in February (Data can be found in Appendix H). From there, we assume that the population is
most closely related with the Street Census. Solid waste production is a reliable symptomatic
variable used by demographers, so it is likely that the population follows the same trends as solid
waste production. We conducted a population estimate for the years of 2015 to 2017, which we
discuss in Section 4.2.4.
FIGURE 16: SOLID WASTE IN TONNAGE PER MONTH (DATA IN APPENDIX H)
The anchor month was used to scale data, such as the StreetLight activity index and solid
waste production, from the base data into total populations counts. As discussed in Section 4.1,
the Street Census is currently the most reliable base count of year-round residents on Nantucket.
Since there is no sufficient data on the actual population of Nantucket in February, we
decided to use three different anchors to represent lower, middle, and upper estimates of what the
population could be. These estimates were representative of three different methods of
calculating the anchor population, each with different assumptions, advantages, and limitations.
The overarching assumptions for each of these methods are as follows:
1. Solid waste data is a reliable symptomatic variable of population, which indicates that the
population is lowest in February for 2015-2017.
0
200
400
600
800
1000
1200
1400
1600
1800
2000
Jan Feb Mar Apr May Jun Jul Aug Sep Oct Nov Dec
Solid
Was
te G
ene
rate
d (
Ton
s)
Solid Waste Produced in Tons
2015 2016 2017

50
2. The Town Clerk’s office maintains a complete list of non-respondents for each census
year.
3. The non-respondents to the Street Census have the same average family size as the
respondents.
4. Each head of household on Nantucket is documented by the Town Clerk and received a
copy of the Street Census survey.
5. All permanent residents are present on Nantucket and are counted as spending the
majority of February on Nantucket
Below is an outline of three different anchor populations, and the methods we used to
calculate each:
Lower Bound Estimate: 16,984 People
We used the Street Census population of 13,200 and scaled up by the response rate of
77.7% to yield an estimate of 16,984 people. This estimate functions as a lower bound because it
assumes that there are no visitors to Nantucket during the month of February. By intuition, we
understand that there are indeed visitors to Nantucket during February, but the purpose of this
value is to act as the theoretical lowest bound. It also assumes that all the permanent residents are
on island in February, and not on vacation elsewhere.
𝐿𝑜𝑤𝑒𝑟 𝐵𝑜𝑢𝑛𝑑 𝐸𝑠𝑡𝑖𝑚𝑎𝑡𝑒 =𝑆𝑡𝑟𝑒𝑒𝑡 𝐶𝑒𝑛𝑠𝑢𝑠 𝑃𝑜𝑝𝑢𝑙𝑎𝑡𝑖𝑜𝑛 (13,200)
𝑆𝑡𝑟𝑒𝑒𝑡 𝐶𝑒𝑛𝑠𝑢𝑠 𝑅𝑒𝑠𝑝𝑜𝑛𝑠𝑒 𝑅𝑎𝑡𝑒 (77.7%)
Middle Estimate: 18,627 People
We started with the lower bound estimate of 16,984, which accounts for only permanent
residents. We then used travel data from the Nantucket Memorial Airport, Steamship Authority,
and Hy-Line Ferry to estimate the visitor population in February. We assumed that every ferry
rider arriving to Nantucket also departed on the ferry, and that they were on Nantucket for two
days. This is an arbitrary assumption, as there is no supporting data, but we used the assumption
that visitors coming to Nantucket would most likely come for a weekend trip, averaging around
two days spent on Nantucket. Assuming an average stay of two days, we determined that there

51
were 1,643 visitors on Nantucket at any one time in February. Adding the lower bound
population to this visitor population yielded a middle anchor estimate of 18,627 people
(Equations found in Appendix I). Addition assumptions used to calculate the middle estimate
include:
• Visitors to Nantucket in February stay an average of two days.
• Arrivals and departures are equal across all modes of transportation to and from
Nantucket in February.
• There are no permanent residents using the ferry in February.
• All permanent residents are on the island during February
• The number of visitors traveling to and from Nantucket using private boats and aircraft in
February is negligible.
Upper Bound Estimate: 24,722 People
We calculated our upper bound anchor population using StreetLight to account for visitors in
February. We used our StreetLight heuristics as outlined in Section 4.3.1 to determine the
percentage of StreetLight activity associated with permanent residents on Nantucket in February.
We used this percentage in conjunction with the lower bound estimate of 16,984 to produce an
estimate of 24,722 people in February. A table containing the demographic percentages based on
our heuristics can be found in Appendix J, and a summary of the equations for all anchor points
can be found in Appendix K. Additional assumptions used to calculated the middle estimate
include:
• The 25-mile rule (Section 4.3.1) for StreetLight analysis is accurate in accounting for the
percentage of permanent residents on Nantucket in February.
• All permanent residents spend at least 18 nights on Nantucket during the month of
February (Section 4.1.2).
• StreetLight proportionally represents both residents and visitors.
𝑈𝑝𝑝𝑒𝑟 𝐵𝑜𝑢𝑛𝑑 𝐸𝑠𝑡𝑖𝑚𝑎𝑡𝑒 =𝐿𝑜𝑤𝑒𝑟 𝐵𝑜𝑢𝑛𝑑 𝐸𝑠𝑡𝑖𝑚𝑎𝑡𝑒 (16,984)
𝐹𝑒𝑏𝑟𝑢𝑎𝑟𝑦 𝑃𝑒𝑟𝑐𝑒𝑛𝑡𝑎𝑔𝑒 𝑃𝑒𝑟𝑚𝑎𝑛𝑒𝑛𝑡 𝑅𝑒𝑠𝑖𝑑𝑒𝑛𝑡𝑠 (68.7%)

52
In our opinion, as well as the opinion of the NDP, the upper bound estimate seems high.
We believe this could be due to the way StreetLight tracks visitors to Nantucket. As mentioned
in Section 4.3, it is still unclear whether StreetLight tracks visitors more often than permanent
residents, which is reflected in the 68.7% of tracked persons in February being permanent
residents.
Travel data from the ferries and airport do not support an upper bound of 24,722 average
people in February either. Assuming the lower bound estimate accounts for all permanent
residents, the upper bound estimate would constitute 7,738 visitors on Nantucket at any given
time in February. Assuming an average two-day trip by visitors, as well as equal numbers of
departures and arrivals in February for all travel data, we determined that there could only be an
average 1,643 visitors to Nantucket at any point in February.
If visitors to Nantucket are in fact overrepresented by StreetLight, finding the factor by
which they are overrepresented will be crucial to increasing the validity of StreetLight as a tool
for estimating the population.
4.4.3 STREETLIGHT POPULATION AND DEMOGRAPHIC ANALYSIS
To expand on our lower, middle, and upper estimates, we took the three anchor values for
February and scaled them using the StreetLight Activity Index, seen in Figure 17 below.
FIGURE 17: STREETLIGHT POPULATION ESTIMATES USING THE THREE POPULATION ESTIMATES
(DATA IN APPENDIX L)
0
10000
20000
30000
40000
50000
60000
70000
80000
Jan Feb Mar Apr May Jun Jul Aug Sep Oct Nov Dec
Po
pu
lati
on
Streetlight Population Estimates Using the Three Population Estimates
Upper Bound Middle Estimate Lower Bound

53
As mentioned in Section 4.4.2, visitors to Nantucket may be tracked by StreetLight at a
higher rate than permanent residents. This results in an upper bound population estimate that is
much higher than the lower and middle estimation curves.
We used the middle estimate and used StreetLight demographic percentages from a home
and work analysis to construct a demographic breakdown for 2016, seen in Figure 18 below.
This analysis reflects the assumptions made in Section 4.2.1 regarding heuristics, as well as the
assumptions made in Section 4.2.2 regarding the anchor months. See Appendix M for how the
commuter percentage of the population was calculated.
FIGURE 18: STREETLIGHT POPULATION ESTIMATES WITH DEMOGRAPHIC BREAKDOWN USING THE
MIDDLE POPULATION ESTIMATE (DATA IN APPENDIX J)
This home and work analysis utilizes a zone consisting of the entire island of Nantucket.
There are a few reasons why this is significant. When we were first conducting home and work
analyses of the entire island, we were using one kilometer square zones covering the whole
island. We initially believed that this would provide us with the data necessary for population
estimation, as well as allowing us to focus on specific areas if we it was deemed useful.
However, this approach was unusable for a population estimation due to several unforeseen
consequences. One such consequence was that any grid area that did not pick up a minimum
activity index of 100 was considered statistically insignificant, and would turn out blank in the
data set. This meant that any area that did not have enough activity would have no data present,
0
10000
20000
30000
40000
50000
60000
Jan Feb Mar Apr May Jun Jul Aug Sep Oct Nov Dec
Po
pu
lati
on
Streetlight Demographic Breakdown Using the Middle Estimate
Residents Visitors Commuters

54
and there was no way of knowing whether a zone had truly zero activity, or was simply not
picking up enough activity. A whole island zone solved this issue as it was inclusive of all
previous zones, and there was never an area with too little data to show as being significant.
Another problem with using multiple zones was that if a person were to move from one
zone to another, they would be counted twice. Travel activity within Nantucket is very high in
the summer, which resulted in an inflated population estimate. However, with one large
Nantucket zone, an individual is only counted as always being in the same zone while they are
on Nantucket.
In this analysis, we were unable to track seasonal residents as one of the mentioned
demographic groups described in Section 4.2.1. The problem is that StreetLight does not track
seasonal residents like we thought it would. The system in place for determining a home and
work locations is based on a majority time spent over the course of a month (See Section 4.1.2).
This means that a seasonal resident spends a short amount of time on Nantucket, and are
represented as visitors to the island, or that they spend a long enough time Nantucket that they
become indistinguishable from the local, year-round resident population.
4.4.4 SOLID WASTE ANALYSIS
As mentioned in Section 2.3, Beliveau et al. conducted a population estimation in 2010
using solid waste data obtained from the Nantucket Department of Public Works. The study
included population estimates for 2006-2010. We replicated their methods using the middle
estimate population to produce estimates for 2015-2017 (Figure 19). The updated data follows
the same trends observed by the 2010 report, with peak populations in July and August, and
similar increases and decreases in the shoulder seasons (April-June and September-October).

55
FIGURE 19: SOLID WASTE POPULATION MIDDLE ESTIMATES FROM 2015 TO 2017 (DATA IN
APPENDIX N)
As discussed in Section 4.4.2, the solid waste analysis uses February as the anchor month
to scale the relative waste production data to populations, under the assumption of a constant per
capita value of waste production. The estimate below in Figure 20 uses the same three estimates
(lower, middle, and upper) in February 2016 to be consistent with the data obtained from
StreetLight and allow for comparison between methods. We calculated the waste production of
the assumed anchor populations in February, and then scaled this value for all other months. As
the anchor population changes, or if it is possible to achieve a better estimate, all months would
shift by the same factor as the anchor population.
0
10000
20000
30000
40000
50000
60000
70000
80000
Jan Feb Mar Apr May Jun Jul Aug Sep Oct Nov Dec
Po
pu
atio
nSolid Waste Population Estimate Using the Middle Estimate
2015 2016 2017

56
FIGURE 20: SOLID WASTE POPULATION ESTIMATES USING ALL THREE OF THE ANCHOR POINTS
(DATA O)
The main assumption that our solid waste analysis is structured around is that every
demographic group produces the same amount of solid waste. There is insufficient data on the
solid waste production habits of permanent residents versus those of visitors. Robert McNeil of
the Nantucket Department of Public Works mentioned that visitors to Nantucket can often
engage in green behaviors at home, but abandon those green behaviors while visiting the island
(McNeil, 2017). However, visitors may also be less likely to produce solid waste in some
instances. For example, visitors may be less likely to need to dispose of food packaging, which is
a major source of waste produced by permanent residents.
Seasonal variations in waste production habits would also skew the population estimate.
For instance, people may be more likely to use plastic water bottles in the summer due to the
heat, resulting in more total waste. There are no currently known ways to quantify these
discrepancies, so we assumed equal waste production by all demographic groups.
0
10000
20000
30000
40000
50000
60000
70000
80000
90000
100000
Jan Feb Mar Apr May Jun Jul Aug Sep Oct Nov Dec
Po
pu
lati
on
Solid Waste Population Estimates Using all Three Bounds
Upper Bound Middle Estimate Lower Bound
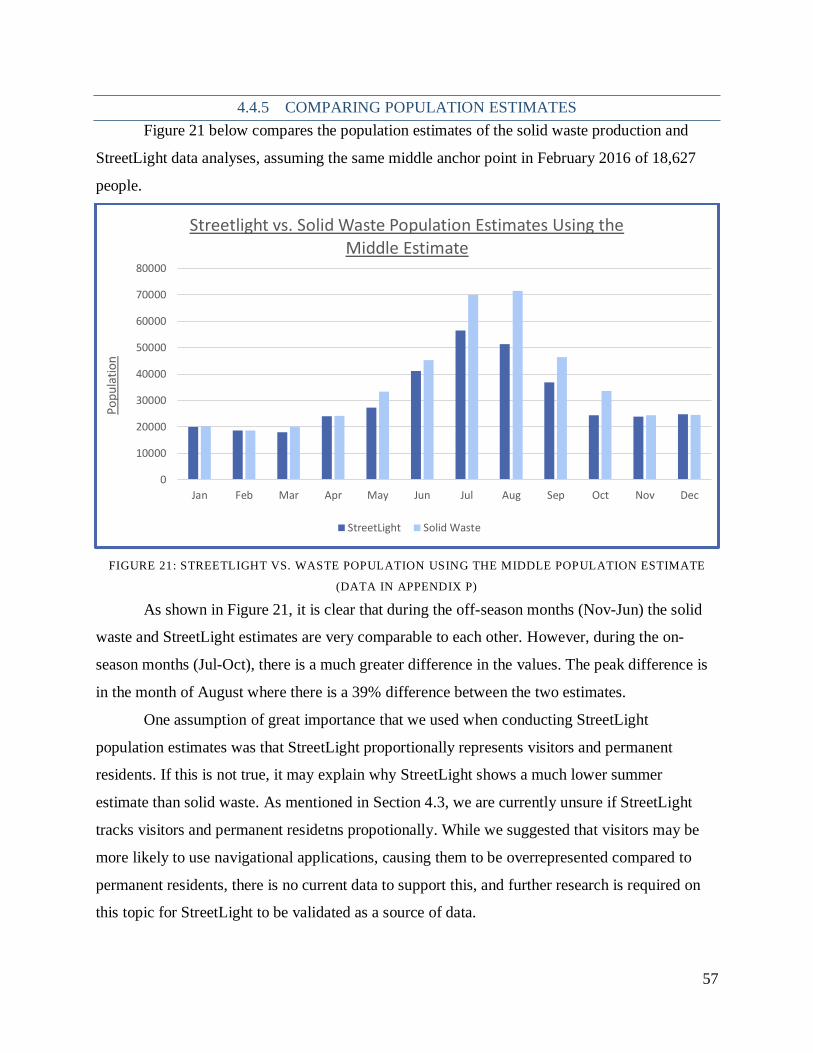
57
4.4.5 COMPARING POPULATION ESTIMATES
Figure 21 below compares the population estimates of the solid waste production and
StreetLight data analyses, assuming the same middle anchor point in February 2016 of 18,627
people.
FIGURE 21: STREETLIGHT VS. WASTE POPULATION USING THE MIDDLE POPULATION ESTIMATE
(DATA IN APPENDIX P)
As shown in Figure 21, it is clear that during the off-season months (Nov-Jun) the solid
waste and StreetLight estimates are very comparable to each other. However, during the on-
season months (Jul-Oct), there is a much greater difference in the values. The peak difference is
in the month of August where there is a 39% difference between the two estimates.
One assumption of great importance that we used when conducting StreetLight
population estimates was that StreetLight proportionally represents visitors and permanent
residents. If this is not true, it may explain why StreetLight shows a much lower summer
estimate than solid waste. As mentioned in Section 4.3, we are currently unsure if StreetLight
tracks visitors and permanent residetns propotionally. While we suggested that visitors may be
more likely to use navigational applications, causing them to be overrepresented compared to
permanent residents, there is no current data to support this, and further research is required on
this topic for StreetLight to be validated as a source of data.
0
10000
20000
30000
40000
50000
60000
70000
80000
Jan Feb Mar Apr May Jun Jul Aug Sep Oct Nov Dec
Po
pu
lati
on
Streetlight vs. Solid Waste Population Estimates Using the Middle Estimate
StreetLight Solid Waste
58
A main advantage of using StreetLight over solid waste analysis is the classification of
demographic groups based on heuristics. As discussed in Section 4.2.3, we were able to infer the
number of visitors to Nantucket based on their home and work distances. Solid waste data
currently provides no means to do so. On the other hand, solid waste analysis operates only on
the assumption that every person produces the same amount of waste, while StreetLight uses
many assumptions that may or not be valid. It will be important to either validate the
assumptions that StreetLight makes, or devise methods to dispose of them to transform
StreetLight into a reliable population data source.
4.5 STAKEHOLDER FEEDBACK AND FUTURE DATA NEEDS
In this section, we present findings from interviews with town government officials,
business owners, and organization executives about the need for population data on Nantucket
and the implications population data holds. Listed below are the three overarching topics that
were discussed in the majority of the conducted interviews, with a more comprehensive list in
Appendix Q:
1. Using data to start making decisions based on reliable data
2. Demographics and travel patterns of people visiting Nantucket
3. Knowing the community on Nantucket
4.5.1 USING DATA TO START MAKING DECISIONS BASED ON RELIABLE DATA
Stakeholders agreed on the need for consolidated and reliable population data. Melissa
Philbrick of ReMain Nantucket, the organization that was the Nantucket Data Platform's first
customer, commissioning a study of the effective population of Nantucket, discussed how data
about any topic on Nantucket has always been difficult to find, often requiring weeks to locate
the right numbers from the right person to solve the question at hand. She said, “[t]here was, and
still is, way too much human capital being invested in digging up numbers” (Philbrick, 2017).
Current Nantucket Board of Selectmen member Jason Bridges stated that the information that the
Nantucket Data Platform is beginning to acquire would be tremendously beneficial to town
planning. He said that infrastructure projects such as road expansions, sidewalk repairs, or town

59
policy planning all need to have “decisions made based on data, rather than emotion” (Bridges,
2017). Having data about a problem makes it possible to discern what is really happening,
compared to what an observer might think is happening from anecdotal or incomplete
information (Bridges, 2017).
Elizabeth Gibson, the Nantucket Town Manager, explained that analyzing the travel
habits of people on Nantucket, where they are going and what routes they are taking, would help
her office make appropriate decisions about planning and funding relevant projects to solve the
continual traffic and congestion issues during the summer months. “The big issue is how to
appropriately delegate funds to town projects and services” (Gibson, 2017). She explained that
decisions such as this are best made using supporting data. This is not only good general
practice, but is also adds a foundation to the direction of action, as well as confidence in
decisions made (Gibson, 2017).
4.5.2 DEMOGRAPHICS AND TRAVEL PATTERNS OF PEOPLE VISITING
NANTUCKET
Many of the individuals interviewed were interested in the travel habits and patterns of
people visiting Nantucket. With thousands of visitors to the island every year, a substantial
portion of Nantucket’s economy is heavily invested in the tourism and hospitality industry.
Everyone from the private to public sectors independently stated that information regarding:
where people come from, the kinds/categories of people coming to the island, where people are
going on the island, and how long their stay is, would be not only interesting, but also very
beneficial in planning and improving the operations of their respective enterprises. A preliminary
study using StreetLight data of the metropolitan areas and states where visitors are coming from
can be found in Appendix R.
In an interview with executive director of the Nantucket Historical Association (NHA)
James Russell, Russell spoke about using demographic data to increase visitation to their
museums and exhibits. He explained that knowing visitors’ age, family status, duration of stay,
etc., would allow the NHA to design and construct tours for the people based on their interests
and time availability. Russell also mentioned how knowing where visitors are from would allow
them to do targeted marketing to help incentivize people to come to their locations (Russell,
2017). David Martin, the Executive Director of the Nantucket Island Chamber of Commerce,

60
talked about how one of his primary duties is to promote businesses on Nantucket, as well as
promote the island itself. He said, “[a]ny current data helping us promote the island would be a
significant step forward” (Martin, 2017). He mentions how knowing who the people are that
coming to Nantucket and where they are coming from would be a very advantageous marketing
tool in his efforts to encourage more people to come visit, especially in the shoulder seasons.
Scott Thomas, the General Manager for the Nantucket Inn, explained how he would be
interested in knowing what demographics of people are here during the “shoulder season,” the
months just before and after the main summer season, to market to those people. He said,
“[t]here’s no growth in the summer for anyone [hotels and inns]; our main interest would be
reaching out to people in the spring and fall” (Thomas, 2017). He discussed how almost anyone
in the hospitality industry is already at maximum capacity for summer business, and that
marketing to and increasing the amount of people here in the spring and fall would be the
primary area of increasing their market share (Thomas, 2017).
4.5.3 KNOWING THE COMMUNITY ON NANTUCKET
The final consensus throughout the stakeholder interviews was the need for accurate data
to describe the local community on Nantucket. The current data used to describe the year-round
community is significantly inflated due to Nantucket being a tourist destination. The extensive
number of multimillion-dollar seasonal homes on the island inflate statistics about the Nantucket
housing market. According to Realtor.com, the current median value for houses on Nantucket is
more than 1.4 million dollars, and the median price of homes currently listed for sale is more
than 2.4 million dollars. For an average family, these prices are incredibly difficult to afford. The
owners of these homes tend to be well off financially, which shifts the average income to be
more than what the average family makes. Data about income and economic status for the
permanent residents living on Nantucket about there are simply unknown at this time. Gibson
touched on this area during an interview. Her office, as well as others on Nantucket, apply for
grants for beneficial and often needed public projects. However, they run into many roadblocks
due to Nantucket’s reputation of being a very well off community (Gibson, 2017). Andrew
Vorce of the Town Planning Office said that this lack of economic data is a concern with respect
to housing on Nantucket. He said that possessing economic data solely on the people living on

61
Nantucket year-round would be tremendously beneficial to many other town offices and
organizations as well (Vorce, 2017).

62
5.0 CONCLUSIONS & RECOMMENDATIONS
StreetLight LBS data and solid waste data furnish us two sources for constructing what
demographers term “symptomatic indicators” of people’s presence in a community. Such
indicators are useful complements to established census enumerations of local populations. The
former serve to refine the latter, which typically reference a population as of a specific time (e.g.,
the decennial census as of April 1 or Nantucket’s annual census centered on the month of
January).
In anchoring the two to the same point in time, we note similarities in the monthly
population estimates. Solid waste registers the presence of many more people during peak
summer months; we regard it as a valid benchmark, given its consistency over several years.
StreetLight LBS data (Figure #, Section 4.3.5) adds a promising new symptomatic indicator.
The initial questions we address are “How do these two symptomatic indicators of
people’s presence on Nantucket agree, and where do they differ? Beyond estimates of their sheer
numbers, what more can StreetLight data reveal about their characteristics?
The Nantucket Street Census furnishes the most reliable source of a permanent resident
count to scale our population estimates. It is the most complete record of residents on Nantucket
at one point in time. It will be important in the future that the Street Census is validated by or
replaced by other various forms of data to form a reliable anchor month population estimate.
We regard February as a viable anchor month, based on our review of monthly solid
waste production data. Data for the years 2015-2017 showed February as the month with the
lowest amount of the solid waste production. Regarding solid waste as a credible symptomatic
indicator of population, we regard February as the low point of people’s presence on
Nantucket—and the Nantucket Street Census as a credible count of people present on Nantucket
(and generating solid waste) in February.
We explored the feasibility of incorporating ridership data from the Steamship Authority
and Hy-Line Ferries as a method to test if StreetLight tracks different demographic groups
representatively. Results thus far are inconclusive, but we recommend further effort to explore
how these data might complement StreetLight measures.
One feature of StreetLight that local government organizations and business owners alike
were interested in was the Origin-Destination analysis. Our interviews revealed that many
organizations want to know where people originate, where they go on Nantucket, and what

63
routes they follow. Local businesses were specifically interested in origin-destination data, to
target their marketing. Government offices saw how such data could be used to improve
transportation infrastructure like roads, sidewalks, and bike paths, to help relieve congestion
downtown, implement public transportation, and increase the level of safety associated with
traveling through Nantucket.
5.1 ANCHOR POPULATION RECOMMENDATIONS
We recommend February as the “anchor month” for estimating the permanent resident
population of Nantucket. We base this recommendation on data showing that February is the
consistent low point for solid waste generation over the past three years. It will be of utmost
importance that the Anchor Point be continually improved by the means of updating the Street
Census, or analyzing other forms of available data to further pinpoint the permanent population.
Furthermore, we recommend that the Nantucket Data Platform continually evaluate this
relationship is future years, to revalidate the basis for this recommendation. Our recommendation
(based on the most recent three years) should be revalidated annually. That is, analyze the anchor
population in February year after year to improve our current estimate to account for the
dynamic nature of the population of Nantucket.
The Nantucket Data Platform can use the methods outlined in Section 4.4.2 to find the
anchor population using three different methods providing low, middle, and high estimates as
there not many other known ways to account for demographics that are not permanent residents
in the offseason. The low, middle, and high estimates may be used as points of reference when
trying to narrow to reliable population estimate.
5.2 FUTURE POPULATION ESTIMATES RECOMMENDATIONS
We recommend that the Nantucket Data Platform continue to refine data obtained from the
entire island zone analysis using StreetLight. The entire island zone provided a similar curve to
solid waste data when using the same anchor point, and the StreetLight analysis has the potential
to provide much more detailed demographic information as heuristics are refined and StreetLight
is updated. As mentioned above, this analysis will become more accurate as the anchor point in
February is further refined. Our further specific recommendations are:

64
1. To strengthen accuracy of population estimates using StreetLight, we suggest that the
Nantucket Data Platform explore weighting the contribution of each demographic group
to the StreetLight index metric, as it may not be representative. Ferry ridership data may
be applicable here, to evaluate how StreetLight indexes might be skewed toward tracking
visitors, and to weight population estimates accordingly.
2. We also recommend comparing solid waste data and StreetLight estimates. It would be
beneficial to look into studies on the amount of solid waste produced per capita to see if
this matches up with the derived use per capita used in our solid waste analysis. Also,
since visitors may produce more (or less) solid waste than permanent residents, it would
increase the accuracy of the population estimate if these groups were weighted
accordingly by waste per capita.
3. We recommend refining the heuristics associated with home and work distance to fit
within the restrictions of StreetLight. The permanent resident percentage using the “25-
mile rule” shows promise because of Nantucket’s distance from any other landmass.
However, since distances are presented as ranges, there may not be much room for the
adjustment of the heuristics concerning Visitor Home and Work Analysis, with regard to
certain demographic groups. For instance, we recommend that the Nantucket Data
Platform explores the use of StreetLight in conjunction with data on seasonal
homeownership to better separate the group of seasonal residents from permanent
residents and tourists. Because StreetLight does not recognize a home unless the resident
stays there for 18 days of out a month, the seasonal resident population of Nantucket
remains unknown. In 2015, 64% of homes on Nantucket were considered seasonal
(Nantucket Housing Issues). Using this data, combined with a study on the average time
of stay for seasonal residents, may allow the Nantucket Data Platform to achieve a better
understanding of the seasonal resident population on Nantucket.
4. We recommend that the Nantucket Data Platform attempt to recover departure and arrival
data for Hy-Line and Steamship ferries, as well as Nantucket Memorial Airport
passengers organized by trip. This data has not been readily available, but would allow
the Nantucket Data Platform to calculate the population on a daily basis by subtracting
departing passengers and adding arriving passengers, assuming an accurate anchor month
is established.

65
5. We urge the Nantucket Data Platform to avoid extracting the total activity index from
1km x 1km zones for the purpose of a population estimate, as this results in an inaccurate
summer population. This is because people are tracked every time they enter any of the 1
km x 1km zones, which would track people that are more mobile in the summer more
than other times of the year. These 1 km x 1 km zones are more useful for Origin
Destination analysis to examine common travel patterns.
5.3 COMMUNITY FEEDBACK RECOMMENDATIONS
It would be beneficial for the Nantucket Data Platform to examine travel patterns through
Origin-Destination (O-D) analysis. Many stakeholders on Nantucket are very interested in the
implications of travel information gathered from O-D analyses for the use of improving
Nantucket travel logistics and the decongestion of the downtown area.
As the NDP compiles more specific information, the capabilities of StreetLight to
provide an in-depth analysis of where people are going on the island, and common travel patterns
could be utilized. To improve public travel, an O-D analysis of where people travel to on
Nantucket would be used to study the possible necessity of certain town maintenance projects, or
the addition of bike paths and bus systems to assist public travel. As mentioned in Section 4.2,
StreetLight has the ability to analyze movement during individual hours of the day. This specific
daytime would be instrumental to town officials attempting to plan and schedule bus routes, both
in the on and off season.
Another concern from the conducted interviews that we recommend the NDP explore is
the breakdown of demographic information for just the permanent resident population. The
current average home value information needed for various town governance, such as applying
for government grants and delegating appropriate town funding, does not accurately represent
the permanent residents of Nantucket. We recommend that the NDP use home and work analyses
with StreetLight’s demographic statistics, combined with the information contained on the Street
Census, as well as any other available data source they may have access to, to try and dissect the
permanent population to tell a more complete story about the people who live on Nantucket year-
round.

66
REFERENCES
Ahas, R., Aasa, A., Mark, Ü, Pae, T., & Kull, A. (2007). Seasonal tourism spaces in Estonia:
Case study with mobile positioning data. Tourism Management, 28(3), 898-910.
doi:10.1016/j.tourman.2006.05.010
Balling, J. (2017, ). Nantucket data platform initiative may be boon to better decisions. The
Inquirer and Mirror Retrieved from http://www.ack.net/news/20170727/nantucket-data-
platform-initiative-may-be-boon-to-better-decisions
Beliveau, A., Hesler, M., Jaskolka, S., & Sigety, K. (2010). Feasibility of a smart grid on
Nantucket. ().
Boston data portal. Retrieved
from https://www.northeastern.edu/csshresearch/bostonarearesearchinitiative/boston-data-
portal/
Bridges, J. (2017). In Donovan T., Wehse A.(Eds.), Bridges, Jason interview;
Bureau, U. S. C. (2012). Nantucket economy-wide key statistics. Retrieved
from https://factfinder.census.gov/faces/tableservices/jsf/pages/productview.xhtml?src=CF
Bureau, U. C. United States Census Bureau. Retrieved from https://www.census.gov/en.html
Civis analytics. Retrieved from https://www.civisanalytics.com/
Connecticut data collaborative. Retrieved from http://ctdata.org/
Data, S. Measure travel behavior | StreetLight Data. Retrieved from:
https://www.streetlightdata.com
Deville, P., Linard, C., Martin, S., Gilbert, M., Stevens, F. R., Gaughan, A. E., . . . Tatem, A. J.
(2014). Dynamic population mapping using mobile phone data. Proceedings of the National
Academy of Sciences, 111(45), 15888-15893. doi:10.1073/pnas.1408439111
Douglass, C. (2017). In Wehse, A. (Ed.), Email with StreetLight Senior Support Engineer
Fehr & Peers. (2014). Napa county travel behavior study

67
Fifield, J., Happel, S., & Hogan, T. (1986). Valley's winter residents spend $381 million;1986
SRI U0280-1.708.2. Retrieved
from https://statistical.proquest.com/statisticalinsight/result/pqpresultpage.previewtitle?docT
ype=PQSI&titleUri=/content/1986/U0280-1.708.2.xml
Gibson, E. (2017). In Donovan T., Wehse A.(Eds.), Gibson, elizabeth interview
Glass, R., & Callahan, S. (2014). The big data-driven business: How to use big data to win
customers, beat competitors, and boost profits., 10-25. Retrieved
from http://ebookcentral.proquest.com.ezproxy.wpi.edu/lib/wpi/reader.action?docID=18355
54
Goldschmidt, P., & Dahl, A. (1976). Estimating population in seasonal resort communities
Gorowara, A., Matthews, A., Russo, D., & Sezer, A. (2013). Tourism in the city of canals
managing Venice’s love-hate relationship with its visitors. ().
Graebert, M., Wyckoff, M., & Bretz, L. (2014). Northwest Michigan seasonal population
analysis. ().MSU Land Policy Institute.
Graziadei, J. (2017). In Donovan T., Wehse A.(Eds.), Graziadei, Jason interview;
Lamb, G. (1999). Estimating the seasonal population of door county. Retrieved
from http://www.doorcountybusiness.com/wp-
content/uploads/2010/10/SeasonalPopulation.pdf
Martin, D. (2017). In Donovan T., Wehse A.(Eds.), Martin, David interview
McNeil, R. (2017). In Donovan T., Wehse A.(Eds.), McNeil, Robert interview
MetroLab network. Retrieved from https://metrolabnetwork.org/
Monmouth County Planning Board. (2008). Summer coastal population study. Retrieved
from https://co.monmouth.nj.us/documents/24/Coastal%20Pop%20Study%20Report.pdf
Nantucket Atheneum. Nantucket housing issues. Retrieved from:
https://www.nantucketatheneum.org/research/ack-citizen-issues/nantucket-housing-issues/

68
Nantucket data platform. (2017). Retrieved
from https://nantucketdataplatform.wordpress.com/2017/08/01/featured-content-2/
Nantucket housing issues. (). Retrieved from https://www.nantucketatheneum.org/research/ack-
citizen-issues/nantucket-housing-issues/
Nantucket island chamber of commerce. Retrieved from http://www.nantucketchamber.org
Nantucket Town Clerk. (2017). In Wehse A. (Ed.), Nantucket Town Clerk correspondence;
Paper Crane Associates. (2016). Town of Nantucket Department of Culture and Tourism
organizational assessment 2016. ().
Philbrick, M. (2017). In Donovan T., Wehse A.(Eds.), Philbrick, Melissa interview;
Population Census. (2008). Uses of census data. Retrieved from:
http://www.cbs.gov.il/census/census/pnimi_sub_page_e.html?id_topic=1&id_subtopic=5
Realtor.com. (2017). Retrieved from https://www.realtor.com/realestateandhomes-
search/Nantucket_MA
Rouse, M. What is data management platform (DMP)? - definition from WhatIs.com. Retrieved
from http://searchstorage.techtarget.com/definition/data-management-platform
Russel, J. (2017). In Donovan T., Wehse A.(Eds.), Russell, James interview
SAS. What is big data and why it matters. Retrieved
from https://www.sas.com/en_us/insights/big-data/what-is-big-data.html
Schulte, J. (2017). In Donovan T., Wehse A.(Eds.), Schulte, Janet interview
Smith, S. (1989). Toward a methodology for estimating temporary residents. Retrieved
from https://www.bebr.ufl.edu/sites/default/files/Research%20Reports/1989%20JASA%20
%28Temp%20Residents%29.pdf
Smith, S., & House, M. (2007). Temporary migration: A case study of Florida. Population
Research and Policy Review, 26(4), 437-454. doi:10.1007/s11113-007-9037-6
Stover, C. (2017). In Donovan T., Wehse A.(Eds.), Stover, Catherine; interview

69
StreetLight. (2017). StreetLight data technology | StreetLight data. Retrieved
from https://www.streetlightdata.com/population-mobility-technology
Thomas, S. (2017). In Donovan T., Wehse A.(Eds.), Thomas, Scott interview
Town of Nantucket Department of Culture, & Tourism Organizational Assessment, 2.Town of
Nantucket department of culture and tourism organizational assessment 2016
U.S. census bureau QuickFacts selected: Nantucket county, Massachusetts. Retrieved
from https://www.census.gov/quickfacts/fact/chart/nantucketcountymassachusetts/PST0452
16
Venice open data project. Retrieved from http://dati.venezia.it/
Venice project center. (2013). Retrieved from http://veniceprojectcenter.org/
Vorce, A. (2017). In Donovan T., Wehse A.(Eds.), Vorce, Andrew interview
Workforce housing needs assessment. (2015). Retrieved from http://www.nantucket-
ma.gov/DocumentCenter/Home/View/10009

70
APPENDIX A: FURTHER BACKGROUND RESEARCH ON DATA
PLATFORMS:
The Connecticut Data Collaborative comprises 135 public data sets from state and
national government departments. The most prominent sources of these data sets are the: US
Census, Connecticut Department of Education, and Connecticut Department of Public Health.
For the Connecticut’s population estimate, the Connecticut Data Collaborative relies solely on
census data provided by the national government. More specific demographic populations, such
as the population of school districts, rely on more specific state departments, such as the
Connecticut Department of Education. The Connecticut Data Collaborative provides this data to
its communities by hosting an open data portal. From this portal, one can obtain data of specific
data sets by browsing statistics using their online user interface, or downloading the available
files. They offer a variety of features to assist a user in locating data of interest, such as location
based comparisons, and searching for sources of data with respect to specific characteristics.
Instead of relying solely on government sources for their data, the Boston Data Platform
gathers their data from academic research projects, with a majority coming out of Harvard and
Northeastern Universities. The data gathered from these projects are transferred into a third
party, open source data repository software known as the Dataverse Project. The Dataverse
Project holds vast amounts of data sets and is used by many platforms to draw upon data for
analysis. The Boston Data Platform uses this data to provide an open data portal for public
download, as well as an interactive map that can be used to look at demographics in the local
Boston area.
The Venice Open Data Project is a data platform that collects data for the different
neighborhoods of Venice. The Venice Open Data Project’s main goal is to help manifest a sense
of open government and open data practices. The Platform specifically focuses on ways that data
already being collected could be visualized and portrayed so that regular users could better
understand the data being presented. To accomplish this, they used various styles of heat maps to
describe location based information around the city, and graphs and charts to help breakdown
and visualize government budgets and spending. The platform’s result was data being provided
to the public covering a plethora of topics about the city that could be used to help people
understand their city better.
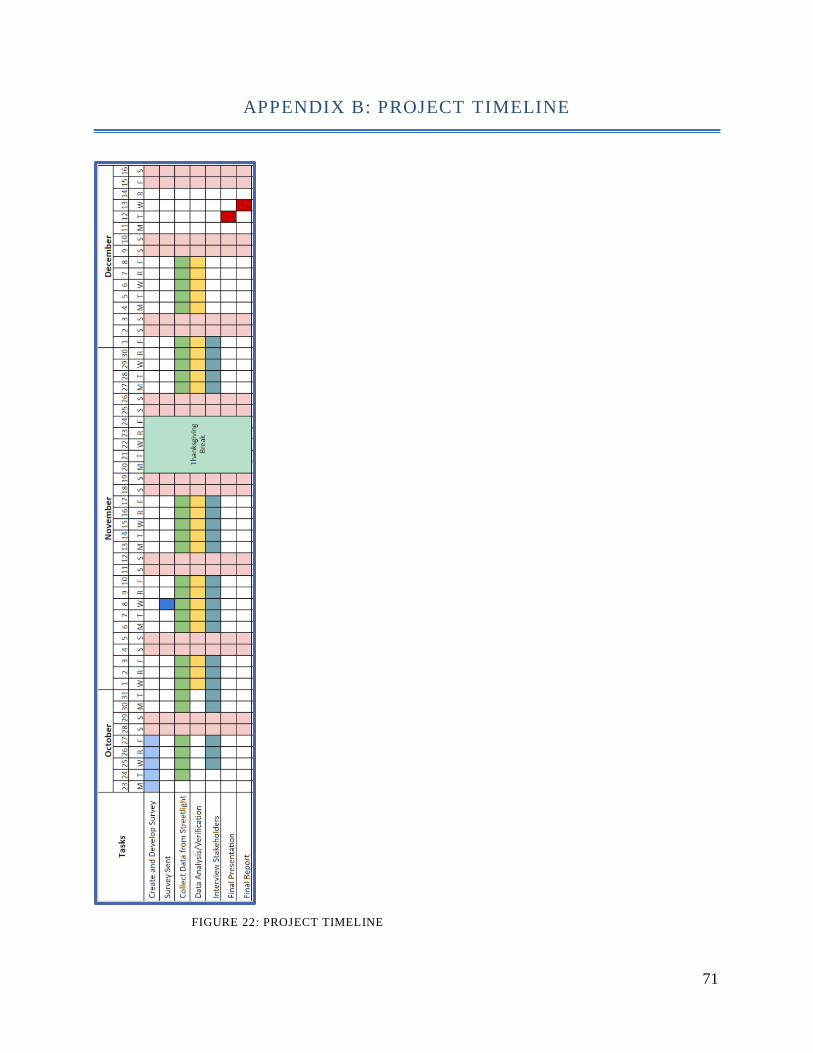
71
APPENDIX B: PROJECT TIMELINE
FIGURE 22: PROJECT TIMELINE

72
APPENDIX C: LIST OF BUSINESSES AND CONTACT PERSONS
INTERVIEWED
TABLE 4: INTERVIEWED ORGANIZATIONS WITH LEAD CONTACT
Business/Organization Contact Person Hospitality
Town Offices
Handlebar Cafe Jason Bridges
Select Board Jason Bridges Brotherhood of Thieves Donald Kolp
Town Planning Office Andrew Vorce Nantucket Inn Scott Thomas
Culture & Tourism Janet Schulte Business Promotion
Town Clerk Catherine Stover Chamber of Commerce David Martin
Public Works Robert McNeil Real Estate
Town Manager Elizabeth Gibson Compass Rose N/A*
Nantucket DPW Robert McNeil Island Properties N/A*
Memorial Airport Janine Torres* Landscaping
Health Services
JM Landscaping Jivko Kalpazanov*
Nantucket Cottage Hosp. Jason Graziadei Non-Profits
Banking
ReMain Nantucket Melissa Philbrick
Nantucket Bank Neil Marttila Nantucket Community Fdn. Margaretta Andrews*
Cape Cod Five Cent Savings Bank James Eldredge* Nantucket Historical Assoc. James Russell
(*) Signifies a company/organization we reached out to and no response was received
(N/A) Signifies that a key contact person was not known, and contact was made to either the
organization, or a key member of their management board.

73
APPENDIX D: INTERVIEW PREAMBLE AND QUESTIONS/TOPICS
Interview Preamble: We are a group of students from Worcester Polytechnic Institute’s
Nantucket Project Center. We are conducting this interview on behalf of the Nantucket Data
Platform to learn more about the needs of population related data from Nantucket businesses and
citizens. By agreeing to participate, you are consenting that any information given can be used to
further our research. If at any point during the interview you wish to pause or end the discussion,
you are able to do so. If when writing our final report, we wish to quote you directly, we will
reach out to you with the section of the report containing your quote for your approval. If we do
not hear back from you by December 4th, your consent will be implied. You also have the right
to have the information you provide today remain anonymous, in which case your name and
anything referring directly to your (business/operation/etc.) will not be named in our final report.
If it is permissible by you, would you be comfortable with us record this conversation for later
reference? We thank you for your time, and will begin if you agree to these terms.
Primary Discussion Areas
• On the subject of population and demographic data, is there lacking information that
would be beneficial to know for (insert organization/business/public office) to improve
operations and decision making?
o Possible demographic areas of interest: age, income, family, where they are from,
duration of their stay
• Are you impacted by not knowing population data?
• What data would you like to know/ are interested in?
o Demographics (commuters, tourists, age groups, etc.)
o Population densities
• How would you like said data presented/analyzed?
o Interactive Map
o Tabular
o Excel
o Spreadsheet (Downloadable)

74
APPENDIX E: SURVEY PREAMBLE AND QUESTIONS
Survey Preamble: We are a group of students from Worcester Polytechnic Institute. We are
conducting this survey in collaboration with the Nantucket Data Platform* and the Chamber of
Commerce to learn more about the seasonal workforce on Nantucket. We will report the results
of the survey in aggregate form only, and will not reveal any information that can be used to
identify you or your business. Your participation in this survey is completely voluntary, you need
not answer every question, and you may withdraw at any time. If you have specific questions
about this research please feel free to contact our WPI project advisors, Dominic Golding and
Richard Vaz, at [email protected] and [email protected].
* In August 2017, a group of citizens formed the Nantucket Data Platform in an effort to
consolidate population and other data on Nantucket and make it publicly available to
organizations for use in the decision-making process. You can find more information on the
Nantucket Data Platform at:
https://nantucketdataplatform.wordpress.com/author/nantucketdataplatform/
Survey Guidelines:
• Results of this survey will be kept confidential and will not be attributed to you in any
way.
• Results of this survey will only be released in aggregate and with no personal identifying
information.
• Participation in the research is voluntary.
• Participants may end their participation at any time.
• Participants need not answer every question on the survey
Survey Questions:
Q1: Please select the category below that best describes your primary business:
o Restaurant/ Food Services
o Lodging
o Public Services/ Utilities

75
o Retail/ Grocery
o Real Estate
o Finance
o Nonprofit
o Landscaping
o Other (Please specify)
Q2: How many workers did you employ in the 2016-2017 off-season? (Oct. 2016 -Apr. 2017)
o Full Time:
o Part Time:
Q3: How many seasonal employees did you add for the 2017 summer season?
o Full Time:
o Part Time:
Q4: Was the number of seasonal employees you added in 2017 sufficient?
o Yes
o No
Skip To: Q7 If Was the number of seasonal employees you added in 2017 sufficient? = Yes
Q5: How many more employees would you have added?
o Full Time:
o Part Time:
Q6: What prevented you from adding more seasonal employees in 2017?
Q7: Did any of your seasonal employees require work visas in 2017?
o Yes
o No
Skip To: Q10 If Did any of your seasonal employees require work visas in 2017? = No

76
Q8: How many of your seasonal workers in 2017 required work visas?
o Full Time:
o Part Time:
Q10: Over the past few years, about what percentage of your summer seasonal employees have
been regular returnees?
o 0-19%
o 20-39%
o 40-59%
o 60-79%
o 80-100%
Q11: How many seasonal employees do you anticipate needing to add for the upcoming 2018
season?
o Full Time:
o Part Time:
Q9: Do you have any additional comments regarding seasonal employment on Nantucket?

77
APPENDIX F: SURVEY RESULTS
Our survey of seasonal employers received a response that was not substantial enough to
draw conclusions, other than anecdotal data. We received 5 full responses, and 8 partially
completed responses. Some of these responses detailed various reasons employers think that
finding sufficient seasonal help on Nantucket is difficult. These reasons include:
• It is difficult for foreign workers to obtain work visas.
• There is a lack of qualified applicants on Nantucket.
• There is currently an issue finding enough housing for seasonal workers.
Due to our limited response rate, we are giving the Nantucket Data Platform access to the
survey and its results. Hopefully given more time, they will be able to solicit more responses so
they will have the ability to draw conclusions about the seasonal workforce on Nantucket

78
APPENDIX G: STREETLIGHT PRIVACY STATEMENT:
Privacy is one of the core principles at Streetlight Data. Our analytics only describe the
movement of groups of people - not the movement of individuals. This means that we do not
process, use, or distribute personally identifiable information in our products. Our services do not
enable marketing messages targeted to individual devices such as cell phones. However, we
recognize that there are risks and misconceptions regarding the emerging area of market
analytics using location-based information. These risks include the possibility that anonymized
data could be linked together to subsequently re-identify an individual. We follow a proven
approach to minimize the possibility that data could be linked together to re-identify an
individual. In addition, we contractually require our customers to commit to not using our
Metrics to re-identify individuals.
Taken directly from the Streetlight Website:
https://www.streetlightdata.com/Streetlight-data-privacy-principles?hsCtaTracking=aef22474-
40f3-4a06-8007-c57d1ed5d195%7C20652897-0b8b-49a2-94dd-57ece6301d8

79
APPENDIX H: NANTUCKET SOLID WASTE PRODUCTION
TABLE 5: NANTUCKET SOLID WASTE PRODUCTION (IN TONS) 2015 2016 2017
January 486.01 530.54 538.25
February 417.53 489.13 438.37
March 495.26 530.1 496.73
April 574.28 635.3 632.93
May 869.32 876.84 918.33
June 1,160.64 1,188.59 1,214.14
July 1,732.51 1,837.21 1,785.61
August 1,839.99 1,876.62 1,850.62
September 1,247.08 1,220.61 1,228.75
October 863.36 882.27 883.24
November 638.38 639.85
December 654.58 643.13
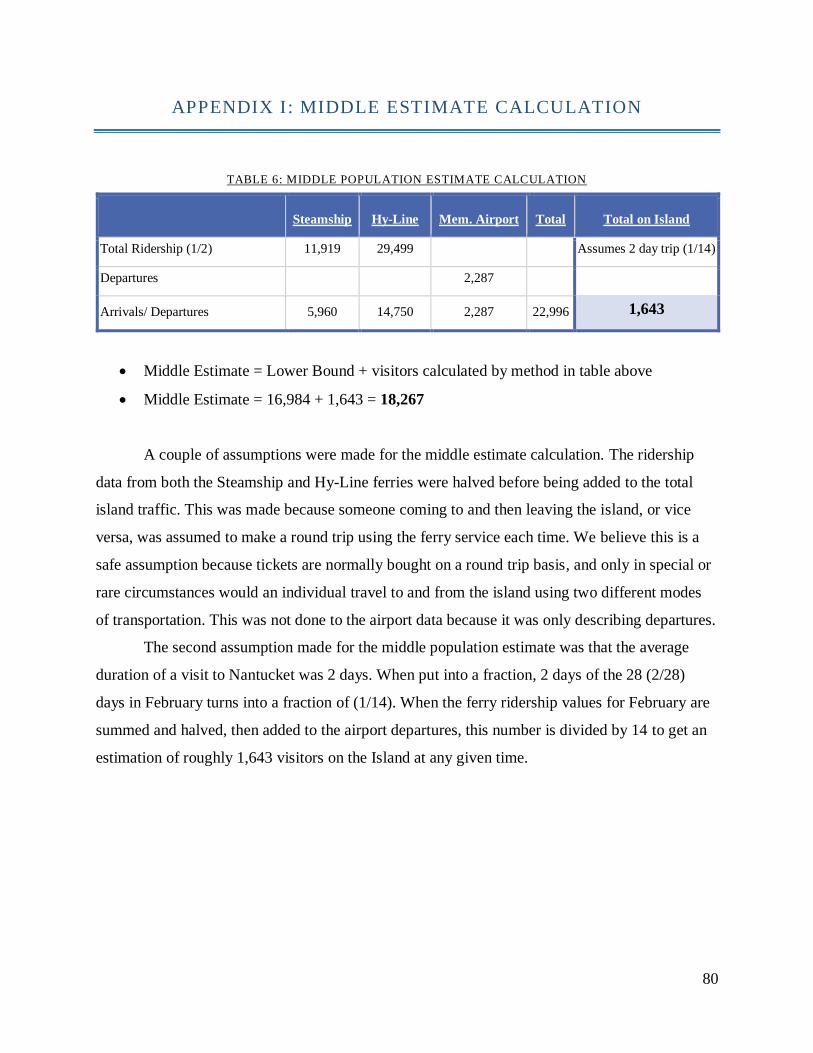
80
APPENDIX I: MIDDLE ESTIMATE CALCULATION
TABLE 6: MIDDLE POPULATION ESTIMATE CALCULATION
Steamship Hy-Line Mem. Airport Total Total on Island
Total Ridership (1/2) 11,919 29,499
Assumes 2 day trip (1/14)
Departures
2,287
Arrivals/ Departures 5,960 14,750 2,287 22,996 1,643
• Middle Estimate = Lower Bound + visitors calculated by method in table above
• Middle Estimate = 16,984 + 1,643 = 18,267
A couple of assumptions were made for the middle estimate calculation. The ridership
data from both the Steamship and Hy-Line ferries were halved before being added to the total
island traffic. This was made because someone coming to and then leaving the island, or vice
versa, was assumed to make a round trip using the ferry service each time. We believe this is a
safe assumption because tickets are normally bought on a round trip basis, and only in special or
rare circumstances would an individual travel to and from the island using two different modes
of transportation. This was not done to the airport data because it was only describing departures.
The second assumption made for the middle population estimate was that the average
duration of a visit to Nantucket was 2 days. When put into a fraction, 2 days of the 28 (2/28)
days in February turns into a fraction of (1/14). When the ferry ridership values for February are
summed and halved, then added to the airport departures, this number is divided by 14 to get an
estimation of roughly 1,643 visitors on the Island at any given time.
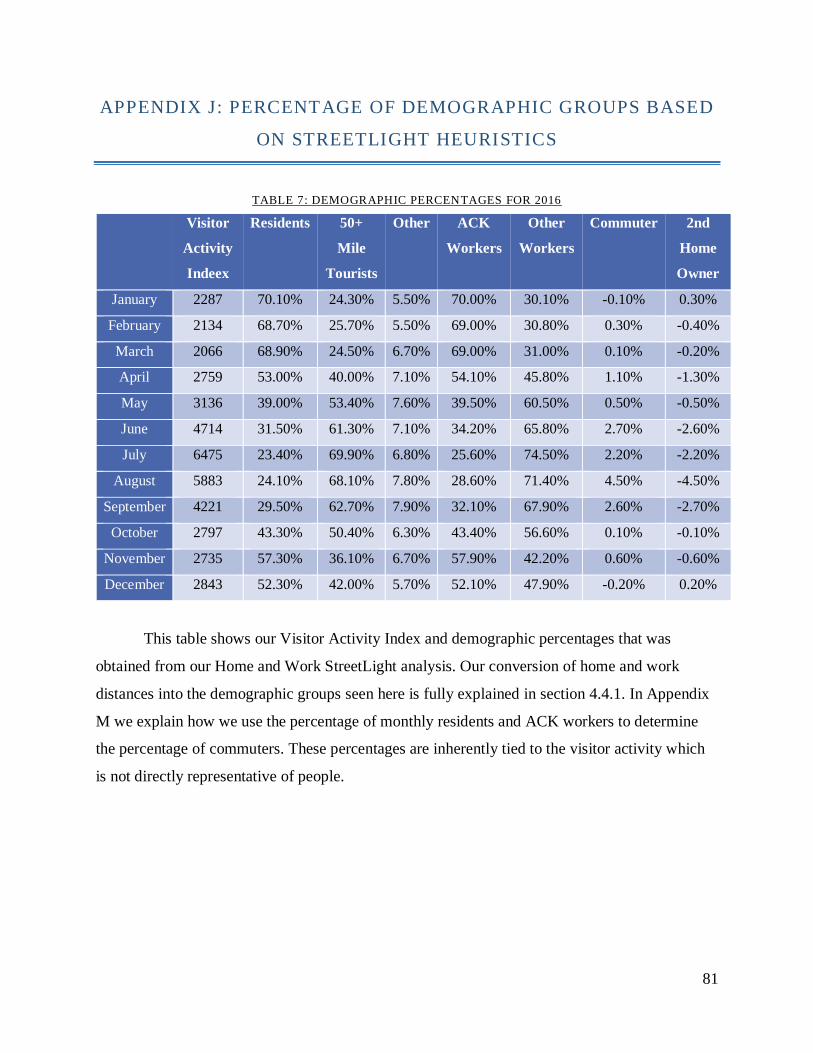
81
APPENDIX J: PERCENTAGE OF DEMOGRAPHIC GROUPS BASED
ON STREETLIGHT HEURISTICS
TABLE 7: DEMOGRAPHIC PERCENTAGES FOR 2016
Visitor
Activity
Indeex
Residents 50+
Mile
Tourists
Other ACK
Workers
Other
Workers
Commuter 2nd
Home
Owner
January 2287 70.10% 24.30% 5.50% 70.00% 30.10% -0.10% 0.30%
February 2134 68.70% 25.70% 5.50% 69.00% 30.80% 0.30% -0.40%
March 2066 68.90% 24.50% 6.70% 69.00% 31.00% 0.10% -0.20%
April 2759 53.00% 40.00% 7.10% 54.10% 45.80% 1.10% -1.30%
May 3136 39.00% 53.40% 7.60% 39.50% 60.50% 0.50% -0.50%
June 4714 31.50% 61.30% 7.10% 34.20% 65.80% 2.70% -2.60%
July 6475 23.40% 69.90% 6.80% 25.60% 74.50% 2.20% -2.20%
August 5883 24.10% 68.10% 7.80% 28.60% 71.40% 4.50% -4.50%
September 4221 29.50% 62.70% 7.90% 32.10% 67.90% 2.60% -2.70%
October 2797 43.30% 50.40% 6.30% 43.40% 56.60% 0.10% -0.10%
November 2735 57.30% 36.10% 6.70% 57.90% 42.20% 0.60% -0.60%
December 2843 52.30% 42.00% 5.70% 52.10% 47.90% -0.20% 0.20%
This table shows our Visitor Activity Index and demographic percentages that was
obtained from our Home and Work StreetLight analysis. Our conversion of home and work
distances into the demographic groups seen here is fully explained in section 4.4.1. In Appendix
M we explain how we use the percentage of monthly residents and ACK workers to determine
the percentage of commuters. These percentages are inherently tied to the visitor activity which
is not directly representative of people.

82
APPENDIX K: SUMMARY OF ANCHOR CALCULATIONS
TABLE 8:ANCHOR CALCULATIONS
Lower Bound Middle Estimate Upper Bound
Street Census 13,200 13,200 13,200
Response Rate 77.72% 77.72% 77.72%
Scaled Perm Res 16,984 16,984 16,984
% Perm Res 100.00% 91.20% 68.70%
February Pop. 16,984 18,627 24,722
This table shows our calculations for the total population of our February anchor month.
Details about the anchor month are described in section 4.4.2. The percentage of permanent
residents are based on several factors. The lower bound assumes that in the month of February
there are only residents on island, the middle estimate bases its percentage of permanent
residents from calculations from travel data discussed in Appendix I, and the upper bound
percentage of permanent residents was determined by the StreetLight permanent resident
percentage, which can be found in Appendix J for February.
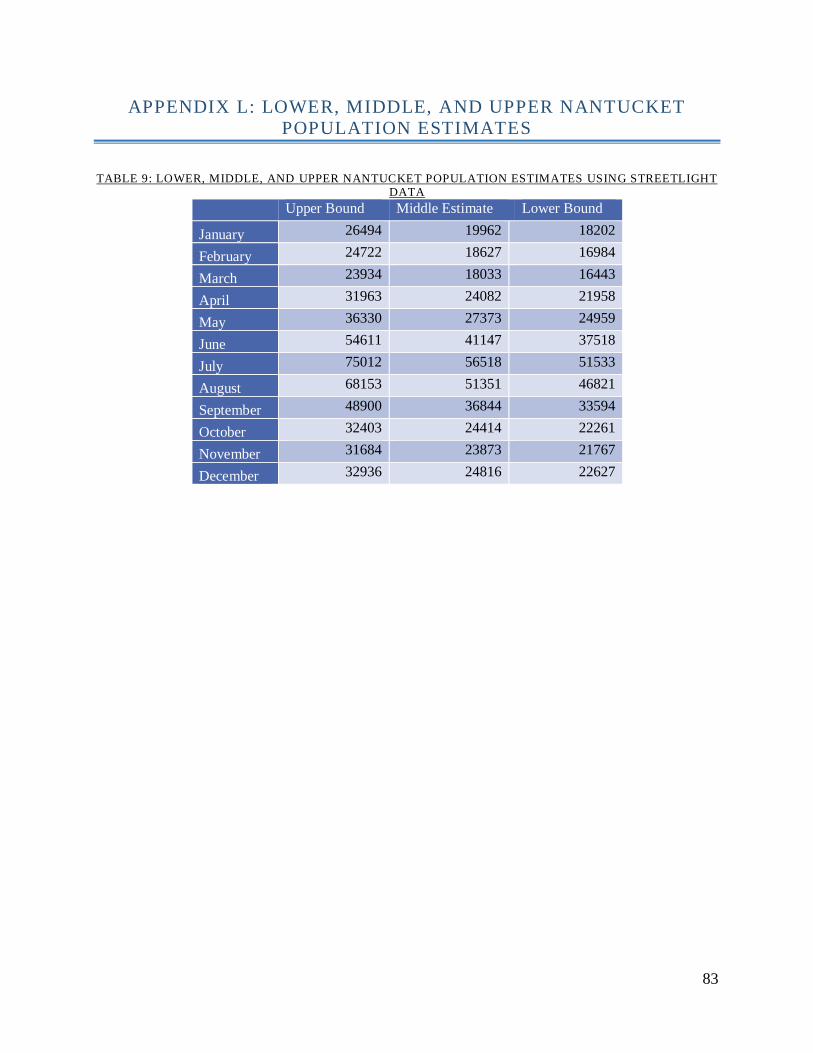
83
APPENDIX L: LOWER, MIDDLE, AND UPPER NANTUCKET
POPULATION ESTIMATES
TABLE 9: LOWER, MIDDLE, AND UPPER NANTUCKET POPULATION ESTIMATES USING STREETLIGHT
DATA Upper Bound Middle Estimate Lower Bound
January 26494 19962 18202
February 24722 18627 16984
March 23934 18033 16443
April 31963 24082 21958
May 36330 27373 24959
June 54611 41147 37518
July 75012 56518 51533
August 68153 51351 46821
September 48900 36844 33594
October 32403 24414 22261
November 31684 23873 21767
December 32936 24816 22627

84
APPENDIX M: COMMUTER CALCULATION
We obtained residential and visitor status percentages using a StreetLight Home and
Work analysis. Residents were determined by people who live on island using the 25-mile rule as
described in section 4.4.1 and visitors being people who do not live on Nantucket, beyond 25
miles away. A similar method was used to determine percentages for work distance with respect
to Nantucket, again using the 25-mile rule. These percentages can be viewed above in Appendix
I. Using these two data sets, we created a formula to estimate the percentage of commuters to
Nantucket based on our heuristics. We defined commuters as working on island, but not living
there. This meant that by subtracting the percentage of people living on Nantucket from the
percentage of people working on Nantucket, we would get the percentage of people that work on
island but do not live there. This equation bases it calculation on the assumption that all residents
of Nantucket also work there.
FIGURE 23: COMMUTER CALCULATION GRAPH
Figure 21 illustrates the results of our calculation. We can conclude from this graph that
the number of commuters peaks during the summer. We currently believe that this is because
many business on Nantucket hire additional staff for the busy summer months so that they can
keep up with large influx of people on island. We do hold some suspicion with this simplistic
calculation, as some months during the offseason came out to be just below 0% as negative
values. However, we believe the principles behind this calculation to be logically sound.
0.0
10.0
20.0
30.0
40.0
50.0
60.0
70.0
80.0
90.0
Jan Feb Mar Apr May Jun Jul Aug Sep Oct Nov Dec
Per
cen
tage
Representation of Communters on Nantucket
Nantucket Workers Residents Commuters
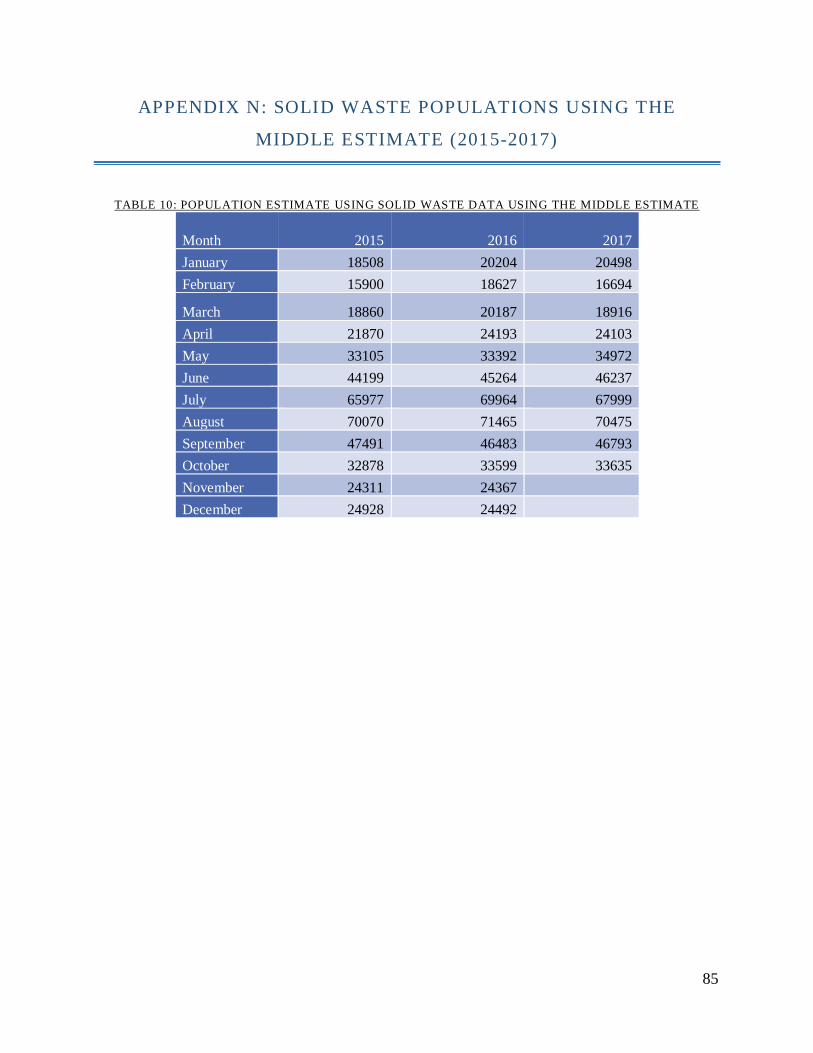
85
APPENDIX N: SOLID WASTE POPULATIONS USING THE
MIDDLE ESTIMATE (2015-2017)
TABLE 10: POPULATION ESTIMATE USING SOLID WASTE DATA USING THE MIDDLE ESTIMATE
Month 2015 2016 2017
January 18508 20204 20498
February 15900 18627 16694
March 18860 20187 18916
April 21870 24193 24103
May 33105 33392 34972
June 44199 45264 46237
July 65977 69964 67999
August 70070 71465 70475
September 47491 46483 46793
October 32878 33599 33635
November 24311 24367
December 24928 24492
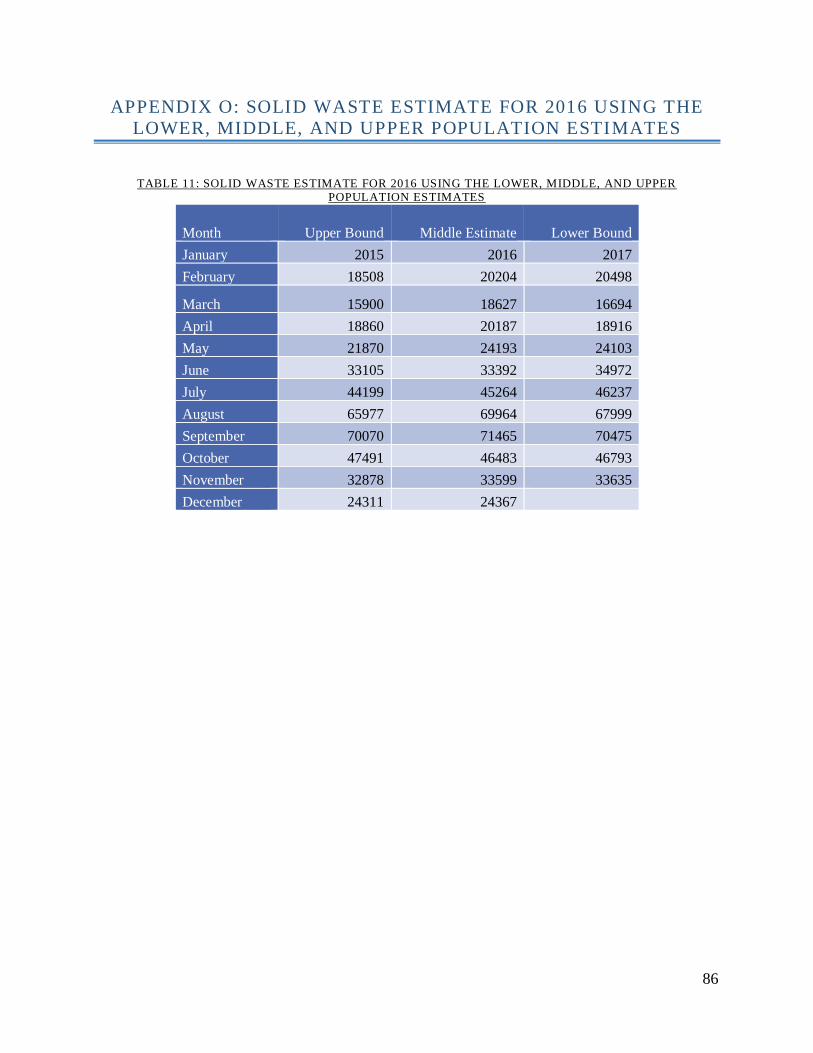
86
APPENDIX O: SOLID WASTE ESTIMATE FOR 2016 USING THE
LOWER, MIDDLE, AND UPPER POPULATION ESTIMATES
TABLE 11: SOLID WASTE ESTIMATE FOR 2016 USING THE LOWER, MIDDLE, AND UPPER
POPULATION ESTIMATES
Month Upper Bound Middle Estimate Lower Bound
January 2015 2016 2017
February 18508 20204 20498
March 15900 18627 16694
April 18860 20187 18916
May 21870 24193 24103
June 33105 33392 34972
July 44199 45264 46237
August 65977 69964 67999
September 70070 71465 70475
October 47491 46483 46793
November 32878 33599 33635
December 24311 24367
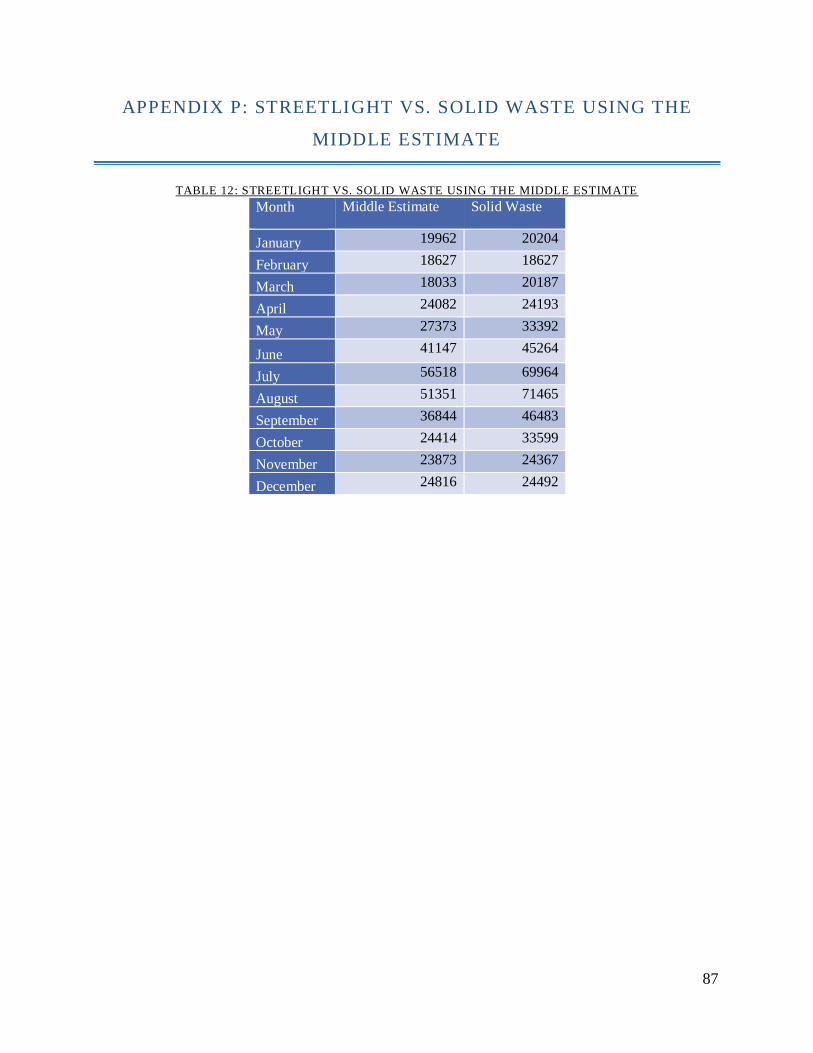
87
APPENDIX P: STREETLIGHT VS. SOLID WASTE USING THE
MIDDLE ESTIMATE
TABLE 12: STREETLIGHT VS. SOLID WASTE USING THE MIDDLE ESTIMATE
Month Middle Estimate Solid Waste
January 19962 20204
February 18627 18627
March 18033 20187
April 24082 24193
May 27373 33392
June 41147 45264
July 56518 69964
August 51351 71465
September 36844 46483
October 24414 33599
November 23873 24367
December 24816 24492

88
APPENDIX Q: SUMMARIZED CONSOLIDATION OF INTERVIEW
NOTES
• Would like to know where people are coming from, how long they are staying on the
island, and where they tend to go while they are here
• Would like to know what kinds of people are traveling to Nantucket, and how these
demographics change over the course of the main on-season and “shoulder seasons”
• Data helps to understand what is really happening, vs. what someone might think is
happening from anecdotal information
o “Basing decisions based on data, rather than emotion” - Jason Bridges
• Improve Nantucket infrastructure for transportation and working to fix the congestion
problem during the summer downtown
o Could use travel data to select projects to take on. Such as: bigger
roads/sidewalks, expanding bike paths, directing people down alternate routes
o Do we invest in a project that is beneficial for more than a small part of the year
(i.e. increasing a sidewalk because it is crowded for only 6 weeks of the year,
which wouldn’t be a good use of funds compared to improving something that is
more beneficial for longer/year-round)
o Sewer system projects are on the books, but what order to do them with available
funds, would population data be able to help guide that answer
• Make services more efficient and properly managed for the number of people here
o Example: bus service makes sense for the summer, but for the offseason, what
routes should it take and how long should it run. Can we use travel data on the
island to help plan these routes
• The Nantucket Data Platform will be a huge service to many Nantucket town
departments, who are constantly needing to know these types of statistics
o “There was/is way too much human capital being invested in digging up
incomplete numbers” - Melissa Philbrick
o “There are more people here than anyone realizes” - Catherine Stover
o “Make data easily accessible by everyone. Good, cited sources. No more
questions about how to get stuff, just a one-way ticket to the Data Platform” -
Andrew Vorce

89
• Cultural Focusses: Knowing who is here would allow the planning of various community
and cultural events tailored to the people who are on Nantucket
o “Help enrich organizational events within the town for those to attend” - Janet
Schulte
• Hospital: Would want to know who is here to better assist the people that could
potentially be coming into the hospital
o “Everyone keeps guessing about the population. We want to better understand the
population that we serve” - Jason Graziadei

90
APPENDIX R: WHERE PEOPLE ARE COMING FROM
One of the most common requests from business owners and organization leaders was
that they would like use StreetLight data to see where tourists are coming from so that they could
market themselves more directly to those people. StreetLight allows for the tracking of home in
various ways the such as distance from the zone and census blocks but the two best ways to track
people that we decided to look at for the needs of the people we interviewed was looking where
people were coming from by metro zone and by state.
FIGURE 24: PERCENTAGE OF PEOPLE VISITING NANTUCKET BY METRO AREA
This graph shows what metro areas people are coming from as given by the Streetlight
data averaged over the entire year. This does not include any rural areas which Nantucket is
defined as by the United States census which is why these percentages do not add up to 100%.
Figure 25 below shows the top 10 states averaged for the year of where people visiting
Nantucket are from. Unlike the metro area analysis, organizing traffic data by state also includes
rural area populations, which is why the Massachusetts area is a much large percentage. With
this information, the NDP could provide local businesses with detailed information on visitors.
Additional projects could be done to look at this data during more specific times of the year. This
would be useful to a business trying to market more effectively during different times of the
year.
0.00% 200.00%400.00%600.00%800.00%1000.00%1200.00%1400.00%
Washington-Arlington-Alexandria, DC-VA-MD-WV
Philadelphia-Camden-Wilmington, PA-NJ-DE-MD
Worcester, MA
Hartford-West Hartford-East Hartford, CT
Bridgeport-Stamford-Norwalk, CT
Providence-New Bedford-Fall River, RI-MA
New York-Northern New Jersey-Long Island, NY-NJ-…
Barnstable Town, MA
Boston-Cambridge-Quincy, MA-NH
Percent
Percent of People Visiting Nantucket by Metro Area
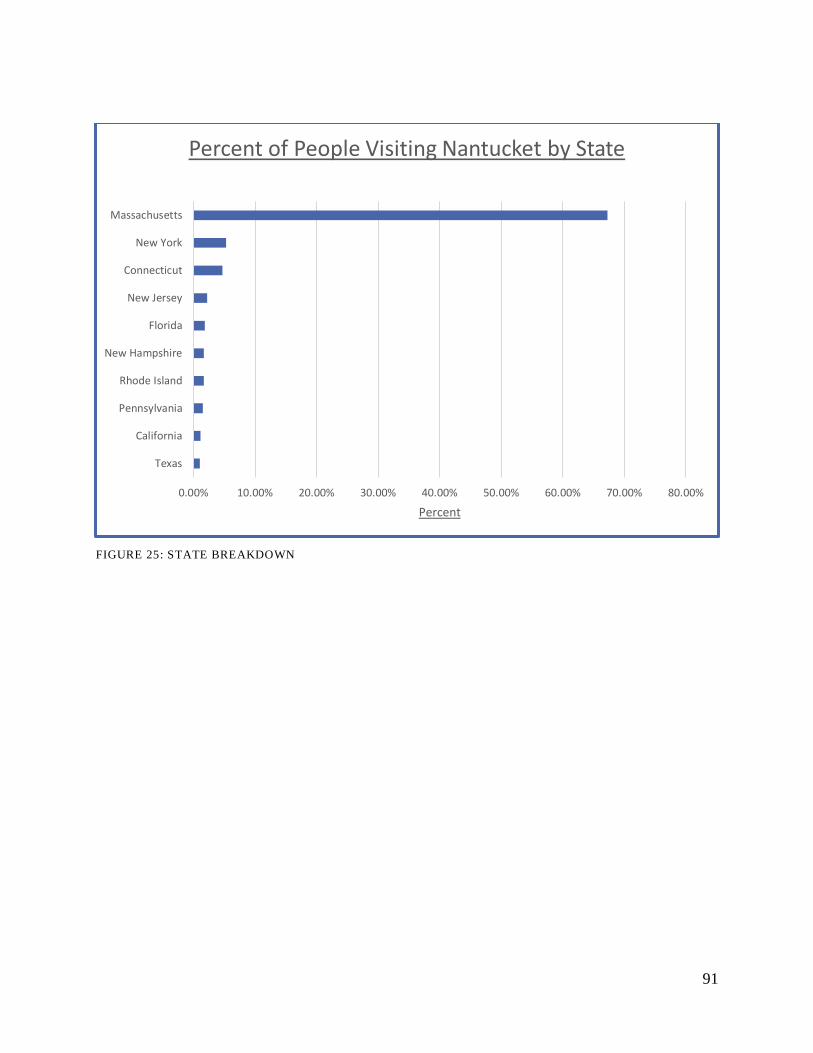
91
FIGURE 25: STATE BREAKDOWN
Texas
California
Pennsylvania
Rhode Island
New Hampshire
Florida
New Jersey
Connecticut
New York
Massachusetts
0.00% 10.00% 20.00% 30.00% 40.00% 50.00% 60.00% 70.00% 80.00%
Percent
Percent of People Visiting Nantucket by State

92
APPENDIX S: SUMMATIVE TEAM ASSESMENT
Throughout the course of our four-month Interactive Qualifying Project, our team
identified some strategies that helped us work effectively with each other:
• To-do list: As with any large project, tasks started to pile up, making it very important to
keep track of deadlines, and who was working on each item. We decided early on that the
best way to ensure all work was being completed in a punctual manner would be a to-do
list, usually organized by day or week. We made a list of all tasks to be completed, and
would either pick and choose the things we wanted to work on, or simply delegate tasks
throughout the group as needed.
• Delegation of tasks: As a group, we realized that our members had strengths and
weaknesses in certain analytical and writing skills. We usually delegated tasks
accordingly, so each member would be able to utilize their strengths to help the team.
However, there were many instances where members were pushed out of their comfort
zone and had an opportunity to improve their weaknesses.
• Staying focused on goals: In the beginning of our time on Nantucket, we were provided
with a large amount of data from the StreetLight Data Platform. Our overall project goal
was to determine methods for evaluating the effective population of Nantucket. However,
there were times where we were not focused on our goal, as we were exploring what
StreetLight had to offer. In the future, we will always take more time to check if the work
we are doing is relevant to our project goal.
We were also able to reflect critically on our effectiveness as a team in the following ways:
• Open to criticism: All members of our team were usually very accepting to criticism,
especially as we were learning about new subjects in the field of demography and the
StreetLight Data platform, since we had little prior knowledge. Because we delegated
tasks in a manner that catered to our strengths and weaknesses, we often became more
familiar than others with various sections of our study. However, we are able to challenge
each other’s ideas in a manner that was respectful to gain different perspectives.
• Open Communication: Our team attempted to keep maximum communication to ensure
that all members would fully understand every aspect of the project to the best degree
possible. So, whenever any of our group members would come back from a interview
they would full debrief the team on what happened and any important points to keep note
of. Same went for whenever a new project in Streetlight was made or a graph was created
it was explained to the group so that everyone was kept up to date.
Self-Reflection: We had our team focus on self-reflection after team meetings so that we could
compose and digest all the new information we gained. This allowed for our team to make the
most out of our team meetings, and to learn from and grow together as a group.