
Estimating Slab Earthquake Response Spectra from a 3D Q Model
15
2649 Bulletin of the Seismological Society of America, Vol. 93, No. 6, pp. 2649–2663, December 2003 Estimating Slab Earthquake Response Spectra from a 3D Q Model by Donna Eberhart-Phillips and Graeme McVerry Abstract The problem of estimating response spectra for a heterogeneous litho- sphere can be addressed by directly computing attenuation from physical models. In a subduction zone, slab earthquakes will have different attenuation through the man- tle wedge than the slab. This article is primarily concerned with very high loss paths through the attenuating mantle underlying the volcanic zone of the North Island, New Zealand, where low Q requires modification of the “standard” New Zealand engineering response spectrum model. A lack of strong-motion data prevents a standard regression analysis for paths from deep slab earthquakes through the highly attenuating mantle zone. Instead, modifications have been derived using a 3D frequency-independent Q model that has been developed for the North Island subduction zone from 2–20 Hz local earthquake t* data. By calibrating the t* crustal results to the standard New Zealand model, amplitudes can be compared between the standard model and the 3D Q model. Ad- ditional path-averaged attenuation rate coefficients, CQ, for each source and station pair are determined. This results in simple expressions for CQ as a function of cen- troid depth, for modifying the standard model. This modification reduces the model spectra by a factor of approximately 2–4 for mantle wedge paths below the volcanic region. This reduction is similar to the ob- served variation in response spectra, at periods below 0.4 sec, for a 160-km-deep M w 6.0 earthquake. For shallow earthquakes propagating through the shallow volcanic region, the new model gives results that are similar to a volcanic-path attenuation term derived by regression analysis. Introduction It is important for engineering prediction of earthquake ground motion to model the heterogeneous transmission of shaking from deep slab earthquakes in New Zealand. The North Island lies above the Hikurangi subduction zone (Fig. 1), which has resulted in volcanism and extension in the Taupo volcanic zone (TVZ). Because of along-strike variation in plate motion and plate-interface properties, the TVZ is limited to the central and northern portions of the North Island, although the subducted slab continues to the northern South Island (Reyners, 1998; Eberhart-Phillips et al., 2002; Upton et al., 2002). Seismograms from mantle paths indicate high attenuation compared to slab paths, yet there are not enough strong-motion data to use a standard regression approach to model the attenuation in the mantle. The geometry for deep earthquakes is illustrated sche- matically in Figure 2a. Below 40-km depth, earthquakes tend to occur only in the subducting slab and hence are located directly below the TVZ. The subducting Pacific plate slab has very low attenuation, the crust of the Australian plate has moderate attenuation, and the mantle wedge between the slab and the overlying crust has very high attenuation. Ad- ditionally the crust in the TVZ has very high attenuation. Thus deep earthquakes will be more strongly felt at more distant eastern sites with low-loss slab paths, such as Napier, than at closer sites with paths through the mantle wedge. Deep earthquakes have produced triggered strong-motion re- cords at eastern sites, but for engineering applications the response for deep earthquakes at sites including high-loss paths, such as Taupo and Rotorua in the TVZ and other lo- cations to the northwest, must also be estimated. The effect of high attenuation in the mantle and TVZ can be clearly seen in both felt and instrumental data. An atlas of isoseismal maps for New Zealand (Downes, 1995) contains several deep-earthquake maps for which the major axis of the ellipse that fits the isoseismal pattern is displaced well to the east of the epicenter (Fig. 2b). These maps of felt effects provide insight for earthquakes that lack strong- motion records. Although not formally mapped, the same effect can be seen in records from strong-motion accelero- graphs. For several deep earthquakes in the general vicinity of the TVZ, the strongest accelerations have been recorded in the vicinity of Napier and Gisborne, whereas instruments at sites above or west of the epicenter have either not been triggered or have returned weaker motions.
Transcript of Estimating Slab Earthquake Response Spectra from a 3D Q Model

2649
Bulletin of the Seismological Society of America, Vol. 93, No. 6, pp. 2649–2663, December 2003
Estimating Slab Earthquake Response Spectra from a 3D Q Model
by Donna Eberhart-Phillips and Graeme McVerry
Abstract The problem of estimating response spectra for a heterogeneous litho-sphere can be addressed by directly computing attenuation from physical models. Ina subduction zone, slab earthquakes will have different attenuation through the man-tle wedge than the slab. This article is primarily concerned with very high loss pathsthrough the attenuating mantle underlying the volcanic zone of the North Island,New Zealand, where low Q requires modification of the “standard” New Zealandengineering response spectrum model.
A lack of strong-motion data prevents a standard regression analysis for pathsfrom deep slab earthquakes through the highly attenuating mantle zone. Instead,modifications have been derived using a 3D frequency-independent Q model that hasbeen developed for the North Island subduction zone from 2–20 Hz local earthquaket* data. By calibrating the t* crustal results to the standard New Zealand model,amplitudes can be compared between the standard model and the 3D Q model. Ad-ditional path-averaged attenuation rate coefficients, CQ, for each source and stationpair are determined. This results in simple expressions for CQ as a function of cen-troid depth, for modifying the standard model.
This modification reduces the model spectra by a factor of approximately 2–4 formantle wedge paths below the volcanic region. This reduction is similar to the ob-served variation in response spectra, at periods below 0.4 sec, for a 160-km-deep Mw
6.0 earthquake. For shallow earthquakes propagating through the shallow volcanicregion, the new model gives results that are similar to a volcanic-path attenuationterm derived by regression analysis.
Introduction
It is important for engineering prediction of earthquakeground motion to model the heterogeneous transmission ofshaking from deep slab earthquakes in New Zealand. TheNorth Island lies above the Hikurangi subduction zone(Fig. 1), which has resulted in volcanism and extension inthe Taupo volcanic zone (TVZ). Because of along-strikevariation in plate motion and plate-interface properties, theTVZ is limited to the central and northern portions of theNorth Island, although the subducted slab continues tothe northern South Island (Reyners, 1998; Eberhart-Phillipset al., 2002; Upton et al., 2002). Seismograms from mantlepaths indicate high attenuation compared to slab paths, yetthere are not enough strong-motion data to use a standardregression approach to model the attenuation in the mantle.
The geometry for deep earthquakes is illustrated sche-matically in Figure 2a. Below 40-km depth, earthquakes tendto occur only in the subducting slab and hence are locateddirectly below the TVZ. The subducting Pacific plate slabhas very low attenuation, the crust of the Australian platehas moderate attenuation, and the mantle wedge between theslab and the overlying crust has very high attenuation. Ad-ditionally the crust in the TVZ has very high attenuation.
Thus deep earthquakes will be more strongly felt at moredistant eastern sites with low-loss slab paths, such as Napier,than at closer sites with paths through the mantle wedge.Deep earthquakes have produced triggered strong-motion re-cords at eastern sites, but for engineering applications theresponse for deep earthquakes at sites including high-losspaths, such as Taupo and Rotorua in the TVZ and other lo-cations to the northwest, must also be estimated.
The effect of high attenuation in the mantle and TVZcan be clearly seen in both felt and instrumental data. Anatlas of isoseismal maps for New Zealand (Downes, 1995)contains several deep-earthquake maps for which the majoraxis of the ellipse that fits the isoseismal pattern is displacedwell to the east of the epicenter (Fig. 2b). These maps of felteffects provide insight for earthquakes that lack strong-motion records. Although not formally mapped, the sameeffect can be seen in records from strong-motion accelero-graphs. For several deep earthquakes in the general vicinityof the TVZ, the strongest accelerations have been recordedin the vicinity of Napier and Gisborne, whereas instrumentsat sites above or west of the epicenter have either not beentriggered or have returned weaker motions.

2650 D. Eberhart-Phillips and G. McVerry
Wha
ngan
ui B
asin
NI D
extra
l Fau
lt Be
lt
Hikura
ngi T
roug
h
Alpine Fault
PACIFIC PLATE
AUSTRALIAN PLATE
stron
g
wea
k
mod
erately wea
k
mod
erate
perm
anen
t
Mar
lboro
ugh
Fault
Sys
tem
N
0 1 0 0 2 0 0
km
37 mm a-1
45 mm a-1
Taup
o Vo
lcan
ic Z
one
A
B
Wellington
Napier
Taupo
Rotorua
Gisborne
Figure 1. Generalized tectonics of the North Is-land of New Zealand. The region is dominated byoblique subduction of the Pacific plate along theHikurangi Trough, with plate velocity indicated byarrows. The outlined Taupo volcanic zone (TVZ) ex-hibits active volcanism and rifting. The transcurrentplate motion is expressed in upper plate fault zonessuch as the North Island dextral fault belt. The cou-pling along the plate interface has been shown byReyners (1998) to vary from weak to strong as la-beled, becoming permanent in the South Island as thetectonic style switches to oblique continental colli-sion. The star indicates the epicenter of the earthquakedisplayed in Figure 4. Line AB shows the cross sec-tion for attenuation (Fig. 7).
Dowrick and Rhoades (1999) have developed attenua-tion models for modified Mercalli intensity isoseismals forNew Zealand earthquakes, including a model for earth-quakes more than 70 km deep. Regardless of the actual lo-cation of the deep event, they find that the isoseismals aresystematically shifted to the east (shown by the AA line inFigure 2a) rather than being centered around the epicenteras might be expected without lateral heterogeneity in thecrust and upper mantle. The offset at the center of the iso-seismal pattern from the epicenter is demonstrated by the173-km-deep earthquake shown in Figure 2. The AA linecorresponds to the 35-km depth contour on the top of thedipping slab and thus means that the isoseismals for all deepearthquakes are centered east of the mantle wedge. Theshape of the isoseismals is modeled as an asymmetric ellipse
compressed on the western side near the TVZ. The exactshape varies with the magnitude and depth.
The standard New Zealand subduction zone responsespectrum attenuation model (McVerry et al., 2000) is de-rived from data exhibiting the behavior shown in Figure 2.There are not enough strong-motion data to use a standardregression approach to model the attenuation for pathsthrough the mantle. The film-recording accelerographs thatmade up the New Zealand strong-motion network until therecent introduction of digital accelerographs and digital seis-mographs were too insensitive to yield more than a few use-ful records of motions from paths through the attenuatingmantle. In fact, these few records were excluded from theregression analysis so as not to corrupt the models for themuch more commonly recorded paths up the slab. The prac-tical problem for hazard analysis is that it is nonconservativeto simply ignore contributions from deep slab earthquakesat sites involving mantle paths. However, using the standardmodel, which is appropriate for paths up the slab to sites inthe eastern or southern North Island, for sites above thesource zone of deep slab earthquakes involving mantlepaths, produces overly high estimated motions that incor-rectly dominate the hazard estimates.
In the Hokkaido region of Japan, there is similarly aproblem of varied intensity for deep earthquakes dependingon the path through the low-Q mantle wedge. Takai et al.(2000) developed a method to predict intensity based on pathlength through the mantle wedge. They used a simple two-element Earth model with slab and wedge. Then they un-dertook a regression using path length in each layer, withoutsolving for Q.
We aim to go a step further with a physical modelingapproach, taking a 3D Earth model and using it to developa modified response spectral model that accounts for hetero-geneous structure. The spectral attenuation of small earth-quakes (magnitude �2.5), which are routinely recorded bythe seismograph network, can be parameterized by t*, asdescribed later. The t* data are inverted for a 3D Q model.Using the Q model, attenuation is calculated along various3D ray paths. Finally attenuation rate terms are determinedthat fit into the response spectral model, with the other termsin the model being held constant.
We make the assumption that Q measured for smallearthquakes will be applicable to large earthquakes. Whilethe amplification of ground motion in soft soil is known tobe nonlinear with magnitude (Beresnev and Wen, 1996),there is little reason to expect Q would vary with magnitude.For fluid-saturated porous media with low effective stress,where attenuation results from localized fluid flow and grain-contact effects, some studies indicate that Q decreases forlarge strain amplitudes (�10�6) that disturb the grain con-tacts (Sharma and Tutuncu, 1994; Winkler and Murphy,1995). The strain amplitude for a magnitude �7.0 earth-quake at 100-km distance could reach 10�6 (Gomberg,1996), and thus there is some possibility of strain-related Qdecrease. It is less clear how the attenuation mechanisms

Estimating Slab Earthquake Response Spectra from a 3D Q Model 2651
40 So
40 o
170 Eo
NORTH ISLAND EARTHQUAKE
1973 JANUARY05
Magnitude:
Epicenter:
Depth:
7.0 M 6.3 ML s
39.13 S 175.18 E0 0
173 km
+
IVV
VI
3
5
4 45
4
4
54?
46
565
655
?
44
5
445
44
?
5 5
5
5
??
5?4
6?5 6
??
55 4
66
5555
5? 4
5
5
55
5
4
?55
6
5 4
444
4
3
44
4
4
7 ? 6
?
5
4?
5
o
175 o
42 o
44 o
42 o
44 o
38 o
180 o
PACIFIC PLATE
AUSTRALIAN PLATE crust
slab
highlyattenuatingwave path
>~
100 km
low loss
wave paths
plate interfaceA
A
“deep” earthquake source, h 70 km c
M A N T L E
approximate center line of strongest shaking
for deep events (parallel to plate boundary)
a)
b)
Figure 2. (a) Schematic view comparing highly attenuating mantle paths to sitesabove the focus of a deep earthquake, with low-loss paths up the subducting slab andthrough the crust to sites east of the epicenter (after Dowrick and Rhoades, 1999). Themarkedly higher attenuation rate for mantle paths causes isoseismal patterns to beasymmetric and offset to the east of the epicenter, as illustrated by the shaded ellipse.Black star, hypocenter; gray star, epicenter. (b) An example of an isoseismal patternfrom a deep earthquake offset to the east of its epicenter, marked by a star (Downes,1995).

2652 D. Eberhart-Phillips and G. McVerry
work in the more viscous mantle wedge, but they are likelyto be less influenced by strain amplitude.
New Zealand Standard Response Spectral Model
The standard New Zealand response spectral accelera-tion model (McVerry et al., 2000) was obtained by an em-pirical fit to observed spectra using standard regression mod-els. The model took account of different tectonic types ofearthquakes and their depths and mechanisms. The base dataconsisted of 5% damped horizontal acceleration responsespectra SA(T) from a data set of New Zealand earthquakerecords, supplemented by peak ground acceleration (PGA)values from overseas records in the near-source range. Lim-ited ranges of magnitude and distance and insufficient re-cords in the response spectrum data set prevented thedevelopment of a purely New Zealand model. Instead, inter-national models were adjusted to better fit the New Zealanddata. Abrahamson and Silva (1997) was selected as a suit-able base model for crustal earthquakes and Youngs et al.(1997) for subduction-zone earthquakes.
The form of the McVerry et al. (2000) model for crustalearthquakes at weak rock sites is
ln SA(T) �standardNZcrustal
C (T) � C (M � 6)1 4AS2� C (T) (8.5 � M) � C (T) r (1)3AS 5
� (C (T) � C (M � 6))8 6AS2 2 1/2ln(r � C (T)) � C (T) r ,10AS 46 VOL
where T is period, M is moment magnitude, r is the slantdistance (straight-line path) from the site to the fault, andrVOL is the length of the part of the source-to-site path thatlies in the volcanic zone. Other terms for mechanism andsite classification may be included. Coefficients subscripted“AS” were constrained to the base model (Abrahamson andSilva, 1997) values.
The model contains two anelastic attenuation coeffi-cients, C5 and C46, which vary with period. The averagecrustal attenuation rate is modeled by C5. However this doesnot account for the recognized high attenuation in the vol-canic region of the North Island (Haines, 1981; Cousins etal., 1999). For shallow earthquakes with paths through thehigh-attenuation-rate crustal volcanic region, there are suf-ficient data to derive volcanic-path anelastic attenuationterms for the standard model using regression analyses. Thedifferent volcanic crustal attenuation rate is modeled by C46.For PGA, C5 � �0.00967 km�1, while C46 � �0.03279km�1, that is, a total rate of �0.04246 km�1, over 4 timesthe standard crustal rate.
The form of the McVerry et al. (2000) model for sub-duction-zone earthquakes for weak rock sites is
ln SA(T) �standardNZsubductionzone3C (T) � C (T) (M � 6) � C (T) (10 � M)11 12 13Y (2)
� C (T) ln (r � C exp(C M))17 18Y 19Y
� C (T) H � C (T) SI � C (T) r (1 � DS)20 C20 24 46 VOL
where SI � 1 for subduction interface earthquakes or zerootherwise, HC20 is the lesser of the centroid depth or 150 km,and DS is 1 for deep slab earthquakes (centroid depthsgreater than 50 km) or zero otherwise. The coefficients sub-scripted “Y” were constrained to their values in the Youngset al. (1997) model. There was also a near-source constraintthat the magnitude dependence at zero distance is the sameas for the Youngs et al. model, requiring
C (T) � C (T) C � C � C (T) C . (3)12 17 19Y 12Y 17Y 19Y
This model is similar to the Youngs et al. model, but allowsthe coefficients of the magnitude, centroid depth, and sub-duction interface terms to be functions of period, as well asadding the volcanic path anelastic attenuation term C46(T)rVOL for interface and shallow slab earthquakes with crustalvolcanic-zone paths.
The resulting PGA attenuation curves for shallow sub-duction-zone earthquakes for shallow soil sites are verysimilar to the Youngs et al. (1997) rock curves (Fig. 3), forboth earthquakes at the subduction interface and in the shal-low slab (i.e., at centroid depths around 20 km). For deeperslab earthquakes, the New Zealand model predicts greatershallow soil PGAs than the Youngs et al. (1997) rock model.
The similarity between the Youngs et al. (1997) rockcurves and the New Zealand shallow soil curves can be ex-plained in terms of the site classification used in the twomodels. The New Zealand site classifications vary fromthose used in the Abrahamson and Silva (1997) and Youngset al. (1997) attenuation models, especially for the rockclasses. The Abrahamson and Silva (1997, p. 95) “rock”class includes both “rock (Vs � 600 m/s) or very thin soil(�5m) over rock” and “shallow soil; soils 5–20 m thick overrock.” In describing their rock class, Youngs et al. (1997, p.59) stated that “rock site conditions are expected to be simi-lar to typical rock conditions in the California strong motiondatabase, consisting of at most a few feet of soil over weath-ered rock.” N. A. Abrahamson (personal comm., 2003)stated that the rock classes in both the Abrahamson and Silva(1997) and Youngs et al. (1997) models are in fact similar,representing both rock and shallow soil sites. The New Zea-land rock class requires material with a compressive strengthexceeding 1 MPa, although allowing a surface layer of nomore than 3 m depth of highly weathered or completelyweathered rock or soil. Although the classification can bemade from geological descriptions rather than requiringmeasurement of the strength, and in practice is assigned thisway, the minimum strength of 1 MPa corresponds to theboundary between rock and soil defined by the New Zealand

Estimating Slab Earthquake Response Spectra from a 3D Q Model 2653
100
2 5 101
2 510
-2
2
5
10-1
2
5
100
2
5
101
(b) PGA for Shallow Slab Earthquakes, Hc = 20 km
102
M=7.5M=5.5
M = 7.5M = 5.5
100
2 5 101
2 5 10210
-2
2
5
10-1
2
5
100
2
5
101
M=7.5M=5.5
M = 7.5M = 5.5(a) PGA for Interface Earthquakes, Hc = 20 km
Source Distance (km)
Peak
Gro
und
Acc
eler
atio
n (g
)Pe
ak G
roun
d A
ccel
erat
ion
(g)
Source Distance (km)
Youngs et al. Rock
NZ Standard Shallow Soil
Youngs et al. Rock
NZ Standard Shallow Soil
2 5
2 5
Figure 3. Comparison, for shallow subduction earthquakes, of the New Zealandstandard shallow soil model (black lines, McVerry et al., 2000) to the worldwide model(gray lines, Youngs et al., 1997), which was derived from both rock and shallow soilsites. Peak ground acceleration is for M 5.5 (solid lines) and M 7.5 (dashed lines)earthquakes with centroid depth of 20 km. (a) Plate interface earthquakes; (b) shallowslab earthquakes.
Geomechanics Society (1988), and materials assigned to thisclass are clearly rock rather than soil. The separation of rocksites from shallow soil sites was found to be statisticallyjustified in the development of the New Zealand responsespectrum attenuation relations, with shallow soil sites typi-cally having stronger spectra than the rock sites that arelumped with them in the Abrahamson and Silva (1997)model and reportly in the Youngs et al. (1997) model also.
Rodriguez-Marek et al. (2001) have pointed out that theAbrahamson and Silva (1997) rock (and shallow soil) classis in fact dominated by records from shallow soil sites, andtheir spectra reflect this, representing those for shallow soilsites rather than the considerably reduced spectra from rocksites, similar to the comparisons between rock spectra andshallow soil site spectra in New Zealand. It is therefore notsurprising that the Youngs et al. (1997) rock PGA attenuation

2654 D. Eberhart-Phillips and G. McVerry
curves are similar to the shallow soil rather than rock curvesfrom the New Zealand model.
The McVerry et al. (2000) model for subduction-zoneearthquakes includes a term for hypocentral depth, C20 HC.This coefficient is positive (e.g., 0.013 for 2 Hz) and thusserves to increase the anticipated acceleration for deep earth-quakes relative to shallower earthquakes that have the samedistance. However this is a biased result, because availablestrong-motion records involved low-loss paths within thesubducted slab. With such limited data, empirical regressionmethods will predict high accelerations for all deep earth-quakes and thus will overestimate nonslab paths. The highattenuation for deep slab earthquakes for propagation pathsthrough the mantle wedge has been recognized for manyyears (e.g., Mooney, 1970), but scarcity of strong-motiondata for the effected paths prevented its modeling in theMcVerry et al. (2000) regression-based attenuation expres-sion.
Heterogeneous Q Model
The New Zealand National Seismograph Network re-cords earthquakes of magnitude 3.5 and greater. These dataare available for numerous earthquakes that were too smallto trigger strong-motion recorders. Deep earthquake record-ings show large differences between eastern stations withslab paths and other stations with paths through the mantlewedge and volcanic zone.
Records for a 180-km-deep M 4.7 earthquake under Ro-torua (star in Fig. 1) are shown in Figure 4, with a vertical-component velocity seismogram and observed and modeledamplitude spectra for each station. TVZ stations are com-pared to eastern stations, illustrating that the dropoff in am-plitude with frequency is much more pronounced for theTVZ stations. We fit each velocity amplitude spectra (equa-tion 4) with three parameters: the spectral level, X0, cornerfrequency, f c, and t*, a parameter that represents the whole-path attenuation (Scherbaum, 1990; Rietbrock, 2001;Eberhart-Phillips and Chadwick, 2002).
2f cA( f ) � 2pfX * * exp[�pft*] (4)0 2 2( f � f )c
Amplitude spectra for a window (2.56 sec) around the Parrival are used, including only data with significant a signal-to-noise ratio (�2) over the frequency band 1–20 Hz. In the3D QP inversion, the 3D Vp model is used in determiningray paths and in computing QP perturbations. The cornerfrequency, f c, of the event is estimated by a grid search usingall the recordings for each event. Then an iterative procedureis used to fit the spectral level, X0, and t*. In order to weighteach t* residual in the QP inversion, we estimate a qualityfor the t* observation based on how well the spectra is mod-eled and the range of frequency that is modeled. Thus Figure4 shows the t* values that describe the varied frequency
decay, with t* being roughly 3 times greater for the TVZstations than for the eastern stations.
Given t* for a set of earthquakes and stations and a 3Dvelocity structure, t* can be inverted for Q structure by re-lating t* to Q along the ray paths (s).
t* � 1/(Q(s) *V(s))ds (5)�raypath
This method has been used to obtain detailed 3D QP modelsfor regions with dense temporary seismograph deployments(Rietbrock, 2001; Eberhart-Phillips and Chadwick, 2002). At* station term can optionally be included in equation 5, butsince the application in this study is for predicting the atten-uation rate, we choose to push near-surface attenuation ef-fects into the 3D model.
For estimating the heterogeneous attenuation of deepearthquakes under the North Island, we compute a largerscale 3D QP model using primarily the sparse permanentnetwork. For the period 1990–2000, we selected 450 earth-quakes, magnitude 4–6, near-surface to 400-km depth, thatwere spatially well distributed and recorded on at least 12stations. Seismograms from all 146 available stations wereused, but most of those stations were temporary and only 27stations had 50 or more observations. The data comprised10,475 P arrivals and 4473 t* values. As t* can only beestimated when the noise is low over the desired frequencyrange (Fig. 4), there are fewer t* than P-arrival data. Sinceour goal was to image the mantle wedge, we did not includesources from the eastern North Island where the subductedslab is shallower than 50 km. The initial model was extrap-olated from 3D studies of the eastern North Island (Eberhart-Phillips and Chadwick, 2002; Eberhart-Phillips et al., 2002).
The inversion model is coarse 3D in the crust to 35-kmdepth with 11–75 km grid spacing, and 2D for 35- to 400-km depth through linking of along-strike nodes. Velocityand QP are linearly interpolated between nodes. The methodassumes frequency-independent QP. Other linking of adja-cent nodes was done within the mantle wedge to make itsproperties relatively uniform even on the less-resolved pe-ripheral nodes. This is important for creating a model that isuseful for attenuation applications while still making surethe model fits the data.
The results are shown in Figure 5 for a cross sectionfrom the east coast across the volcanic zone. The inversionhypocenters are also shown. The Vp model shows high ve-locity for the slab relative to the mantle wedge and reducedvelocity for the mantle below the TVZ. The QP model showshigh QP (500–900) for the subducted slab and low QP (100–200) for the mantle wedge. Low QP is also shown for theTVZ and the eastern accretionary sediments. Note that thelow crustal QP on the west could be due to smearing alongray paths that primarily sample the mantle wedge since thereare few crisscrossing peripheral crustal ray paths to inde-pendently resolve crustal velocity.

Estimating Slab Earthquake Response Spectra from a 3D Q Model 2655
Magnitude 4.7 under Rotorua
Hc= 180 kmTVZ Stations
Eastern Stations
2924
Vel
ocity
Spe
ctra
l Am
plitu
de
10 -9
10 -810 -8
10 -7
10 -6
10 -5
10 -4
10 -3
10 -2
11 2 5 10 20 50
WLZ
*t 0.172fc 13.7wgt 0 t* 0.092 t* 0.148
Frequency (Hz) Frequency (Hz) Frequency (Hz)
WLZ, R= 50km CNZ, R= 147km NGZ, R= 143km
NOZ, R= 181km PGZ, R= 295km KOKE, R= 178km
4198
Vel
ocity
Spe
ctra
l Am
plitu
de
10 -9
10 -810 -8
10 -7
10 -6
10 -5
10 -4
10 -3
10 -2
11 2 5 10 20 50
NOZ
t* 0.049fc 13.7wgt 0
3802
10 -9
10 -810 -8
10 -7
10 -6
10 -5
10 -4
10 -3
10 -2
11 2 5 10 20 50
PGZ
t* 0.037fc 13.7wgt 1
Frequency (Hz) Frequency (Hz) Frequency (Hz)
3487
10 -9
10 -810 -8
10 -7
10 -6
10 -5
10 -4
10 -3
10 -2
11 2 5 10 20 50
KOKE
t* 0.039fc 13.7wgt 2
242
10 -9
10 -810 -8
10 -7
10 -6
10 -5
10 -4
10 -3
10 -2
11 2 5 10 20 50
CNZ
fc 13.7wgt 0
694
10 -9
10 -810 -8
10 -7
10 -6
10 -5
10 -4
10 -3
10 -2
11 2 5 10 20 50
NGZ
fc 13.7wgt 1
Figure 4. Example of fitting t* for a 180-km-deep earthquake. TVZ stations, displaymore attenuated waveforms than eastern stations, which corresponds to much higher t*values. For each station, the waveform is shown with the velocity spectra underneath. Acommon f c is found for the event, and then the spectral level and t* are estimated. Dottedlines show the noise spectra and heavy lines show the fit to the data over the range withadequate signal-to-noise ratio, and wgt indicates fit quality with best fit � 0.
2656 D. Eberhart-Phillips and G. McVerry
0
20
40
60
80
100
120
140
160
180
200
220
240
260
280
300
320
340
0
20
40
60
80
100
120
140
160
180
200
220
240
260
280
300
320
340
-200 -180 -160 -140 -120 -100 -80 -60 -40 -20 0 20 40
-200 -180 -160 -140 -120 -100 -80 -60 -40 -20 0 20 40
NW SE
a) Vp V
Dep
th (
km)
X-Distance (km )
4.0 4.5 5.0 5.5 6.0 6.5 7.0 7.5 8.0 8.5 9.0Vp(km/s)
0
20
40
60
80
100
120
140
160
180
200
220
240
260
280
300
320
340
0
20
40
60
80
100
120
140
160
180
200
220
240
260
280
300
320
340
-200 -180 -160 -140 -120 -100 -80 -60 -40 -20 0 20 40
-200 -180 -160 -140 -120 -100 -80 -60 -40 -20 0 20 40
NW SE
b) Qp V
Dep
th (
km)
X-Distance (km )
0 100 200 300 400 500 600 700 800 900 1000Qp
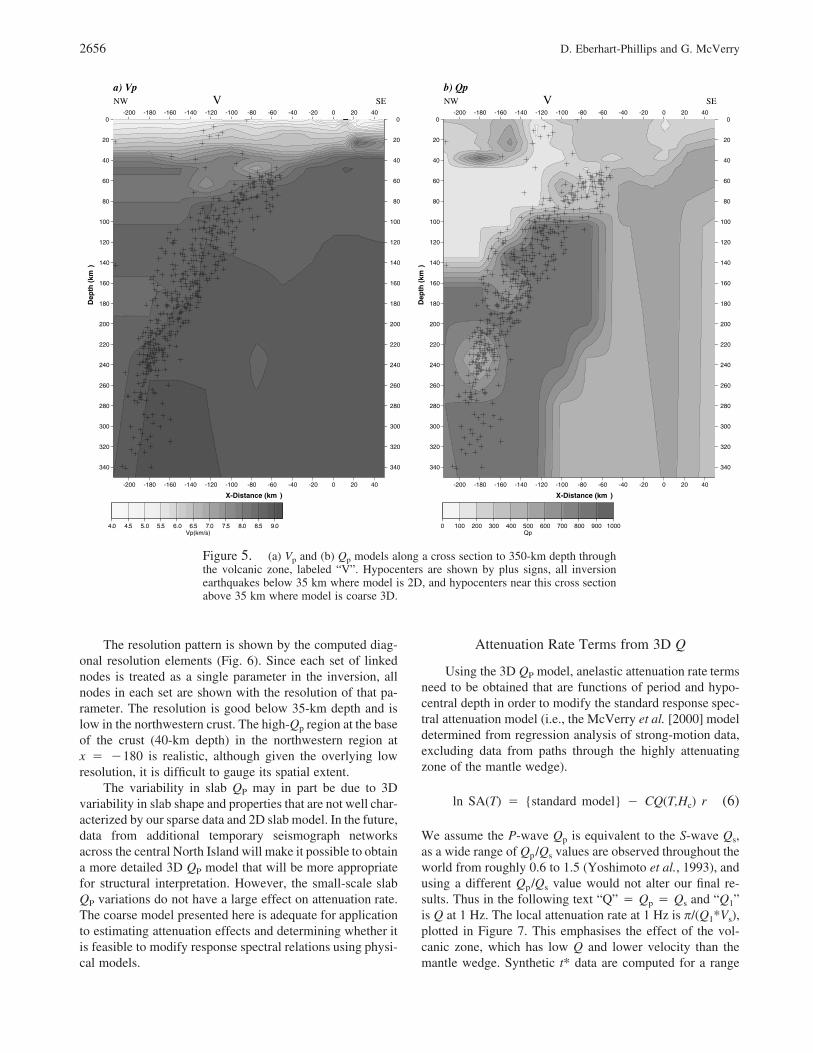
Figure 5. (a) Vp and (b) Qp models along a cross section to 350-km depth throughthe volcanic zone, labeled “V”. Hypocenters are shown by plus signs, all inversionearthquakes below 35 km where model is 2D, and hypocenters near this cross sectionabove 35 km where model is coarse 3D.
The resolution pattern is shown by the computed diag-onal resolution elements (Fig. 6). Since each set of linkednodes is treated as a single parameter in the inversion, allnodes in each set are shown with the resolution of that pa-rameter. The resolution is good below 35-km depth and islow in the northwestern crust. The high-Qp region at the baseof the crust (40-km depth) in the northwestern region atx � �180 is realistic, although given the overlying lowresolution, it is difficult to gauge its spatial extent.
The variability in slab QP may in part be due to 3Dvariability in slab shape and properties that are not well char-acterized by our sparse data and 2D slab model. In the future,data from additional temporary seismograph networksacross the central North Island will make it possible to obtaina more detailed 3D QP model that will be more appropriatefor structural interpretation. However, the small-scale slabQP variations do not have a large effect on attenuation rate.The coarse model presented here is adequate for applicationto estimating attenuation effects and determining whether itis feasible to modify response spectral relations using physi-cal models.
Attenuation Rate Terms from 3D Q
Using the 3D QP model, anelastic attenuation rate termsneed to be obtained that are functions of period and hypo-central depth in order to modify the standard response spec-tral attenuation model (i.e., the McVerry et al. [2000] modeldetermined from regression analysis of strong-motion data,excluding data from paths through the highly attenuatingzone of the mantle wedge).
ln SA(T) � {standard model} � CQ(T,H ) r (6)c
We assume the P-wave Qp is equivalent to the S-wave Qs,as a wide range of Qp/Qs values are observed throughout theworld from roughly 0.6 to 1.5 (Yoshimoto et al., 1993), andusing a different Qp/Qs value would not alter our final re-sults. Thus in the following text “Q” � Qp � Qs and “Q1”is Q at 1 Hz. The local attenuation rate at 1 Hz is p/(Q1*Vs),plotted in Figure 7. This emphasises the effect of the vol-canic zone, which has low Q and lower velocity than themantle wedge. Synthetic t* data are computed for a range

Estimating Slab Earthquake Response Spectra from a 3D Q Model 2657
0
20
40
60
80
100
120
140
160
180
200
220
240
260
280
300
320
340
-200 -180 -160 -140 -120 -100 -80 -60 -40 -20 0 20 40
NW SEDRE Qp Link D
epth
(km
)
X-Distance (km )
2040
60
60
80
80
0 10 20 30 40 50 60 70 80 90 100Qp Diag Resol Elem (x100)
Figure 6. Plot of diagonal resolution elements forQp inversion (Fig. 5b). Note that the southeastern Qp
was fixed to previous models, the model is 2D below35-km depth, and linking combines weakly samplednodes in the inversion.
S6
S5
S4
S3
S2
S1
Local Attenuation Rate at 1 Hz
π0.005 0.010 0.015 0.020 0.025 0.030 0.035 0.040
Figure 7. Cross section, along line AB in Figure1, showing attenuation rate [p/(Q1*Vs)] at 1 Hz, andsynthetic sources and sites used for computing atten-uation terms CQ(HC). Sites are labeled S1–S6, circlesare synthetic sources, and plus signs are inversion hy-pocenters. Note local attenuation rates of 0.002 in thedeep slab, 0.007 in the standard crust (between S1and S2), and 0.030 in the volcanic zone (below S4).
of sources and sites in order to estimate CQ. Sources aredistributed from 30- to 350-km depth, and six sites are usedacross the profile.
For consistency, the CQ coefficients should be tied tothe McVerry et al. (2000) empirical crustal anelastic atten-uation coefficient, C5 (equation 1). C5 would be related toQs. We initially evaluated the C5(T) coefficients for fre-quency dependence of Q, considering QC5(f ) � Q1 f g, andQ1 is QC5 at 1 Hz. Thus,
gC ( f ) � �pf/(Q f V ). (7)5 1 s
By comparing C5 at f � 2–13 Hz to C5 at 1 Hz, we foundthat a g of 0.7 is suggested by the empirical coefficients,with g nearer to 1 for 10–13 Hz.
Synthetic t* values are computed for varied crustalearthquakes. The frequency-independent Qp can be matchedto the crustal QC5(f ) by equating them at the best-fittingfrequency, fQ. The slant distance from source to site is used
for r, as for other terms in the McVerry et al. (2000) model.However for calculating t*, the actual 3D ray path is used.At 1 Hz,
0.7t* � r/(Q V ) � r/(Q f V ),p p 1 Q p (8)�1 0.7so Q � (t*/r) f V1 Q p
and the C5 coefficient at 1 Hz can be related to the synthetict*,
0.7C (1) � �p (t*/r) f (V /V ). (9)5 Q p s
The best-fitting fQ for the synthetic crustal t* data is 4.5 Hz.

2658 D. Eberhart-Phillips and G. McVerry
0 50 100 150 200 250 300 350Source Depth Hc (km)
0.0
0.002
0.004
0.006
0.008
0.01
0.012
0.014
0.016
0.018
0.02
CQ
1=C
Q(1
s)p
erkm
S1Standard
S2
S5 Mantle WedgeS3S6S4 Wedge + Volcanic
CQ1=CQ(1s) for Sites
Figure 8. The average attenuation rates at 1 Hz, CQ1, for sites S1–S6 (Fig. 7) as afunction of the centroid depth (HC) of the earthquake.
This is a reasonable value since it is in the range (1–20 Hz)used in computing the 3D Q model. Note that fQ is a cali-bration factor to relate C5 and CQ. It would absorb anyQp/Qs variation without altering the CQ coefficients. For in-stance, if Qp/Qs was 1.5, fQ would be 2.5 Hz, which is stilla reasonable value.
Similarly, the anelastic attenuation coefficients for 1 Hzcan be computed from synthetic t* along any path throughthe 3D Q model:
0.7CQ � �p (t*/r) f (V /V ). (10)1 Q p s
To get CQ1 for slab earthquakes, we use a series of sourceslying along the top of the dipping subducted slab (Fig. 7).As slab seismicity is limited to a relatively narrow zone,these are representative of other events at the same depths.
The CQ1 values for a series of sites, S1 to S6, as shownin Figure 7, are plotted as a function of depth in Figure 8.Sites S1 and S2 represent standard sites with low-loss pathsas in the McVerry et al. (2000) model. Sites S3, S5, and S6represent paths through the attenuating mantle wedge, butnormal crust. Site S4 represents a path through both the man-tle wedge and the volcanic zone, and it has over twice theattenuation rate of the standard site. The mantle wedge site,S5, also shows a very high attenuation rate.
We need simple attenuation terms for each site. Typi-cally, for each site, there is a constant value of CQ1 oversome depth range and then a descending branch for greatercentroid depths. In one case there is an ascending branch forsmall depths. The descending branches can be fitted by hy-perbolae, as shown in Figure 8. The hyperbolae can be in-terpreted physically as the curves that result for travel pathsthrough a series of regions, each with a different local atten-
uation rate, p/(Q1*Vs). The local CQ1 values of 0.0071 km�1
for the standard crust and lower for the deep slab impliedby the following formula are confirmed by the plot of thelocal attenuation rates in Figure 7.
The corresponding formula give the 1-Hz attenuationcoefficients.
For the standard site,
CQ (H ) � 0.0071 0 km � H � 60 km1STANDARD C C
� 0.0025 � 0.275/H 60 km � H � 350 km.C C
(11)
For the mantle wedge site,
CQ (H ) � 0.0110 0 km � H � 100 km1SITE C C
� 0.0033 � 0.77/H 100 km � H � 220 kmC C
� 0.0025 � 0.946/H 220 km � H � 350 km.C C
(12)
For the mantle wedge plus volcanic zone,
CQ (H ) � 0.0088 � 0.0001 H 0 km � H � 601SITE C C C
� 0.0148 60 km � H � 100 kmC
� 0.0025 � 1.23/H 100 km � H � 350 km.C C
(13)
The attenuation rates for other periods can be computed fromthe 1-Hz values, using a frequency exponent, g, of 0.7 anda g of 1 above 5 Hz:
0.3CQ (T,H ) � CQ (H )/T T � 0.2 secSITE c 1SITE c (14)CQ (T,H ) � CQ (T � 0.2 sec, H ) T � 0.2 sec.SITE c 1SITE c
Estimating Slab Earthquake Response Spectra from a 3D Q Model 2659
5 10-1
2 5 100
2 5
Spectral Period (Seconds)
5
10-2
2
5
0-1
2
5
100
2
5
1
Abs
olut
eA
ccel
erat
ion
(g)
M = 7.7
(standard site)S2 Rh=94km, R=177km
M 7.7 at 150km depth - Standard vs. Modified Spectra
Modified model - lower set (Gray)
.Rh=8 5km, R=150kmS4 - wedge + volcanic
S5 Rh=3.5km, R=150km - mantle wedge
Standard model- to setp (Black)
S4,S5
S2
S5
S4
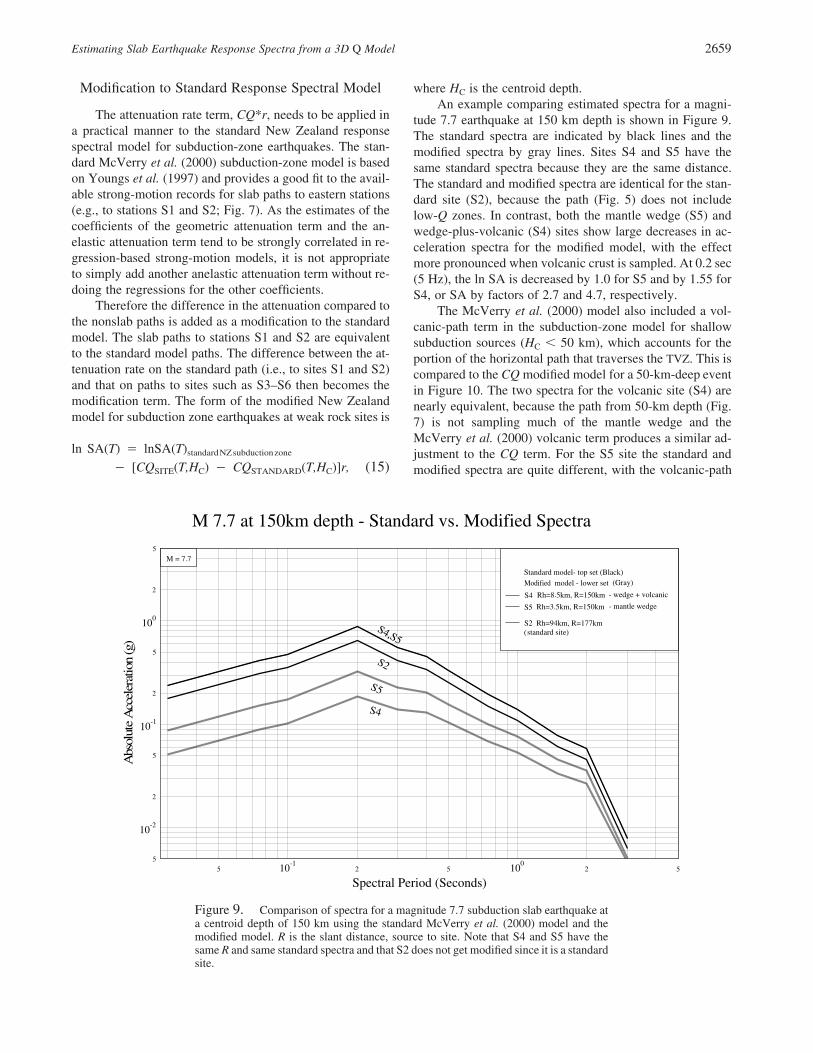
Figure 9. Comparison of spectra for a magnitude 7.7 subduction slab earthquake ata centroid depth of 150 km using the standard McVerry et al. (2000) model and themodified model. R is the slant distance, source to site. Note that S4 and S5 have thesame R and same standard spectra and that S2 does not get modified since it is a standardsite.
Modification to Standard Response Spectral Model
The attenuation rate term, CQ*r, needs to be applied ina practical manner to the standard New Zealand responsespectral model for subduction-zone earthquakes. The stan-dard McVerry et al. (2000) subduction-zone model is basedon Youngs et al. (1997) and provides a good fit to the avail-able strong-motion records for slab paths to eastern stations(e.g., to stations S1 and S2; Fig. 7). As the estimates of thecoefficients of the geometric attenuation term and the an-elastic attenuation term tend to be strongly correlated in re-gression-based strong-motion models, it is not appropriateto simply add another anelastic attenuation term without re-doing the regressions for the other coefficients.
Therefore the difference in the attenuation compared tothe nonslab paths is added as a modification to the standardmodel. The slab paths to stations S1 and S2 are equivalentto the standard model paths. The difference between the at-tenuation rate on the standard path (i.e., to sites S1 and S2)and that on paths to sites such as S3–S6 then becomes themodification term. The form of the modified New Zealandmodel for subduction zone earthquakes at weak rock sites is
ln SA(T) � lnSA(T)standardNZsubductionzone
� [CQ (T,H ) � CQ (T,H )]r, (15)SITE C STANDARD C
where HC is the centroid depth.An example comparing estimated spectra for a magni-
tude 7.7 earthquake at 150 km depth is shown in Figure 9.The standard spectra are indicated by black lines and themodified spectra by gray lines. Sites S4 and S5 have thesame standard spectra because they are the same distance.The standard and modified spectra are identical for the stan-dard site (S2), because the path (Fig. 5) does not includelow-Q zones. In contrast, both the mantle wedge (S5) andwedge-plus-volcanic (S4) sites show large decreases in ac-celeration spectra for the modified model, with the effectmore pronounced when volcanic crust is sampled. At 0.2 sec(5 Hz), the ln SA is decreased by 1.0 for S5 and by 1.55 forS4, or SA by factors of 2.7 and 4.7, respectively.
The McVerry et al. (2000) model also included a vol-canic-path term in the subduction-zone model for shallowsubduction sources (HC � 50 km), which accounts for theportion of the horizontal path that traverses the TVZ. This iscompared to the CQ modified model for a 50-km-deep eventin Figure 10. The two spectra for the volcanic site (S4) arenearly equivalent, because the path from 50-km depth (Fig.7) is not sampling much of the mantle wedge and theMcVerry et al. (2000) volcanic term produces a similar ad-justment to the CQ term. For the S5 site the standard andmodified spectra are quite different, with the volcanic-path

2660 D. Eberhart-Phillips and G. McVerry
5 10-1
2 5 100
2 5
Spectral Period (Seconds)
5
10-2
2
5
10-1
2
5
Abs
olut
eA
ccel
erat
ion
(g)
M = 7.7
S5 Rh=109km, R=120km, rvol=43kmS4 Rh=97km, R=109km, rvol=33kmStandard model with volcanic path termS5S4Modified Q-based model
Waikato sites M7.7 at 50km depth - Volcanic Path & Modified Spectra
Figure 10. Comparison of modified spectra and standard McVerry et al. (2000)model with volcanic term included, for a 50-km-depth earthquake at sites in the vol-canic zone (S4) and slightly west of the volcanic zone (S5).
term producing a larger adjustment than the CQ term. Thisis because the 3D Q model has a more localized shallowregion of very low Q associated with the volcanic region,and the path from 50-km depth to site S5 largely travelsbelow the zone of highest attenuation (Fig. 7). The exactshape of the high volcanic attenuation region is not welldefined by the coarse 3D model; however it is clear that thehighest attenuation is shallower than 20 km and thus the CQmodified model may be more appropriate for subduction-zone events than applying the volcanic path term. Hence,both for simplicity of implementation and to avoid possibleoverreduction of the spectra for sites with greater pathlengths through the volcanic zone, it is recommended thatthe CQ modified spectra be applied for all subduction-zoneearthquakes, irrespective of whether they are interface, shal-low slab, or deep slab events. Thus the volcanic-path termis not included in the model (equation 15).
Acceleration Spectra for Deep Taupo Eevent
Unfortunately, the New Zealand strong-motion data setcontains few records from sites affected by high attenuationin the mantle, which makes it difficult for us to demonstratethe problem addressed by our modification to the spectralattenuation model. This is partly because until the recentadvent of high-resolution digital accelerographs at a fewsites in the affected region, the strength of shaking in this
region from deep earthquakes was generally insufficient toproduce useful records. Often, the accelerographs did noteven trigger in deep earthquakes that were recorded atgreater distances elsewhere in the country.
One event that has produced useful records demonstrat-ing the effect of high attenuation in the mantle was the Mw
6.0 earthquake of 25 October 1999 20:31 UTC, 161-km deepat an epicentral distance of only 18 km from Taupo. Thisearthquake produced records at several sites in the Napierregion at epicentral distances of about 130–150 km withstronger motions (0.014g–0.042g PGA, typically around0.017g PGA) than at TVZ sites closer to the source (e.g.,0.007g at Taupo and Reporoa, and 0.003g at Rotorua). Sev-eral of the Napier region records are from sites where strongamplification may have occurred from site effects. The rec-ord from the site at Napier Girls High School, on weak rockwith a PGA of 0.019g, typical of rock and shallow stiff soilsites in the area, is selected as a representative motion oflocations in the Napier area where site effects are not ex-pected to be pronounced. Of the three TVZ records, only theTaupo record is suitable for detailed comparison.
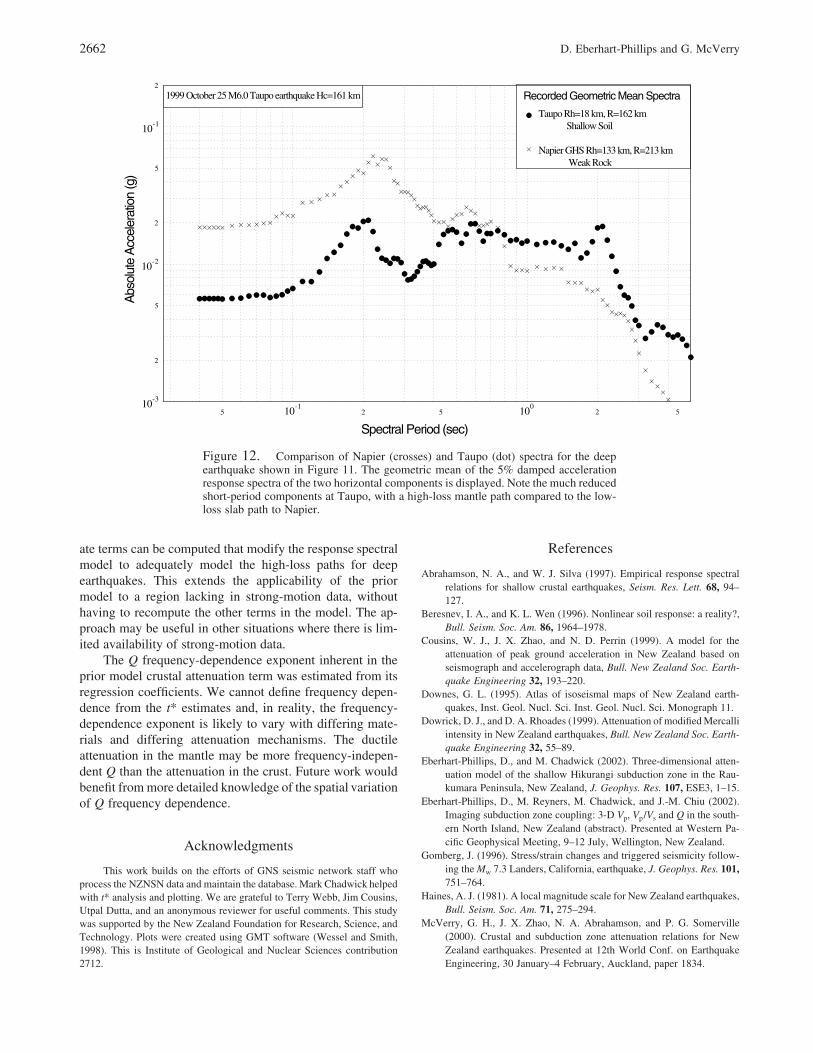
The three-component acceleration records from Taupoand Napier are shown in Figure 11, with different scales forthe accelerations. The Napier record is much stronger, withthe peak value about 3 times larger, even though recordedat a distance of 213 km compared to 162 km for Taupo. The5% damped acceleration response spectra are shown in Fig-

Estimating Slab Earthquake Response Spectra from a 3D Q Model 2661
ure 12. As well as its higher overall amplitude, the Napierrecord clearly contains a relatively greater proportion ofshort-period (high-frequency) content, at periods less thanabout 0.5 sec.
The attenuated spectrum at Taupo fits the modifiedmodel very well for f � 2.5 Hz (T � 0.4 sec), which is therange used for t* and deriving 3D Q. The observed reductionin ln SA ranges from 0.92 to 1.34. The anticipated reductionin ln SA from the modification term ranges from 0.99 to1.22 over the 2.5 to 20-Hz range.
In comparing the waveform plots (Fig. 11), an unusualaspect is the relatively high amplitude of P relative to S atTaupo compared to Napier. The maximum of the verticalcomponent at Taupo is a distinct arrival that comes in shortlyafter the direct P. Thus this is likely to be a near-sourceconverted phase. An S to P conversion at the top of thesubducted slab is a possible cause. Note that the attenuation
rate once the S was converted to P would be reduced by afactor of Vp/Vs (equation 10), which would serve to exag-gerate the amplitude of the converted phase.
Conclusions
The rheology of the Earth is heterogeneous in seismi-cally active regions. This particularly influences attenuationmodels for deep slab earthquakes, which can, therefore, havelong paths through quite different materials for differentsites. Using seismograph network data, 3D Q models can bederived that image the heterogeneous attenuation.
The standard response spectral attenuation model fordeep earthquakes in New Zealand overestimates spectrawhen the path from source to site passes through highlyattenuating zones associated with the mantle wedge andTVZ. Using actual Q-values along specified paths, appropri-
a) Napier b) TaupoEvent: 5 km WNW of Taupo 1999 October 25 20:31 Mw 6.00Dist 133 km Depth 161 Data is unfiltered
1300 10 20 30 40 50 60 70 80 90 100 110 120-70
0
70Comp N16E Peak value: 65.0 mm/s/s
Acc
eler
atio
n (m
m/s
/s)
Time (s)
1300 10 20 30 40 50 60 70 80 90 100 110 120-70
0
70Comp UP Peak value: 46.0 mm/s/s
Acc
eler
atio
n (m
m/s
/s)
Time (s)
Event: 5 km WNW of Taupo 1999 October 25 20:31 Mw 6.00Dist 18 km Depth 161 Data is unfiltered
Comp S45W Peak value: 185.1 mm/s/s
-200 10 20 30 40 50 60 70 80 90 100 110
0
0
200
Acc
eler
atio
n (m
m/s
/s)
Time (s)
Comp UP Peak value: 57.1 mm/s/s
-200 10 20 30 40 50 60 70 80 90 100 110
0
0
200
Acc
eler
atio
n (m
m/s
/s)
Time (s)
Comp N45W Peak value: 167.2 mm/s/s
-200 10 20 30 40 50 60 70 80 90 100 110
0
0
200
Acc
eler
atio
n (m
m/s
/s)
Time (s)1300 10 20 30 40 50 60 70 80 90 100 110 120
-70
0
70Comp S74E Peak value: 55.3 mm/s/s
Acc
eler
atio
n (m
m/s
/s)
a
Figure 11. The three-component acceleration records from 161-km-deep earth-quake, 25 October 1999, at (a) Napier and (b) Taupo stations. The peak value of eachtrace is noted and marked with a circled plus sign. Despite the greater distance fromthe source, the Napier horizontal components are about 3 times stronger than those atTaupo. Note the acceleration scale is increased for Taupo.
2662 D. Eberhart-Phillips and G. McVerry
5 10-1
2 5 10010
-3
2
5
10-2
2
5
10-1
2
Taupo Rh=18 km, R=162 km Shallow Soil
Napier GHS Rh=133 km, R=213 km Weak Rock
1999 October 25 M6.0 Taupo earthquake Hc=161 km Recorded Geometric Mean Spectra
Abs
olut
e A
ccel
erat
ion
(g)
Spectral Period (sec)
2 5
Figure 12. Comparison of Napier (crosses) and Taupo (dot) spectra for the deepearthquake shown in Figure 11. The geometric mean of the 5% damped accelerationresponse spectra of the two horizontal components is displayed. Note the much reducedshort-period components at Taupo, with a high-loss mantle path compared to the low-loss slab path to Napier.
ate terms can be computed that modify the response spectralmodel to adequately model the high-loss paths for deepearthquakes. This extends the applicability of the priormodel to a region lacking in strong-motion data, withouthaving to recompute the other terms in the model. The ap-proach may be useful in other situations where there is lim-ited availability of strong-motion data.
The Q frequency-dependence exponent inherent in theprior model crustal attenuation term was estimated from itsregression coefficients. We cannot define frequency depen-dence from the t* estimates and, in reality, the frequency-dependence exponent is likely to vary with differing mate-rials and differing attenuation mechanisms. The ductileattenuation in the mantle may be more frequency-indepen-dent Q than the attenuation in the crust. Future work wouldbenefit from more detailed knowledge of the spatial variationof Q frequency dependence.
Acknowledgments
This work builds on the efforts of GNS seismic network staff whoprocess the NZNSN data and maintain the database. Mark Chadwick helpedwith t* analysis and plotting. We are grateful to Terry Webb, Jim Cousins,Utpal Dutta, and an anonymous reviewer for useful comments. This studywas supported by the New Zealand Foundation for Research, Science, andTechnology. Plots were created using GMT software (Wessel and Smith,1998). This is Institute of Geological and Nuclear Sciences contribution2712.
References
Abrahamson, N. A., and W. J. Silva (1997). Empirical response spectralrelations for shallow crustal earthquakes, Seism. Res. Lett. 68, 94–127.
Beresnev, I. A., and K. L. Wen (1996). Nonlinear soil response: a reality?,Bull. Seism. Soc. Am. 86, 1964–1978.
Cousins, W. J., J. X. Zhao, and N. D. Perrin (1999). A model for theattenuation of peak ground acceleration in New Zealand based onseismograph and accelerograph data, Bull. New Zealand Soc. Earth-quake Engineering 32, 193–220.
Downes, G. L. (1995). Atlas of isoseismal maps of New Zealand earth-quakes, Inst. Geol. Nucl. Sci. Inst. Geol. Nucl. Sci. Monograph 11.
Dowrick, D. J., and D. A. Rhoades (1999). Attenuation of modified Mercalliintensity in New Zealand earthquakes, Bull. New Zealand Soc. Earth-quake Engineering 32, 55–89.
Eberhart-Phillips, D., and M. Chadwick (2002). Three-dimensional atten-uation model of the shallow Hikurangi subduction zone in the Rau-kumara Peninsula, New Zealand, J. Geophys. Res. 107, ESE3, 1–15.
Eberhart-Phillips, D., M. Reyners, M. Chadwick, and J.-M. Chiu (2002).Imaging subduction zone coupling: 3-D Vp, Vp/Vs and Q in the south-ern North Island, New Zealand (abstract). Presented at Western Pa-cific Geophysical Meeting, 9–12 July, Wellington, New Zealand.
Gomberg, J. (1996). Stress/strain changes and triggered seismicity follow-ing the Mw 7.3 Landers, California, earthquake, J. Geophys. Res. 101,751–764.
Haines, A. J. (1981). A local magnitude scale for New Zealand earthquakes,Bull. Seism. Soc. Am. 71, 275–294.
McVerry, G. H., J. X. Zhao, N. A. Abrahamson, and P. G. Somerville(2000). Crustal and subduction zone attenuation relations for NewZealand earthquakes. Presented at 12th World Conf. on EarthquakeEngineering, 30 January–4 February, Auckland, paper 1834.

Estimating Slab Earthquake Response Spectra from a 3D Q Model 2663
Mooney, H. M. (1970). Upper mantle inhomogeneity beneath New Zea-land: seismic evidence, J. Geophys. Res. 75, 285–309.
New Zealand Geomechanics Society (1988). Guidelines for the Field De-scription of Soils and Rocks in Engineering Use, New Zealand Geo-technical Society, Auckland.
Reyners, M. (1998). Plate coupling and the hazard of large subductionthrust earthquakes at the Hikurangi subduction zone, New Zealand,New Zealand J. Geol. Geophys. 41, 343–354.
Rietbrock, A. (2001). P-wave attenuation structure in the fault area of the1995 Kobe earthquake, J. Geophys. Res. 106, 4141–4154.
Rodriguez-Marek, A., J. D. Bray, and N. Abrahamson (2001). An empiri-cally based geotechnical seismic site response procedure, EarthquakeSpectra 17, 65–87.
Scherbaum, F. (1990). Combined inversion for the three-dimensional Qstructure and source parameters using microearthquake spectra, J.Geophys. Res. 95, 12,423–12,438.
Sharma, M. M., and A. N. Tutuncu (1994). Grain contact adhesion hyster-esis: a mechanism for attenuation of seismic waves, Geophys. Res.Lett. 21, 2323–2326.
Takai, N., H. Umeda, and S. Okada (2000). The method of predicting in-tensity distribution for subduction zones. Presented at Proc. 6th Int.Conf. Seismic Zonation, 12–15 November, Palm Springs, California.
Upton, P., P. Koons, and D. Eberhart-Phillips (2003). Extension and strain-partitioning in an oblique subduction zone, New Zealand: constraintsfrom three-dimensional numerical modeling, Tectonics (in press).
Wessel, P., and W. H. F. Smith (1998). New version of the generic mappingtools released, EOS 79, 579.
Winkler, K. W., and W. F. Murphy, III (1995). Acoustic velocity and at-tenuation in porous rocks, in Rock Physics and Phase Relations: AHandbook of Physical Constants, T. J. Ahrens (Editor), AmericanGeophysical Union, Washington, D.C., 20–34.
Yoshimoto, K., H. Sato, and M. Ohtake (1993). Frequency-dependent at-tenuation of P and S waves in the Kanto area, Japan, based on thecoda-normalization method, Geophys. J. Int. 114, 165–174.
Youngs, R. R., S.-J. Chiou, W. J. Silva, and J. R. Humphrey (1997). Strongground motion attenuation relationships for subduction zone earth-quakes, Seism. Res. Lett. 68, 58–73.
Institute of Geological and Nuclear SciencesPrivate Bag 1930Dunedin, New Zealand
(D.E.-P.)
Institute of Geological and Nuclear SciencesP. O. Box 30368Lower Hutt, New Zealand
(G.M.)
Manuscript received 24 February 2003.


![[PPT]Grillage Analysis for Slab & Pseudo-Slab Bridge Decksenggprog.com/Downloads/Lectures/BridgeEngg/Lecture No. 3... · Web viewTitle Grillage Analysis for Slab & Pseudo-Slab Bridge](https://static.fdocuments.in/doc/165x107/5adedacf7f8b9afd1a8beaa6/pptgrillage-analysis-for-slab-pseudo-slab-bridge-no-3web-viewtitle-grillage.jpg)
