Estimating present and future wildfire pollution in … · Estimating present and future wildfire...
28
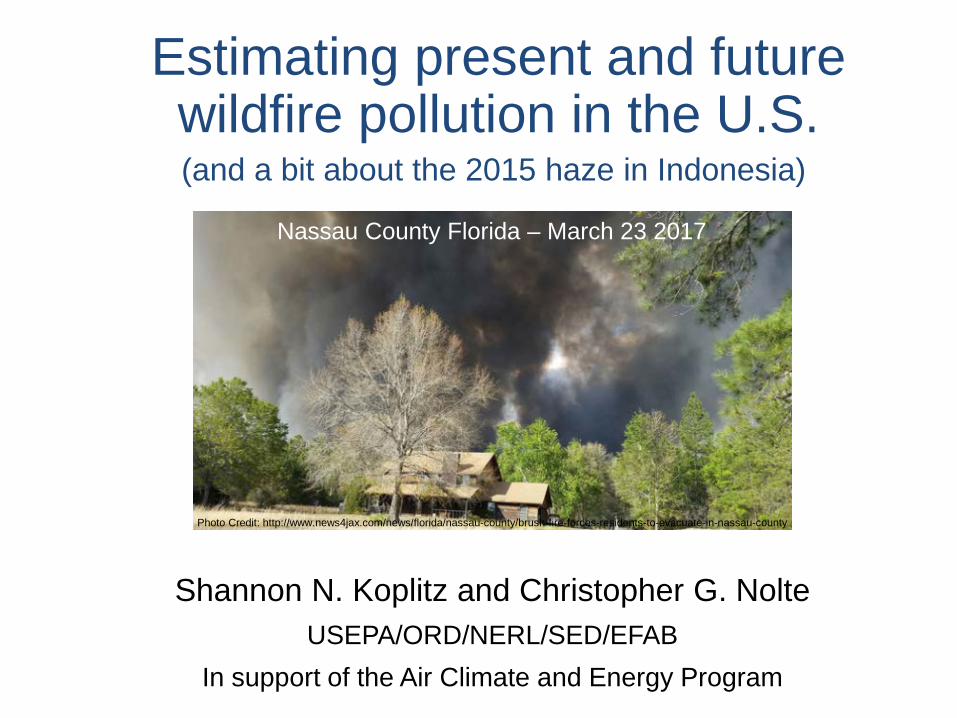
Estimating present and future wildfire pollution in the U.S. Shannon N. Koplitz and Christopher G. Nolte USEPA/ORD/NERL/SED/EFAB In support of the Air Climate and Energy Program (and a bit about the 2015 haze in Indonesia)
Transcript of Estimating present and future wildfire pollution in … · Estimating present and future wildfire...

Estimating present and future wildfire pollution in the U.S.
Shannon N. Koplitz and Christopher G. NolteUSEPA/ORD/NERL/SED/EFAB
In support of the Air Climate and Energy Program
(and a bit about the 2015 haze in Indonesia)

Wildfire pollution is a global issue
2
Fire-related pollution leads to thousands of premature deaths every year.
Johnston et al., 2012
Average deaths per year attributed to fires during 1997-2006

Wildfire pollution is a global issue
3
Fire-related pollution leads to thousands of premature deaths every year.
Johnston et al., 2012
Average deaths per year attributed to fires during 1997-2006
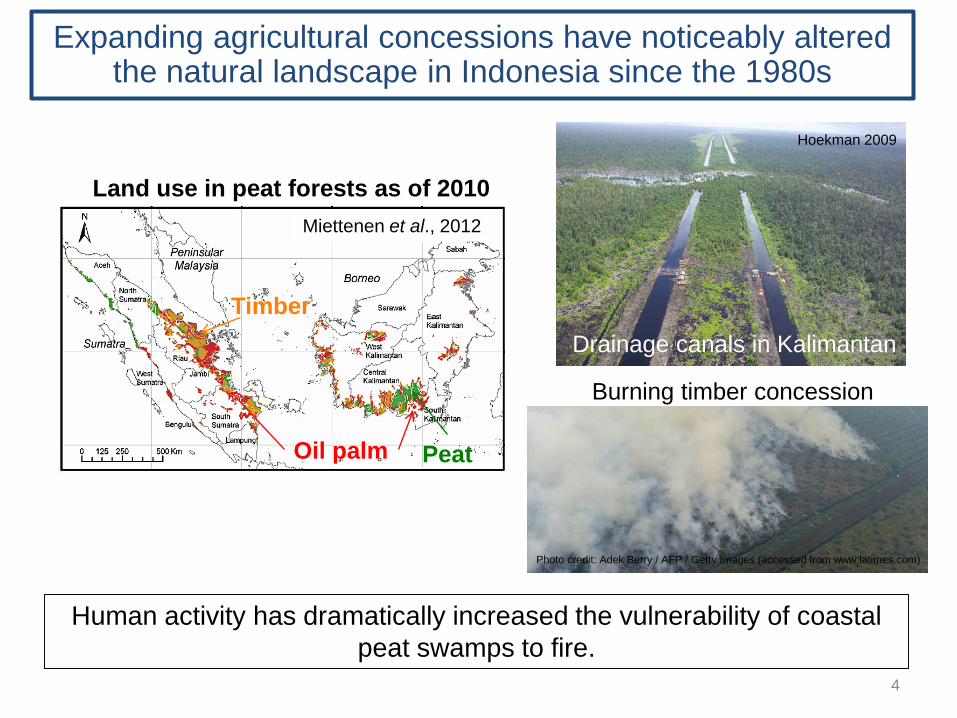
Land use in peat forests as of 2010Miettenen et al., 2012
Oil palm
Timber
Peat
Hoekman 2009
Drainage canals in Kalimantan
Expanding agricultural concessions have noticeably altered the natural landscape in Indonesia since the 1980s
Human activity has dramatically increased the vulnerability of coastal peat swamps to fire.
Burning timber concession
4
Photo credit: Adek Berry / AFP / Getty Images (accessed from www.latimes.com)
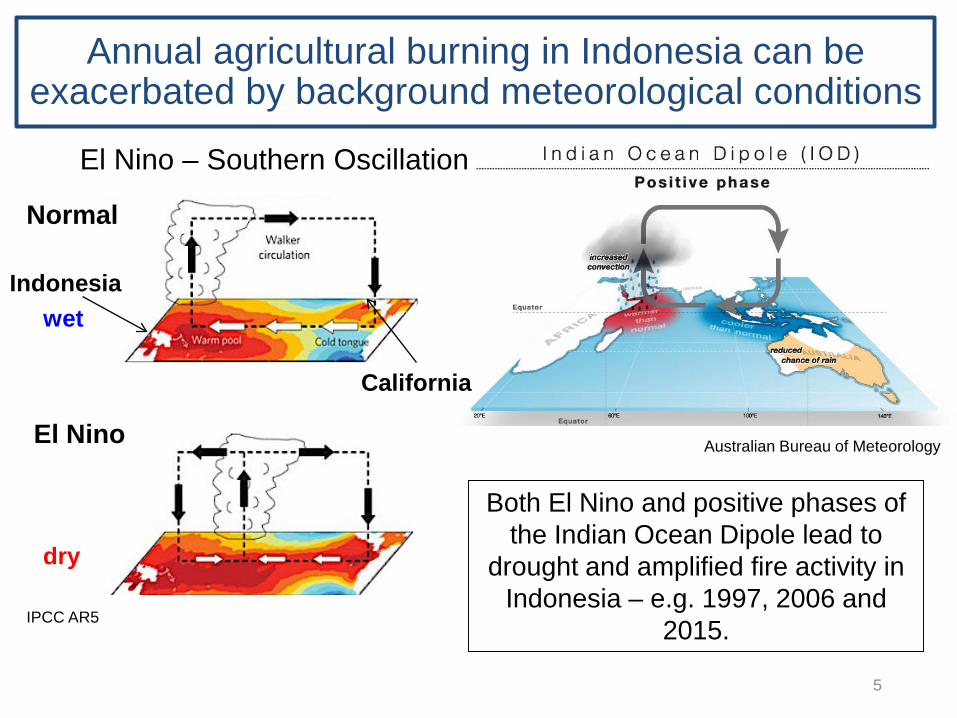
Annual agricultural burning in Indonesia can be exacerbated by background meteorological conditions
5
Source: IPCC AR5
Normal
Indonesia
California
El Nino
wet
dry
IPCC AR5
El Nino – Southern Oscillation
Both El Nino and positive phases of the Indian Ocean Dipole lead to
drought and amplified fire activity in Indonesia – e.g. 1997, 2006 and
2015.
Australian Bureau of Meteorology
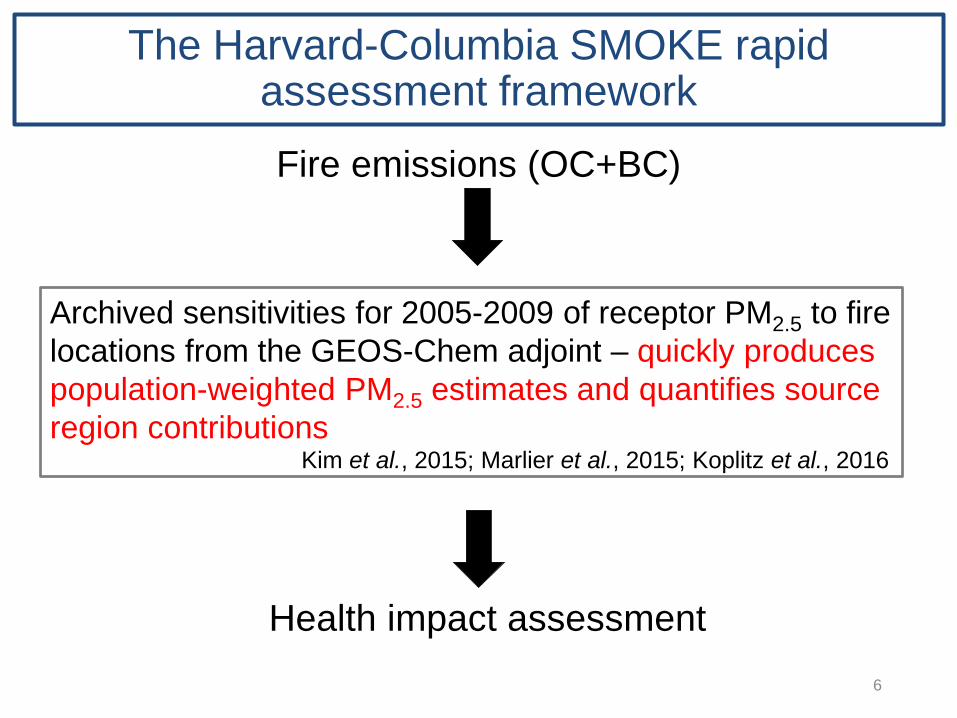
The Harvard-Columbia SMOKE rapid assessment frameworkFire emissions (OC+BC)
6
Archived sensitivities for 2005-2009 of receptor PM2.5 to fire locations from the GEOS-Chem adjoint – quickly produces population-weighted PM2.5 estimates and quantifies source region contributions
Health impact assessment
Kim et al., 2015; Marlier et al., 2015; Koplitz et al., 2016

The 2015 haze in Indonesia is estimated to have led to more than 100,000 PM-related premature deaths
7
Jambi
S. Sumatra
W. Kalimantan
C. Kalimantan
Most of the smoke pollution leading to degraded regional air quality in 2015 was attributed to fire emissions in South Sumatra province.
Koplitz et al., ERL 2016

Fires in the U.S. – a complex landscape
8
Fires can account for more than 30%* of total U.S. PM2.5 emissions. * Based on NEI 2011
Photo: Saul Young/New Sentinel
Tennessee 2016California 2013
Photo: Hoover Volunteer Fire Department (accessed from CNN.com)
Texas 2017Colorado 2012
Photo: @PatrickSandusky (accessed from www.businessindsider.com)
Photo: Dan Bartletti, Los Angeles Times (accessed from www.soperwheeler.com)

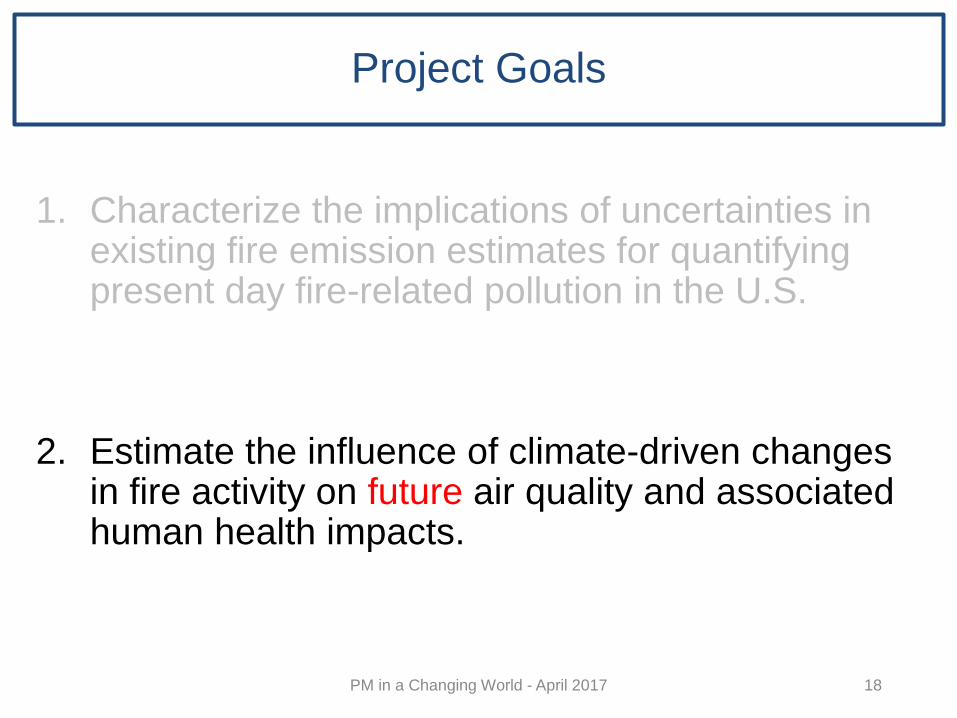
Project Goals
1. Characterize the implications of uncertainties in existing fire emission estimates for quantifying present day fire-related pollution in the U.S.
2. Estimate the influence of climate-driven changes in fire activity on future air quality and associated human health impacts.
9
Project Goals
1. Characterize the implications of uncertainties in existing fire emission estimates for quantifying present day fire-related pollution in the U.S.
2. Estimate the influence of climate-driven changes in fire activity on future air quality and associated human health impacts.
10

Fire emissions in global and regional models are estimated from four key variables.
Es,i,j = BAi,j x FLi,j x CCi,j x EFs
11
To estimate emissions E of chemical species s in grid cell i,j:
Burned area
Fuel load (i.e. how much
biomass is there)
Combustion completeness
(i.e. how much of the available
biomass actually burns)
Emission factor per unit carbon
combusted
Burned area is usually quantified independently of the other three parameters, and can be estimated a variety of ways.
NEI
GFED
NIFC
FINN
MTBS
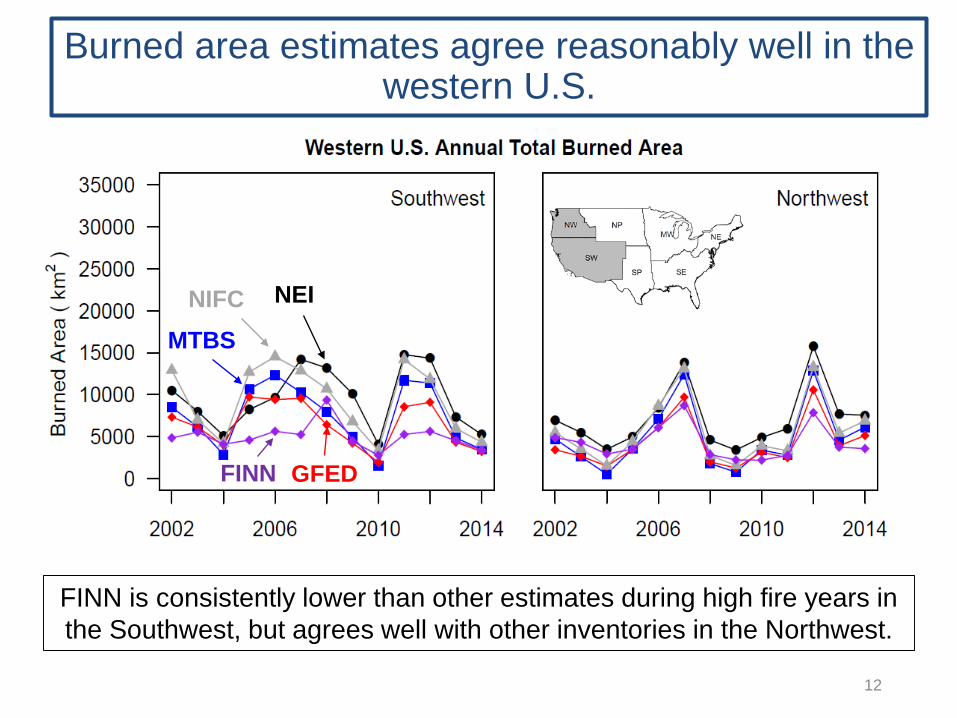
Burned area estimates agree reasonably well in the western U.S.
FINN is consistently lower than other estimates during high fire years in the Southwest, but agrees well with other inventories in the Northwest.
12
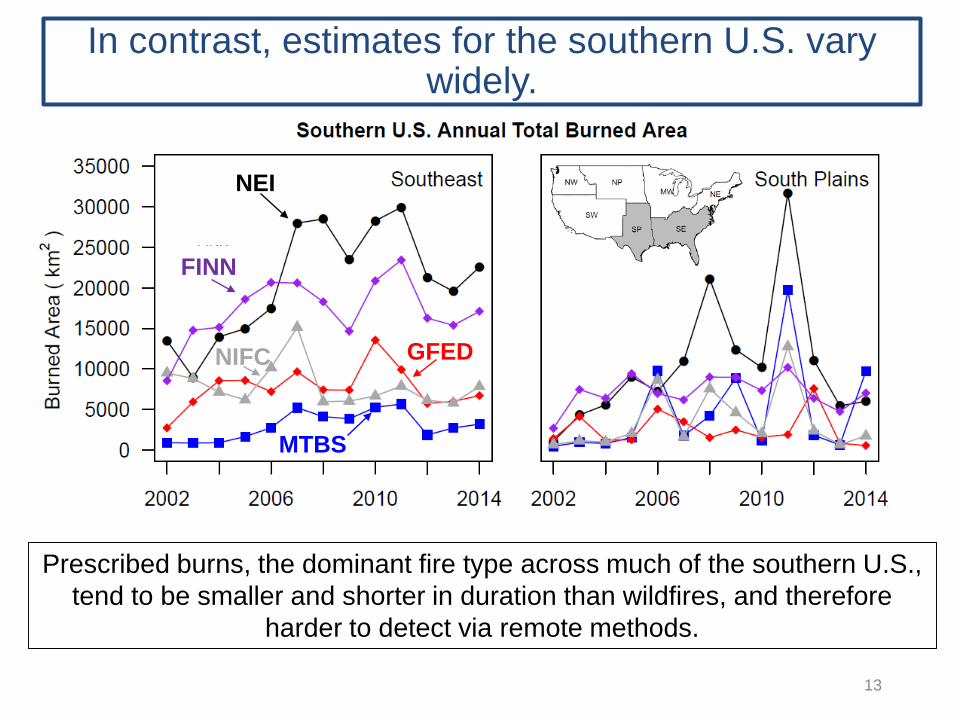
In contrast, estimates for the southern U.S. vary widely.
Prescribed burns, the dominant fire type across much of the southern U.S., tend to be smaller and shorter in duration than wildfires, and therefore
harder to detect via remote methods.
13
NEI
GFEDNIFC
FINN
MTBS
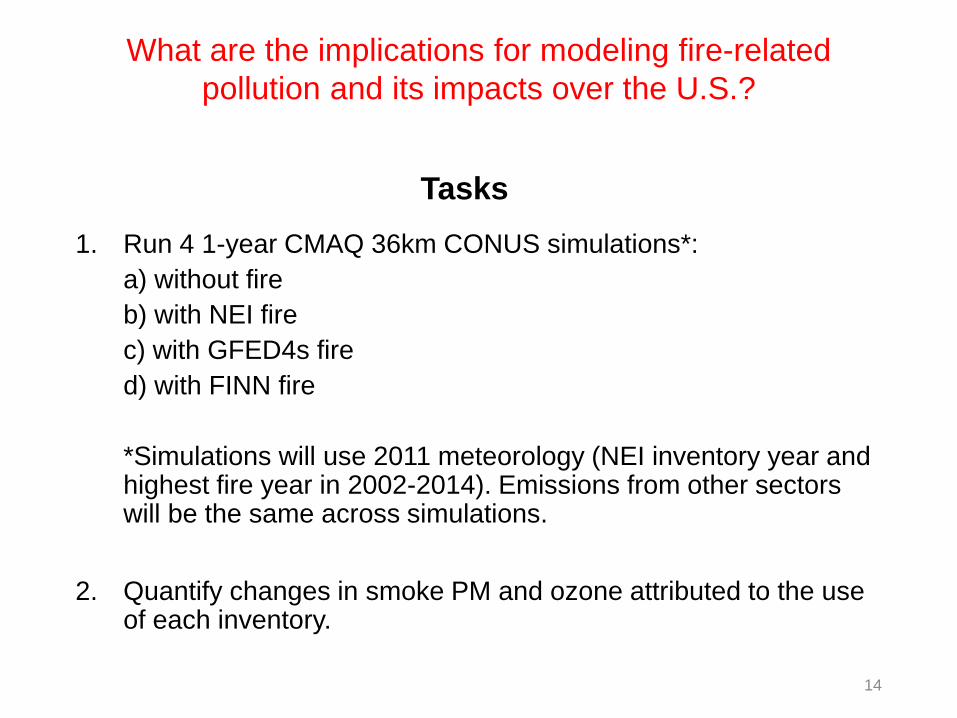
1. Run 4 1-year CMAQ 36km CONUS simulations*: a) without fireb) with NEI firec) with GFED4s fired) with FINN fire
*Simulations will use 2011 meteorology (NEI inventory year and highest fire year in 2002-2014). Emissions from other sectors will be the same across simulations.
2. Quantify changes in smoke PM and ozone attributed to the use of each inventory.
14
What are the implications for modeling fire-related pollution and its impacts over the U.S.?
Tasks

15
Modeled surface PM2.5 from fires during March 2011
NEI – FINN
w/ NEI w/ FINN
µg m-3
µg m-3
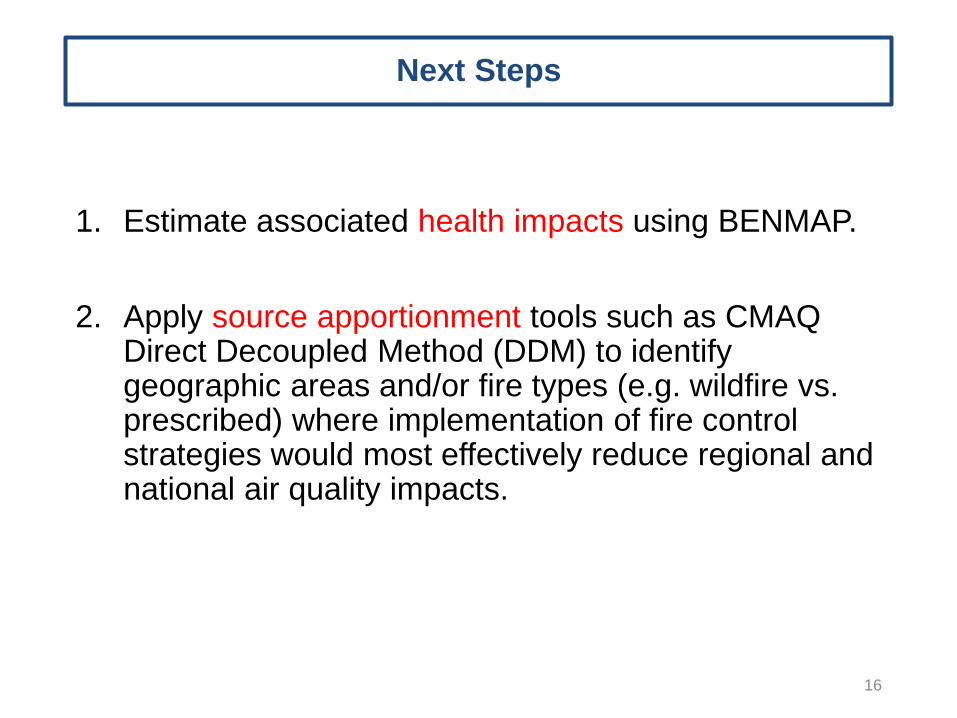
Next Steps
1. Estimate associated health impacts using BENMAP.
2. Apply source apportionment tools such as CMAQ Direct Decoupled Method (DDM) to identify geographic areas and/or fire types (e.g. wildfire vs. prescribed) where implementation of fire control strategies would most effectively reduce regional and national air quality impacts.
16

Extra Slides
17
Project Goals
1. Characterize the implications of uncertainties in existing fire emission estimates for quantifying present day fire-related pollution in the U.S.
2. Estimate the influence of climate-driven changes in fire activity on future air quality and associated human health impacts.
PM in a Changing World - April 2017 18

Most process-based land cover change models were not designed to reproduce fire activity at timescales
relevant for air quality.
PM in a Changing World - April 2017 19
How can we best represent the influence of future land cover and future meteorology on fire activity in one approach?
MC2 results courtesy of John Kim, USFS
NEI
NIFC
MC2
Estimating present and future wildfire pollution in the U.S.
Shannon N. Koplitz and Christopher G. NolteUSEPA/ORD/NERL/SED/EFAB
In support of the Air Climate and Energy Program
(and a bit about the 2015 haze in Indonesia)
Photo Credit: http://www.news4jax.com/news/florida/nassau-county/brush-fire-forces-residents-to-evacuate-in-nassau-county
Nassau County Florida – March 23 2017
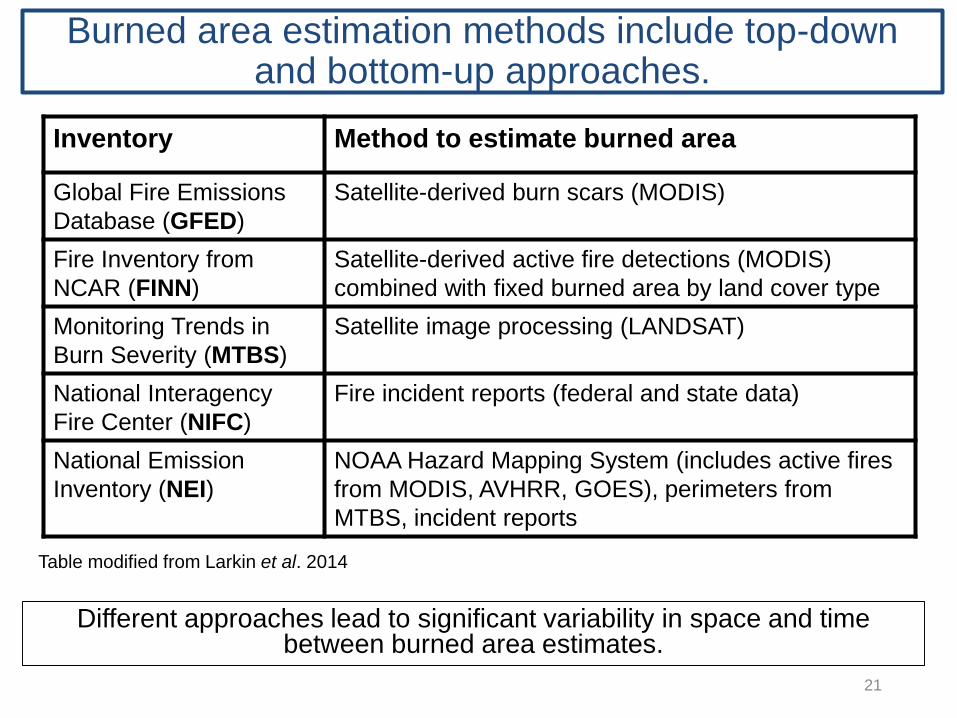
Burned area estimation methods include top-down and bottom-up approaches.
Different approaches lead to significant variability in space and time between burned area estimates.
21
Inventory Method to estimate burned area
Global Fire Emissions Database (GFED)
Satellite-derived burn scars (MODIS)
Fire Inventory from NCAR (FINN)
Satellite-derived active fire detections (MODIS) combined with fixed burned area by land cover type
Monitoring Trends in Burn Severity (MTBS)
Satellite image processing (LANDSAT)
National Interagency Fire Center (NIFC)
Fire incident reports (federal and state data)
National Emission Inventory (NEI)
NOAA Hazard Mapping System (includes active fires from MODIS, AVHRR, GOES), perimeters from MTBS, incident reports
Table modified from Larkin et al. 2014
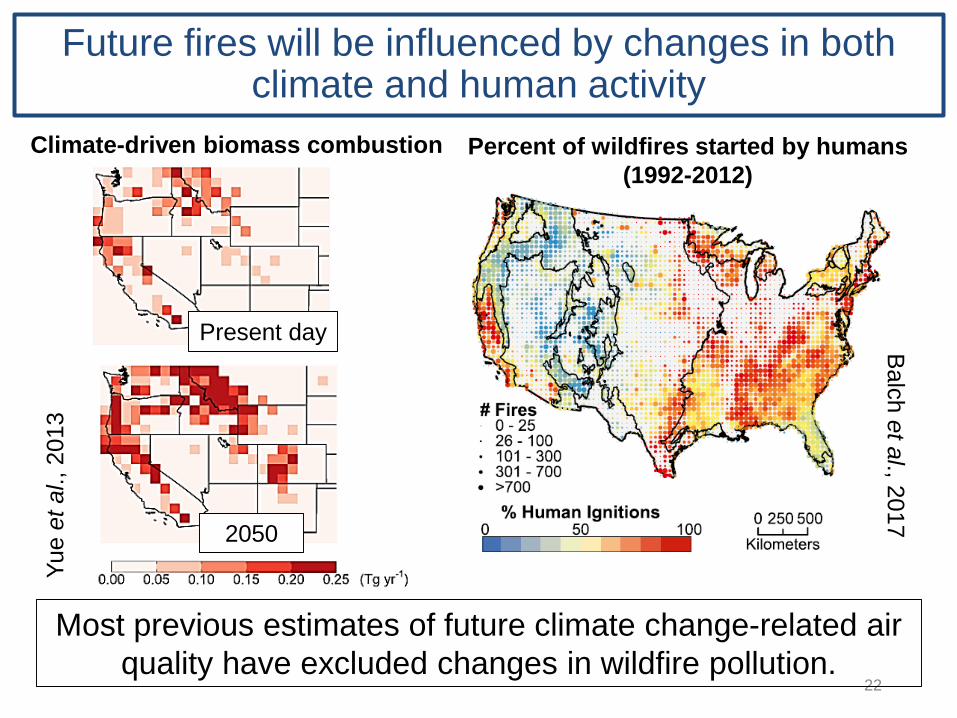
Future fires will be influenced by changes in both climate and human activity
22
Balch et al., 2017
Percent of wildfires started by humans (1992-2012)
Yue
et a
l., 2
013
Climate-driven biomass combustion
Present day
2050
Most previous estimates of future climate change-related air quality have excluded changes in wildfire pollution.
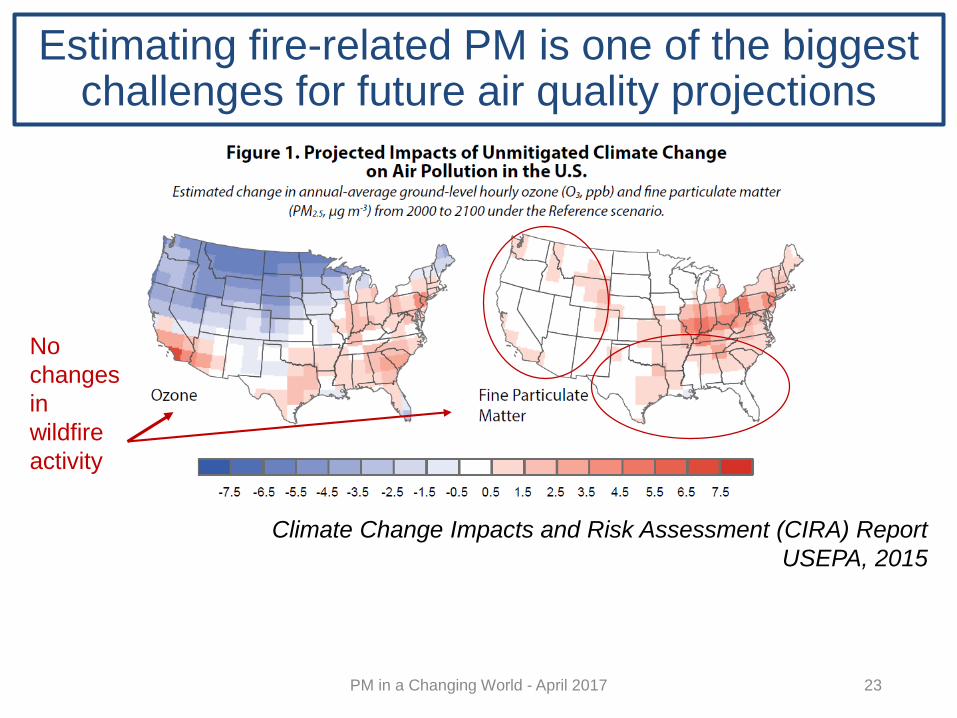
Estimating fire-related PM is one of the biggest challenges for future air quality projections
PM in a Changing World - April 2017 23
No changes in wildfire activity
Climate Change Impacts and Risk Assessment (CIRA) Report USEPA, 2015
24
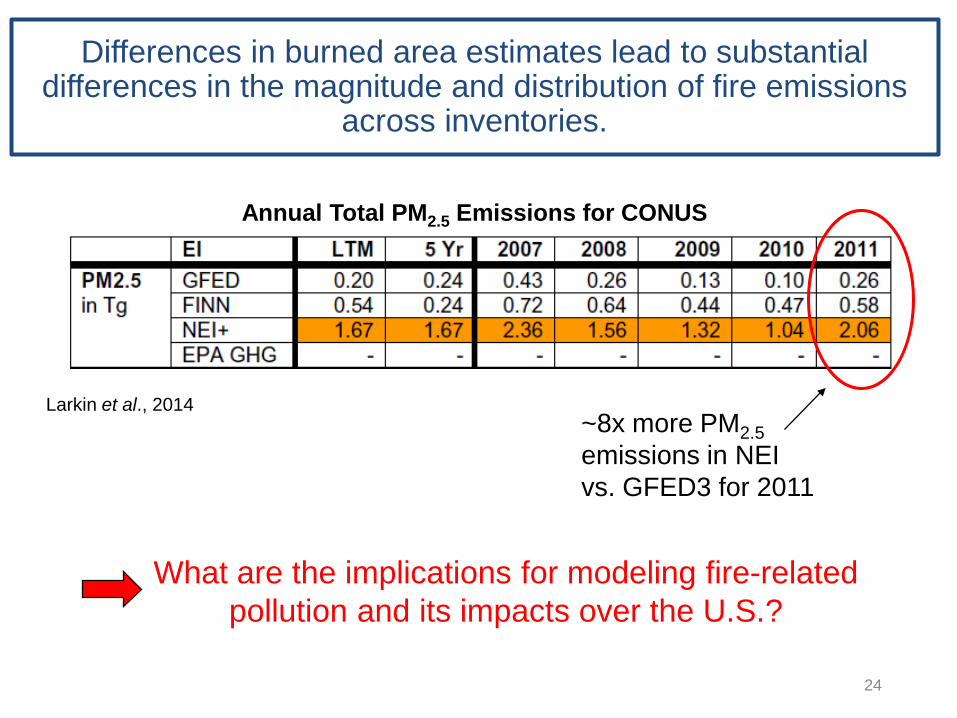
Differences in burned area estimates lead to substantial differences in the magnitude and distribution of fire emissions
across inventories.
What are the implications for modeling fire-related pollution and its impacts over the U.S.?
~8x more PM2.5emissions in NEI vs. GFED3 for 2011
Larkin et al., 2014
Annual Total PM2.5 Emissions for CONUS
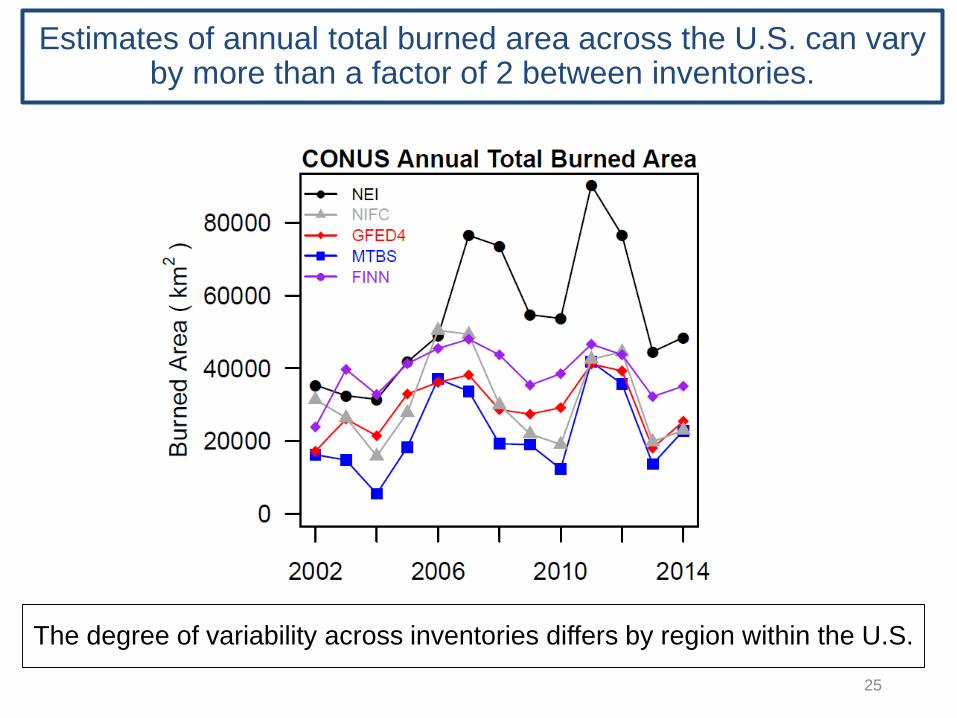
Estimates of annual total burned area across the U.S. can vary by more than a factor of 2 between inventories.
The degree of variability across inventories differs by region within the U.S.
25
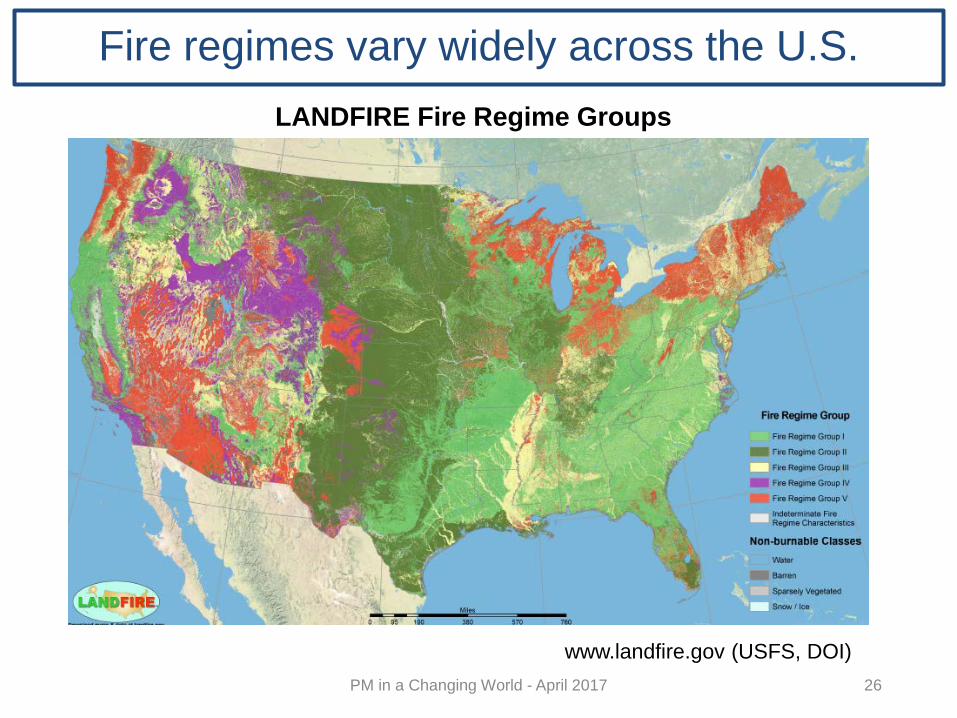
Fire regimes vary widely across the U.S.
PM in a Changing World - April 2017 26
www.landfire.gov (USFS, DOI)
LANDFIRE Fire Regime Groups

Fire activity is influenced by a combination of land cover and meteorology
Capturing both the land cover dynamics and the changes in weather patterns that are relevant for fire activity in one model is extremely difficult.
PM in a Changing World - April 2017 27
Fuel characteristics(monthly/yearly/decadal)
Weather conditions(daily/hourly)

Next Steps
1. Refine approach for estimating future fire emissions in the U.S.
2. Use CMAQ to simulate changes in future PM and ozone pollution from climate-driven fire activity
PM in a Changing World - April 2017 28