ESTIMATING NET INTERRACIAL MOBILITY IN THE UNITED …
41
2 ESTIMATING NET INTERRACIAL MOBILITY IN THE UNITED STATES: A RESIDUAL METHODS APPROACH Anthony Daniel Perez* Charles Hirschman* This paper presents a residual methods approach to identifying social mobility across race/ethnic categories. In traditional de- mographic accounting models, population growth is limited to changes in natural increase and migration. Other sources of pop- ulation change are absorbed by the model residual and can be es- timated only indirectly. While these residual estimates have been used to illuminate a number of elusive demographic processes, there has been little effort to incorporate shifts in racial identi- fication into formal accounts of population change. In light of growing evidence that a number of Americans view race/ethnic identities as a personal choice, not as a fixed characteristic, mobil- ity across racial categories may play important roles in the growth of race/ethnic subpopulations and changes to the composition of the United States. To examine this potential, we derive a reduced- form population balancing equation that treats fertility and inter- national migration as given and estimates survival from period life table data. After subtracting out national increase and net interna- tional migration and adjusting for changes in racial measurement This research has been supported by a grant from the National Insti- tute of Child Health and Human Development (HD47289). An earlier version of this article was presented at the 2008 annual meeting of the American Socio- logical Association in Boston. Direct correspondence to Anthony Daniel Perez at [email protected] or Charles Hirschman at [email protected]. *University of Washington 31
Transcript of ESTIMATING NET INTERRACIAL MOBILITY IN THE UNITED …
2ESTIMATING NET INTERRACIALMOBILITY IN THE UNITEDSTATES: A RESIDUAL METHODSAPPROACH
Anthony Daniel Perez*Charles Hirschman*
This paper presents a residual methods approach to identifyingsocial mobility across race/ethnic categories. In traditional de-mographic accounting models, population growth is limited tochanges in natural increase and migration. Other sources of pop-ulation change are absorbed by the model residual and can be es-timated only indirectly. While these residual estimates have beenused to illuminate a number of elusive demographic processes,there has been little effort to incorporate shifts in racial identi-fication into formal accounts of population change. In light ofgrowing evidence that a number of Americans view race/ethnicidentities as a personal choice, not as a fixed characteristic, mobil-ity across racial categories may play important roles in the growthof race/ethnic subpopulations and changes to the composition ofthe United States. To examine this potential, we derive a reduced-form population balancing equation that treats fertility and inter-national migration as given and estimates survival from period lifetable data. After subtracting out national increase and net interna-tional migration and adjusting for changes in racial measurement
This research has been supported by a grant from the National Insti-tute of Child Health and Human Development (HD47289). An earlier versionof this article was presented at the 2008 annual meeting of the American Socio-logical Association in Boston. Direct correspondence to Anthony Daniel Perez [email protected] or Charles Hirschman at [email protected].
*University of Washington
31
32 PEREZ AND HIRSCHMAN
and census coverage, we argue that the remaining error of closureprovides a reasonable estimate of net interracial mobility amongthe native born. Using recent U.S. Census and ACS microdata, weillustrate the impact that identity shifts may have had on the growthof race/ethnic subpopulations in the past quarter century. Find-ings suggest a small drift from the non-Hispanic white populationinto race/ethnic minority groups, though the pattern varies by ageand between time periods.
Population change is a natural preoccupation of sociological inquiry.The dynamics of natural increase and migration shape the size and struc-ture of populations, and the interplay between these processes forms thecore logic of demographic accounting. Armed with basic methods suchas the population balancing and renewal equations, demographers rou-tinely construct forecasts of future populations, provide estimates ofmigratory flows, evaluate the coverage and accuracy of census enumer-ations, and help shed light on population dynamics from the distantpast using fragmentary data sources. In this paper, we extend thesemethods to measure net mobility across race and ethnic categories.
We begin by reviewing different ways in which populations canbe defined, noting that race/ethnicity blurs the line between a fixedcharacteristic and a flexible identity. After outlining some conceptualand methodological challenges that race poses for traditional demo-graphic accounting models, we devise a residual methods approach toestimating net flows between race/ethnic groups over time. We thenillustrate the feasibility of the method using recent U.S. Census andAmerican Community Survey data.
1. DEMOGRAPHIC ACCOUNTING AMONG DIFFERENTTYPES OF POPULATIONS
Though defined at particular points in time and space, populations arealways in motion. Growth and decline largely hinge on the balance oftwo biological processes—fertility and mortality—though geographicmobility often plays an integral role. The interplay between these threeprocesses governs the logic of demographic accounting, as shown in
δP = Births − Deaths + Immigrants − Emigrants, (1)
which states that the total change in any population is simply the sum ofnatural increase (births minus deaths) and net migration (in-migrants

ESTIMATING NET INTERRACIAL MOBILITY 33
minus out-migrants). This formal identity, known as the population bal-ancing equation, is one of the oldest and most basic tools of demographicaccounting.
The logic of the balancing equation easily extends to subpop-ulations defined by ascribed characteristics—those that remain fixedthroughout the life course (sex, birthplace, etc.) or that change in a pre-dictable pattern (e.g., age). Subpopulations defined by achieved char-acteristics present a more complex undertaking (Ryder 1964; Schnore1961), since individuals can enter and exit these populations throughchanges in social status (e.g., from married to divorced). Both the num-ber and timing of status transitions confound the simple logic of de-mographic accounting. A given individual can be counted in differ-ent populations (e.g., married versus unmarried) throughout the lifecourse, and a given status (e.g., all unmarried persons) can apply todifferent types of persons (never married versus divorced). Still, withsimplifying assumptions about life course changes, demographic ac-counting methods can be adapted to measure components of changewithin populations defined by achieved characteristics, such as occu-pation and religious affiliation (Duncan 1963; Fischer and Hout 2006,ch. 8).
While the accounting framework is robust, the methodologyoffers little insight on whether a particular population characteristicshould be treated as ascribed or achieved. Race (or race/ethnicity),1 forexample, is widely included as an ascribed characteristic in demographicaccounts. A popular demography textbook lists race, along with groupsdelineated by sex and nativity, as common examples of “populations de-fined by characteristics fixed at birth” (Preston et al. 2001:2). In keepingwith this perspective, the Census Bureau routinely projects the futurerace/ethnic composition of the American population (U.S. Census Bu-reau 2008), and mainstream media outlets are often quick to relay these
1 Unless otherwise noted, we use “race” and “race/ethnicity” inter-changeably throughout the text. While race and ethnicity can be viewed as con-ceptually distinct (e.g., race is more often associated with physical appearance),the two concepts often serve the same function. Many white ethnic groups wereconsidered distinct “races” or peoples at various points in time (Waters 1990), andmany ethnic and national origin groups (Chinese, Korean, etc.) are defined as raceson current census forms (see Appendix A). Likewise, Hispanics, the sole “ethnic”group defined by current guidelines (OMB 1997), are often treated as a distinct“race”(coequal with non-Hispanic whites, blacks, etc.) in published research andpublic consciousness (Logan 2004; Perez 2008).

34 PEREZ AND HIRSCHMAN
projections as “official” forecasts of America’s racial future some 20,30, even 40 years out (Roberts 2008). These projections, and the cov-erage they receive, reinforce the idea that the racial identities recordedin the census and other data sources are exogenous to the individualand subject to uniform rules of inheritance. These assumptions raisea number of conceptual and practical concerns, however (Hirschman2002).
2. THE CHALLENGE OF RACE/ETHNICITYFOR DEMOGRAPHIC ACCOUNTING
Concepts of race and ethnicity have experienced a dramatic shift awayfrom once widely held beliefs that identities are solely a function of bio-logical inheritance or ancestry. The critical backlash against ideologicalracism in the wake of World War II signaled the downfall of essentialistthinking about race (Fredrickson 2002), and in the decades that fol-lowed, there emerged a growing recognition of the cultural and politicalunderpinnings of racial and ethnic identities (Hirschman 2004). Today,not only are race and ethnicity primarily viewed as social constructs,but there is also increasing evidence that race/ethnic identities can varyacross generations, and possibly over the life course of individuals.
Though several factors contribute to the ambiguity ofrace/ethnic identities, none is more important than the blurring ofgroup boundaries through population admixture. Ethnic blending ismost often attributed to intermarriage and the gradual absorptionof new immigrant groups. Accordingly, more nuanced projections ofAmerica’s race/ethnic diversity include a range of estimates using alter-nate assumptions about future levels of immigration and intermarriage(Edmonston and Passel 1994; Edmonston et al. 2002; Gibson 1992).While these projections improve upon those released by the census, re-cent intermarriage may not fully capture the mixed ancestry of manyAmericans (Perez and Hirschman 2009), particularly those whose eth-nic descent is shrouded in murky and often painful histories, such as theabsorption of indigenous peoples and the prevalence of forced sexualunions between plantation-era property owners and slaves (Davis 1991;Spencer 2006).
Only fragments of Americans’ race/ethnic complexity are re-flected in the statistical record. Modern census-taking relies on

ESTIMATING NET INTERRACIAL MOBILITY 35
“mail-in” questionnaires that are filled out by individuals, so the deci-sion to report a particular identity, but not others, is largely a matterof personal choice. This pattern is particularly well documented forpersons of mixed European ancestry, who comprise the majority ofnon-Hispanic whites in the United States (Alba 1990). Most whitesoversimplify their ancestral roots on the census and social surveys, andthe selective reporting of certain ancestries stems from a number offactors, including personal sentiments about favored relatives and holi-days (Waters 1990), popular stereotypes about ethnic groups (Hout andGoldstein 1994; Perry 2002), and at times the mere listing of particularnationalities (e.g., Irish, Italian) on the census form, which some mayinterpret as suggestions for how to identify (Farley 1991).
With socioeconomic divisions between white ethnic groups hav-ing all but disappeared from contemporary American life (Alba 1990),the blurring of ethnic boundaries is not only reasonable, it is exactlywhat the popular image of a “melting pot” society would predict(Bonnett 1998; McDermott and Samson 2005). Racial identities, whichare usually associated with physical appearance, are not as malleableas cultural or ancestral ties (Nagel 1996), though there are many simi-larities in the ways race and ethnicity have functioned throughout U.S.history (see footnote 1). While African ancestry is commonly associatedwith the one drop rule that makes “black” identity mandatory (Davis1991; Hollinger 2005), many persons of mixed African and Europeandescent identified as multiracial in the eighteenth and early nineteenthcenturies (Williamson 1980), while others chose to “pass” into the whitepopulation to escape racial oppression (Davis 1991; Piper 1992). In ananalysis of census race responses among children with white and Asianparents, Xie and Goyette (1997) find that the choice of race is largely op-tional, although language, immigrant generation, and surname all playa role in how biracial children are classified. Among Native Americans,population growth in recent censuses so vastly outpaced expectationsthat researchers could only attribute the excess growth to changes inracial self-classification among persons with partial indigenous ances-try (Eschbach 1993; Eschbach 1995; Harris 1994; Nagel 1996; Passel1976, 1996; Passel and Berman 1986; Snipp 1997). Race and ethnic-ity also seem to be especially fluid among children transitioning toadulthood, as recent studies have shown that adolescents can changeidentities even within short time periods (Harris and Sim 2002; Perez2008).
36 PEREZ AND HIRSCHMAN
The ambiguities in race/ethnic reporting are compounded byfrequent changes and inconsistencies in the system of race/ethnicmeasurement and classification (Ferrante and Brown 1998; Perez andHirschman 2009; Perlmann and Waters 2002). Both the categories andmethods by which race is measured vary between data sources and overtime (Office of Management and Budget 1977, 1997; Schenker 2003).For example, Passel (1976) notes that the excess population growthamong American Indians was first observed in the “mail-in” census of1960—the first to heavily rely on self-classification, rather than enu-merator observation, to identify the race of household members. Thedecision to allow respondents to report multiple races was also a ma-jor departure from earlier census forms (Farley 2002), as it increasedthe minimum number of categories from five in 1990 to more than 60(due to combinations) in 2000. The Census Bureau implemented thesechanges in time for the 2000 Census, but other statistical agencies weregiven additional time to adopt the new rules (Office of Managementand Budget 1997). Compliance remains uneven to this day.
As argued in earlier work (Perez and Hirschman 2009), the dif-ficulties in defining and measuring race/ethnic identities cast suspicionon most, if not all, projections of the future race/ethnic diversity of theUnited States. The potential for mobility across categories challengesthe conventional wisdom that treats race/ethnicity as an ascribed char-acteristic in population accounting models. At the same time, thesechallenges provide an opportunity to expand the demographic toolkitto incorporate identity shifts into formal accounts of population change.Doing so requires a new analytic starting point, however—one that ex-plicitly recognizes that while race may be seen as an ascriptive attributeby the majority of the population, there is a minority, of unknown mag-nitude, for whom race is a social identity that can change over the lifecourse.
With minor revisions, demographic accounting can accommo-date both types of persons, as shown in
δP =n∑
k=1
δPk,
where k denotes each race/ethnic group, and
δPk = Bk − Dk + Ik − Ek + εk. (2)
ESTIMATING NET INTERRACIAL MOBILITY 37
This simple decomposition of (1) acknowledges that most persons en-ter race/ethnic subpopulations through birth or immigration and exitthrough death or emigration—just as they do in the broader popula-tion. Unlike individuals in the total population, however, they can alsotransition in or out of racial groups by switching identities, a processwe refer to as interracial mobility. Under these circumstances, naturalincrease and international migration provide a biased portrait of popu-lation change to race/ethnic groups.2 It is therefore necessary to includethe error term εk, which restores the equality between the right and leftsides of the balancing equation. This term, referred to as the error ofclosure (EOC) in demographic accounting (Preston et al. 2001), canarise for two reasons: measurement error and model misspecification.
The former occurs whenever data from various parts of the bal-ancing equation are drawn from different sources. One popular ap-proach, for example, is to compare the observed population changebetween censuses with the expected changes based on vital statisticsand other independent data sources. This comparison is the founda-tion of a highly influential method of population accounting knownas demographic analysis (Coale 1955), which remains a popular toolfor census coverage evaluation to this day (Himes and Clogg 1992).Like the census, demographic data also contain inaccuracies, andthe residual term absorbs these errors as well as errors in censuscoverage.
The EOC also absorbs any components of population changethat are not specified in the balancing equation, which defines totalpopulation change as the sum of its components. From this zero-sumproperty it follows that any input left out of the balancing equationcan be approximated by subtracting known sources of change from thetotal population change in a given time period. By this logic, the EOCprovides a reasonable, albeit indirect, estimate of unknown sources ofpopulation change, provided known sources are measured with littleerror. This estimation strategy, known as the residual method (hereafterRM), has a rich intellectual tradition among demographers, who havelong relied upon indirect estimates of unmeasured sources of populationchange.
2 Broader population change would not be biased by persons exchangingidentities between racial subpopulations, since the total number of persons remainsunchanged.

38 PEREZ AND HIRSCHMAN
Hamilton (1966) reports that population researchers have beenusing residual methods since the early twentieth century. Demographersroutinely subtracted the difference between births and deaths (net natu-ral increase) from total population change to obtain residual estimatesof internal migration (Hart 1921; Thornthwaite 1934). The scope of un-documented immigration also came to light through residual analysis,given the larger than expected counts of Latino and Asian immigrantsin the 1980 Census (Fay et al. 1988). Estimates of undocumented immi-gration can be obtained by subtracting legally resident foreign nationalsfrom the total foreign-born population and then adjusting the differ-ence to account for the undercount of undocumented immigrants inthe census (Passel et al. 2004; Passel and Woodrow 1987). Current esti-mates of unauthorized immigration rely on RM estimation of this type(U.S. Department of Homeland Security 2005), as do most estimatesof foreign- and native-born emigration (Ahmed and Robinson 1994;Kraly 1998; Mulder et al. 2002; Mulder 2003; Warren and Passel 1987;Warren and Peck 1980).
A handful of studies have also used residual methods to exam-ine unexpected changes in the size of race/ethnic groups. In the earlytwentieth century, RM was used to estimate rates of “white passing”among persons with mixed European and African ancestry (Hart 1921;Herskovits 1928), and recent studies of American Indians have at-tributed much of the growth since 1960 to changes in self-classificationamong persons with partial indigenous ancestry (Eschbach 1993, 1995;Harris 1994; Nagel 1996; Passel 1976, 1996; Passel and Berman 1986;Snipp 1989). A recent report echoes the risks posed by inconsistenciesin racial classification more broadly:
DA [demographic analysis] estimates of net undercountwill be biased if persons who are classified as Black inDA are reported as another race in the census. Weneed to conduct more research to assess the degreeof inconsistency and identify ways this “classificationerror” can be minimized. (Robinson 1996)
While it is important to consider individual preferences, andchanges thereto, as a viable source of change to race/ethnic sub-populations, neither the census nor demographic data contain direct

ESTIMATING NET INTERRACIAL MOBILITY 39
measures of identity preference, life histories of race/ethnic identifi-cation, or repeated measures of race/ethnicity at the individual level.Since the probability of switching races cannot be calculated withoutsuch measures, residual methods cannot be used to estimate interracialmobility directly. Only aggregate shifts in the size and composition ofrace/ethnic groups are observed. Interracial mobility can be inferredfrom these shifts, but only after careful evaluation of other potentialexplanations, including sources of measurement error. Furthermore,aggregate estimates of net interracial mobility must be interpretable interms of changing preferences for particular race/ethnic identities.
3. A REDUCED-FORM POPULATION ACCOUNTINGMODEL
Empirically, it is difficult to disentangle identity shifts from errors in themeasurement and estimation of population dynamics, since all are ab-sorbed by a common residual term. To minimize competing sources ofclosure error, we propose a reduced-form equation that estimates resid-ual change among the native born, which we define as the gap betweenobserved and expected survivorship between one census (time 1) andthe next (time 2).3 After adjusting the EOC for intercensal changes inracial measurement and coverage, the remaining closure error providesa reasonable estimate of net interracial mobility for each race/ethnicgroup.
In formal demographic accounting, each population process isestimated from distinct sources (e.g., birth and death records). Sinceour goal is to minimize sources of measurement error, we substitutedemographic estimates of fertility and migration with observed censuscounts of each. Changes in the foreign-born population between t1 andt2 provide a net measure of international migration for each race/ethnicgroup,4 as shown in
MkT = P f bkt2
− P f bkt1
, (3)
3 For the Census 2000 cohort, t2 estimates are derived from the 2006American Community Survey.
4 This simplification ignores native-born emigration and pools foreign-born emigration and deaths.
40 PEREZ AND HIRSCHMAN
where M represents net migration, T is the length of the interval betweent1 and t2, and Pfb is the population of foreign-born persons. Similarly,intercensal births to each race/ethnic subpopulation are defined as
BkT =T−1∑x=0
Pnbkxt2, (4)
where x is age in years and Pnb is the population of native-born persons.By assuming P f b
kt2 − P f bkt1 to be equal to IkT − EkT , it follows from
(2), (3), and (4) that
δPkT − BkT − MkT = −DnbkT + εkT, (5)
where DnbkT
represents the native-born deaths to each race/ethnic sub-population (foreign-born deaths are absorbed by Mk). In other words,after subtracting births and changes to the foreign-born populationbetween censuses, the balance of population change accrues to native-born mortality and the EOC. Since the three left-hand values in (5) aremeasured directly from the census, − Dnb
kT + εkT is identified, but deathsare confounded with errors in this combined quantity. Separating thetwo requires an independent measure of mortality. Our estimates uselife table survival ratios to project each race/ethnic population forwardthrough time (Arias 2002, 2006; National Center for Health Statistics1985, 1997).5 Since life tables are available for detailed age groups, thetotal number of deaths is simply the sum of the age-specific deaths toeach native-born census population, or
DnbkT =
90+∑x=0
DnbkTx =
89∑x=0
Tqx Pnbx + Tq90+ Pnb
90+
=89∑
x=0
[(1 − Lx+T
Lx
)Pnb
x
]+
[(1 − T90+T
T90
)Pnb
90+
], (6)
where T is equal to the length of the interval between censuses and xequals age in years (subscript k for race/ethnic group omitted from the
5 Specific survival rates are available only for whites and blacks; popula-tion averages are used for other groups.

ESTIMATING NET INTERRACIAL MOBILITY 41
right-hand side for simplicity). The quantity Tqx is the probability ofdying between the ages of x and x + T , which can be interpreted as theproportion of each census-cohort (by age and race) that is not expectedto survive to the next time point (see Appendix B for additional details).
Combining observed counts of intercensal fertility and migra-tion with demographic estimates of mortality results in a reduced formestimate of the expected subpopulation change between censuses, or
E(δPkT) = BkT − DnbkT + MkT = δPkT − εkT. (7)
With mortality uniquely identified, so too is the error term, and thoughinterracial mobility is not the only explanation for the EOC, there arefewer competing explanations than would be the case in more com-prehensive demographic models in which the residual absorbs multiplesources of measurement error. In fact, of the three major componentsof population change, only the most accurately measured—mortality—is estimated from demographic sources in our model (Robinson et al.1993). Using the net change in the foreign-born population eliminatesthe need to estimate immigration, return migration, and foreign-borndeaths from separate demographic data sources. Similarly, our estimateof intercensal fertility circumvents the problem of quantifying potentialidentity changes among persons who were not alive at both time points.
This approach is not without limitations. The most significantis that identity change among immigrants and children born betweencensuses are not measured (though the latter would be included in sub-sequent censuses). Our specification also ignores U.S.-born expatriates,though native-born emigration is fairly trivial at the population level,recent estimates placing the annual exodus at just 18,000 persons (Gibbset al. 2003).
This minor loss of generalizability must be balanced against thedramatic reduction in the number of competing explanations for the er-ror of closure. By limiting the analysis of residual growth to native-bornpersons who are alive at both time points, any biases from unmeasuredor poorly measured components of fertility and international migration(illegal immigration, underregistration of births, etc.) are eliminated.This formulation forces intercensal agreement between the expectedand enumerated populations of the foreign born and young children,so neither group contributes to the EOC. While this simplification re-duces our residual analysis to native-born census cohorts, this subset
42 PEREZ AND HIRSCHMAN
comprises a large segment of the overall population. Even at t2 (1990,2000, and 2006), an average of 78% of the population is comprised ofnative-born persons from the previous census (1980, 1990, and 2000,respectively). Restricting our focus to this universe helps ensure thatestimates of interracial mobility are conservative and less likely to beconflated with the leading sources of error in intercensal accounting—fertility and international migration (Robinson et al. 1993).
After fixing two of the three major sources of population change,and estimating the third, the balance of intercensal change to eachrace/ethnic subpopulation falls on the residual term. Since the latteris no longer subject to errors in the measurement of international mi-gration or fertility, and since native-born emigration is assumed rareenough to be safely ignored, only two sources of error remain con-founded with estimates of net interracial mobility: mortality and censuscoverage.
The former is of little concern, since death records are consideredamong the most complete and accurate of demographic data sources(Robinson et al. 1993:1064). There is evidence that coroners sometimesmisclassify race on death certificates, but these errors should have lit-tle impact on the overall growth of race/ethnic subpopulations. First,mortality has been in steady decline for decades, and as a proportion oftotal population change, mortality trails fertility for every race/ethnicgroup, and it is a distant third to immigration for the fastest growinggroups (Asians and Hispanics). Second, while coroner misclassificationmay bias mortality rates by 10%–20% for small subpopulations (e.g.,American Indians and Pacific Islanders), the impact on larger groupsis much smaller—1%–3% for Hispanics, blacks, and whites (Rosenberget al. 1999). Third, even the well-known, and much larger, differences inrelative mortality (e.g., black versus white) are dwarfed by the absolutemortality declines that all groups have experienced in recent decades(Arias 2002, 2006). If lingering racial differences in death rates do notaffect the growth of race/ethnic populations to a large degree, minorinaccuracies in the measurement of those differences should have onlymodest effects. This is fortunate, since life tables for non-black minori-ties are not available (Arias 2006).6
6 Life table data are available only for the total, black, and white popula-tions.
ESTIMATING NET INTERRACIAL MOBILITY 43
Differential coverage of censuses, however, poses a much moreserious challenge to our inference of interracial mobility. Indeed, theerror of closure has traditionally been interpreted as a proxy for cov-erage error since the invention of modern demographic analysis (Coale1955). Using independent demographic sources, Coale calculated anexpected population for 1950 by summing the 1940 population withthe projected gains through natural increase and migration over thesubsequent decade.7 After comparing this expected population to theofficial census count for 1950, Coale found that the latter was nearly 3%smaller than expected, which he attributed to omissions in the censusitself.
While demographic analysis is primarily used to estimate censusundercount (Himes and Clogg 1992), Coale notes that for race/ethnicsubgroups, undercount is not the only explanation for the error ofclosure:
The large apparent deficits among nonwhites pose aninteresting question: are these deficits the result ofomissions of nonwhites or misclassification of somesort? In this instance “misclassification” is perhaps . . .
inconsistent classification of the same person as be-tween one census and another, as between a birth cer-tificate and a census form, or as between the entry madeby a Selective Service Board and by a census enumera-tor. (Coale 1955:45)
Of the five conclusions reached in Coale’s seminal paper, none wasdiscussed at greater length than the potential contribution of identityshifts to the EOCs of racial groups (Coale 1955:48). The magnitudes ofthese shifts were not identified, however, and even if they had been, anyshifts between race/ethnic subpopulations must, by definition, sum tozero for the total population.8 As a result, changes in racial classification
7 This summary oversimplifies Coale’s work, which drew upon a numberof sources (including vital statistics, draft registrations, and immigration data) andprojection methods to produce a range of estimates of intercensal change and censuscoverage.
8 Blacks may identify as white, or vice versa, but while these shifts maychange the number of blacks and whites, the total number of persons remains thesame.

44 PEREZ AND HIRSCHMAN
would have no bearing on the total population undercount, for whichCoale’s discovery is best remembered (Anderson and Fienberg 2001).
While coverage error is conflated with interracial mobility inour model, limited estimates of census undercount are available. Pri-mary sources include demographic analysis and postenumeration sur-veys conducted by the Census Bureau. Results from the two sources aregenerally comparable, and in the most recent census, coverage improvedto the point that various counting errors (omissions, duplications, etc.)largely offset one another, producing net estimates of coverage errorthat were close to zero in both DA (0.12%) and postenumeration survey(0.49%) estimates (U.S. Census Bureau 2002).
Despite the sophistication and convergence of coverage evalua-tion methods, debates about whether to “correct” the census for under-count remain heated. Arguments for and against adjustment are oftenrooted in divisive political and methodological differences about howto reconcile modest but reliable estimates of national undercount withlarger but less precise estimates of undercount for minorities, youngmen, and urban areas (see Anderson and Fienberg 2001 and Skerry2000 for contrasting views). Though the RM approach described inthis paper can be applied to any level of geography for which data areavailable, we limit our illustrations of interracial mobility to the nationallevel. Unlike the case with smaller levels of geography, the use of ad-justed counts at the national level is “neither difficult nor controversial”(Ericksen et al. 1989:927).
Adjusting the EOC for coverage error eliminates the primaryconfounder of interracial mobility in our reduced-form accountingmodel. Disaggregating the error term and solving for the unknownportion shows that
εkT = rkT + ckT = δPkT − E(δPkT),
where ck and rk correspond to coverage error and race reporting shifts,respectively, and
rkT = δPkT − (BkT − Dnb
kT + MkT + ckT), where
n∑k=1
rkT = rT = 0.
(8)
In other words, net interracial mobility is simply the balance ofsubpopulation change after international migration, natural increase,

ESTIMATING NET INTERRACIAL MOBILITY 45
and coverage error are subtracted out. The equation also includes thelogical constraint that any net flows between race/ethnic groups cancelout at the population level (see footnote 2).
4. INTERRACIAL MOBILITY IN THE PAST QUARTERCENTURY: CENSUS AND ACS EVIDENCE
To illustrate the utility of this reduced-form accounting model, we re-view the growth of major race and ethnic subpopulations in the UnitedStates between 1980 and 2006, and present net estimates of interra-cial mobility among the native born. Data include the .01 PUMS filefrom the 1980, 1990, and 2000 censuses, as well as the 2006 AmericanCommunity Survey, the recently phased in replacement for the decen-nial census long form.9 All samples are drawn from the IPUMS dataarchive at the Minnesota Population Center.10
Since changes in race/ethnic categorization and measurementmay affect the way individuals identify on the census, several stepsare taken to facilitate the comparison of race/ethnicity data acrossyears (see Appendix A for questionnaire wording and categories). Themost important change occurred on the 2000 census, which allowedrespondents to indicate multiple races by “checking all that apply”(Office of Management and Budget 1997). Previous censuses limitedrespondents to just one race, so counts from earlier years are not directlycomparable with data from 2000 and beyond. To address this issue,we use historically compatible race measures that impute single raceresponses for those who identify multiple races in Census 2000 andthe 2006 ACS. These “bridged” race estimates, originally developed bythe National Center for Health Statistics (Ingram et al. 2003), and latermodified for use with PUMS microdata (Liebler and Halpern-Manners2008), permit the comparison of contemporary race data with thosefrom earlier censuses.
Census 2000 was also the first to distinguish Asians from PacificIslanders, who were counted as a single population in 1980 and 1990.Since there is no way to disaggregate the two groups in earlier years,
9 Race/ethnicity questions on the ACS are identical to Census 2000, andthe 2006 ACS was the first to include group quarters.
10 For more information, see http://usa.ipums.org/usa/.

46 PEREZ AND HIRSCHMAN
we revert to the combined “API” (Asian or Pacific Islander) format forall years. The listings of detailed race/ethnicity categories also variedslightly between censuses,11 though the major categories, to which welimit our analysis, did not change: Federal guidelines designate fourmajor race categories (white, black, American Indian/Alaska Native,and Asian/Pacific Islander) and a separate measure to distinguish His-panics from non-Hispanics (Office of Management and Budget 1977).We also include the catch-all “some other race” (SOR) category usedby the Census, which is a write-in option for respondents who fail toidentify a listed category.
“Hispanic” is not formally included as a race but is instead mea-sured in a separate questionnaire item on Hispanic/Latino origin (seeAppendix A). Since this configuration vastly overstates the number of“other race” respondents in the census (Perez and Hirschman 2009), weuse a “combined” race/ethnicity format that pools all Hispanics andthen compares this aggregate group to non-Hispanics from the fourmajor race categories (Hirschman et al. 2000). Since the vast major-ity of Hispanics identify as white or SOR on the race question (48%and 43% in Census 2000, respectively), the sizes of these two groupsare significantly reduced when Hispanics are treated as a quasi-racialcategory.12
Table 1 decomposes the growth of major race/ethnic groupsover the past quarter century. The top panel contains the number ofpersons (in thousands) added or lost through each source of populationchange (plus errors), while the bottom panel expresses the contributionof each component as a percentage of total population change. Resultsshow that the United States has grown increasingly diverse in recentyears, primarily through racial differences in immigration and natu-ral increase. Between 1980 and 2006, 40 million Hispanics and APIswere added, and the combined share of these groups rose from 8%to 20% of the U.S. total. Most of this growth can be attributed tolarge numbers of recent immigrants and their U.S.-born children. Non-Hispanic whites, by contrast, added just 20 million persons during this
11 For example, Eskimo and Aleut were listed in 1980 and 1990 but notin 2000.
12 In the latter case, removing Hispanics basically depletes the population,since more than 97% of the 15 million persons who identify as SOR in Census 2000are Hispanic.

ESTIMATING NET INTERRACIAL MOBILITY 47
TA
BL
E1
Com
pone
nts
ofC
hang
eto
Rac
e/E
thni
cPo
pula
tion
sin
the
Uni
ted
Stat
es,1
980–
2006
Tota
lPop
ulat
ion
Cha
nge(
1)F
orei
gn-B
orn
Cha
nge
Inte
rcen
salB
irth
sP
roje
cted
Nat
ive-
Bor
nD
eath
sE
rror
ofC
losu
re
80–9
090
–00
00–0
680
–06
80–9
090
–00
00–0
680
–06
80–9
090
–00
00–0
680
–06
80–9
090
–00
00–0
680
–06
80–9
090
–00
00–0
680
–06
Rac
e(3
)21
,392
33,2
9817
,977
72,6
666,
628
11,5
556,
726
24,9
0935
,135
38,1
9823
,783
97,1
1618
,237
20,3
4313
,160
51,7
40−2
,134
3,88
862
82,
382
Whi
te7,
525
9,39
73,
187
20,1
10−4
241,
318
533
1,42
824
,734
23,8
0813
,578
62,1
1915
,383
17,0
8311
,013
43,4
80−1
,402
1,35
490
42B
lack
2,91
45,
989
2,82
911
,732
552
949
720
2,22
15,
152
6,15
33,
681
14,9
872,
229
2,45
61,
541
6,22
5−5
621,
342
−32
749
AIA
N42
925
4−6
361
9=
70
−43
+35
636
618
490
6−
7510
061
236
+14
1−1
1−1
83−5
3A
PI
3,38
04,
050
2,64
310
,074
2,50
32,
748
1,66
96,
920
861
1,21
592
22,
997
7494
8225
091
182
134
407
His
pani
c(2
)7,
129
13,3
939,
058
29,5
794,
010
6,45
43,
624
14,0
883,
969
6,55
55,
330
15,8
5547
060
545
51,
530
−380
988
558
1,16
6SO
R15
216
323
554
−20
8718
325
064
101
8725
26
57
18−2
233
6070
Tota
lPop
ulat
ion
Cha
nge
(4)
For
eign
-Bor
nC
hang
eIn
terc
ensa
lBir
ths
Pro
ject
edN
ativ
e-B
orn
Dea
ths
Err
orof
Clo
sure
80–9
090
–00
00–0
680
–06
80–9
090
–00
00–0
680
–06
80–9
090
–00
00–0
680
–06
80–9
090
–00
00–0
680
–06
80–9
090
–00
00–0
680
–06
Rac
e(3
)10
0.0%
100.
0%10
0.0%
100.
0%10
.7%
15.6
%15
.2%
14.1
%56
.5%
51.6
%53
.7%
55.1
%29
.4%
27.5
%29
.7%
29.4
%3.
4%5.
3%1.
4%1.
4%W
hite
100.
0%10
0.0%
100.
0%10
0.0%
1.0%
3.0%
2.1%
1.3%
59.0
%54
.7%
53.8
%58
.0%
36.7
%39
.2%
43.7
%40
.6%
3.3%
3.1%
0.4%
0.0%
Bla
ck10
0.0%
100.
0%10
0.0%
100.
0%=
6.5%
8.7%
12.1
%9.
2%+
60.7
%56
.4%
61.6
%62
.0%
−26
.2%
22.5
%25
.8%
25.7
%+
6.6%
12.3
%0.
5%3.
1%A
IAN
100.
0%10
0.0%
100.
0%10
0.0%
1.1%
0.0%
0.9%
0.2%
61.5
%76
.5%
42.7
%75
.6%
12.9
%21
.0%
14.1
%19
.7%
24.4
%2.
4%42
.3%
4.4%
AP
I10
0.0%
100.
0%10
0.0%
100.
0%70
.9%
64.8
%59
.5%
65.4
%24
.4%
28.7
%32
.8%
28.3
%2.
1%2.
2%2.
9%2.
4%2.
6%4.
3%4.
8%3.
8%H
ispa
nic
(2)
100.
0%10
0.0%
100.
0%10
0.0%
45.4
%44
.2%
36.4
%43
.2%
45.0
%44
.9%
53.5
%48
.6%
5.3%
4.1%
4.6%
4.7%
4.3%
6.8%
5.6%
3.6%
SOR
100.
0%10
0.0%
100.
0%10
0.0%
17.8
%38
.6%
54.3
%42
.3%
56.8
%44
.6%
25.9
%42
.6%
5.7%
2.2%
2.1%
3.1%
19.7
%14
.6%
17.7
%11
.9%
Not
es:(
1)Po
pula
tion
inth
ousa
nds.
(2)H
ispa
nics
(ofa
llra
ces)
are
pool
ed.R
acia
lgro
ups
(whi
te,b
lack
,etc
)lim
ited
tono
n-H
ispa
nics
.(3)
Mul
tira
cial
resp
onde
nts
from
2000
and
2006
data
reas
sign
edto
mos
tpro
babl
esi
ngle
-rac
eca
tego
ry.A
IAN
=A
mer
ican
Indi
anor
Ala
ska
Nat
ive;
AP
I=
Asi
anor
Pac
ific
Isla
nder
;SO
R=
Som
eot
her
race
.(4)
Per
cent
ages
use
abso
lute
valu
esin
both
num
erat
oran
dde
nom
inat
or;a
llva
lues
are
thus
posi
tive
.S
ourc
es:I
PU
MS
1%m
icro
data
from
the
2006
AC
San
d19
80,1
990,
and
2000
Cen
suse
s:U
.S.L
ife
Tab
les
from
1980
,199
0,20
00,a
nd20
03.
48 PEREZ AND HIRSCHMAN
interval, a slower rate of natural increase largely due to their olderage structure. Nearly 44 million native-born whites died between 1980and 2006, compared with just 1.3 million native-born Hispanics andAPIs.
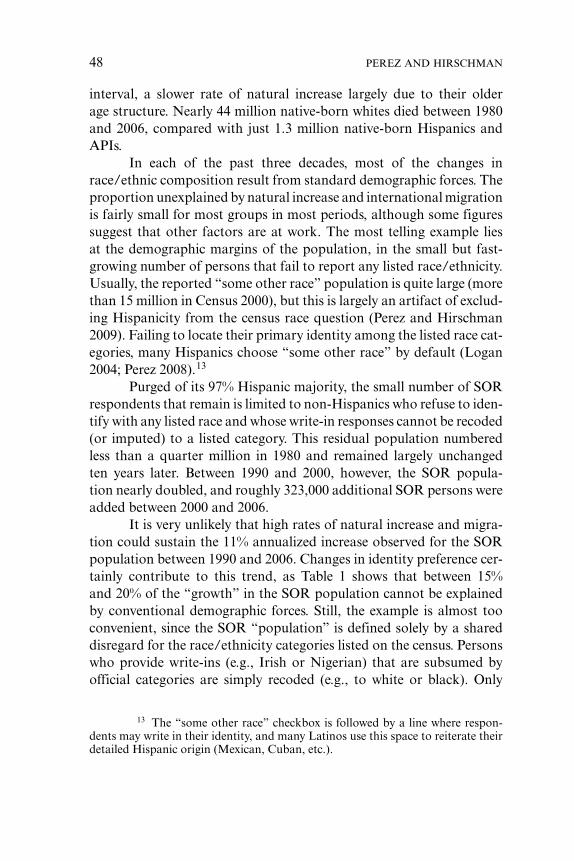
In each of the past three decades, most of the changes inrace/ethnic composition result from standard demographic forces. Theproportion unexplained by natural increase and international migrationis fairly small for most groups in most periods, although some figuressuggest that other factors are at work. The most telling example liesat the demographic margins of the population, in the small but fast-growing number of persons that fail to report any listed race/ethnicity.Usually, the reported “some other race” population is quite large (morethan 15 million in Census 2000), but this is largely an artifact of exclud-ing Hispanicity from the census race question (Perez and Hirschman2009). Failing to locate their primary identity among the listed race cat-egories, many Hispanics choose “some other race” by default (Logan2004; Perez 2008).13
Purged of its 97% Hispanic majority, the small number of SORrespondents that remain is limited to non-Hispanics who refuse to iden-tify with any listed race and whose write-in responses cannot be recoded(or imputed) to a listed category. This residual population numberedless than a quarter million in 1980 and remained largely unchangedten years later. Between 1990 and 2000, however, the SOR popula-tion nearly doubled, and roughly 323,000 additional SOR persons wereadded between 2000 and 2006.
It is very unlikely that high rates of natural increase and migra-tion could sustain the 11% annualized increase observed for the SORpopulation between 1990 and 2006. Changes in identity preference cer-tainly contribute to this trend, as Table 1 shows that between 15%and 20% of the “growth” in the SOR population cannot be explainedby conventional demographic forces. Still, the example is almost tooconvenient, since the SOR “population” is defined solely by a shareddisregard for the race/ethnicity categories listed on the census. Personswho provide write-ins (e.g., Irish or Nigerian) that are subsumed byofficial categories are simply recoded (e.g., to white or black). Only
13 The “some other race” checkbox is followed by a line where respon-dents may write in their identity, and many Latinos use this space to reiterate theirdetailed Hispanic origin (Mexican, Cuban, etc.).

ESTIMATING NET INTERRACIAL MOBILITY 49
those who provide uncodable responses remain in the SOR category,and those who do so comprise a fairly eclectic mix.14
More compelling evidence of potential identity shifts lies with-inthe traditional racial groups, some of which also experience rates ofchange that exceed the limits of natural increase and immigration. Themost remarkable case is the American Indian/Alaska Native popula-tion. After growing by 30% in the 1980s, the AIAN population grewat a considerably slower pace in the 1990s and appears to have evendeclined in recent years. In the absence of exogenous population shockslike famine, war, or diaspora, such an erratic pattern of growth/declineshould be viewed with skepticism.
For example, while Hispanics and APIs also grew quickly duringthe 1980s, over 90% of the growth was due to immigration and fertility.AIANs, by contrast, added almost no immigrants and experienced just356,000 births, yet total intercensal growth somehow exceeded 429,000during the 1980s. That there is an unexplained surplus of AIAN personsin 1990, even before deaths are subtracted out, implies that the 1980census cohort grew over time, adding 66,000 new AIAN persons duringa decade in which that population was projected to lose an even largernumber (75,000) to mortality. Summing these two discrepancies resultsin a net EOC of 141,000, or roughly 24.4% of AIAN growth between1980 and 1990.
Improvements in mortality and census coverage could not haveaccounted for this trend. More likely, the excess “growth” in the AIANpopulation reflects continuing fluidity in the willingness to report Na-tive American identity among persons of partial American Indian an-cestry. Compounding this suspicion is the equally unusual deficit in pro-jected AIAN growth during subsequent decades. As shown in Table 1,there is a small but negative EOC for the AIAN population between1990 and 2000, which widens sharply between 2000 and 2006, a dramaticreversal of the earlier trend. Six years into the current decade, the totalAIAN population has apparently declined by more than 60K persons,despite adding three new births for every projected death (180K/60K).Barring mass emigration or a severe undercount of AIAN persons in
14 These include regional or national responses that are racially ambigu-ous (e.g., Brazilian or Eurasian) or uninformative multiethnic responses such as“rainbow” or “mixed.” A complete listing of Census Race Codes is provided at:http://www.census.gov/acs/www/UseData/sf/Append_G_2005_Code_List.pdf.

50 PEREZ AND HIRSCHMAN
the 2006 ACS, the “disappearance” of 180,000 AIAN persons (nearly1 in 10 AIANs from Census 2000) over a six-year interval likely re-sults from identity shifts, though the bridging methodology (discussedbelow) may also play a role.
Blacks also seem to have experienced seemingly implausible ratesof growth, though only during the 1990s. According to Table 1, theblack population grew by 6 million persons, or 21%, between 1990 and2000. These gains would imply an increase of more than 2% per year—nearly double the annual growth rate from the previous decade, andconsiderably higher than the pace of the current decade (1.3% through2006). Though immigration and natural increase account for 87% ofthis growth, the EOC among native-born blacks stands at 1.34 millionin the year 2000. A surplus of this magnitude would be equivalentto eliminating more than half the deaths to native-born blacks in the1990s. Even if blacks experienced the same mortality as whites duringthis decade, a surplus of more than half a million persons would remain(results not shown).
While it is clear that nontraditional sources of population changeunderlie these anomalous findings, even large errors of closure are notsufficient evidence of interracial mobility per se. First, EOCs mightsimply reflect changes in census coverage over time. There is no clearpattern to the residual differences between race/ethnic groups, andall but one group’s EOCs change signs from one interval to the next.Furthermore, the sum of the residuals over time (group totals) are quitesmall; only Hispanics show a surplus larger than 750,000 for the full26-year period. Population totals, by contrast, which should sum tozero, instead fall in the 2–4 million range in the 1980s and 1990s, andare differently signed in each decade. Interracial mobility might wellbe occurring, but any aggregate identify shifts that are taking place areobscured by the large cyclical changes in error rates from one census tothe next.
Second, even if the EOCs for racial groups were valid, theseaggregate errors mask potentially large differences in residual growthbetween age groups, which raises important questions about the inter-pretability of the results. While some expectations are intuitive—for ex-ample, to expect less stable identities among children and adolescents—the same need not be expected for the working age or the elderly.
Figure 1 illustrates this age pattern of closure error in greaterdetail, by listing the normalized percentage EOC for each race/ethnic
ESTIMATING NET INTERRACIAL MOBILITY 51
-15%
-10%
-5%
0%
5%
10%
15%
20%
White Black AIAN API Hisp
1980–1990
White Black AIAN API Hisp
1990–2000
0–9 10–24 25–44 45+
White Black AIAN API Hisp
2000–2006
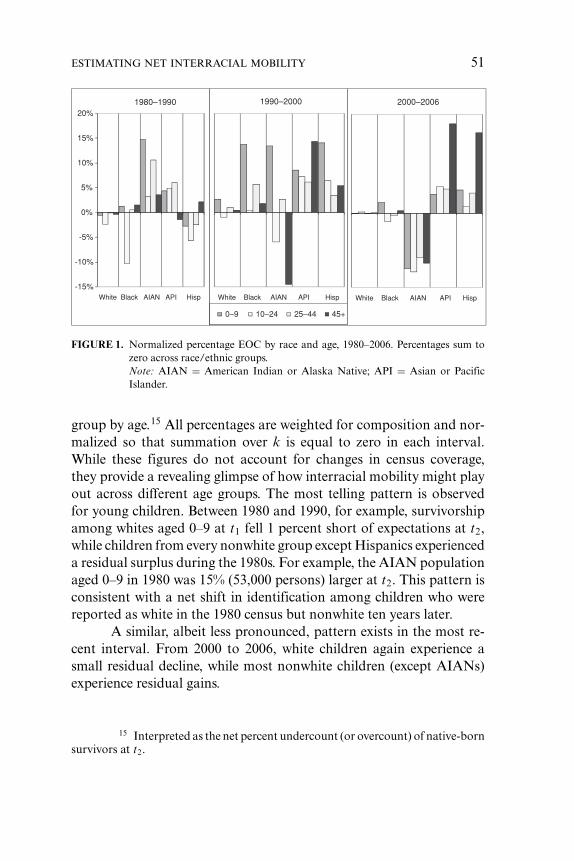
FIGURE 1. Normalized percentage EOC by race and age, 1980–2006. Percentages sum tozero across race/ethnic groups.Note: AIAN = American Indian or Alaska Native; API = Asian or PacificIslander.
group by age.15 All percentages are weighted for composition and nor-malized so that summation over k is equal to zero in each interval.While these figures do not account for changes in census coverage,they provide a revealing glimpse of how interracial mobility might playout across different age groups. The most telling pattern is observedfor young children. Between 1980 and 1990, for example, survivorshipamong whites aged 0–9 at t1 fell 1 percent short of expectations at t2,while children from every nonwhite group except Hispanics experienceda residual surplus during the 1980s. For example, the AIAN populationaged 0–9 in 1980 was 15% (53,000 persons) larger at t2. This pattern isconsistent with a net shift in identification among children who werereported as white in the 1980 census but nonwhite ten years later.
A similar, albeit less pronounced, pattern exists in the most re-cent interval. From 2000 to 2006, white children again experience asmall residual decline, while most nonwhite children (except AIANs)experience residual gains.
15 Interpreted as the net percent undercount (or overcount) of native-bornsurvivors at t2.

52 PEREZ AND HIRSCHMAN
Results for the 1990–2000 interval reveal the largest unexplainedgains among nonwhite children in any decade; those who are 0–9 in 1990grow by 9–14% for every nonwhite group. Even American Indians, whoexperience a small overall decline during the 1990s (see again Table 1),register a 14% surplus of young children. While these 1990 figures hintat a continuation or acceleration of the pattern set in the 1980s, there isone troublesome distinction: In the ’80s, nonwhite gains were logicallyoffset by white losses, but in the 1990s, all children experienced residualgrowth.
This logical fallacy could be allayed by adding additional con-straints (for example, by normalizing the white EOC to zero) or forcingracial differences to sum to zero within age groups, but statistical ad-justment will not address the underlying need to disentangle censuscoverage from interracial mobility in the aggregate EOC. In the 1990s,for example, persons aged 0–9 and 25–44 show net gains for every racialgroup, and among persons 45 and older, only American Indians appearto decline. All told, just 3 out of 20 race∗age cohorts experience a resid-ual loss in the 1990s. Interracial mobility cannot account for such anerratic pattern. Rather, these results almost certainly reflect the knownimprovements in census coverage between 1990 and 2000 (U.S. CensusBureau 2002).
To help address this limitation, Figure 2 lists the undercount-adjusted errors for each race/ethnic group in the 1980s, 1990s, and thefull interval from 1980 to 2006.16 From an interracial mobility perspec-tive, the adjusted results are much more intuitive.17 In the 1990–2000interval, most nonwhites continue to show a surplus in at least threeof four age groups, but whites now show corresponding losses at allages. The percentages shown in the figure are forced to sum to zeroacross race/ethnic groups, but after taking changes in census coverageinto account, this constraint is almost unnecessary. The unconstrainedsum of the group EOCs for 1990–2000 is just 0.69%, less than 250,000persons (not shown). This is a huge reduction of the unadjusted sumof 3.8 million shown in Table 1. More importantly, just as period totalshave grown closer to zero, racial differences across periods have become
16 Estimates rely on DA adjustment with multiplicative scaling. See Ap-pendix C for details.
17 Coverage estimates are not available for the American CommunitySurvey, so 2000–2006 values are unadjusted.

ESTIMATING NET INTERRACIAL MOBILITY 53
-15%
-10%
-5%
0%
5%
10%
15%
20%
White Black AIAN API Hisp
1980–1990
White Black AIAN API Hisp
1990–2000
0–9 10–24 25–44 45+
White Black AIAN API Hisp
1980–2006
FIGURE 2. Net interracial mobility by race and age, 1980–2006. Percentages sum to zeroacross race/ethnic groups. Coverage estimates unavailable for 2000–2006 (aver-age uses unadjusted values from Figure 1).Note: AIAN = American Indian or Alaska Native; API = Asian or PacificIslander.
more consistent, which is precisely what should result if identity shiftsoffset one another within intervals but accumulate over time. Amongyoung children, results for the 1980s are little changed from the unad-justed figures, with the exception of black children switching from asmall surplus to a small deficit. For the 1990–2000 interval, the surplusof children among nonwhite groups is now offset by a similar-sizeddeficit of white children.
Clearly, broad improvements in census coverage were largelyresponsible for the unadjusted surpluses observed between 1990 and2000. After adjusting for coverage changes, however, a clearer patternof net interracial mobility begins to emerge. If the results shown inFigure 2 are accurate, then about half a million children who wereidentified as white in the 1990 census either identified, or were classifiedas having, a nonwhite race/ethnicity in Census 2000.
Table 2 puts the magnitude of these reporting shifts into per-spective, using WLS estimates of the percentage EOC by race and year.Each observation is a one-year age group from each race and censuscohort (N = 486). Model coefficients are the relative percent surpluses(or deficits) of persons surviving to t2 for each race, using whites as the
54 PEREZ AND HIRSCHMAN
TA
BL
E2
WL
SE
stim
ates
ofP
erce
ntag
eE
OC
byR
ace/
Eth
nici
ty,1
980–
2006
1980
–199
019
90–2
000
2000
–200
6
(1)
(2)
(3)
(4)
(5)
(1)
(2)
(3)
(4)
(5)
(1)
(2)
(3)
Whi
te(r
ef)
00
00
00
00
00
00
0B
lack
−1.5
−1.3
0.1
0.1
0.1
4.5∗
4.4∗
3.4∗
3.4∗
3.4∗
−0.2
−0.1
0.0
AIA
N11
.4∗
11.6
∗10
.0∗
10.0
∗10
.0∗
−1.5
−1.6
−5.9
∗−5
.9∗
−5.9
∗−9
.0∗
−9.0
∗−8
.4∗
AP
I7.
8∗7.
8∗5.
0∗5.
0∗5.
0∗7.
6∗6.
7∗9.
5∗9.
5∗9.
5∗3.
8∗3.
8∗6.
5∗
His
pani
c−3
.4∗
−3.1
∗−0
.8−0
.8−0
.87.
5∗6.
9∗5.
5∗5.
5∗5.
5∗2.
9∗2.
9∗5.
3∗
Mod
elD
F5
929
3030
59
2930
305
929
Mod
elR
sq.
0.11
0.22
0.34
0.35
0.35
0.14
0.26
0.36
0.37
0.37
0.11
0.12
0.18
Not
e:C
over
age
Adj
ustm
ents
deri
ved
from
Dem
ogra
phic
Ana
lysi
s.A
IAN
=A
mer
ican
Indi
anor
Ala
ska
Nat
ive;
AP
I=
Asi
anor
Pac
ific
Isla
nder
.Res
ults
for
the
SOR
popu
lati
onin
clud
edin
the
esti
mat
ion,
but
not
repo
rted
:(1
)R
ace-
only
mod
el,n
oco
ntro
lvar
iabl
es(I
dent
ical
toC
ross
-tab
)(2
)C
ontr
ols
for
Age
Stru
ctur
e(5
-Gro
upva
riab
leus
edin
earl
ier
tabl
es)
(3)
Con
trol
sfo
rR
acia
lDif
fere
nces
inA
geSt
ruct
ure
(Tw
o-w
ayIn
tera
ctio
n)(4
)(3
)pl
usco
ntro
lfor
Inte
rcen
salC
hang
ein
Cen
sus
Cov
erag
e(A
ddit
ive
Scal
e)(5
)(3
)pl
usco
ntro
lfor
Inte
rcen
salC
hang
ein
Cen
sus
Cov
erag
e(M
ulti
plic
ativ
eSc
ale)
∗P
erce
ntag
esh
ift
sign
ific
antl
ydi
ffer
ent
than
whi
tere
fere
nce
at<
0.10
N=
486
(81
age
grou
psby
6ra
ces)
Cel
ls=
Wei
ghte
dP
erce
ntE
OC
min
usW
hite
EO
C(i
.e.r
elat
ive
perc
enta
gesh
ift)
ESTIMATING NET INTERRACIAL MOBILITY 55
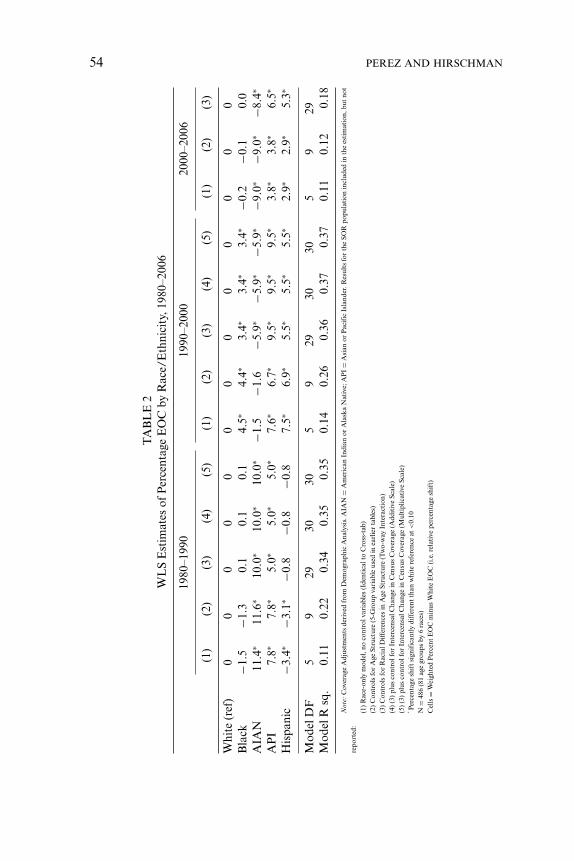
reference group. All percentages are weighted for composition, and eachintercensal panel contains a race-only model (column 1), models thatadjust for age structure and racial differences in age structure (columns2 and 3, respectively),18 and models that add two different estimatesof census undercount.19 Significant residual shifts are defined as thosethat differ from the white reference group at the .10 level or better.
Racial differences in residual growth during the 80–90 intervalare consistent with earlier tables and figures. Relative to whites, Amer-ican Indians and Alaska Natives (AIAN) show a net 10–12% residualgain across models, while survivorship among native-born Asians andPacific Islanders (API) exceeds expectations by about 5%–8%. Further-more, the negative EOCs (residual losses) for native-born Hispanics areno longer significant after controlling for changes in census coverage.Estimates for blacks are small and insignificant at the .10 level. Sum-ming up the residual shifts during the 1980–1990 interval, results suggestthat nonwhite groups either retained their populations or absorbed asmall number of non-Hispanic whites during this period.
Results for subsequent years show a more pronounced drift to-ward minority groups, with the exception of AIANs. APIs and His-panics experience residual surpluses of 5%–10% after adjusting for dif-ferences in age structure (column 3). In the 1990s and 2000s, blacksalso experience unexplained growth after 1990, though the surplus islimited to the 1990–2000 interval, and shrinks from 4.5% to 3.4% aftercontrolling for changes in undercount. Table 2 also confirms the rapidfall-off of the double-digit growth in AIAN identities observed duringthe 1980s. In fact, after adjusting for changes in undercount, the AIANcohort from the 1990 census appears to have declined by around 6%during the subsequent decade, while the 2000 cohort has lost an evengreater percentage (8–9%) as of 2006.
5. LIMITATIONS OF THE REDUCED-FORMACCOUNTING MODEL
These results reveal several instances in which race/ethnic subpopula-tions change in ways that defy demographic principles and yet cannot
18 Five category age variable with cutpoints at age 5, 10, 25, and 45.19 See Table 2 notes and Appendix C for details on undercount method-
ology.

56 PEREZ AND HIRSCHMAN
be fully explained by census coverage. The overall pattern is tentativelyconsistent with a net reshuffling of identities, among children in par-ticular, from non-Hispanic whites to various race/ethnic minorities inrecent decades. These shifts are modest for certain age groups and timeperiods, though our estimates of interracial mobility are generally muchsmaller than the changes accruing to conventional forces of populationchange (immigration and natural increase).
As proof of principle, the residual approach derived in this paperoffers a promising extension to well-known methods of demographicaccounting. Substantive interpretations of the empirical results shouldbe drawn with caution, however. First, even after attempting to discountchanges in census coverage (a challenging task in itself, as discussed be-low), closure errors persist for some older age groups. With few a priorireasons to expect adults to systematically change their race/ethnicityfrom one census to the next, the EOCs among older persons mightsimply be due to measurement error—either in the life table survivalrates, estimates of census coverage, or both. Fortunately, patterns ob-served for young children are more consistent and generally, though notalways, of greater magnitude than those observed for adults. More im-portantly, all but the youngest children in our analysis are enumerated(at t2) after recently entering or passing through adolescence, an agein which race/ethnic identities have been shown to be relatively fluid(Harris and Sim 2002; Perez 2008).
Second, our sample restrictions exclude two important segmentsof the population (foreign-born persons and children born between cen-suses) and dismiss a third (native-born emigrants) on the assumptionthat it is small enough to ignore (Gibbs et al. 2003). Still, while the exclu-sion of U.S.-born emigrants may inflate estimates of residual growth forall groups, the omission of immigrants and intercensal births likely hasan opposite and much larger effect. Given the instability of identitiesamong children and the lack of familiarity with American race/ethniccategories among new immigrants, excluding these groups ignores twopotentially large sources of interracial mobility in the United States.
Third, although our reduced-form model draws upon fewer datasources than conventional demographic models, none of the data weutilize were designed to explore patterns of interracial mobility perse. The race categories in the life-tables are not directly comparablewith those used in the census, and changes in measurement within thecensus itself threaten the comparability of race across years. We attempt

ESTIMATING NET INTERRACIAL MOBILITY 57
to mitigate this latter concern by using bridged race measures derivedfrom a social survey in which respondents who identify multiple racesare asked to choose which single race they would report under the old“check one race only” format (Ingram et al. 2003). The proportion ofpersons who opt for each single-race response are then used as bridgingparameters to link contemporary race data with those from earliercensuses.
Decisions about how to simplify identities depend on a num-ber of factors, however, and the bridging models used to assign singlerace responses often include rich contextual measures in the predic-tion equation.20 Since many data sources, including the PUMS used inthis paper, lack detailed geographic measures, bridged race estimatesmay lack precision (Liebler and Halpern-Manners 2008). Addition-ally, while the decisions to pool all Hispanics regardless of race(s) andrecombine the Asian and Pacific Islander populations reduce the num-ber of cases that require bridging to about 1.4% of the total 2000 and2006 populations, this solution remains less than optimal for somegroups. AIANs, for instance, have a large share (up to one-third) ofbridged cases in 2000 and 2006, which suggests that the erratic fluctua-tions in the residual growth of this population may result, in part, fromlimitations of the bridging methodology itself.
Fourth, while disparate rates census coverage for minorities andurban areas generate frequent headlines (and controversy) (Skerry2000), there is little published research that provides detailed break-downs of census undercount over time. Many sources list aggregate un-dercounts by race, sex, and age, but few look at age-specific rates withinrace (or race∗sex), and detailed rates for nonblack minorities are rarelyreported. The authors were unable to locate detailed undercount ratesfrom the 1980 postenumeration program or the 1990 postenumerationsurvey, or race∗age (1-year age groups) estimates from DemographicAnalysis for years other than 1990 (Robinson et al. 1993). As a result,the race∗age undercount estimates used in this paper are extrapolatedfrom very limited sources (see Appendix C for details). Still, this is moreof a data shortcoming than a methodological one. As illustrated in theage-decompositions from Figures 1 and 2, our model can accommo-date additional subpopulation characteristics by indexing race/ethnic
20 Ingram et al. (2003) includes restricted county-level measures of racialgroups, as well as the proportion Hispanic and multiracial groups.

58 PEREZ AND HIRSCHMAN
groups by other measures of interest (such as age and sex). Racial dif-ferences in undercount, for example, are typically more pronouncedamong males (Anderson and Fienberg 2001). If race∗age∗sex-specificcoverage data were available for multiple census years, gender-specificestimates of interracial mobility could readily be calculated.
Finally, although our reduced-form model attempts to minimizecompeting explanations for the native-born error of closure, the fairlypersistent 5%–8% residual growth observed for native-born Hispanicand Asian adults suggests that additional forms of mobility may beat work. A likely explanation is the misreporting of nativity status.Hamilton (1966) notes that demographic projections are biased by asmall number of foreign-born persons who report themselves as native-born on the Census. Given the rapid increases in immigration in recentdecades and the often heated public outcries toward undocumentedmigrants (Lee and Ottati 2002), it is plausible that immigrants mayopt to misreport their place of birth on later censuses. Counting thesepersons as native-born at t2 will inflate native-born survivorship, and byextension, estimates of interracial mobility toward race/ethnic groupswith a large share of immigrants (Hispanics and Asians).
6. CONCLUDING THOUGHTS
There is considerable speculation about the future race and ethnic com-position of the United States. In a recent report, the Census Bureauprojects that non-Hispanic whites will fall below 50% of the populationby 2042 (U.S. Census Bureau 2008), leading observers in the popularmedia to claim that a “majority minority” United States is just onegeneration away (Roberts 2008). While claims about America’s racialfuture often draw upon published U.S. Census reports that are echoedin scholarly writings, it is impossible to predict the race and ethnic com-position of the United States without relying upon strong assumptions(Hirschman 2002). Not only are future trends in natural increase andinternational migration likely to differ from the past and present, butmore importantly, race and ethnic identities will remain subjective andsocially contextual characteristics. The boundaries between groups arein flux because of intermarriage and the incorporation of new immi-grants (Alba and Golden 1986; Farley 1999), and measured changesin racial composition are compounded by structural changes in the

ESTIMATING NET INTERRACIAL MOBILITY 59
measurement and categorization of race in the census and social surveys,as well as selectivity in the assignment of identities to mixed-ancestrychildren by their parents (Perlmann and Waters 2002; Xie and Goyette1997). These identities may change again when these children reachadulthood and begin to report their own race/ethnicities (Liebersonand Waters 1993).
Though the future remains uncertain, recent changes in the raciallandscape have been swift and pronounced. The most dramatic trendhas been the rapid increase in the Asian and Hispanic populations,which grew from just 8% of the population in 1980 to nearly 20% in2006. The share of African Americans has also inched up during thisperiod, from less than 12% to almost 13% of the American population.Non-Hispanic whites have also increased in number and still comprisetwo-thirds of the American population, but unlike the immigrant-drivengrowth of Hispanics and Asians, growth among whites has been largelyconfined to natural increase, and the gains have been modest becauseof an older age structure that generates nearly as many deaths as births.
While international migration and natural increase have been theprimary forces of change, mobility across race/ethnic categories alsoappears to have played a role. Race/ethnicity is not simply an ascrip-tive trait passed down from one generation to the next. America’s racialhistory echoes a complex and as yet unsettled narrative, rife with histor-ical flows across the black-white color line (Davis 1991; Frazier 1937),the absorption of indigenous populations and subsequent resurgenceof native identities (Nagel 1996), the declining homogeneity of Asiansand Hispanics through intermarriage (Qian and Lichter 2007), and thesteady disappearance of white ethnic identities among European-origingroups once thought to be separate “races” (Baltzell 1964; Higham1988; Waters 1990).
Extending the logic of residual methods used to estimate un-documented migration and other elusive demographic processes, thispaper derives a reduced-form population balancing equation that canbe used to assess net mobility across race/ethnic groups. Populationaccounting relies on a formal identity that decomposes sources of pop-ulation change over time. Any growth left unexplained by measuredcomponents—the error of closure—is both a proxy for unmeasuredcomponents and the cumulative sum of measurement errors. We attemptto disentangle the two by combining simplifying assumptions with sam-pling restrictions. After treating migration and fertility as given, net
60 PEREZ AND HIRSCHMAN
interracial mobility remains confounded with changes in census cover-age and the measurement of race/ethnicity. We attempt to account forboth factors by combining undercount-adjusted data with historicallycompatible race measures. The sum of these adjustments yields errorsof closure that provide “best guess” estimates of net interracial mobility.
Applying these methods to recent U.S. Census and ACS data, weobserve relatively small shifts into race/ethnic minority groups from thenon-Hispanic white population between 1980 and 2006. This pattern ismost pronounced among young children, half a million of whom mayhave switched from white to nonwhite in the 1990–2000 interval alone.The major exception to this trend is the American Indian population,which experienced large residual growth from 1980 to 1990, but notafterward. There are at least two explanations for these patterns. Oneis that some mixed ancestry children are classified by their parents aswhite when they are young but nonwhite when they reach an age atwhich they can negotiate their identities with their parents or respondto census and survey inquiries for themselves. The other possibility isthat immigrants may claim to be native-born after spending time in theUnited States. As mobility across ethnic and racial boundaries becomesa larger demographic phenomenon in the years ahead, demographicaccounting tools can be adapted to explore these patterns in greaterdetail.

ESTIMATING NET INTERRACIAL MOBILITY 61
APPENDIX A: CENSUS AND ACS RACE/ETHNICITYMEASURES, 1980–2006
1980
4. Is this person –
Fill one circle.
Fill one circle.
White Asian Indian Black or Negro HawaiianJapanese Guamanian Chinese SamoanFilipino Eskimo Korean AleutVietnamese Other—Specify Indian (Amer.) Print
7. Is this person of Spanish/Hispanic No ( not Spanish/Hispanic)Yes, Mexican, Mexican-Amer., Chicano Yes, Puerto RicanYes, Cuban Yes, other Spanish/Hispanic
tribe
Origin or descent?
1990
4. Race Fill ONE circle for the race that the personconsiders himself/herself to be.
If Indian (Amer.), print the name of the enrolled or principal tribe.
If Other Asian or Pacific Islander (API),print one group, for example: Hmong,Fijian, Laotian, Thai, Tongan, Pakistani,Cambodian, and so on.
If Other race, print race.
White Black or Negro Indian (Amer.) (Print the name of theenrolled or principal tribe.)
Eskimo Aleut
Asian or Pacific Islander (API)Chinese Japanese Filipino Asian Indian Hawaiian Samoan Korean Guamanian Vietnamese Other API
Other race (Print race)
7. Is this person of Spanish/Hispanic origin?
Fill ONE circle for each person.
If Yes, other Spanish/Hispanic,print one group.
No (not Spanish/Hispanic) Yes, Mexican, Mexican-Am., Chicano Yes, Puerto Rican Yes, Cuban Yes, other Spanish/Hispanic
(Print one group, for example: Argentinean, Colombian, Dominican, Nicaraguan,Salvadoran, Spaniard, and so on.)

62 PEREZ AND HIRSCHMAN
2000 Census and 2006 American Community Survey
Is this person Spanish/Hispanic/Latino? Markthe “No” box it not Spanish/Hispanic/Latino.
No, not Spanish/Hispanic/Latino
Yes, Mexican, Mexican Am., Chicano Yes, Puerto Rican
Yes, Cuban Yes, other Spanish/Hispanic/Latino—Print group.
What is this person's race? Mark one ormore races to indicate what this person considershimself/herself to be.
White Black, African Am., or NegroAmerican Indian or Alaska Native—Print nameof enrolled or principal tribe.
Asian IndianChinese
Filipino
Japanese Korean
Vietnamese Other Asian—Print race.
Native Hawaiian
Guamanian orChamorro Samoan Other PacificIslander – Print race.
Some other race- Print race.
5
6
Note: “Negro” not included in 2006 American Community Survey.

ESTIMATING NET INTERRACIAL MOBILITY 63
APPENDIX B: MORTALITY PROJECTIONS
As noted in equation (6) in the text, interracial mortality is estimated as
DnbkT =
90+∑x=0
DnbkTx =
89∑x=0
Tqx Pnbx + Tq90+ Pnb
90+
=89∑
x=0
[(1 − Lx+T
Lx
)Pnb
x
]+
[(1 − T90+T
T90
)Pnb
90+
].
Note that tqx values are calculated slightly differently for those youngerthan 90 years of age versus those 90 and older. Among the former, theprobability of dying is simply the complement of the forward survivalratio Lx+t
Lxfor each one-year age-cohort—in other words, the probability
that a person of a specific age (e.g., 15) will not survive from one censusto the next. Persons older than 89 are top coded at 90+ (the 1980 censusmaximum) and aged forward using equivalent Tx survival ratios, whichare available for persons up to 110 years of age. Since age is top codedin the census, the age structure of the oldest-old is ignored, but theinterpretation of intercensal mortality remains the same. In this case,1 − T90+t
T90expresses the probability that all persons aged 90 and older
will not survive the interval between measures. For the 1980 and 1990populations, survival ratios are calculated using the mean of the Lx
values from the starting and ending points of each decennial interval(1980–1990 and 1990–2000, respectively), while the 2000 population isprojected forward using 2003 life table data, which will have to serve asan approximation of the 2000–2006 average, since more recent data arenot available at the time of this writing.
APPENDIX C: CENSUS COVERAGE ERROR ADJUSTMENT
The quantity ck is calculated as the difference between the EOCs fromthe unadjusted and coverage-adjusted counts of each race-age cohortfrom the 1980, 1990, and 2000 censuses. Table C1 shows undercountestimates by race and year from the two leading sources of coverageevaluation, the Census Post-Enumeration Survey (PES) and Demo-graphic Analysis (DA). While the magnitude and direction of the two
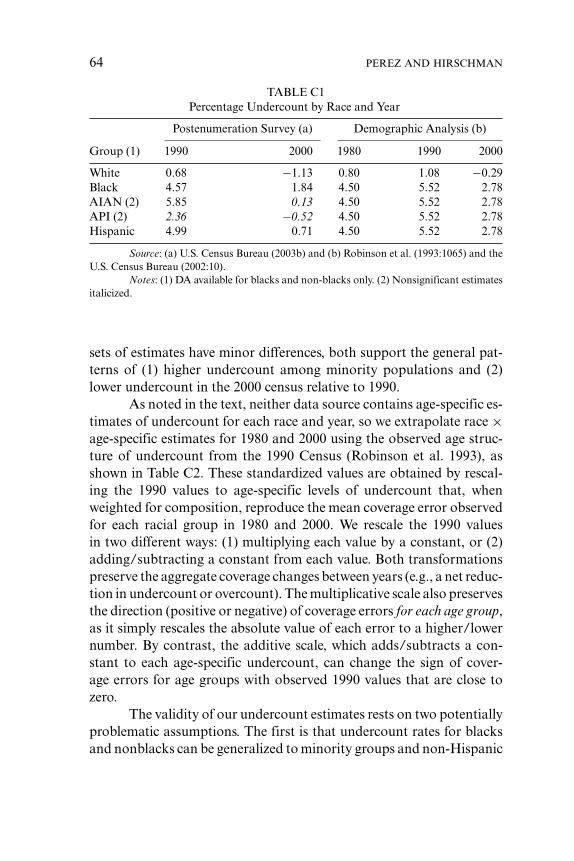
64 PEREZ AND HIRSCHMAN
TABLE C1Percentage Undercount by Race and Year
Postenumeration Survey (a) Demographic Analysis (b)
Group (1) 1990 2000 1980 1990 2000
White 0.68 −1.13 0.80 1.08 −0.29Black 4.57 1.84 4.50 5.52 2.78AIAN (2) 5.85 0.13 4.50 5.52 2.78API (2) 2.36 −0.52 4.50 5.52 2.78Hispanic 4.99 0.71 4.50 5.52 2.78
Source: (a) U.S. Census Bureau (2003b) and (b) Robinson et al. (1993:1065) and theU.S. Census Bureau (2002:10).
Notes: (1) DA available for blacks and non-blacks only. (2) Nonsignificant estimatesitalicized.
sets of estimates have minor differences, both support the general pat-terns of (1) higher undercount among minority populations and (2)lower undercount in the 2000 census relative to 1990.
As noted in the text, neither data source contains age-specific es-timates of undercount for each race and year, so we extrapolate race ×age-specific estimates for 1980 and 2000 using the observed age struc-ture of undercount from the 1990 Census (Robinson et al. 1993), asshown in Table C2. These standardized values are obtained by rescal-ing the 1990 values to age-specific levels of undercount that, whenweighted for composition, reproduce the mean coverage error observedfor each racial group in 1980 and 2000. We rescale the 1990 valuesin two different ways: (1) multiplying each value by a constant, or (2)adding/subtracting a constant from each value. Both transformationspreserve the aggregate coverage changes between years (e.g., a net reduc-tion in undercount or overcount). The multiplicative scale also preservesthe direction (positive or negative) of coverage errors for each age group,as it simply rescales the absolute value of each error to a higher/lowernumber. By contrast, the additive scale, which adds/subtracts a con-stant to each age-specific undercount, can change the sign of cover-age errors for age groups with observed 1990 values that are close tozero.
The validity of our undercount estimates rests on two potentiallyproblematic assumptions. The first is that undercount rates for blacksand nonblacks can be generalized to minority groups and non-Hispanic

ESTIMATING NET INTERRACIAL MOBILITY 65T
AB
LE
C2
Per
cent
Und
erco
unt
byR
ace,
Age
,and
Yea
r
1980
Est
imat
eU
sing
1990
2000
Est
imat
eU
sing
1990
Age
Stru
ctur
e(3
)A
geSt
ruct
ure
(3)
Obs
erve
dV
alue
sA
ddit
ive
Scal
eM
ulti
plic
ativ
eSc
ale
from
1990
(a)
Add
itiv
eSc
ale
Mul
tipl
icat
ive
Scal
eA
geB
lack
Non
blac
kB
lack
Non
blac
kB
lack
Non
blac
kB
lack
Non
blac
kB
lack
0–4
7.51
2.36
7.08
2.07
8.28
2.54
5.53
1.22
4.17
5–9
6.71
2.36
6.39
2.07
7.48
2.54
4.73
1.22
3.76
10–1
43.
160.
213.
360.
313.
930.
391.
18−0
.93
1.98
15–1
9−0
.79
−2.3
9−0
.02
−1.8
1−0
.02
−2.2
2−2
.77
−3.5
3−0
.01
20–2
43.
21−1
.09
3.40
−0.7
53.
98−0
.92
1.23
−2.2
32.
0025
–29
7.91
2.91
7.42
2.52
8.68
3.09
5.93
1.77
4.37
30–3
47.
861.
867.
381.
668.
632.
045.
880.
724.
3435
–39
6.16
1.01
5.92
0.97
6.93
1.19
4.18
−0.1
33.
4940
–44
5.16
−0.0
45.
070.
115.
930.
143.
18−1
. 18
2.98
45–4
96.
261.
266.
011.
177.
031.
444.
280.
123.
5450
–54
5.91
1.21
5.71
1.13
6.68
1.39
3.93
0.07
3.36
55–5
95.
161.
315.
071.
215.
931.
493.
180.
172.
9860
–64
2.81
1.41
3.06
1.30
3.58
1.59
0.83
0.27
1.80
65–6
9−3
.69
0.26
−2.5
00.
36−2
.92
0.44
−5. 6
7−0
.88
−1.4
770
–74
−0.7
40.
510.
020.
560.
030.
69−2
.72
−0.6
30.
0175
+2.
910.
463.
140.
523.
680.
640.
93−0
.68
1.85
4.50
00.
800
4.50
00.
800
5.52
01.
080
2.78
0−0
.290
2.78
0W
eigh
ted
Mea
n(1
)0.
764
0.17
80.
855
0.81
8−0
.123
−0.2
15−2
.744
−1.3
160.
503
Scal
ing
Fac
tor
(2)
−18.
5%−2
5.9%
−18.
5%−2
5.9%
100.
0%10
0.0%
−49.
6%−1
26.9
%−4
9.6%
Rel
ativ
eC
hang
efr
om19
90
Sou
rce:
(a)
Rob
inso
net
al.1
993.
(1)
Wei
ghts
=R
ace∗
age
Com
posi
tion
.(2
)M
ulti
ple
of(f
orm
ulti
plic
ativ
esc
ale)
ornu
mbe
rsu
btra
cted
from
(for
addi
tive
scal
e)ob
serv
ed19
90va
lues
.(3
)19
80an
d20
00es
tim
ates
are
extr
apol
ated
from
the
1990
race
∗ age
stru
ctur
eof
unde
rcou
nt.

66 PEREZ AND HIRSCHMAN
whites, respectively. The second is that the age structure of undercountdid not change appreciably between 1980 and 2000.
REFERENCES
Ahmed, B., and G. Robinson. 1994. “Estimates of Emigration of the Foreign-BornPopulation:1980–1990.” Technical Working Paper No. 9, Population Division,U.S. Census Bureau, Washington, DC.
Alba, Richard D. 1990. Ethnic Identity: The Transformation of White America. NewHaven: Yale University Press.
Alba, Richard D., and R. M. Golden. 1986. “Patterns of Ethnic Marriage in theUnited States.” Social Forces 65:202–23.
Anderson, Margo J., and Stephan Fienberg. 2001. Who Counts? The Politics ofCensus Taking in Contemporary America. New York: Russell Sage Foundation.
Arias, Elizabeth. 2002. “United States Life Tables, 2000.” National Vital StatisticsReports 51(3). Hyattsville, MD: National Center for Health Statistics.
———. 2006 “United States Life Tables, 2003.” National Vital Statistics Reports54(14). Hyattsville, MD: National Center for Health Statistics.
Baltzell, E. Digby. 1964. The Protestant Establishment: Aristocracy and Caste inAmerica. New York: Vintage Books.
Bonnett, Alastair. 1998. “Who Was White? The Disappearance of Non-EuropeanWhite Identities and the Formation of European Racial Whiteness.” Ethnic andRacial Studies 21:1029–55.
Coale, Ansley J. 1955. “The Population of the United States in 1950 Classified byAge, Sex, and Color—A Revision of Census Figures.” Journal of the AmericanStatistical Association 50, 16–54.
Davis, F. James. 1991. Who Is Black? One Nation’s Definition. University Park:Penn State University Press.
Duncan, Otis Dudley. 1963. “Occupation Trends and Patterns of Net Mobility.”Demography 3:1–18.
Edmonston, Barry, and Jeffery Passel. 1994. “Ethnic Demography: U.S. Immigra-tion and Ethnic Variation.” Pp. 1–30 in Immigration and Ethnicity: The Inte-gration of America’s Newest Arrivals, edited by Barry Edmonston and JeffreyPassel. Washington, DC: Urban Institute.
Edmonston, Barry, Sharon M. Lee, and Jeffrey S. Passel. 2002. “Recent Trends inIntermarriage and Immigration and Their Effects on the Future Racial Com-position of the U.S. Population,” Pp. 227–55 in The New Race Question: Howthe Census Counts Multiracial Individuals, edited by Joel Perlmann and Mary C.Waters. New York: Russell Sage Foundation.
Ericksen, Eugene P., Joseph B. Kadane, and John W. Tukey. 1989. “Adjusting the1980 Census of Population and Housing.” Journal of the American StatisticalAssociation 84(408):927–44.
Eschbach, Karl. 1993. “Changing Identification Among American Indians andAlaskan Natives.” Demography 30:635–52.

ESTIMATING NET INTERRACIAL MOBILITY 67
———. 1995. “The Enduring and Vanishing American Indian.” Ethnic and RacialStudies 18:89–108.
Farley, Reynolds. 1991. “The New Census Question About Ancestry: What Did ItTell Us?” Demography 28:411–30.
———. 1999. “Racial Issues: Recent Trends in Residential Patterns and Intermar-riage.” Pp. 85–128 in Diversity and Its Discontents: Cultural Conflict and CommonGround in Contemporary American Society, edited by Neil J. Smelser and JeffreyC. Alexander. Princeton, NJ: Princeton University Press.
———. 2002. “Racial Identities in 2000: The Response to the Multiple Race Re-sponse Option.” Pp. 33–61 in The New Race Question: How the Census CountsMultiracial Individuals, edited by Joel Perlmann and Mary C. Waters. New York:Russell Sage Foundation.
Fay, Robert E., Jeffrey S. Passel, and John G. Robinson. 1988. The Coverage ofPopulation in the 1980 Census, Evaluation and Research Report PHC80-E4.Washington, DC: U.S. Department of Commerce, Bureau of the Census.
Ferrante, Joan W., and Prince Brown. 1998. “Classifying People by Race.” Pp. 109–119 in The Social Construction of Race in America, edited by Joan W. Ferranteand Prince Brown. New York: Longman.
Fischer, Claude, and Michael Hout. 2006. Century of Difference: How AmericaChanged in the Last One Hundred Years. New York: Russell Sage Foundation.
Frazier, E. Franklin. 1937. The Negro in the United States, Rev. ed. New York:Macmillan.
Fredrickson, George M. 2002. Racism: A Short History. Princeton: Princeton Uni-versity Press.
Gibbs, Jim C., Gregory S. Harper, Marc J. Rubin, and Hyon B. Shin. 2003. “Evalu-ating Components of International Migration: Native-Born Emigrants.” Popu-lation Division Working Paper Series No. 63, U.S. Census Bureau, Washington,DC.
Gibson, Campbell. 1992. “The Contribution of Immigration to the Growth andEthnic Diversity of the American Population.” Proceedings of the AmericanPhilosophical Society 136(2):157–75.
Hamilton, C. Horace. 1966. “Effect of Census Errors on the Measurement of NetMigration.” Demography 3(2):393–415.
Harris, David. 1994. “The 1990 Census Count of American Indians: What Do theNumbers Really Mean?” Social Science Quarterly 75:580–93.
Harris, David, and Jeremiah Sim. 2002. “Who Is Multiracial? Assessing the Com-plexity of Lived Race.” American Sociological Review 67:614–27.
Hart, H. 1921. Selective Migration as a Factor in Child Welfare in the United States,with Special Reference to Iowa. Iowa City: University of Iowa Press.
Herskovits, M. J. 1928. The American Negro: A Study in Racial Crossing. New York:Knopf.
Higham, John. 1988. Strangers in the Land: Patterns of American Nativism, 1860–1925. 2nd ed. New Brunswick, NJ: Rutgers University Press.
Himes, C. L., and Cliff C. Clogg. 1992. “An Overview of Demographic Analysisas a Method for Evaluating Census Coverage in the U.S.” Population Index58:587–607.

68 PEREZ AND HIRSCHMAN
Hirschman, Charles. 2002. “The Meaning of Race and Ethnic Population Pro-jections.” Pp. 51–72 in American Diversity: A Demographic Challenge for theTwenty-First Century, edited by Nancy A. Denton and Stewart E. Tolnay. Al-bany: State University of New York Press.
———. 2004. “The Origins and Demise of the Concept of Race.” Population andDevelopment Review 30:385–415.
Hirschman, Charles, Richard Alba, and Reynolds Farley. 2000. “The Meaning andMeasurement of Race in the U.S. Census: Glimpses in the Future.” Demography37:381–93.
Hollinger, David A. 2005. “The One Drop Rule & the One Hate Rule.” Daedalus134:18–28.
Hout, Michael, and Joshua Goldstein. 1994. “How 4.5 Million Irish ImmigrantsBecame 40 Million Irish-Americans: Demographic and Subjective Aspects ofthe Ethnic Composition of White Americans.” American Sociological Review59:64–82.
Ingram, Deborah D., J. D. Parker, N. Schenker, J. A. Weed, B. Hamilton, E. Arias,and J. H. Madans. 2003. United States Census 2000 Population with Bridged RaceCategories. Vital and Health Statistics Series 2—Data Evaluation and MethodsResearch 2(135):1–55.
Kraly, E. P. 1998. “Emigration: Implications for U.S. Immigration Policy Research.”Pp. 587–618 in Migration Between Mexico and the United States: BinationalStudy, Vol. 2, Research Reports and Background Materials. Mexico City andWashington, DC: Mexican Ministry of Foreign Affairs and the U.S. Commissionon Immigration Reform.
Lee, Y., and V. Ottati. 2002. “Attitudes Toward American Immigration Policy: TheRole of Ingroup-Outgroup Bias, Economic Concern, and Obedience to Law.”Journal of Social Psychology 142:617–34
Lieberson, Stanley, and Mary Waters. 1993. “The Ethnic Responses of Whites:What Causes Their Instability, Simplification, and Inconsistency?” Social Forces72:421–50.
Liebler, Carolyn A., and Andrew Halpern-Manners. 2008. “A Practical Approachto Using Multiple-Race Response Data: A Bridging Method for Public-UseMicrodata.” Demography 45(1):143–55.
Logan, John R. 2004. “How Race Counts for Hispanic Americans.” Sage RaceRelations Abstracts 29:7–19.
McDermott, Monica, and Frank L. Samson. 2005. “White Racial and EthnicIdentity in the United States.” Annual Review of Sociology31:245–61.
Mennell, Stephen. 1994. “The Formation of We-Images: A Process Theory.” Pp.175–97 in Social Theory and the Politics of Identity, edited by Craig Calhoun.Oxford, England: Blackwell.
Mulder, T. J. 2003. “Foreign-Born Emigration from the United States: 1990 to2000.” Presented at the annual meeting of the Population Association of Amer-ica, Minneapolis, MN.
Mulder, T. J., B. Guzman, and A. M. Brittingham. 2002. “Evaluating Componentsof International Migration: Foreign-Born Emigrants,” Technical Working PaperNo. 62, Population Division, U.S. Census Bureau, Washington, DC.

ESTIMATING NET INTERRACIAL MOBILITY 69
Nagel, Joane. 1996. American Indian Ethnic Renewal: Red Power and the Resurgenceof Identity and Culture. New York: Oxford University Press.
National Center for Health Statistics. 1985. U.S. Decennial Life Tables for 1979–81. Vol. 1, No. 1. DHHS Pub. No. (PHS) 85-1150-1. Public Health Service.Washington, DC: U.S. Government Printing Office.
———. 1997. U.S. Decennial Life Tables for 1989–91. Vol. 1, No. 1. Hyattsville,MD. 1997.
Office of Management and Budget. 1977. “Race and Ethnic Standards for FederalStatistics and Administrative Reporting.” Statistical Policy Directive No. 15, pp.37–38.
———. 1997. “Revisions to the Standards for the Classification of Federal Data onRace and Ethnicity.” Federal Register. Vol. 62, No. 210, October 30/Notices,pp. 58782–90.
Passel, Jeffrey S. 1976. “Provisional Evaluation of the 1970 Census Count of Amer-ican Indians.” Demography 13:397–409.
———. 1996. “The Growing American Indian Population, 1960–1990: BeyondDemography.” Pp. 79–102 in Changing Numbers, Changing Needs, edited byGary D. Sandefur, Ronald Rindfuss, and Barney Cohen. Washington, DC:National Academy Press.
Passel, Jeffrey S., and Patricia A. Berman. 1986. “Quality of 1980 Census Data forAmerican Indians.” Social Biology 33:163–82.
Passel, Jeffrey S. and K. A. Woodrow. 1987. “Change in the Undocumented AlienPopulation in the United States, 1979–1983.” International Migration Review21(4, Winter):1304–34.
Passel, Jeffrey S., Jennifer Van Hook, and Frank D. Bean. 2004. “Estimates of theLegal and Unauthorized Foreign-Born Population for the United States andSelected States, Based on Census 2000.” Paper prepared for U.S. Bureau of theCensus, Washington, DC.
Perez, Anthony Daniel. 2008. “Who is Hispanic? Shades of Ethnicity AmongLatino/a Youth.” Pp. 17–35 in Racism in Post-Race America: New Theories,New Directions, edited by Charles Gallagher. Chapel Hill, NC: Social ForcesPublishing.
Perez, Anthony Daniel, and Charles Hirschman. 2009. “An Historical Perspectiveon the Racial and Ethnic Composition of the American Population at the Turnof the Millennium.” Population and Development Review 35(1):1–51.
Perlmann, Joel, and Mary C. Waters, eds. 2002. The New Race Question: How theCensus Counts Multiracial Individuals. New York: Russell Sage Foundation.
Perry, Pamela. 2002. Shades of White: White Kids and Racial Identities in HighSchool. Durham, NC: Duke University Press.
Piper, Adrian. 1992. “Passing for White, Passing for Black.” Transition 58:4–32.Preston, Samuel H., Patrick Heuveline, and Michel Guillot. 2001. Demography:
Measuring and Modeling Population Processes. Oxford, England: Blackwell Pub-lishers.
Qian, Zhenchao, and Daniel T. Lichter. 2007. “Social Boundaries and Marital As-similation: Interpreting Trends in Racial and Ethnic Intermarriage.” AmericanSociological Review 72:68–94.
70 PEREZ AND HIRSCHMAN
Roberts, Sam. 2008. “A Generation Away, Minorities May Become Majority in theU.S.” New York Times, August 14, p. 1.
Robinson, John G. 1996. “What Is the Role of Demographic Analysis in the 2000United States Census?” Proceedings of Statistics Canada Symposium 1996: Non-sampling errors. Ottawa: Statistics Canada.
Robinson, John G., B. Ahmed, P. Das Gupta, and K. A. Woodrow. 1993. “Estima-tion of Population Coverage in the 1990 United States Census Based on Demo-graphic Analysis.” Journal of the American Statistical Association 88(423):1061–71.
Ryder, Norman B. 1964. “Notes on the Concept of a Population.” American Journalof Sociology 69:447–63.
Rosenberg, Harry M., Jeffrey D. Maurer, Paul D. Sorlie, Norman J. Johnson,Marian F. McDorman, Donna L. Hoyert, James F. Spitler, and Chester Scott.1999. Quality of Death Rates by Race and Hispanic Origin: A Summary of CurrentResearch. Vital and Health Statistics Series 2(128).
Schenker, Nathaniel. 2003. “Assessing Variability Due to Race Bridging: Appli-cation to Census Counts and Vital Rates for the Year 2000.” Journal of theAmerican Statistical Association 98:818–28.
Schnore, Leo F. 1961. “Social Mobility in Demographic Perspective.” AmericanSociological Review 26:407–23.
Skerry, Peter. 2000. Counting on the Census? Race, Group Identity, and the Evasionof Politics. Washington DC: Brookings Press.
Snipp, C. Matthew. 1989. American Indians: The First of this Land. New York:Russell Sage.
———. 1997. “Some Observations About Racial Boundaries and the Experiencesof American Indians.” Ethnic and Racial Studies 20:667–89.
Spencer, Rainier. 2006. “New Racial Identities, Old Arguments: Continuing Bio-logical Reification.” Pp. 83–102 in Mixed Messages: Multiracial Identities in the“Color Blind” Era, edited by David L. Brunsma. Boulder CO: Lynne ReinnerPublishers.
Stuckert, Robert P. 1958. “African Ancestry of the White American Population.”Ohio Journal of Science 58:155–60.
———. 1976. “Race Mixture: The Black Ancestry of White Americans.” Pp. 135–39 in Physical Anthropology and Archaeology, edited by Peter B. Hammon. NewYork: Macmillan.
Thornthwaite, C. Warren. 1934. “Internal Migration in the United States.”Philadelphia: University of Pennsylvania Press.
U.S. Census Bureau. 2001. The Fertility of American Women: June 2000. CurrentPopulation Reports P10-S43RV. Washington, DC.
———. 2002. “Comparison of A.C.E. Revision II Results with Demographic Anal-ysis.” DSSD A.C.E. Revision II Estimates Memorandum Series #PP-41. Wash-ington, DC.
———. 2008. “An Older and More Diverse Nation by Midcentury,” Internet PressRelease. Retrieved August 14, 2008 (http://www.census.gov/Press-Release/www/releases/archives/population/012496.html).

ESTIMATING NET INTERRACIAL MOBILITY 71
U.S. Department of Homeland Security. 2005. “Estimates of the Unautho-rized Immigrant Population Residing in the United States: January 2005.”Retrieved August 14, 2008 (http://www.dhs.gov/xlibrary/assets/statistics/publications/ILL_PE_2005.pdf).
Warren, R., and Jeffrey S. Passel. 1987. “A Count of the Uncountable: Estimates ofUndocumented Aliens Counted in the 1980 United States Census.” Demography24(August 3):375–94.
Warren, R., and J. Peck. 1980. “Foreign-Born Emigration from the United States:1960 to 1970.” Demography 17(February 1):71–84.
Waters, Mary. 1990. Ethnic Options: Choosing Identities in America. Berkeley:University of California Press.
Williamson, Joel. 1980. New People: Miscegenation and Mulattoes in the UnitedStates. New York: Free Press.
Xie, Yu, and Kim Goyette. 1997. “The Racial Identification of Biracial Childrenwith One Asian Parent: Evidence from the 1990 Census.” Social Forces 76:547–570.