Estimating Health Benefits when Behaviors are Endogenous ... · Estimating Health Benefits when...
59
SANDEE Working Paper No. 34-08 October 2008 South Asian Network for Development and Environmental Economics (SANDEE) PO Box 8975, EPC 1056 Kathmandu, Nepal Estimating Health Benefits when Behaviors are Endogenous: A Case of Indoor Air Pollution in Rural Nepal KRISHNA PRASAD PANT Center for Economic Development and Administration (CEDA) Tribhuvan University, Kathmandu, Nepal
Transcript of Estimating Health Benefits when Behaviors are Endogenous ... · Estimating Health Benefits when...
SANDEE Working Paper No. 34-08
October 2008
South Asian Network for Development and Environmental Economics (SANDEE)PO Box 8975, EPC 1056
Kathmandu, Nepal
Estimating Health Benefits when Behaviors areEndogenous: A Case of Indoor Air Pollution
in Rural Nepal
KRISHNA PRASAD PANT
Center for Economic Development and Administration (CEDA)Tribhuvan University, Kathmandu, Nepal
lmantha
Text Box
This work is used with the permission of South Asian Network for Development and Environmental Economics (SANDEE). © 2008, South Asian Network for Development and Environmental Economics (SANDEE).

2 SANDEE Working Paper No. 34-08
Published by the South Asian Network for Development and Environmental Economics(SANDEE)PO Box 8975, EPC 1056 Kathmandu, Nepal.Telephone: 977-1-552 8761, 552 6391 Fax: 977-1-553 6786
SANDEE research reports are the output of research projects supported by the SouthAsian Network for Development and Environmental Economics. The reports have beenpeer reviewed and edited. A summary of the findings of SANDEE reports are alsoavailable as SANDEE Policy Briefs.
National Library of Nepal Catalogue Service:
Krishna Prasad PantEstimating Health Benefits when Behaviors are Endogenous: A Case of Indoor Air Pollution inRural Nepal(SANDEE Working Papers, ISSN 1893-1891; 2008- WP 34)-
ISBN: 978 - 9937 - 8093 - 3 - 7
Key words:
1. Indoor air pollution2. Biogas3. Chronic bronchitis4. Asthma5. Acute respiratory infections6. Instrumental variable probit
II
The views expressed in this publication are those of the author and do not necessarilyrepresent those of the South Asian Network for Development and EnvironmentalEconomics or its sponsors unless otherwise stated.
SANDEE Working Paper No. 34-08 3
Technical EditorPriya Shyamsundar
Mani Nepal
English EditorCarmen Wickramagamage
The South Asian Network for Development andEnvironmental Economics
The South Asian Network for Development and Environmental Economics(SANDEE) is a regional network that brings together analysts from differentcountries in South Asia to address environment-development problems. SANDEE’sactivities include research support, training, and information dissemination.SANDEE is supported by contributions from international donors and its members.Please see www.sandeeonline.org for further information about SANDEE.
SANDEE is financially supported by International Development Research Centre(IDRC), Swedish International Development Cooperation Agency (SIDA) andNorwegian Agency for Development Cooperation (NORAD).
Comments should be sent to Krishna Prasad Pant, Center for Economic Development andAdministration (CEDA), Tribhuvan University, Kathmandu, Nepal. Email: [email protected]
III

4 SANDEE Working Paper No. 34-08IV
SANDEE Working Paper No. 34-08 5V
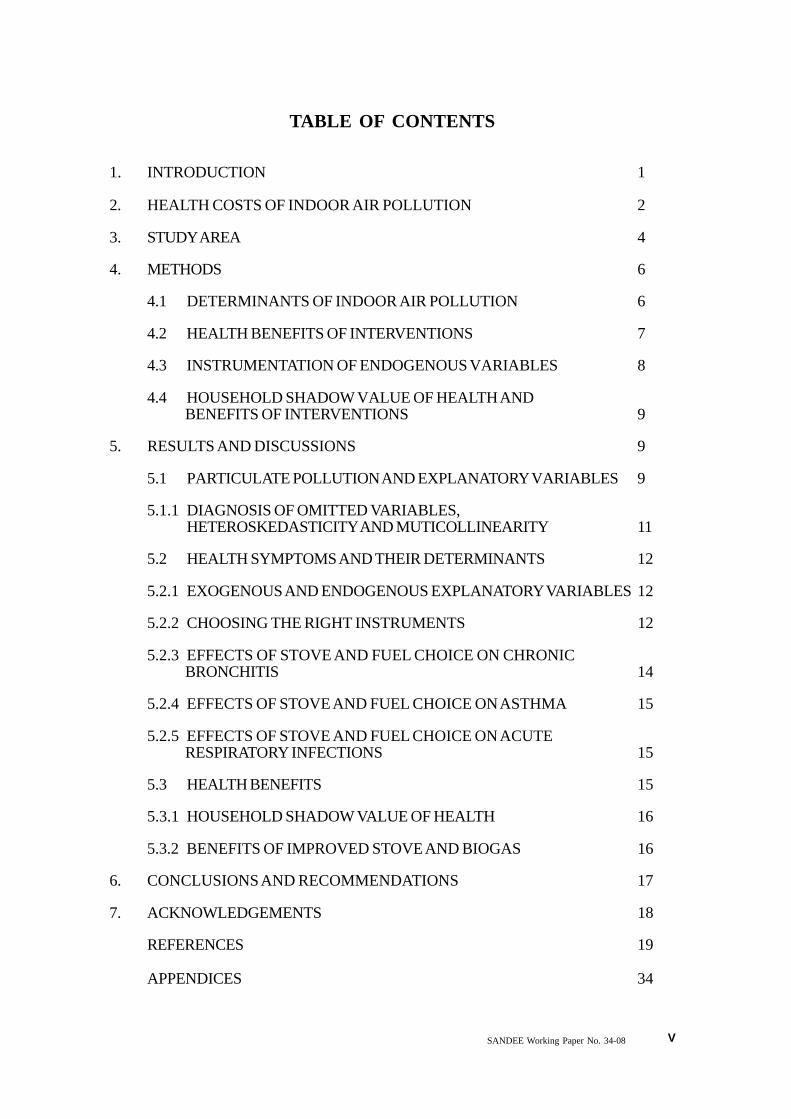
TABLE OF CONTENTS
1. INTRODUCTION 1
2. HEALTH COSTS OF INDOOR AIR POLLUTION 2
3. STUDY AREA 4
4. METHODS 6
4.1 DETERMINANTS OF INDOOR AIR POLLUTION 6
4.2 HEALTH BENEFITS OF INTERVENTIONS 7
4.3 INSTRUMENTATION OF ENDOGENOUS VARIABLES 8
4.4 HOUSEHOLD SHADOW VALUE OF HEALTH ANDBENEFITS OF INTERVENTIONS 9
5. RESULTS AND DISCUSSIONS 9
5.1 PARTICULATE POLLUTION AND EXPLANATORY VARIABLES 9
5.1.1 DIAGNOSIS OF OMITTED VARIABLES,HETEROSKEDASTICITY AND MUTICOLLINEARITY 11
5.2 HEALTH SYMPTOMS AND THEIR DETERMINANTS 12
5.2.1 EXOGENOUS AND ENDOGENOUS EXPLANATORY VARIABLES 12
5.2.2 CHOOSING THE RIGHT INSTRUMENTS 12
5.2.3 EFFECTS OF STOVE AND FUEL CHOICE ON CHRONICBRONCHITIS 14
5.2.4 EFFECTS OF STOVE AND FUEL CHOICE ON ASTHMA 15
5.2.5 EFFECTS OF STOVE AND FUEL CHOICE ON ACUTERESPIRATORY INFECTIONS 15
5.3 HEALTH BENEFITS 15
5.3.1 HOUSEHOLD SHADOW VALUE OF HEALTH 16
5.3.2 BENEFITS OF IMPROVED STOVE AND BIOGAS 16
6. CONCLUSIONS AND RECOMMENDATIONS 17
7. ACKNOWLEDGEMENTS 18
REFERENCES 19
APPENDICES 34
6 SANDEE Working Paper No. 34-08
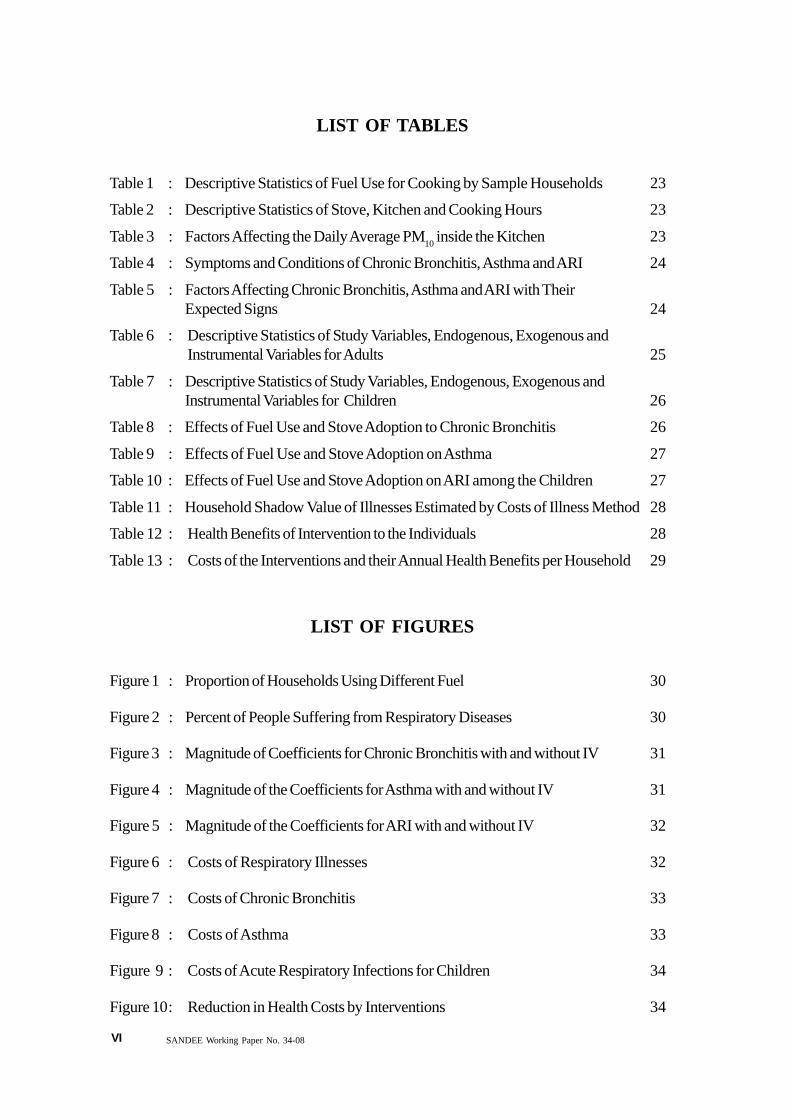
LIST OF TABLES
Table 1 : Descriptive Statistics of Fuel Use for Cooking by Sample Households 23
Table 2 : Descriptive Statistics of Stove, Kitchen and Cooking Hours 23
Table 3 : Factors Affecting the Daily Average PM10 inside the Kitchen 23
Table 4 : Symptoms and Conditions of Chronic Bronchitis, Asthma and ARI 24
Table 5 : Factors Affecting Chronic Bronchitis, Asthma and ARI with TheirExpected Signs 24
Table 6 : Descriptive Statistics of Study Variables, Endogenous, Exogenous and Instrumental Variables for Adults 25
Table 7 : Descriptive Statistics of Study Variables, Endogenous, Exogenous andInstrumental Variables for Children 26
Table 8 : Effects of Fuel Use and Stove Adoption to Chronic Bronchitis 26
Table 9 : Effects of Fuel Use and Stove Adoption on Asthma 27
Table 10 : Effects of Fuel Use and Stove Adoption on ARI among the Children 27
Table 11 : Household Shadow Value of Illnesses Estimated by Costs of Illness Method 28
Table 12 : Health Benefits of Intervention to the Individuals 28
Table 13 : Costs of the Interventions and their Annual Health Benefits per Household 29
LIST OF FIGURES
Figure 1 : Proportion of Households Using Different Fuel 30
Figure 2 : Percent of People Suffering from Respiratory Diseases 30
Figure 3 : Magnitude of Coefficients for Chronic Bronchitis with and without IV 31
Figure 4 : Magnitude of the Coefficients for Asthma with and without IV 31
Figure 5 : Magnitude of the Coefficients for ARI with and without IV 32
Figure 6 : Costs of Respiratory Illnesses 32
Figure 7 : Costs of Chronic Bronchitis 33
Figure 8 : Costs of Asthma 33
Figure 9 : Costs of Acute Respiratory Infections for Children 34
Figure 10: Reduction in Health Costs by Interventions 34
VI
SANDEE Working Paper No. 34-08 7
Abstract
A majority of rural households in developing countries still use solid fuels for cooking. Manystudies show linkages between the indoor air pollution from solid fuels with respiratory healthproblems. These estimates, however, suffer from an endogeneity bias arising from the effects ofhealth conditions on fuel choice. This study estimates the effects of indoor air pollution onrespiratory health after adjusting for endogenous health behaviors. Our study, which includesmeasurements on indoor air pollution, is based on a detailed survey of 600 rural households fromSyangja and Chitwan districts of Nepal. We employ instrumental variable probit regressions tofind the effects of pollution-reducing interventions on chronic bronchitis, asthma and acuterespiratory infections. The estimates with the instrumental variable approach are found to belarger than those that do not correct for endogeneity. Improved cook stoves and biogas arefound to reduce respiratory diseases. We also estimate household shadow values for chronicbronchitis, asthma and acute respiratory infections using the cost of illness method. We estimatethe annual reduction in health costs per intervention of stove to be Rs 1,217 and that of biogas tobe Rs 647. The health benefits from improved stoves are many times higher than the cost whilethe health benefits from biogas plant are nearly equal to its cost. We, however, do not includeother benefits of the interventions like energy efficiency, forest conservation and reduction incarbon emissions. The comparison between annual health benefits and costs shows that there isno clear reason for not buying the interventions.
Keywords: Indoor air pollution, Biogas, Chronic bronchitis, Asthma, Acute respiratoryinfections, Instrumental variable probit.
JEL Classification: Q42, I12.
VII

SANDEE Working Paper No. 34-08 1
Estimating Health Benefits when Behaviors areEndogenous: A Case of Indoor Air
Pollution in Rural NepalKrishna Prasad Pant
1. Introduction
Many rural households in low-income countries use traditional biomass fuels for cooking, whichis a major source of indoor air pollution (IAP) and related illnesses. Approximately half theworld’s population, which includes up to 90 percent of rural households in developing countries,still relies on unprocessed biomass fuels in the form of wood, dung and crop residues (WorldResources Institute, UNEP, UNDP, World Bank, 1998). Pollutants from biomass fuel combustionfor cooking are the main source of IAP and a primary cause of respiratory ill health among ruralpeople, particularly among those who cook food. Empirical studies consistently report significantdirect relationships between exposure to IAP and respiratory illnesses (Pandey, 1984; Pandey,et al., 1989; Smith, 2000).
Studies show that over 89 percent of total energy use in Nepal comes from traditional fuels(ADB, 2003). The exposure to IAP, especially to particulate matter, from the combustion ofbiomass fuels (wood, charcoal, dung and agricultural residues) has been cited as a causal agentof respiratory diseases (Chen, et al., 1990). Although charcoal, dung and agricultural residuesare in limited use in Nepal, 66 percent of households use wood as the main fuel for cooking. Theuse of modern fuels in contrast is rather limited. Only 13 percent of households use kerosenewhile eight percent use liquid petroleum gas (LPG). Households using biogas as the main fuel isless than two percent (CBS, 2002).
In the past decade, the literature on IAP and health has grown rapidly, including analyses of themagnitude of the problem, and the physical impacts of interventions (Larson and Rosen, 2002).But estimates of the effects of IAP on respiratory illness obtained from the literature suffer fromproblems of endogeneity. Although effects of IAP on respiratory health are discussed in severalstudies, most ignore the effect of health conditions on stove and fuel choice. Ignoring thisendogeneity leads to biased measures of the effects of behavior on health (Briscoe et al., 1990).If we use an ordinary least square (OLS) to estimate the effects of air pollution on health, theerror term is correlated with explanatory variable air pollution. When the level of pollution ishigh, the error term is likely to be negative; when the pollution level is low the error term ispositive. The correlation of the explanatory variable with the error term violates the basic assumptionof the OLS. Therefore, not only does exposure to pollution affects health but health problemsaffect the exposure leading to a problem of endogeniety. In such case of circularity, single equationestimate results in a simultaneity bias with inefficient estimates.
On the policy front, IAP is inextricably linked to poverty. It is the poor who both rely on lower-grade fuels and have the least access to clean technologies for cooking and heating (Bruce, etal., 2000). Therefore, reducing IAP can contribute to the Millennium Development Goals ofpoverty reduction by reducing health costs and making the people better off. Moreover, manystudies emphasize that poor women and children are at greatest risk from the health effects ofIAP (Boy, et al., 2000). However there has been little analysis to date of the reasons for low

2 SANDEE Working Paper No. 34-08
household-level demand for IAP reducing interventions. Public health officials, researchers andprogram implementers working in the area of IAP abatement, therefore, need to understand thehealth benefits of IAP reducing interventions. Though the literature on IAP and health has grownrapidly, it is still not clear why acceptance and adoption of improved technologies that reduceIAP are still low in the rural areas of developing countries.
This research aims to estimate the precise effects of IAP on child and adult respiratory healthafter adjusting for the simultaneity bias created by the problem of endogeniety. The specificobjectives of this study are to: a) find the factors, including interventions, affecting the level ofparticulate pollution in the kitchen; b) estimate the marginal effects of indoor air pollution variableson respiratory health outcomes of adults and children; c) estimate the household’s shadow pricesfor changes in child and adult health; and d) estimate the marginal willingness to pay for theinterventions that reduce respiratory health problems. The data for this study comes from asurvey of 600 households selected randomly from six Village Development Committees fromCentral Nepal.
The next section deals with health costs of indoor air pollution. The third section is devoted to thedescription of the study area. The methodology of the study is discussed in detail in section four.The section five presents the results and discussion including particulate pollution, determinantsof health symptoms and health benefits of intervention. Section six concludes.
2. Health Costs of Indoor Air Pollution
A major shortcoming in the literature on air pollution and the subsequent health hazards has beenits focus on outdoor air pollution. Remarkably few studies have measured IAP (Pearce, 1996).World Health Organization however recognizes that human exposure to a number of importantindoor air pollutants is much larger than those created by outdoor pollution (WHO, 1997). If wewere to add up the total population of the developing world and express it as person hours, 70percent of all person hours are spent indoors (Smith, 1988). Though the research on exposureto indoor smoke and its impacts on respiratory diseases in developing countries began in the1960s and ’70s in India, Nigeria, and Papua New Guinea (Ezzati and Kammen, 2002), theevidence for causal links between IAP and several diseases is still accumulating.
Poor people use biomass fuel for cooking because they are cheaper than modern fuels and aregenerally easily accessible. But the health costs can be high – a point that is generally notunderstood or ignored by the less educated rural poor to whom the linkages between theirdiseased condition and the type of stove they use or the fuels they burn are not clearly visible.The indoor use of biomass fuels leads to levels of IAP many times higher than internationalambient air quality standards that expose poor women and children on a daily basis to a majorpublic health hazard (von Schirnding, et al., 2000). The biomass contains a large number ofpollutants and known health hazards, including particulate matter (PM), carbon monoxide (CO),nitrogen dioxide, formaldehyde, and polycyclic organic matter, such as benzoapyrene, a carcinogen(Ezzati and Kammen, 2002). Burning a kilogram of wood in a new wood stove will produceabout 130 grams of carbon monoxide, 51 grams of hydrocarbons (including up to 10 grams ofcarcinogenic benzene), 21 grams of fine particulates, and about 0.3 grams of the highly carcinogenicpolycyclic organic hydrocarbons (EPA, 1986; Larson and Koenig, 1993). Wood burning alsoproduces 10 to 167 milligrams of highly carcinogenic dioxins per kilogram of fuel burning (Abelson,1994). When exposed, these pollutants are found to cause respiratory diseases to the individuals.
SANDEE Working Paper No. 34-08 3
Chronic obstructive pulmonary disease (COPD) is a severe respiratory health problem. It ischaracterized by abnormalities in the lungs which make it difficult to exhale normally. Generally,two distinct diseases are involved in this case: emphysema and chronic bronchitis. Emphysemaand chronic bronchitis cause excessive inflammatory processes that eventually lead to abnormalitiesin lung structure that permanently obstruct airflow (hence the term “chronic obstructive”). Arecent study shows that adults with asthma are 12 times more likely to develop COPD thanthose who do not have the condition (Silva et al. 2004).
Similarly, acute respiratory infection (ARI) is another severe respiratory problem typically commonamong the children. It is the single most important cause of mortality in children under five yearsof age, accounting for around 2 million deaths annually in this age group. Various studies indeveloping countries have reported on the association between exposure to indoor air pollutionand acute lower respiratory infections (Kossove, 1982; Campbell, et al., 1989; Collings, et al.,1990; Armstrong and Campbell 1991). In rural Nepal many such patients are not diagnosedand treated properly. Data on COPD and ARI are not readily available for the study and thechallenging data gap is met by the household survey. More challenging is the adoption of theintervention to reduce the root cause of such diseases – the pollutant.
Studies show that the interventions for reducing IAP save health costs to people affected. Yelin etal., (2002) estimate the direct cost of all respiratory diseases at $45 billion in the US (in 1996prices). They show that healthcare expenditure on behalf of persons with respiratory conditionshas a substantial impact on the nation’s economy and that the increment specifically attributableto these conditions raises total expenditure among persons with respiratory conditions. Theintervention also saves lives. Smith (2000) makes a conservative estimate that nearly half amillion premature deaths annually can be attributed to the use of biomass fuels.
The available literature has not arrived at a consensus on the ways to either mitigate or preventIAP when it comes to poor rural households in developing countries. On one hand, recentreports from Bangladesh (Dasgupta et al., 2004, 2006) link the level of IAP with wall and roofpermeability as well as the location of the kitchen and its openness to other rooms in the house.They find that the construction of walls and roofs have significant effects on IAP concentration.However, they also find that different sources of biomass fuel contribute very little towards explainingdifferences in measured average IAP. They conclude therefore that fuel choice is less importantthan ventilation factors when it comes to explaining variation in IAP among poor households.They further argue that while ventilation changes are inexpensive, lack of awareness among ruraldwellers becomes the primary limiting factor in preventing the problem of IAP.
However, using Bangladesh as a case study, Pitt et al. (2005), conclude that improving ventilationby increasing the permeability of roofs or walls has no significant effect on the health outcomes.They conclude that proximity to the stove is the major factor in explaining health effects. Theyargue that household decisions regarding division of labour along gender lines lead to differentlevels of exposure of individual family members to IAP. These findings might lead us to concludethat avoiding exposure to the stove could be one of the major preventive measures. The householdcan decide to spare a particular member by allocating other jobs to him or her. However,sparing an individual member of the household cannot help a household as such since someonehas to be assigned the task of preparing food.
It should be however noted that attempts to prevent exposure to pollution by either making thewall or roof of the kitchen permeable or by switching the stoves or fuels in use can only be
4 SANDEE Working Paper No. 34-08
endogenous if the households make such adjustments with the express intention of reducing IAP.The reallocation of household labour in order to mitigate the problem of respiratory illness due toIAP is also endogenous if the decision is made on the basis of the knowledge that exposure topollution was the cause. Such decisions, dependent on past or current health conditions orperceived future problems create circularity from an analytical perspective. Briscoe et al. (1990)argue that the estimates become biased if such problems of endogeneity are ignored. Unbiasedand reliable estimates of health benefits are thus required in order to assist rural people to makesound decisions.
3. Study Area
Our study employs primary data generated from a sample survey and pollution monitoringobservations in the rural areas of central Nepal (see Map 1).1 Over 81 percent of the householdsin this area are rural dwellers (CBS, 2002). Although fuel use statistics are not available separatelyfor the rural and urban areas, the dependency on solid fuels is higher in rural areas. People usekerosene mainly for lighting purposes in areas that do not have access to electricity.2 Because ofunavailability, switching to LPG and electricity are not the options in rural areas.
Until recently, the health effects of IAP due to burning of biomass cooking fuels have not beenknown in the area. Some interventions like improved cooking stoves (ICS) and biogas plantsare sparse in their impact and reach. Though the intensity of such interventions is higher in thecentral part of the country, coverage is still very low benefiting only about two percent of thepopulation. Moreover, ICS and biogas are aimed particularly at reducing fuel-wood consumption.
Two districts, Syangja from the hill area and Chitwan from the plains, were selected purposivelyfor the study. The Village Development Committees (VDCs), the smallest administrative units, ineach district were ranked on the basis of the intensity of ICS and biogas plants. The intensity ofICS and biogas in each VDC was estimated by taking the ratio of adopter households that havecompleted one year of adoption3 to the total number of households. From the VDCs thusranked, we selected three sample VDCs from the first 12 VDCs by using systematic samplingwith a random start.4 That is, we selected one VDC randomly from the first four while from thenonwards every fourth VDC was selected to make a sample of three VDCs in each district. Thusthe sampling is unequal probability sampling giving more weight to higher intensity areas than tothe lower intensity areas. The rationale behind this sampling scheme is to develop a sample ofhouseholds with a sufficiently large number of interventions, mainly ICS and biogas for statisticalanalysis.5
A list of the households obtained from the records of the selected VDCs forms the samplingframe. The population of Nepal living in the hills (including mountains) is about fifty percent; the
1 For purposes of development administration, Nepal is divided into five development regions, namelyEastern, Central, Western, Mid-western and Far-western.
2 Nearly 63 percent of the households in Nepal are not yet supplied with electricity (CBS, 2004).3 Interventions adopted in the recent months may not be enough to exhibit the effects on respiratory
health.4 Syangja district comprises of 60 VDCs and Chitwan district 37 VDCs. In addition, each district has two
municipalities. These are not included in the sampling frame.5 Nepal Living Standard Survey (2003/04) shows that only two percent households in Nepal have a biogas
plant while two percent have improved cooking stoves.

SANDEE Working Paper No. 34-08 5
rest live in the plains. Accordingly, we divided the sample equally for the hills (300 households)and the plains (300 households). We then allocated the sample households in each district tothree select VDCs6 based on the probability proportionate to the number of households. Fromthe sampling frame for each select VDC, we selected the required number of sample householdsand one-fourth replacement households.7 In the survey, the actual number of replacementhouseholds is less than two percent.
We conducted the household survey using a structured pre-tested questionnaire. The questionnaireincluded modules on stove and fuel, family and respiratory diseases, costs of illness and householdincome (please see Annex I for details). It was administered by a team of trained enumerators.In rural Nepal, many diseases go untreated or at least not properly diagnosed. Consequently,we undertook a survey of symptoms - in order to identify cases of COPD, for instance, wesurveyed the symptoms of chronic bronchitis and asthma. Similarly, we surveyed the appearanceof the symptoms of ARI when it comes to the children.
We selected a sub-sample of 99 households for pollution monitoring in the kitchen. The procedureadopted was the random selection of one out of the three sample VDCs for each district.8
Similarly, the selection of the monitored households out of the sample households was random.PM and CO are major pollutants in the biomass burning kitchen. As the effect of CO is shortlived and that of PM is cumulative, many studies focus on the latter. Our study monitored thePM10 level9 in the kitchen using the Laser Dust Monitor (LD–1). The LD-1 measures the intensityof the laser beam scattered by the dust particles of specific size. The device is run for 10 minutesfor each reading. Investigators took two readings from the kitchen of each sample household –one during cooking and another during no cooking. For each reading, the researchers firstconverted the counts obtained for 10 minutes into count per minute (CPM); they then convertedthe CPM to a microgram per meter cube of air (µg/m³) multiplying by a conversion factor (k=9.192) developed by Yadav et al. (2004) in similar situations by running Laser Dust Monitor andthe High Volume Air Sampler side by side.
6 The sample VDCs are Setidobhan (81 sample households), Sworek (125 households) and Tindobate (94households) from Syangja district and Pithuwa (105 households), Gitanagar (125 household) and Shivnagar(70 household) from Chitwan district.
7 The number of households in the VDCs of Syangja district is found to be smaller than those in the VDCsof Chitwan district. In Syangja district, we select one household randomly from the first nine householdswhile every ninth household is selected thereafter. In order to develop the 25 percent replacementhouseholds, we selected the first household randomly while every 36th household is selected thereafter.Similarly, from the register maintained by the VDCs in Chitwan district, we selected one household ran-domly from the first 20 households, while every 20th household from it is selected thereafter. In order todevelop the 25 percent replacement households, after the first household is selected every 80th house-hold from it is selected thereafter.
8 The sub-sample for monitoring includes 50 households from Sworek in Syangja district and 49 house-holds from Gitanagar in Chitwan.
9 Particulate matters of size 10 micron or less (PM10) are more damaging to health than the particulate matterof larger size
6 SANDEE Working Paper No. 34-08
4. Methods
We use households as the unit of analysis. With given exogenous income and time, householdsattempt to maximize their utility with consumption, leisure and fuel attributes. Every fuel carries acost to the household. Some fuels have direct costs, others have indirect costs, while someothers have both in different proportions. Electricity and petroleum fuels have direct costs likestartup costs and consumption-based tariffs. Biomass fuels collected or produced by the householditself carry the opportunity cost of labour and land. The time and budget constraints implicitlycapture these opportunity costs. When the households operate in fuel markets, the price isdetermined by the market price. For non-market participants, the price of biomass is theopportunity cost of collection labour and the indirect health costs if that is known to them. Ourstudy focuses on estimating these indirect health costs.
We begin with the notion of household welfare represented by an indirect utility function, whereutility is derived from the consumption of various goods and services and leisure. As the health offamily members is affected negatively by polluting fuels like fuelwood, it is necessary to consideran expanded form of the household utility function that includes health-related variables.Households can be viewed as choosing a combination of fuels that maximize their utility fromcooking to fuel efficiency and health given full information, budget and other resource constraints.But, health costs being indirect, it is hard to believe that the households have full information. Thestudy attempts to generate information that will be helpful in the reconsideration of benefits andcosts by households in the hope that it will in turn lead to an increase in the adoption of pollution-reducing interventions and household utility.
Given our interest in understanding the health impacts of IAP and household’s demand for lesspolluting technology, the household utility maximization allows us to test the following alternativehypotheses:
a) Improved stove technology reduces indoor air pollution;b) Switching to clean fuel reduces the level of particulate pollution in the kitchen;c) Adoption of improved stove and clean fuel affect positively the respiratory health of adults
and children;d) The shadow prices of households for changes in child and adult health is positive;e) Health benefits of major interventions are larger than their market price.
For testing the first and second hypotheses, we estimate a pollution production function, whereasfor testing the third one we estimate a health production function. The last two hypotheses aretested using cost of illness estimates.
4.1 Determinants of Indoor Air Pollution
There are three practical strategies through which to figure out which set of activities and behaviorsare associated with IAP generation. First, we summarize the data to see if a sufficient number ofpeople engage in an activity. Next, we note whether there is some variation as well as correlationbetween activities. For example, since almost everyone uses dry wood and/or breaks firewoodinto small pieces before cooking, this reduces the likelihood that we will be able to find out howsuch behaviors influence IAP in this sample. Third, based on the understanding we have from thefirst two strategies, we estimate a pollution production function.
SANDEE Working Paper No. 34-08 7
After making a short list of behaviors/choices, which include fuel choice, cooking technology,kitchen characteristics, and behaviors during cooking (breaking into small pieces, using dry woodand kerosene to start the fire, etc.), we followed the second strategy and dropped some of thesevariables from our analyses. Then, for the data set of 99 households (for whom PM10 wasmeasured), we regressed the measured PM10 on the short-listed behaviors in order to identifywhich choices significantly affect IAP (all else being equal).
We estimated a log-linear production function for IAP. We then tested for the problems of omittedvariables, heteroskedasticity and multicollinearity in order to gauze the reliability of the estimates.
We specify the pollution production function as follows:
Where, ln (PM10j) is the natural log of the level of PM10 measured in the kitchen in household j;Sj is the type of stove in the household j, Fj is a vector of fuel used in the household j, Kj is avector of kitchen structures in household j, tj is the time spent (hours/day) for cooking in householdj, ej is the error term; and â1, â2, are coefficient vectors and ±, â3 and â4 are the coefficients tobe estimated.
4.2 Health Benefits of Interventions
In order to estimate the individual health effects of pollution variables, we regress individualhealth outcomes on pollution variables and individual characteristics. This model includes thefixed effects in terms of geographical area.
We estimate a probit regression with a dichotomous dependent variable (y = 1 when symptomsexist and y = 0 when there are no disease symptoms). This model is derived from the normalcumulative distribution function (CDF) (Gujarati, 2003).
Pr(yi = 1) = F (xi b) (2)
Here b is a parameter vector to be estimated, and F is the normal cumulative distribution function.The term ‘xb’ is the probit score or utility index. Since ‘xb’ has a normal distribution, the probitcoefficients are tested with the Z test (Gujarati, 2003).
We assess the negative impacts of indoor air pollution on respiratory health outcomes for chronicbronchitis and asthma among 2,723 individuals and for the ARI among 301 children. In ruralareas of Nepal, it is practically difficult to analyze cost of illness on the basis of medically identifiedcases of such diseases from the household samples because many diseases go untreated or atleast not properly diagnosed. Hence, the visible symptoms of these diseases are surveyed forthe purpose. Symptoms of chronic cough and hemoptysis are taken as the indicators for thepresence of chronic bronchitis and shortness of breath or dyspnea as the indicators of asthma.The ARI symptoms are assessed for children aged five years and less. The explanatory variablesincluded are cooking technology and fuel, and personal characteristics such as age and gender.
We estimate the following probit equation as the health function of pollution exposure, conditionalon individual and household characteristics:
8 SANDEE Working Paper No. 34-08
Where, Hij is the incidence of any respiratory disease symptom for person i in household j; Wj isa vector of smoke averting activities (stove and fuels) adopted by household j that are endogenous;Aij is a vector of person-specific attributes (age, gender) that are exogenous; Gj is a geographicalcharacteristic (hill or plain) that is exogenous; eij is the error term; â1, â2 and â3 are the vectorsof coefficients to be estimated.
We call W the pollution variables not because they measure IAP (as in PM10) but because theyare the best proxy, given the nested sampling for PM10 in 99 (and not 501) households. Pollutionvariables such as fuel and stove are more visible and meaningful to discuss with rural householdsthan the actual measure of pollution level that the scientific community prefers.
4.3 Instrumentation of Endogenous Variables
First we identify exogenous variables, such as, age, sex, and geographical area of residence thatmay affect the health outcomes. Then we identify the potentially endogenous variables that affecthealth and are also likely to be affected from health-related household decisions. The endogenousvariables identified are ICS plus heaters, biogas, LPG and fuel wood. These endogenous variablesare instrumented using a set of instruments that are discussed below.
Identification of valid instruments requires imagination, diligence, and sophistication (Murray,2006). We short-listed all possible candidate instruments first and tested their association to thehealth outcomes based on the validity and strength criteria discussed above. We identified asvalid instruments those variables that do not have correlation with the health outcomes (seedetails in Annex VII). Similarly, we measured the associations of the candidate instruments withthe instrumented endogenous variables to find the strength of the instruments. We intuitivelyselected probable candidates for instrumental variables like households characteristics (sex ratioand access to credit), land holding (irrigated land, non-irrigated land and total land), farm production(production of rice, maize), the location variable (distance to the market), price variables (priceof LPG, fuelwood, biogas, ICS, subsidy received for biogas), and income variables (salary income,non-agriculture income, income from crops, income from livestock and total agriculture income,ratio of non-agriculture income to total income). We tested each of these candidates for theirstrengths (using zero-order correlation) to work as instruments for endogenous variables (seedetail in Annex VIII).
In order to correct for the problem of endogeneity, we fit the instrumental variable probit regressionmodel of health symptoms on exogenous variables and endogenous variables that areinstrumented. To estimate the relation of air pollution variables to chronic bronchitis and asthmaamong the adults and ARI among the children, we use the instrumental variable probit regression10
as shown in equation (4).
10 As the stove and fuel variables used as explanatory variables are endogenous, we use the ivprob toestimate the probit model. We use the divprob in order to find the marginal effects for ivprob. These twoprograms implement Amemiya Generalized Least Squares (AGLS) estimators for probit with endogenousregressors (Newey, 1987; equation 5.6). The author of the program is Joe Harkness, Johns HopkinsUniversity, USA, [email protected].
SANDEE Working Paper No. 34-08 9
Where, all the symbols are as in equation (3), except tj, which is the predicted value that comesfrom the first stage regression of Wj on a set of instruments.11 We used instruments (a) distanceto the market, (b) sex ratio in the family, (c) access to credit, (d) price of LPG, (e) year of use ofbiogas, (f) maize production squared, (g) ratio of income from non-agricultural sources, (h)ownership of refrigerator, and (i) ownership of television.
Though logically not related, there is a slight spurious correlation of health outcomes with twoinstruments, the price of LPG and ownership of television. These two instruments are included inthe model following the suggestion of Murray (2006) that “strong instruments that are almostvalid tend to incur only small biases for two-stage least squares in moderately large samples.”The price of LPG and ownership of television are strongly correlated with endogenous variables.
4.4 Household Shadow Value of Health and Benefits of Interventions
We estimate the household shadow values of respiratory diseases using the cost of illness method.The COI estimation includes the direct and indirect core (health-related) and other related (non-health) costs of illness and disability (Kirschstein, 2000). We estimate the core direct costsconnected with the use of medicines, diagnostic facilities (X-ray, cough test, etc.) and fees chargedby hospitals and doctors. Other related direct costs we include are the fare for transportation tohospitals, to physicians or to other health providers and additional dietary expenses resultingfrom the illness. The core indirect costs we include are the value of time that patients lose due tomorbidity. The other related indirect costs include the value of time lost by caretaking by familymembers. However, the estimates of the economic costs of illness do not capture some aspectsof the burden of illness such as reduced functioning, pain and suffering, and deterioration in otherdimensions of health-related quality of life including emotional and psychological impacts onfamilies, friends, and co-workers (Kirschstein, 2000). The costs of illness thus estimated due tothe health problem are the lower bound of the household shadow value of the respiratory diseases.
To find out the health benefits of the intervention, we multiply the marginal reductions in thediseases due to interventions by the household shadow value of the disease. We compare thisbenefit from an intervention with the cost of the annual depreciation of the intervention.
5. Results and Discussions
In this section, we identify first the interventions that can reduce indoor air pollution econometrically.Second, we explore the effects of such pollution reducing interventions on chronic bronchitis.We identify thirdly the effects of the interventions on asthma. Fourthly, we explore the effects ofthe intervention on acute respiratory infections (ARI) among children. Finally, we estimate thehealth benefits of the pollution reducing interventions.
5.1 Particulate Pollution and Explanatory Variables
As a large proportion of rural households do not perceive IAP as a problem, identification ofpollution variables that they too can notice is necessary. The fact that 39 percent of the respondentsreported that there is no pollution inside their kitchen shows the extent to which the IAP problem
11 We treat endogenous regressors as linear functions of the instruments and the other exogenousvariables (Maddala, 1983).
10 SANDEE Working Paper No. 34-08
has to do with perception – amongst this 39 percent of households, we measured an averagepollution level of 2,812 ìg/m3 of air, which is high by any standard. Those who reported pollutionmostly blamed fuelwood as the cause of pollution. This is because the use of other polluting fuels(like animal dung and coal) is very limited. Likewise, electricity is not yet established as a cookingfuel in Nepal. The distribution of the households using different types of cooking fuels in 600sample households is presented in Table 1. Only two fuels, namely biogas and fuelwood, arebeing used by more than 20 percent of the sample households (see Fig 1). Thus, we base theanalysis mainly on these two major fuels.
We measure PM10 in the kitchen of the sub-sample of 99 households both during cooking hoursand non-cooking hours. We establish the average PM10 level by taking a weighted average ofcooking hour readings and non-cooking hour readings, taking the hours of cooking as the weight.12
The level of average PM10 in the kitchen ranges from 2393 to 4209 µg/m3 with a mean of 3233µg/m3 (see Table 2). This result is comparable to earlier studies. Nepal Health Research Councilreports that the PM10 concentration for cooking areas, where wood is burned, is as high as8,207 µg/m3, which is almost twice and four times as high as the concentration for kitchens usingkerosene (3414 µg/m3) and LPG (1504 µg/m3), respectively (Winrock International, 2004).Many other studies report that indoor concentrations of particles usually exceed guideline levelsby a large margin: the 24-hour mean PM10 levels are typically in the range 300–3000 µg/m3 andmay reach 30000 µg/m3 or more during periods of cooking (Anderson, 1978; Collings, et al.,1990; Martin, 1991; Ellegard 1996; McCracken and Smith, 1998; Albalak et al., 1999). Thelevel of the pollution observed in a Nepalese kitchen is considered alarmingly high in comparisonwith World Health Organization standards of 50 µg/m3 and the United States EnvironmentalProtection Agency standards for a 24-hour average PM10 concentration of 150 µg/m3 (EPA,1997). Galassi et al. (2000) find substantial health benefits from a PM10 reduction in eight Italiancities whose annual concentrations are far lower (45-55 µg/m3). For Nepalese households withvery high levels of pollution, the health benefits of the reduction therefore are certain to be veryhigh.
To estimate the determinants of pollution, the logarithm of the weighted average PM10 is used asthe dependent variable. Fuelwood and biogas use as the kitchen fuels are the explanatory variables.Other variables hypothesized to affect kitchen PM10 levels are improved cooking stoves (ICS),area of the kitchen, ventilation of the kitchen and cooking hours (see Table 2). More than 20percent of the sample households use these four measures. We use a dummy for the use ofimproved cooking stove (ICS). The area of the kitchen is considered to be another variable.We elicit information from the respondents on the length and breadth of the kitchen in order toestimate the area of the kitchen. Meals are generally prepared three times a day. The totalnumber of hours required for preparing meals per day is taken as cooking hours.
The description of explanatory variables for estimating indoor air pollution and their expectedsigns are presented in Annex II. They include fuelwood, biogas, ICS, kitchen area, kitchenventilation and cooking hours per day. The results of the ordinary least square estimation of therelationship between IAP level with the set of explanatory variables including fuel and stove showthat the level of indoor air pollution is significantly reduced by biogas (9 percent) and ICS (5percent) (see Table 3). Other variables like fuelwood and ventilation are not found to affect thelevel of pollution. This is because most of the 99 sample households monitored are found to use
12 We measure the PM10 for a day while the quantity of fuelwood consumption is taken for a year.

SANDEE Working Paper No. 34-08 11
fuelwood and have ventilation in the kitchen (fuelwood 96.5 percent, ventilation 94.5 percent).To the same tune also the kitchen area and cooking hours do not affect the level of pollution. Theregression equation, though significant, explains only seven percent of the variations in the level ofindoor particulate pollution. Thus, this exercise of pollution production function should not beconsidered a definitive estimation and modeling of exposure to indoor air pollutants. Moreover,this reading of PM10 is for just one day of the year—to be more precise, for just two points oftime in a 24-hour day. Such a reading of pollution should not be interpreted as the perfectmeasurement of the factor affecting respiratory diseases.
5.1.1 Diagnosis of Omitted Variables, Heteroskedasticity and Muticollinearity
We checked the regression equation thus estimated for omitted variables, heteroskedasticity andmuticollinearity. The test results show that the model has no omitted variable. Similarly, theincluded variables are homoskedatic (with the exception of fuelwood) and there is no evidenceof multicollinearity.
We conducted the Ramsey RESET test, using the powers of the fitted values of the natural log ofthe daily average PM10. The statistic F(3, 89) is found to be very low (0.68). The test is notsignificant (probability > F = 0.568). From this result, we infered that the functional form of themodel estimated is correct and has no omitted variables bias.
We conducted two separate tests for heteroskedasticity: first, the Breusch-Pagan / Cook-Weisberg test, commonly known as the BP test, which detects heteroskedasticity. Here, thechi-square statistic is very small {÷2(1) = 0.1} and statistically not significant (probability > ÷2 =0.750). We can therefore safely infer that the variance of the fitted values of the variable naturallog of average particulate matter of size 10 or less is constant. Similarly, we tested theheteroskedasticity of individual variables fitted in the model using the Szroeter’s test (see AnnexIII for the detailed results). The results show that the null hypothesis of homoskedasticity (constantvariance) cannot be rejected for the variables except for fuelwood. The fuelwood is slightlyheteroskedastic (p = 0.029) but it is tolerated for practical purposes.
To test the presence and severity of the multicollinearity, we estimated the variance inflationfactor (VIF) and pair-wise correlation among explanatory variables. The mean VIF for theexplanatory variables is 1.06 and the highest value of VIF is 1.31, that of biogas. Consideringthe small value of VIF, we infer that multicollinearity is not a problem in the equation estimated.To confirm the absence of multicollinearity, another test of pair-wise correlation among theexplanatory variables was conducted (see Annex IV). The pair-wise correlations among thevariables are not more than 0.1 and hence we do not expect the multicollinearity problem.However, the pair-wise correlation between fuelwood and biogas, ICS and kitchen area, biogasand ventilation, fuelwood and cooking hours and cooking hours and kitchen area is significant.Considering the low level of correlation, we decided to tolerate this minor problem for empiricalreasons.
Thus, we can conclude that the equation estimated for particulate pollution is statistically significantand valid. The variables that affect the level of indoor air pollution in the given situation arebiogas and ICS. These two variables are taken as pollution variables for further analysis ofrespiratory health effects.
12 SANDEE Working Paper No. 34-08
5.2 Health Symptoms and their Determinants
In order to understand the health effects of IAP, we constructed dependent variables from thereported symptoms of respiratory illnesses. We identified explanatory variables, both endogenousand exogenous, logically and screen the instrumental variables.
Table 4 summarizes the symptoms of the respiratory illnesses included in the survey. We take thesymptoms of chronic cough (that is, cough on most days for at least 3 months each year) andhemoptysis (bringing up phlegm for 3 months each year) as the symptoms of chronic bronchitis.Similarly, shortness of breath (dyspnea) as characterized by a need to stop for breath whenwalking at own pace and waking up at night due to attack of shortness of breath we take as thesymptoms of asthma.
Cases of acute respiratory infection (ARI) are common among the children. Symptoms of ARIwe surveyed included a weakened appetite on the part of the child, abnormal drowsiness anddifficulty in waking up, fever or low body temperature, localized chest pain and cough, which isat first dry and painful and later productive and tenacious with rusty sputum or occasionally frankblood-stained. We surveyed the symptoms on a one year recall basis. We developed the diseasevariables on the basis of the appearance of the symptoms on the individuals. The proportions ofindividuals suffering from these respiratory diseases are presented in Fig 2.
5.2.1 Exogenous and Endogenous Explanatory Variables
The explanatory variables of respiratory diseases include cooking technology (improved cookstove) and fuel use (biogas, LPG and wood). ICS and biogas are dummies while the other twoare continuous variables. The cooking technology and fuel variables are endogenous as thedecision of the households for stove choice and fuel choice can be affected, in turn, by the healthproblems they are facing. Most of the IAP studies assume that the levels of the behaviour-related variables are determined by factors other than those under study that is that they areexogenous. In fact there is widespread evidence that people are not passive acceptors of risksto their health, but that they adjust their behaviour because of their perceptions of their health andthe risks to their health (Briscoe et al. 1990). Households facing more problems of respiratoryhealth may decide to adopt ICS or biogas depending on their preference.
The exogenous variables are the personal characteristics that may affect health status like ageand gender. Similarly, geographical characteristics like hill and plain can affect respiratory healthand are also exogenous. We present the description of these endogenous and exogenousexplanatory variables and their expected signs in Table 5.
The problem of endogenous variables creates a system of simultaneous equations. Researchersgenerally use the reduced form equation of two stages least square to solve the problem. To thiseffect, we identified and employed instrumental variables.
5.2.2 Choosing the Right Instruments
Studies show that people are not passive acceptors of risks to their health. They modify theirbehavior in accordance with their perceptions of their health status and the perceived risks to
SANDEE Working Paper No. 34-08 13
health (Briscoe, et al., 1990). Several household decisions relating to the emissions of smokepollution and the exposure of family members to pollution may potentially be endogenous.Literature suggests an instrumental variable (IV) method, mostly employed in epidemiologicalstudies, to address the problem (Greenland, 2000; and Hernan and Robins, 2006). We attemptedto identify potential instruments for this purpose.
We take distance to the nearest market as one of the instrumental variables. Household isolationvariables include the distance to the nearest hospital or health post, distance to the nearest medicalstore, distance to nearest market place and distance to the road head. We measure distance interms of the number of minutes it takes to reach through the most commonly used mode oftransport. Annex V provides descriptive statistics of such variables. The biggest distance is forthe hospital/health post and the closest is for the road head. But these four distances to utilityvariables are highly and positively correlated pair-wise (see Annex VI for detail). The correlationranges from the 0.2 between the distance to the nearest hospital/health post and market to ashigh as 0.8 between medical store and market. This is because the medical stores are generallylocated in the market area. Among these four distance variables, the distances to the market andthe medicals have the minimum standard deviations. Logically the distance to the market and themedicals cannot have a health effect. Hence the distance to the market and the medical are thecandidates for the instrumental variables. The distance of the household from the market is notsignificantly correlated with study variables of chronic bronchitis, asthma and ARI. Therefore,this is a valid instrument (please see Annex VII for detail). But the distance to the medical storeis somehow significantly correlated with one of the study variable, asthma, and is an invalidinstrument. The distance to the market is significantly correlated with the endogenous variables(ICS, biogas, LPG and fuel wood). However, the degree of correlation ranges from 0.05 to0.31 (see Annex VIII for detail). Hence, the distance to market is a valid instrument with anacceptable strength.13
Another probable instrument is sex ratio in the family. Since the sex ratio in the family is out of thecontrol of the household and has no association with the study variable, at least in the short run,it is a valid instrument. As it is moderately correlated with some of the endogenous variables, ithas some strength. Using the same standards and also considering the correlation of the variableswith other valid instruments, we have used access to credit, price of LPG, year of use of biogas,maize production squared, non-agricultural income as a percent of the total income, and refrigeratorand television as instrumental variables in the study.
The descriptive statistics of the endogenous variables, exogenous variables, instrumental variablesand study variables (chronic bronchitis and asthma) are presented in Table 6 for 2,739 individualsof 600 households. Table 7 presents the descriptive statistics of the endogenous, exogenous,instrumental and study variables (acute respiratory infections) separately for 301 children of agefive or less in 600 sample households.
We measure distance to the nearest market in terms of the time it takes to reach using the mostcommonly available mode of transport. On an average, the households take 41 minutes to reachthe nearest markets. Since not all households have male members, the sex ratio (female to maleratio) is missing for those households without male members. Access to credit is a dummy at
13 An instrument with a significant and higher (0.30 or more) correlation coefficient with at least one endog-enous variable is taken as a strong instrument whereas that with significant but weaker (less than 0.30)correlation coefficient is taken as an acceptable instrument.
14 SANDEE Working Paper No. 34-08
household level; 69 percent of the households report that they have easy access to credit at timesof need. The price of LPG includes the cost incurred by households to buy and transport ithome. The price of LPG ranges from Rs 63 to Rs 70 per kg (about one US dollar). The year ofbiogas use is as high as 17 years with the average at two years. This means that biogas interventionis a recent phenomenon.
Similarly, maize production per household is in quintal per year. To make it valid for the use as aninstrument square of the maize production is taken. Another IV is the ratio of non-farm incometo the total income. Nearly 51 percent of the income is from the non-agriculture sector and therest from the agriculture sector. Around six percent of the households have a refrigerator while48 percent can lay claim to a television. The descriptive statistics are presented separately for asub-sample of the households that have children of five years or less. Such variables are used forthe analysis of ARI among children.
The effects of stove choice and fuel choice on major respiratory health problems like chronicbronchitis, asthma and acute respiratory infections (ARI) are discussed in this section. Weobtain these results with and without making corrections for endogeneity.
5.2.3 Effects of Stove and Fuel Choice on Chronic Bronchitis
We assess the effects of indoor air pollution related variables on the appearance of the symptomsof chronic bronchitis on individual members of the households using simple probit (see results inAnnex IX) as well as instrumental variable probit (see Table 8). Fig 3 presents a comparison ofresults. The results from the simple probit that suffer from the problem of endogeneity differ fromthe results obtained through the instrumental variable probit that corrects for the problem ofendogeneity.
The simple probit regression shows illogical results that chronic bronchitis significantly decreaseswith increases in the quantity of fuel wood consumption whereas ICS and biogas do not significantlyreduce the symptoms associated with the illnesses (Annex IX). After correcting for the problemof endogeneity, the IV probit gives logically sound results (Table 8) that ICS and biogas significantlyreduce the symptoms of chronic bronchitis; fuelwood on the other hand does not. For theendogenous variables, namely, ICS, biogas, LPG and fuelwood, both the coefficients and slopesincrease after corrections for endogeneity. The sign and magnitude of the coefficients and slopeof the exogenous variables remain the same with the exception of the hill variable. In the case ofthe hill variable, the size of the coefficient increases after correcting for endogeneity. The loglikelihood ratio, chi-square value and the pseudo coefficient of multiple determinations remainthe same in both cases. The equation explains about 21 percent of the variations in chronicbronchitis. The overall equation is statistically significant.
The results, after correcting for endogeneity (Table 8), show that the use of ICS and biogassignificantly reduces the symptoms of chronic bronchitis among the residents. ICS reduceschronic bronchitis by over nine percent while biogas does so by over one percent. The problemof chronic bronchitis is more severe in old age. It is also worse among women. This is becausewomen are more exposed than men to the cooking stove. The problem of chronic bronchitis isalso more severe in the hill region than in the plain.
SANDEE Working Paper No. 34-08 15
5.2.4. Effects of Stove and Fuel Choice on Asthma
The results obtained from the simple probit (see Annex X for results) and instrumental variableprobit (see Table 9) are similar in direction but different in magnitude in the case of asthma (seeFig 4). Both results show that biogas significantly reduces the problem of asthma and that ICShas no significant effect. It is surprising to note that the use of fuelwood decreases the problemof asthma. Pistelly (1997) reports similar findings about wood smoke and asthma. Bruce et al.,(2000) also conclude that asthma is less common among rural populations where biomass fueluse is more common.
The effects of biogas on asthma are to be expected as biogas reduces smoke emissions aspresented in Table 3 above. But the result for fuelwood is unexpected. We could hypothesizethat asthma is mainly the result of past exposures. Furthermore, the use of fuelwood in thedwelling house has the effect of space heating which is also considered therapeutic in the case ofasthma patients.
The results also show that the problem of asthma increases with the increase in age. It is moresevere among women as compared to men. Thus, the use of biogas as a cooking fuel reducesthe problem of asthma illness among the rural poor. The equation explains about 16 percentvariation in asthma among rural women and men.
5.2.5 Effects of Stove and Fuel Choice on Acute Respiratory Infections
We assessed the effects of stove and fuel choice on acute respiratory infections among childrenof five years and less using simple probit (see Annex XI for results) and instrumental variableprobit (see Table 10). The results obtained after the adjustment for endogeneity is different fromthe results without the adjustment (see Fig 5). The use of biogas reduces the problem of ARIunder both the estimates but the size of coefficients and slope increases after the adjustment. Theuse of biogas as cooking fuel reduces the problem of ARI nearly by half (43 percent).
The problem of ARI decreases with the increase in age. The problem is not significantly differentfor girls and boys, and on the hills and in the plains. The use of ICS does not affect the problemof ARI among the children. The coefficient of multiple determinations (pseudo R2) decreasesafter making the adjustment for endogeneity. The equation after adjustment explains only fourpercent of the variations in ARI. The only policy variable available to reduce the problem of ARIis the adoption of biogas.
5.3 Health Benefits
We estimate the health benefits of indoor air pollution reducing interventions using the householdshadow value of respiratory diseases and the marginal reduction in health problems due tointerventions.
16 SANDEE Working Paper No. 34-08
5.3.1 Household Shadow Value of Health
We estimate the household shadow values of health for chronic bronchitis, asthma and ARIdirectly from the cost of illnesses survey of the households (see Table 11). The estimated householdshadow value of chronic bronchitis is Rs 2,576. This includes the treatment costs and opportunitycosts of the time lost14 due to diseases. The household shadow value of asthma is Rs 2,121 andthat of ARI Rs 4,298 (see Fig 6). Over 80 percent of these costs are for medicines. Around fourpercent is for doctors’ and hospital fees. The costs of diagnostic tests are still lower (see Figs 7,8 and 9). The opportunity costs of the time lost due to travel to and stay in hospitals or to healthposts and inability to work as well as the time lost by caretakers (see Annex XII for detail) rangefrom about four percent in ARI to 10 percent in asthma. As the labour market in the study areais far from complete, the opportunity cost of time lost is taken as 45 percent of the wage rate(Adhikari, 1988). If we can reduce the probability of these diseases through interventions forIAP reduction, the costs of illnesses too could be reduced presumably in the same proportion.
5.3.2 Benefits of Improved Stove and Biogas
We estimate the annual reduction in the health costs per intervention of stove and biogas basedon the marginal reduction in health problems such as chronic bronchitis, asthma and ARI throughthese interventions and household shadow value of health. We find that ICS plus heaters reducethe risk of chronic bronchitis by 0.092, thereby reducing health costs by Rs 237 per person perannum (see Table 12). Taking into account family size as weight per household, the averagereduction in health costs by the intervention is Rs 1,217 per annum (see Table 13).
On the cost side, the average market price15 of ICS and heater is Rs 605 (see Table 13). Takingthe average life of ICS plus heaters, as 10 years, and taking the linear depreciation of the ICSand heater into account, the annual depreciation can be calculated at Rs 60. This shows that theannual health benefits from each ICS or heater on average is 20 times higher than the annual costof this intervention. This analysis, however, takes into account only the health benefits and notthe energy efficiency benefits of the intervention. The energy efficiency benefits are direct andmore visible to the households and funders than the health benefits when it comes to decisionmaking. The external benefit of the ICS not taken into account in this comparison is the reductionin green house gas emissions from reducing fuelwood consumption. Improved cookstovespromoted in Nepal are estimated to be 35 per cent more efficient than traditional stoves (Bluffstone,1989; Sulpya, 1989). The stove reduces fuelwood consumption and hence the emission of carbonto the atmosphere.
Similarly, we found a biogas plant to reduce the risk of chronic bronchitis by 0.014, asthma by0.011 and ARI by 0.159, thereby reducing the annual health cost by Rs 59 per adult and Rs 683per child. Taking into account the family size and demographic features of the rural household asweight, the weighted annual reduction in the health costs due to the intervention of a biogas plantis Rs 647 per household. A typical biogas plant costs Rs 19,615 to the household. Taking 30
14 We exclude the costs of pain and sufferings due to problems in estimation. The cost estimate is the costof morbidity. Estimating the costs of mortality is out of the scope of this study.
15 The shadow price of ICS plus heater would however be slightly higher than this amount due to certainintervention programs for ICS. Since the analysis is done with household perspective, we use the marketprice for the purpose.
SANDEE Working Paper No. 34-08 17
years as the reasonable life-time of a biogas plant as well as the fact of linear depreciation, theannual depreciation comes to Rs 654 (see Fig 10). Thus the annual health benefit from a biogasplant is nearly equal (99 percent) to the annual average costs of a biogas plant. The energyefficiency benefit of the intervention is in addition to this health benefit. Adoption of a biogasplant shifts cooking fuel from solid to gas and has implications to green house gas emission aswell. Reduced solid fuel consumption reduces carbon emission and controlled production ofcooking gas reduces methane escape to the atmosphere. Such benefits are not taken into accountand the study confines itself to the health benefit analysis.
The comparison of health benefits and costs shows that there is no reason for not buying theintervention. In addition there is energy benefit that is more visible to the households. Under theassumption of full information, even they ignore the external benefits of environmental protectionand climate change, the households would have adopted ICS and biogas and maximized theirbenefits. Thus the assumption of full information is not applicable in this case when some costsand benefits are hidden. Even scientists find it difficult to desegregate the effects and estimate thehealth benefits precisely due to endogeneity bias and other confounding factors like outdoor airpollution. As the study is conducted in rural area, the outdoor air pollution is not a problem in thestudy area.
Households invest in pollution-reducing interventions on the basis of the costs and benefits theyperceive and internalize. The market price of the intervention is known; what is unknown is mostprobably the health benefits that are indirect. There is a need to make the rural householdsaware of the health benefits of the intervention so that a larger proportion of the rural householdswill adopt the interventions and reduce thereby their health costs at the same time protecting theenvironment and climate.
6. Conclusions and Recommendations
The analysis starts with a screening of pollution variables. Pollution variables like stoves andfuels are more visible to the households than the actual measure of emission concentrations.Many of the rural people, who have been using solid fuels for generations, do not generallyregard indoor smoke as a problem per se. But the actual measurement of the level of pollutionshows that the level of particulate matter pollution inside the average kitchen is alarmingly high.The level of average PM10 in the kitchen ranges from 2393 to 4209 µg/m3 with a mean of 3233µg/m3. This level of pollution is quite high compared to World Health Organization standards (50µg/m3) and the United States Environmental Protection Agency standards (150 µg/m3) (EPA,1997). Most households use fuelwood for cooking, however, the use of coal is not very popular.
The pollutants production function analysis shows that the level of indoor air pollution (IAP) isaffected in a significantly negative manner by improved cook stove (ICS) and biogas. Biogasfuel reduces the indoor air pollution by nine percent and ICS reduces it by five percent. As mostof the 99 sub-sample households use fuelwood (96.5 percent) and have ventilation in the kitchen(94.5 percent) we find slight variations in PM10 when it comes to these variables. We concludefrom the analysis that of the cooking fuels available in the rural areas, ICS and biogas will lead tosignificant reductions in IAP.
We assess the effects of IAP reducing interventions on the appearance of the symptoms ofchronic bronchitis, asthma and ARI on individual members of the households using two approaches:
18 SANDEE Working Paper No. 34-08
one that assumes behaviors are exogenous (e.g., using a probit model) and the other whichassumes that behavior is endogenous (using an instrumental variable probit model). The resultsfrom the two types of analysis are found to be different for all the three diseases under consideration.The results obtained after correcting for endogeneity using the instrumental variable probit givesmore reliable results, that is, in addition to age and gender, the use of improved stove and biogassignificantly reduces respiratory health problems. Thus, historical estimates of the effects ofindoor air pollution on health may have to be revised by correcting for the endogeneity problem.
Our analysis suggests that the problem of respiratory health is more severe among older agecohorts, particularly among those who are female. As cooking is generally done by women, theysuffer more from respiratory problems. Hence, they require special attention from health workersand development partners who are interested in reducing the health effects of indoor air pollution.
Promotion of the improved stoves and biogas in rural areas can help save the rural people fromrespiratory health problems arising from indoor air pollution. An improved stove can reducehealth costs by Rs 1,217 per year. This benefit is 20 times higher than the annual depreciatedcost of an improved stove. Similarly, a biogas plant, with an annual depreciated cost of Rs 654,is found to reduce annual health cost by Rs 647. This would lead us to the conclusion that thecost of a biogas plant is almost equal to its health benefits. In addition, ICS and biogas have theadded benefits of energy efficiency to the households and environmental benefits to the society.The estimates of health benefits in this study, however, do not include such costs or the costs ofthe pain and suffering to sick people and the costs of mortality. This means the estimates are thelower bound of the benefits of intervention.
In spite of the much higher benefits of ICS and biogas as compared to their costs, why is it thata large proportion of the rural people are still to adopt these interventions. Perhaps an ‘informationgap’ is the reason. Households invest in pollution reducing interventions on the basis of the costsand benefits they perceive. The health benefits of improved stove and biogas are indirect and notadequately perceived by the rural people who are mostly less educated or illiterate. There is aneed to make the rural households aware of the health benefits of interventions so that a largerproportion can adopt the intervention and thereby save significantly on health costs. We however,recommend further studies to compare the complete costs and benefits of different interventionsthat are known to reduce indoor air pollution.
7. Acknowledgements
I am grateful to Priya Shyamsundar and Subhrendu Pattanayak for encouragement and guidancethroughout the study. I thank M. N. Murty, Gunnar Kohlin and all other resource persons ofSouth Asian Network for Development and Environmental Economics (SANDEE) whosesuggestions on how to improve on the study were invaluable. I would like to record here mygratitude to the staff of SANDEE for their unstinting support. I would also like to acknowledgethe financial support provided by SANDEE and its sponsors. I acknowledge with gratitude thelate Abullais Thakurai, and Ramesh Chandra Chitrakar, then Executive Directors of the Centerfor Economic Development and Administration (CEDA) for providing a conducive environmentfor research. I appreciate the input of Shanta Aryal, in data collection. I also recognize the helpand constructive suggestions of many of the other SANDEE associates. I am thankful to ManiNepal for his constructive comments on the manuscript. Finally, I acknowledge the valuablesuggestions from anonymous reviewers.
SANDEE Working Paper No. 34-08 19
References
Abelson, P. (1994), “Sources of Dioxin,” Science, October 21, 1994, 266:350-352.
ADB, (2003), “Country Strategy and Program Update 2004-2006, Nepal,” CountryEnvironmental Indicators, [Appendix Table A1.4:13], Asian Development Bank, Manila.
Adhikari, R. B. (1988), “Manufacturing Industries in Developing countries: An Economic EfficiencyAnalysis of Nepal”, Gower Publishing Company, UK.
Albalak, R., A. R. Frisancho and G. J. Keeler (1999), “Domestic biomass fuel combustion andchronic bronchitis in two rural Bolivian villages,” Thorax, 54 (11): 1004–1008.
Anderson, H. R. (1978), “Respiratory abnormalities in Papua New Guinea children: the effectsof locality and domestic wood smoke pollution,” International Journal of Epidemiology, 7:63–72.
Armstrong, J.R. and H. Campbell (1991), “Indoor air pollution exposure and lower respiratoryinfections in young Gambian children,” International Journal of Epidemiology, 20: 424–429.
Bluffstone, R. (1989), “Improved Cookstove Promotion and the Proper Public Role: A CaseStudy of Salyan, Nepal,” USAID/Nepal: Kathmandu.
Boy, E., N. Bruce, K. R. Smith and R. Hernandez (2000), “Fuel efficiency of an improved woodburnimg stove in rural Guatemala: implications for health, environment and development,” Energyfor Sustainable Development, 4 (2): 21-29.
Briscoe, J., J. Akin and D. Guilkey (1990), “People are not passive acceptors to threats to theirhealth,” International Journal of Epidemiology, 19(1): 147-153.
Bruce, N., R. Perez-Padilla and R. Albalak (2000), “Indoor air pollution in developing countries:a major environmental and public health challenge,” WHO Bulletin, 78: 1078-1092.www.who.int/ bulletin/tableofcontents/2000/vol.78no.9.html
Campbell, H., J. R. Armstrong and P. Byass (1989), “Indoor air pollution in developing countriesand acute respiratory infection in children,” Lancet, 1: 1012.
CBS (2002), “Population Census 2001, National Report,” Central Bureau of Statistics,Kathmandu, Nepal, 112-113.
Chen, B. H., et. al., (1990), “Indoor air pollution in developing countries,” World Health StatisticsQuarterly, 43: 127-138.
Collings, D. A., S. D. Sithole and K. S. Martin (1990), “Indoor woodsmoke pollution causinglower respiratory disease in children,” Tropical Doctor, 20: 151–155.
Dasgupta, S., et. al., (2004), “Indoor air quality for poor families: new evidence from Bangladesh,”Development Research Group Working Paper No. 3393. Washington, DC: The World Bank.
20 SANDEE Working Paper No. 34-08
—, (2006) “Indoor air quality for poor families: new evidence from Bangladesh,” Indoor Air,16: 426–444. www.blackwellpublishing.com/ina
Ellegard, A. (1996), “Cooking fuel smoke and respiratory symptoms among women in low-income areas of Maputo,” Environmental Health Perspectives, 104: 980–985.
EPA (1986), “Technical Support Document for Residential Wood Combustion,” EnvironmentalProtection Agency Document, 450/4-85-012, Nero & Associates, Portland, Oregon, USA.
—, (1997), “Revisions to the National Ambient Air Quality Standards for Particles Matter,”United States Environmental Protection Agency, Federal Register, 62: 38651–38701.
Ezzati, M. and D. M. Kammen (2002), “Household Energy, Indoor Air Pollution, and PublicHealth in Developing Countries,” Resources for the Future, Issue Brief, 02-26, Washington,D.C., USA.
Galassi, C., et. al., (2000) “Exposure to PM10 in the Eight Major Italian Cities and Quantificationof the Health Effects,” Presented to ISEE 2000, Buffalo, New York, August 2000, 19-22.
Greenland, S. (2000), “An introduction to instrumental variables for epidemiologists,” InternationalJournal of Epidemiology, 29: 722-729.
Gujarati, D. N. (2003), Basic Econometrics, Fourth Edition, Tata McGraw-Hill, New Delhi.
Hernan, M. A. and J. M. Robins (2006), “Instruments for causal inference: an epidemiologist’sdream?” Epidemiology, 17 (4): 360-72.
Kirschstein, R. (2000), “Disease-Specific Estimates of Direct and Indirect Costs of Illnessand NIH Support”, Fiscal Year 2000 update, Department of Health and Human Services, NationalInstitutes of Health, Maryland.
Kossove, D. (1982), “Smoke-filled rooms and lower respiratory disease in infants,” South AfricanMedical Journal, 61: 622–624.
Larson, B. A. and S. Rosen (2002), “Understanding household demand for indoor air pollutioncontrol in developing countries,” Social Science and Medicine, Volume 55, Issue 4, August2002: 571-584.
Larson, T. and J. Koenig (1993), “A summary of the emissions characterization and noncancerrespiratory effects of wood smoke,” EPA-453/R-93-046, US EPA, December 1993.
Maddala, G. S. (1983), “Limited-dependent and Qualitative Variables in Econometrics,”Cambridge University Press, London.
McCracken, J. P. and K. R. Smith (1998), “Emissions and efficiency of improved woodburningcookstoves in highland Guatemala,” Environment International, 24: 739–747.
SANDEE Working Paper No. 34-08 21
Martin, K. S. (1991), “Indoor air pollution in developing countries,” Lancet, 337: 358.Murray, M. P. (2006), “Avoiding Invalid Instruments and Coping with Weak Instruments,”Journal of Economic Perspectives, 20.4: 111–132.
Newey, W. (1987), “Simultaneous estimation of limited dependent variable models withendogenous explanatory variables,” Journal of Econometrics, 36: 231-250.
Pandey, M. R. (1984), “Prevalence of chronic bronchitis in a rural community of the Hill Regionof Nepal,” Thorax, 39: 331-336.
Pandey, M. R., et. al., (1989), “Indoor air pollution in developing countries and acute respiratoryinfection in children,” Lancet, 1: 427-429.
Pearce, D. (1996), “Economic valuation and health damage from air pollution in the developingworld,” Energy Policy, 24 (7): 627-630.
Pistelly, R. (1997), “Wood smoke and asthma: a controversial issue,” American Journal ofRespiratory and Critical Care Medicine, 155: A941.
Pitt, Mark M., Mark R. Rosenzweig and M. Nazmul Hassan (2005), “Sharing the Burden ofDisease: Gender, the Household Division of Labor and the Health Effects of Indoor Air Pollution,”CID Working Paper No. 119, March 2005, Center for International Development, HarvardUniversity, MA, USA.
von Schirnding, Y, et. al., (2000), “Addressing the Impact of Household Energy and Indoor AirPollution on the Health of the Poor – Implications for Policy Action and Intervention Measures,”Draft Working Paper, Prepared for the Commission on Macroeconomics and Health.
Silva, G. E., et al. (2004) “Asthma as a Risk Factor for COPD in a Longitudinal Study” Chest126:59-65.
Smith, K. (1988), “Air pollution: assessing total exposure in developing countries,” Environment,30 (10): 16-20 & 28-35.
Smith, K. R. (2000), “National burden of disease in India from indoor air pollution,” PNAS, 97(24). www.pnas.org
Sulpya, K.M. (1989), “A Study of the Impact and Effectiveness of Insert Stoves in the Terai,”Food and Agriculture Organization (FAO), Kathmandu.
WHO (1997), “Health and environment in sustainable development: five years after the EarthSummit,” WHO/EHG, Geneva, Switzerland.
Winrock International (2004), “Household Energy, Indoor Air Pollution and Health Impacts:Status Report for Nepal,” United States Agency for International Development, Place?.
World Resources Institute, UNEP, UNDP, World Bank (1998), World Resources (1998–99):a guide to the global environment, Oxford University Press, Oxford, UK.
22 SANDEE Working Paper No. 34-08
Yadav, C. S., et. al., (2004), “Situation analysis of indoor air pollution and development ofguidelines for indoor air quality assessment and house building for health,” Report, Nepal HealthResearch Council, Kathmandu, Nepal.
Yelin, E., et. al., (2002), “A National Study of Medical Care Expenditures for RespiratoryConditions,” European Respiratory Journal, 19: 414-421.
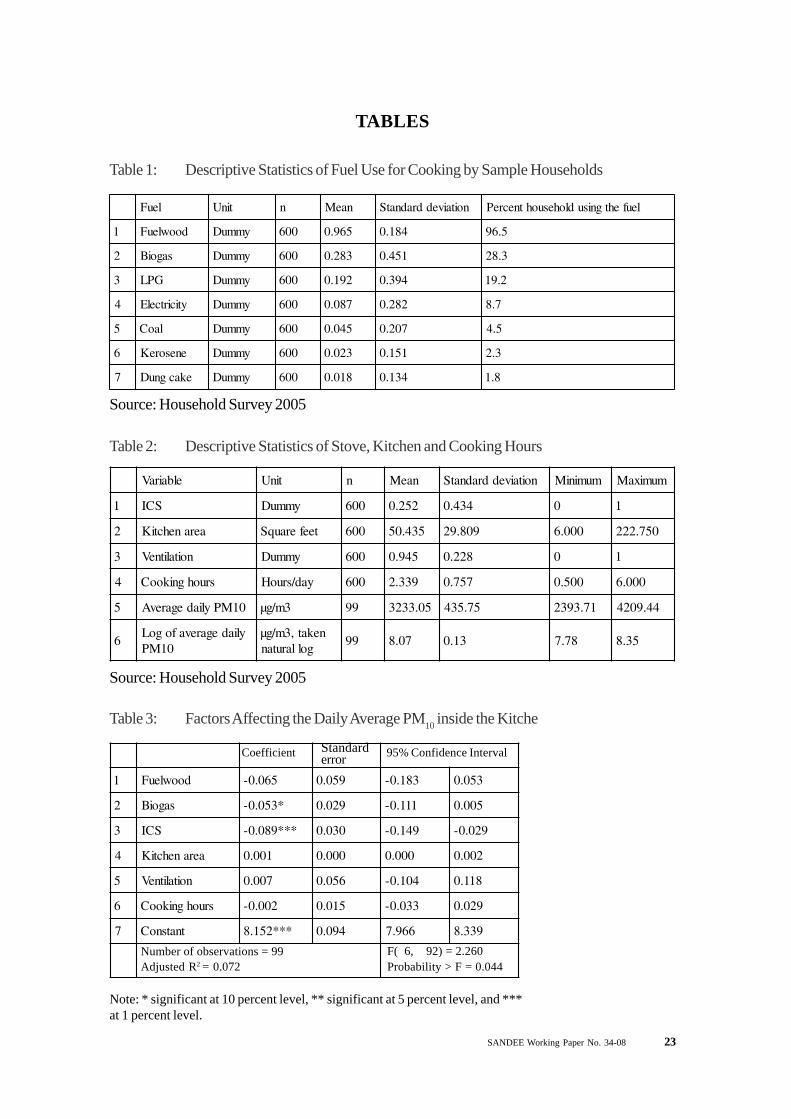
SANDEE Working Paper No. 34-08 23
TABLES
Table 1: Descriptive Statistics of Fuel Use for Cooking by Sample Households
Source: Household Survey 2005
leuF tinU n naeM noitaiveddradnatS leufehtgnisudlohesuohtnecreP
1 doowleuF ymmuD 006 569.0 481.0 5.69
2 sagoiB ymmuD 006 382.0 154.0 3.82
3 GPL ymmuD 006 291.0 493.0 2.91
4 yticirtcelE ymmuD 006 780.0 282.0 7.8
5 laoC ymmuD 006 540.0 702.0 5.4
6 enesoreK ymmuD 006 320.0 151.0 3.2
7 ekacgnuD ymmuD 006 810.0 431.0 8.1
elbairaV tinU n naeM noitaiveddradnatS muminiM mumixaM
1 SCI ymmuD 006 252.0 434.0 0 1
2 aeranehctiK teeferauqS 006 534.05 908.92 000.6 057.222
3 noitalitneV ymmuD 006 549.0 822.0 0 1
4 sruohgnikooC yad/sruoH 006 933.2 757.0 005.0 000.6
5 01MPyliadegarevA 3m/gµ 99 50.3323 57.534 17.3932 44.9024
6yliadegarevafogoL
01MPnekat,3m/gµ
gollarutan99 70.8 31.0 87.7 53.8
Table 2: Descriptive Statistics of Stove, Kitchen and Cooking Hours
Source: Household Survey 2005
Table 3: Factors Affecting the Daily Average PM10 inside the Kitche
1 doowleuF 560.0- 950.0 381.0- 350.0
2 sagoiB *350.0- 920.0 111.0- 500.0
3 SCI ***980.0- 030.0 941.0- 920.0-
4 aeranehctiK 100.0 000.0 000.0 200.0
5 noitalitneV 700.0 650.0 401.0- 811.0
6 sruohgnikooC 200.0- 510.0 330.0- 920.0
7 tnatsnoC ***251.8 490.0 669.7 933.8
95% Confidence IntervalCoefficient Standarderror
Number of observations = 99Adjusted R2 = 0.072
F( 6, 92) = 2.260Probability > F = 0.044
Note: * significant at 10 percent level, ** significant at 5 percent level, and ***at 1 percent level.
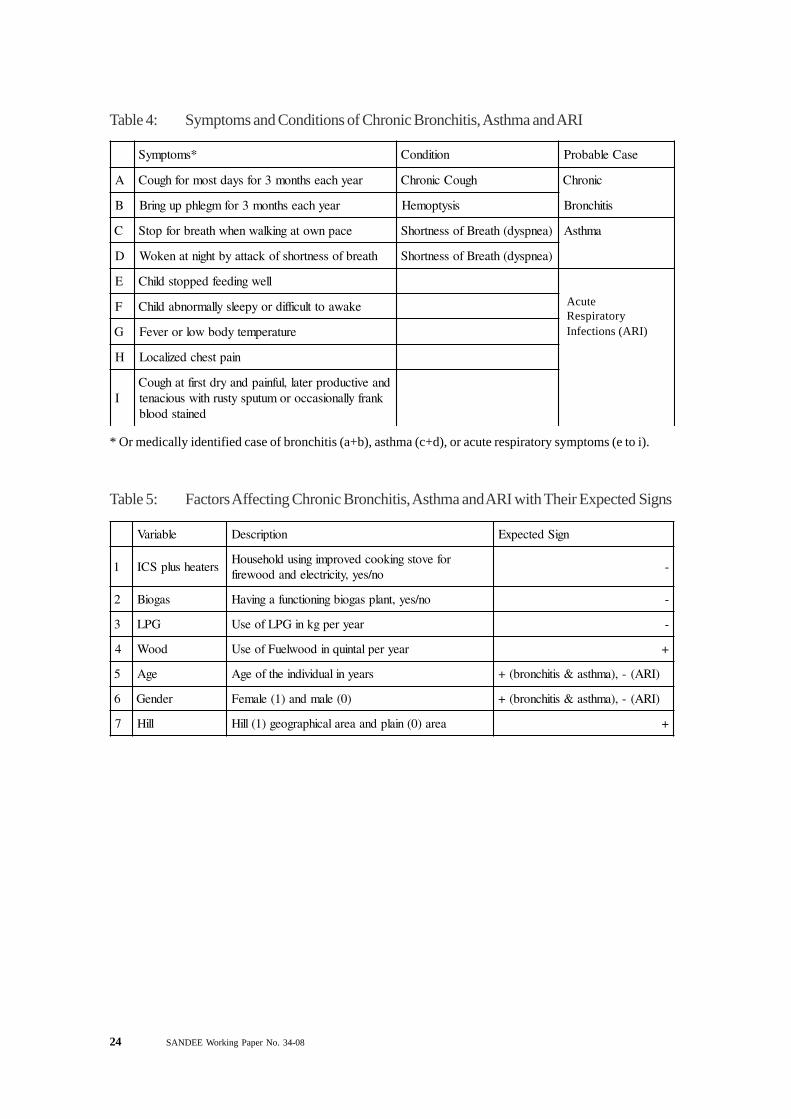
24 SANDEE Working Paper No. 34-08
Table 4: Symptoms and Conditions of Chronic Bronchitis, Asthma and ARI
Table 5: Factors Affecting Chronic Bronchitis, Asthma and ARI with Their Expected Signs
*smotpmyS noitidnoC esaCelbaborP
A raeyhcaeshtnom3rofsyadtsomrofhguoC hguoCcinorhC cinorhC
B raeyhcaeshtnom3rofmgelhppugnirB sisytpomeH sitihcnorB
C ecapnwotagniklawnehwhtaerbrofpotS )aenpsyd(htaerBfossentrohS amhtsA
D htaerbfossentrohsfokcattaybthgintanekoW )aenpsyd(htaerBfossentrohS
E llewgnideefdeppotsdlihC
F ekawaottluciffidroypeelsyllamronbadlihC
G erutarepmetydobwolroreveF
H niaptsehcdezilacoL
Idnaevitcudorpretal,lufniapdnayrdtsriftahguoC
knarfyllanoisaccoromutupsytsurhtiwsuoicanetdeniatsdoolb
AcuteRespiratoryInfections (ARI)
* Or medically identified case of bronchitis (a+b), asthma (c+d), or acute respiratory symptoms (e to i).
elbairaV noitpircseD ngiSdetcepxE
1 sretaehsulpSCIrofevotsgnikoocdevorpmignisudlohesuoH
on/sey,yticirtcelednadoowerif-
2 sagoiB on/sey,tnalpsagoibgninoitcnufagnivaH -
3 GPL raeyrepgkniGPLfoesU -
4 dooW raeyreplatniuqnidoowleuFfoesU +
5 egA sraeynilaudividniehtfoegA )IRA(-,)amhtsa&sitihcnorb(+
6 redneG )0(elamdna)1(elameF )IRA(-,)amhtsa&sitihcnorb(+
7 lliH aera)0(nialpdnaaeralacihpargoeg)1(lliH +
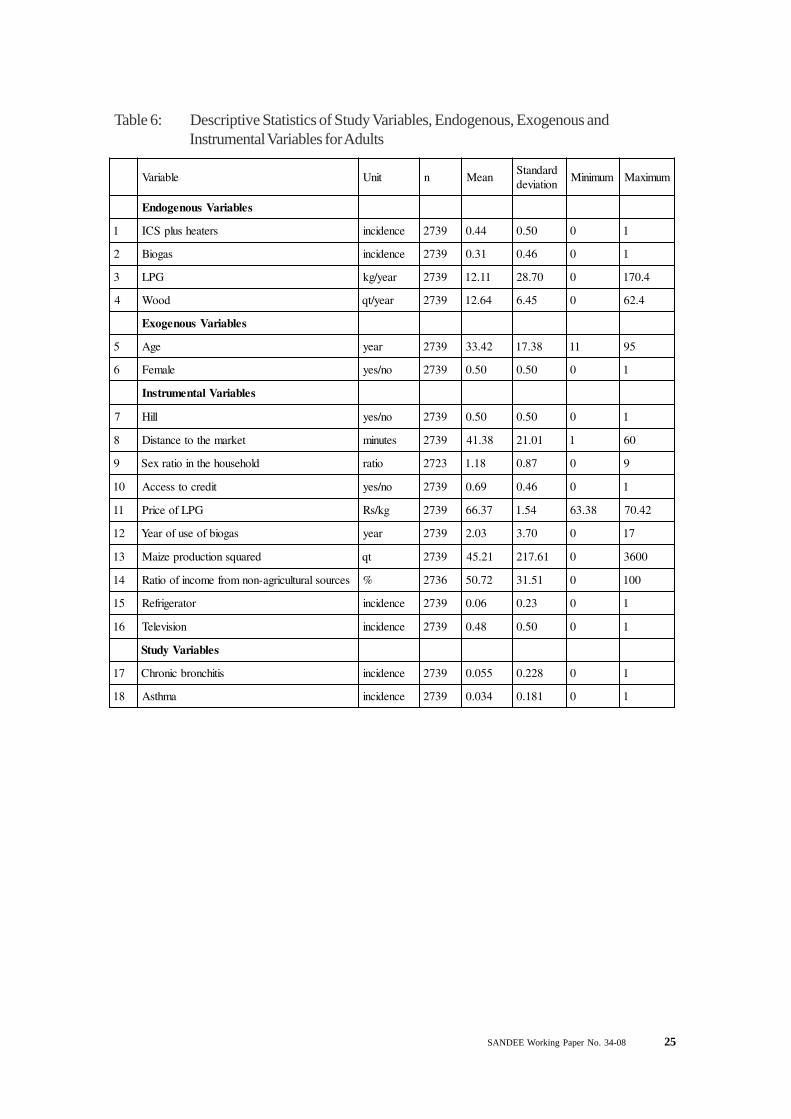
SANDEE Working Paper No. 34-08 25
Table 6: Descriptive Statistics of Study Variables, Endogenous, Exogenous andInstrumental Variables for Adults
elbairaV tinU n naeMdradnatSnoitaived
muminiM mumixaM
selbairaVsuonegodnE
1 sretaehsulpSCI ecnedicni 9372 44.0 05.0 0 1
2 sagoiB ecnedicni 9372 13.0 64.0 0 1
3 GPL raey/gk 9372 11.21 07.82 0 4.071
4 dooW raey/tq 9372 46.21 54.6 0 4.26
selbairaVsuonegoxE
5 egA raey 9372 24.33 83.71 11 59
6 elameF on/sey 9372 05.0 05.0 0 1
selbairaVlatnemurtsnI
7 lliH on/sey 9372 05.0 05.0 0 1
8 tekramehtotecnatsiD setunim 9372 83.14 10.12 1 06
9 dlohesuohehtnioitarxeS oitar 3272 81.1 78.0 0 9
01 tidercotsseccA on/sey 9372 96.0 64.0 0 1
11 GPLfoecirP gk/sR 9372 73.66 45.1 83.36 24.07
21 sagoibfoesuforaeY raey 9372 30.2 07.3 0 71
31 derauqsnoitcudorpeziaM tq 9372 12.54 16.712 0 0063
41 secruoslarutlucirga-nonmorfemocnifooitaR % 6372 27.05 15.13 0 001
51 rotaregirfeR ecnedicni 9372 60.0 32.0 0 1
61 noisiveleT ecnedicni 9372 84.0 05.0 0 1
selbairaVydutS
71 sitihcnorbcinorhC ecnedicni 9372 550.0 822.0 0 1
81 amhtsA ecnedicni 9372 430.0 181.0 0 1
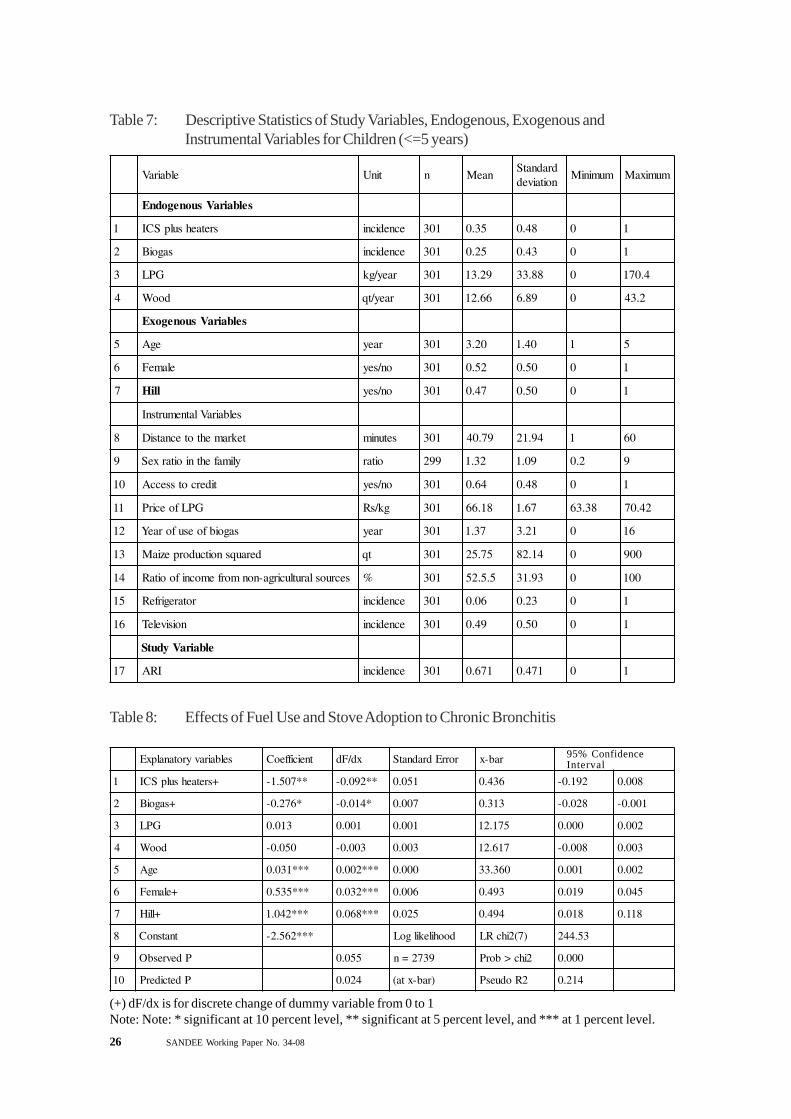
26 SANDEE Working Paper No. 34-08
Table 8: Effects of Fuel Use and Stove Adoption to Chronic Bronchitis
Table 7: Descriptive Statistics of Study Variables, Endogenous, Exogenous andInstrumental Variables for Children (<=5 years)
elbairaV tinU n naeMdradnatSnoitaived
muminiM mumixaM
selbairaVsuonegodnE
1 sretaehsulpSCI ecnedicni 103 53.0 84.0 0 1
2 sagoiB ecnedicni 103 52.0 34.0 0 1
3 GPL raey/gk 103 92.31 88.33 0 4.071
4 dooW raey/tq 103 66.21 98.6 0 2.34
selbairaVsuonegoxE
5 egA raey 103 02.3 04.1 1 5
6 elameF on/sey 103 25.0 05.0 0 1
7 lliH on/sey 103 74.0 05.0 0 1
selbairaVlatnemurtsnI
8 tekramehtotecnatsiD setunim 103 97.04 49.12 1 06
9 ylimafehtnioitarxeS oitar 992 23.1 90.1 2.0 9
01 tidercotsseccA on/sey 103 46.0 84.0 0 1
11 GPLfoecirP gk/sR 103 81.66 76.1 83.36 24.07
21 sagoibfoesuforaeY raey 103 73.1 12.3 0 61
31 derauqsnoitcudorpeziaM tq 103 57.52 41.28 0 009
41 secruoslarutlucirga-nonmorfemocnifooitaR % 103 5.5.25 39.13 0 001
51 rotaregirfeR ecnedicni 103 60.0 32.0 0 1
61 noisiveleT ecnedicni 103 94.0 05.0 0 1
elbairaVydutS
71 IRA ecnedicni 103 176.0 174.0 0 1
selbairavyrotanalpxE tneiciffeoC xd/Fd rorrEdradnatS rab-x
1 +sretaehsulpSCI **705.1- **290.0- 150.0 634.0 291.0- 800.0
2 +sagoiB *672.0- *410.0- 700.0 313.0 820.0- 100.0-
3 GPL 310.0 100.0 100.0 571.21 000.0 200.0
4 dooW 050.0- 300.0- 300.0 716.21 800.0- 300.0
5 egA ***130.0 ***200.0 000.0 063.33 100.0 200.0
6 +elameF ***535.0 ***230.0 600.0 394.0 910.0 540.0
7 +lliH ***240.1 ***860.0 520.0 494.0 810.0 811.0
8 tnatsnoC ***265.2- doohilekilgoL )7(2ihcRL 35.442
9 PdevresbO 550.0 9372=n 2ihc>borP 000.0
01 PdetciderP 420.0 )rab-xta( 2RoduesP 412.0
95% ConfidenceInterval
(+) dF/dx is for discrete change of dummy variable from 0 to 1Note: Note: * significant at 10 percent level, ** significant at 5 percent level, and *** at 1 percent level.
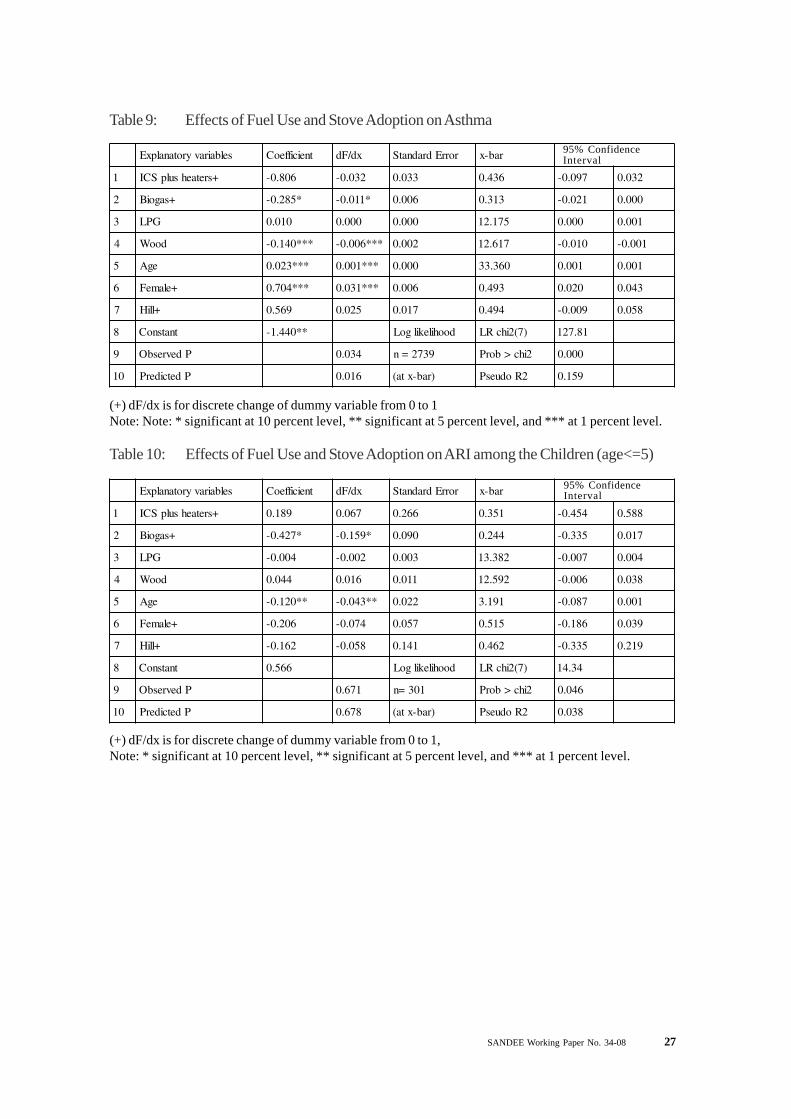
SANDEE Working Paper No. 34-08 27
Table 9: Effects of Fuel Use and Stove Adoption on Asthma
selbairavyrotanalpxE tneiciffeoC xd/Fd rorrEdradnatS rab-x
1 +sretaehsulpSCI 608.0- 230.0- 330.0 634.0 790.0- 230.0
2 +sagoiB *582.0- *110.0- 600.0 313.0 120.0- 000.0
3 GPL 010.0 000.0 000.0 571.21 000.0 100.0
4 dooW ***041.0- ***600.0- 200.0 716.21 010.0- 100.0-
5 egA ***320.0 ***100.0 000.0 063.33 100.0 100.0
6 +elameF ***407.0 ***130.0 600.0 394.0 020.0 340.0
7 +lliH 965.0 520.0 710.0 494.0 900.0- 850.0
8 tnatsnoC **044.1- doohilekilgoL )7(2ihcRL 18.721
9 PdevresbO 430.0 9372=n 2ihc>borP 000.0
01 PdetciderP 610.0 )rab-xta( 2RoduesP 951.0
95% ConfidenceInterval
(+) dF/dx is for discrete change of dummy variable from 0 to 1Note: Note: * significant at 10 percent level, ** significant at 5 percent level, and *** at 1 percent level.
selbairavyrotanalpxE tneiciffeoC xd/Fd rorrEdradnatS rab-x
1 +sretaehsulpSCI 981.0 760.0 662.0 153.0 454.0- 885.0
2 +sagoiB *724.0- *951.0- 090.0 442.0 533.0- 710.0
3 GPL 400.0- 200.0- 300.0 283.31 700.0- 400.0
4 dooW 440.0 610.0 110.0 295.21 600.0- 830.0
5 egA **021.0- **340.0- 220.0 191.3 780.0- 100.0
6 +elameF 602.0- 470.0- 750.0 515.0 681.0- 930.0
7 +lliH 261.0- 850.0- 141.0 264.0 533.0- 912.0
8 tnatsnoC 665.0 doohilekilgoL )7(2ihcRL 43.41
9 PdevresbO 176.0 103=n 2ihc>borP 640.0
01 PdetciderP 876.0 )rab-xta( 2RoduesP 830.0
Table 10: Effects of Fuel Use and Stove Adoption on ARI among the Children (age<=5)
95% ConfidenceInterval
(+) dF/dx is for discrete change of dummy variable from 0 to 1,Note: * significant at 10 percent level, ** significant at 5 percent level, and *** at 1 percent level.
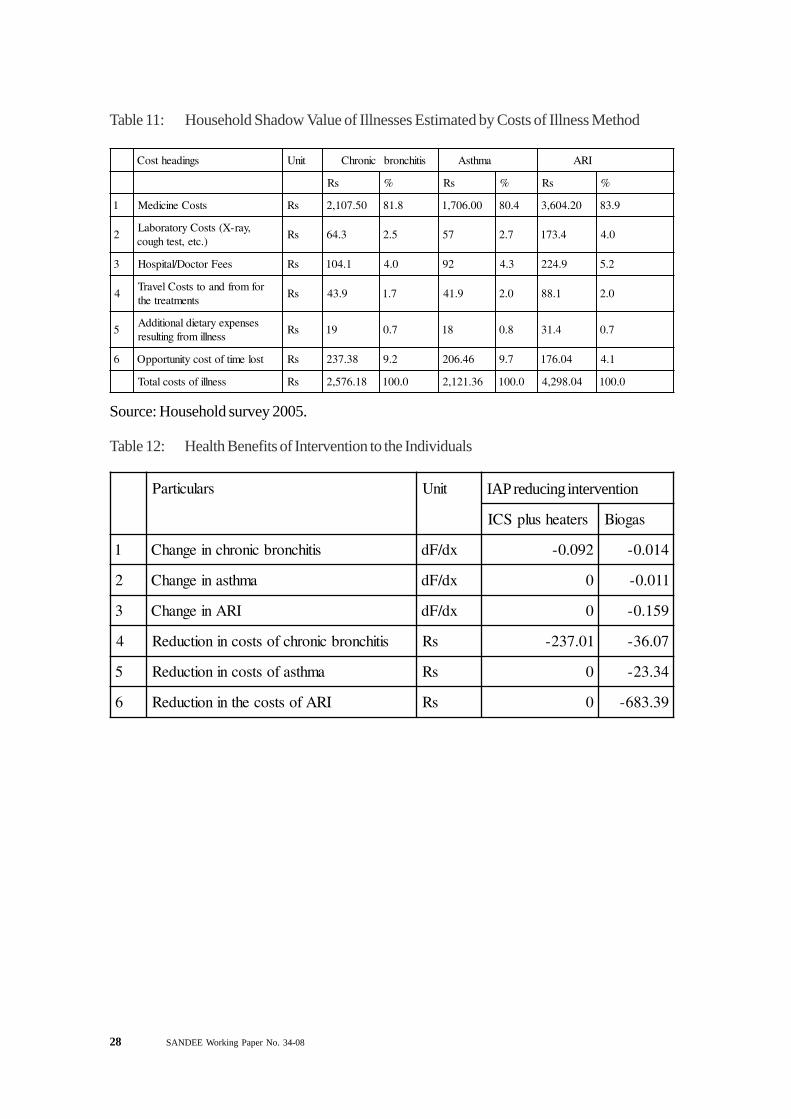
28 SANDEE Working Paper No. 34-08
Table 11: Household Shadow Value of Illnesses Estimated by Costs of Illness Method
sgnidaehtsoC tinU cinorhC sitihcnorb amhtsA IRA
sR % sR % sR %
1 stsoCenicideM sR 05.701,2 8.18 00.607,1 4.08 02.406,3 9.38
2,yar-X(stsoCyrotarobaL
).cte,tsethguocsR 3.46 5.2 75 7.2 4.371 0.4
3 seeFrotcoD/latipsoH sR 1.401 0.4 29 3.4 9.422 2.5
4rofmorfdnaotstsoClevarT
stnemtaertehtsR 9.34 7.1 9.14 0.2 1.88 0.2
5sesnepxeyrateidlanoitiddA
ssenllimorfgnitlusersR 91 7.0 81 8.0 4.13 7.0
6 tsolemitfotsocytinutroppO sR 83.732 2.9 64.602 7.9 40.671 1.4
ssenllifostsoclatoT sR 81.675,2 0.001 63.121,2 0.001 40.892,4 0.001
Source: Household survey 2005.
sralucitraP tinU
sretaehsulpSCI sagoiB
1 sitihcnorbcinorhcniegnahC xd/Fd 290.0- 410.0-
2 amhtsaniegnahC xd/Fd 0 110.0-
3 IRAniegnahC xd/Fd 0 951.0-
4 sitihcnorbcinorhcfostsocninoitcudeR sR 10.732- 70.63-
5 amhtsafostsocninoitcudeR sR 0 43.32-
6 IRAfostsocehtninoitcudeR sR 0 93.386-
Table 12: Health Benefits of Intervention to the Individuals
IAP reducing intervention
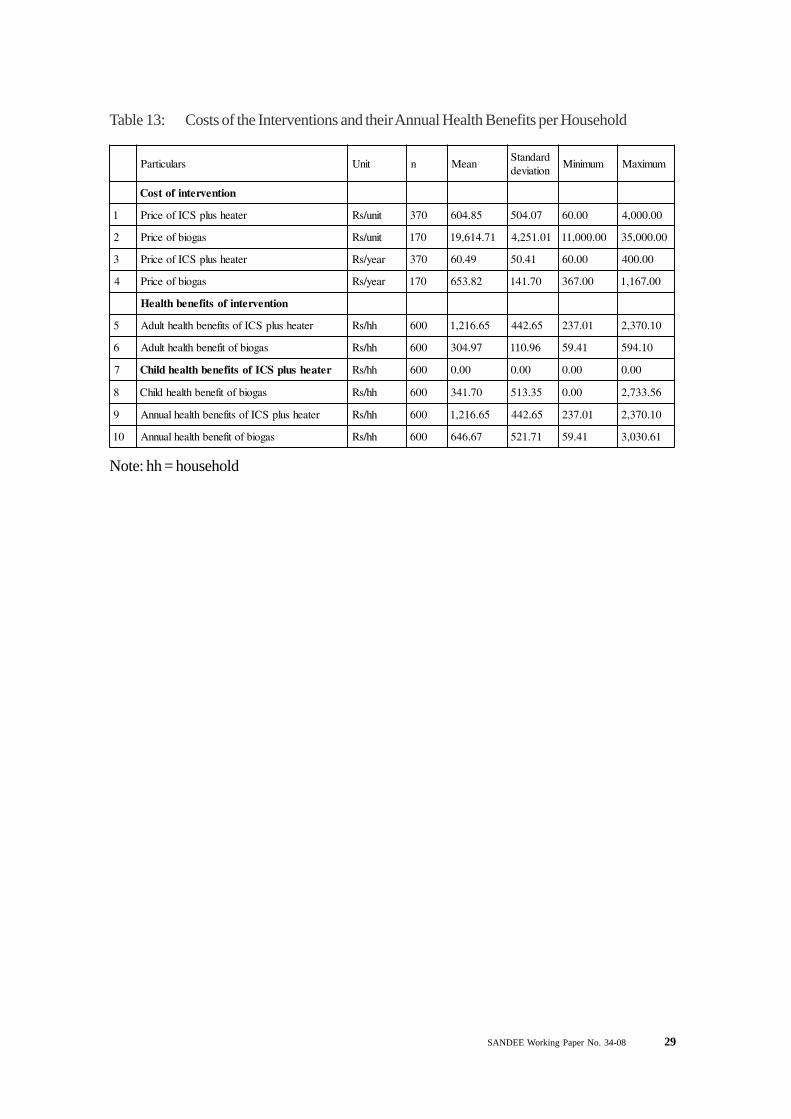
SANDEE Working Paper No. 34-08 29
Table 13: Costs of the Interventions and their Annual Health Benefits per Household
sralucitraP tinU n naeMdradnatSnoitaived
muminiM mumixaM
noitnevretnifotsoC
1 retaehsulpSCIfoecirP tinu/sR 073 58.406 70.405 00.06 00.000,4
2 sagoibfoecirP tinu/sR 071 17.416,91 10.152,4 00.000,11 00.000,53
3 retaehsulpSCIfoecirP raey/sR 073 94.06 14.05 00.06 00.004
4 sagoibfoecirP raey/sR 071 28.356 07.141 00.763 00.761,1
noitnevretnifostifenebhtlaeH
5 retaehsulpSCIfostifenebhtlaehtludA hh/sR 006 56.612,1 56.244 10.732 01.073,2
6 sagoibfotifenebhtlaehtludA hh/sR 006 79.403 69.011 14.95 01.495
7 retaehsulpSCIfostifenebhtlaehdlihC hh/sR 006 00.0 00.0 00.0 00.0
8 sagoibfotifenebhtlaehdlihC hh/sR 006 07.143 53.315 00.0 65.337,2
9 retaehsulpSCIfostifenebhtlaehlaunnA hh/sR 006 56.612,1 56.244 10.732 01.073,2
01 sagoibfotifenebhtlaehlaunnA hh/sR 006 76.646 17.125 14.95 16.030,3
Note: hh = household
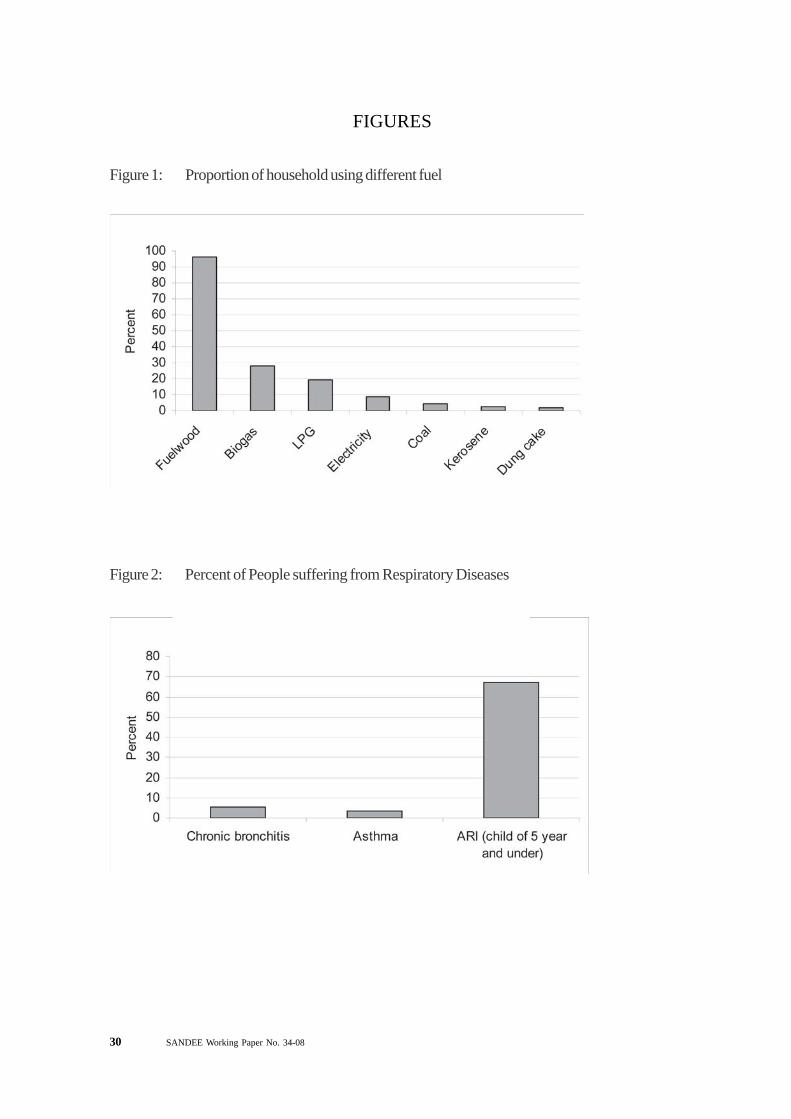
30 SANDEE Working Paper No. 34-08
Figure 2: Percent of People suffering from Respiratory Diseases
FIGURES
Figure 1: Proportion of household using different fuel
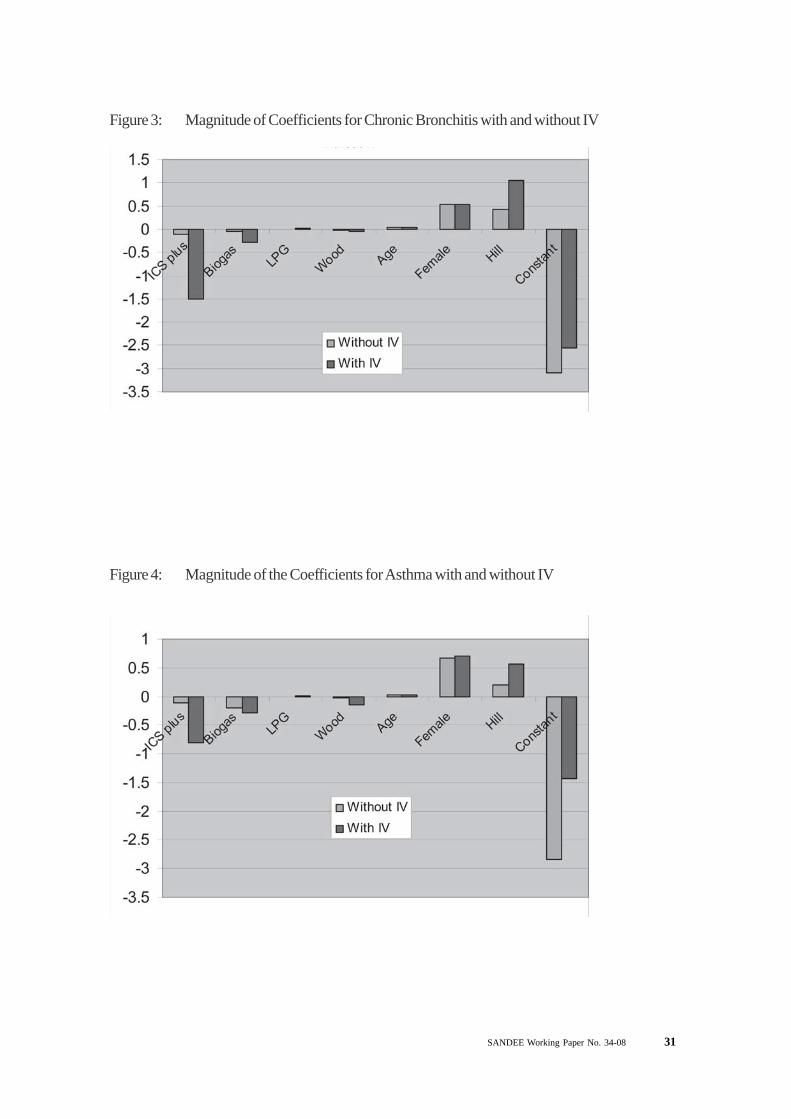
SANDEE Working Paper No. 34-08 31
Figure 3: Magnitude of Coefficients for Chronic Bronchitis with and without IV
Figure 4: Magnitude of the Coefficients for Asthma with and without IV
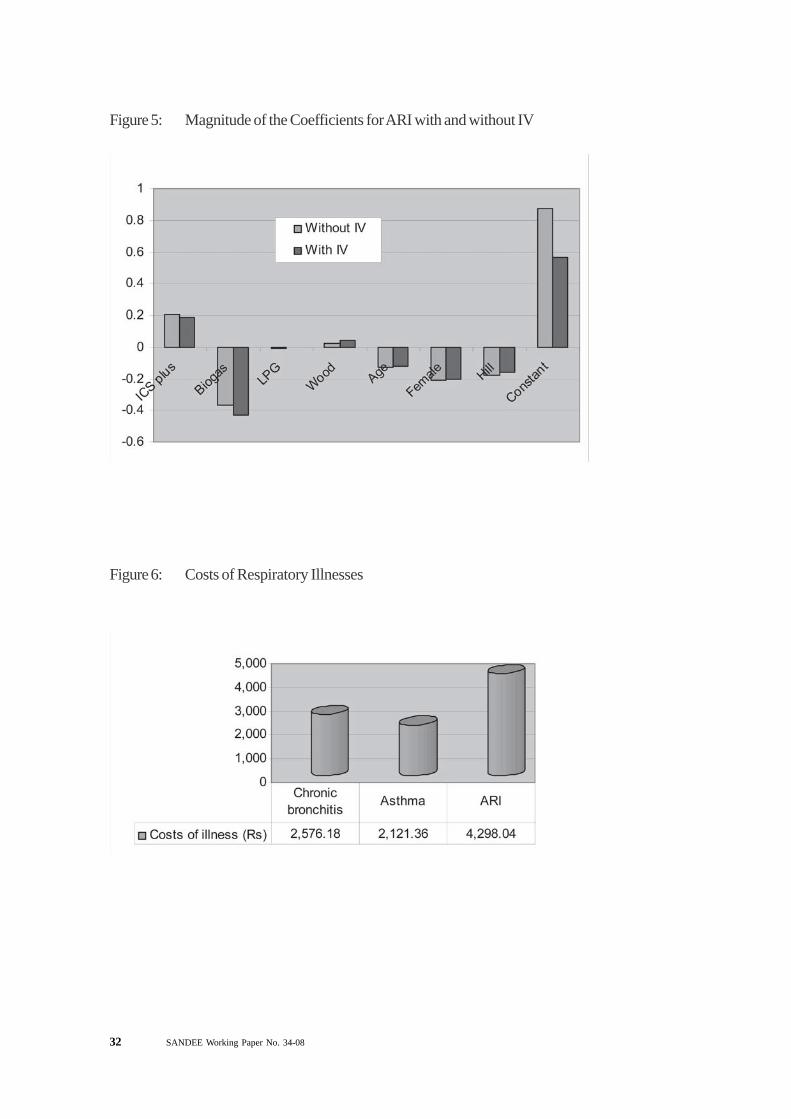
32 SANDEE Working Paper No. 34-08
Figure 5: Magnitude of the Coefficients for ARI with and without IV
Figure 6: Costs of Respiratory Illnesses
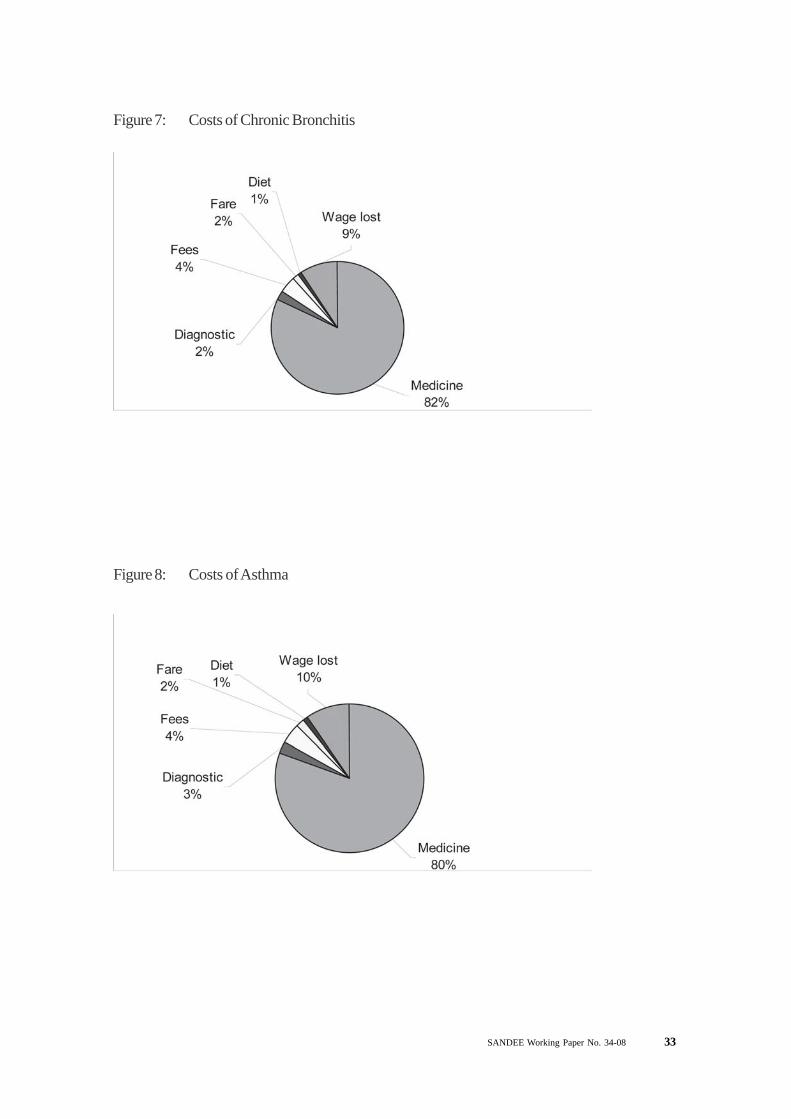
SANDEE Working Paper No. 34-08 33
Figure 7: Costs of Chronic Bronchitis
Figure 8: Costs of Asthma
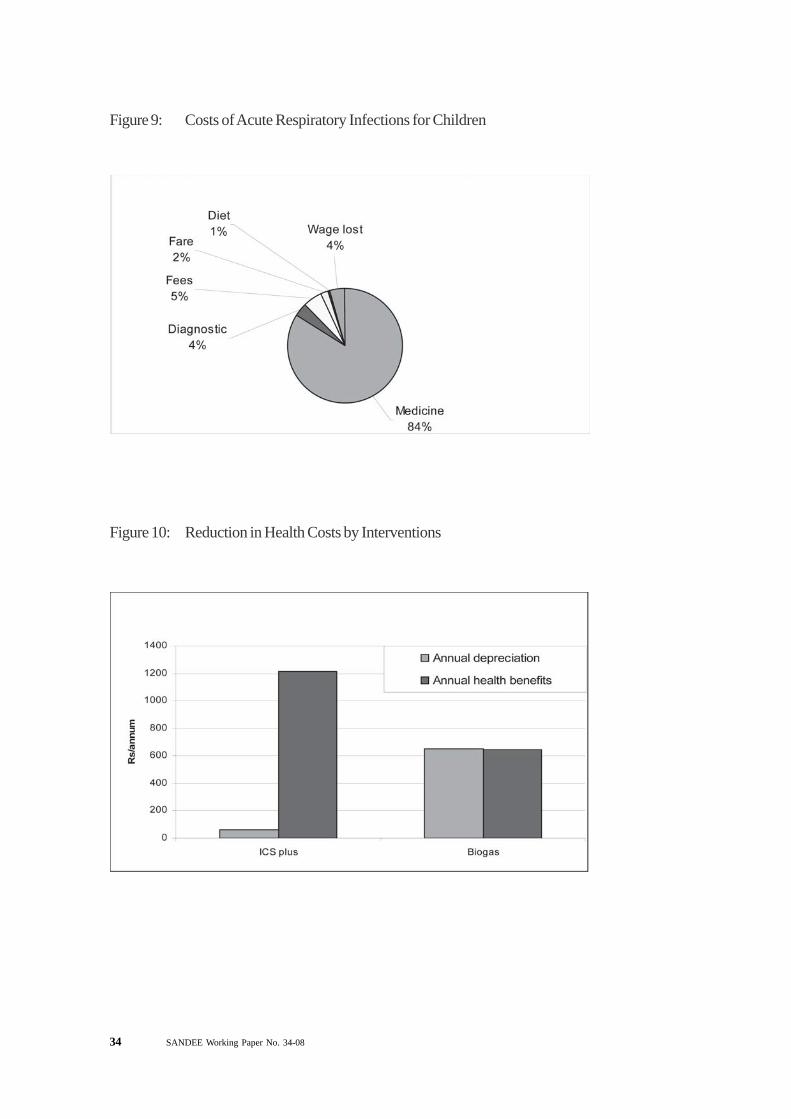
34 SANDEE Working Paper No. 34-08
Figure 9: Costs of Acute Respiratory Infections for Children
Figure 10: Reduction in Health Costs by Interventions
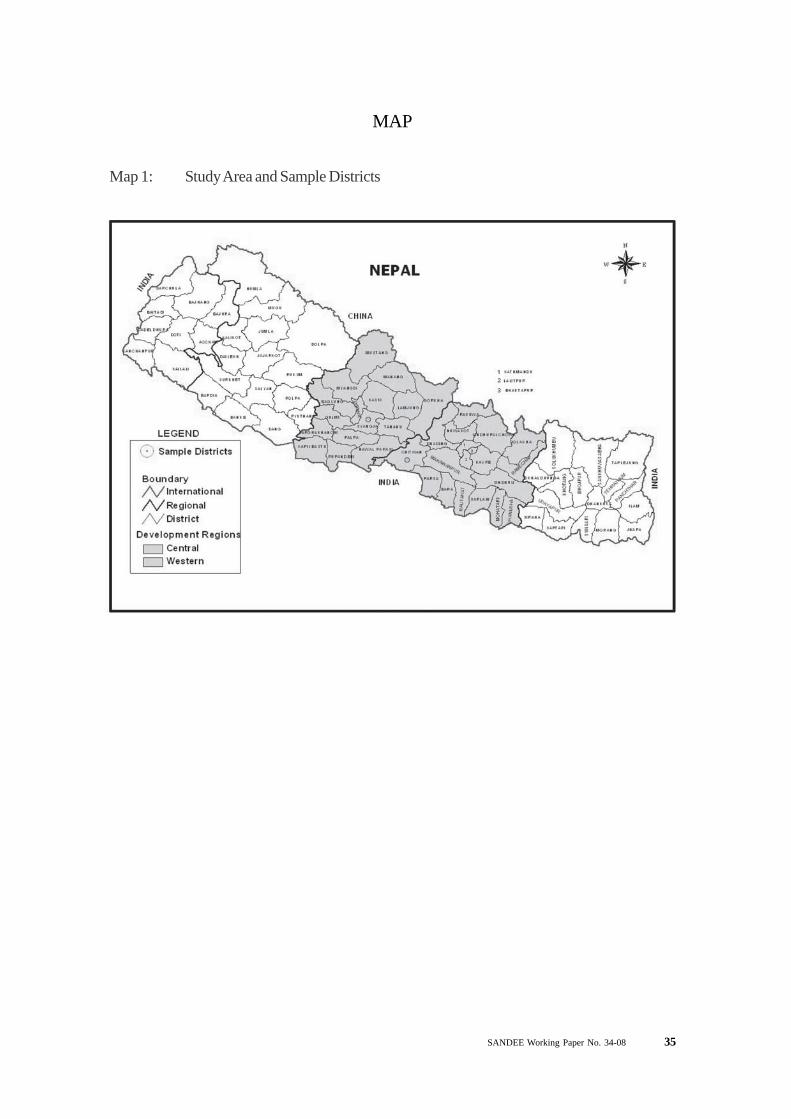
SANDEE Working Paper No. 34-08 35
MAP
Map 1: Study Area and Sample Districts
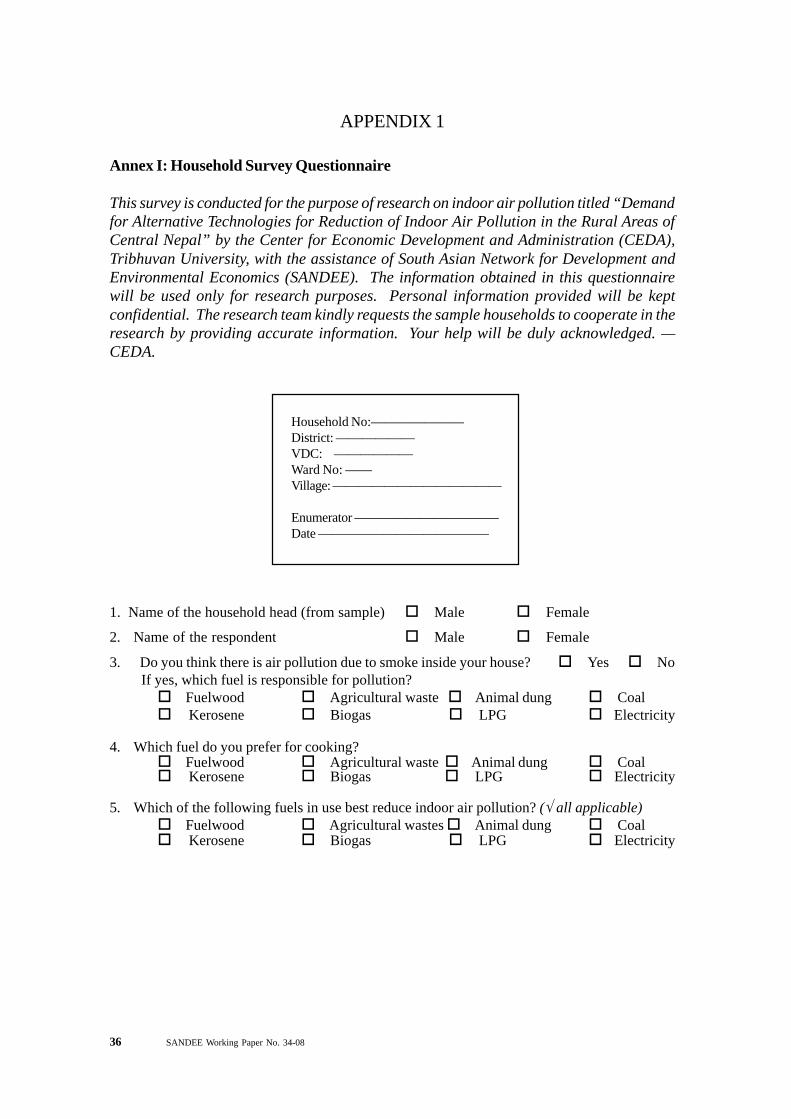
36 SANDEE Working Paper No. 34-08
APPENDIX 1
Annex I: Household Survey Questionnaire
This survey is conducted for the purpose of research on indoor air pollution titled “Demandfor Alternative Technologies for Reduction of Indoor Air Pollution in the Rural Areas ofCentral Nepal” by the Center for Economic Development and Administration (CEDA),Tribhuvan University, with the assistance of South Asian Network for Development andEnvironmental Economics (SANDEE). The information obtained in this questionnairewill be used only for research purposes. Personal information provided will be keptconfidential. The research team kindly requests the sample households to cooperate in theresearch by providing accurate information. Your help will be duly acknowledged. —CEDA.
1. Name of the household head (from sample) Male Female
2. Name of the respondent Male Female
3. Do you think there is air pollution due to smoke inside your house? Yes No If yes, which fuel is responsible for pollution?
Fuelwood Agricultural waste Animal dung Coal Kerosene Biogas LPG Electricity
4. Which fuel do you prefer for cooking? Fuelwood Agricultural waste Animal dung Coal Kerosene Biogas LPG Electricity
5. Which of the following fuels in use best reduce indoor air pollution? (√ all applicable) Fuelwood Agricultural wastes Animal dung Coal Kerosene Biogas LPG Electricity
Household No:———————District: ——————VDC: ——————Ward No: ——Village: —————————————
Enumerator ———————————Date —————————————
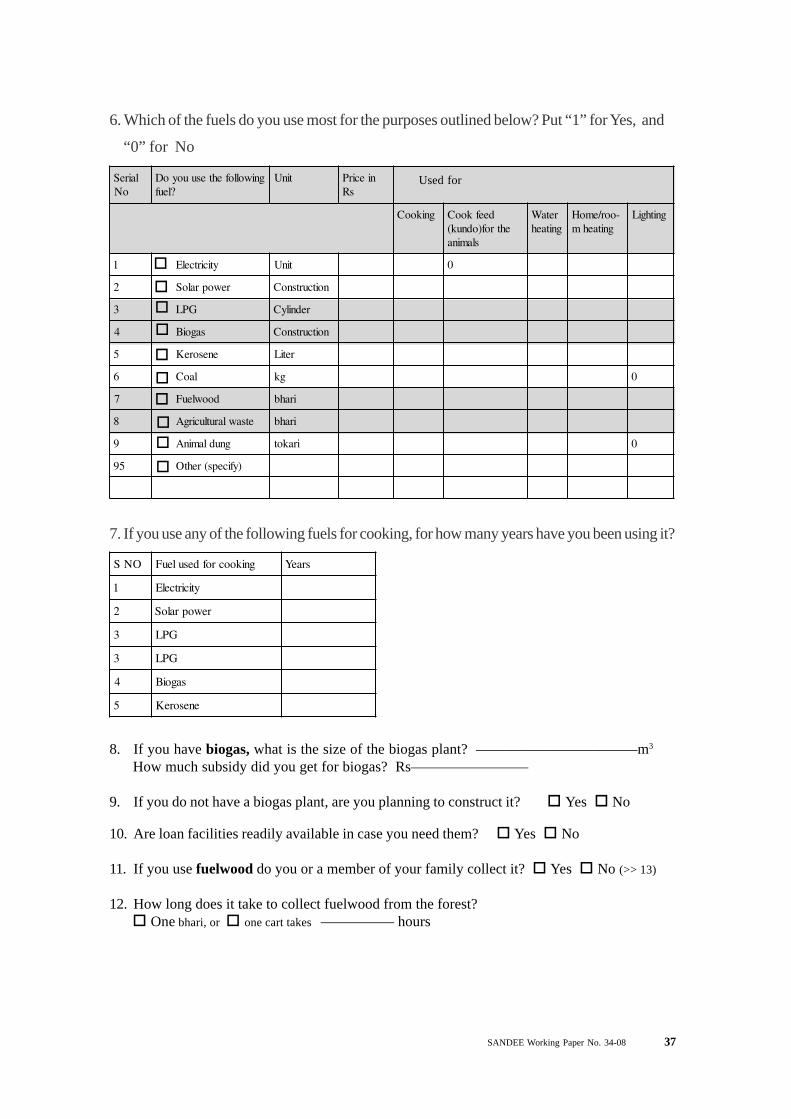
SANDEE Working Paper No. 34-08 37
Used forlaireSoN
gniwollofehtesuuoyoD?leuf
tinU niecirPsR
gnikooC deefkooCehtrof)odnuk(
slamina
retaWgnitaeh
-oor/emoHgnitaehm
gnithgiL
1 yticirtcelE tinU 0
2 rewopraloS noitcurtsnoC
3 GPL rednilyC
4 sagoiB noitcurtsnoC
5 enesoreK retiL
6 laoC gk 0
7 doowleuF irahb
8 etsawlarutlucirgA irahb
9 gnudlaminA irakot 0
59 )yficeps(rehtO
6. Which of the fuels do you use most for the purposes outlined below? Put “1” for Yes, and
“0” for No
7. If you use any of the following fuels for cooking, for how many years have you been using it?
ONS gnikoocrofdesuleuF sraeY
1 yticirtcelE
2 rewopraloS
3 GPL
3 GPL
4 sagoiB
5 enesoreK
8. If you have biogas, what is the size of the biogas plant? ———————————m3
How much subsidy did you get for biogas? Rs————————
9. If you do not have a biogas plant, are you planning to construct it? Yes No
10. Are loan facilities readily available in case you need them? Yes No
11. If you use fuelwood do you or a member of your family collect it? Yes No (>> 13)
12. How long does it take to collect fuelwood from the forest? One bhari, or one cart takes ————— hours

38 SANDEE Working Paper No. 34-08
ON.S leuF remmuS retniW doirePdnatinU
1 yticirtcelE
2 GPL
3 enesoreK
4 laoC
5 doowleuF
6 etsawlarutlucirgA
7 ekacgnudlaminA
8 )lanoitidart(aluhcduM
13. How much fuel do you use for cooking in summer and winter seasons?
Units Rs.
(√ appropriate boxes)
Units Rs.
One 14.2 kg cylinder enough for ?? days
Liter
kg, bag
kg, bhari
kg, bhari
kg, tokari
per day, per week, per month
per day, per week, per month
per day, per week, per month
per day, per week, per month
per day, per week, per month
per month
14. How many chulas do you use?
oNS aluhcfoepyT oN
uoydidhcumwoH?aluhchcaerofyap
)aluhc/sR(
foraeY?esahcrup
tilliwhcumwoHuoyfiwontsoc
?lles )aluhc/sR(
tilliwgnolwoHdetcepxE(?krow
)sraeyniefil
1 )sagoibroGPLrof(evotssaG
2 evotsenesoreK
3 )doowleufrof(aluhcdevorpmI
4 aluhcsetteuqirb/laoC
5 rekooceciR
6 retaehcirtcelE
7 enotseerht/dopirtnorI
8 )lanoitidart(aluhcduM
Used forcooking
(write ‘C’) orfor heating(write ‘H’)
If you have it
15. Do you have an improved chula? Yes No (>> 20)16. If you have an improved chula, how did you get it? constructed by mistry, constructed yourself, purchased from market
17. Do you like the improved chula? Yes No (>> 19)
18. What are your reasons for liking it? (answers may be multiple) fuel efficiency easy to handle utensils remain clean less smoke any other (specify)———————————(>>21)
19. What are the reasons for not liking the improved chula? (answers may be multiple) Difficult to handle takes longer time for cooking does not fit the pots pots become dirty, more smoke not enough heat available for space heating location of stove needs to be changed danger of termites damaging the ceiling wood in the absence of smoke any other (specify) —————————————————————-(>> 21)
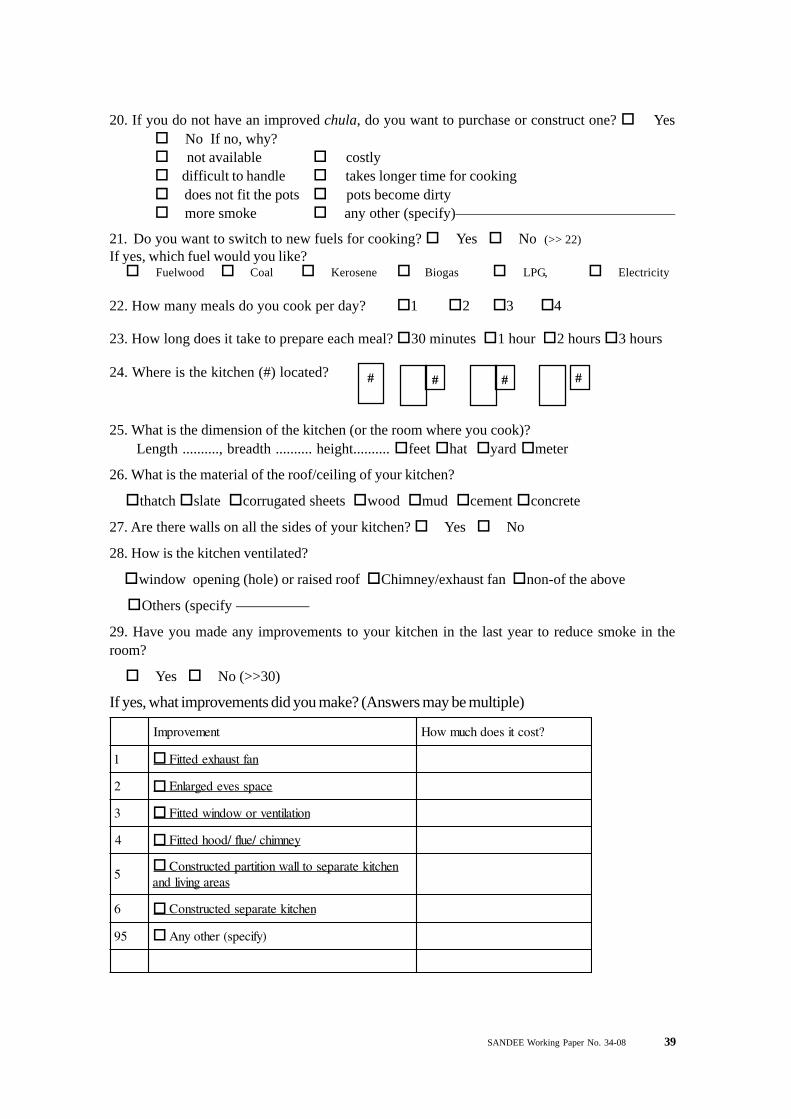
SANDEE Working Paper No. 34-08 39
20. If you do not have an improved chula, do you want to purchase or construct one? Yes No If no, why? not available costly difficult to handle takes longer time for cooking does not fit the pots pots become dirty more smoke any other (specify)———————————————
21. Do you want to switch to new fuels for cooking? Yes No (>> 22)If yes, which fuel would you like? Fuelwood Coal Kerosene Biogas LPG, Electricity
22. How many meals do you cook per day? 1 2 3 4
23. How long does it take to prepare each meal? 30 minutes 1 hour 2 hours 3 hours
24. Where is the kitchen (#) located? # # # #
25. What is the dimension of the kitchen (or the room where you cook)? Length .........., breadth .......... height.......... feet hat yard meter
26. What is the material of the roof/ceiling of your kitchen?
thatch slate corrugated sheets wood mud cement concrete
27. Are there walls on all the sides of your kitchen? Yes No
28. How is the kitchen ventilated?
window opening (hole) or raised roof Chimney/exhaust fan non-of the above
Others (specify —————
29. Have you made any improvements to your kitchen in the last year to reduce smoke in theroom?
Yes No (>>30)
If yes, what improvements did you make? (Answers may be multiple)
tnemevorpmI ?tsoctiseodhcumwoH
1 naftsuahxedettiF
2 ecapssevedegralnE
3 noitalitnevrowodniwdettiF
4 yenmihc/eulf/doohdettiF
5nehctiketarapesotllawnoititrapdetcurtsnoC
saeragnivildna
6 nehctiketarapesdetcurtsnoC
59 )yficeps(rehtoynA
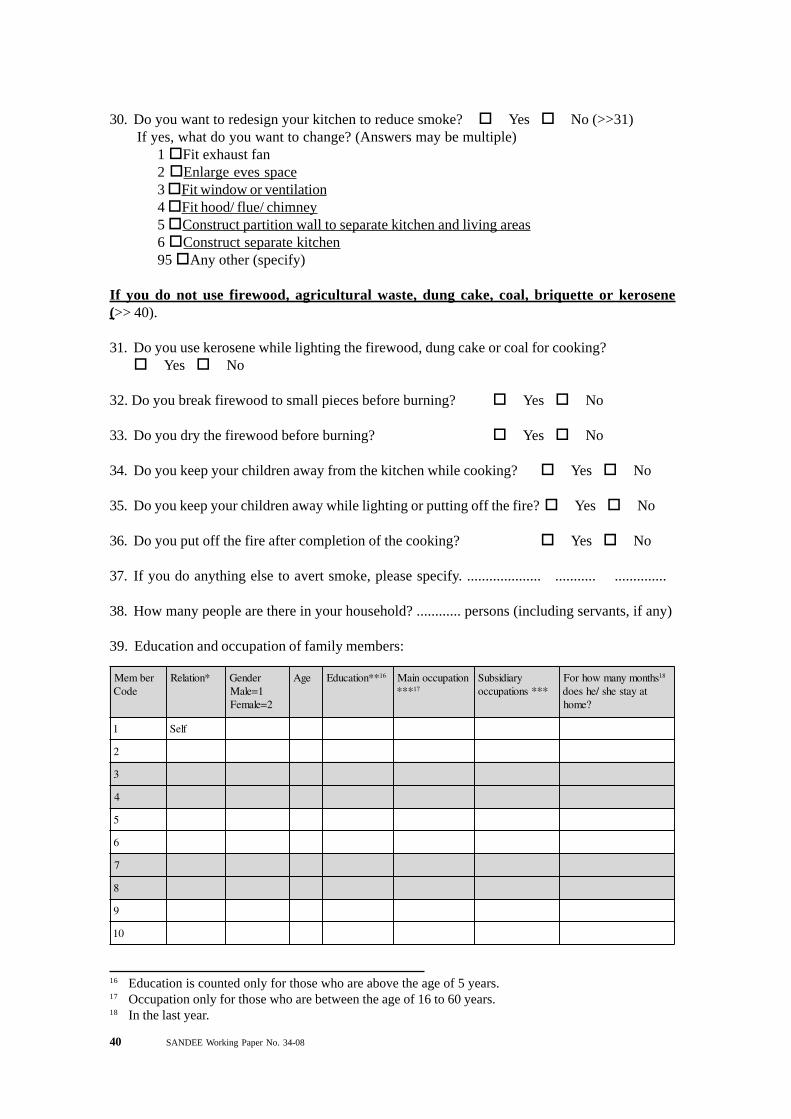
40 SANDEE Working Paper No. 34-08
30. Do you want to redesign your kitchen to reduce smoke? Yes No (>>31) If yes, what do you want to change? (Answers may be multiple)
1 Fit exhaust fan2 Enlarge eves space3 Fit window or ventilation4 Fit hood/ flue/ chimney5 Construct partition wall to separate kitchen and living areas6 Construct separate kitchen95 Any other (specify)
If you do not use firewood, agricultural waste, dung cake, coal, briquette or kerosene(>> 40).
31. Do you use kerosene while lighting the firewood, dung cake or coal for cooking? Yes No
32. Do you break firewood to small pieces before burning? Yes No
33. Do you dry the firewood before burning? Yes No
34. Do you keep your children away from the kitchen while cooking? Yes No
35. Do you keep your children away while lighting or putting off the fire? Yes No
36. Do you put off the fire after completion of the cooking? Yes No
37. If you do anything else to avert smoke, please specify. .................... ........... ..............
38. How many people are there in your household? ............ persons (including servants, if any)
39. Education and occupation of family members:
rebmeMedoC
*noitaleR redneG1=elaM
2=elameF
egA **noitacudE 61 noitapucconiaM*** 71
yraidisbuS***snoitapucco
shtnomynamwohroF 81
tayatsehs/ehseod?emoh
1 fleS
2
3
4
5
6
7
8
9
01
16 Education is counted only for those who are above the age of 5 years.17 Occupation only for those who are between the age of 16 to 60 years.18 In the last year.
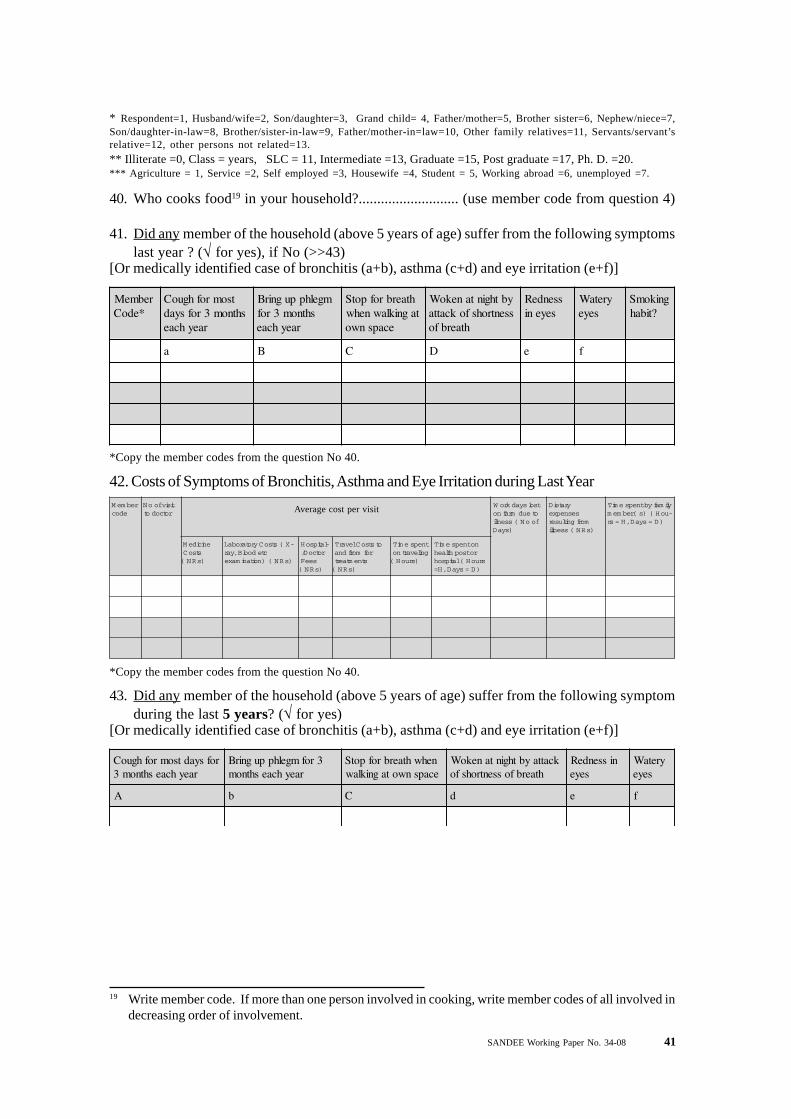
SANDEE Working Paper No. 34-08 41
40. Who cooks food19 in your household?........................... (use member code from question 4)
41. Did any member of the household (above 5 years of age) suffer from the following symptomslast year ? (√ for yes), if No (>>43)
[Or medically identified case of bronchitis (a+b), asthma (c+d) and eye irritation (e+f)]
* Respondent=1, Husband/wife=2, Son/daughter=3, Grand child= 4, Father/mother=5, Brother sister=6, Nephew/niece=7,Son/daughter-in-law=8, Brother/sister-in-law=9, Father/mother-in=law=10, Other family relatives=11, Servants/servant’srelative=12, other persons not related=13.** Illiterate =0, Class = years, SLC = 11, Intermediate =13, Graduate =15, Post graduate =17, Ph. D. =20.*** Agriculture = 1, Service =2, Self employed =3, Housewife =4, Student = 5, Working abroad =6, unemployed =7.
rebmeM*edoC
tsomrofhguoCshtnom3rofsyad
raeyhcae
mgelhppugnirBshtnom3rof
raeyhcae
htaerbrofpotStagniklawnehw
ecapsnwo
ybthgintanekoWssentrohsfokcatta
htaerbfo
ssendeRseyeni
yretaWseye
gnikomS?tibah
a B C D e f
*Copy the member codes from the question No 40.
42. Costs of Symptoms of Bronchitis, Asthma and Eye Irritation during Last YearrebmeM
edoctisivfooN
rotcodottsolsyadkroW
oteudmrafnofooN(ssenlli
)syaD
yrateiDsesnepxe
morfgnitluser)sRN(ssenlli
ylimafybtnepsemiT-uoH()s(rebmem
)D=syaD,H=sr
enicideMstsoC)sRN(
-X(stsoCyrotarobaLctedoolB,yar
)sRN()noitanimaxe
-latipsoHrotcoD/
seeF)sRN(
otstsoClevarTrofmorfdna
stnemtaert)sRN(
tnepsemiTgnilevartno
)sruoH(
notnepsemiTrotsophtlaeh
sruoH(latipsoh)D=syaD,H=
*Copy the member codes from the question No 40.
43. Did any member of the household (above 5 years of age) suffer from the following symptomduring the last 5 years? (√ for yes)
[Or medically identified case of bronchitis (a+b), asthma (c+d) and eye irritation (e+f)]
rofsyadtsomrofhguoCraeyhcaeshtnom3
3rofmgelhppugnirBraeyhcaeshtnom
nehwhtaerbrofpotSecapsnwotagniklaw
kcattaybthgintanekoWhtaerbfossentrohsfo
nissendeRseye
yretaWseye
A b C d e f
Average cost per visit
19 Write member code. If more than one person involved in cooking, write member codes of all involved indecreasing order of involvement.
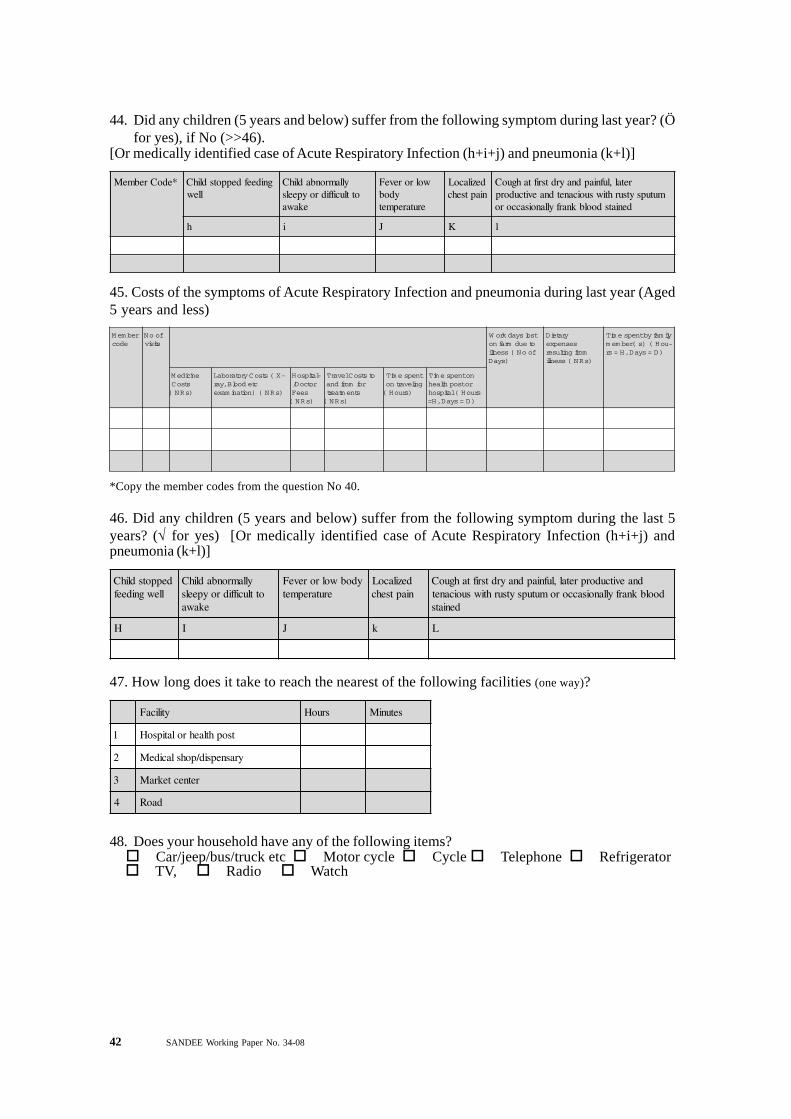
42 SANDEE Working Paper No. 34-08
44. Did any children (5 years and below) suffer from the following symptom during last year? (Öfor yes), if No (>>46).
[Or medically identified case of Acute Respiratory Infection (h+i+j) and pneumonia (k+l)]
45. Costs of the symptoms of Acute Respiratory Infection and pneumonia during last year (Aged5 years and less)
rebmeMedoc
fooNstisiv
tsolsyadkroWoteudmrafnofooN(ssenlli
)syaD
yrateiDsesnepxe
morfgnitluserssenlli sRN( )
ylimafybtnepsemiT)s(rebmem -uoH(
)D=syaD,H=sr
enicideMstsoC)sRN(
-X(stsoCyrotarobaLctedoolB,yar)noitanimaxe sRN( )
-latipsoHrotcoD/
seeF)sRN(
otstsoClevarTrofmorfdna
stnemtaert)sRN(
tnepsemiTgnilevartno
)sruoH(
notnepsemiTrotsophtlaeh
(latipsoh sruoH)D=syaD,H=
*edoCrebmeM gnideefdeppotsdlihCllew
yllamronbadlihCottluciffidroypeels
ekawa
wolroreveFydob
erutarepmet
dezilacoLniaptsehc
retal,lufniapdnayrdtsriftahguoCmutupsytsurhtiwsuoicanetdnaevitcudorp
deniatsdoolbknarfyllanoisaccoro
h i J K l
*Copy the member codes from the question No 40.
46. Did any children (5 years and below) suffer from the following symptom during the last 5years? (√ for yes) [Or medically identified case of Acute Respiratory Infection (h+i+j) andpneumonia (k+l)]
deppotsdlihCllewgnideef
yllamronbadlihCottluciffidroypeels
ekawa
ydobwolroreveFerutarepmet
dezilacoLniaptsehc
dnaevitcudorpretal,lufniapdnayrdtsriftahguoCdoolbknarfyllanoisaccoromutupsytsurhtiwsuoicanet
deniats
H I J k L
47. How long does it take to reach the nearest of the following facilities (one way)?
ytilicaF sruoH setuniM
1 tsophtlaehrolatipsoH
2 yrasnepsid/pohslacideM
3 retnectekraM
4 daoR
48. Does your household have any of the following items? Car/jeep/bus/truck etc Motor cycle Cycle Telephone Refrigerator TV, Radio Watch

SANDEE Working Paper No. 34-08 43
ytitnauQ )xobetairporppa(tinU
1 yddaP seepuR,dnuomakcup,dnuomahcak,irum,latniuq
2 taehW seepuR,dnuomakcup,dnuomahcak,irum,latniuq
3 eziaM irahbseepuR,dnuomakcup,dnuomahcak,irum,latniuq
4 yelraB seepuR,dnuomakcup,dnuomahcak,irum,latniuq
5 seotatoP seepuR,dnuomakcup,dnuomahcak,irum,latniuq
6 dratsuM seepuR,dnuomakcup,dnuomahcak,irum,latniuq
7 selbategeV seepuR,dnuomakcup,dnuomahcak,irum,latniuq
8 stiurF seepuR,dnuomakcup,dnuomahcak,irum,latniuq
9 regniG seepuR,dnuomakcup,dnuomahcak,irum,latniuq
01 yficeps,rehtoynA
49. May I ask you about your household income (non-agricultural)?
ecruoS sRNemocnilatoT )xobetairporppa(doireP
1 )emohtagnidisersrebmemfo(yralaS raeyrephtnomrep
2 *yticrodaorbagnikrowsrebmemylimafmorfemocnI raeyrephtnomrep
3 krowetareceip/tcartnoC raeyrephtnomrep
4 )dniknideviecersitahwfoeulavehtgnidulcni(egawyliaD raeyrephtnomrep
5 noisneP raeyrephtnomrep
6 tnemyolpmefleS raeyrephtnomrep
7 .cte,kcollub/tnempiuqe/rettuhs/gnidliubfotneR raeyrephtnomrep
8 .cte,sdnedivid/tseretnI raeyrephtnomrep
9 )yficeps(rehtoynA
* Take into account only the part of income received at home.
50. Do you have agricultural land? Yes No (>> 53)If yes, how much land do you have? Khet.........Bari....... Ropani, Bigha Katha Hall
51. Do you purchase chemical fertilizers? Yes No (>> 52) If yes, how much during last year?
rezilitreF ytitnauQ )xobetairporppa(tinU
1 aerU gab,gk
2 PAD gab,gk
3 hsatoP gab,gk
4 xelpmoC gab,gk
5 )yficeps(srehtO gab,gk
52. How much was your crop productions last year?
√
√
Average cost per visit

44 SANDEE Working Paper No. 34-08
53. How many cattle and buffaloes do you have?
tludA
1 elttaC
2 olaffuB
54. How much were your livestock and poultry productions?
ytitnauQ )xobetairporppa(tinU )xobetairporppa(doireP
1 taoG seepuR,rebmun raeyrep
2 peehS seepuR,rebmun raeyrep
3 sgiP seepuR,rebmun raeyrep
4 yrtluoP seepuR,rebmun raeyrephtnomrep,keewrep
5 kliM seepuR,gk,anam,retil raeyrephtnomrep,yadrep
6 ggE seepuR,rebmun -raeyrep,htnomrep,yadrep
7 yenoH seepuR,gk,anam,retil raeyrep
8 kliS seepuR,gk raeyrep
9 yficeps,rehtoynA
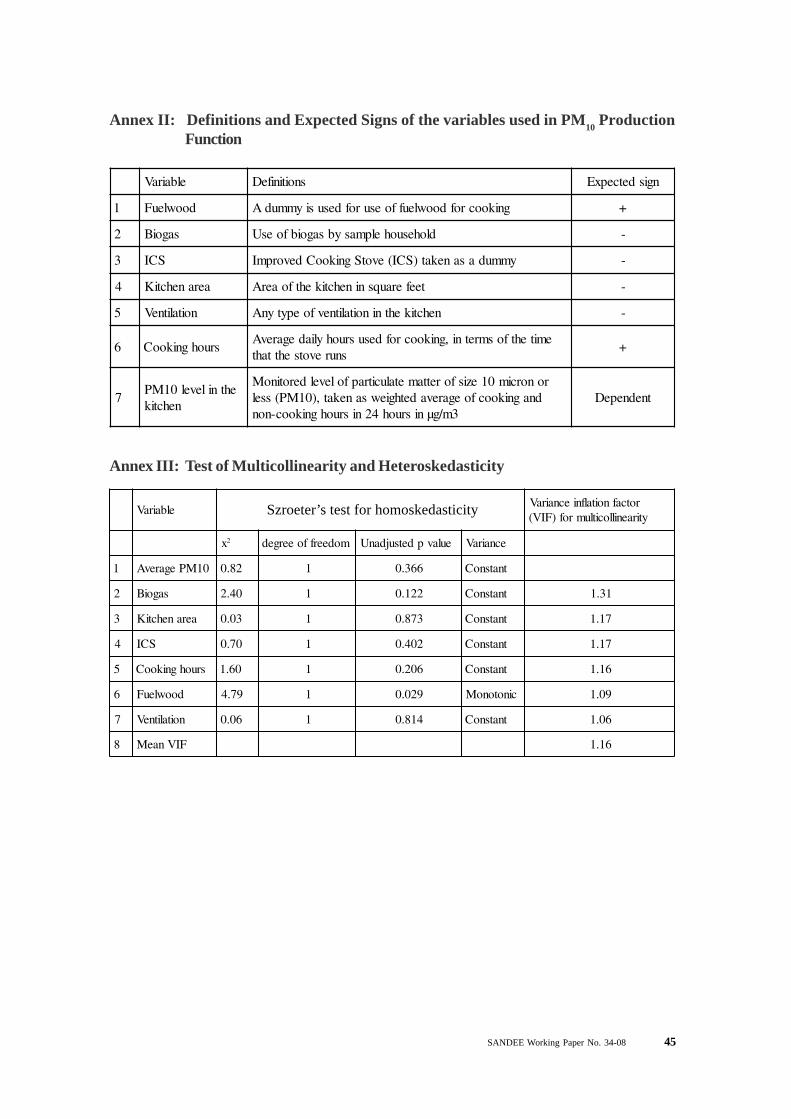
SANDEE Working Paper No. 34-08 45
Annex II: Definitions and Expected Signs of the variables used in PM10 ProductionFunction
elbairaV snoitinifeD ngisdetcepxE
1 doowleuF gnikoocrofdoowleuffoesurofdesusiymmudA +
2 sagoiB dlohesuohelpmasybsagoibfoesU -
3 SCI ymmudasanekat)SCI(evotSgnikooCdevorpmI -
4 aeranehctiK teeferauqsninehctikehtfoaerA -
5 noitalitneV nehctikehtninoitalitnevfoepytynA -
6 sruohgnikooCemitehtfosmretni,gnikoocrofdesusruohyliadegarevA
snurevotsehttaht+
7ehtnilevel01MP
nehctik
ronorcim01ezisforettametalucitrapfolevelderotinoMdnagnikoocfoegarevadethgiewsanekat,)01MP(ssel
3m/gµnisruoh42nisruohgnikooc-nontnednepeD
Annex III: Test of Multicollinearity and Heteroskedasticity
elbairaVrotcafnoitalfniecnairaVytiraenillocitlumrof)FIV(
x2 modeerffoeerged eulavpdetsujdanU ecnairaV
1 01MPegarevA 28.0 1 663.0 tnatsnoC
2 sagoiB 04.2 1 221.0 tnatsnoC 13.1
3 aeranehctiK 30.0 1 378.0 tnatsnoC 71.1
4 SCI 07.0 1 204.0 tnatsnoC 71.1
5 sruohgnikooC 06.1 1 602.0 tnatsnoC 61.1
6 doowleuF 97.4 1 920.0 cinotonoM 90.1
7 noitalitneV 60.0 1 418.0 tnatsnoC 60.1
8 FIVnaeM 61.1
Szroeter’s test for homoskedasticity
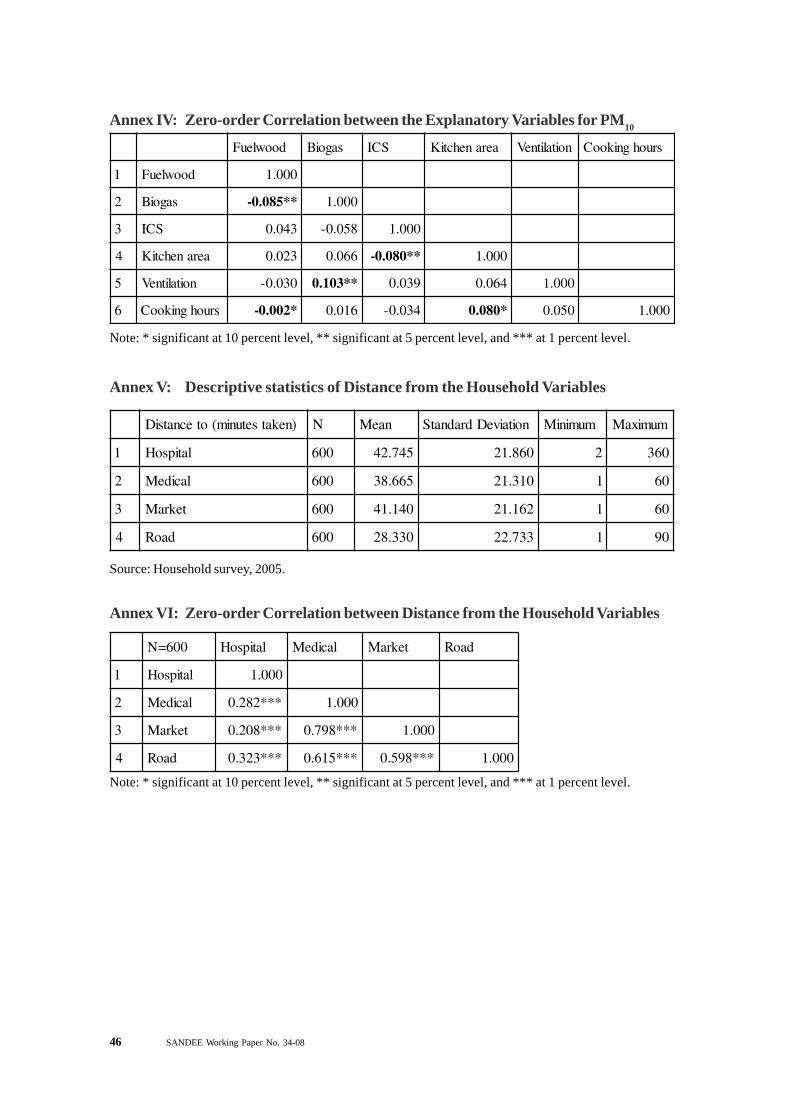
46 SANDEE Working Paper No. 34-08
Note: * significant at 10 percent level, ** significant at 5 percent level, and *** at 1 percent level.
Annex V: Descriptive statistics of Distance from the Household Variables
)nekatsetunim(otecnatsiD N naeM noitaiveDdradnatS muminiM mumixaM
1 latipsoH 006 547.24 068.12 2 063
2 lacideM 006 566.83 013.12 1 06
3 tekraM 006 041.14 261.12 1 06
4 daoR 006 033.82 337.22 1 09
Source: Household survey, 2005.
Annex VI: Zero-order Correlation between Distance from the Household Variables
006=N latipsoH lacideM tekraM daoR
1 latipsoH 000.1
2 lacideM ***282.0 000.1
3 tekraM ***802.0 ***897.0 000.1
4 daoR ***323.0 ***516.0 ***895.0 000.1
Note: * significant at 10 percent level, ** significant at 5 percent level, and *** at 1 percent level.
Annex IV: Zero-order Correlation between the Explanatory Variables for PM10
doowleuF sagoiB SCI aeranehctiK noitalitneV sruohgnikooC
1 doowleuF 000.1
2 sagoiB **580.0- 000.1
3 SCI 340.0 850.0- 000.1
4 aeranehctiK 320.0 660.0 **080.0- 000.1
5 noitalitneV 030.0- **301.0 930.0 460.0 000.1
6 sruohgnikooC *200.0- 610.0 430.0- *080.0 050.0 000.1
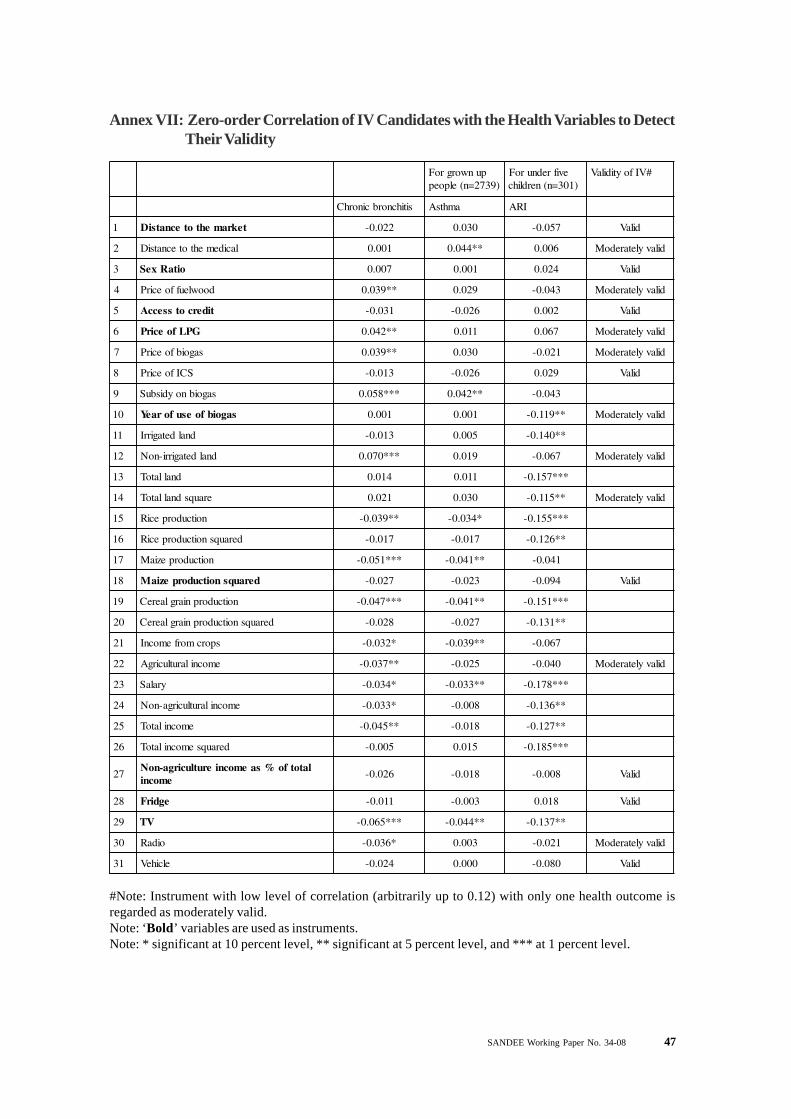
SANDEE Working Paper No. 34-08 47
Annex VII: Zero-order Correlation of IV Candidates with the Health Variables to DetectTheir Validity
punworgroF)9372=n(elpoep
evifrednuroF)103=n(nerdlihc
#VIfoytidilaV
sitihcnorbcinorhC amhtsA IRA
1 tekramehtotecnatsiD 220.0- 030.0 750.0- dilaV
2 lacidemehtotecnatsiD 100.0 **440.0 600.0 dilavyletaredoM
3 oitaRxeS 700.0 100.0 420.0 dilaV
4 doowleuffoecirP **930.0 920.0 340.0- dilavyletaredoM
5 tidercotsseccA 130.0- 620.0- 200.0 dilaV
6 GPLfoecirP **240.0 110.0 760.0 dilavyletaredoM
7 sagoibfoecirP **930.0 030.0 120.0- dilavyletaredoM
8 SCIfoecirP 310.0- 620.0- 920.0 dilaV
9 sagoibnoydisbuS ***850.0 **240.0 340.0-
01 sagoibfoesuforaeY 100.0 100.0 **911.0- dilavyletaredoM
11 dnaldetagirrI 310.0- 500.0 **041.0-
21 dnaldetagirri-noN ***070.0 910.0 760.0- dilavyletaredoM
31 dnallatoT 410.0 110.0 ***751.0-
41 erauqsdnallatoT 120.0 030.0 **511.0- dilavyletaredoM
51 noitcudorpeciR **930.0- *430.0- ***551.0-
61 derauqsnoitcudorpeciR 710.0- 710.0- **621.0-
71 noitcudorpeziaM ***150.0- **140.0- 140.0-
81 derauqsnoitcudorpeziaM 720.0- 320.0- 490.0- dilaV
91 noitcudorpniarglaereC ***740.0- **140.0- ***151.0-
02 derauqsnoitcudorpniarglaereC 820.0- 720.0- **131.0-
12 sporcmorfemocnI *230.0- **930.0- 760.0-
22 emocnilarutlucirgA **730.0- 520.0- 040.0- dilavyletaredoM
32 yralaS *430.0- **330.0- ***871.0-
42 emocnilarutlucirga-noN *330.0- 800.0- **631.0-
52 emocnilatoT **540.0- 810.0- **721.0-
62 derauqsemocnilatoT 500.0- 510.0 ***581.0-
72latotfo%saemocnierutlucirga-noN
emocni620.0- 810.0- 800.0- dilaV
82 egdirF 110.0- 300.0- 810.0 dilaV
92 VT ***560.0- **440.0- **731.0-
03 oidaR *630.0- 300.0 120.0- dilavyletaredoM
13 elciheV 420.0- 000.0 080.0- dilaV
#Note: Instrument with low level of correlation (arbitrarily up to 0.12) with only one health outcome isregarded as moderately valid.Note: ‘Bold’ variables are used as instruments.Note: * significant at 10 percent level, ** significant at 5 percent level, and *** at 1 percent level.

48 SANDEE Working Paper No. 34-08
Ann
ex V
III:
Zero
-ord
er C
orre
latio
n of
IV C
andi
date
s with
the E
ndog
enou
s Var
iabl
es to
Fin
d Th
eir S
tren
gths
setadidnaC
htgnertS
sulpS
CIsagoi
BG
PL
dooW
sulpS
CIsagoi
BG
PL
dooW
1tekra
meht
otecnatsi
D***550.0-
***531.0-***531.0-
***661.0-*590.0-
**931.0-**631.0-
***013.0-gnort
S
2lacide
meht
otecnatsi
D220.0-
***971.0-***181.0-
***022.0-***241.0-
***471.0 -***642.0-
***292.0-dli
M
3oita
RxeS
***570.0-000.0
***170.0-*530.0
**121.0-040.0-
750.0-**321.0
dliM
4doo
wleuffoecir
P***701.0
***531.0030.0-
810.0-***241.0
**211.0310.0
190.0-dli
M
5tiderc
otssecc
A***091.0
***743.0***141.0
920.0***182.0
***663.0***312.0
*790.0gnort
S
6GP
Lfo
ecirP***812.0
810.0***790.0-
610.0***113.0
230.0-**321.0-
060.0-gnort
S
7sagoibfo
ecirP
410.0***9 40.0
810.0-500.0
520.0*901.0-
*801.0-900.0-
8S
CIfoecir
P*430.0-
***740.0***140.0
**930.0310.0
220.0-830.0-
260.0
9sagoib
noydisbu
S***103.0
***880.0***970.0-
900.0-***363.0
350.0510.0-
640.0-gnort
S
01sagoib
foesu
foraeY
***501.0-***708.0
***101.0-** *280.0-
940.0-***747.0
180.0-860.0-
gnortS
11dnal
detagirrI***470.0-
***791.0***680.0
***021.0-900.0
***722.0***051.0
***18 1.0-dli
M
21dnal
detagirri-noN
***803.0***131.0
700.0-320.0
***823.0***381.0
480.0-260.0
gnortS
31dnallatoT
**440.0***432.0
***970.0***501.0-
**611.0***872.0
**611.0***451.0-
dliM
41erauqs
dnallatoT900.0-
***151.0**930.0
***990.0-*001.0
***191.0*401.0
***102.0-dli
M
51noitcudorp
eciR
***940.0-***502.0
***761.0***790.0-
330.0***292.0
***342.0*601.0-
dliM
61derauqs
noitc udorpeci
R010.0-
***021.0***651.0
***711.0-070.0
***071.0***362.0
***891.0-dli
M
71noitcudorp
eziaM
200.0-***721.0
***301.0**540.0-
870.0-***903.0
340.0900.0
gnortS
81derauqs
noitcudorpezia
M**540.0
***850.0***070.0
***350.0-390.0-
***342.0910.0-
250.0-dli
M
91noitcudorp
niarglaereC
620.0-***981.0
***561.0***770.0-
400.0***933.0
***012.0170.0-
gnortS
02derauqs
noitc udorpniarglaere
C920.0
***311.0***451.0
***080.0-050.0
***752.0***952.0
***861.0-dli
M
12sporc
morfe
mocnI***270.0
***932.0***021.0
300.0-290.0
***613.0***261.0
740.0-gnort
S
22e
mocnilarutlucirgA
220.0***822.0
***080.0310.0-
250.0***073.0
**321.0860.0-
gnortS
32yrala
S**830.0
***870.0***091.0
***160.0-390.0
390.0**141.0
660.0-dli
M
42e
mocnilarutlucirga-noN
***951.0** *260.0
***652.0700.0
**531.0***572.0
***243.0760.0-
gnortS
52e
mocnilatoT***441.0
***451.0***252.0
000.0**131.0
***963.0***8 23.0
180.0-gnort
S
62derauqs
emocnilatoT
***780.0***050.0
***751.0810.0-
370.0***243.0
***382.0**631.0-
gnortS
72e
mocnilatotfo
%sa
emocni
erutlucirga-noN
***651.0620.0-
***022.0720.0
280.0730.0-
***391.0110.0-
dliM
82egdirF
***941.0***021.0
*** 773.0310.0
***272.0*490.0
***906.0**511.0
gnortS
92V
T310.0-
***102.0***722.0
*630.0***651.0
***412.0***823.0
760.0gnort
S
03oida
R***370.0
500.0***301.0
***980.0***671.0
**931.0**131.0
940.0dli
M
13elcihe
V310.0
***921.0***680.0
100.0-860.0
**031.0***172.0
410.0-dli
M
Not
es: ‘
Bol
d’ v
aria
bles
are
use
d as
inst
rum
ents
. * si
gnifi
cant
at 1
0 pe
rcen
t lev
el, *
* si
gnifi
cant
at 5
per
cent
leve
l, an
d **
* at
1 p
erce
nt le
vel.
For
unde
r fi
ve c
hild
ren
(n=3
01)
For
grow
n up
peo
ple
(n=2
739)

SANDEE Working Paper No. 34-08 49
Annex IX: Effects of Fuel Consumption and Chula on Chronic Bronchitis (age >10years) - Without IV
selbairavyrotanalpxE tneiciffeoC xd/Fd rorrEdradnatS rab-x
1 +sevotskoocdevorpmI 301.0- 600.0- 700.0 734.0 910.0- 600.0
2 +sagoiB 940.0- 300.0- 600.0 313.0 410.0- 800.0
3 GPL 200.0- 1000.0- 000.0 211.21 000.0 000.0
4 dooW ***320.0- ***100.0- 100.0 246.21 200.0- 000.0
5 egA ***130.0 ***200.0 000.0 714.33 200.0 200.0
6 +elameF ***525.0 ***230.0 600.0 594.0 020.0 440.0
7 +lliH ***624.0 ***620.0 700.0 794.0 310.0 830.0
8 tnatsnoC ***001.3- doohilekilgoL )7(2ihcRL 95.842
9 PdevresbO 550.0 9372=n 2ihc>borP 000.0
01 PdetciderP 520.0 )rab-xta( 2RoduesP 412.0
(+) dF/dx is for discrete change of dummy variable from 0 to 1Note: * significant at 10 percent level, ** significant at 5 percent level, and *** at 1 percent level.
Annex X: Effects of Fuel Consumption and Chula on Asthma (age>10 years)–Without IV
selbairavyrotanalpxE tneiciffeoC xd/Fd rorrEdradnatS rab-x
1 +sevotskoocdevorpmI 111.0- 500.0- 500.0 734.0 510.0- 600.0
2 +sagoiB *402.0- *800.0- 400.0 313.0 610.0- 000.0
3 GPL 200.0- 1000.0- 000.0 211.21 000.0 000.0
4 dooW ***030.0- ***100.0- 000.0 246.21 200.0- 000.0
5 egA ***420.0 ***100.0 000.0 714.33 100.0 100.0
6 +elameF ***676.0 ***030.0 500.0 594.0 910.0 140.0
7 +lliH *591.0 *800.0 500.0 794.0 200.0- 810.0
8 tnatsnoC ***838.2- doohilekilgoL )7(2ihcRL 02.331
9 PdevresbO 430.0 9372=n 2ihc>borP 000.0
01 PdetciderP 710.0 )rab-xta( 2RoduesP 461.0
95% Confidence Interval
95% Confidence Interval
(+) dF/dx is for discrete change of dummy variable from 0 to 1Note: * significant at 10 percent level, ** significant at 5 percent level, and *** at 1 percent level.
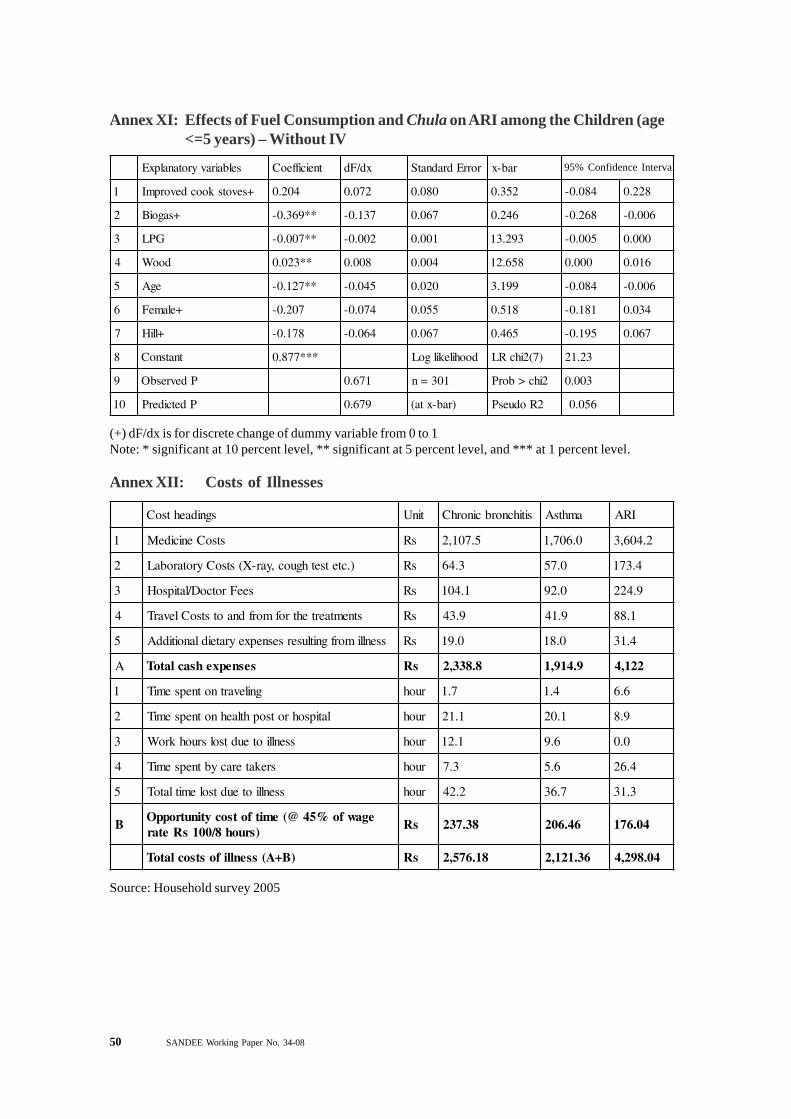
50 SANDEE Working Paper No. 34-08
Annex XI: Effects of Fuel Consumption and Chula on ARI among the Children (age<=5 years) – Without IV
selbairavyrotanalpxE tneiciffeoC xd/Fd rorrEdradnatS rab-x
1 +sevotskoocdevorpmI 402.0 270.0 080.0 253.0 480.0- 822.0
2 +sagoiB **963.0- 731.0- 760.0 642.0 862.0- 600.0-
3 GPL **700.0- 200.0- 100.0 392.31 500.0- 000.0
4 dooW **320.0 800.0 400.0 856.21 000.0 610.0
5 egA **721.0- 540.0- 020.0 991.3 480.0- 600.0-
6 +elameF 702.0- 470.0- 550.0 815.0 181.0- 430.0
7 +lliH 871.0- 460.0- 760.0 564.0 591.0- 760.0
8 tnatsnoC ***778.0 doohilekilgoL )7(2ihcRL 32.12
9 PdevresbO 176.0 103=n 2ihc>borP 300.0
01 PdetciderP 976.0 )rab-xta( 2RoduesP 650.0
95% Confidence Interval
(+) dF/dx is for discrete change of dummy variable from 0 to 1Note: * significant at 10 percent level, ** significant at 5 percent level, and *** at 1 percent level.
Annex XII: Costs of Illnesses
sgnidaehtsoC tinU sitihcnorbcinorhC amhtsA IRA
1 stsoCenicideM sR 5.701,2 0.607,1 2.406,3
2 ).ctetsethguoc,yar-X(stsoCyrotarobaL sR 3.46 0.75 4.371
3 seeFrotcoD/latipsoH sR 1.401 0.29 9.422
4 stnemtaertehtrofmorfdnaotstsoClevarT sR 9.34 9.14 1.88
5 ssenllimorfgnitlusersesnepxeyrateidlanoitiddA sR 0.91 0.81 4.13
A sesnepxehsaclatoT sR 8.833,2 9.419,1 221,4
1 gnilevartnotnepsemiT ruoh 7.1 4.1 6.6
2 latipsohrotsophtlaehnotnepsemiT ruoh 1.12 1.02 9.8
3 ssenllioteudtsolsruohkroW ruoh 1.21 6.9 0.0
4 srekateracybtnepsemiT ruoh 3.7 6.5 4.62
5 ssenllioteudtsolemitlatoT ruoh 2.24 7.63 3.13
Begawfo%54@(emitfotsocytinutroppO
)sruoh8/001sRetarsR 83.732 64.602 40.671
)B+A(ssenllifostsoclatoT sR 81.675,2 63.121,2 40.892,4
Source: Household survey 2005

SANDEE Working Paper No. 34-08 51