Estimating Foreign Value -added in Mexico’s Manufacturing ... · Estimating Foreign Value -added...
33
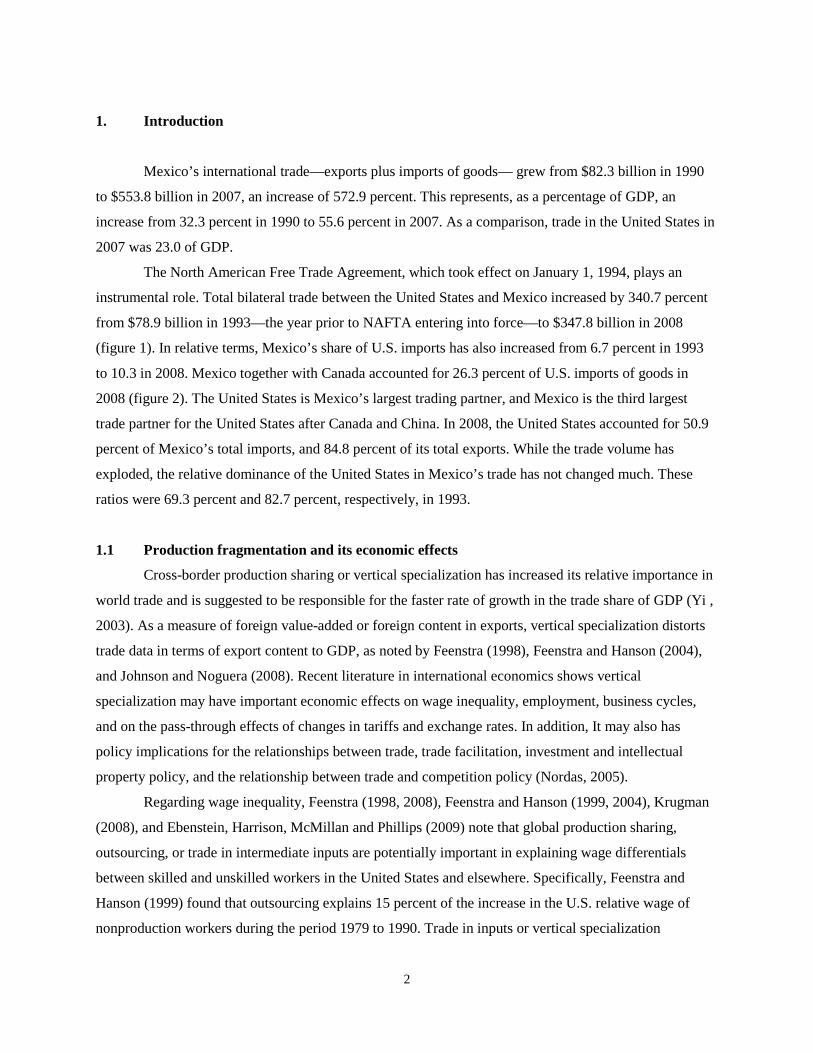
1 January 5, 2011 Estimating Foreign Value-added in Mexico’s Manufacturing Exports Justino De La Cruz, Robert B. Koopman, and Zhi Wang United States International Trade Commission Shang-Jin Wei Columbia University, CEPR, and NBER Abstract We report estimates of foreign value-added (FVA) in Mexico’s manufacturing exports that takes into account the high import content of production in the Maquiladora and PITEX programs, using a methodology developed in Koopman, Wang, and Wei (2008). This is the first study for Mexico that measures vertical specialization using a recently available input-output table for the Maquiladora industry in addition to trade data from both export promotion programs. On average, Mexico’s manufacturing exports have a FVA share of about 66 percent. Those industries that have a foreign content share of 50 percent or more account for 80 percent of the country’s manufacturing exports. They include computer and peripheral equipment, audio and video equipment, communications equipment, semiconductor and other electronic components, and electrical equipment. JEL Codes: F1, C67, C82 Key words: Mexico, vertical specialization, domestic and foreign value-added, and processing exports The authors are grateful to Hubert Escaith, Ted H. Moran, Ralph Watkins, Ruben Mata, Hugh Arce, Christine McDaniel, and Ricardo Rojas for helpful comments, and Eric Cardenas and Natalia Buniewicz for research assistance. We are especially grateful to José Arturo Blancas Espejo, Rodolfo Daude Balmer, Ernesto Garcia Zuñiga, and Jaime A. de la Llata from INEGI for providing data and input-output tables. The views in the paper are those of the authors and are not the official views of the USITC or of any other organization that the authors are affiliated with.
Transcript of Estimating Foreign Value -added in Mexico’s Manufacturing ... · Estimating Foreign Value -added...
1
January 5, 2011
Estimating Foreign Value-added in Mexico’s Manufacturing Exports
Justino De La Cruz, Robert B. Koopman, and Zhi Wang United States International Trade Commission
Shang-Jin Wei
Columbia University, CEPR, and NBER
Abstract We report estimates of foreign value-added (FVA) in Mexico’s manufacturing exports that takes into account the high import content of production in the Maquiladora and PITEX programs, using a methodology developed in Koopman, Wang, and Wei (2008). This is the first study for Mexico that measures vertical specialization using a recently available input-output table for the Maquiladora industry in addition to trade data from both export promotion programs. On average, Mexico’s manufacturing exports have a FVA share of about 66 percent. Those industries that have a foreign content share of 50 percent or more account for 80 percent of the country’s manufacturing exports. They include computer and peripheral equipment, audio and video equipment, communications equipment, semiconductor and other electronic components, and electrical equipment. JEL Codes: F1, C67, C82 Key words: Mexico, vertical specialization, domestic and foreign value-added, and processing exports The authors are grateful to Hubert Escaith, Ted H. Moran, Ralph Watkins, Ruben Mata, Hugh Arce, Christine McDaniel, and Ricardo Rojas for helpful comments, and Eric Cardenas and Natalia Buniewicz for research assistance. We are especially grateful to José Arturo Blancas Espejo, Rodolfo Daude Balmer, Ernesto Garcia Zuñiga, and Jaime A. de la Llata from INEGI for providing data and input-output tables. The views in the paper are those of the authors and are not the official views of the USITC or of any other organization that the authors are affiliated with.
2
1. Introduction
Mexico’s international trade—exports plus imports of goods— grew from $82.3 billion in 1990
to $553.8 billion in 2007, an increase of 572.9 percent. This represents, as a percentage of GDP, an
increase from 32.3 percent in 1990 to 55.6 percent in 2007. As a comparison, trade in the United States in
2007 was 23.0 of GDP.
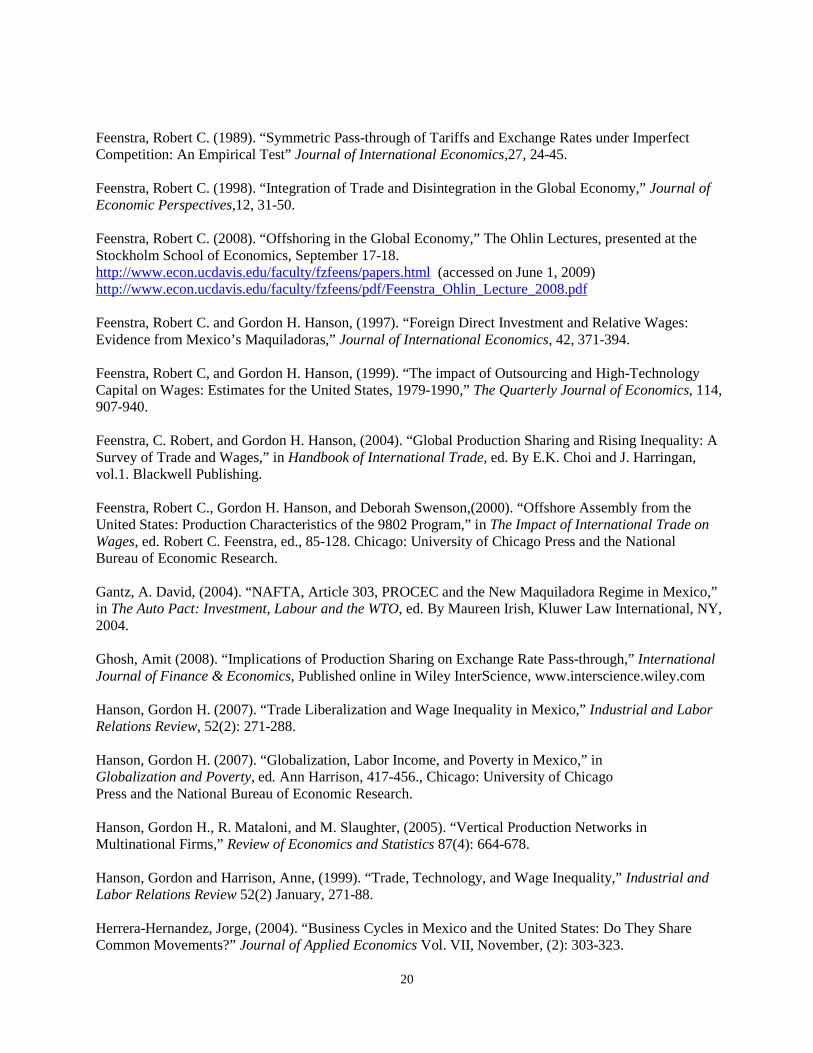
The North American Free Trade Agreement, which took effect on January 1, 1994, plays an
instrumental role. Total bilateral trade between the United States and Mexico increased by 340.7 percent
from $78.9 billion in 1993—the year prior to NAFTA entering into force—to $347.8 billion in 2008
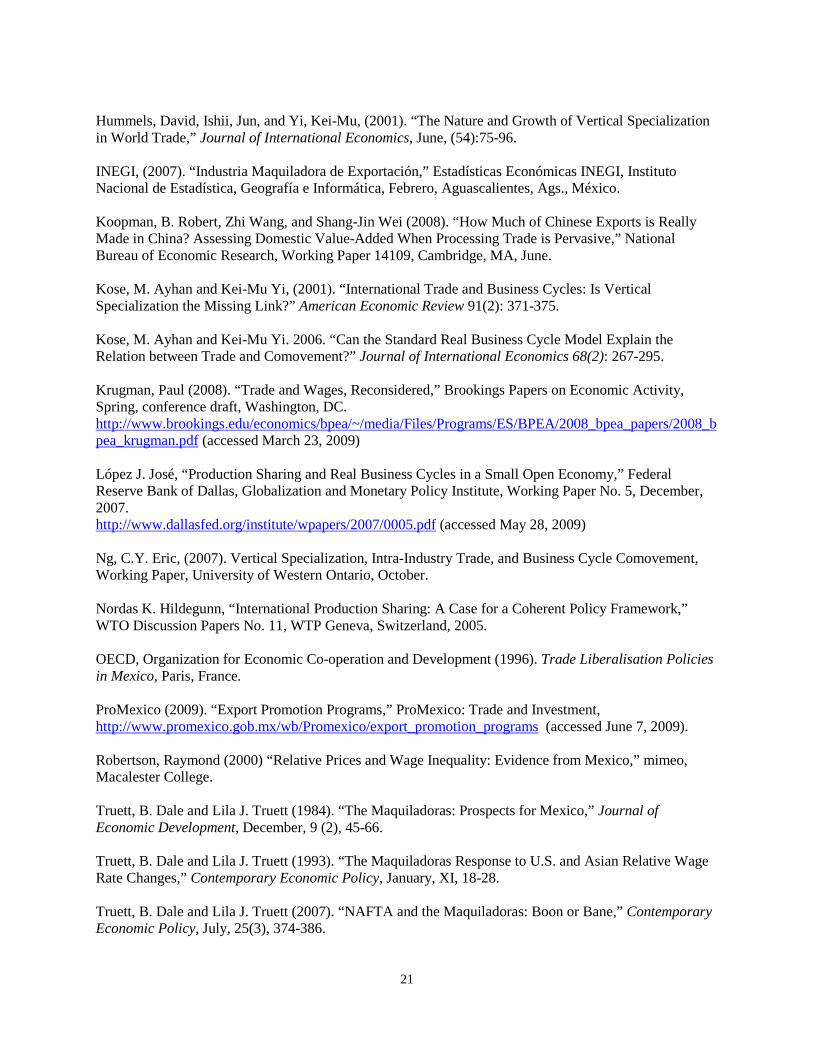
(figure 1). In relative terms, Mexico’s share of U.S. imports has also increased from 6.7 percent in 1993
to 10.3 in 2008. Mexico together with Canada accounted for 26.3 percent of U.S. imports of goods in
2008 (figure 2). The United States is Mexico’s largest trading partner, and Mexico is the third largest
trade partner for the United States after Canada and China. In 2008, the United States accounted for 50.9
percent of Mexico’s total imports, and 84.8 percent of its total exports. While the trade volume has
exploded, the relative dominance of the United States in Mexico’s trade has not changed much. These
ratios were 69.3 percent and 82.7 percent, respectively, in 1993.
1.1 Production fragmentation and its economic effects
Cross-border production sharing or vertical specialization has increased its relative importance in
world trade and is suggested to be responsible for the faster rate of growth in the trade share of GDP (Yi ,
2003). As a measure of foreign value-added or foreign content in exports, vertical specialization distorts
trade data in terms of export content to GDP, as noted by Feenstra (1998), Feenstra and Hanson (2004),
and Johnson and Noguera (2008). Recent literature in international economics shows vertical
specialization may have important economic effects on wage inequality, employment, business cycles,
and on the pass-through effects of changes in tariffs and exchange rates. In addition, It may also has
policy implications for the relationships between trade, trade facilitation, investment and intellectual
property policy, and the relationship between trade and competition policy (Nordas, 2005).
Regarding wage inequality, Feenstra (1998, 2008), Feenstra and Hanson (1999, 2004), Krugman
(2008), and Ebenstein, Harrison, McMillan and Phillips (2009) note that global production sharing,
outsourcing, or trade in intermediate inputs are potentially important in explaining wage differentials
between skilled and unskilled workers in the United States and elsewhere. Specifically, Feenstra and
Hanson (1999) found that outsourcing explains 15 percent of the increase in the U.S. relative wage of
nonproduction workers during the period 1979 to 1990. Trade in inputs or vertical specialization
3
depresses the demand for less-skilled workers while raising the relative demand and wages of the higher-
skilled. Evidence on Mexico also suggests that outsourcing by multinationals has contributed to the
increase in the relative wage of skilled-workers in the country (Feenstra and Hanson, 1997).1
With respect to tariffs, in an earlier paper Yi (2003) theorized that because of vertical
specialization, tariff reductions can have magnifying effects on imports prices. Empirically, Feenstra
(2008) confirmed this with evidence from the Information Technology Agreement (ITA) of the WTO
under which tariffs on high-technology goods were eliminated from 1997 to 1999. Feenstra estimated a
tariff pass-through coefficient of 22.6 suggesting that the multilateral tariff reductions under ITA had
magnified effects on decreasing U.S. import prices, as prices declined many times more that the tariff
decreases. In contrast, the pass-through effect of exchange rates under production sharing seems to be
relative small both empirically and theoretically, which has contributed to keeping prices low.
Production sharing has the potential to synchronize business cycles as well as to increase the
volatility and severity of economic fluctuations. Burstein, Kurz and Tesar (2008), in a multi-country
setting, and López (2007), for a small open economy, show that production sharing can generate business
cycles synchronization. The Lopéz’s model of business cycle, in which the transmission mechanism is
production sharing, successfully replicated real business statistics of the Mexican maquiladora or
production sharing manufacturing sector. Empirically, Herrera (2004), and Chiquiar and Ramos-Francia
(2005) show that the U.S. and Mexican manufacturing sectors became synchronized after NAFTA was
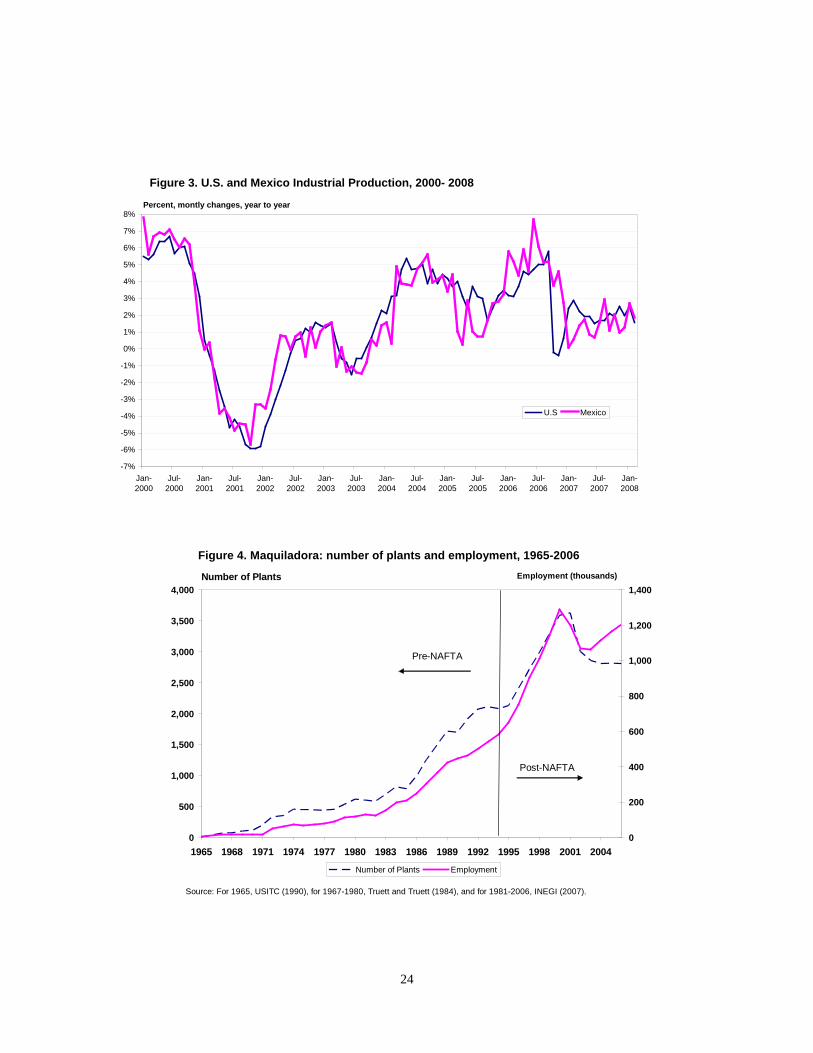
enacted. This also seems to be the case during the period from 2000 to 2008 (figure 3). Furthermore,
Bergin, Feenstra, and Hanson (2008, 2009) provide theoretical and empirical evidence suggesting that the
Mexican maquiladora industry associated with U.S. production sharing experiences fluctuations in
employment that are twice as volatile as that of their counterpart industries in the United States. Feenstra
(2008, p. 87) adds: “That fact that the maquiladora industries are more volatile means that the U.S. is
essentially exporting some of its business cycle, or more precisely, exporting the cyclical fluctuations due
to demand shocks.” Regarding vertical specialization and the severity of business cycles, Yi (2009)
analyzed the recent collapse of global trade, suggests that vertical specialization can amplify trade effects
so that the collapse in global trade in the fourth quarter of 2008 has been sudden, severe, and
synchronized. Yi’s explanation is based on the linkage between U.S. exports and U.S. imports, i.e. when
U.S. imports decline so do U.S. exports of intermediate goods used in the manufacturing of U.S. imports
of final goods. In this instance, we have a multiplicative effect as vertical specialization links a country’s
imports to its exports.
2
1 Rising wage inequality in Mexico may also be explained by trade and quality upgrading noted by Verhoogen (2008), and by trade liberalization as suggested by Hanson and Harrison (1999) and Chiquiar (2008). 2 Without accounting for the presence of vertical specialization, most of the current literature asserts that the pass-through effect of exchange rates has been declining from 0.5 to 0.2, Campa and Goldberg (2006).
Bergin
4
and Feenstra (2008) estimated the pass-through effect of exchange rates to fall by about one-fifth of its
size as a result of the growing share of U.S. trade with China, a major source of offshoring. Additionally,
Ghosh (2008) presents a theoretical model in which the exchange rate pass-through is lower with
production sharing trade compared with the situation of standard trade. The pass-through symmetry of
tariffs and exchange rates was tested by Feenstra (1988) but not under production sharing.
1.2 The Maquiladora program
The Maquiladora program started in the mid-1960s with two plants and a few employees
manufacturing televisions and plastics.3 Bergin, Feenstra and Hanson (2008) suggest that this industry did
not grow substantially until the Mexican government relaxed its restrictions on FDI in the 1980’s.4
Specifically, under NAFTA’s article 303 the waiver or deferral of import duties, commonly
known as “duty-drawback,” was eliminated beginning January 1, 2001. NAFTA duty-drawback
elimination meant that maquiladoras using non-NAFTA originating inputs to produce goods to export to
the United States or Canada would have to pay Mexico’s MFN import duties sometimes as high as 35
percent; while inputs from NAFTA countries would still be duty free. Given the importance of the
Now,
the Maquiladora industry appears to be highly integrated with the U.S. manufacturing sector and most
maquiladoras are U.S. owned but companies based in Japan, South Korea, and Germany are also
important participants. Initially, U.S. firms offshoring to Mexico utilized the U.S. foreign assembly
operations law under TSUS 806.30 and TSUS 807.00 of the U.S. Tariff code (Truett and Truett, 1984)
and later under HS9802 (Feenstra, Hanson, and Swenson, 2000). These provisions allowed for
preferential tariff treatment by which U.S. firms paid duties on foreign valued-added only; while Mexico
allowed for duty-free imports as long as the Maquiladora output was exported back to the United States.
Thus, Maquiladoras received preferential treatment under both countries’ laws but with the
implementation of NAFTA the preferential tariff treatment afforded to Maquiladoras ended.
3 INEGI (2008). Also, according to Truett and Truett (1984) the maquiladora program, initially called the Border Industrialization Program (Programa de Industrialización de la Frontera Norte), was developed in 1965 after the U.S. terminated the Bracero Program in 1964. The Bracero program was a U.S. program that admitted Mexican agricultural workers for temporary employment during World War II. It was designed to bring Mexican workers to satisfy the demand for U.S. agricultural labor. The end of this program left thousands of unemployed in Mexican border cities. The maquiladora program was designed as an employment alternative in the manufacturing sector for those unemployed agricultural workers but it was also designed to promote Mexican exports. 4 OECD (1996). Also, Truett and Truett (1984, 1993, and 2007) note that initially, Maquiladora assembly plants could be 100 percent foreign owned (unlike other firms in Mexico); were required to post a bond to guarantee that their imports would be used in the authorized activities; were restricted to operate where authorized only and not in the interior on Mexico, i.e. where there were ports of entry and custom facilities; and could enjoy local and federal tax exemptions as long the Maquiladoras’ output was not sold in Mexico. Eventually the Mexican government lifted some of these restrictions and allowed Maquiladora firms to locate anywhere in Mexico and sell their output domestically but gradually; up to 20 percent in 1983, up to 50 percent in 1990, and because of NAFTA, 100 percent in 2001.
5
maquiladora regime as a generator of jobs, exports, and foreign exchange in Mexico for more than 35
years, in 2002 the Mexican government established Sectoral Development Programs (PROSECs) to
maintain competitiveness of manufacturing sector in Mexico, whether to export or not (WTO, 2008). The
PROSECs allowed participating companies to import eligible non-NAFTA inputs and capital equipment
at a rates either zero percent or 5 percent (Gantz, 2004). The maquiladoras’ finished products were not
contingent to subsequent exportation and may be sold in Mexico or exported. In addition, maquiladoras’
exports were exempted from the Value Added Tax, and upon complying with certain rules income tax
and asset tax were done away with (Baker & McKenzie, 2006). Thus, in spite of NAFTA’s article 303,
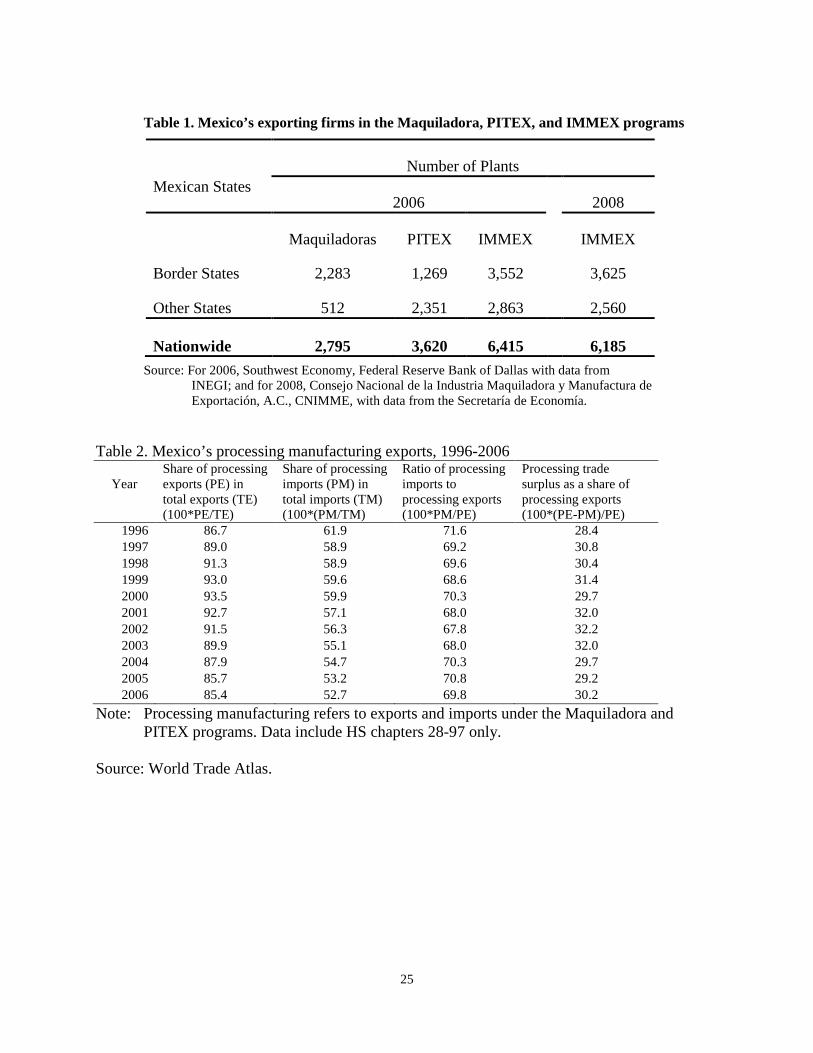
growth in the Maquiladora industry accelerated and by 2006, there were 2,810 Maquiladora plants with
1.2 million employees (figure 4). Also, Bergin, Feenstra and Hanson (2008) point out that the industry’s
real value-added approximately tripled between 1994 and 2005.
1.3 PITEX, IMMEX and other programs
Mexico’s second major export promotion program, Program of Temporary Imports to Produce
Export Goods or PITEX (Programa de Importación Temporal para Producir Artículos de Exportación)
was established in 1990. This program, designed for firms established already in Mexico and producing
for the domestic and export markets, also grants fiscal and administrative benefits, i.e. to import
intermediates and machinery free of duty as long as the final product is exported (USITC, 1998b). PITEX
was the only program notified to the WTO among all Mexican programs.5
On November 23, 2006, the Mexican government merged the Maquiladora and PITEX programs
into a new regime to promote exports named the Manufacturing Industry, Maquiladora and Export
Services Program or IMMEX, which is administered by the Secretariat of Economy. The new program
simplifies procedures and requirements for eligible firms to import inputs, raw materials, parts and
One benefit of PITEX was to
allow foreign investors to register as a national supplier to the automotive industry (USITC, 1998b). Also,
the program included duty-drawback for firms that have a significant share of imported inputs in their
exports in addition to special administrative, fiscal, and financial benefits (OECD, 1996). However, firms
under PITEX were subject to taxes for which Maquiladora firms were exempt (USITC, 1998b). In 2006,
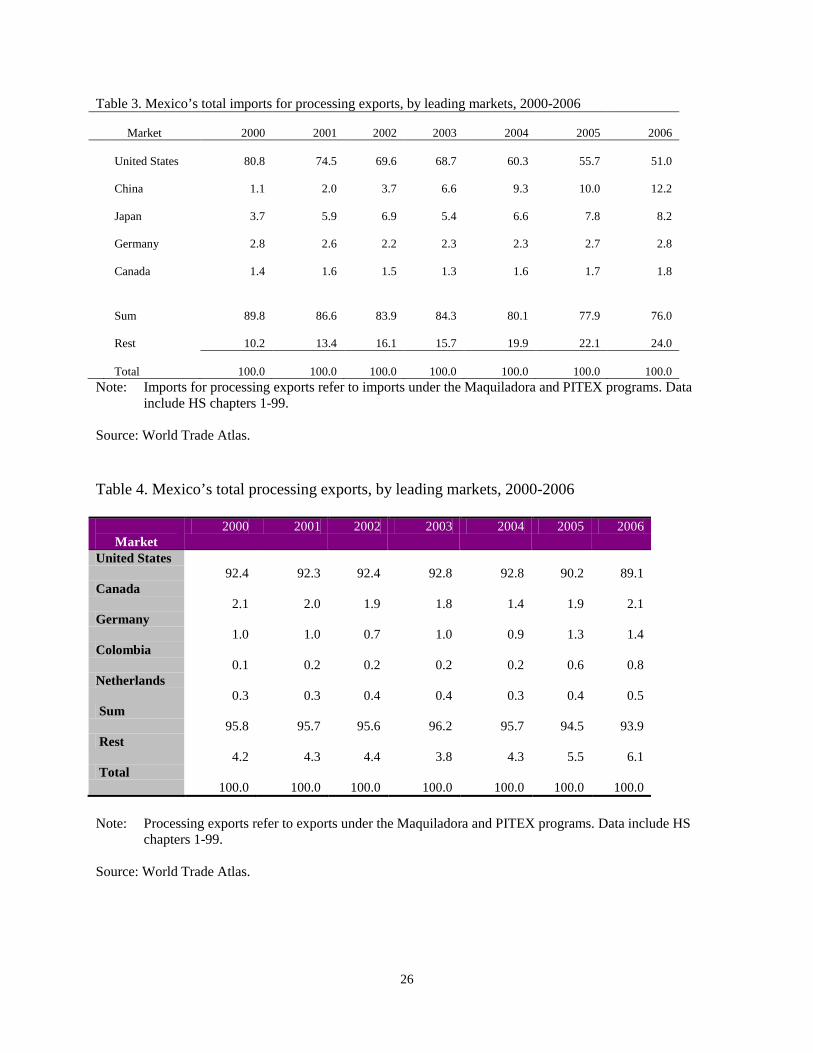
PITEX firms numbered 3,620 and included all motor vehicle assembly plants and most of their parts
suppliers. They tended to locate in the interior of Mexico because a significant portion of their sales was
destined to the domestic market; while Maquiladora firms tended to locate in the border states (Table 1).
PITEX and Maquiladora firms together employed more than 60 percent of Mexico’s total manufacturing
employment in 2006.
5 WTO, Committee on Subsidies and Countervailing Measures, G/SCM/N/3/MEX, 21 November 1996.
6
components, and machinery and equipment free of duty as long as the finished product is exported. Firms
under the IMMEX program also enjoy certain tax exemptions. In 2008, there were 6,185 firms under the
IMMEX program (Table 1).
In addition to the IMMEX program, Mexico has other programs to promote exports through tariff
and tax concessions and administrative facilities. These include the High-Volume Exporting Companies
(ALTEX) program and the Foreign Trade Companies (ECEX) program. At the end of 2006, there were
2,644 firms in the ALTEX program and 340 firms in the ECEX program. Between 2002 and 2006, the
government approved 46,989 refund requests from Mexican exporters under the duty-drawback program
(WTO, 2008).
In summary, Mexico’s processing exports through its Maquiladora, PITEX, and other programs
underscore the importance of uncovering the true domestic and foreign value-added in its exports. We
estimate these value-added measures by applying the methodology developed by Koopman, Wang, and
Wei (2008). In estimating the domestic value-added in China’s exports, Koopman, Wang and Wei (2008)
use an optimizing algorithm to estimate the structure of processing export sectors. However, in this study
for Mexico, that step is not necessary because Mexico has an actual input-output (I-O) table available for
its Maquiladora industry. Here, we will assume that other export-promoting programs, including PITEX,
have the same I-O coefficients as those of the Maquiladora industry. This article contributes to the
literature in that it is the first study for Mexico that measures vertical specialization using a recently
available input-output table for the Maquiladora industry in addition to using trade data from both export
promotion programs, the Maquiladora and PITEX—to date most studies on processing exports for
Mexico use trade data from the Maquiladora industry only. Our results suggest that Mexico’s industrial
strategy has resulted, although modestly and in some industries, in its insertion into the global supply
chains as the domestic value-added share in Mexico’s manufacturing exports increased in recent years.
The estimated measures indicate that on average Mexico’s domestic value-added in its
manufacturing exports is about 34 percent. Accounting for 80 percent of the country’s manufacturing
exports, 41 industries (out of a total 75 3-digit NAICS), have a domestic content of less than 50 percent.
These industries include computer and peripheral equipment, audio and video equipment,
communications equipment, semiconductor and other electronic components, and electrical equipment
among others. The remainder of this paper explains the data and the methodology in Section 2, the
estimation results in Section 3, and the conclusion in Section 4.
7
2 Data and Estimation Method
2.1 Mexico’s input-output table for 2003
The most up to date input-output table for Mexico was the one for 2003 developed by Mexico’s
statistical agency, the Instituto Nacional de Estadística, Geografía e Informática (INEGI), which has 255
4-digit NAICS sectors. A notable feature is a specific I-O table for the Maquiladora industry.6
In 2006, Mexico’s Maquiladora processing exports amounted to $111.9 billion, including, at the
HS-2 digit level, electrical machinery (49.0 percent), machinery (18.4 percent), autos and auto parts (6.2
percent), medical instruments (6.1 percent), furniture and bedding (4.2 percent), knitted and non-knitted
apparel (4.2 percent), and plastics (1.8 percent). These products combined represent about 90.0 percent of
the total. Similarly, in the same year, Mexican firms under the PITEX program exported $62.3 billion
This table
includes national production of goods and services classified under Mexico’s NAICS for 2002, inputs
purchased in the domestic economy, and imports from the rest of the world. The Mexico’s trade data at
the HS 8-digit level during 1996-2006 were obtained from the World Trade Atlas; they are reported for
both the Maquiladora and PITEX firms’ imports and exports by country source and destination.
2.2 Trade statistics
INEGI also reported trade data for the Maquiladora industry but not PITEX. Thus, the analysis of
the processing industry in Mexico based only on Maquiladora data omits important information.
Furthermore, U.S. data on production sharing or U.S. imports under HS chapter 98 are likely to be
underestimated as a result of the implementation of NAFTA and other preferential agreements (Burstein,
Kurz, and Tesar, 2008). The World Trade Atlas trade data are from the Mexican government but are
greater than U.S. data by about 10 to 12 percent (U.S. Department of Commerce, 2000 and 2001).
Exports of manufactured goods under the Maquiladora and PITEX programs accounted for 85.4
percent of total manufactured exports of $195.6 billion in 2006, but in previous years this share was
larger—for instance in 2000, it was 93.5 percent (table 2). Maquiladora and PITEX firms’ imports
accounted for 69.8 percent of their exports in 2006, i.e. out of one dollar of exports from these firms, 69.8
cents consisted of imported parts and components. In 2006, the leading suppliers of these imports were
the United States, 51 percent; China, 12.2 percent; and Japan, 8.2 percent (table 3). Historically, the
United States was the predominate supplier but China, Japan, South Korea, Taiwan, Malaysia, and
Singapore have gained market shares in recent years. The main destination of Mexico’s processing
exports is the United States, to which Mexico’s exports about 90 percent, followed by Canada, with about
2 percent (table 4).
6 We are grateful to INEGI for providing us with the input-output table.
8
including autos and auto parts (48.7 percent), machinery (12.3 percent), electrical machinery (6.4
percent), iron and steel (3.2 percent), beverages (3.1 percent), iron and steel products (3.0 percent),
vegetables (2.9 percent), and medical instruments (2.1 percent); which combined represent about 82.0
percent of the total.
2.3 Estimation methods7
HIY formula is implicitly derived from a single country “non-competitive” input-output model,
which can be specified as follows
Hummels, Ishii, and Yi (2001) (HIY for short in subsequent discussion) proposed the concept of
vertical specialization (VS) or foreign content or foreign value added in a country’s trade as "the imported
input content of exports, or equivalently, foreign value-added embodied in exports." They provided a
formula to compute VS shares based exclusively on a country’s input-output table. A key assumption
needed for the HIY formula to work is that the intensity in the use of imported inputs is the same between
production for exports and production for domestic sales. Recognizing that such an assumption is violated
in the presence of processing exports, Koopman, Wang and Wei (2008) (KWW for short in subsequent
discussions) pointed out that the HIY formula is likely to lead to a significant under-estimation of the
share of foreign value-added in a country’s exports. This is particularly important when policy
preferences for processing trade leads to a significant difference in the intensity of imported intermediate
inputs in the production for processing exports and the production for domestic final sales and normal
exports. They developed a formula that can be used to estimate domestic and foreign content for
economies that engage in a massive amount of tariff or tax-favored processing trade, such as that of China,
Mexico, and Vietnam. They also demonstrated that there is a clear connection between the domestic
content concept and the concept of vertical specialization proposed by HIY.
2.3.1 HIY method: When a country does not engage in processing trade
8
XYXA DD =+
:
(1)
MYXA MM =+ (2)
uAuAuA vMD =++ (3)
where AD = [aDij] is an xn n matrix of direct input coefficients of domestic products; AM = [aM
ij] is an xn n
matrix of direct inputs of imported goods; YD is an 1xn vector of final demands for domestically produced
products, including usage in gross capital formation, private and public final consumption, and gross 7 This section draws from Koopman, Wang and Wei (2008). 8 HIY (2001) do not specify this system explicitly but go straight to the implied Leontief inverse
9
exports; YM is an 1xn vector of final demands for imported products, including usages in gross capital
formation, private and public final consumption; X is a 1xn vector of gross output; M is a 1xn vector of
imports; Av = [avj] is a 1xn vector of each sector j’s ratio of value-added to gross output; ˆ
VA is an xn n
diagonal matrix with avj as its diagonal elements; finally, u is a 1xn unity vector. Subscripts i and j
indicate sectors, and superscripts D and M represent domestically produced and imported products,
respectively.
Equations (1) and (2) define two horizontal balance conditions for domestically produced and
imported products respectively. A typical row k in equation (1) specifies that total domestic production of
product k should be equal to the sum of the sales of product k to all users in the economy (to be used as
intermediate inputs or for final sales to these users), the final sales include domestic consumption and
capital formation, plus exports of product k. A typical row h in equation (2) specifies that the total
imports of product h should be equal to the sum of the sales of product h to all users in the economy,
including intermediate inputs for all sectors, plus final domestic consumption and capital formation.
Equation (3) is a vertical balance conditions, and is also an adding-up constraint for the input-output
coefficients. It implies that the total output (X) in any sector k has to be equal to the sum of direct value-
added in sector k, and the cost of intermediate inputs from all domestically produced and imported
products.
From equation (1) we have
DD YAIX 1)( −−= (4)
1)( −− DAI is the well-known Leontief Inverse, a matrix of coefficients for the total domestic
intermediate product requirement. Define a vector of share of domestic content, or domestic value-added,
in a unit of domestically produced products, DVS = {dvsj}, a 1xn vector, as the additional domestic value-
added generated by one additional unit of final demand of domestic products (∆YD = u’), such that
11 )()(/ −−∧∧
−=−=∆∆= Dv
Dv
Dv AIAAIAYXADVS (5)
Equation (5) indicates that the domestic content for an I-O industry is the corresponding column sum of
the coefficient matrix for total domestic intermediate goods requirement, weighted by the direct value-
added coefficient of each industry.
Under the condition that all exports and domestic sales have the same input-output coefficients,
the share of domestic content in final demand and the share of domestic content in total exports should be
the same. So, equation (5) is also the formula for the share of domestic content in total exports for each
industry.
10
Define a vector for the share of foreign content (or foreign value-added) in final demand for
domestically produced products by FVS = u – DVS. By using equation (3), it can be verified that
FVS = 1)( −−− Dv AIAu 1)( −−= DM AIuA (6)
For each industry, this is the column sum of the coefficient matrix for total intermediate import
requirement. This turns out to be the exact same formula used to compute vertical specialization by HIY
(2001). In other words, the concepts of vertical specialization and that of foreign content are identical.
2.3.2 KWW method: When a country engages in processing trade
The KWW formula is derived from a single country extended input-output model with a separate
account for processing trade, which is specified as follows:
−=
−
−−P
PD
P
PDPDD
EEY
EEX
IAAI
0 (7)9
MYEAEXA MPMPPMD =++− )(
(8)
uAuAuA Dv
MDDD =++ (9)
uAuAuA Pv
MPDP =++ (10)
Where. ][][ pjj
ddijdd
ijDD
exz
aA−
== , ][][ pjj
mdijmd
ijMD
exz
aA−
== , ][][ pjj
djvd
jDv ex
vaA
−==
][][],[][],[][ pj
pjvp
jPvp
j
mpijmp
ijMP
pj
dpijdp
ijDP
ev
aAez
aAez
aA ====== , and the superscript P and D represent
processing exports, and domestic sales and normal exports respectively.
This is a generalization of the model specified in the previous subsection. Equations (7)-(8) are a
generalization of equations (1)-(2), and equations (9)-(10) are a generalization of equation (3), with a
separate account for processing exports. Equations (9) and (10) are also the new adding up constraint for
the I-O coefficients.
The analytical solution of the system is
−
−−=
−−
P
PDDPDD
P
P
EEY
IAAI
EEX
1
0 (11)
The generalized Leontief inverse for this extended model can be computed as follows:
9 See Figure 1 in Koopman, Wang and Wei (2008) for details.
11
−−=
=
−−=
−−−
IAAIAI
BBBB
IAAI
BDPDDDD
PPPD
DPDDDPDD
0)()(
0
111
(12)
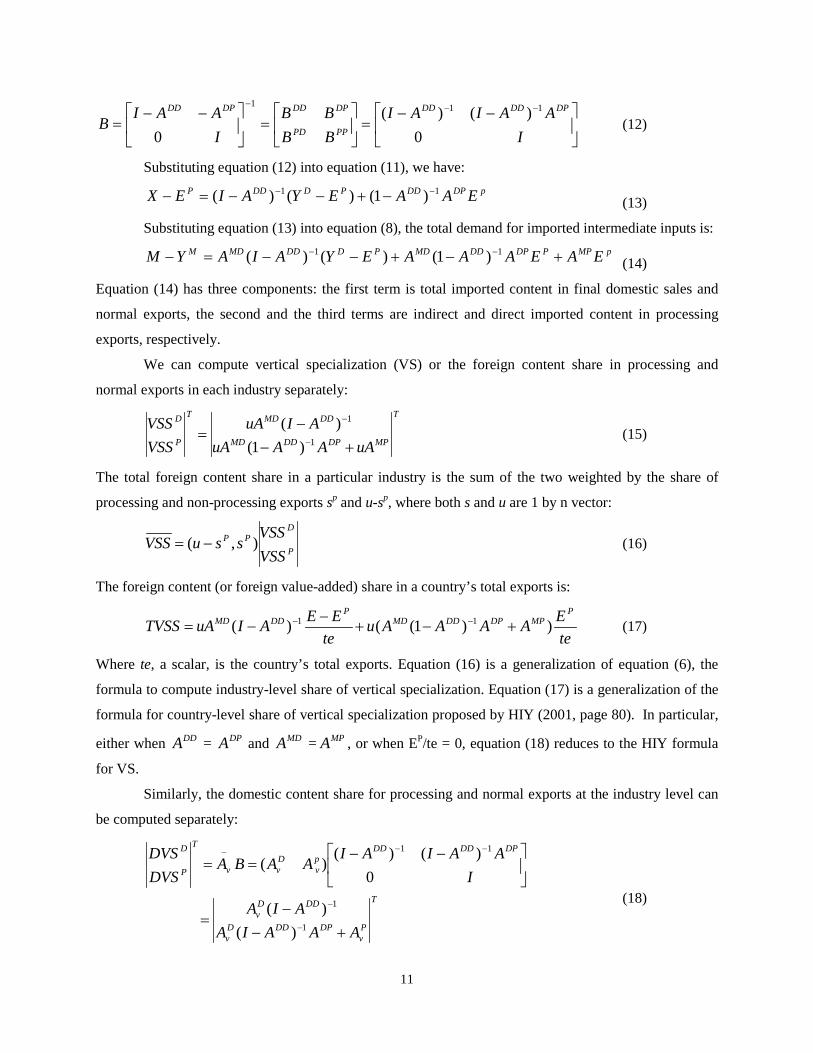
Substituting equation (12) into equation (11), we have:
pDPDDPDDDP EAAEYAIEX 11 )1()()( −− −+−−=− (13)
Substituting equation (13) into equation (8), the total demand for imported intermediate inputs is: pMPPDPDDMDPDDDMDM EAEAAAEYAIAYM +−+−−=− −− 11 )1()()( (14)
Equation (14) has three components: the first term is total imported content in final domestic sales and
normal exports, the second and the third terms are indirect and direct imported content in processing
exports, respectively.
We can compute vertical specialization (VS) or the foreign content share in processing and
normal exports in each industry separately: T
MPDPDDMD
DDMDT
P
D
uAAAuAAIuA
VSSVSS
+−−
=−
−
1
1
)1( )(
(15)
The total foreign content share in a particular industry is the sum of the two weighted by the share of
processing and non-processing exports sp and u-sp, where both s and u are 1 by n vector:
P
DPP
VSSVSS
ssuVSS ),( −= (16)
The foreign content (or foreign value-added) share in a country’s total exports is:
teEAAAAu
teEEAIuATVSS
PMPDPDDMD
PDDMD ))1(()( 11 +−+
−−= −− (17)
Where te, a scalar, is the country’s total exports. Equation (16) is a generalization of equation (6), the
formula to compute industry-level share of vertical specialization. Equation (17) is a generalization of the
formula for country-level share of vertical specialization proposed by HIY (2001, page 80). In particular,
either when DDA = DPA and MDA = MPA , or when EP/te = 0, equation (18) reduces to the HIY formula
for VS.
Similarly, the domestic content share for processing and normal exports at the industry level can
be computed separately:
T
Pv
DPDDDv
DDDv
DPDDDDpv
Dvv
T
P
D
AAAIAAIA
IAAIAI
AABADVSDVS
+−−
=
−−==
−
−
−−−
1
1
11
)()(
0)()(
)(
(18)

12
The total domestic content share in a particular industry is a weighted sum of the two:
P
DPP
DVSDVS
ssuDVS ),( −= (19)
The domestic content share in a country’s total exports is:
teEAAAA
teEEAIATDVS
PP
VDPDDD
V
PDDD
V ))1(()( 11 +−+−
−= −− (20)
Either when DDA = DPA and DvA = P
vA , or when EP/te = 0, equation (19) reduces to the HIY
formula in equation (5). It is ease to verify that for both processing and normal exports, the sum of
domestic and foreign content shares is unity. Equations (17) and (20) also imply that with a one year single country I-O table and detailed
bilateral export data for different years and with different trading partners, one is able to compute the
domestic and foreign value-added shares at the aggregate level for different years and trading partners
separately. However, the variation in such a computation will come only from the variations in export
composition change over time and across different trading partners, since the domestic and foreign
content shares are the same at sector level.
3. Estimation Results
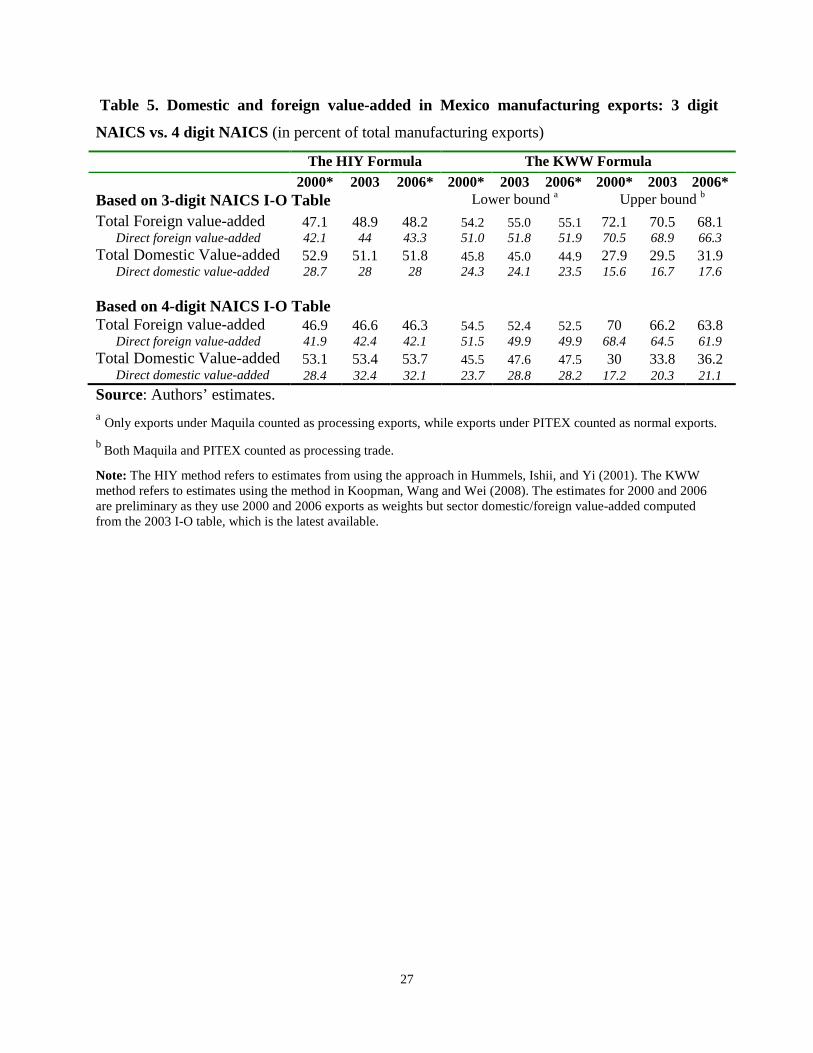
Decomposition results for foreign and domestic value-added shares in 2000, 2003, and 2006 for
Mexico’s manufacturing exports, with the exception of food, aggregated from both the 3-digit and 4-digit
Mexican NAICS input-output table are reported in table 5. Because exports under the PITEX program
may have a different intensity in using imported intermediates from those of exports under the
Maquiladora program, we report two estimates; one in which exports under the PITEX program are
treated as normal exports and the other when they are treated as processing exports. For comparison, the
results from the HIY formula that ignore processing trade are also reported.
The KWW estimates indicate that aggregated from the 3-digit NAICS I-O table, the total
domestic value-added share in Mexico’s manufacturing exports was 45.8% in 2000, 45% in 2003, and
44.9% in 2006 when only exports under the Maquiladora program were counted as processing exports.
When exports under the PITEX program are also counted as processing exports, the share declines to
28%, 30%, and 32% in the same years (table 5). If aggregated from the 4-digit NAICS I-O table, the
values are slightly higher, 30%, 34% and 36% when exports under both Marquiladora and PITEX are
counted as processing exports; and 45.5%, 47.6% and 47.5% when exports under the PITEX program
were treated as normal exports. In general, the direct domestic value-added shares are less than two thirds
of the total domestic value-added shares. However, the indirect foreign value-added share (equals total
13
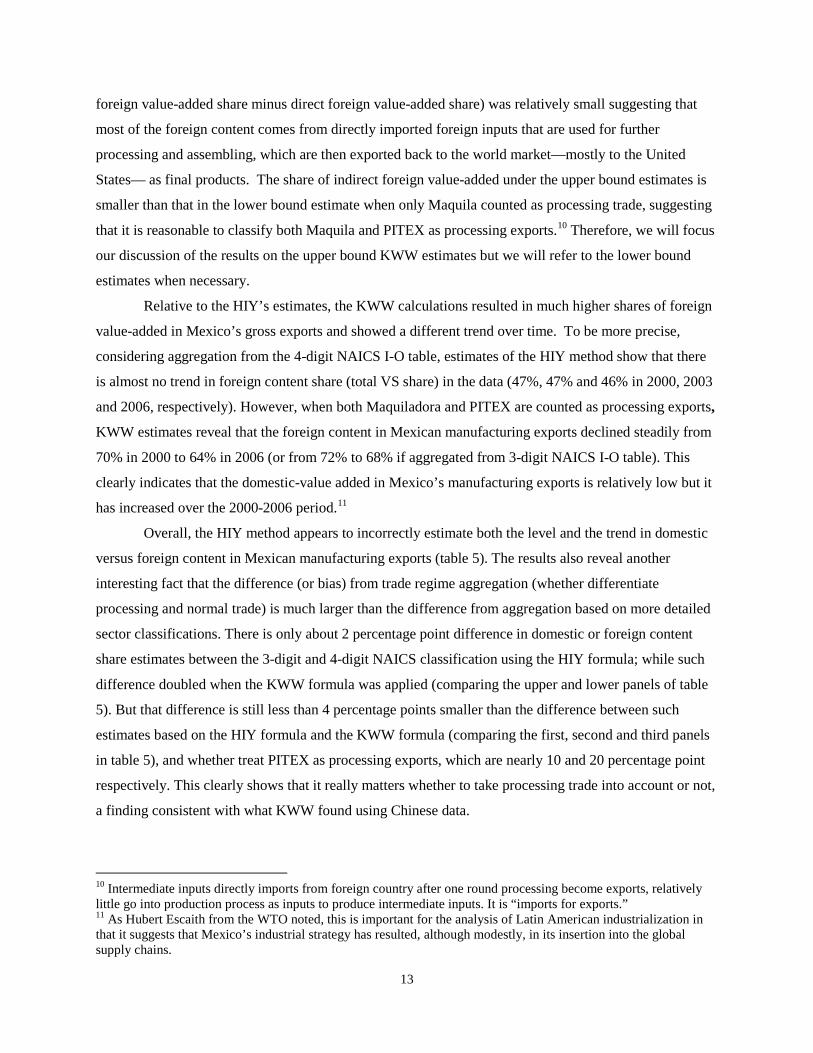
foreign value-added share minus direct foreign value-added share) was relatively small suggesting that
most of the foreign content comes from directly imported foreign inputs that are used for further
processing and assembling, which are then exported back to the world market—mostly to the United
States— as final products. The share of indirect foreign value-added under the upper bound estimates is
smaller than that in the lower bound estimate when only Maquila counted as processing trade, suggesting
that it is reasonable to classify both Maquila and PITEX as processing exports.10
Relative to the HIY’s estimates, the KWW calculations resulted in much higher shares of foreign
value-added in Mexico’s gross exports and showed a different trend over time. To be more precise,
considering aggregation from the 4-digit NAICS I-O table, estimates of the HIY method show that there
is almost no trend in foreign content share (total VS share) in the data (47%, 47% and 46% in 2000, 2003
and 2006, respectively). However, when both Maquiladora and PITEX are counted as processing exports,
KWW estimates reveal that the foreign content in Mexican manufacturing exports declined steadily from
70% in 2000 to 64% in 2006 (or from 72% to 68% if aggregated from 3-digit NAICS I-O table). This
clearly indicates that the domestic-value added in Mexico’s manufacturing exports is relatively low but it
has increased over the 2000-2006 period.
Therefore, we will focus
our discussion of the results on the upper bound KWW estimates but we will refer to the lower bound
estimates when necessary.
11
10 Intermediate inputs directly imports from foreign country after one round processing become exports, relatively little go into production process as inputs to produce intermediate inputs. It is “imports for exports.” 11 As Hubert Escaith from the WTO noted, this is important for the analysis of Latin American industrialization in that it suggests that Mexico’s industrial strategy has resulted, although modestly, in its insertion into the global supply chains.
Overall, the HIY method appears to incorrectly estimate both the level and the trend in domestic
versus foreign content in Mexican manufacturing exports (table 5). The results also reveal another
interesting fact that the difference (or bias) from trade regime aggregation (whether differentiate
processing and normal trade) is much larger than the difference from aggregation based on more detailed
sector classifications. There is only about 2 percentage point difference in domestic or foreign content
share estimates between the 3-digit and 4-digit NAICS classification using the HIY formula; while such
difference doubled when the KWW formula was applied (comparing the upper and lower panels of table
5). But that difference is still less than 4 percentage points smaller than the difference between such
estimates based on the HIY formula and the KWW formula (comparing the first, second and third panels
in table 5), and whether treat PITEX as processing exports, which are nearly 10 and 20 percentage point
respectively. This clearly shows that it really matters whether to take processing trade into account or not,
a finding consistent with what KWW found using Chinese data.
14
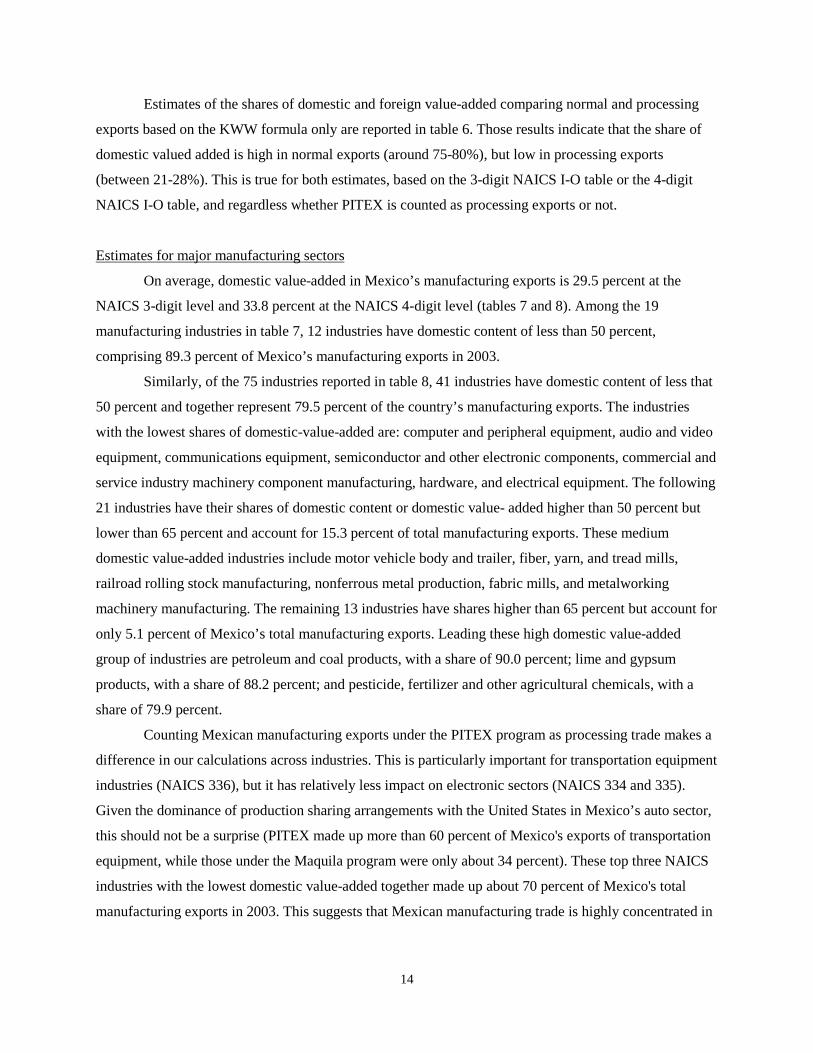
Estimates of the shares of domestic and foreign value-added comparing normal and processing
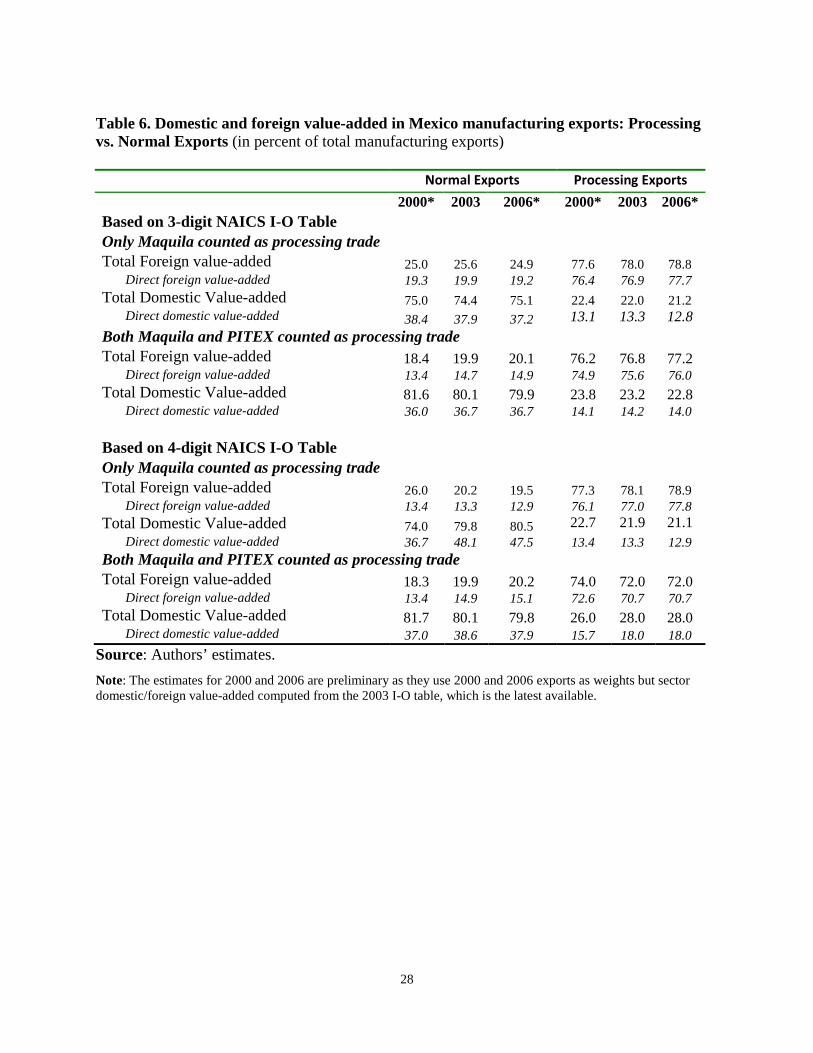
exports based on the KWW formula only are reported in table 6. Those results indicate that the share of
domestic valued added is high in normal exports (around 75-80%), but low in processing exports
(between 21-28%). This is true for both estimates, based on the 3-digit NAICS I-O table or the 4-digit
NAICS I-O table, and regardless whether PITEX is counted as processing exports or not.
Estimates for major manufacturing sectors
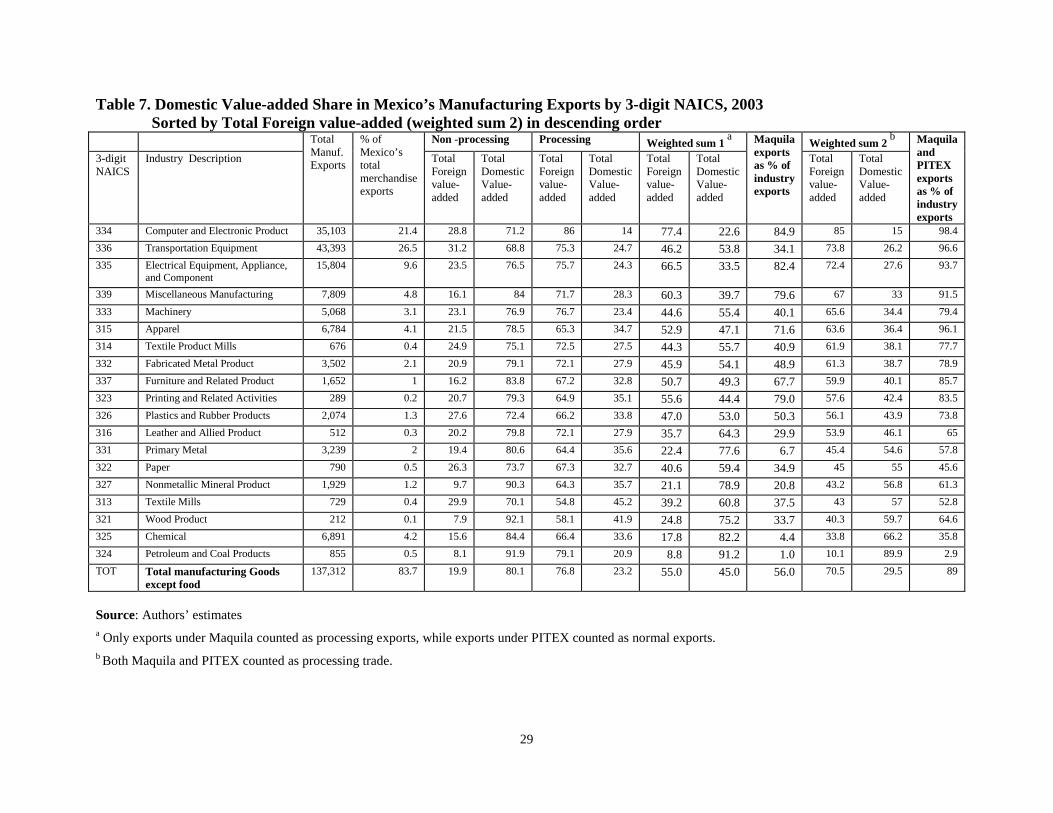
On average, domestic value-added in Mexico’s manufacturing exports is 29.5 percent at the
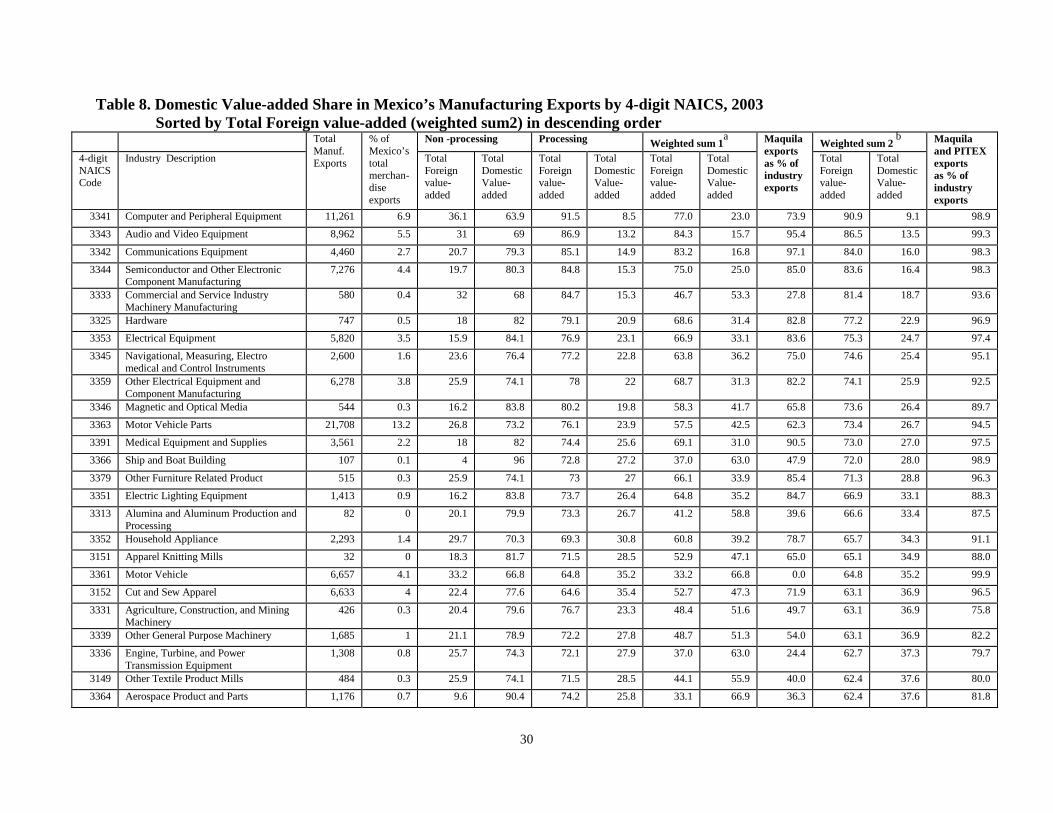
NAICS 3-digit level and 33.8 percent at the NAICS 4-digit level (tables 7 and 8). Among the 19
manufacturing industries in table 7, 12 industries have domestic content of less than 50 percent,
comprising 89.3 percent of Mexico’s manufacturing exports in 2003.
Similarly, of the 75 industries reported in table 8, 41 industries have domestic content of less that
50 percent and together represent 79.5 percent of the country’s manufacturing exports. The industries
with the lowest shares of domestic-value-added are: computer and peripheral equipment, audio and video
equipment, communications equipment, semiconductor and other electronic components, commercial and
service industry machinery component manufacturing, hardware, and electrical equipment. The following
21 industries have their shares of domestic content or domestic value- added higher than 50 percent but
lower than 65 percent and account for 15.3 percent of total manufacturing exports. These medium
domestic value-added industries include motor vehicle body and trailer, fiber, yarn, and tread mills,
railroad rolling stock manufacturing, nonferrous metal production, fabric mills, and metalworking
machinery manufacturing. The remaining 13 industries have shares higher than 65 percent but account for
only 5.1 percent of Mexico’s total manufacturing exports. Leading these high domestic value-added
group of industries are petroleum and coal products, with a share of 90.0 percent; lime and gypsum
products, with a share of 88.2 percent; and pesticide, fertilizer and other agricultural chemicals, with a
share of 79.9 percent.
Counting Mexican manufacturing exports under the PITEX program as processing trade makes a
difference in our calculations across industries. This is particularly important for transportation equipment
industries (NAICS 336), but it has relatively less impact on electronic sectors (NAICS 334 and 335).
Given the dominance of production sharing arrangements with the United States in Mexico’s auto sector,
this should not be a surprise (PITEX made up more than 60 percent of Mexico's exports of transportation
equipment, while those under the Maquila program were only about 34 percent). These top three NAICS
industries with the lowest domestic value-added together made up about 70 percent of Mexico's total
manufacturing exports in 2003. This suggests that Mexican manufacturing trade is highly concentrated in
15
a few industries with an extremely high proportion of processing exports—between 72 and 85 percent and
low domestic content of less than 27 percent (table 7).
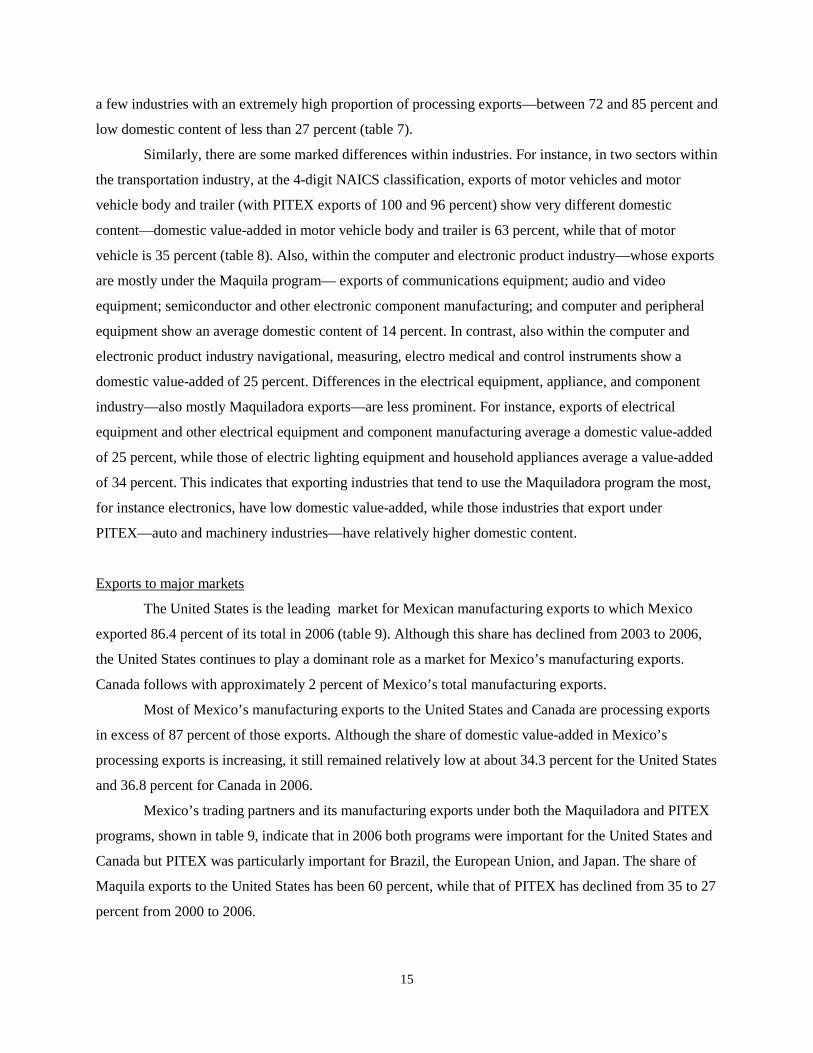
Similarly, there are some marked differences within industries. For instance, in two sectors within
the transportation industry, at the 4-digit NAICS classification, exports of motor vehicles and motor
vehicle body and trailer (with PITEX exports of 100 and 96 percent) show very different domestic
content—domestic value-added in motor vehicle body and trailer is 63 percent, while that of motor
vehicle is 35 percent (table 8). Also, within the computer and electronic product industry—whose exports
are mostly under the Maquila program— exports of communications equipment; audio and video
equipment; semiconductor and other electronic component manufacturing; and computer and peripheral
equipment show an average domestic content of 14 percent. In contrast, also within the computer and
electronic product industry navigational, measuring, electro medical and control instruments show a
domestic value-added of 25 percent. Differences in the electrical equipment, appliance, and component
industry—also mostly Maquiladora exports—are less prominent. For instance, exports of electrical
equipment and other electrical equipment and component manufacturing average a domestic value-added
of 25 percent, while those of electric lighting equipment and household appliances average a value-added
of 34 percent. This indicates that exporting industries that tend to use the Maquiladora program the most,
for instance electronics, have low domestic value-added, while those industries that export under
PITEX—auto and machinery industries—have relatively higher domestic content.
Exports to major markets
The United States is the leading market for Mexican manufacturing exports to which Mexico
exported 86.4 percent of its total in 2006 (table 9). Although this share has declined from 2003 to 2006,
the United States continues to play a dominant role as a market for Mexico’s manufacturing exports.
Canada follows with approximately 2 percent of Mexico’s total manufacturing exports.
Most of Mexico’s manufacturing exports to the United States and Canada are processing exports
in excess of 87 percent of those exports. Although the share of domestic value-added in Mexico’s
processing exports is increasing, it still remained relatively low at about 34.3 percent for the United States
and 36.8 percent for Canada in 2006.
Mexico’s trading partners and its manufacturing exports under both the Maquiladora and PITEX
programs, shown in table 9, indicate that in 2006 both programs were important for the United States and
Canada but PITEX was particularly important for Brazil, the European Union, and Japan. The share of
Maquila exports to the United States has been 60 percent, while that of PITEX has declined from 35 to 27
percent from 2000 to 2006.
16
Comparing Mexico and China
On average, Mexico’s domestic value-added in manufacturing exports is about 34 percent, a
share that is relatively lower than that of China of 51 percent (Koopman, Wang, and Wei, 2008, table 3).
Low domestic content industries in both countries include computers and accessories and
telecommunications equipment. Some higher domestic value-added industries that are similar in both
countries include motor vehicles, cement, and pesticide and fertilizers.
Mexico’s domestic content in processing trade for computers (8.5 percent, table 8) is higher than
that of China (3.9 percent, KWW table 5), suggesting some backward (???) integration in Mexico's
information and communications technology. Mexico has promoted partnerships among domestic firms,
foreign firms, and the university system in the city of Guadalajara, to create the country’s “Silicon
Valley.”12
???Of this latter group, the top five countries to which Mexico exported in 2003 were Aruba,
Guatemala, the Dominican Republic, Colombia and Costa Rica. These countries accounted for almost 50
percent of total exports to the rest of Latin America and the Caribbean group. Most of these exports were
normal exports, comprising two thirds of the total, with a relatively high domestic content of 82.3 percent
(table 9). These Mexican exports to the group consisted primarily of crude oil—almost 50 percent— to
Aruba and Dominican Republic. Crude oil or petroleum has the highest domestic content of 90.0 percent
among Mexico’s manufacturing industries (table 8). Other normal exports to these countries include
In addition, the country has also moved, although modestly, in the global supply chain in the
areas of software development and information technology services. Mexico's domestic value added in
communication equipment (14.9 percent) is half of China's (31.2 percent), while that of electronic
components is about 15 percent for both countries. High domestic value-added processing industries in
Mexico are railroad rolling stock manufacturing (63 percent) and pesticide, fertilizer, and other
agricultural chemicals (82.4 percent), which are twice as high as those of China (33.1 and 31.0 percent,
relatively).
Estimates of domestic value-added in manufacturing exports by country or region of destination
indicate that domestic content in both Mexico and China’s exports to the United States is less that 50
percent—31.9 percent for Mexico (table 9) and 45.6 percent for China (table 7, Koopman, Wang, and
Wei (2008). Moreover, domestic content in exports to Japan, Canada, and Brazil is, on average, lower
than 50 percent for Mexico (43.1 percent) but higher than 60 percent for China (60.5 percent). Notably,
both countries’ domestic value-added in manufacturing exports to the rest of Latin America and the
Caribbean is relatively high—66 percent for Mexico and 76.5 percent for China.
12 We thank Ted H. Moran for making this important remark linked to the formation of backward linkages and supplier networks for multinational investors.
17
shampoos and soap, NAICS code 3256; pharmaceutical and medicine, NAICS code 3254; and converted
paper, NAICS code 3222; all of which have relatively high domestic value-added.
4. Conclusions
Vertical specialization is pervasive in Mexico. In line with global trade, Mexico’s trade has
increased at impressive rates over the last fifteen years and more than 85 percent of its exports are
production sharing operations.
Production sharing in Mexico started in the mid-1960s with the implementation of the
Maquiladora program, an export promotion program that allowed for the importation of inputs free of
duty into Mexico as long as the final product was exported mostly to the United States that under the
HS9802 provisions, firms paid duty only on foreign value-added. Earlier in the 1990s, Mexico developed
and implemented another export promotion program, PITEX, for the domestic firms already established
in the country with similar incentives as the Maquiladora program. These programs grew and in 2006,
firms under both programs employed about 60 percent of manufacturing employment and exported more
than 85 percent of a total of $195.6 billion of manufacturing exports.
In this paper we estimated the extent to which domestic and foreign value-added are present in
Mexico’s manufacturing exports for 2000, 2003, and 2006. The estimation was carried out by applying
the methodology developed by Koopman, Wang, and Wei (2008) but with a slight modification. In their
methodology, the authors estimated the structure of the Chinese processing export sector via an
optimizing algorithm. This step was not necessary for our estimation because Mexico statistical agency
compiled an input-output table specifically for the production sharing sector i.e. for the Maquiladora
industry for 2003. This is the first study of its kind in that for Mexico it provides measures of vertical
specialization using such an input-output table in addition to using trade data from both export promotion
programs, the Maquiladora and PITEX programs.
The estimation results suggest that on average Mexico’s manufacturing exports have a domestic
value-added share of about 34 percent. Industries that have a domestic content of less than 50 percent
account for approximately 80 percent of the country’s manufacturing exports. Low domestic value-added
industries include computer and peripheral equipment, audio and video equipment, communications
equipment, semiconductor and other electronic components, and electrical equipment. Industries that have
domestic content shares higher than 65 percent account for only 5.1 percent of Mexico’s total
manufacturing exports. Some leading industries in this higher domestic value-added group are petroleum
and coal products, with a share of 90.0 percent; lime and gypsum products, with a share of 88.2 percent;
and pesticide, fertilizer and other agricultural chemicals, with a share of 79.9 percent.
18
Counting Mexican manufacturing exports under the PITEX program as processing trade makes a
difference in our calculations across industries. In particular, it made a significant difference in the
transportation equipment industries, whose exports under PITEX made up more than 60 percent of
Mexico's exports of that industry, while those under the Maquila program were only about 34 percent.
This reflects the dominance of production sharing arrangements with the United States in Mexico’s auto
sector. Furthermore, the top three NAICS industries with the lowest domestic value-added (transportation
equipment and electronic sectors), together made up about 70 percent of Mexico's total manufacturing
exports in 2003. This suggests that Mexican manufacturing trade is highly concentrated in a few
industries with an extremely high proportion of processing exports—between 72 and 85 percent and low
domestic content of less than 27 percent (table 7). Our results also indicate that exporting industries that
tend to use the Maquiladora program the most, for instance electronics, have low domestic value-added,
while those industries that export under PITEX—auto and machinery industries—have a relatively higher
domestic content.
Most of Mexico’s manufacturing exports to the United States and Canada consist of processing
exports and the United States is by far the single-country largest export market to which Mexico exported
86.4 percent of its total in 2006. Canada’s share of Mexico’s total manufacturing exports was only
approximately 2 percent in the same year. Mexico’s manufacturing exports under both the Maquiladora
and PITEX programs are important for the United States and Canada but PITEX was particularly
important for Brazil, the European Union, and Japan. The share of Maquila exports to the United States
has been 60 percent, while that of PITEX has declined from 35 to 27 percent from 2000 to 2006.
Although relatively low, the domestic value-added in Mexico’s exports has increased in recent
years suggesting that Mexico’s industrial strategy has resulted, although modestly and in some industries
only, in its insertion into the global supply chains.
19
Bibliography
Baker & McKenzie Abogados, S.C., (2006). “Doing Business in Mexico.” http://www.bakernet.com/NR/rdonlyres/219EF148-9DD9-49C8-8513-13CB1B6829C6/0/dbi_mexico2006.pdf Buie, Amanda, (2008). “Mexico’s Maquiladoras—Climbing the Ladder of Success,” ProLogis Research Bulletin, Spring, Denver, Colorado. http://www.prologisresearch.com/library/default.asp (accessed June 12, 2009) http://www.mfiintl.com/reports/Mexico_Maquiladoras_Report.pdf Burstein, A., C. Kurz, and L. Tesar, (2008). “Trade, Production Sharing, and the International Transmission of Business Cycles,” Journal of Monetary Economics, 55, 775-795. Bergin R. Paul, and Robert C. Feenstra (2008). “Pass-Through of Exchange Rates and Competition Between Floaters and Fixers,” Revised version of the NBER Working Paper No. 13620, Journal of Money Credit and Banking, forthcoming http://www.econ.ucdavis.edu/faculty/bergin/research/index.html (accessed May 29, 2009). Bergin R. Paul, Robert C. Feenstra, and Gordon H. Hanson (2008). “Offshoring and Volatility: Evidence from Mexico’s Maquiladora Industry,” University of California, Davis, Forthcoming in the American Economic Review http://www.econ.ucdavis.edu/faculty/bergin/research/BFH1web.pdf (accessed May 29, 2009) Bergin R. Paul, Robert C. Feenstra, and Gordon H. Hanson (2009). “Volatility Due to Offshoring: Theory and Evidence,” University of California, Davis, Working Paper, January http://www.econ.ucdavis.edu/faculty/bergin/research/Offshoring_and_Volatility_theory_web.pdf (accessed May 29, 2009). Campa Jose Manuel and Linda S. Goldberg (2006). “Pass Through of Exchange Rates to Consumption Prices: What Has Changes and Why?” National Bureau of Economic Research, Working Paper 12547, Cambridge, MA, September. Chen, Hogan, Matthew Kondratowicz, and Kei-Mu Yi, (2005). “Vertical specialization and three facts about U.S. international trade, North American Journal of Economics and Finance, 16, 35-59. Chiquiar, Daniel (2008). “Globalization, regional wage differentials and the Stolper-Samuelson Theorem: Evidence from Mexico,” Journal of International Economics, 74, 70-93. Chiquiar, Daniel and Manuel Ramos-Francia, (2005). “Trade and Business-Cycle Synchronization: Evidence from Mexican and U.S. Manufacturing Industries,” North American Journal of Economics and Finance, 16, 187-216. Durand Alcantara, Gerardo (2007). “The Maquiladora Industry of Mexico: An Approach for the compilation of statistics on goods for processing,” Expert Group on International Merchandise Trade Statistics, United Nation, Statistics Division, New York, December 3-6. Ebenstein, Avraham, Ann Harrison, Margaret McMillan and Shannon Phillips (2009). “Estimating the Impact of Trade and Offshoring on American Workers using the Current Population Surveys,” National Bureau of Economic Research, Working Paper 15107, Cambridge, MA, June.
20
Feenstra, Robert C. (1989). “Symmetric Pass-through of Tariffs and Exchange Rates under Imperfect Competition: An Empirical Test” Journal of International Economics,27, 24-45. Feenstra, Robert C. (1998). “Integration of Trade and Disintegration in the Global Economy,” Journal of Economic Perspectives,12, 31-50. Feenstra, Robert C. (2008). “Offshoring in the Global Economy,” The Ohlin Lectures, presented at the Stockholm School of Economics, September 17-18. http://www.econ.ucdavis.edu/faculty/fzfeens/papers.html (accessed on June 1, 2009) http://www.econ.ucdavis.edu/faculty/fzfeens/pdf/Feenstra_Ohlin_Lecture_2008.pdf Feenstra, Robert C. and Gordon H. Hanson, (1997). “Foreign Direct Investment and Relative Wages: Evidence from Mexico’s Maquiladoras,” Journal of International Economics, 42, 371-394. Feenstra, Robert C, and Gordon H. Hanson, (1999). “The impact of Outsourcing and High-Technology Capital on Wages: Estimates for the United States, 1979-1990,” The Quarterly Journal of Economics, 114, 907-940. Feenstra, C. Robert, and Gordon H. Hanson, (2004). “Global Production Sharing and Rising Inequality: A Survey of Trade and Wages,” in Handbook of International Trade, ed. By E.K. Choi and J. Harringan, vol.1. Blackwell Publishing. Feenstra, Robert C., Gordon H. Hanson, and Deborah Swenson,(2000). “Offshore Assembly from the United States: Production Characteristics of the 9802 Program,” in The Impact of International Trade on Wages, ed. Robert C. Feenstra, ed., 85-128. Chicago: University of Chicago Press and the National Bureau of Economic Research. Gantz, A. David, (2004). “NAFTA, Article 303, PROCEC and the New Maquiladora Regime in Mexico,” in The Auto Pact: Investment, Labour and the WTO, ed. By Maureen Irish, Kluwer Law International, NY, 2004. Ghosh, Amit (2008). “Implications of Production Sharing on Exchange Rate Pass-through,” International Journal of Finance & Economics, Published online in Wiley InterScience, www.interscience.wiley.com Hanson, Gordon H. (2007). “Trade Liberalization and Wage Inequality in Mexico,” Industrial and Labor Relations Review, 52(2): 271-288. Hanson, Gordon H. (2007). “Globalization, Labor Income, and Poverty in Mexico,” in Globalization and Poverty, ed. Ann Harrison, 417-456., Chicago: University of Chicago Press and the National Bureau of Economic Research. Hanson, Gordon H., R. Mataloni, and M. Slaughter, (2005). “Vertical Production Networks in Multinational Firms,” Review of Economics and Statistics 87(4): 664-678. Hanson, Gordon and Harrison, Anne, (1999). “Trade, Technology, and Wage Inequality,” Industrial and Labor Relations Review 52(2) January, 271-88. Herrera-Hernandez, Jorge, (2004). “Business Cycles in Mexico and the United States: Do They Share Common Movements?” Journal of Applied Economics Vol. VII, November, (2): 303-323.
21
Hummels, David, Ishii, Jun, and Yi, Kei-Mu, (2001). “The Nature and Growth of Vertical Specialization in World Trade,” Journal of International Economics, June, (54):75-96. INEGI, (2007). “Industria Maquiladora de Exportación,” Estadísticas Económicas INEGI, Instituto Nacional de Estadística, Geografía e Informática, Febrero, Aguascalientes, Ags., México. Koopman, B. Robert, Zhi Wang, and Shang-Jin Wei (2008). “How Much of Chinese Exports is Really Made in China? Assessing Domestic Value-Added When Processing Trade is Pervasive,” National Bureau of Economic Research, Working Paper 14109, Cambridge, MA, June. Kose, M. Ayhan and Kei-Mu Yi, (2001). “International Trade and Business Cycles: Is Vertical Specialization the Missing Link?” American Economic Review 91(2): 371-375. Kose, M. Ayhan and Kei-Mu Yi. 2006. “Can the Standard Real Business Cycle Model Explain the Relation between Trade and Comovement?” Journal of International Economics 68(2): 267-295. Krugman, Paul (2008). “Trade and Wages, Reconsidered,” Brookings Papers on Economic Activity, Spring, conference draft, Washington, DC. http://www.brookings.edu/economics/bpea/~/media/Files/Programs/ES/BPEA/2008_bpea_papers/2008_bpea_krugman.pdf (accessed March 23, 2009) López J. José, “Production Sharing and Real Business Cycles in a Small Open Economy,” Federal Reserve Bank of Dallas, Globalization and Monetary Policy Institute, Working Paper No. 5, December, 2007. http://www.dallasfed.org/institute/wpapers/2007/0005.pdf (accessed May 28, 2009) Ng, C.Y. Eric, (2007). Vertical Specialization, Intra-Industry Trade, and Business Cycle Comovement, Working Paper, University of Western Ontario, October. Nordas K. Hildegunn, “International Production Sharing: A Case for a Coherent Policy Framework,” WTO Discussion Papers No. 11, WTP Geneva, Switzerland, 2005. OECD, Organization for Economic Co-operation and Development (1996). Trade Liberalisation Policies in Mexico, Paris, France. ProMexico (2009). “Export Promotion Programs,” ProMexico: Trade and Investment, http://www.promexico.gob.mx/wb/Promexico/export_promotion_programs (accessed June 7, 2009). Robertson, Raymond (2000) “Relative Prices and Wage Inequality: Evidence from Mexico,” mimeo, Macalester College. Truett, B. Dale and Lila J. Truett (1984). “The Maquiladoras: Prospects for Mexico,” Journal of Economic Development, December, 9 (2), 45-66. Truett, B. Dale and Lila J. Truett (1993). “The Maquiladoras Response to U.S. and Asian Relative Wage Rate Changes,” Contemporary Economic Policy, January, XI, 18-28. Truett, B. Dale and Lila J. Truett (2007). “NAFTA and the Maquiladoras: Boon or Bane,” Contemporary Economic Policy, July, 25(3), 374-386.
22
Taylor Hansen, Lawrence Douglas (2003). Los origenes de la industria maquiladora en Mexico. (The Origins of the Maquila Industry in Mexico. With English summary.), Comercio Exterior, November, v. 53, iss. 11, pp. 1045-56. http://revistas.bancomext.gob.mx/rce/en/numeros_ant.jsp?year=2003 U.S. Department of Commerce (2000). “Merchandise Trade Reconciliation United States-Mexico-Canada 1996-1997. Bureau of the Census, Economics and Statistics Administration. http://www.census.gov/foreign-trade/aip/recon9697.pdf (accessed June 17, 2009) U.S. Department of Commerce (2001). “Merchandise Trade Reconciliation United States-Mexico-Canada 199-1999. Bureau of the Census, Economics and Statistics Administration. http://www.census.gov/foreign-trade/aip/recon9899.pdf (accessed June 17, 2009) U. S. International Trade Commission (1998a). “The Use and Economic Impact of TSUS Items 806.30 and 807.00,” USITC Publication 2053, January, Washington, DC. U. S. International Trade Commission (1998b) “Production Sharing: Use of U.S. Components and Materials in Foreign Assembly Operations, 1994-1997,” USITC Publication 3146, December, Washington, DC. U. S. International Trade Commission (1994). “Production Sharing: U.S. Imports under Harmonized Tariff Schedule Provisions 9802.00.60 and 9802.00.80, 1989-1992,” USITC Publication 2729, February, Washington, DC. Verhoogen, Eric, A. (2008). “Trade, Quality Upgrading, and Wage Inequality in the Mexican Manufacturing Sector,” Quarterly Journal of Economics, May, 489-530. WTO, World Trade Organization (2008). “Trade Policy Review: Mexico,” ET/TPR/S/195/Rev.1, May 2 http://www.wto.org/english/tratop_e/tpr_e/tpr_e.htm (accessed June 16, 2009). Yi, Kei-Mu (2003). “Can Vertical Specialization Explain the Growth of World Trade?” Journal of Political Economy, 111, No.1, February, 52-102. Yi, Kei-Mu (2009). “The collapse of global trade: the role of vertical specialization” in The collapse of global trade, murky protectionism, and the crisis: Recommendations for the G20, ed. Richard Baldwin and Simon Evenett, 45-48, A VoxEU. Org publication, Centre for Economic Policy Research, London, UK, 2009.
23
Figure 2. U.S. goods imports from the world, 1983-2008
0.0%
20.0%
40.0%
60.0%
80.0%
100.0%
1983 1987 1991 1995 1999 2003 2007
Source: U.S. Department of Commerce.
Percent
Rest of World
NAFTA Mexico
NAFTA Canada
Rest of Asia
Japan
China
EU 25
Post-NAFTAPre-NAFTA
Figure 1. U.S.-Mexico goods trade, 1983-2008
0.0
50.0
100.0
150.0
200.0
250.0
300.0
350.0
400.0
1983 1985 1987 1989 1991 1993 1995 1997 1999 2001 2003 2005 2007
Source: U.S. Department of Commerce.
Billion dollars
U.S. importsfrom Mexico
U.S. exportsto Mexico
Post-NAFTAPre-NAFTA
24
Figure 4. Maquiladora: number of plants and employment, 1965-2006
0
500
1,000
1,500
2,000
2,500
3,000
3,500
4,000
1965 1968 1971 1974 1977 1980 1983 1986 1989 1992 1995 1998 2001 2004
Number of Plants
0
200
400
600
800
1,000
1,200
1,400Employment (thousands)
Number of Plants Employment
Post-NAFTA
Pre-NAFTA
Source: For 1965, USITC (1990), for 1967-1980, Truett and Truett (1984), and for 1981-2006, INEGI (2007).
Figure 3. U.S. and Mexico Industrial Production, 2000- 2008
-7%
-6%
-5%
-4%
-3%
-2%
-1%
0%
1%
2%
3%
4%
5%
6%
7%
8%
Jan-2000
Jul-2000
Jan-2001
Jul-2001
Jan-2002
Jul-2002
Jan-2003
Jul-2003
Jan-2004
Jul-2004
Jan-2005
Jul-2005
Jan-2006
Jul-2006
Jan-2007
Jul-2007
Jan-2008
U.S Mexico
Percent, montly changes, year to year
25
Table 1. Mexico’s exporting firms in the Maquiladora, PITEX, and IMMEX programs
Number of Plants Mexican States
2006 2008
Maquiladoras PITEX IMMEX IMMEX
Border States 2,283 1,269 3,552 3,625
Other States 512 2,351 2,863 2,560
Nationwide 2,795 3,620 6,415 6,185 Source: For 2006, Southwest Economy, Federal Reserve Bank of Dallas with data from
INEGI; and for 2008, Consejo Nacional de la Industria Maquiladora y Manufactura de Exportación, A.C., CNIMME, with data from the Secretaría de Economía.
Table 2. Mexico’s processing manufacturing exports, 1996-2006
Year
Share of processing exports (PE) in total exports (TE) (100*PE/TE)
Share of processing imports (PM) in total imports (TM) (100*(PM/TM)
Ratio of processing imports to processing exports (100*PM/PE)
Processing trade surplus as a share of processing exports (100*(PE-PM)/PE)
1996 86.7 61.9 71.6 28.4 1997 89.0 58.9 69.2 30.8 1998 91.3 58.9 69.6 30.4 1999 93.0 59.6 68.6 31.4 2000 93.5 59.9 70.3 29.7 2001 92.7 57.1 68.0 32.0 2002 91.5 56.3 67.8 32.2 2003 89.9 55.1 68.0 32.0 2004 87.9 54.7 70.3 29.7 2005 85.7 53.2 70.8 29.2 2006 85.4 52.7 69.8 30.2
Note: Processing manufacturing refers to exports and imports under the Maquiladora and PITEX programs. Data include HS chapters 28-97 only.
Source: World Trade Atlas.
26
Table 3. Mexico’s total imports for processing exports, by leading markets, 2000-2006
Market 2000 2001 2002 2003 2004 2005 2006
United States
80.8
74.5
69.6
68.7
60.3
55.7 51.0
China
1.1
2.0
3.7
6.6
9.3
10.0
12.2
Japan
3.7
5.9
6.9
5.4
6.6
7.8
8.2
Germany
2.8
2.6
2.2
2.3
2.3
2.7
2.8
Canada
1.4
1.6
1.5
1.3
1.6
1.7
1.8
Sum
89.8
86.6
83.9
84.3
80.1
77.9
76.0
Rest
10.2
13.4
16.1
15.7
19.9
22.1
24.0
Total
100.0
100.0
100.0
100.0
100.0
100.0
100.0 Note: Imports for processing exports refer to imports under the Maquiladora and PITEX programs. Data
include HS chapters 1-99. Source: World Trade Atlas. Table 4. Mexico’s total processing exports, by leading markets, 2000-2006
Market 2000 2001 2002 2003 2004 2005 2006
United States 92.4
92.3
92.4
92.8
92.8
90.2
89.1
Canada 2.1
2.0
1.9
1.8
1.4
1.9
2.1
Germany 1.0
1.0
0.7
1.0
0.9
1.3
1.4
Colombia 0.1
0.2
0.2
0.2
0.2
0.6
0.8
Netherlands 0.3
0.3
0.4
0.4
0.3
0.4
0.5
Sum 95.8
95.7
95.6
96.2
95.7
94.5
93.9
Rest 4.2
4.3
4.4
3.8
4.3
5.5
6.1
Total 100.0
100.0
100.0
100.0
100.0
100.0
100.0
Note: Processing exports refer to exports under the Maquiladora and PITEX programs. Data include HS
chapters 1-99. Source: World Trade Atlas.
27
Table 5. Domestic and foreign value-added in Mexico manufacturing exports: 3 digit
NAICS vs. 4 digit NAICS (in percent of total manufacturing exports)
The HIY Formula The KWW Formula 2000* 2003 2006* 2000* 2003 2006* 2000* 2003 2006* Based on 3-digit NAICS I-O Table Lower bound a Upper bound b Total Foreign value-added 47.1 48.9 48.2 54.2 55.0 55.1 72.1 70.5 68.1 Direct foreign value-added 42.1 44 43.3 51.0 51.8 51.9 70.5 68.9 66.3 Total Domestic Value-added 52.9 51.1 51.8 45.8 45.0 44.9 27.9 29.5 31.9 Direct domestic value-added 28.7 28 28 24.3 24.1 23.5 15.6 16.7 17.6 Based on 4-digit NAICS I-O Table Total Foreign value-added 46.9 46.6 46.3 54.5 52.4 52.5 70 66.2 63.8 Direct foreign value-added 41.9 42.4 42.1 51.5 49.9 49.9 68.4 64.5 61.9 Total Domestic Value-added 53.1 53.4 53.7 45.5 47.6 47.5 30 33.8 36.2 Direct domestic value-added 28.4 32.4 32.1 23.7 28.8 28.2 17.2 20.3 21.1 Source: Authors’ estimates. a Only exports under Maquila counted as processing exports, while exports under PITEX counted as normal exports. b Both Maquila and PITEX counted as processing trade. Note: The HIY method refers to estimates from using the approach in Hummels, Ishii, and Yi (2001). The KWW method refers to estimates using the method in Koopman, Wang and Wei (2008). The estimates for 2000 and 2006 are preliminary as they use 2000 and 2006 exports as weights but sector domestic/foreign value-added computed from the 2003 I-O table, which is the latest available.
28
Table 6. Domestic and foreign value-added in Mexico manufacturing exports: Processing vs. Normal Exports (in percent of total manufacturing exports) Normal Exports Processing Exports
2000* 2003 2006* 2000* 2003 2006* Based on 3-digit NAICS I-O Table Only Maquila counted as processing trade Total Foreign value-added 25.0 25.6 24.9 77.6 78.0 78.8 Direct foreign value-added 19.3 19.9 19.2 76.4 76.9 77.7 Total Domestic Value-added 75.0 74.4 75.1 22.4 22.0 21.2 Direct domestic value-added 38.4 37.9 37.2 13.1 13.3 12.8 Both Maquila and PITEX counted as processing trade Total Foreign value-added 18.4 19.9 20.1 76.2 76.8 77.2 Direct foreign value-added 13.4 14.7 14.9 74.9 75.6 76.0 Total Domestic Value-added 81.6 80.1 79.9 23.8 23.2 22.8 Direct domestic value-added 36.0 36.7 36.7 14.1 14.2 14.0 Based on 4-digit NAICS I-O Table Only Maquila counted as processing trade Total Foreign value-added 26.0 20.2 19.5 77.3 78.1 78.9 Direct foreign value-added 13.4 13.3 12.9 76.1 77.0 77.8 Total Domestic Value-added 74.0 79.8 80.5 22.7 21.9 21.1 Direct domestic value-added 36.7 48.1 47.5 13.4 13.3 12.9 Both Maquila and PITEX counted as processing trade Total Foreign value-added 18.3 19.9 20.2 74.0 72.0 72.0 Direct foreign value-added 13.4 14.9 15.1 72.6 70.7 70.7 Total Domestic Value-added 81.7 80.1 79.8 26.0 28.0 28.0 Direct domestic value-added 37.0 38.6 37.9 15.7 18.0 18.0
Source: Authors’ estimates. Note: The estimates for 2000 and 2006 are preliminary as they use 2000 and 2006 exports as weights but sector domestic/foreign value-added computed from the 2003 I-O table, which is the latest available.
29
Table 7. Domestic Value-added Share in Mexico’s Manufacturing Exports by 3-digit NAICS, 2003 Sorted by Total Foreign value-added (weighted sum 2) in descending order Total
Manuf. Exports
% of Mexico’s total merchandise exports
Non -processing Processing Weighted sum 1 a Maquila exports as % of industry exports
Weighted sum 2 b Maquila and PITEX exports as % of industry exports
3-digit NAICS
Industry Description Total Foreign value-added
Total Domestic Value-added
Total Foreign value-added
Total Domestic Value-added
Total Foreign value-added
Total Domestic Value-added
Total Foreign value-added
Total Domestic Value-added
334 Computer and Electronic Product 35,103 21.4 28.8 71.2 86 14 77.4 22.6 84.9 85 15 98.4 336 Transportation Equipment 43,393 26.5 31.2 68.8 75.3 24.7 46.2 53.8 34.1 73.8 26.2 96.6 335 Electrical Equipment, Appliance,
and Component 15,804 9.6 23.5 76.5 75.7 24.3 66.5 33.5 82.4 72.4 27.6 93.7
339 Miscellaneous Manufacturing 7,809 4.8 16.1 84 71.7 28.3 60.3 39.7 79.6 67 33 91.5 333 Machinery 5,068 3.1 23.1 76.9 76.7 23.4 44.6 55.4 40.1 65.6 34.4 79.4 315 Apparel 6,784 4.1 21.5 78.5 65.3 34.7 52.9 47.1 71.6 63.6 36.4 96.1 314 Textile Product Mills 676 0.4 24.9 75.1 72.5 27.5 44.3 55.7 40.9 61.9 38.1 77.7 332 Fabricated Metal Product 3,502 2.1 20.9 79.1 72.1 27.9 45.9 54.1 48.9 61.3 38.7 78.9 337 Furniture and Related Product 1,652 1 16.2 83.8 67.2 32.8 50.7 49.3 67.7 59.9 40.1 85.7 323 Printing and Related Activities 289 0.2 20.7 79.3 64.9 35.1 55.6 44.4 79.0 57.6 42.4 83.5 326 Plastics and Rubber Products 2,074 1.3 27.6 72.4 66.2 33.8 47.0 53.0 50.3 56.1 43.9 73.8 316 Leather and Allied Product 512 0.3 20.2 79.8 72.1 27.9 35.7 64.3 29.9 53.9 46.1 65 331 Primary Metal 3,239 2 19.4 80.6 64.4 35.6 22.4 77.6 6.7 45.4 54.6 57.8 322 Paper 790 0.5 26.3 73.7 67.3 32.7 40.6 59.4 34.9 45 55 45.6 327 Nonmetallic Mineral Product 1,929 1.2 9.7 90.3 64.3 35.7 21.1 78.9 20.8 43.2 56.8 61.3 313 Textile Mills 729 0.4 29.9 70.1 54.8 45.2 39.2 60.8 37.5 43 57 52.8 321 Wood Product 212 0.1 7.9 92.1 58.1 41.9 24.8 75.2 33.7 40.3 59.7 64.6 325 Chemical 6,891 4.2 15.6 84.4 66.4 33.6 17.8 82.2 4.4 33.8 66.2 35.8 324 Petroleum and Coal Products 855 0.5 8.1 91.9 79.1 20.9 8.8 91.2 1.0 10.1 89.9 2.9 TOT Total manufacturing Goods
except food 137,312 83.7 19.9 80.1 76.8 23.2 55.0 45.0 56.0 70.5 29.5 89
Source: Authors’ estimates a Only exports under Maquila counted as processing exports, while exports under PITEX counted as normal exports. b Both Maquila and PITEX counted as processing trade.
30
Table 8. Domestic Value-added Share in Mexico’s Manufacturing Exports by 4-digit NAICS, 2003 Sorted by Total Foreign value-added (weighted sum2) in descending order
Total Manuf. Exports
% of Mexico’s total merchan-dise exports
Non -processing Processing Weighted sum 1a Maquila
exports as % of industry exports
Weighted sum 2 b Maquila
and PITEX exports as % of industry exports
4-digit NAICS Code
Industry Description Total Foreign value-added
Total Domestic Value-added
Total Foreign value-added
Total Domestic Value-added
Total Foreign value-added
Total Domestic Value-added
Total Foreign value-added
Total Domestic Value-added
3341 Computer and Peripheral Equipment 11,261 6.9 36.1 63.9 91.5 8.5 77.0 23.0 73.9 90.9 9.1 98.9
3343 Audio and Video Equipment 8,962 5.5 31 69 86.9 13.2 84.3 15.7 95.4 86.5 13.5 99.3
3342 Communications Equipment 4,460 2.7 20.7 79.3 85.1 14.9 83.2 16.8 97.1 84.0 16.0 98.3
3344 Semiconductor and Other Electronic Component Manufacturing
7,276 4.4 19.7 80.3 84.8 15.3 75.0 25.0 85.0 83.6 16.4 98.3
3333 Commercial and Service Industry Machinery Manufacturing
580 0.4 32 68 84.7 15.3 46.7 53.3 27.8 81.4 18.7 93.6
3325 Hardware 747 0.5 18 82 79.1 20.9 68.6 31.4 82.8 77.2 22.9 96.9
3353 Electrical Equipment 5,820 3.5 15.9 84.1 76.9 23.1 66.9 33.1 83.6 75.3 24.7 97.4
3345 Navigational, Measuring, Electro medical and Control Instruments
2,600 1.6 23.6 76.4 77.2 22.8 63.8 36.2 75.0 74.6 25.4 95.1
3359 Other Electrical Equipment and Component Manufacturing
6,278 3.8 25.9 74.1 78 22 68.7 31.3 82.2 74.1 25.9 92.5
3346 Magnetic and Optical Media 544 0.3 16.2 83.8 80.2 19.8 58.3 41.7 65.8 73.6 26.4 89.7
3363 Motor Vehicle Parts 21,708 13.2 26.8 73.2 76.1 23.9 57.5 42.5 62.3 73.4 26.7 94.5
3391 Medical Equipment and Supplies 3,561 2.2 18 82 74.4 25.6 69.1 31.0 90.5 73.0 27.0 97.5
3366 Ship and Boat Building 107 0.1 4 96 72.8 27.2 37.0 63.0 47.9 72.0 28.0 98.9
3379 Other Furniture Related Product 515 0.3 25.9 74.1 73 27 66.1 33.9 85.4 71.3 28.8 96.3
3351 Electric Lighting Equipment 1,413 0.9 16.2 83.8 73.7 26.4 64.8 35.2 84.7 66.9 33.1 88.3
3313 Alumina and Aluminum Production and Processing
82 0 20.1 79.9 73.3 26.7 41.2 58.8 39.6 66.6 33.4 87.5
3352 Household Appliance 2,293 1.4 29.7 70.3 69.3 30.8 60.8 39.2 78.7 65.7 34.3 91.1
3151 Apparel Knitting Mills 32 0 18.3 81.7 71.5 28.5 52.9 47.1 65.0 65.1 34.9 88.0
3361 Motor Vehicle 6,657 4.1 33.2 66.8 64.8 35.2 33.2 66.8 0.0 64.8 35.2 99.9
3152 Cut and Sew Apparel 6,633 4 22.4 77.6 64.6 35.4 52.7 47.3 71.9 63.1 36.9 96.5
3331 Agriculture, Construction, and Mining Machinery
426 0.3 20.4 79.6 76.7 23.3 48.4 51.6 49.7 63.1 36.9 75.8
3339 Other General Purpose Machinery 1,685 1 21.1 78.9 72.2 27.8 48.7 51.3 54.0 63.1 36.9 82.2
3336 Engine, Turbine, and Power Transmission Equipment
1,308 0.8 25.7 74.3 72.1 27.9 37.0 63.0 24.4 62.7 37.3 79.7
3149 Other Textile Product Mills 484 0.3 25.9 74.1 71.5 28.5 44.1 55.9 40.0 62.4 37.6 80.0
3364 Aerospace Product and Parts 1,176 0.7 9.6 90.4 74.2 25.8 33.1 66.9 36.3 62.4 37.6 81.8
31
Total Manuf. Exports
% of Mexico’s total merchan-dise exports
Non -processing Processing Weighted sum 1a Maquila
exports as % of industry exports
Weighted sum 2 b Maquila
and PITEX exports as % of industry exports
4-digit NAICS Code
Industry Description Total Foreign value-added
Total Domestic Value-added
Total Foreign value-added
Total Domestic Value-added
Total Foreign value-added
Total Domestic Value-added
Total Foreign value-added
Total Domestic Value-added
3272 Glass and Glass Product 852 0.5 13.4 86.6 71.9 28.1 25.5 74.5 20.6 62.1 38.0 83.1
3329 Other Fabricated Metal Product 1,485 0.9 22.3 77.8 74.5 25.5 51.9 48.1 56.7 62.1 37.9 76.4
3399 Other Miscellaneous Manufacturing 4,248 2.6 15.7 84.3 68.6 31.4 52.9 47.1 70.4 61.4 38.6 86.5
3334 Ventilation, Heating, Air-Conditioning, and Commercial Refrigeration Equipment
669 0.4 26.6 73.4 71.7 28.3 50.8 49.3 53.6 61.3 38.7 77.0
3322 Cutlery and Hand tool 222 0.1 17.3 82.7 73.1 26.9 31.3 68.7 25.2 60.0 40.1 76.5
3141 Textile Furnishings Mills 192 0.1 24.2 75.9 73.1 26.9 45.2 54.8 43.0 59.4 40.6 71.9
3261 Plastics Product 1,586 1 28.5 71.5 66.6 33.4 49.4 50.6 55.0 58.6 41.4 79.1
3231 Printing and Related Support Activities 289 0.2 21.1 78.9 64.8 35.2 55.9 44.1 79.6 57.6 42.4 83.5
3372 Office Furniture 923 0.6 19.6 80.4 62.1 37.9 46.0 54.0 62.2 54.9 45.1 83.2
3311 Iron and Steel Mills and Ferroalloy 1,239 0.8 19.4 80.7 65.7 34.3 19.8 80.2 1.0 54.1 45.9 75.0
3159 Apparel Accessories and Other Apparel 119 0.1 16.4 83.6 64.5 35.5 45.8 54.2 61.1 53.5 46.5 77.2
3161 Leather and Hide Tanning and Finishing 109 0.1 16.4 83.6 77 23 20.2 79.8 6.4 53.3 46.7 60.8
3169 Other Leather and Allied Product 140 0.1 19.9 80.1 60.6 39.4 38.8 61.2 46.5 53.3 46.7 82.1
3162 Footwear 263 0.2 20.7 79.3 76.4 23.6 37.7 62.3 30.7 52.7 47.3 57.5
3371 Household and Institutional Furniture and Kitchen Cabinet
214 0.1 14.6 85.4 65.9 34.1 39.6 60.5 48.7 51.1 48.9 71.3
3327 Machine Shops; Turned Product; and Screw, Nut, and Bolt
61 0 16.4 83.6 63.6 36.4 40.9 59.1 51.9 50.9 49.1 73.1
3324 Boiler, Tank, and Shipping Container 126 0.1 23.6 76.4 66.5 33.5 34.2 65.8 24.7 49.9 50.1 61.2
3133 Textile and Fabric Finishing and Fabric Coating Mills
100 0.1 26.3 73.7 71.7 28.4 47.1 52.9 45.9 49.3 50.7 50.8
3212 Veneer, Plywood, and Engineered Wood Product
55 0 13.9 86.1 69 31 20.6 79.4 12.2 48.5 51.5 62.8
3259 Other Chemical Product and Preparation 835 0.5 22.4 77.6 70.6 29.4 28.4 71.6 12.4 48.0 52.0 53.1
3326 Spring and Wire Product 509 0.3 21 79 54.6 45.4 23.5 76.5 7.4 47.9 52.1 80.3
3211 Sawmills and Wood Preservation 3 0 4.4 95.6 65.9 34.1 13.1 86.9 14.1 47.4 52.6 70.0
3262 Rubber Product 487 0.3 26.9 73.1 62.8 37.2 38.8 61.2 33.1 47.1 52.9 56.4
3222 Converted Paper Product 695 0.4 25.2 74.8 67.2 32.8 41.7 58.3 39.2 46.4 53.7 50.3
3369 Other Transportation Equipment 31 0 32.8 67.2 56.2 43.8 38.8 61.3 25.5 45.8 54.2 55.7
3332 Industrial Machinery 146 0.1 14.6 85.4 62 38 32.7 67.3 38.1 43.0 57.0 59.8
3312 Steel Product using Purchased Steel 620 0.4 22.3 77.7 54.3 45.7 26.1 73.9 11.9 41.9 58.1 61.3
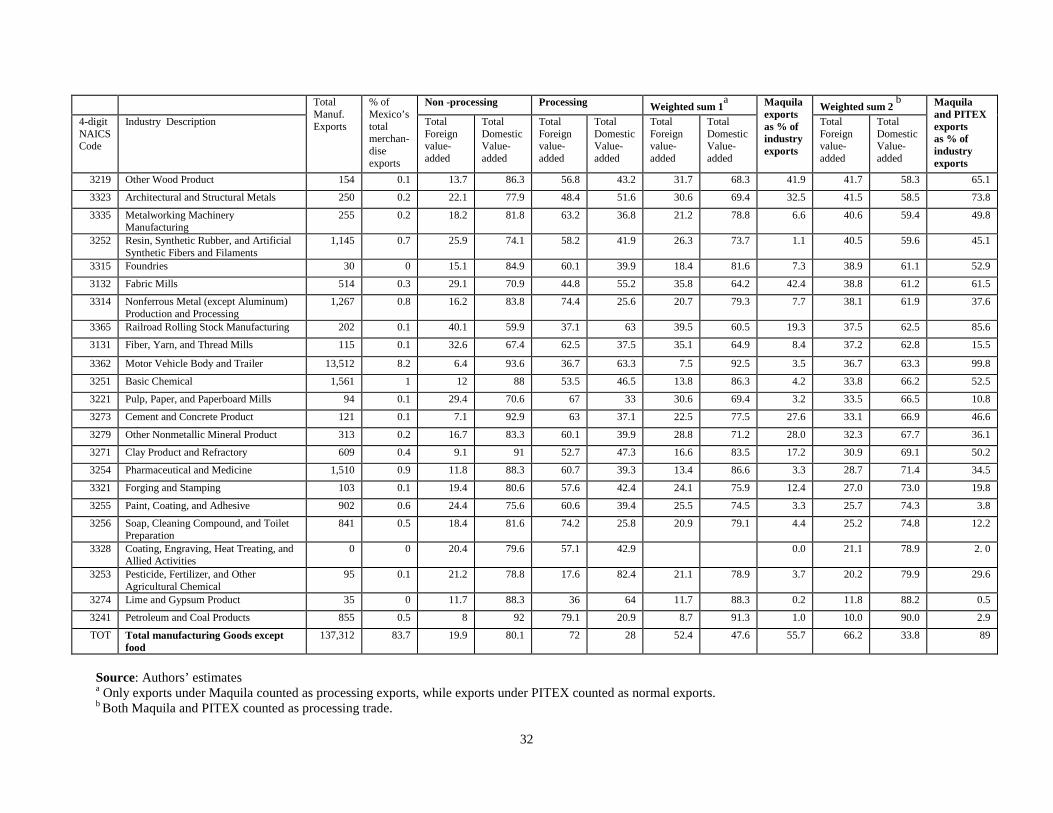
32
Total Manuf. Exports
% of Mexico’s total merchan-dise exports
Non -processing Processing Weighted sum 1a Maquila
exports as % of industry exports
Weighted sum 2 b Maquila
and PITEX exports as % of industry exports
4-digit NAICS Code
Industry Description Total Foreign value-added
Total Domestic Value-added
Total Foreign value-added
Total Domestic Value-added
Total Foreign value-added
Total Domestic Value-added
Total Foreign value-added
Total Domestic Value-added
3219 Other Wood Product 154 0.1 13.7 86.3 56.8 43.2 31.7 68.3 41.9 41.7 58.3 65.1
3323 Architectural and Structural Metals 250 0.2 22.1 77.9 48.4 51.6 30.6 69.4 32.5 41.5 58.5 73.8
3335 Metalworking Machinery Manufacturing
255 0.2 18.2 81.8 63.2 36.8 21.2 78.8 6.6 40.6 59.4 49.8
3252 Resin, Synthetic Rubber, and Artificial Synthetic Fibers and Filaments
1,145 0.7 25.9 74.1 58.2 41.9 26.3 73.7 1.1 40.5 59.6 45.1
3315 Foundries 30 0 15.1 84.9 60.1 39.9 18.4 81.6 7.3 38.9 61.1 52.9
3132 Fabric Mills 514 0.3 29.1 70.9 44.8 55.2 35.8 64.2 42.4 38.8 61.2 61.5
3314 Nonferrous Metal (except Aluminum) Production and Processing
1,267 0.8 16.2 83.8 74.4 25.6 20.7 79.3 7.7 38.1 61.9 37.6
3365 Railroad Rolling Stock Manufacturing 202 0.1 40.1 59.9 37.1 63 39.5 60.5 19.3 37.5 62.5 85.6
3131 Fiber, Yarn, and Thread Mills 115 0.1 32.6 67.4 62.5 37.5 35.1 64.9 8.4 37.2 62.8 15.5
3362 Motor Vehicle Body and Trailer 13,512 8.2 6.4 93.6 36.7 63.3 7.5 92.5 3.5 36.7 63.3 99.8
3251 Basic Chemical 1,561 1 12 88 53.5 46.5 13.8 86.3 4.2 33.8 66.2 52.5
3221 Pulp, Paper, and Paperboard Mills 94 0.1 29.4 70.6 67 33 30.6 69.4 3.2 33.5 66.5 10.8
3273 Cement and Concrete Product 121 0.1 7.1 92.9 63 37.1 22.5 77.5 27.6 33.1 66.9 46.6
3279 Other Nonmetallic Mineral Product 313 0.2 16.7 83.3 60.1 39.9 28.8 71.2 28.0 32.3 67.7 36.1
3271 Clay Product and Refractory 609 0.4 9.1 91 52.7 47.3 16.6 83.5 17.2 30.9 69.1 50.2
3254 Pharmaceutical and Medicine 1,510 0.9 11.8 88.3 60.7 39.3 13.4 86.6 3.3 28.7 71.4 34.5
3321 Forging and Stamping 103 0.1 19.4 80.6 57.6 42.4 24.1 75.9 12.4 27.0 73.0 19.8
3255 Paint, Coating, and Adhesive 902 0.6 24.4 75.6 60.6 39.4 25.5 74.5 3.3 25.7 74.3 3.8
3256 Soap, Cleaning Compound, and Toilet Preparation
841 0.5 18.4 81.6 74.2 25.8 20.9 79.1 4.4 25.2 74.8 12.2
3328 Coating, Engraving, Heat Treating, and Allied Activities
0 0 20.4 79.6 57.1 42.9 0.0 21.1 78.9 2. 0
3253 Pesticide, Fertilizer, and Other Agricultural Chemical
95 0.1 21.2 78.8 17.6 82.4 21.1 78.9 3.7 20.2 79.9 29.6
3274 Lime and Gypsum Product 35 0 11.7 88.3 36 64 11.7 88.3 0.2 11.8 88.2 0.5
3241 Petroleum and Coal Products 855 0.5 8 92 79.1 20.9 8.7 91.3 1.0 10.0 90.0 2.9
TOT Total manufacturing Goods except food
137,312 83.7 19.9 80.1 72 28 52.4 47.6 55.7 66.2 33.8 89
Source: Authors’ estimates a Only exports under Maquila counted as processing exports, while exports under PITEX counted as normal exports. b Both Maquila and PITEX counted as processing trade.
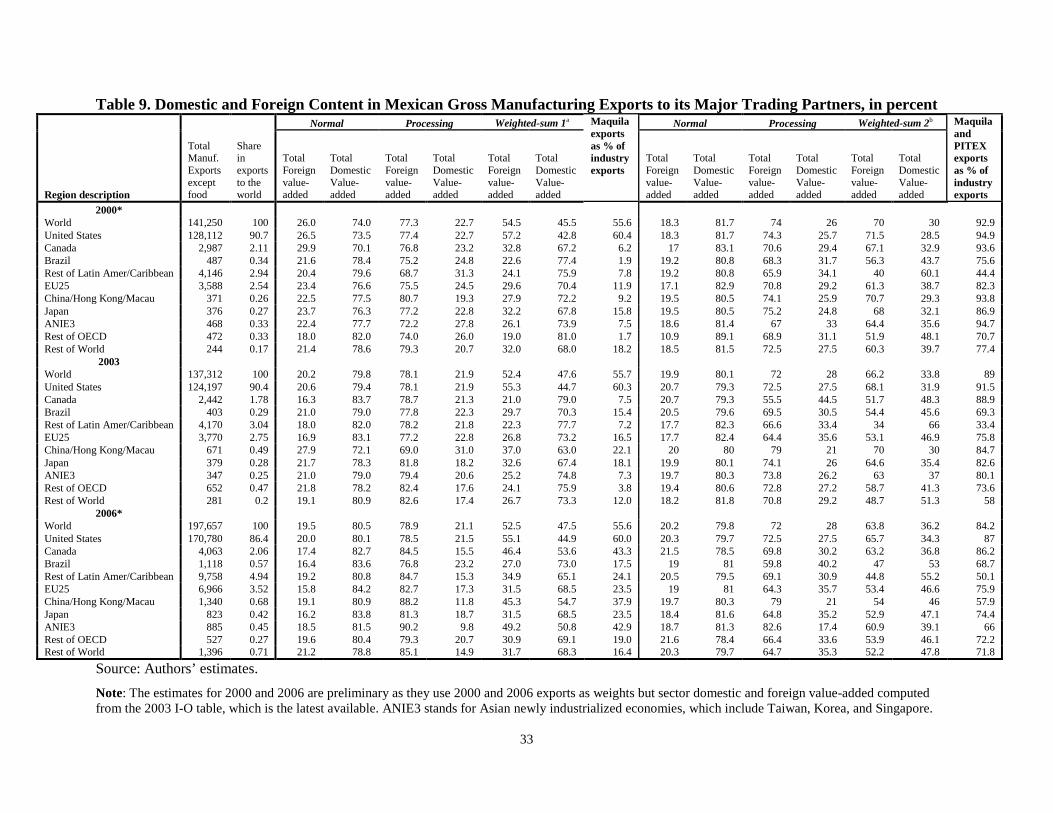
33
Table 9. Domestic and Foreign Content in Mexican Gross Manufacturing Exports to its Major Trading Partners, in percent
Total Manuf. Exports except food
Share in exports to the world
Normal Processing Weighted-sum 1a Maquila exports as % of industry exports
Normal Processing Weighted-sum 2b Maquila and PITEX exports as % of industry exports Region description
Total Foreign value-added
Total Domestic Value-added
Total Foreign value-added
Total Domestic Value-added
Total Foreign value-added
Total Domestic Value-added
Total Foreign value-added
Total Domestic Value-added
Total Foreign value-added
Total Domestic Value-added
Total Foreign value-added
Total Domestic Value-added
2000* World 141,250 100 26.0 74.0 77.3 22.7 54.5 45.5 55.6 18.3 81.7 74 26 70 30 92.9 United States 128,112 90.7 26.5 73.5 77.4 22.7 57.2 42.8 60.4 18.3 81.7 74.3 25.7 71.5 28.5 94.9 Canada 2,987 2.11 29.9 70.1 76.8 23.2 32.8 67.2 6.2 17 83.1 70.6 29.4 67.1 32.9 93.6 Brazil 487 0.34 21.6 78.4 75.2 24.8 22.6 77.4 1.9 19.2 80.8 68.3 31.7 56.3 43.7 75.6 Rest of Latin Amer/Caribbean 4,146 2.94 20.4 79.6 68.7 31.3 24.1 75.9 7.8 19.2 80.8 65.9 34.1 40 60.1 44.4 EU25 3,588 2.54 23.4 76.6 75.5 24.5 29.6 70.4 11.9 17.1 82.9 70.8 29.2 61.3 38.7 82.3 China/Hong Kong/Macau 371 0.26 22.5 77.5 80.7 19.3 27.9 72.2 9.2 19.5 80.5 74.1 25.9 70.7 29.3 93.8 Japan 376 0.27 23.7 76.3 77.2 22.8 32.2 67.8 15.8 19.5 80.5 75.2 24.8 68 32.1 86.9 ANIE3 468 0.33 22.4 77.7 72.2 27.8 26.1 73.9 7.5 18.6 81.4 67 33 64.4 35.6 94.7 Rest of OECD 472 0.33 18.0 82.0 74.0 26.0 19.0 81.0 1.7 10.9 89.1 68.9 31.1 51.9 48.1 70.7 Rest of World 244 0.17 21.4 78.6 79.3 20.7 32.0 68.0 18.2 18.5 81.5 72.5 27.5 60.3 39.7 77.4
2003 World 137,312 100 20.2 79.8 78.1 21.9 52.4 47.6 55.7 19.9 80.1 72 28 66.2 33.8 89 United States 124,197 90.4 20.6 79.4 78.1 21.9 55.3 44.7 60.3 20.7 79.3 72.5 27.5 68.1 31.9 91.5 Canada 2,442 1.78 16.3 83.7 78.7 21.3 21.0 79.0 7.5 20.7 79.3 55.5 44.5 51.7 48.3 88.9 Brazil 403 0.29 21.0 79.0 77.8 22.3 29.7 70.3 15.4 20.5 79.6 69.5 30.5 54.4 45.6 69.3 Rest of Latin Amer/Caribbean 4,170 3.04 18.0 82.0 78.2 21.8 22.3 77.7 7.2 17.7 82.3 66.6 33.4 34 66 33.4 EU25 3,770 2.75 16.9 83.1 77.2 22.8 26.8 73.2 16.5 17.7 82.4 64.4 35.6 53.1 46.9 75.8 China/Hong Kong/Macau 671 0.49 27.9 72.1 69.0 31.0 37.0 63.0 22.1 20 80 79 21 70 30 84.7 Japan 379 0.28 21.7 78.3 81.8 18.2 32.6 67.4 18.1 19.9 80.1 74.1 26 64.6 35.4 82.6 ANIE3 347 0.25 21.0 79.0 79.4 20.6 25.2 74.8 7.3 19.7 80.3 73.8 26.2 63 37 80.1 Rest of OECD 652 0.47 21.8 78.2 82.4 17.6 24.1 75.9 3.8 19.4 80.6 72.8 27.2 58.7 41.3 73.6 Rest of World 281 0.2 19.1 80.9 82.6 17.4 26.7 73.3 12.0 18.2 81.8 70.8 29.2 48.7 51.3 58
2006* World 197,657 100 19.5 80.5 78.9 21.1 52.5 47.5 55.6 20.2 79.8 72 28 63.8 36.2 84.2 United States 170,780 86.4 20.0 80.1 78.5 21.5 55.1 44.9 60.0 20.3 79.7 72.5 27.5 65.7 34.3 87 Canada 4,063 2.06 17.4 82.7 84.5 15.5 46.4 53.6 43.3 21.5 78.5 69.8 30.2 63.2 36.8 86.2 Brazil 1,118 0.57 16.4 83.6 76.8 23.2 27.0 73.0 17.5 19 81 59.8 40.2 47 53 68.7 Rest of Latin Amer/Caribbean 9,758 4.94 19.2 80.8 84.7 15.3 34.9 65.1 24.1 20.5 79.5 69.1 30.9 44.8 55.2 50.1 EU25 6,966 3.52 15.8 84.2 82.7 17.3 31.5 68.5 23.5 19 81 64.3 35.7 53.4 46.6 75.9 China/Hong Kong/Macau 1,340 0.68 19.1 80.9 88.2 11.8 45.3 54.7 37.9 19.7 80.3 79 21 54 46 57.9 Japan 823 0.42 16.2 83.8 81.3 18.7 31.5 68.5 23.5 18.4 81.6 64.8 35.2 52.9 47.1 74.4 ANIE3 885 0.45 18.5 81.5 90.2 9.8 49.2 50.8 42.9 18.7 81.3 82.6 17.4 60.9 39.1 66 Rest of OECD 527 0.27 19.6 80.4 79.3 20.7 30.9 69.1 19.0 21.6 78.4 66.4 33.6 53.9 46.1 72.2 Rest of World 1,396 0.71 21.2 78.8 85.1 14.9 31.7 68.3 16.4 20.3 79.7 64.7 35.3 52.2 47.8 71.8
Source: Authors’ estimates. Note: The estimates for 2000 and 2006 are preliminary as they use 2000 and 2006 exports as weights but sector domestic and foreign value-added computed from the 2003 I-O table, which is the latest available. ANIE3 stands for Asian newly industrialized economies, which include Taiwan, Korea, and Singapore.