Estimating Effectiveness of the Control of Violence and ...
24
Estimating Effectiveness of the Control of Violence and Socioeconomic Development in Colombia: An Application of Dynamic Data Envelopment Analysis and Data Panel Approach Alexander Cotte Poveda Accepted: 27 November 2010 / Published online: 29 December 2010 Ó The Author(s) 2010. This article is published with open access at Springerlink.com Abstract This paper develops an index to evaluate the level of effectiveness of the control of violence based on the data envelopment analysis approach. The index is used to examine the grade of effectiveness of the control of violence at the level of Colombian departments between 1993 and 2007. Comparing the results across Colombian depart- ments, we find that the majority of departments show improvement in their scores of effectiveness. A second stage of the regression model reveals that departments with a higher gross domestic product and higher education and employment are more effective in the control of violence, whereas departments with higher political violence, unemployment rates, unsatisfied basic needs, a displaced population, and hectares cultivated with coca show lower effectiveness in the control of violence. All these findings are of particular interest in the formulation and development of policies against violence, taking into account that organised forms of violence, such as drug trafficking, impede the adequate effectiveness of its control. Moreover, violence decreases social investments, generating alterations in social services that produce long-run deterioration in faith in the govern- ment’s ability to govern, which should become an incentive to further violence. Keywords Control of violence Economic development Effectiveness Data envelopment analysis Colombian departments 1 Introduction Violence comprises of the use or threatened use of weapons to inflict injury, death or psychosocial harm, which undermines development. The human costs of violence are far- reaching. It destroys lives and livelihoods, interrupts access to education, health and social A. Cotte Poveda (&) Department of Economics, University of Go ¨ttingen, Platz der Go ¨ttinger Sieben 3, 37073 Go ¨ttingen, Germany e-mail: [email protected] A. Cotte Poveda Faculty of Accounting and Administration, University of La Salle, Cra. 2 No. 10-70, Bogota, Colombia 123 Soc Indic Res (2012) 105:343–366 DOI 10.1007/s11205-010-9772-7
Transcript of Estimating Effectiveness of the Control of Violence and ...

Estimating Effectiveness of the Control of Violenceand Socioeconomic Development in Colombia:An Application of Dynamic Data EnvelopmentAnalysis and Data Panel Approach
Alexander Cotte Poveda
Accepted: 27 November 2010 / Published online: 29 December 2010� The Author(s) 2010. This article is published with open access at Springerlink.com
Abstract This paper develops an index to evaluate the level of effectiveness of the
control of violence based on the data envelopment analysis approach. The index is used to
examine the grade of effectiveness of the control of violence at the level of Colombian
departments between 1993 and 2007. Comparing the results across Colombian depart-
ments, we find that the majority of departments show improvement in their scores of
effectiveness. A second stage of the regression model reveals that departments with a
higher gross domestic product and higher education and employment are more effective in
the control of violence, whereas departments with higher political violence, unemployment
rates, unsatisfied basic needs, a displaced population, and hectares cultivated with coca
show lower effectiveness in the control of violence. All these findings are of particular
interest in the formulation and development of policies against violence, taking into
account that organised forms of violence, such as drug trafficking, impede the adequate
effectiveness of its control. Moreover, violence decreases social investments, generating
alterations in social services that produce long-run deterioration in faith in the govern-
ment’s ability to govern, which should become an incentive to further violence.
Keywords Control of violence � Economic development � Effectiveness �Data envelopment analysis � Colombian departments
1 Introduction
Violence comprises of the use or threatened use of weapons to inflict injury, death or
psychosocial harm, which undermines development. The human costs of violence are far-
reaching. It destroys lives and livelihoods, interrupts access to education, health and social
A. Cotte Poveda (&)Department of Economics, University of Gottingen, Platz der Gottinger Sieben 3, 37073 Gottingen,Germanye-mail: [email protected]
A. Cotte PovedaFaculty of Accounting and Administration, University of La Salle, Cra. 2 No. 10-70, Bogota, Colombia
123
Soc Indic Res (2012) 105:343–366DOI 10.1007/s11205-010-9772-7
services, reduces social and human capital by sowing fear and insecurity, and results in
high economic costs from years of lost productivity. Violence can induce large-scale
displacement, restrict mobility, reduce investment and access to credit and trade, and
contribute to the growth of illicit markets and power structures. It can also undermine
governance and state stability, while creating or taking root in under-governed spaces.1
Violence is a source and result of a range of risk factors such as horizontal inequalities,2
poverty, socio-political exclusion and governance challenges (OECD 2009). In this con-
text, violence has become an obstacle to the development of countries.
Violence is often restricted to specific geographic areas of a region, country, state,
department or municipality. While certain areas of a country or city may operate normally,
others can suffer from acute levels of violence. Peripheral, marginal and historically
neglected regions such as border areas and city slums are often under-governed and vul-
nerable to the growth of informal and/or predatory power structures (Greene and Bourne
2005) like the guerrilla-dominated areas of southern Colombia and the urban shantytowns
of Sao Paulo (Brazil).
In recent literature, violence has been studied using different methods and approaches.
Collier and Hoeffler (2004) investigates whether the socio-economic determinants of
homicide and civil war are similar and then explores potential inter-relationships between
their using ordinary least squares estimation (OLS), indicating that higher homicide rates
do not increase the risk of war but that civil wars generate a legacy of increased post-
conflict homicide rates. WOAT (2005) analyses the trends between incidents of violence
and socio-economic inequalities at the macro and micro level using empirical analysis of
the correlation between social and economic inequalities and violence, finding that socio-
economic inequality variables are explanatory in analysing variations in the level and type
of violence at both the micro and macro levels. Burgoon (2006) develops arguments and
evidence on how social policies affect terrorism and violence through both cross-sectional
and pooled time series cross-section estimation, demonstrating that social welfare policies
not only may serve redistributive or developmental goals but should also be a part of
strategies to combat terrorist violence. An important difference between our analysis and
these studies is that we use second stage data envelopment analysis (DEA) efficiency
analyses in the context of control violence.
Boix (2008) applies an integrated analytical model that considers both the motives and
the opportunities for violence from the perspective of states and rebels, using a multivariate
analysis of the factors influencing civil wars, guerrillas and rebellious actions across the
world in contemporary times. He finds that systematic and organised violent conflicts are
most likely in economies where inequality is high and wealth is mostly immobile, that is,
in societies where those worse off would benefit substantially from expropriating all assets.
Bodea and Elbadawi (2008) analyse the economic growth impact of organised political
violence through a quantitative model of violence, predicting probabilities of aggregate
violence and demonstrating that, under plausible assumptions about risk aversion during
times of conflict, the overall effects of organised political violence are likely to be much
1 Under-governed areas include those lacking the presence of formal state structures/representatives. In fact,most ‘‘under-governed’’ areas feature some form of traditional or alternative governance institutions, leadersand practices. These alternatives are often regarded as being more legitimate and representative than thecentral government in the eyes of the local population. However, alternative governance structures can alsobe coercive and exploitive (while lacking legitimacy), especially when authority is based on enforcement byarmed non-state actors linked to criminal enterprises (Clunan and Trinkunas 2010; Lamb 2007).2 ‘‘Horizontal inequalities’’ defines to inequalities among groups living in the same society (Stewart 2008).
344 A. Cotte Poveda
123

higher than its direct effect of capital destruction. Our analysis differs in that we focus on
structural risk and proximate risk factors to explain the variations in control of violence.
In the Colombian case, several studies have used different approaches to analyse the
violence and its results. Martınez et al. (2001), using data from the 1990s, determine a
weak role for poverty but none for inequality on violence. Sanchez and Nunez (2001), with
data between 1980s and 1990s, find that poverty, inequality and social exclusion explain
only a small fraction of the homicide rate. Bourguignon et al. (2002), with data from the
1980s and 1990s, show that only a certain fraction of the income distribution, namely, the
percentage of people below 80% of mean income, is related to property crime. Rubio
(2001), analysing a cross-section of Colombian municipalities for different yearly intervals
since 1987, shows that traditionally important determinants of guerrilla presence at the
community level, such as inequality, wealth and education, lose their explanatory power
during the 1990s. Holmes et al. (2007) examine the traditional political and economic
factors that have been purported to explain the prevalence of insurgency at the sub-national
level in Colombia, finding that guerrilla violence is positively associated with exports;
higher levels of insurgency are associated with low levels of gross domestic product (GDP)
per capita; and guerrilla violence emerges in the context of a weak state presence. Cotte
(2007) finds that socioeconomic features of every Colombian region have affected the
economic growth dynamics and that productive factors and violence have effects on
Colombian economic growth. Grun (2008) analyses the impact of violence on household
decisions and find that both guerrilla and common violence have consequences that reach
beyond their immediate destructive effect.
Both at the international level and in the Colombian case, the studies have analysed the
social and economic causes of violence and effects on economic growth and development
using typical empirical analysis. However, the results obtained from this kind of analysis
do not provide enough information that allow the analysis of the effectiveness of the
control of violence and the factors affecting this effectiveness in a different context. In the
available body of literature on violence, hardly any attention is paid to the effectiveness of
the control of violence and its determinants. Against this background, the main goals of
this study are twofold. First, we analyse the effectiveness of the control of violence in
the Colombian departments3 using DEA. Second, we determine the factors that affect the
effectiveness of the control of violence using a regression analysis. We carry out the
analysis for the time period 1993–2007.
Measuring the effectiveness of the control of violence can play an important role in
achieving improvements in the welfare of population, as the violence can have negative
effects on the economic development of the countries. Developing and reporting perfor-
mance information is crucial to identifying performance improvements and thus guiding
decision-making. Comparative performance reporting is typically undertaken co-opera-
tively to assist all participants to improve their performance. Moreover, Becker (1968) has
demonstrated that optimal policies to combat violence are part of an optimal allocation of
resources. In this context, DEA is an analytical tool that can assist in the identification of
best practices in the use of resources among a group of organisations. Such identification
can highlight possible improvements in effectiveness that may help public agencies to
achieve their potential. Therefore, this study provides new evidence on the control of
violence and the effects of structural risk and proximate risk factors in the effectiveness of
their control.
3 In the Colombian case, there are 32 sub-national political territories called departments.
Estimating Violence and Socioeconomic Development in Colombia 345
123
In the last few years, some researchers have analysed economic development using
DEA. Raab and Habib (2007) have developed a generalised efficiency to rank developing
and developed nations in terms of overall production efficiency, using linear programming
to measure and rank the relative technical efficiency. Malul et al. (2009) introduce an
efficiency ranking to measure the economic, environmental and social efficiency of
countries. Adler et al. (2009) measure the relative socio-economic performance of
developing countries. Different DEA linear programming models have been developed to
assess the relative performance of the countries in terms of human development (Mahlberg
and Obersteiner 2001; Despotis 2005; Somarriba and Pena 2009; Despotis et al. 2009).
Ramanathan (2006) studies economic performance through DEA in countries of the
Middle East and North Africa. Habibov and Fan (2009) compare and contrast the poverty
reduction performance of social welfare programs in Canada. These studies have dem-
onstrated that DEA in conjunction with traditional measures on development, and growth
are an alternative and effective method to measure and rank the economic, development
and social efficiency in different approaches.
Moreover, in criminology DEA has been used to evaluate the efficiency from different
approaches. Hence, Butler and Johnson (1997) assessed the relative efficiency of prison
operations and to set targets for improvement identifying the source of inefficiency and
potential remedies. Sun (2002) measured the relative efficiency of police precincts in
Taiwan showing that differences in operation and process depend mainly of resident
population and location factors. Verma and Gavirneni (2006) measured policy efficiency in
India found that DEA helps to generate targets of performance, identify inefficient
departments, and determine adequate levels of operation and improvements in the unit of
criminal justice systems. Garcia (2007) evaluated the effectiveness of the Spanish police
force determined that the units with the most effective overall are characterized by the
solving of crimes against the right to sexual freedom and indemnity and by the arrest of a
high percentage of those guilty of other offences. These studies show the applicability of
DEA in the analysis of efficiency of criminal justice. However, these researches have not
evaluated the effectiveness of the control of violence and socioeconomic development,
which is the aim of this study.
In Colombia, DEA models have also been applied in studies of the performance and
efficiency of power distribution systems (Pombo and Taborda 2006), production costs
(Lopez et al. 2007), the analysis of ranking Colombian research groups (Restrepo and
Villegas 2007) and the analysis of energy efficiency in manufacturing industries (Pardo
2009, 2010). However, DEA has not been applied to measure and rank the efficiency from
an economic development and social approach being this a singular feature of this research
in the Colombian context.
With this background, the contribution of this study is that it employs DEA to compare
the effectiveness of the control of violence within Colombian departments by considering
different variables as input and output from the mix of the department’s situation. It also
identifies the best-performing departments over time and defines the factors that affect
these results where the studies are limited.
The rest of this paper is organised into five sections. Following the introduction, the
second section describes DEA and the methodological foundation of this study. The third
section provides an empirical illustration of the application of DEA to the analysis and
comparison of the effectiveness of the control of violence in the Colombian departments,
the justification for the adoption of DEA and the data construction. The fourth section
shows the results of DEA. The fifth section applies an econometric model to investigate the
346 A. Cotte Poveda
123

sources of differences in the effectiveness of the control of violence in Colombian
departments. The sixth section concludes the paper and provides some policy suggestions.
2 Data Envelopment Analysis
Data envelopment analysis (DEA) is a mathematical programming methodology that uses
the Frontier approach to measure the relative efficiency or performance of decision-making
units (DMUs) based on a fractional programming problem that has been converted to a
linear programming problem. In DEA, a DMU is regarded as an entity transforming inputs
into outputs. A DMU can be a company, a non-profit organisation, or a jurisdiction with
multiple inputs and outputs (Charnes et al. 1978; Banker et al. 1984; Charnes et al. 1994).
DEA was first developed as an application of linear programming to analysis efficiency
in production by Charnes et al. (1978), who used what is now called the CCR-model, based
on the method of frontier analysis by Farrel (1957). Different DEA models have since been
further developed; examples are a model of variable returns to scale, or the BCC model, by
Banker et al. (1984), the ‘‘Malmquist’’ index model (CCD), developed by Caves et al.
(1982), and window analysis, which assesses the performance of a DMU over time by
treating it as a different entity in each time period (Charnes et al. 1985).
The basic concept and the general form of a DEA (input-oriented CCR) model can be
presented as follows (Ramanathan 2003): for each DMU, we have multiple inputs and
outputs, which are linearly aggregated by weights to be determined by the DEA pro-
gram.The virtual inputs and outputs are formed as follows:
Virtual input ¼ v1x1 þ � � � þ vIxI ¼XI
i¼1
vixi;
Virtual output ¼ u1y1 þ � � � þ uJyJ ¼XJ
j¼1
ujyj;
where v1 is the weight assigned to input xi, and ui is the weight assigned to output yi in the
linear aggregation. Variables xi and yi are the actually observed inputs and outputs for
determining the weights. The following model is used to maximise the ratio:
Efficiency ¼ Virtual output
Virtual input¼PJ
j¼1 ujyjPI
i¼1 vixi
:
As can be observed, this is a generalisation of the model achieved through a reduction
from a ‘‘multiple-output–multiple input’’ situation to the situation of a single ‘‘virtual’’
output and a single ‘‘virtual’’ input. The efficiency of a DMU can be defined as the ratio of
‘‘virtual output’’ to ‘‘virtual input’’, with weights to be determined. Suppose that we are
going to compare the efficiencies of n DMUs and that the DMUs under analysis have xim
inputs and yjm outputs. In particular, it takes any mth DMU that uses xim inputs to produce
yjm outputs and maximise its efficiency as the reference DMU. To measure the efficiency of
this process by a DMU, a fractional mathematical programming model, denoted as Eq. (1)
below, is proposed. The objective function of the model maximises the ratio of weighted
outputs to weighted inputs for the DMU under evaluation, subject to the condition that the
similar ratios for all DMUs be less than or equal to one (Ramanathan 2003). The formula is
as follows:
Estimating Violence and Socioeconomic Development in Colombia 347
123

Max Em ¼PJ
j¼1 ujmyjmPI
i¼1 vimxim
;
subject to
0�PJ
j¼1 ujmyjmPI
i¼1 vimxim
� 1; n ¼ 1; 2; . . .;N;
vjm; uim� 0; i ¼ 1; 2; . . .; I; j ¼ 1; 2; . . .; J;
ð1Þ
where Em is the efficiency of the mth DMU, xim and yjm are the input and output of mth
DMU, respectively, vim and ujm are the weights assigned to input xim and output yjm,
respectively, and xin and yjn are the ith input and jth output of nth DMU, n = 1, 2, …, N,
respectively. The weights for each input and output are selected such that the associated
DMU obtains a score that places it in the best possible light. Each DMU has its own unique
set of weights restricted from 0 to 1, determined by linear programming.
The mathematical formula analysed above is fractional in form and difficult to solve.
However, it can be solved easily by normalising either the numerator (maximising the
outputs) or denominator (minimising the inputs) of the fractional form. An output maxi-
misation model is expressed as follows:
Max z ¼XJ
j¼1
ujmyjm;
subject to
XI
i¼1
vimxim ¼ 1;
XJ
j¼1
ujmyjn �XI
i¼1
vimxin� 0;
vjm; uim� 0; i ¼ 1; 2; . . .; I; j ¼ 1; 2; . . .; J;
ð2Þ
where xim, yjm, vim, ujm, xin and yjn are indicated as above. This is an ordinary linear
programming problem. Elements for the transformation from problem in (1) to the linear
programming solution in (2) can be found in studies by Charnes et al. (1978) and Cooper
et al. (2000).
In DEA, a DMU or several DMUs for which the efficiency is maximised is called the
reference set (Charnes et al. 1994; Cooper et al. 2000). DEA identifies the reference set that
consists of relatively efficient DMUs that are most similar to each DMU being evaluated.
The performance of evaluated DMUs is measured by their divergence from the reference
set. Consequently, a unique reference set is developed for each DMU; the reference set for
an inefficient DMU may differ from unit to unit. The DMUs included in the reference set
are the benchmarks for the evaluated DMU. By evaluating the performance of each DMU
against the benchmarks, DEA identifies sources and computes the amounts of inefficien-
cies in each input and each output for each DMU.
Following this, sources and amounts of inefficiencies are translated into the amounts of
input and/or output that should be changed to make the DMU efficient relative to the
benchmarks. The proposed changes in input and output set targets for future improvements
for each DMU.
348 A. Cotte Poveda
123

2.1 Application Considerations of DEA
There are several important issues faced in DEA application. First, DEA models require
that both of the input and output variables be positive. If a variable is not positive, the
variable should be transformed by an affine displacement, which does not alter the iden-
tification of DMUs in the efficient frontier, as shown in the study by Ali and Seiford
(1990). In this paper, all selected inputs and outputs are positive. Second, all DMUs under
analysis should be homogeneous entities that have the same inputs and produce the same
outputs. Finally, as in other methods based on statistics, DEA also has the issue of stability
in the form of degrees of freedom. In DEA, the degrees of freedom increase with the
number of DMUs and decrease with the number of inputs and outputs. A general rule of
thumb is as follows:
n� maxfm� s; 3ðmþ sÞg;
where n is the number of DMUs, m is the number of inputs and s is the number of outputs
(Cooper et al. 2000). Therefore, the minimum number of DMUs is either the product of the
number of inputs and the number of outputs or three times that of the sum of the number of
inputs and outputs, whichever is bigger. In this study, we have 4 inputs (desirable attri-
butes) and 3 outputs (undesirable attributes), and we need at least 21 DMUs to meet the
required degrees of freedom. In this analysis, we have divided the departments in three
groups with the aim of obtaining comparable decision-making units (DMUs). The groups
of departments are the following: departments with a high level of violence, departmentswith a moderate level of violence, and departments with a low level of violence. Therefore,
for every group, there are only a maximum of 11 departments in Colombia, implying that
we have at less 21 DMUs. However, this can be solved in this analysis by the application of
a window analysis. In window analysis, for each evaluation, we have 33 DMUs for
Departments with a high level of violence and Departments with a middle level of vio-
lence, and we have 30 DMUs for Departments with a low level of violence.
In DEA, it is necessary to consider the construction of the production frontier, which is
the subset of all feasible techniques that attain the highest effectiveness of the control of
violence for the particular features they correspond to. In case of panel data literature
defines three different kinds of frontiers (Contemporaneous, Inter-temporal and Sequen-
tial).4 In this study, we used the inter-temporal frontier, where the production possibility set
is defined as S0 ¼ x; yð Þ : x�
Pni¼1
Ptt¼1 kt
ixti; y�
Pni¼1
Ptt¼1 yt
iyti
� �; when there are
n units observed over T periods of time at which the DMU is being evaluated. This frontier
is selected because it captures overall efficiency change over time, it assumes technical
progress or regress taking into account that the measures of efficiency in each year can be
compared and can be taken as indicators of advance or decline in performance, and it leads
to greater degrees of freedom and therefore, more variation in the measured efficiencies.
Moreover, in DEA, the stochastic frontier includes the possibility of measurement errors in
the input and output variables as well as indeterminacy in the estimated frontiers due to
limited samples in comparison with deterministic frontier (Kenneth et al. 1994; Ray 2004).
4 DEA analysis defines three types of frontiers with panel data: (a) the contemporaneous builds from onlythe cross-section data from a given period, (b) the sequential considers all current and past observations asfeasible, and (c) the inter-temporal uses observations from all the periods in the sample (Tulkens andEeckaut 1995).
Estimating Violence and Socioeconomic Development in Colombia 349
123
2.2 Window Analysis
Window analysis is a moving-average model that comprises of a series analysis with time-
dependent DMUs as described in Charnes et al. (1985) and in Bowlin (1987). In window
analysis, the same department in different time periods is treated as different DMUs. As a
result, the performance of a department is not only compared with that of other depart-
ments at the same time but also compared with itself at different time periods. For
example, this analysis selects a 3 year window for the study over a 15 year period from
1993 to 2007 for 32 Colombian departments divided as departments with a high-, middle-,
or low level of violence. In the first window, data of year 1, year 2 and year 3 are analysed;
the window covers 1993–1995 and so on until the last window, year 13, year 14 and year
15 are included. Therefore, for each window in analysis, we have 30 or 33 DMUs. There
are two major benefits of using window analysis. First, it increases the number of DMUs
and allows for more input and output variables to be taken into account in a given number
of DMUs. By increasing the number of variables in DEA, window analysis overcomes the
constraints of degrees of freedom. Second, it can be used to test the stability of perfor-
mance of each department over a period of time. In that way, window analysis may reveal
more meaningful implications regarding the changes in the performance of analysed
DMUs, by examining their efficiency in dynamic settings.
3 Empirical Illustration: The Effectiveness of the Control of Violence in Colombia
In this section, DEA is applied to evaluate and compare the effectiveness of the control of
violence in Colombian departments. When assessing the performance of Colombian
departments, DEA combines the performance of Colombian departments in terms of
several desirable (inputs) and undesirable (outputs) attributes into a single scalar measure,
called the efficiency score. Departments that register unit efficiency scores are considered
efficient in that they have the highest values of desirable attributes and the lowest values of
undesirable attributes. Departments with efficiency scores less than 1 may be considered to
operate sub-optimally for a given set of attributes.5
As noted above, DEA uses two sets of variables: input (desirable attributes) and output
(undesirable attribute). For the purpose of this study, we treat each Colombian department
as a separate DMU with its own input and output values. Each DMU has desirable attri-
butes-denominated input variables and undesirable attributes-denominated output vari-
ables. Of the seven attributes, homicides, kidnapping and robberies represent undesirable
attributes (outputs) whereas confiscated drugs, budget execution, captures and number of
policeman represent desirable attributes (inputs). This model assumes that the score
increases when a department achievement improves its desirable attributes (inputs), and the
score decreases when a department increases its undesirable attributes (outputs). The
choice of attributes for this study is influenced by issues of data consistency, reliability and
affordability.
In this study, when computing efficiency scores using DEA, we assume constant returns
to scale (CRS) with output-oriented where the model minimise the undesirable attributes
(outputs) whereas maximise the desirable attributes (inputs). Before detailing our study, we
5 This concept follows that used by Ramanathan (2006) to evaluate the comparative performance ofcountries of the Middle East and North Africa.
350 A. Cotte Poveda
123

show the justification of using DEA. The following are selected important features and
advantages of using DEA for a comparative analysis of Colombian departments.
3.1 Justification for Adoption of DEA
We can return to three major reasons for employing DEA for the analysis of the effec-
tiveness of the control of violence across Colombian departments. First, each department
uses multiple inputs (desirable attributes) and multiple outputs (undesirable attributes).
Therefore, the analyst faces the challenge of assessing the system with multiple inputs and
multiple outputs. As a quantitative technique, DEA is specially designed to determine
efficiency using multiple inputs and multiple outputs. DEA allows assessing the aggregated
effectiveness of the control of violence, as it produces a single composite measure to rank
departments by their relative efficiency in the effectiveness of the control of violence. A
single ranking such as this can be easily understood by policy makers, social adminis-
trators, media and the general population.
Second, DEA reveals best-practice performance, which are different from the average
performance levels produced by a regression analysis. Regression analysis generates a
central tendency line (based on the least-squares principle) that identifies the average
performance of departments. Afterwards, it is possible to determine the performance of a
department as ‘‘above average’’ if a unit is above the line or as ‘‘inferior’’ if a unit is below
the line. The degrees of the excellence or inferiority of the performance is estimated by
amounts of deviation from the line (Habibov and Fan 2009). On the contrary, DEA
identifies the best department to set benchmarks and then measures the performance of
other departments by their deviation from the benchmarks. As a result, each department is
compared with the best possible performance among the peers rather than with the average
as in the case of regression analysis. Furthermore, because DEA compares each department
with benchmarks, it is possible to compute to what extent specific inputs and outputs
should be changed to make the department relatively efficient. By showing the amounts
and sources of inefficiencies, DEA provides a foundation for future corrective actions. This
feature of DEA is different from other statistical approaches, such as regression analysis,
which is not able to identify sources or amounts of inefficiencies (Bowlin 1998).
Finally, when DEA is extended to evaluate social performances, terms like ‘‘inputs’’ and
‘‘outputs’’ are largely generic (to conform to DEA usages), as can be seen in earlier DEA
applications (Golany and Thore 1997; Raab et al. 2000). For example, the current study
uses ‘‘budget execution’’ as an input and ‘‘homicides’’ as an output. However, they cannot
be considered an input and output, respectively, in the traditional sense of DEA. That is,
‘‘budget execution’’ cannot be said to produce ‘‘homicides’’. In this sense, performance
levels in terms of undesirable attributes are considered outputs, and performance levels in
terms of desirable attributes are considered inputs. Such generic usage is also true of
DMUs. In a traditional DEA context, DMUs are entities that convert inputs into outputs.
Here however, the term denotes only the entity (a department) under consideration.
Nevertheless, DEA can be used to compare the performance of different departments by
the scalar efficiency score. The score increases when department achievements increase in
terms of desirable attributes and decreases when achievements increase in terms of
undesirable attributes (Ramanathan 2006).
Taken together, the evidence presented above suggests that DEA can be adopted for the
comparison of the effectiveness of the control of violence across Colombian departments.
The results from DEA model specified in this study are robustness and suitable taking
account the analysis of Smith (1997) on accurate estimates of efficiency using DEA.
Estimating Violence and Socioeconomic Development in Colombia 351
123

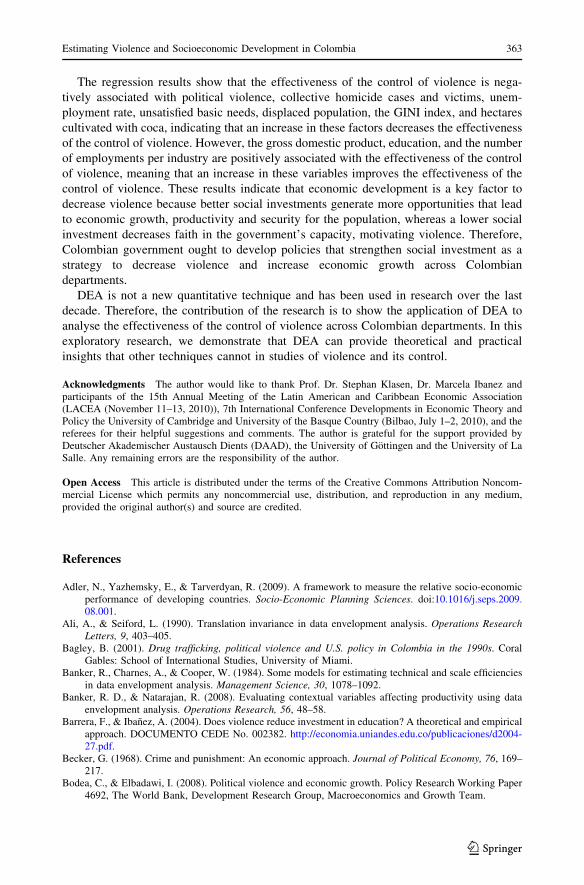
3.2 Data Construction
DEA evaluates the relative efficiency of a set of comparable entities with multiple inputs
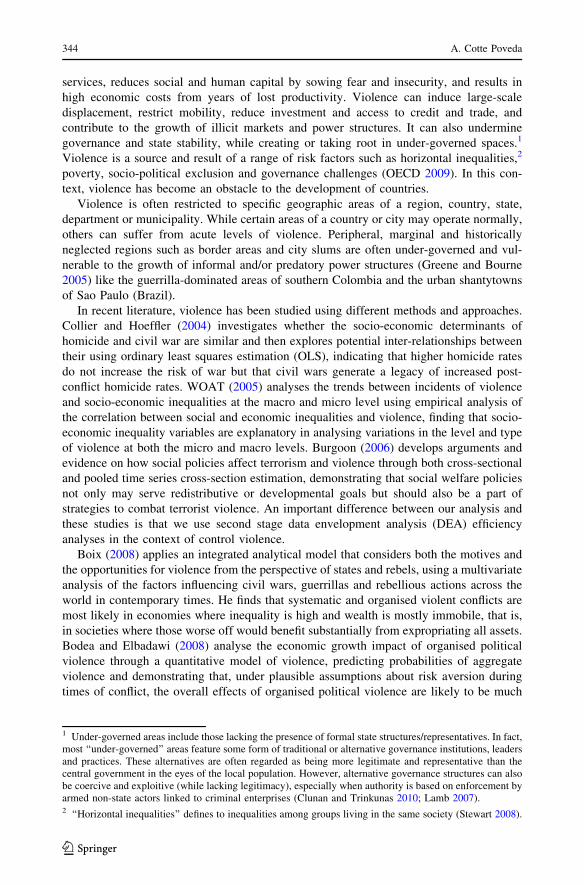
and outputs. In this study, Colombian departments are divided among departments with a
high level of violence, a moderate level of violence and a low level of violence (see Fig. 1)
using k-means clustering (MacQueen 1967), where, given a set of observations (z1, z2, …,
zn), each observation is a d-dimensional real vector, then k-means clustering aims to
partition the n observations into k sets (k \ n) S = {S1, S2, …, Sk} so as to minimise the
within-cluster sum of squares (see Eq. 3). K-means clustering analysis uses the variables
homicide rates, population and gross domestic product for each department.
arg min sXk
i¼1
X
zj2Si
zj
�� � �xik2 ð3Þ
where �xi is the mean of Si.
The data of Colombian departments come from the National Police of Colombia, the
Colombian defence ministry, the DNP (National Planning Department), and the Colombian
finance and public credit ministry. Input variables as desirable outputs are measured as
kilograms of confiscated drugs by department, budget execution as public expenditure
executed by year in Colombian departments, measured as pesos in the year 2000, the
number of captures or apprehensions by department, and the number of policeman by
department. Output variables as undesirable attributes are measured as the number of
homicides, kidnapping and robberies by department.
4 Comparing the Effectiveness of the Control of Violence in ColombianDepartments Using DEA
First of all, we examine the traditional measure of violence by computing the homicide
rates per 100,000 in the population. The average homicide rates of Colombian departments
during this period were 49.78 homicides per 100,000 in the population. The average
homicide rates increased over 2001–2002 and declined thereafter as a consequence of the
fractured institutions generated during and after peace negotiations made by the Pastrana
government, where the end stage of the negotiation process was particularly violent and
thus increased the homicide rates. The departments with the highest homicide rates are
Arauca and Guaviare (more than 100 homicides per 100,000 in the population), whereas
Amazonas and San Andres have the lowest homicide rates (less than 15 homicides per
100,000 in the population).
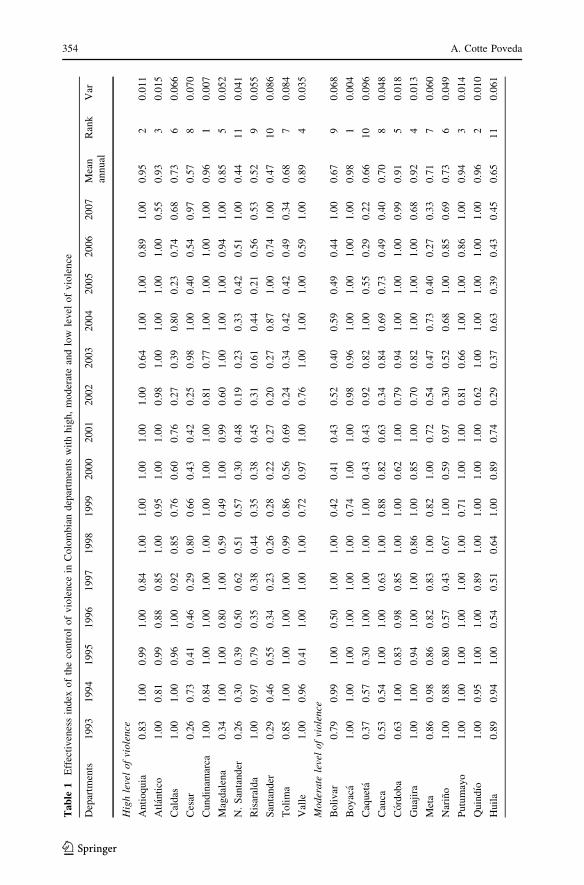
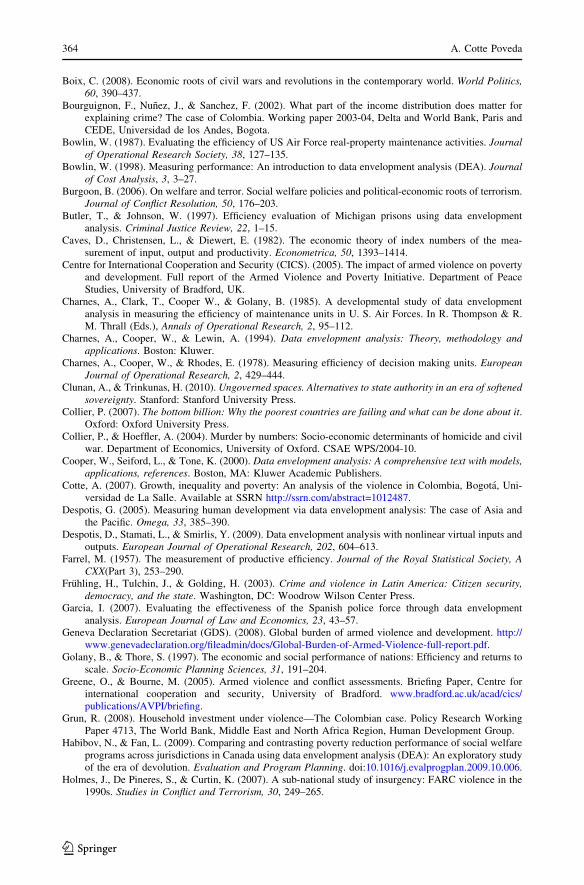
The resulting efficiency scores of Colombian departments regarding the effectiveness of
the control of violence are indicated in Table 1 and Fig. 2. Note that the listed efficiencies
should be viewed relative to the best-performing department (departments). The departments
were ranked taking into account the criterion based on the frequency with which an effective
unit appears as a referent for ineffective ones. Two columns added on the right of the table
provide results for the stability of each departments DEA ranking. These two columns show
the mean efficiency rating and variance over the evaluations. These columns exhibit highly
stable results for efficiency scores; several departments have very low variance. The results of
our analysis show that the effectiveness of the control of violence is on average 73% for
departments with a high level of violence, 80% for departments with a middle level of
violence and 72% for departments with a low level of violence, indicating that departments
352 A. Cotte Poveda
123

with a middle level of violence show the best performance, while departments with a low
level of violence show the worst performance in the control of violence.
In the departments with a high level of violence, the effectiveness score ranges from
0.26 to 1.00. The majority of departments show improvement in their effectiveness scores
except for Atlantico, Caldas, Risaralda and Tolima. The departments with the best
Fig. 1 Distribution of violence in Colombia by departments
Estimating Violence and Socioeconomic Development in Colombia 353
123
Ta
ble
1E
ffec
tiv
enes
sin
dex
of
the
con
tro
lo
fv
iole
nce
inC
olo
mb
ian
dep
artm
ents
wit
hh
igh
,m
od
erat
ean
dlo
wle
vel
of
vio
len
ce
Dep
artm
ents
19
93
19
94
19
95
19
96
19
97
19
98
19
99
20
00
20
01
20
02
20
03
20
04
20
05
20
06
20
07
Mea
nan
nu
alR
ank
Var
Hig
hle
vel
of
vio
len
ce
An
tio
qu
ia0
.83
1.0
00
.99
1.0
00
.84
1.0
01
.00
1.0
01
.00
1.0
00
.64
1.0
01
.00
0.8
91
.00
0.9
52
0.0
11
Atl
anti
co1
.00
0.8
10
.99
0.8
80
.85
1.0
00
.95
1.0
01
.00
0.9
81
.00
1.0
01
.00
1.0
00
.55
0.9
33
0.0
15
Cal
das
1.0
01
.00
0.9
61
.00
0.9
20
.85
0.7
60
.60
0.7
60
.27
0.3
90
.80
0.2
30
.74
0.6
80
.73
60
.06
6
Ces
ar0
.26
0.7
30
.41
0.4
60
.29
0.8
00
.66
0.4
30
.42
0.2
50
.98
1.0
00
.40
0.5
40
.97
0.5
78
0.0
70
Cun
din
amar
ca1
.00
0.8
41
.00
1.0
01
.00
1.0
01
.00
1.0
01
.00
0.8
10
.77
1.0
01
.00
1.0
01
.00
0.9
61
0.0
07
Mag
dal
ena
0.3
41
.00
1.0
00
.80
1.0
00
.59
0.4
91
.00
0.9
90
.60
1.0
01
.00
1.0
00
.94
1.0
00
.85
50
.05
2
N.
San
tan
der
0.2
60
.30
0.3
90
.50
0.6
20
.51
0.5
70
.30
0.4
80
.19
0.2
30
.33
0.4
20
.51
1.0
00
.44
11
0.0
41
Ris
aral
da
1.0
00
.97
0.7
90
.35
0.3
80
.44
0.3
50
.38
0.4
50
.31
0.6
10
.44
0.2
10
.56
0.5
30
.52
90
.05
5
San
tan
der
0.2
90
.46
0.5
50
.34
0.2
30
.26
0.2
80
.22
0.2
70
.20
0.2
70
.87
1.0
00
.74
1.0
00
.47
10
0.0
86
To
lim
a0
.85
1.0
01
.00
1.0
01
.00
0.9
90
.86
0.5
60
.69
0.2
40
.34
0.4
20
.42
0.4
90
.34
0.6
87
0.0
84
Val
le1
.00
0.9
60
.41
1.0
01
.00
1.0
00
.72
0.9
71
.00
0.7
61
.00
1.0
01
.00
0.5
91
.00
0.8
94
0.0
35
Mo
der
ate
leve
lo
fvi
ole
nce
Boli
var
0.7
90
.99
1.0
00
.50
1.0
01
.00
0.4
20
.41
0.4
30
.52
0.4
00
.59
0.4
90
.44
1.0
00
.67
90
.06
8
Boy
aca
1.0
01
.00
1.0
01
.00
1.0
01
.00
0.7
41
.00
1.0
00
.98
0.9
61
.00
1.0
01
.00
1.0
00
.98
10
.00
4
Caq
uet
a0
.37
0.5
70
.30
1.0
01
.00
1.0
01
.00
0.4
30
.43
0.9
20
.82
1.0
00
.55
0.2
90
.22
0.6
61
00
.09
6
Cau
ca0
.53
0.5
41
.00
1.0
00
.63
1.0
00
.88
0.8
20
.63
0.3
40
.84
0.6
90
.73
0.4
90
.40
0.7
08
0.0
48
Cord
ob
a0
.63
1.0
00
.83
0.9
80
.85
1.0
01
.00
0.6
21
.00
0.7
90
.94
1.0
01
.00
1.0
00
.99
0.9
15
0.0
18
Gu
ajir
a1
.00
1.0
00
.94
1.0
01
.00
0.8
61
.00
0.8
51
.00
0.7
00
.82
1.0
01
.00
1.0
00
.68
0.9
24
0.0
13
Met
a0
.86
0.9
80
.86
0.8
20
.83
1.0
00
.82
1.0
00
.72
0.5
40
.47
0.7
30
.40
0.2
70
.33
0.7
17
0.0
60
Nar
ino
1.0
00
.88
0.8
00
.57
0.4
30
.67
1.0
00
.59
0.9
70
.30
0.5
20
.68
1.0
00
.85
0.6
90
.73
60
.04
9
Pu
tum
ayo
1.0
01
.00
1.0
01
.00
1.0
01
.00
0.7
11
.00
1.0
00
.81
0.6
61
.00
1.0
00
.86
1.0
00
.94
30
.01
4
Qu
ind
ıo1
.00
0.9
51
.00
1.0
00
.89
1.0
01
.00
1.0
01
.00
0.6
21
.00
1.0
01
.00
1.0
01
.00
0.9
62
0.0
10
Hu
ila
0.8
90
.94
1.0
00
.54
0.5
10
.64
1.0
00
.89
0.7
40
.29
0.3
70
.63
0.3
90
.43
0.4
50
.65
11
0.0
61
354 A. Cotte Poveda
123

Ta
ble
1co
nti
nu
ed
Dep
artm
ents
19
93
19
94
19
95
19
96
19
97
19
98
19
99
20
00
20
01
20
02
20
03
20
04
20
05
20
06
20
07
Mea
nan
nu
alR
ank
Var
Lo
wle
vel
of
vio
len
ce
Am
azon
as1
.00
1.0
01
.00
1.0
00
.43
1.0
01
.00
0.7
61
.00
0.8
20
.49
1.0
00
.67
1.0
00
.71
0.8
63
0.0
41
Ara
uca
0.3
80
.42
0.3
00
.37
0.5
50
.37
0.5
91
.00
0.2
80
.38
0.4
30
.97
1.0
00
.38
0.3
60
.52
80
.06
6
Cas
anar
e0
.40
0.5
00
.32
0.7
20
.70
0.2
50
.09
0.3
60
.32
0.4
80
.49
0.7
21
.00
0.4
50
.78
0.5
19
0.0
57
Cho
co0
.42
0.4
80
.20
0.3
70
.18
0.1
60
.08
0.2
30
.38
0.4
50
.45
0.5
20
.49
0.8
21
.00
0.4
21
00
.06
0
Gu
ain
ıa0
.83
0.9
91
.00
1.0
01
.00
1.0
01
.00
1.0
01
.00
1.0
01
.00
1.0
01
.00
1.0
01
.00
0.9
91
0.0
02
Gu
avia
re0
.76
1.0
00
.94
1.0
01
.00
0.4
40
.32
1.0
01
.00
0.5
40
.86
1.0
00
.98
0.4
60
.56
0.7
95
0.0
64
San
An
dre
s1
.00
1.0
01
.00
1.0
01
.00
0.8
60
.73
0.9
71
.00
1.0
00
.59
0.8
10
.99
1.0
00
.86
0.9
22
0.0
16
Su
cre
0.3
00
.26
0.2
10
.39
0.2
00
.58
0.4
30
.40
0.5
00
.61
0.6
81
.00
1.0
00
.65
0.9
50
.54
70
.07
5
Vau
pes
0.4
20
.87
0.4
01
.00
1.0
00
.17
1.0
01
.00
1.0
00
.98
1.0
01
.00
0.7
71
.00
1.0
00
.84
40
.07
7
Vic
had
a0
.33
1.0
01
.00
1.0
00
.78
0.3
20
.74
0.9
91
.00
0.6
00
.75
1.0
01
.00
0.2
41
.00
0.7
86
0.0
80
Estimating Violence and Socioeconomic Development in Colombia 355
123

Fig. 2 Results of DEA for Colombian departments. Note: The larger symbols represent values for 1993whereas the small represent values for 2007. The arrows indicate, in a schematic way, the change in eachdepartment
356 A. Cotte Poveda
123

performance are Cundinamarca, Antioquia and Valle, while North of Santander, Santander
and Risaralda show the worst performance during the sample period.
In the departments with a moderate level of violence, the effectiveness score ranges
from 0.22 to 1.00. The majority of departments show an improvement in their effectiveness
scores except for Bolivar, Cordoba, Guajira, Meta, Narino and Huila. The departments
with the best performance are Boyaca, Quindıo and Putumayo, while Bolivar, Caqueta and
Huila show the worst performance during the sample period.
In the departments with a low level of violence, the effectiveness score ranges from 0.08
to 1.00. The majority of departments show an improvement in their effectiveness scores
except for Amazonas, and San Andres. The departments with the best performance are
Guainıa and San Andres, while Choco, Casanare, and Arauca show the worst performance
during the sample period.
5 Explaining Inter-department Variations in Effectivenessof the Control of Violence
The results show variation across Colombian departments, indicating that each situation of
violence features its particular unique mix of drivers, dynamics and effects. Any external
intervention must be sensitive to the context in which armed violence occurs. Despite their
unique characteristics, however, most situations of violence also share a number of
common underlying structural and proximate risk factors.
Structural risk factors include social, political and economic inequalities/exclusion;
systemic unemployment and underemployment; rising perceptions of economic depriva-
tion or grievances; rising expectations in the face of limited or non-existent opportunities;
weak or problematic governance (including impunity in the judicial system and an inef-
fective criminal justice system, public security failure, corruption, penetration by organised
crime and illicit markets, insufficient investments in social policies and programming,
under-governed spaces and other deficits that compromise effective, impartial gover-
nance); resource scarcity and competition; rapid and unregulated urbanisation and limited
education and employment opportunities (GDS 2008). In this study, to analysis these
factors, we include the following variables: political violence, collective homicide, col-
lective homicide victims, gross domestic product, education, unemployment rate, unsat-
isfied basic needs, GINI, and employments per industry.
Proximate risk factors include sharp economic shocks; natural (and human-induced)
disasters such as drought; easy access to alcohol, narcotics, and small arms; and fresh
exposure to past violence (WHO 2002). In this factor, we include the following variables:
displaced population and hectares cultivated with coca.
To explain the observed variation of the effectiveness of the control of violence and
structural and proximate risk factors across Colombian departments during our sample
period, we employ regression analysis. The measures of effectiveness estimated (SE) in
this paper are used as dependent variables in the various regression models and include
different structural and proximate risk factors. The multiple regression for effectiveness of
the control of violence is estimated using the Maximum likelihood estimation (MLE),6
6 This study uses MLE because it is generally the most efficient estimation procedure in the class ofestimators that use information on the distribution of the endogenous variables given the exogenous vari-ables (Wooldridge 2001). Moreover, the results of Hausman Test indicated that random effect is the bestmodel in the case of our empirical analysis.
Estimating Violence and Socioeconomic Development in Colombia 357
123

which is the appropriate method to use in two-stage procedures where DEA is the stage 1
and MLE is the stage 2 which produces consistent estimators (Banker and Natarajan 2008;
McDonald 2009). The structural equation in the MLE is:
li ¼1
2
�1
r2e
XTi
t¼1ðyit � xitbÞ2 �
r2u
Tir2u þ r2
e
XTi
t¼1ðyit � xitbÞ
n o2� �
þ ln Tir2
u
r2e
þ 1
� �þ Ti ln 2pr2
e
�ð4Þ
The models used in this study are as follows:
The control of violence in Colombian Departments with high level of violence
DSEit ¼ c0 þ c1 � PVit þ c2 � GDPit þ c3 � UEit þ c4 � EDUit þ c5 � UBNit
þ c6 � HCCit þ c7 � DPit þ c8 � GINIit ð5Þ
The control of violence in Departments with middle level of violence
DSEit ¼ c0 þ c1 � EDUit þ c2 � UBNit þ c3 � PVit þ c4 � GINIit þ c5 � HCCit þ c6 � EIit
þ c7 � UEit þ c8 � DPit ð6Þ
The control of violence in Departments with low level of violence
DSEit ¼ c0 þ c1 � GDPit þ c2 � EDUit þ c3 � UEit þ c4 � UBNit þ c5 � CHit
þ c6 � HCCit þ c7 � EIit þ c8 � DPit ð7Þ
The control of violence in whole Colombian Departments
DSEit ¼ c0 þ c1 � PVit þ c2 � GDPit þ c3 � EDUit þ c4 � UEit þ c5 � UBNit
þ c6 � HCCit þ c7 � DPit þ c8 � GINIit ð8Þ
Note that SEit is the DEA score measuring the effectiveness of the control of violence in
the period t for the department i; PVit is the political violence, measured as the number of
political homicides in the period t for the department i; GDPit is the aggregate-level
production per capita by department; UEit is the unemployment rate by department; EDUit
is coverage education by department; UBNit is the level of unsatisfied basic needs by
department; HCCit is the hectares cultivated with coca by department DPit is the displaced
population by department; GINit is the coefficient of the Gini index in period t for
department; EIit is the number of employments by industry by department; and CHit is the
collective homicides by department.
The results from the MLE models are reported in Tables 2, 3, 4 and 5. As expected,
political violence has a negative influence on the effectiveness of the control of violence
and is significant, indicating that higher politic violence lower the effectiveness of the
control of violence. This result concurs with Adler et al. (2009) and Collier (2007), which
show that political violence leads to the destruction of human lives and economic assets
and stops the accumulation of capital and wealth. These studies provide evidence that
insecurity and instability in conflict and post-conflict countries create long-term devel-
opmental difficulties.
The GDP variable has a positive and significant coefficient, implying that departments
with higher GDP may experience higher effectiveness in the control of violence, which
concurs with Holmes et al. (2002), indicating that in Colombia, guerrilla and paramilitary
358 A. Cotte Poveda
123

Table 2 Results of MLE regressions for explaining effectiveness of the control of violence in ColombianDepartments with high level of violence
Parameter [1] [2] [3] [4] [5]
Constant 1.509***(0.168)
1.791***(0.583)
1.685***(0.562)
1.936***(0.653)
1.950***(0.669)
Political violence -0.029*(0.015)
-0.028*(0.015)
-0.028*(0.015)
-0.019(0.015)
-0.018(0.015)
GDP 3.18e-08***(9.68e-09)
3.04e-08***(9.46e-09)
3.29e-08***(9.20e-09)
3.93e-08***(1.11e-08)
4.01e-08***(1.35e-08)
Unemployment rate -0.268***(0.061)
-0.286***(0.068)
-0.283***(0.068)
-0.210***(0.071)
-0.210***(0.071)
Education 0.201***(0.073)
0.210***(0.079)
0.224***(0.076)
0.237***(0.077)
0.233***(0.084)
Unsatisfied basicneeds
-0.062(0.130)
-0.034(0.125)
-0.0002(0.148)
-0.012(0.186)
Hectares cultivatedwith coca
-0.00001(0.00001)
-6.38e-06(0.00001)
-6.30e-06(0.00001)
Displacedpopulation
-0.068***(0.025)
-0.069**(0.027)
GINI -0.095(0.895)
No. obs 158 158 158 158 158
Notes: Figures in the parentheses are standard error
* Significant at the 10% level, ** Significant at the 5% level and *** Significant at the 1% level
Table 3 Results of MLE regressions for explaining effectiveness of the control of violence in ColombianDepartments with middle level of violence
Parameter [1] [2] [3] [4] [5]
Constant 0.714***(0.159)
0.701***(0.165)
0.850***(0.225)
0.844***(0.189)
0.821***(0.191)
Education 0.004(0.005)
0.004(0.005)
0.006(0.005)
0.056(0.057)
0.051(0.057)
Unsatisfied basic needs -0.0003(0.001)
-0.0002(0.001)
-0.001(0.002)
-0.002(0.002)
-0.001(0.002)
Political violence -0.0009***(0.0003)
-0.0008***(0.0003)
-0.0009***(0.0003)
GINI -0.231(0.186)
-0.247(0.194)
-0.062(0.242)
Hectares cultivatedwith coca
-8.65e-07(3.23e-06)
-5.60e-06(4.40e-06)
Employments perindustry
0.0005(0.0007)
0.0005(0.001)
0.0004(0.001)
Unemployment rate -0.001(0.006)
-0.0002(0.006)
Displaced population -3.53e-06(3.27e-06)
No. obs 165 165 150 126 126
Notes: Figures in the parentheses are standard error
* Significant at the 10% level, ** Significant at the 5% level and *** Significant at the 1% level
Estimating Violence and Socioeconomic Development in Colombia 359
123
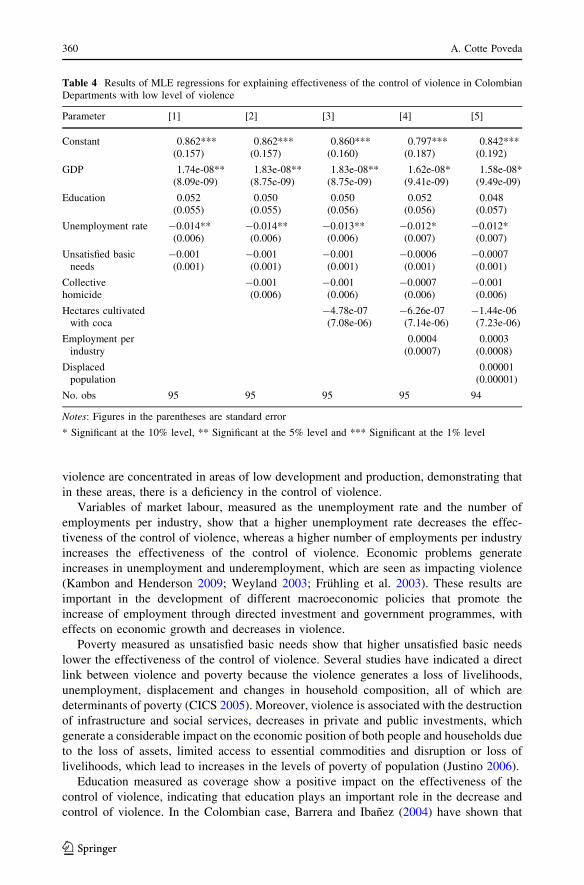
violence are concentrated in areas of low development and production, demonstrating that
in these areas, there is a deficiency in the control of violence.
Variables of market labour, measured as the unemployment rate and the number of
employments per industry, show that a higher unemployment rate decreases the effec-
tiveness of the control of violence, whereas a higher number of employments per industry
increases the effectiveness of the control of violence. Economic problems generate
increases in unemployment and underemployment, which are seen as impacting violence
(Kambon and Henderson 2009; Weyland 2003; Fruhling et al. 2003). These results are
important in the development of different macroeconomic policies that promote the
increase of employment through directed investment and government programmes, with
effects on economic growth and decreases in violence.
Poverty measured as unsatisfied basic needs show that higher unsatisfied basic needs
lower the effectiveness of the control of violence. Several studies have indicated a direct
link between violence and poverty because the violence generates a loss of livelihoods,
unemployment, displacement and changes in household composition, all of which are
determinants of poverty (CICS 2005). Moreover, violence is associated with the destruction
of infrastructure and social services, decreases in private and public investments, which
generate a considerable impact on the economic position of both people and households due
to the loss of assets, limited access to essential commodities and disruption or loss of
livelihoods, which lead to increases in the levels of poverty of population (Justino 2006).
Education measured as coverage show a positive impact on the effectiveness of the
control of violence, indicating that education plays an important role in the decrease and
control of violence. In the Colombian case, Barrera and Ibanez (2004) have shown that
Table 4 Results of MLE regressions for explaining effectiveness of the control of violence in ColombianDepartments with low level of violence
Parameter [1] [2] [3] [4] [5]
Constant 0.862***(0.157)
0.862***(0.157)
0.860***(0.160)
0.797***(0.187)
0.842***(0.192)
GDP 1.74e-08**(8.09e-09)
1.83e-08**(8.75e-09)
1.83e-08**(8.75e-09)
1.62e-08*(9.41e-09)
1.58e-08*(9.49e-09)
Education 0.052(0.055)
0.050(0.055)
0.050(0.056)
0.052(0.056)
0.048(0.057)
Unemployment rate -0.014**(0.006)
-0.014**(0.006)
-0.013**(0.006)
-0.012*(0.007)
-0.012*(0.007)
Unsatisfied basicneeds
-0.001(0.001)
-0.001(0.001)
-0.001(0.001)
-0.0006(0.001)
-0.0007(0.001)
Collectivehomicide
-0.001(0.006)
-0.001(0.006)
-0.0007(0.006)
-0.001(0.006)
Hectares cultivatedwith coca
-4.78e-07(7.08e-06)
-6.26e-07(7.14e-06)
-1.44e-06(7.23e-06)
Employment perindustry
0.0004(0.0007)
0.0003(0.0008)
Displacedpopulation
0.00001(0.00001)
No. obs 95 95 95 95 94
Notes: Figures in the parentheses are standard error
* Significant at the 10% level, ** Significant at the 5% level and *** Significant at the 1% level
360 A. Cotte Poveda
123

another economic cost of violence is the decrease of the human capital stock by the
reduction in investments in human capital.
Another factor analysed is the displaced population, which shows a negative and sig-
nificant coefficient, implying that departments with a higher displaced population show
lower effectiveness in the control of violence. This result concurs with Kirchhoff and
Ibanez’s (2001) demonstration of the role of violence and perceptions of insecurity in the
displaced population in the Colombian context. Moreover, the data on displacement show
that violence, armed conflict, drug trafficking and the search for better living conditions
have generated a displacement of population in recent decades (UN 2006).
The results of the Gini index indicate that higher inequality in land ownership generates
a lower effectiveness of the control of violence. In Colombia, violence is considered the
important development limitation that affects economic growth and productivity and
decreases the government’s capacity to reduce inequality and the exclusion of the rural and
urban populations. Likewise, at the institutional level, it generates both high levels of
impunity within the justice system and a lack of social investments (WB 2000).
Hectares cultivated with coca have a negative coefficient, indicating that a lower area
cultivated with coca leads to a higher effectiveness of the control of violence. The increase
of drug production and trafficking in recent decades in Colombia has intensified guerrilla
and paramilitary violence and has worsened political and economic conditions in the
country. Likewise, poverty in the countryside and a lack of government control in many
areas have allowed the increase of drug production, generating violence in the different
Colombian regions (UN 2006; Bagley 2001).
Table 5 Results of MLE regressions for explaining effectiveness of the control of violence in ColombianDepartments
Parameter [1] [2] [3] [4] [5]
Constant 0.995***(0.111)
1.546***(0.477)
1.416***(0.480)
1.637***(0.463)
1.575***(0.471)
Political violence -0.030**(0.012)
-0.030**(0.012)
-0.026**(0.012)
-0.015(0.012)
-0.015(0.012)
GDP 3.41e-08***(1.10e-08)
2.90e-08**(1.14e-08)
3.06e-08***(1.14e-08)
4.08e-08***(1.13e-08)
4.29e-08***(1.17e-08)
Education 0.048(0.040)
0.058(0.040)
0.061(0.039)
0.067*(0.037)
0.066*(0.037)
Unemployment rate -0.101**(0.045)
-0.124**(0.049)
-0.118**(0.049)
-0.065(0.049)
-0.062(0.049)
Unsatisfied basic needs -0.127(0.106)
-0.097(0.107)
-0.046(0.103)
-0.050(0.103)
Hectares cultivated withcoca
-8.19e-06*(4.82e-06)
-4.16e-06(4.80e-06)
-4.38e-06(4.80e-06)
Displaced population -0.070***(0.018)
-0.071***(0.018)
GINI -0.207(0.338)
No. obs 293 293 293 293 293
Notes: Figures in the parentheses are standard error
* Significant at the 10% level, ** Significant at the 5% level and *** Significant at the 1% level
Estimating Violence and Socioeconomic Development in Colombia 361
123

Collective homicides have a negative coefficient, implying that departments with higher
number of collective homicides experience a lower effectiveness of the control of violence.
Restrepo et al. (2003) show that several large collective homicide cases in Colombia have
occurred in regions where the degree of institutional development is precarious and the
extent of government military operations is constrained by a lack of material resources and
difficulties of geography.
In Colombian departments with high level of violence, GDP and education have
positive effects on effectiveness of control of violence, whereas political violence,
unemployment rate, unsatisfied basic needs, hectares cultivated with coca, displaced
population and GINI have negative effects on effectiveness of control of violence. The
main variables that determined an effectiveness of control of violence are GDP, unem-
ployment rate, education and displaced population.
In Colombian departments with middle level of violence, education and employments
per industry have positive effects on effectiveness of control of violence, whereas unsat-
isfied basic needs, political violence, GINI, hectares cultivated with coca, unemployment
rate and displaced population have negative effects on effectiveness of control of violence.
The main variable that determined an effectiveness of control of violence is political
violence, whereas the other variables have not statistically significant effects.
In Colombian departments with low level of violence, GDP, education and employ-
ment per industry have positive effects on effectiveness of control of violence, whereas
unemployment rate, unsatisfied basic needs, collective homicides, hectares cultivated with
coca and displaced population have negative effects on effectiveness of control of violence.
The main variable that determined an effectiveness of control of violence are GDP and
unemployment rate, whereas the other variables have not statistically significant effects.
In whole Colombian departments, GDP and education have positive effects on effec-
tiveness of control of violence, whereas unemployment rate, political violence, unsatisfied
basic needs, hectares cultivated with coca, displaced population and GINI have negative
effects on effectiveness of control of violence. The main variable that determined an
effectiveness of control of violence are GDP, political violence, unemployment rate, and
displaced population.
All of the findings of this paper are of particular interest for the formulation and
development of policies against violence, taking into account that organised forms of
violence, such as drug trafficking, corrupt and impede an adequate administration of jus-
tice. Moreover, violence decreases social investments, generating alterations in services
such as health, police, and education, which in the long run lead to a deterioration of faith
in the government’s capacity, which should become an incentive to further violence.
6 Conclusions
In this paper, the effectiveness of the control of violence in 32 Colombian departments was
compared using DEA with 7 performance attributes. Using panel data from 1993 to 2007,
we find that there exist considerable differences in the effectiveness of the control of
violence across Colombian departments. The results of DEA analysis indicate that the
effectiveness of the control of violence is on average 73% for departments with a high level
of violence, 80% for departments with a middle level of violence and 72% for departments
with a low level of violence, indicating that departments with a middle level of violence
show the best performance, whereas departments with a low level of violence show the
worst performance in the control violence.
362 A. Cotte Poveda
123
The regression results show that the effectiveness of the control of violence is nega-
tively associated with political violence, collective homicide cases and victims, unem-
ployment rate, unsatisfied basic needs, displaced population, the GINI index, and hectares
cultivated with coca, indicating that an increase in these factors decreases the effectiveness
of the control of violence. However, the gross domestic product, education, and the number
of employments per industry are positively associated with the effectiveness of the control
of violence, meaning that an increase in these variables improves the effectiveness of the
control of violence. These results indicate that economic development is a key factor to
decrease violence because better social investments generate more opportunities that lead
to economic growth, productivity and security for the population, whereas a lower social
investment decreases faith in the government’s capacity, motivating violence. Therefore,
Colombian government ought to develop policies that strengthen social investment as a
strategy to decrease violence and increase economic growth across Colombian
departments.
DEA is not a new quantitative technique and has been used in research over the last
decade. Therefore, the contribution of the research is to show the application of DEA to
analyse the effectiveness of the control of violence across Colombian departments. In this
exploratory research, we demonstrate that DEA can provide theoretical and practical
insights that other techniques cannot in studies of violence and its control.
Acknowledgments The author would like to thank Prof. Dr. Stephan Klasen, Dr. Marcela Ibanez andparticipants of the 15th Annual Meeting of the Latin American and Caribbean Economic Association(LACEA (November 11–13, 2010)), 7th International Conference Developments in Economic Theory andPolicy the University of Cambridge and University of the Basque Country (Bilbao, July 1–2, 2010), and thereferees for their helpful suggestions and comments. The author is grateful for the support provided byDeutscher Akademischer Austausch Dients (DAAD), the University of Gottingen and the University of LaSalle. Any remaining errors are the responsibility of the author.
Open Access This article is distributed under the terms of the Creative Commons Attribution Noncom-mercial License which permits any noncommercial use, distribution, and reproduction in any medium,provided the original author(s) and source are credited.
References
Adler, N., Yazhemsky, E., & Tarverdyan, R. (2009). A framework to measure the relative socio-economicperformance of developing countries. Socio-Economic Planning Sciences. doi:10.1016/j.seps.2009.08.001.
Ali, A., & Seiford, L. (1990). Translation invariance in data envelopment analysis. Operations ResearchLetters, 9, 403–405.
Bagley, B. (2001). Drug trafficking, political violence and U.S. policy in Colombia in the 1990s. CoralGables: School of International Studies, University of Miami.
Banker, R., Charnes, A., & Cooper, W. (1984). Some models for estimating technical and scale efficienciesin data envelopment analysis. Management Science, 30, 1078–1092.
Banker, R. D., & Natarajan, R. (2008). Evaluating contextual variables affecting productivity using dataenvelopment analysis. Operations Research, 56, 48–58.
Barrera, F., & Ibanez, A. (2004). Does violence reduce investment in education? A theoretical and empiricalapproach. DOCUMENTO CEDE No. 002382. http://economia.uniandes.edu.co/publicaciones/d2004-27.pdf.
Becker, G. (1968). Crime and punishment: An economic approach. Journal of Political Economy, 76, 169–217.
Bodea, C., & Elbadawi, I. (2008). Political violence and economic growth. Policy Research Working Paper4692, The World Bank, Development Research Group, Macroeconomics and Growth Team.
Estimating Violence and Socioeconomic Development in Colombia 363
123
Boix, C. (2008). Economic roots of civil wars and revolutions in the contemporary world. World Politics,60, 390–437.
Bourguignon, F., Nunez, J., & Sanchez, F. (2002). What part of the income distribution does matter forexplaining crime? The case of Colombia. Working paper 2003-04, Delta and World Bank, Paris andCEDE, Universidad de los Andes, Bogota.
Bowlin, W. (1987). Evaluating the efficiency of US Air Force real-property maintenance activities. Journalof Operational Research Society, 38, 127–135.
Bowlin, W. (1998). Measuring performance: An introduction to data envelopment analysis (DEA). Journalof Cost Analysis, 3, 3–27.
Burgoon, B. (2006). On welfare and terror. Social welfare policies and political-economic roots of terrorism.Journal of Conflict Resolution, 50, 176–203.
Butler, T., & Johnson, W. (1997). Efficiency evaluation of Michigan prisons using data envelopmentanalysis. Criminal Justice Review, 22, 1–15.
Caves, D., Christensen, L., & Diewert, E. (1982). The economic theory of index numbers of the mea-surement of input, output and productivity. Econometrica, 50, 1393–1414.
Centre for International Cooperation and Security (CICS). (2005). The impact of armed violence on povertyand development. Full report of the Armed Violence and Poverty Initiative. Department of PeaceStudies, University of Bradford, UK.
Charnes, A., Clark, T., Cooper W., & Golany, B. (1985). A developmental study of data envelopmentanalysis in measuring the efficiency of maintenance units in U. S. Air Forces. In R. Thompson & R.M. Thrall (Eds.), Annals of Operational Research, 2, 95–112.
Charnes, A., Cooper, W., & Lewin, A. (1994). Data envelopment analysis: Theory, methodology andapplications. Boston: Kluwer.
Charnes, A., Cooper, W., & Rhodes, E. (1978). Measuring efficiency of decision making units. EuropeanJournal of Operational Research, 2, 429–444.
Clunan, A., & Trinkunas, H. (2010). Ungoverned spaces. Alternatives to state authority in an era of softenedsovereignty. Stanford: Stanford University Press.
Collier, P. (2007). The bottom billion: Why the poorest countries are failing and what can be done about it.Oxford: Oxford University Press.
Collier, P., & Hoeffler, A. (2004). Murder by numbers: Socio-economic determinants of homicide and civilwar. Department of Economics, University of Oxford. CSAE WPS/2004-10.
Cooper, W., Seiford, L., & Tone, K. (2000). Data envelopment analysis: A comprehensive text with models,applications, references. Boston, MA: Kluwer Academic Publishers.
Cotte, A. (2007). Growth, inequality and poverty: An analysis of the violence in Colombia, Bogota, Uni-versidad de La Salle. Available at SSRN http://ssrn.com/abstract=1012487.
Despotis, G. (2005). Measuring human development via data envelopment analysis: The case of Asia andthe Pacific. Omega, 33, 385–390.
Despotis, D., Stamati, L., & Smirlis, Y. (2009). Data envelopment analysis with nonlinear virtual inputs andoutputs. European Journal of Operational Research, 202, 604–613.
Farrel, M. (1957). The measurement of productive efficiency. Journal of the Royal Statistical Society, ACXX(Part 3), 253–290.
Fruhling, H., Tulchin, J., & Golding, H. (2003). Crime and violence in Latin America: Citizen security,democracy, and the state. Washington, DC: Woodrow Wilson Center Press.
Garcia, I. (2007). Evaluating the effectiveness of the Spanish police force through data envelopmentanalysis. European Journal of Law and Economics, 23, 43–57.
Geneva Declaration Secretariat (GDS). (2008). Global burden of armed violence and development. http://www.genevadeclaration.org/fileadmin/docs/Global-Burden-of-Armed-Violence-full-report.pdf.
Golany, B., & Thore, S. (1997). The economic and social performance of nations: Efficiency and returns toscale. Socio-Economic Planning Sciences, 31, 191–204.
Greene, O., & Bourne, M. (2005). Armed violence and conflict assessments. Briefing Paper, Centre forinternational cooperation and security, University of Bradford. www.bradford.ac.uk/acad/cics/publications/AVPI/briefing.
Grun, R. (2008). Household investment under violence—The Colombian case. Policy Research WorkingPaper 4713, The World Bank, Middle East and North Africa Region, Human Development Group.
Habibov, N., & Fan, L. (2009). Comparing and contrasting poverty reduction performance of social welfareprograms across jurisdictions in Canada using data envelopment analysis (DEA): An exploratory studyof the era of devolution. Evaluation and Program Planning. doi:10.1016/j.evalprogplan.2009.10.006.
Holmes, J., De Pineres, S., & Curtin, K. (2007). A sub-national study of insurgency: FARC violence in the1990s. Studies in Conflict and Terrorism, 30, 249–265.
364 A. Cotte Poveda
123

Holmes, J., Gutierrez, S., & Curtin, K. (2002). Drugs, violence and development in Colombia: A departmentlevel analysis. University of Texas at Dallas, Latin American Politics and Society.
Justino, P. (2006). On the links between violent conflict and chronic poverty: How much do we really know?Institute of Development Studies, at the University of Sussex. Chronic Poverty Research Centre. CPRCWorking Paper 61.
Kambon, A., & Henderson, G. (2009). Exploring policy linkages between poverty, crime and violence: Alook at three Caribbean states. Economic Comission for Latin American and the Caribbean, Studiesand Perspectives Series, United Nations publication.
Kenneth, C., Land, C., Lovell, K., & Thore, S. (1994). Productive efficiency under capitalism and statesocialism: An empirical inquiry using chance-constrained data envelopment analysis. TechnologicalForecasting and Social Change, 46, 139–152.
Kirchhoff, S., & Ibanez, A. (2001). Displacement due to violence in Colombia: Determinants and conse-quences at the household level. ZEF—Discussion papers on development policy No. 41.
Lamb, R. (2007). Ungoverned areas and threats from safe havens. Final Report of the Ungoverned AreasProject. Prepared for the Office of the Under Secretary of Defence for Policy.
Lopez, J., Fernandez, S., & Morales, M. (2007). Application of the skill DEA (data envelopment analysis) inthe determination of efficiency of centers of costs of production. Scientia et Technica, 37, 395–400. (InSpanish).
MacQueen, J. (1967). Some methods for classification and analysis of multivariate observations. Pro-ceedings of 5th Berkeley Symposium on Mathematical Statistics and Probability. Berkeley, Universityof California Press, 1, 281–297.
Mahlberg, B., & Obersteiner, M. (2001). Remeasuring the HDI by data envelopement analysis. InterimReport IR-01-069, International Institute for Applied Systems Analysis.
Malul, M., Hadad, Y., & Ben-Yair, A. (2009). Measuring and ranking of economic, environmental andsocial efficiency of countries. International Journal of Social Economics, 36, 832–843.
Martınez, H., Medina, C., & Steiner, R. (2001). Violence, inequality, poverty and drug prohibition inColombia. CEDE, Universidad de Los Andes.
McDonald, J. (2009). Using least squares and tobit in second stage DEA efficiency analyses. EuropeanJournal of Operational Research, 197, 792–798.
Organisation for Economic Co-operation and Development (OECD). (2009). Conflict and fragility armedviolence reduction: Enabling development. www.oecd.org.
Pardo, C. (2009). Energy efficiency development in the German and Colombian energy intensive sectors:A non-parametric analysis. Energy and Sustainability, II, 499–511. WIT Transactions on Ecology andthe Environment.
Pardo, C. (2010). Energy efficiency development in German and Colombian non-energy-intensive sectors:A non-parametric analysis. Energy efficiency. doi:10.1007/s12053-010-9078-2.
Pombo, C., & Taborda, R. (2006). Performance and efficiency in Colombia’s power distribution system:Effects of the 1994 reform. Energy Economics, 28, 339–369.
Raab, R., & Habib, E. (2007). A productivity growth accounting approach to the ranking of developing anddeveloped nations. The International Journal of Accounting, 42, 396–415.
Raab, R., Kotamraju, P., & Haag, S. (2000). Efficient provision of child quality of life in less developedcountries: Conventional development indexes versus a programming approach to development indexes.Socio Economic Planning Sciences, 34, 51–67.
Ramanathan, R. (2003). An introduction to data envelopment analysis: A tool for performance measurement.Thousand Oaks, CA: Sage Publication.
Ramanathan, R. (2006). Evaluating the comparative performance of countries of the Middle East and NorthAfrica: A DEA application. Socio-Economic Planning Sciences, 40, 156–167.
Ray, C. (2004). Data envelopment analysis: Theory and techniques for economics and operations research.Cambridge: Cambridge University Press.
Restrepo, J., Spagat, M., & Vargas, J. (2003). The dynamics of the Colombian civil conflict: A new data set.Royal Holloway University of London Royal. Discussion Papers in Economics No. 03/12.
Restrepo, M., & Villegas, G. (2007). Ranking Colombian research groups applying data envelopmentanalysis. Journal of Engineering faculty of Antioquia University, 42, 105–119. (In Spanish).
Rubio, M. (2001). Violence and conflict in the nineties. Coyuntura Social, 22, May. (In Spanish).Sanchez, F., & Nunez, J. (2001). Determinants of violent crime in a highly violent country: Colombian case.
Documento CEDE 2001-02 (In Spanish).Smith, P. (1997). Model misspecification in data envelopment analysis. Annals of Operations Research, 73,
233–252.Somarriba, N., & Pena, B. (2009). Synthetic indicators of quality of life in Europe. Social Indicators
Research, 94, 115–133.
Estimating Violence and Socioeconomic Development in Colombia 365
123

Stewart, R. (2008). Horizontal inequalities and conflict. Understanding Group Violence in MultiethnicSocieties. London: Palgrave Macmillan.
Sun, S. (2002). Measuring the relative efficiency of police precincts using data envelopment analysis. Socio-Economic Planning Sciences, 36, 51–71.
Tulkens, H., & Eeckaut, V. (1995). Non-parametric efficiency, progress and regress measures for panel data:Methodological aspects. European Journal of Operational Research, 80, 474–499.
United Nations (UN). (2006). Colombia, coca cultivation survey. Office on drugs and crime.www.unodc.org/pdf/andean/Colombia_coca_survey_2005_eng.pdf.
Verma, A., & Gavirneni, S. (2006). Measuring police efficiency in India: An application of data envelop-ment analysis. Policing: An International Journal of Police Strategies and Management, 29, 125–145.
Weyland, K. (2003). Political repercussions of crime and violence in Latin America. An essay for theconference on culture and peace: Violence, politics, and representation in the Americas. University ofTexas at Austin.
Wooldridge, J. (2001). Econometric analysis of cross section and panel data. Cambridge, MA and London,England: The MIT Press.
World Bank (WB). (2000). Violence in Colombia. Building sustainable peace and social capital. WorldBank country studies.
World Health organisation (WHO). (2002). World report on violence and health. http://www.who.int/violence_injury_prevention/violence/world_report/en/Full%20WRVH%20.pdf.
World Organization Against Torture (WOAT). (2005). Poverty, inequality and violence: The economic,social and cultural root causes of violence. A human rights perspective. www.omct.org/pdf/ESCR/.
366 A. Cotte Poveda
123