
Estimating coefficient of consolidation from …...Estimating coefficient of consolidation from...
12
Estimating coefficient of consolidation from piezocone tests P. K. ROBERTSON Civil Engineering Department, University of Alberta, Edmonton, Alta., Canada T6G 2G7 J. P. SULLY INTE VEP S.A., Caracas, Venezuela D. J. WOELLER Conetec Investigations Ltd., Unit 3, 9113 Shaughnessy Street, Vancouver, B.C., Canada T. LUNNE Norwegian Geotechnical Institute, P.O. Box 40 Tasen, N-0801, Oslo, Norway J. J. M. POWELL Building Research Establishment, Garston, Watford WD2 7JR, United Kingdom AND D. G. GILLESPIE British Columbia Ministry of Transportation and Highways, Geotechnical and Materials Branch, 3149 Production Way, Burnaby, B.C., Canada V5A 3HI Received September 30, 1991 Accepted January 13, 1992 Data have been reviewed from sites in Europe and North and South America as well as published data from South Africa. The review has concentrated on dissipation data from piezocone tests (CPTU) to compare predicted coefficient of consolidation and permeability values using published interpretation techniques with available reference values. The results of this review have shown that the theoretical solutions provide reasonable estimates of the in situ coefficient of consolidation. Results were evaluated for pore-pressure data from different locations on the piezocone, and the least scatter in results was obtained with the pore-pressure element location immediately above the cone tip. A new correlation has been proposed to estimate in situ horizontal coefficient of permeability (k,) from piezocone dissipa- tion data. Key words: in situ, coefficient consolidation, cone penetration test, permeability. L'on a passe en revue des donnees provenant de sites en Europe et en Amerique du Nord et du Sud, de meme que des donnkes publiees en Afrique du Sud. L'on s'est arrCtC particulittrement aux donnees de dissipation des essais de piezoc6ne (CPTU) pour comparer le coefficient de consolidation predit et les valeurs de permeabiliti au moyen de techniques d'interprktation publiees avec les valeurs de reference disponibles. Les resultats de cette revue ont montrC que les solutions theoriques fournissent des estimations raisonnables du coefficient de consolidation in situ. Des resultats ont it6 evaluks en partant de donnees piezometriques mesurkes B differentes positions sur le piCzoc6ne, et la dispersion la plus faible dans les rksultats a CtC obtenue avec l'element poreux situe immediatement au-dessus de la pointe conique. Une nouvelle correlation est suggCrCe pour Cvaluer le coefficient de permeabilite horizontal (k,) in situ en partant des donnies de dissipation du piezoc6ne. Mots clbs : in situ, coefficient de consolidation, l'essai de piezoc6ne, permeabilite. [Traduit par la redaction] Can. Geotech. J. 29, 539-550 (1992) Introduction A project was initiated to review existing in situ test data and associated laboratory and performance data from well- documented geotechnical research sites. The objective of the review was to evaluate current interpretation methods of in situ tests for the determination of consolidation and per- meability parameters of soils. Data were reviewed from over 30 sites in Europe and North and South America as well as published data from South Africa. For the sites evaluated in this study, the largest data base of in situ test results available was from the cone penetration test with pore-pressure measurements (CPTU). Hence, to perform a reasonable evaluation of predictive techniques only CPTU data have been used for this study. The restric- tion of this study to the CPTU does not imply any bias towards this test but reflects common practice and availability of in situ dissipation test data. Printed in Canada / lrnprirnc au Canada The main advantages of the cone penetration test (CPT) are its simplicity, repeatability, and speed. The cone penetra- tion test with pore-pressure measurements, commonly referred to as the piezocone test (CPTU), provides added advantages of (i) ability to distinguish drainage conditions during cone penetration; (ii) ability to correct measured cone penetration resistance (9,) and to some extent sleeve fric- tion (f,), to account for unbalanced water forces due to unequal end area in cone designs; (iii) ability to assess equi- librium groundwater conditions; (iv) improved soil profiling and identification; (v) improved evaluation of geotechnical parameters; and (vi) ability to evaluate flow and consolida- tion characteristics. The main objective of this paper is to present a summary of the comparison between the measured available reference values of coefficient of consolidation and permeability with the theoretically derived parameters from CPTU dissipation
Transcript of Estimating coefficient of consolidation from …...Estimating coefficient of consolidation from...

Estimating coefficient of consolidation from piezocone tests
P. K. ROBERTSON Civil Engineering Department, University of Alberta, Edmonton, Alta., Canada T6G 2G7
J . P. SULLY INTE VEP S. A., Caracas, Venezuela
D. J. WOELLER Conetec Investigations Ltd., Unit 3, 9113 Shaughnessy Street, Vancouver, B.C., Canada
T. LUNNE Norwegian Geotechnical Institute, P.O. Box 40 Tasen, N-0801, Oslo, Norway
J . J . M . POWELL Building Research Establishment, Garston, Watford WD2 7JR, United Kingdom
AND
D. G. GILLESPIE British Columbia Ministry of Transportation and Highways, Geotechnical and Materials Branch,
3149 Production Way, Burnaby, B.C., Canada V5A 3HI
Received September 30, 1991
Accepted January 13, 1992
Data have been reviewed from sites in Europe and North and South America as well as published data from South Africa. The review has concentrated on dissipation data from piezocone tests (CPTU) to compare predicted coefficient of consolidation and permeability values using published interpretation techniques with available reference values. The results of this review have shown that the theoretical solutions provide reasonable estimates of the in situ coefficient of consolidation. Results were evaluated for pore-pressure data from different locations on the piezocone, and the least scatter in results was obtained with the pore-pressure element location immediately above the cone tip. A new correlation has been proposed to estimate in situ horizontal coefficient of permeability (k,) from piezocone dissipa- tion data.
Key words: in situ, coefficient consolidation, cone penetration test, permeability.
L'on a passe en revue des donnees provenant de sites en Europe et en Amerique du Nord et du Sud, de meme que des donnkes publiees en Afrique du Sud. L'on s'est arrCtC particulittrement aux donnees de dissipation des essais de piezoc6ne (CPTU) pour comparer le coefficient de consolidation predit et les valeurs de permeabiliti au moyen de techniques d'interprktation publiees avec les valeurs de reference disponibles. Les resultats de cette revue ont montrC que les solutions theoriques fournissent des estimations raisonnables du coefficient de consolidation in situ. Des resultats ont it6 evaluks en partant de donnees piezometriques mesurkes B differentes positions sur le piCzoc6ne, et la dispersion la plus faible dans les rksultats a CtC obtenue avec l'element poreux situe immediatement au-dessus de la pointe conique. Une nouvelle correlation est suggCrCe pour Cvaluer le coefficient de permeabilite horizontal (k,) in situ en partant des donnies de dissipation du piezoc6ne.
Mots clbs : in situ, coefficient de consolidation, l'essai de piezoc6ne, permeabilite. [Traduit par la redaction]
Can. Geotech. J . 29, 539-550 (1992)
Introduction A project was initiated to review existing in situ test data
and associated laboratory and performance data from well- documented geotechnical research sites. The objective of the review was to evaluate current interpretation methods of in situ tests for the determination of consolidation and per- meability parameters of soils. Data were reviewed from over 30 sites in Europe and North and South America as well as published data from South Africa.
For the sites evaluated in this study, the largest data base of in situ test results available was from the cone penetration test with pore-pressure measurements (CPTU). Hence, to perform a reasonable evaluation of predictive techniques only CPTU data have been used for this study. The restric- tion of this study to the CPTU does not imply any bias towards this test but reflects common practice and availability of in situ dissipation test data. Printed in Canada / lrnprirnc au Canada
The main advantages of the cone penetration test (CPT) are its simplicity, repeatability, and speed. The cone penetra- tion test with pore-pressure measurements, commonly referred to as the piezocone test (CPTU), provides added advantages of (i) ability to distinguish drainage conditions during cone penetration; (ii) ability to correct measured cone penetration resistance (9,) and to some extent sleeve fric- tion (f,), to account for unbalanced water forces due to unequal end area in cone designs; (iii) ability to assess equi- librium groundwater conditions; (iv) improved soil profiling and identification; (v) improved evaluation of geotechnical parameters; and (vi) ability to evaluate flow and consolida- tion characteristics.
The main objective of this paper is to present a summary of the comparison between the measured available reference values of coefficient of consolidation and permeability with the theoretically derived parameters from CPTU dissipation
CAN. GEOTECH. J. VOL. 29, 1992
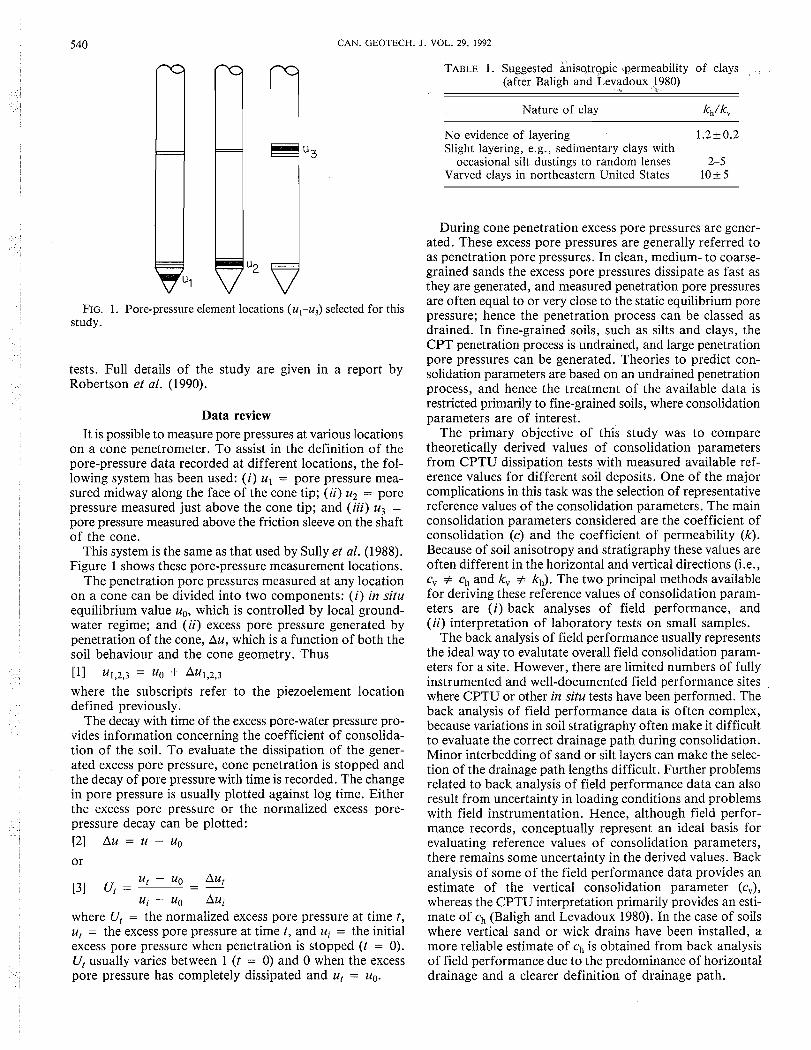
FIG. 1. Pore-pressure element locations (u,-u,) selected for this study.
tests. Full details of the study are given in a report by Robertson et al. (1990).
Data review It is possible to measure pore pressures at various locations
on a cone penetrometer. To assist in the definition of the pore-pressure data recorded at different locations, the fol- lowing system has been used: (i) ul = pore pressure mea- sured midway along the face of the cone tip; (ii) u2 = pore pressure measured just above the cone tip; and (iii) u3 = pore pressure measured above the friction sleeve on the shaft of the cone.
This system is the same as that used by Sully et al. (1988). Figure 1 shows these pore-pressure measurement locations.
The penetration pore pressures measured at any location on a cone can be divided into two components: (i) in situ equilibrium value uo, which is controlled by local ground- water regime; and (ii) excess pore pressure generated by penetration of the cone, Au, which is a function of both the soil behaviour and the cone geometry. Thus
[I] u1,2,3 = u0 + Au1,2,3 where the subscripts refer to the piezoelement location defined previously.
The decay with time of the excess pore-water pressure pro- vides information concerning the coefficient of consolida- tion of the soil. To evaluate the dissipation of the gener- ated excess pore pressure, cone penetration is stopped and the decay of pore pressure with time is recorded. The change in pore pressure is usually plotted against log time. Either the excess pore pressure or the normalized excess pore- pressure decay can be plotted: [2] A u = u - u ,
u, - uo Au, - [3] U, = - - -
u; - uo Au; where U, = the normalized excess pore pressure at time t, u, = the excess pore pressure at time t, and ui = the initial excess pore pressure when penetration is stopped (t = 0). U, usually varies between 1 (t = 0) and 0 when the excess pore pressure has completely dissipated and u, = uo.
TABLE 1. Suggested anisatropic permeability of clays (after Baligh and Levadoux 1980)
->
Nature of clay k d k v
No evidence of layering 1.2k0.2 Slight layering, e.g., sedimentary clays with
occasional silt dustings to random lenses 2-5 Varved clays in northeastern United States 10k 5
During cone penetration excess pore pressures are gener- ated. These excess pore pressures are generally referred to as penetration pore pressures. In clean, medium- to coarse- grained sands the excess pore pressures dissipate as fast as they are generated, and measured penetration pore pressures are often equal to or very close to the static equilibrium pore pressure; hence the penetration process can be classed as drained. In fine-grained soils, such as silts and clays, the CPT penetration process is undrained, and large penetration pore pressures can be generated. Theories to predict con- solidation parameters are based on an undrained penetration process, and hence the treatment of the available data is restricted primarily to fine-grained soils, where consolidation parameters are of interest.
The primary objective of this study was to compare theoretically derived values of consolidation parameters from CPTU dissipation tests with measured available ref- erence values for different soil deposits. One of the major complications in this task was the selection of representative reference values of the consolidation parameters. The main consolidation parameters considered are the coefficient of consolidation (c) and the coefficient of permeability (k). Because of soil anisotropy and stratigraphy these values are often different in the horizontal and vertical directions (i.e., cv # ch and kv # kh). The two principal methods available for deriving these reference values of consolidation param- eters are (i) back analyses of field performance, and (ii) interpretation of laboratory tests on small samples.
The back analysis of field performance usually represents the ideal way to evalutate overall field consolidation param- eters for a site. However, there are limited numbers of fully instrumented and well-documented field performance sites where CPTU or other in situ tests have been performed. The back analysis of field performance data is often complex, because variations in soil stratigraphy often make it difficult to evaluate the correct drainage path during consolidation. Minor interbedding of sand or silt layers can make the selec- tion of the drainage path lengths difficult. Further problems related to back analysis of field performance data can also result from uncertainty in loading conditions and problems with field instrumentation. Hence, although field perfor- mance records, conceptually represent an ideal basis for evaluating reference values of consolidation parameters, there remains some uncertainty in the derived values. Back analysis of some of the field performance data provides an estimate of the vertical consolidation parameter (c,), whereas the CPTU interpretation primarily provides an esti- mate of ch (Baligh and Levadoux 1980). In the case of soils where vertical sand or wick drains have been installed, a more reliable estimate of ch is obtained from back analysis of field performance due to the predominance of horizontal drainage and a clearer definition of drainage path.

ROBERTSON ET AL.: I
TABLE 2. List of sites reviewed with associated references
Site (location) Soil typea Ref.
Amherst (U.S.A.)
Attakapa Landing (U.S.A.)
Saugus (U.S.A.)
Brage, North Sea (Norway)
Saint-Alban (Canada)
McDonald Farm (Canada)
Burnaby (Canada)
Troll, North Sea (Norway)
Onsoy (Norway)
Snorre, North Sea (Norway)
Stjordal-Halsen (Norway)
Drammen (Norway)
Strong Pit, B.C. (Canada)
Colebrook Overpass, B.C. (Canada)
Haga (Norway)
Fucino (Italy)
Porto Tolle (Italy)
Guanabara Bay (Rio de Janeiro, Brazil)
Gainesville, Florida (U.S.A.)
Norco, Louisiana (U.S.A.)
Langley, Lower 232 Street (Cai
Lulu Island, B.C. (Canada)
Laing Bridge South, B.C. (Canada)
Trieste (Italy)
Site 1/11 (France) Glava (Norway)
SLS (U.S.A.)
Storz 264, Nebraska (U.S.A.)
Connecticut Valley varved clay; moderately to lightly overconsolidated
Soft clay and clayey silt; normally consolidated
Boston Blue Clay; moderately to lightly overconsolidated
Silty marine clay and sandy silt; normally consolidated
Champlain Sea Clay; very sensitive, lightly overconsolidated (aged)
Normally consolidated clayey silt
Normally consolidated clay silt
Sandy marine clay; lightly overconsolidated
Marine clay silt; normally consolidated at depth
Silty sandy stiff marine clay; lightly overconsolidated
Marine clay sandy silt; normally consolidated
Normally consolidated clay silt; sensitive
Glaciomarine clayey silt; lightly to moderately overconsolidated
Sensitive silty clay; normally consolidated (aged)
Lean marine clay; moderately overconsolidated
Clayey silt lake deposits; normally consolidated
Soft clayey silt; normally consolidated
Soft silty clay; normally consolidated
Lake Alice Clay; clayey silty sand to clay
Silty sand clay; normally consolidated
nada) Sensitive clay silt; lightly overconsolidated to normally consolidated
Organic clayey silt; normally consolidated
Soft deltaic clayey silt; normally consolidated
Homogeneous soft organic clay; normally consolidated
Clayey silt Medium stiff marine clay;
overconsolidated Soft to medium silty clay;
lightly overconsolidated Florence Lake clays;
normally consolidated
Baligh and Levadoux (1980)
M.T. Tumay (personal communication, 1990)
Baligh and Levadoux (1980)
Norwegian Geotechnical Institute (1988a)
Roy et al. (1982); Tavenas et al. (1974)
Gillespie and Campanella (1981); Gillespie (1981); Hers (1989)
Gillespie and Campanella (1981)
Norwegian Geotechnical Institute (1984)
Mokkelbost (1988)
Norwegian Geotechnical Institute (1988b)
Senneset et al. (1982)
Mokkelbost (1988)
Campanella et al. (1988)
Crawford and Campanella (1991)
Mokkelbost (1988)
Associazione Geotechnica Italiana (1979); Marchetti and Totani (1989)
Battaglio et al. (1981); Jamiolkowski et al. (1979)
Sills et al. (1988)
Gupta and Davidson (1986)
Tumay and Acar (1984)
Zavoral (1988)
Hers (1989); Gillespie (1990)
Le Clair (1988)
Battaglio et a/. (1981); Jamiolkowski et a/. (1983)
Parez and Bachelier (1981) Senneset et al. (1989)
Kabir and Lutenegger (1990)
Lutenegger et al. (1988)

542 CAN. GEOTECH. J. VOL. 29, 1992
TABLE 2 (concluded) I
Ref. ' Site (location) Soil typea
South Africa
Brent Cross (U.K.)
Bothkennar (U.K.) (Grangemouth)
Cowden (U.K.) Madingley, (U.K.)
Various normally Jones and Van Zyl (1981) consolidated materials (tailings, aluminum)
Stiff, heavily consolidated Powell et a/. (1988) London Clay, fissured
Soft, slightly fissured organic Powell et a/. (1988) silty clay
Stiff, glacial till Powell and Quarterman (1988) Gault Clay; stiff, fissured Lunne et al. (1986)
silty clay
aLightly overconsolidated, 1 < OCR < 4; moderately overconsolidated, 4 < OCR < 10; heavily overconsolidated, 10 < OCR.
It is possible to correct the derived cv values to ch using the following equation:
Based on North American experience, Baligh and Levadoux (1980) suggested values of kh/kv for various soil types (Table 1). A similar classification for kh/kv has been sug- gested by Jamiolkowski et al. (1985). Where field or labo- ratory measurements of directional properties are not avail- able, Table 1 has been used to evaluate ch from c,.
The majority of sites reviewed for this project have con- solidation and permeability parameters derived from labo- ratory testing on small, undisturbed samples. The primary laboratory test performed was the one-dimensional (oedo- meter) consolidation test, of which both incremental load and constant rate of strain results are available. One prob- lem associated with the determination of consolidation and permeability parameters from laboratory testing relates to the small size of the sample and the unknown influence of sample disturbance. For soils that are interbedded or have some fabric, such as fissures or layering, laboratory testing on small intact samples can be misleading. Almost all recovered samples have some level of disturbance, hence laboratory-derived parameters may not be entirely represen- tative of in situ conditions. Techniques have been developed to correct oedometer-derived consolidation parameters to account for disturbance (Sandbaekken et al. 1985). Two advantages with laboratory testing to determine consolida- tion parameters are that samples can be tested in both the vertical and horizontal direction to derive both ch and cv and that these parameters can be determined at different stress levels. Tavenas et al. (1983) discuss other limitations with the determination of consolidation parameters from oedometer tests.
Detailed in situ and laboratory data were obtained from over 30 sites. In almost all cases only interpreted laboratory and (or) field data were available and not the basic settle- ment or pore-pressure data which would have permitted independent derivation of parameters. A list of the sites from which data have been obtained is given in Table 2.
The laboratory reference coefficient of consolidation values have been selected at approximately the same over- burden stress that existed at that depth in the field, i.e., at the same overconsolidation ratio (OCR) as exists in situ.
This was considered to be a logical choice to predict the in situ response of the soil to imposed loads. If the soil is overconsolidated the reference value of c, represents the overconsolidated range.
To ensure standardization, only time values for 50% dissipation of excess pore pressures (U, = 0.5) have been taken from the in situ CPTU dissipation curves. Baligh and Levadoux (1980) suggest that at this degree of dissipation or greater the calculated ch from piezocone dissipation should correspond to the in situ consolidation state of the soil.
Obviously, with any study of this kind, some degree of interpretation and (or) extrapolation has been necessary to maximize the data. In determining the average values of tSo from CPTU dissipations and c, from laboratory consolida- tion tests, extreme values have been discarded where these have been considered to be nonrepresentative of the com- plementary data set on the particular soil. No distinction has been made between c, values from different types of oedometer test or for that matter triaxial tests. Furthermore, no depth dependence of c, from laboratory data has been considered, since the complete data set to permit this was not always available. However, for most sites this was not necessary, as global ranges adequately reflected the ranges of cVBh obtained at any one site. Nothwithstanding this, where stratigraphic changes warrant, separate tS0 - C, aver- ages have been used for separate layers.
Theoretical background of CPTU dissipation test In the past 15 years, several techniques have been devel-
oped to evaluate consolidation characteristics from dissipa- tion tests using the CPTU (Torstensson 1975, 1977; Baligh and Levadoux 1980; Gupta and Davidson 1986; Teh 1988).
A CPTU dissipation test consists of stopping cone pene- tration and monitoring the decay of excess pore pressures (Au) with time. Excess pore pressure is defined as the dif- ference between the penetration pore pressure (u) and the static equilibrium pore pressure (uo) From the dissipation data an approximate value of the coefficient of consolidation in the horizontal direction (c,) can be derived.
A comprehensive study and review of this topic was published by Baligh and Levadoux (1986), and the relevant conclusions from this study are as follows. (1) The simple uncoupled solutions provide reasonably accurate predictions
ROBERTSON ET AL.: I 543
S p h e r i c a l
0 001 001 0 .I 1 10 100 1000 T i m e F a c t o r T ' ( Log S c a l e )
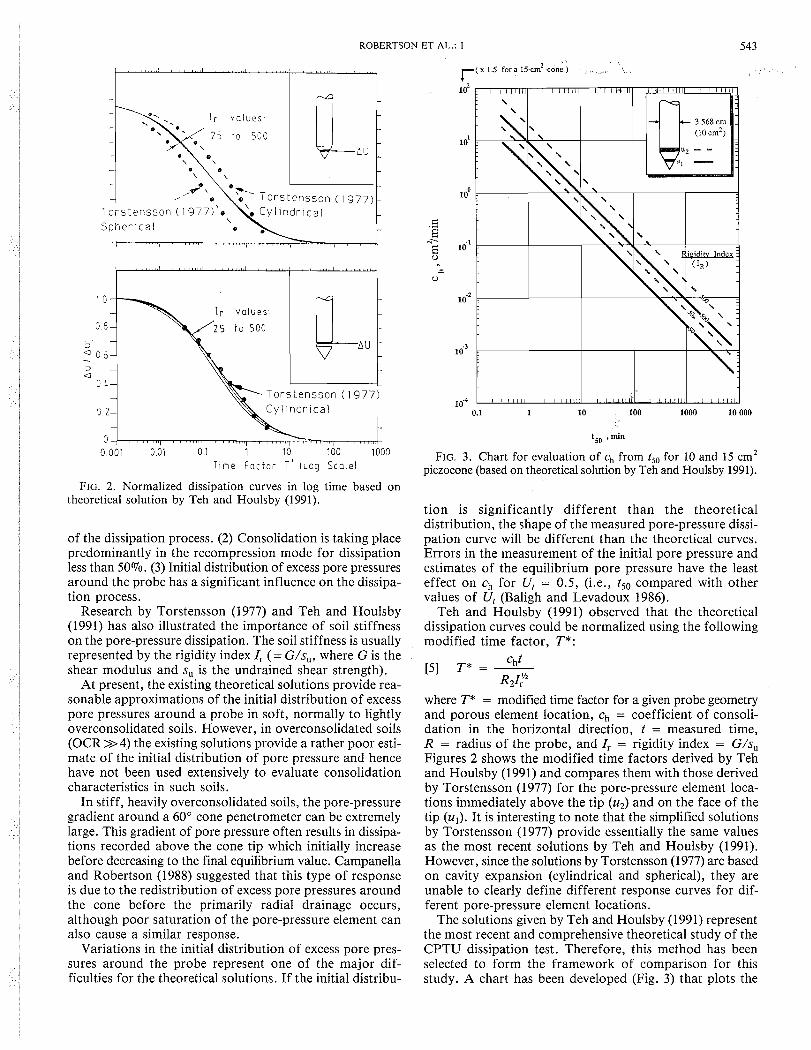
FIG. 2. Normalized dissipation curves in log time based on theoretical solution by Teh and Houlsby (1991).
of the dissipation process. (2) Consolidation is taking place predominantly in the recompression mode for dissipation less than 50%. (3) Initial distribution of excess pore pressures around the probe has a significant influence on the dissipa- tion process.
Research by Torstensson (1977) and Teh and Houlsby (1991) has also illustrated the importance of soil stiffness on the pore-pressure dissipation. The soil stiffness is usually represented by the rigidity index I, (= G/s,,, where G is the shear modulus and s,, is the undrained shear strength).
At present, the existing theoretical solutions provide rea- sonable approximations of the initial distribution of excess pore pressures around a probe in soft, normally to lightly overconsolidated soils. However, in overconsolidated soils (OCR >> 4) the existing solutions provide a rather poor esti- mate of the initial distribution of pore pressure and hence have not been used extensively to evaluate consolidation characteristics in such soils.
In stiff, heavily overconsolidated soils, the pore-pressure gradient around a 60" cone penetrometer can be extremely large. This gradient of pore pressure often results in dissipa- tions recorded above the cone tip which initially increase before decreasing to the final equilibrium value. Campanella and Robertson (1988) suggested that this type of response is due to the redistribution of excess pore pressures around the cone before the primarily radial drainage occurs, although poor saturation of the pore-pressure element can also cause a similar response.
Variations in the initial distribution of excess pore pres- sures around the probe represent one of the major dif- ficulties for the theoretical solutions. If the initial distribu-
10'
lo"
C
'Z N' E 10' 0 - ... U
ldZ
lo3
0.1 1 10 100 1000 10 000
t5,, , min
FIG. 3. Chart for evaluation of c, from t,, for 10 and 15 cm2 piezocone (based on theoretical solution by Teh and Houlsby 1991).
tion is significantly different than the theoretical distribution, the shape of the measured pore-pressure dissi- pation curve will be different than the theoretical curves. Errors in the measurement of the initial pore pressure and estimates of the equilibrium pore pressure have the least effect on ch for U, = 0.5, (i.e., tS0 compared with other values of U, (Baligh and Levadoux 1986).
Teh and Houlsby (1991) observed that the theoretical dissipation curves could be normalized using the following modified time factor, T*:
where T* = modified time factor for a given probe geometry and porous element location, c,, = coefficient of consoli- dation in the horizontal direction, t = measured time, R = radius of the probe, and I, = rigidity index = G/s, Figures 2 shows the modified time factors derived by Teh and Houlsby (1991) and compares them with those derived by Torstensson (1977) for the pore-pressure element loca- tions immediately above the tip (2.44 and on the face of the tip (u,). It is interesting to note that the simplified solutions by Torstensson (1977) provide essentially the same values as the most recent solutions by Teh and Houlsby (1991). However, since the solutions by Torstensson (1977) are based on cavity expansion (cylindrical and spherical), they are unable to clearly define different response curves for dif- ferent pore-pressure element locations.
The solutions given by Teh and Houlsby (1991) represent the most recent and comprehensive theoretical study of the CPTU dissipation test. Therefore, this method has been selected to form the framework of comparison for this study. A chart has been developed (Fig. 3) that plots the

544 CAN. GEOTECH. J. VOL. 29, 1992
TABLE 3. Summary of CPTU field dissipation results for u , position in terms of t,, and laboratory oedometer results
t,,, min c,,, cmvmin Pore-pressure
Site (location) location Range Average Range Average k,/k,
Guanabara Bay (Rio de Janeiro, Brazil)
Saugus, 1-5 (U.S.A.)
Colebrook overpass, B.C. (Canada)
McDonald Farm (Canada)
Strong Pit, B.C. (Canada)
Fucino (Italy) Porto Tolle (Italy) Brage (Norway) Drammen (Norway) Haga (Norway) Onsoy (Norway) Snorre (Norway) Stjordal-Halsen
(Norway) Troll (Norway) Amherst (U.S.A.) Attakapa Landing
(U.S.A.) Lake Alice Clay
(U.S.A.) Saint-Alban (Canada) Norco, Louisiana
(U.S.A.)
Cowden (U.K.) Madingley (U.K.) Brent Cross (U.K.)
derived value of ch based on the solutions by Teh and Houlsby (1991), against the time for 50% dissipation for two of the selected pore-pressure element locations (u, and 4 ) . The chart shown in Fig. 3 will therefore form the framework for the comparison between predicted and mea- sured coefficients of consolidation (ch). For cones with a 15-cm2 cross-sectional area, the scale of the derived ch needs to be increased by a factor of 1.5, as indicated in Fig. 3.
Campanella and Robertson (1988) suggested that the applicability and meaning of the theoretical solutions is com- plicated by several phenomena, such as importance of ver- tical as well as horizontal dissipation; effects of soil distur- bance; uncertainty over distribution, level, and changes in total stresses; soil anisotropy, nonlinearity, and creep; soil layering or nearness to a layer boundary; influence of macro- fabric, such as fissuring; and influence of clogging and smearing of the porous filter element. Despite these above limitations, Campanella and Robertson (1988) suggested that the CPTU dissipation test provides an economic and useful means of evaluating approximate consolidation properties, soil macrofabric, and related drainage paths of natural, fine- grained soil deposits.
Evaluation of CPTU dissipation data Tables 3-5 present a summary of the compiled data in
terms of measured CPTU dissipation times and refer- ence coefficient of consolidation values. Figures 4 and 5 pre- sent all the available CPTU data in terms of tSo for each of the pore-pressure locations u, and u2 and reference ch values obtained from laboratory tests on undisturbed samples. For the purpose of clear presentation, only average values of tSo and ch have been shown. The available data for pore-pressure location u3 was very limited (only 7 sites) and has not been presented in this paper. Full details of all the data are given in the report by Robertson et al. (1990).
The practise at the Norwegian Geotechnical Institute (NGI) is to correct the oedometer c, values for sample disturbance. Details of the correction procedure are given by Sandbaekken et a1 (1985). Although this correction appears to be quite large for some sites, the relative change in ch values is generally quite small in terms of the overall range of values encountered.
The results show the following main points. (1) The trend and magnitude of the measured data (tSo, ch) is generally consistent with the proposed theoretical framework. (2) Of the pore-pressure locations considered, the u2 data appear

ROBERTSON ET AL.: I 545
TABLE 4. Summary of CPTU field dissipation results for u, position in terms of t,, and laboratory oedometer results
t,,, min c,, cm2/min ' Pore-pressure
Site (location) location Range Average Range Average k,/k,
Guanabara Bay (Rio de Janeiro, Brazil) u2 6.1-16.5 11.3 0.012-0.06 0.036 1
Colebrook Overpass, B.C. (Canada) u2 8.8-98 6 1 0.018-0.17 0.093 2.5
Laing Bridge South (Canada) u2 0.75-11.5 4.4 0.102-0.27 0.19 1
Langley, Lower 232 Street (Canada) u2 25-83 42 0.19-0.018 0.074 3
Lulu Island, B.C. (Canada) u2 2.5-10 5.3 1.9-4.2 3.1 1
McDonald Farm (Canada) u2 2.1-7.8 5.0 1.1-3.3 2.2 0.7-1.1
Strong Pit, B.C. (Canada) u2 37-66 46 0.038-0.17 0.057 2
Brage (Norway) u2 0.22-2.5 1.17 0.46-17.5 5.4 1 Drammen (Norway) u2 15-26 2 1 0.004-0.008 0.006 1 Haga (Norway) u2 12-44 25.4 0.17-0.35 0.26 2 Onsoy (Norway) u2 7-40 2 1 0.06-0.13 0.1 2.5 Snorre (Norway) u2 3 3 3 3 0.05-0.17 0.1 1 1 Stjordal-Halsen
(Norway) u2 1-4.4 2.85 2.9-14.7 7.9 1 Troll (Norway) u2 90-180 137 0.04-0.16 0.12 1 SLS (U.S.A.) u2 29.6 29.6 0.04-0.6 0.12 Storz 264, Nebraska (U.S.A.) u2 60-190 105 0.006-0.06 0.024 1 Saint-Alban (Canada) u2 9.6-13 11.3 0.003-0.006 0.0045 1 Glava (Norway) u2 - 18 0.14-0.21 0.16 1.5 Site 1/11 (France) u2 7.5-15 11.5 0.9 0.9 1 Trieste (Italy) u2 20-48 32 0.006-0.012 0.012 1 Porto Tolle (Italy) u2 15-25 20 0.13-0.21 0.14 1.4 Cowden (U.K.) u2 - 44 0.03-0.114 0.072 1 Bothkennar (U.K.) '42 12-90 39 0.079-0.048 0.03 1
TABLE 5. Summary of CPTU field dissipation results for u3 position in terms of t,, and laboratory oedometer results
t,,, min c,, cm2/min Pore-pressure
Site (location) location Range Average Range Average kh/kv
Guanabara Bay (Rio de Janeiro, Brazil) u3 27-44 35.5 ' 0.012-0.06 0.036 1
Saint-Alban (Canada) u3 15.6-18.5 17.1 0.003-0.006 0.0045 1 Laing Bridge South
(Canada) u3 6-22 12.5 0.1042-0.27 0.19 1 Attakapa Landing
(U.S. A.) u3 23-295 103 0.014-0.024 0.019 1 Strong Pit (Canada) u3 94-150 122 0.038-0.17 0.057 2 Brage (Norway) u3 0.67-4.3 2.2 0.46-17.5 5.4 1 McDonald Farm
(Canada) u3 8.3-16.7 12.5 1.1-3.3 2.2 0.7-1.1
to show the least scatter and compare well with the proposed theoretical framework. (3) For the ul and u3 locations, the data show a scatter larger than the range suggested by the theoretical framework. (4) The reference laboratory ch values tend to be less than the predicted values for pore- pressure locations ul and u3.
For two sites, Lake Alice and Norco, the data and soil conditions are such that sufficient data are available to derive ch and tso values for different stratigraphic sequences of the
profile. Figure 6 presents the values of ch and tsO for these sites and shows that the trend of ch with tSo is essentially parallel to the theoretical framework.
Two sites (Saint-Alban and Drammen) appear to con- sistently plot below the theoretical framework and data from other sites. Both these sites comprise either sensitive or struc- tured clays. Hence, the remolding, due to cone penetration and possibly sampling, may have some influence on the tSO and laboratory ch values.
546 CAN. GEOTECH. J. VOL. 29, 1992
r( x 1 5 for a 15-cm2 cone ) r( x 1 5 for a 15-cm2 cone ) , lo2
lo1
lo"
c 3 . "E lo-' 0
- - U
lo.=
l o 3
lo4 0.1 1 10 100 1000 10 000
t , min
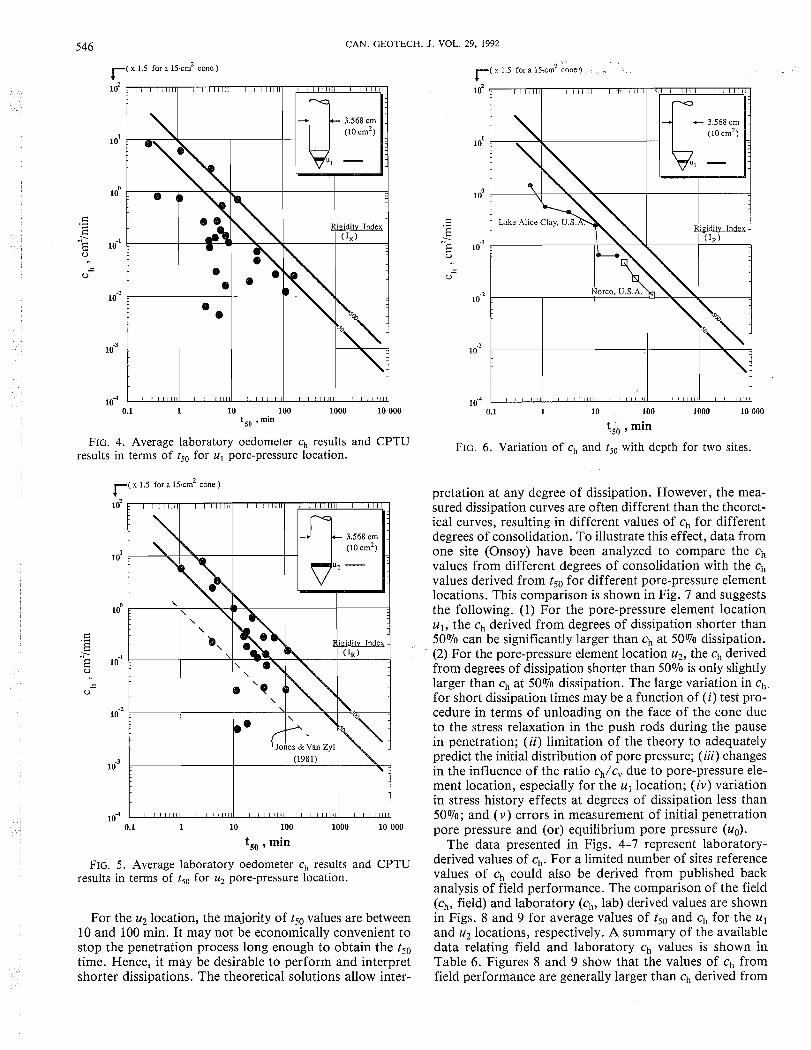
FIG. 4. Average laboratory oedometer c, results and CPTU results in terms of tso for u, pore-pressure location.
lo4 0.1 1 10 100 1000 10 000
tS0 , min
FIG. 5. Average laboratory oedometer ch results and CPTU results in terms of tso for u, pore-pressure location.
For the u2 location, the majority of tSo values are between 10 and 100 min. It may not be economically convenient to stop the penetration process long enough to obtain the tsO time. Hence, it may be desirable to perform and interpret shorter dissipations. The theoretical solutions allow inter-
0.1 1 10 100 1000 10 000
t j o , min
FIG. 6. Variation of ch and tso with depth for two sites.
pretation at any degree of dissipation. However, the mea- sured dissipation curves are often different than the theoret- ical curves, resulting in different values of ch for different degrees of consolidation. To illustrate this effect, data from one site (Onsoy) have been analyzed to compare the ch values from different degrees of consolidation with the ch values derived from tso for different pore-pressure element locations. This comparison is shown in Fig. 7 and suggests the following. (1) For the pore-pressure element location ul, the ch derived from degrees of dissipation shorter than 50% can be significantly larger than ch at 50% dissipation. (2) For the pore-pressure element location u2, the ch derived from degrees of dissipation shorter than 50% is only slightly larger than ch at 50% dissipation. The large variation in ch for short dissipation times may be a function of (i) test pro- cedure in terms of unloading on the face of the cone due to the stress relaxation in the push rods during the pause in penetration; (ii) limitation of the theory to adequately predict the initial distribution of pore pressure; (iii) changes in the influence of the ratio ch/c, due to pore-pressure ele- ment location, especially for the ul location; (iv) variation in stress history effects at degrees of dissipation less than 50%; and (v) errors in measurement of initial penetration pore pressure and (or) equilibrium pore pressure (uo).
The data presented in Figs. 4-7 represent laboratory- derived values of ch. For a limited number of sites reference values of ch could also be derived from published back analysis of field performance. The comparison of the field (ch, field) and laboratory (ch, lab) derived values are shown in Figs. 8 and 9 for average values of tS0 and ch for the ul and u2 locations, respectively. A summary of the available data relating field and laboratory ch values is shown in Table 6 . Figures 8 and 9 show that the values of ch from field performance are generally larger than ch derived from

ROBERTSON ET AL.: I 547
- UBC/BAT (uz) - - Wissa (u,) - - - McClelland (u,) ------ Fugro (4)
0 1 1 I ' I I 1 I I I I 0 20 40 60 80 100
Degree of dissipation, U%
FIG. 7. Variation in c, determined at different degrees of dissipation compared with c, determined at 50% dissipation. Onsoy clay dissipation data from Soares et al. (1987), and c, values from Torstensson cavity expansion theory. Curves are best fit lines to individual data sets for the cones UBC/BAT, Wissa, McClelland, and Fugro.
laboratory testing and that the largest difference appears to occur for the more sensitive and structured clays. This is consistent with the results presented by Tavenas et al. (1986) Figures 8 and 9 would then suggest that, if the diference between ch(lab) and ch(field) is similar for most sites, then the data shown in Figs. 4 and 5 would generally plot closer to the theoretical framework. However, the difference between ch(field) based on performance and ch(lab) also appears to be a function of soil structure.
So far, data have only been presented in terms of ch. This is because the rate of pore-pressure dissipation during a pause in the CPT is theoretically related to ch. However, data are available from some of the sites to evaluate the direct empirical correlation between tS0 and the laboratory- derived values of the horizontal coefficient of permeability kh. A summary of the available data is shown in Table 7. Figure 10 presents the available data of kh and tS0 and com- pares these with a preliminary relationship proposed by Schmertmann (1978). For dissipation times (t,) less than 0.5 min, the penetration process appears to be partially drained, and no correlation or data exists. Some of the reasons for the observed large scatter are probably due to variations in soil compressibility as well as the uncertainty in the reference values.
Conclusions Data have been reviewed from sites in Europe and North
and South America, as well as published data from South Africa. The review has been limited to data from cone penetration tests with pore-pressure measurements (CPTU). The main objective of the review has been to apply existing published interpretation techniques to interpret CPTU
x I s for a 15-cm2 cone )
1 02
lo'
1&
10'
1d2
10'
Guanabara Clay, Brazil I ' I I I 1 , 1 i l l l i l l 1 1 1 1 1 1 1 1 l 1 1 1 1 1 1 1 1 1 8 l l l l l l i l i I l i l l i l l
0.1 1 10 100 1000 10 000
tso , min
FIG. 8. Comparison between field back-analyzed and labora- tory c, values for CPTU ts0 values for u, pore-pressure location.
r( x 1.5 for a L S - C ~ ' cone )
Guanabara Clay, Brazil - Saint-Alban, Canada - Laing Bridge South a Colebrook Overpass
&-X Trieste. Italy
0.1 1 10 100 1000 10 000
tS0 , min
FIG. 9. Comparison between field back-analyzed and labora- tory c, values for CPTU t,, values for u, pore-pressure location.
dissipation test data and compare predicted consolidation and permeability parameters to available reference values. The results of this review can be summarized as follows:
(1) The theoretical solutions proposed by Teh and Houlsby (1991) and Torstensson (1977) provide a reasonable
administrator2
Highlight
CAN. GEOTECH. J. VOL. 29. 1992
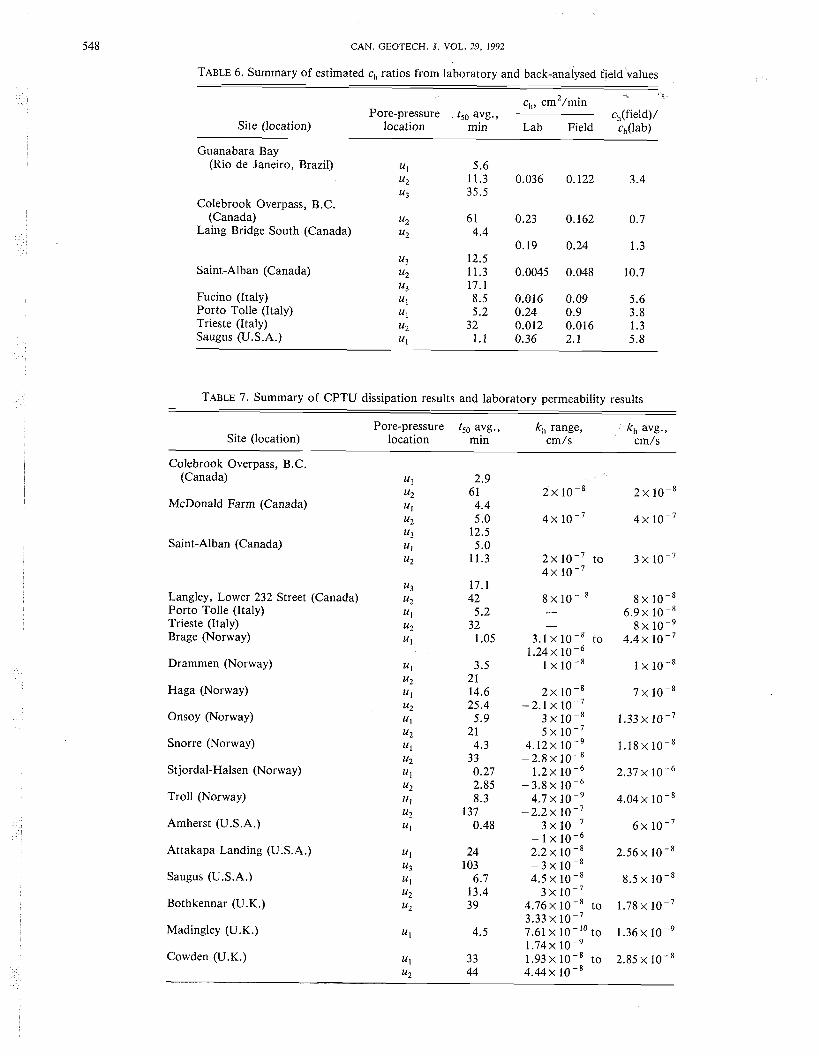
TABLE 6. Summary of estimated c, ratios from laboratory and back-analysed field values
ch, cm2/min *
Pore-pressure t,, avg., ch(field)/ Site (location) location rnin Lab Field c,(lab) .. , ,
Guanabara Bay (Rio de Janeiro, Brazil) UI 5.6
u2 11.3 0.036 0.122 3.4 u3 35.5
Colebrook Overpass, B.C. (Canada) u2 6 1 0.23 0.162 0.7
Laing Bridge South (Canada) u2 4.4 0.19 0.24 1.3
u3 12.5 Saint-Alban (Canada) u2 11.3 0.0045 0.048 10.7
Fucino (Italy) Porto Tolle (Italy) u1 5.2 0.24 0.9 3.8 Trieste (Italy) u2 32 0.012 0.016 1.3 Saugus (U.S.A.) UI 1.1 0.36 2.1 5.8
TABLE 7. Summary of CPTU dissipation results and laboratory permeability results
Pore-pressure t,, avg., kh range, kh avg., Site (location) location min cm/s cm/s
Colebrook Overpass, B.C. (Canada)
McDonald Farm (Canada)
Saint-Alban (Canada)
Langley, Lower 232 Street (Canada) Porto Tolle (Italy) Trieste (Italy) Brage (Norway)
Drammen (Norway)
Haga (Norway)
Onsoy (Norway)
Snorre (Norway)
Stjordal-Halsen (Norway)
Troll (Norway)
Amherst (U.S.A.)
Attakapa Landing (U.S.A.)
Saugus (U.S.A.)
Bothkennar (U.K.)
Madingley (U.K.)
Cowden (U.K.)

ROBERTSON ET AL.: I 549
tS0 , min
FIG. 10. Average values for laboratory-derived horizontal coefficient of permeability (k,) and CPTU t,, for u, pore-pressure location.
estimate of the in situ horizontal coefficient of consolida- tion (ch).
(2) The most consistent results showing the least scatter were obtained with the pore-pressure element location immediately above the cone tip (u2).
(3) The expected reliability for estimating ch for the u2 position is about plus or minus one-half an order of magni- tude, whereas for the u, position this increases to a full one order of magnitude. These magnitudes of expected reliability are consistent with previous published experience for the determination of ch or c,.
A tentative correlation between the rate of dissipation (t5,)) and horizontal coefficient of permeability (kh) has also been proposed, although considerable scatter exists in the data.
The application of these correlations requires that the CPTU must be performed with fully saturated pore-pressure elements. Although data from many sites have been com- piled and reviewed, there is a need for continued research. This review has illustrated the difficulty in determining the coefficient of consolidation of soils from traditional site investigation and laboratory results. The interpretation tech- niques available for the CPTU appear to produce estimates of the coefficient of consolidation with similar accuracy as existing traditional sampling and laboratory testing. The CPTU values of ch are slightly higher than the laboratory values but agree better with ch values back calculated from full-scale performance. However, more data should be col- lected to improve the correlations suggested in this paper. There is a need for more data from sites where field perfor- mance has been monitored so that the reference values of the coefficient of consolidation can be better determined. More data are needed to clarify the influence of OCR and soil structure on the proposed correlations.
Acknowledgements This work was performed under a oontract (23420-9-
M644-01-OSC) for Energy, Mines and Resources Canada. The authors would like to acknowledge the assistance of Prof. R.G. Campanella, C.B. Crawford, Dr. J-M. Konrad, Dr. A. Whittle, Prof. M. Tumay, Prof. A. Lutenegger, and Prof. M. Jamiolkowski for providing valuable data to assist with this study.
Associazione Geotechnica Italiana. 1979. Experiences on the time- settlement behaviour of some Italian soft clays. Proceedings, 7th European Conference on Soil Mechanics and Foundation Engineering, Brighton, vol. 1, pp. 1-1 1.
Baligh, M.M., and Levadoux, J.N. 1980. Pore pressure dissipation after cone penetration. Massachusetts Institute of Technology Department of Civil Engineering, Research Report R80-11.
Baligh, M.M., and Levadoux, J.N. 1986. Consolidation after undrained piezocone penetration. 11: interpretation. ASCE Journal of Geotechnical Engineering, 112: 727-745.
Battaglio, M., Jamiolkowski, M., Lancellotta, R., and Maniscalco, R. 1981. Piezometer probe test in cohesive deposits. Proceedings, ASCE Conference on Cone Penetration Testing and Experience, St. Louis, pp. 264-300.
Campanella, R.G., and Robertson, P.K. 1988. Current status of the piezocone test. Proceedings, 1st International Symposium on Penetration Testing, vol. 1, Orlando, Fla., pp. 93-116.
Campanella, R.G., Sully, J.P., and Robertson, P.K. 1988. Inter- pretation of piezocone soundings in clay - a case history. Pro- ceedings, Penetration Testing in the UK, Birmingham, England, pp. 203-208.
Crawford, C.B., and Campanella, R.G. 1991. Comparison of field consolidation with laboratory and in situ tests. Canadian Geotechnical Journal, 28: 103-1 12.
Gillespie, D.G. 1981. The piezometer cone penetration test. M.A.Sc. thesis, Department of Civil Engineering, University of British Columbia, Vancouver, B.C.
Gillespie, D.G. 1990. Evaluating velocity and pore pressure data from the cone penetration test. Ph.D. thesis, Department of Civil Engineering, University of British Columbia, Vancouver, B.C.
Gillespie, D., and Campanella, R.G. 1991. Consolidation charac- teristics from pore pressure dissipation after piezometer cone penetration. Soil Mechanics Series 47, Department of Civil Engineering, The University of British Columbia. Vancouver, B.C.
Gupta, R.C., and Davidson, J.L. 1986. Piezoprobe determined coefficient of consolidation. Soils and Foundations, 26(3): 12-22.
Hers, I. 1989. The analysis and interpretation of the cone pressure- meter in cohesive soils. M.A.Sc. thesis, Department of Civil Engineering, University of British Columbia, Vancouver, B.C.
Jamiolkowski, M., Lancellotta, R., Marchetti, S., et al. 1979. Design parameters for soft clays. Proceedings, 7th European Conference on Soil Mechanics and Foundation Engineering, Brighton, pp. 27-57.
Jamiolkowski, M., Lancellotta, R., and Wolski, W. 1983. Precom- pression and speeding up consolidation. Proceedings, 8th Euro- pean Conference on Soil Mechanics and Foundation Engineer- ing, Helsinki, vol. 3, pp. 1201-1226.
Jarniolkowski, M., Ladd, C.C., Germaine, J.T., and Lancellotta, R. 1985. New developments in field and laboratory testing of soils. Proceedings, 1 lth International Conference on Soil Mechanics and Foundation Engineering, San Francisco, pp. 57-153.
Jones, G.A., and Van Zyl, D.J.A. 1981. The piezometer probe- A useful tool. Proceedings, 10th International Conference on Soil Mechanics and Foundation Engineering, Stockholm, vol. 2, pp. 489-496.
Kabir, M.G., and Lutenegger, A.J. 1990. In situ estimation of the
550 CAN. GEOTECH. J. VOL. 29, 1992
coefficient of consolidation of clays. Canadian Geotechnical Journal, 27: 58-67.
LeClair, D.G. 1988. Prediction of embankment performance using in-situ tests. M.A.Sc. thesis, Department of Civil Engineering, University of British Columbia, Vancouver, B.C.
Lunne, T. , Powell, J.J.M., Quarterman, R.S.T., and Eidsmoen, T.E. 1986. Piezocone testing in overconsolidated clays. Proceedings, 39th Canadian Geotechnical Conference, Ottawa, pp. 209-218.
Lutenegger, A.J., Kabir, M.G., and Saye, S.R. 1988. Use of penetration tests to predict wick drain performance in a soft clay. Proceedings, 1st International Symposium on Penetration Testing, Orlando, Fla., vol. 2, pp. 843-848.
Marchetti, S., and Totani, G. 1989. Ch evaluations from DMTA dissipation curves. Proceedings, 12th International Conference on Soil Mechanics and Foundation Engineering, Rio de Janeiro, V O ~ . 1, pp. 281-286.
Mokkelbost, K.H. 1988. Application of dilatometer for pile design. Dilatometer tests at four Norwegian sites. Joint Research Proj- ect NGI/BRE, Norwegian Geotechnical Institute, Oslo. Inter- nal Report 521610-1.
Norwegian Geotechnical Institute. 1984. Oppdragsrapport ti1 Norsk Hydro A/S., Troll Ost 1984, grunnundersokelser, laboratorie- rapport. Bind I1 - geologi. Report 84215-2,
Norwegian Geotechnical Institute. 1988a. Contract report to Norsk Hydro A/S. Brage Soil Survey 1987, Contract No. KO 1636/ TU-5171, Geotechnical Data, vols. 1 and 2. Report 87261-03.
Norwegian Geotechnical Institute. 1988b. Contract report to Saga Petroleum A/S. Snorre soil investigation 1987 Block 34/7. Soil parameter report for design. Report 87260-3.
Parez, L., and Bachelier, M. 1981. C,,, K,, 6," determines par penetration statique. Proceedings, 10th International Conference on Soil Mechanics and Foundation Engineering, Stockholm, V O ~ . 2, pp. 553-556.
Powell, J.J.M., and Quarterman, R.S.T. 1988. The interpretation of cone penetration tests in clays, with particular reference to rate effects. Proceedings, 1st International Symposium on Penetration Testing, Orlando, Fla., pp. 903-910.
Powell, J.J.M., Quarterman, R.S.T., and Lunne, T. 1988. Inter- pretation and use of the piezocone test in UK clays. Proceedings, Penetration Testing in the UK, Birmingham, England, pp. 151-156.
Robertson, P.K., Sully, J.P., Woeller, D.J., et al. 1990. Guidelines for interpretation of CPTU test data for determination of con- solidation and permeability parameters of soils. Report prepared by ConeTec Investigations Ltd. for Energy, Mines and Resources Canada, Contract No. 23420-9-M644/01-OSC.
Roy, M., Tremblay, M., Tavenas, F., and La Rochelle, P. 1982. Development of pore pressures in quasi-static penetration tests in sensitive clay. Canadian Geotechnical Journal, 19: 124-138.
Sandbaekken, B., Berre, T., and Lacasse, S. 1985. Oedometer testing at the Norwegian Geotechnical Institute. Proceedings,
Symposium on Consolidation behaviour for Soils, Ft. Lauderdale, Fla. American Society for Testing and Materials, Special Technical Publication 892, pp. 329-353. '
Schmertmann, J.H. 1978. Guidelines for cone penetration tests per- formance and design. Federal Highways Administration, Washington, D.C., Report FHWA-TS-78-209.
Senneset, K., Janbu, N., and Svano, G. 1982. Strength and defor- mation parameters from cone penetration tests. Proceedings, 2nd European Symposium on Penetration Testing, Amsterdam, pp. 863-870.
Senneset, K., Sandven, R., and Janbu, N. 1989. Evaluation of soil parameters from piezocone tests. In In situ testing of soil prop- erties for transportation. Transportation Research Board, National Research Council, Washington, D.C.,Transportation Research Record 1235, pp. 24-37.
Sills, G.C., Almeida, M.S.S., and Danziger, F.A.B. 1988. Coef- ficient of consolidation from piezocone dissipation tests in a very soft clay. Proceedings, 1st International Symposium on Penetra- tion Testing, Orlando, Fla., vol. 2, pp. 967-974.
Soares, M.M., Lunne, T., and Lacasse, S. 1987. In-situ site investigation techniques and interpretation of offshore practise. Interpretation of dissipation tests in Onsoy clay. Norwegian Geotechnical Institute, Oslo, Norway, Internal Report 40019-5.
Sully, J.P., Campanella, R.G., and Robertson, P.K. 1988. Over- consolidation ratio of clays from penetration pore pressures, ASCE Journal of Geotechnical Engineering, 114(2): 209-216.
Tavenas, F.A., Chapeau, C., La Rochelle, P., and Roy, M. 1974. Immediate settlements of three test embankments on Champlain Clay. Canadian Geotechnical Journal, 11: 109-141.
Tavenas, F., Leblond, P., Jean, P., and Leroueil, S. 1983. The permeability of natural soft clays, part I: methods of laboratory measurement. Canadian Geotechnical Journal, 20: 629-644.
Tavenas, F., Tremblay, M., Larouche, G., and Leroueil, S. 1986. In-situ measurement of permeability in soft clays. Proceedings, ASCE Conference on Use of In-situ Tests in Geotechnical Engineering, Blacksburg, Va. ASCE, New York, pp. 1034-1048.
Teh, C.I., and Houlsby, G.T. 1991. An analytical study of the cone penetration test in clay. Geotechnique, 41: 17-34.
Torstensson, B.A. 1975. Pore pressure sounding instrument. Pro- ceedings, ASCE Specialty Conference on In Situ Measurement of Soil Properties, Raleigh, N.C., vol. 2, pp. 48-54.
Torstensson, B.A. 1977. The pore pressure probe. Nordiske Mote, bergemekanikk, Oslo, Norway, Paper 34, pp. 34.1-34.15.
Tumay, M.T., and Acar, Y.B. 1984. Piezocone penetration testing in soft cohesive soils. In Strength testing of marine sediments: laboratory and in situ measurements. American Society for Testing and Materials, Special Technical Publication 883, pp. 72-82.
Zavoral, D.Z. 1988. Laboratory testing evaluation of cone penetra- tion test co-relations for geotechnical soil parameters. B.A. Sc. thesis, Department of Geological Engineering, University of British Columbia, Vancouver, B.C.


![DELAWARE VALLEY GEO-INSTITUTE - DVGIdvgi.org/Newsletters/October 2011 DVGI Newsletter[1].pdf · swelling pressure, stiffness parameters and coefficient of consolidation using both](https://static.fdocuments.in/doc/165x107/5b29fe497f8b9a251e8b70be/delaware-valley-geo-institute-2011-dvgi-newsletter1pdf-swelling-pressure.jpg)


