Estimating Bargaining-related Tax Advantages of Multina ...
38
6979 2018 April 2018 Estimating Bargaining-related Tax Advantages of Multina- tional Firms Peter H. Egger, Nora M. Strecker, Benedikt Zoller-Rydzek
Transcript of Estimating Bargaining-related Tax Advantages of Multina ...

6979 2018
April 2018
Estimating Bargaining-related Tax Advantages of Multina-tional Firms Peter H. Egger, Nora M. Strecker, Benedikt Zoller-Rydzek

Impressum:
CESifo Working Papers ISSN 2364‐1428 (electronic version) Publisher and distributor: Munich Society for the Promotion of Economic Research ‐ CESifo GmbH The international platform of Ludwigs‐Maximilians University’s Center for Economic Studies and the ifo Institute Poschingerstr. 5, 81679 Munich, Germany Telephone +49 (0)89 2180‐2740, Telefax +49 (0)89 2180‐17845, email [email protected] Editors: Clemens Fuest, Oliver Falck, Jasmin Gröschl www.cesifo‐group.org/wp An electronic version of the paper may be downloaded ∙ from the SSRN website: www.SSRN.com ∙ from the RePEc website: www.RePEc.org ∙ from the CESifo website: www.CESifo‐group.org/wp

CESifo Working Paper No. 6979 Category 1: Public Finance
Estimating Bargaining-related Tax Advantages of Multinational Firms
Abstract Bargaining power may explain the tax differences between multinational and national enterprises beyond MNEs’ profit shifting. Larger firms (mostly MNEs) are more valuable for tax authorities for various reasons. In threatening relocation, larger firms extract greater deductions, resulting in a regressive ETR schedule and lower ETRs for size-related reasons. MNEs face lower relocation costs than NEs, which enhances their bargaining position. Using French firm-level data and entropy balancing, we find that the regressivity of the French tax schedule reduces MNEs’ ETRs by 2.52 percentage points (size effect), while their relocation threat leads to a 3.58 percentage point reduction.
JEL-Codes: H250, H260, F230, C210.
Keywords: profit taxation, multinational firms, entropy balancing.
Peter H. Egger ETH Zurich, KOF
Leonhardstrasse 21, LEE G 116 Switzerland – 8092 Zurich
Nora M. Strecker ETH Zurich, KOF
Leonhardstrasse 21, LEE G 129 Switzerland – 8092 Zurich
Benedikt Zoller-Rydzek ETH Zurich, KOF
Leonhardstrasse 21, LEE G 131 Switzerland – 8092 Zurich
March 23, 2018 The authors gratefully acknowledge financial support by the Swiss National Science Foundation (SNSF). The authors are also grateful to comments from participants at conference sessions of the European Economic Association in Geneva, the International Institute of Public Finance at Lake Tahoe, the 16th Journées Louis-André Gérard-Varet in Aix-en-Provence, and seminar participants at KOF ETH Zurich. In particular, the authors are grateful to Ian Wooton, Farid Toubal, and James Hines, Jr. for helpful advice.
1 Introduction
Multinational enterprises (MNEs) are an integral part of the world economy. They actively engage in
innovation, investment, and trade, provide valuable employment, and generate extensive profits. This is why
many countries run campaigns to lure them into their jurisdictions. However, in the public mind and debate,
MNEs are frequently accused of avoiding, if not evading, taxation, thus reducing the tax base of their host
countries and causing welfare losses. Individual governments and international organizations – in particular
the OECD through its Base Erosion and Profit Shifting (BEPS) initiative – have recently begun to try and
limit the undesirable tax avoidance and evasion strategies of firms, primarily of MNEs, in an attempt to limit
tax-avoidance-related welfare losses. These internationally coordinated efforts mainly aim at profit shifting
activities of MNEs related to transfer pricing, debt shifting, and royalty payments.
The reduction of MNEs’ tax bills via profit shifting channels is well documented. However, this paper
focuses on a less explored channel: bargaining. In nearly every European country, firms are able to bargain
with local governments or tax authorities over possible deductions in order to reduce their tax bill. In
this bargaining game MNEs are favored relative to firms that only operate domestically, leading to higher
tax savings of MNEs. Specifically, we think of the bargaining-related tax gap between MNEs and national
enterprises (NEs) as a composite of three ingredients: one non-discriminatory element available to all firms
and two discriminatory elements only available to MNEs. The two discriminatory elements relate to MNEs’
operations of foreign affiliates: (i) foreign affiliates enable profit shifting to low-tax countries (tax avoidance
and evasion); and (ii) MNEs are more credibly footloose than NEs which adds to their relative bargaining
power for any given firm size and profitability. The non-discriminatory element flows from the empirical
regressivity of tax schedules due to the greater bargaining power of larger and more profitable firms and
leads to increased tax savings for MNEs (see Rego, 2003; Slemrod, 2004), solely rooted in their, on average,
larger size and greater profitability relative to NEs (see Markusen, 2002; Helpman et al., 2004). These
discriminatory and non-discriminatory elements have not been rigorously disentangled in earlier work on the
tax gap between MNEs and NEs, which instead largely focused on profit shifting. The goal of the present
paper is to fill this gap and, by focusing on bargaining-related aspects of tax savings, disentangle and quantify
the discriminatory and non-discriminatory bargaining-related tax savings of MNEs using French firm-level
data.
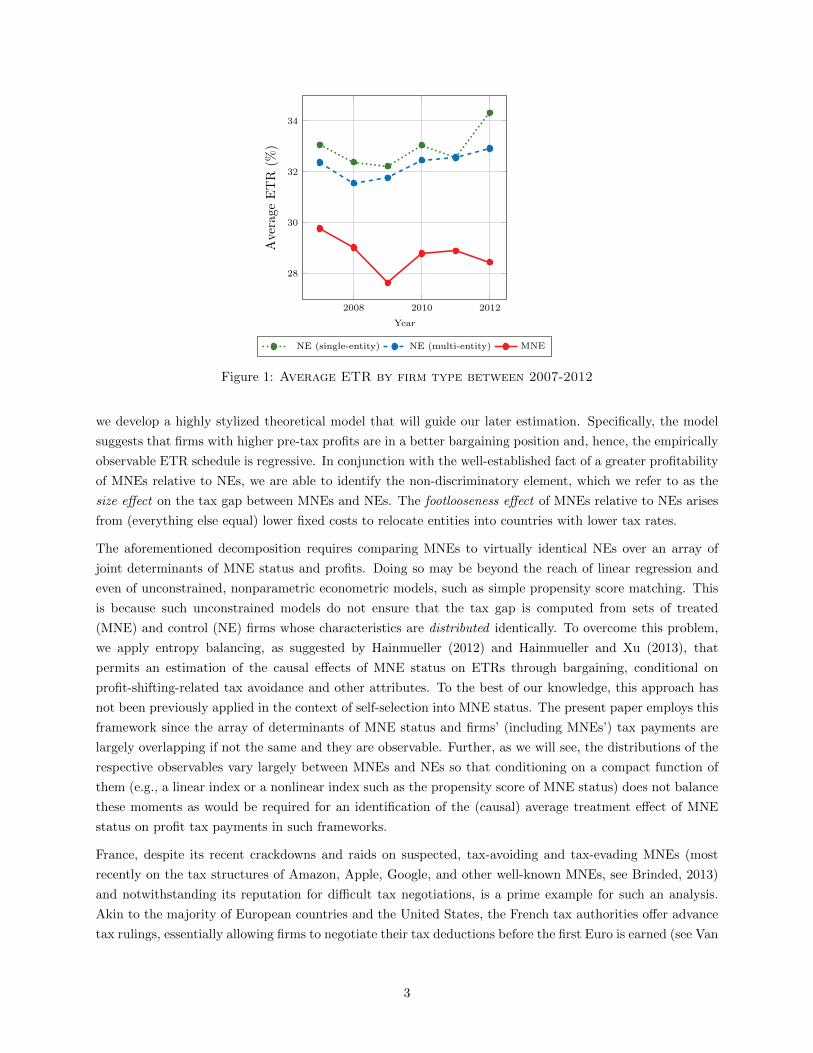
Figure 1 documents the differences in the average ETR (computed as the ratio of annual corporate profit
taxes paid over annual before-tax profits between 2007 and 2012) for three distinct firm types in France as
recorded in Bureau van Dijk’s ORBIS data set: MNEs, multi-entity NEs, and single-entity NEs, where an
entity is an independent unit. The figure suggests that MNEs had systematically lower ETRs than both
types of NEs on average, and the average ETRs of multi-entity NEs were somewhat lower than those of
single-entity NEs. Specifically, the ETR of MNEs is on average 3.42 percentage points lower than that of
multi-entity NEs (with a standard error of 0.30).
We argue that the tax gap between MNEs and NEs does not only root in tax avoidance through profit
shifting or (illegal) tax evasion, but also in the difference in the bargaining power between MNEs and NEs.
In this vein, Rego (2003) and Slemrod (2004) provide evidence that tax savings are positively correlated
with firms’ pre-tax profits, suggesting that the effective tax rate, ETR, declines with pre-tax profits, i.e.,
the ETR schedule of firms is regressive. Egger et al. (2010) show that MNEs have significant tax savings
relative to comparable NEs even for a given pre-tax profit level. Consistent with these empirical findings
2
2008 2010 2012
28
30
32
34
Year
Ave
rage
ET
R(%
)
NE (single-entity) NE (multi-entity) MNE
Figure 1: Average ETR by firm type between 2007-2012
we develop a highly stylized theoretical model that will guide our later estimation. Specifically, the model
suggests that firms with higher pre-tax profits are in a better bargaining position and, hence, the empirically
observable ETR schedule is regressive. In conjunction with the well-established fact of a greater profitability
of MNEs relative to NEs, we are able to identify the non-discriminatory element, which we refer to as the
size effect on the tax gap between MNEs and NEs. The footlooseness effect of MNEs relative to NEs arises
from (everything else equal) lower fixed costs to relocate entities into countries with lower tax rates.
The aforementioned decomposition requires comparing MNEs to virtually identical NEs over an array of
joint determinants of MNE status and profits. Doing so may be beyond the reach of linear regression and
even of unconstrained, nonparametric econometric models, such as simple propensity score matching. This
is because such unconstrained models do not ensure that the tax gap is computed from sets of treated
(MNE) and control (NE) firms whose characteristics are distributed identically. To overcome this problem,
we apply entropy balancing, as suggested by Hainmueller (2012) and Hainmueller and Xu (2013), that
permits an estimation of the causal effects of MNE status on ETRs through bargaining, conditional on
profit-shifting-related tax avoidance and other attributes. To the best of our knowledge, this approach has
not been previously applied in the context of self-selection into MNE status. The present paper employs this
framework since the array of determinants of MNE status and firms’ (including MNEs’) tax payments are
largely overlapping if not the same and they are observable. Further, as we will see, the distributions of the
respective observables vary largely between MNEs and NEs so that conditioning on a compact function of
them (e.g., a linear index or a nonlinear index such as the propensity score of MNE status) does not balance
these moments as would be required for an identification of the (causal) average treatment effect of MNE
status on profit tax payments in such frameworks.
France, despite its recent crackdowns and raids on suspected, tax-avoiding and tax-evading MNEs (most
recently on the tax structures of Amazon, Apple, Google, and other well-known MNEs, see Brinded, 2013)
and notwithstanding its reputation for difficult tax negotiations, is a prime example for such an analysis.
Akin to the majority of European countries and the United States, the French tax authorities offer advance
tax rulings, essentially allowing firms to negotiate their tax deductions before the first Euro is earned (see Van
3
de Velde, 2015, and Waerzeggers and Hillier, 2016, for an extensive overview of tax rulings within Europe).
Huesecken and Overesch (2015) provide some evidence that these advance rulings lead to significantly lower
tax payments. While few of these rulings become public knowledge, there are several suspected cases (e.g.,
Amazon opened distribution centers in France, adding valuable jobs to the economy and revenue to state
coffers after prolonged negotiations with the government, see Le Monde, 2012; Google opened its Paris office
after a big push by the Sarkozy government, see Le Monde, 2010) and a handful of disclosed cases (e.g.,
Vivendi Universal SA, a mass media conglomerate headquartered in France, was permitted to offset the
profits from its semi-owned subsidiaries with losses incurred in 2002, significantly reducing Vivendi’s tax
bill, see ITRWeek, 2004). Furthermore, while the number of audits remains largely constant between 2007
and 2012, coincidentally a time span that covers the Sarkozy presidency of France, the number of penalties
imposed dropped at the beginning of the period and only increased after the beginning of the Hollande
presidency (see Direction Generale des Finances Publiques, 2016). This suggests that French tax authorities
are (at least indirectly) linked to French politics, if not an outright tool in the implementation of French
industrial policy.
The results presented below indicate that, on average and after profit shifting, French MNEs earn 1.53
million more in pre-tax profits than NEs, which, in conjunction with the effectively regressive tax schedule,
translates into an average reduction of an MNE’s ETR by 2.52 percentage points relative to an NE.1 The
direct, bargaining-related effect of being an MNE on the ETR due to MNEs’ greater mobility, controlling
for pre-tax profits, amounts to a 3.58 percentage-point reduction of the ETR on average. Thus, on average,
MNE status reduces the ETR by 6.1 percentage points, conditional on (i.e., after) profit shifting. This effect
is mainly driven by firms in the highest quintile of the pre-tax profit distribution. In fact, an MNE’s status
significantly increases pre-tax profits and dramatically reduces the ETR relative to NEs in France only for
firms in the top quintile.
The remainder of the paper is structured as follows. Section 2 discusses the related literature. Section 3
outlines a stylized model of bargaining over a representative firm’s tax deductions. Section 4 describes the
data and the estimation strategy and presents empirical results. Finally, Section 5 concludes with a brief
summary of the main findings.
2 Related literature
2.1 Sources of MNEs’ tax savings
The public finance literature largely places the difference in ETRs between MNEs and NEs at the door of
profit shifting (see Huizinga and Laeven, 2008; Schindler and Schjelderup, 2013) and its channels through
which MNEs reduce their corporate tax payments, namely transfer pricing (see Davies et al., 2014), debt
shifting (see Egger et al., 2014), and royalty payments (see Karkinsky and Riedel, 2012; Griffith et al., 2014
among others). We take these profit channels into consideration by controlling for observables that capture
them, namely cross-border trading, debt, and intangible asset holdings. Konrad and Stolper (2016) show
under which conditions the tax havens opposed by the OECD and G20 are able to exist, which makes the
1While the statutory tax rate on corporate profits is not regressive in France, French tax law does provide for numerousdeductions and allowances that are related to firm size resulting in an empirically regressive ETR, absent of any bargaining orprofit shifting activities.
4
aforementioned profit shifting methods possible. Kopczuk (2006) argues that the complexity of the tax law
actually makes tax avoidance and shifting more likely. However, while interesting in itself, profit shifting is
not the focus of the present paper, as it has been for long and still is at the heart of interest in the sizable
literature on tax avoidance.
One strand of earlier work addresses aspects of tax savings that are related to firm size. For instance, Grubert
and Slemrod (1998), Rego (2003), Slemrod (2004), and Habu (2017) argue that economies of scale make it
more profitable for MNEs to seek out loop holes in the tax code to reduce their ETRs. Alternatively, Richter
et al. (2009) find that increased lobbying expenditures lead to lowered ETRs in a panel of U.S. firms. These
arguments suggest that the large size of MNEs matters for the affordability of some fixed costs – associated
with tax planning or lobbying. Along this line of thinking, there have been analyses of negotiation- and
lobbying-related tax savings of MNEs relative to NEs. The results in Riedel and Simmler (2018) regarding
the tax setting in German municipalities suggest that a larger business tax base (i.e., many or large firms
present in a particular location) and a high concentration of firms are associated with lower business tax
rates at the regional level. A further reason for the profit tax savings of MNEs relates to their greater
credibility of threatening footlooseness than is the case with NEs. Vandenbussche and Tan (2005) explore
the differences in ETRs between Belgian MNEs and NEs. Their findings suggest that MNEs have better
outside options than NEs, which leads to more bargaining power and lower taxes relative to NEs. Huesecken
and Overesch (2015) show that advance tax rulings (which are tailor-made for MNEs) significantly decrease
the tax payments of MNEs relative to NEs. As such, advance tax rulings are essentially a non-statutory
instrument of tax competition, which itself has been well studied (see Devereux et al., 2002; Hines, 1999
among others), given the importance of MNEs in the global economy. All of these results suggest that larger
firms – in particular, larger MNEs – benefit from their size and economic power in terms of reduced ETRs
beyond profit shifting.
Overall, while there is much documentation of the effective tax savings of MNEs, their magnitude is heavily
debated and may depend on the setting and respective tax authorities. For instance, the results in Egger
et al. (2010) suggest that, among European firms, the absolute tax payments of MNEs are lower than those
of comparable NEs, while the results in Dyreng et al. (2017) suggest that U.S. MNEs indeed face a higher
ETR than U.S. NEs.
2.2 Econometric approach towards estimating the tax savings effect of being
an MNE
In quantifying the effect of the previously noted tax competition on MNE performance, on foreign direct
investment, and location choice, previous work such as in Hines (1999), Gresik (2001), and Devereux and
Maffini (2007) relied on panel data to compare firms or aggregate outcomes just prior to and just after a tax
or law change and across locations (e.g. Dharmapala and Riedel, 2013). Alternatively, other work compared
the outcomes of MNEs and NEs within a given location (see Jog and Tang, 2001; Buettner et al., 2009;
Egger et al., 2010).
In either case, the prevailing framework is based on a selection on (location- and/or firm-level) observables
and either a linear (see Becker and Riedel, 2012) or nonlinear and eventually nonparametric (see Egger et al.,
2010) index of comparability in regression frameworks. Either econometric approach rests on the idea that,
upon conditioning on the (linear or nonlinear) index of observables, any further difference between MNEs
5
and NEs in terms of their (normalized or unnormalized) profit tax payments accrues to a quasi-random
assignment of the MNE-versus-NE status. However, for this to hold, either approach requires that the
distribution of observables behind the index is the same among MNEs (the treated) and NEs (the controls).
Otherwise, some of the differences in profit-tax outcomes that in fact accrue to differences in the distribution
of observable joint determinants of MNE status and tax outcome may be misascribed to MNE status only,
which may in turn lead to biased estimates of the average treatment effect of being an MNE on tax outcomes.
Econometrically, one would generically refer to such a case as one of a lack of covariate balancing.
One approach to overcome this lack of covariate balancing in a selection-on-observables framework has been
proposed by Hainmueller (2012) and Hainmueller and Xu (2013). Rather than assuming such balancing
(as in regression approaches or propensity score matching) and testing against it ex post, Hainmueller’s
entropy balancing enforces covariate balancing in a constrained, nonlinear estimation approach. In a first
step, weights are obtained for each targeted moment of the observables when considering treated and control
(in our case, MNE and NE, respectively) observations subject to balancing constraints. In a second step,
these weights are used in a weighting regression approach, where the outcome is regressed on the treatment
indicator (here, MNE status) to estimate the average treatment effect on outcome. Notice that linear
regression, propensity score matching, and other approaches based on the idea of selection on observables
can be portrayed as special cases of weighting regression approaches towards the estimation of average
treatment effects on outcome (see Wooldridge, 2007).
3 A stylized model of tax bargaining
We are interested in isolating the advantages of being an MNE above and beyond the effects of profit shifting.
In spite of being at odds with many supranational agreements and the desire for policy transparency, advance
tax rulings provide opportunities for unequal treatment of firms by national tax authorities and open the
door to tax bargaining by firms. In this section we develop a stylized theoretical model of tax bargaining
that will be used to inform our estimation. We assume that firms are able to directly negotiate their possible
tax deductions and, by this, their ETRs. For simplicity, we do not differentiate between negotiations over
the fraction of profits that is subject to the domestic tax from those over the ETR, as the outcome would
be isomorphic.2
Formally, we assume that national tax authorities and a generic firm i bargain over the firm’s deductions
from its tax base, Di, taking the statutory tax rate, τ , as given. Firm i’s net profits are then determined as
πni = (1− τ)πi + τDi, (1)
where πi are pre-tax profits. The government’s tax revenues per firm, Ti, are then
Ti = τ(πi −Di). (2)
The firm and the government engage in Nash bargaining over the amount of deductions, Di, where α ∈ [0, 1]
is the bargaining power of the government and (1−α) is the bargaining power of the firm. Let us denote the
2In France and elsewhere, MNEs can negotiate the portion of their profits which will be subject to domestic taxes (seeBergin, 2012). In fact, with the exception of Slovakia, every EU and EFTA country has specific provisions for advance taxrulings.
6

outside option of the firm, i.e., the net profits a firm can generate by relocating its operations to a foreign
country with effective tax rate ETR′i, by (1 − ETR′i)πi − Fi. For simplicity, we assume that the foreign
country is passive; thus, before-tax profits would be the same as at the outset after relocating, and ETR′i
will be the firm’s effective tax rate abroad. Relocating would come at a fixed cost, Fi, which we assume to
depend on the firm’s MNE status. Since MNEs have already established subsidiaries abroad, we assume that
MNEs’ fixed costs of relocating their operations are significantly lower than those of NEs, FMNE < FNE. By
this token, the threat point of an MNE is, ceteris paribus, higher than that of an NE, raising its bargaining
power. Note that in our setup the effective (average) tax rates are relevant and not the marginal ones, as
fixed costs of relocating suggest a lumpy investment decision of firms. A firm will only relocate to a foreign
country if tax savings are high enough to cover the fixed costs. Once a firm decides to relocate, it will do so
with all its profits to maximize (worldwide) net profits.
The solution to the Nash bargaining problem is then
D?i = argmax
Di
[(τ(πi −Di))
α((1− τ)πi + τDi − (1− ETR′i)πi + Fi)1−α] . (3)
The term ((1− τ)πi + τDi − (1− ETR′i)πi + Fi) actually reflects the investment decision and optimization
problem of the firm. Assuming that gross profits are the same in both countries and that the foreign effective
tax rate is lower than the French statutory tax rate, ETR′i < τ , all that prevents a firm to relocate are the
fixed costs, Fi, and possible deductions granted by French tax authorities, Di. Without any deductions firms
with profits above a certain threshold would relocate, while low-profit firms would remain in France. Setting
Di will mitigate differences between the foreign effective tax rate and the French statutory tax rate, but
does not imply that effective marginal tax rates equalize in both countries as long as fixed costs are strictly
positive.
Under the present assumptions equation (3) simplifies to
D?i =
(1− αETR′i
τ
)πi −
α
τFi. (4)
Firm i’s ETR in the domestic country (where it is bargaining with tax authorities) is thus given by
ETRi =τ(πi −D?
i )
πi= α
(ETR′i +
Fiπi
). (5)
Obviously, the ETR increases with the bargaining power of the government, α, and the foreign effective
tax rate, ETR′i. The ETR decreases with pre-tax profits, πi, and is therefore regressive. This regressivity
arises from the opportunity costs of the government. As pre-tax profits rise, domestic tax revenues increase,
while the outside option – no tax revenues from firm i at all – becomes increasingly unattractive. Thus, the
government is willing to grant more tax deductions to a highly profitable firm in order to ensure that it does
not relocate. On the other hand, the ETR also increases with the fixed costs of relocating, Fi, as higher
fixed costs reduce a firm’s ability to credibly threaten relocation and the government is able to negotiate
lower deductions.3
We therefore posit the following:
3If fixed costs are zero and tax authorities in both countries have the same bargaining power α, equation (5) suggests thatthe effective marginal tax rates and effective average tax rates in both countries are the same for a firm i.
7
Proposition: (i) The effective profit tax schedule of firms is downward sloping with their pre-tax profits,
i.e., the ETR is regressive. (ii) The ETR increases with the fixed costs of relocating. If FMNE < FNE, MNEs
face lower ETRs than NEs with the same level of pre-tax profits in equilibrium. (iii) The ETR increases with
the foreign (effective) tax rate. (iv) The ETR is less regressive when the fixed costs of relocation are higher.
See the proof in Appendix A.
The effect in (iv) can be obtained by taking the cross-derivative of equation (5) with respect to profits, πi,
and fixed costs, Fi. Graphically speaking, the ETR schedules of MNEs and NEs are both downward sloping.
However, with FMNE < FNE, the ETR schedule of NEs is above the one of MNEs, but MNEs’ ETR slope is
steeper (more negative). While the ETR schedule is downward sloping due to the size effect and is thereby
independent of MNE status, the difference in slope and intercept of the ETR schedule can be explained by
the greater footlooseness of MNEs.
In Appendix B we extend the above stylized model by introducing tax competition between French tax
authorities and a generic foreign country. Then, ETR′i is determined endogenously within the model. More-
over, we allow for different profit opportunities in the foreign country. Specifically, if a French firm relocates
to a foreign country, profits may be lower (or higher) which changes the outside option in our bargaining
framework. We show that predictions (i), (ii), and (iv) of the aforementioned proposition are not affected
by those modifications.
4 Empirical analysis
This section is devoted to assessing and quantifying some of the core insights from the stylized model above
based on firm-level data. We do so in two parts. First, we demonstrate that some of the key model predictions
are consistent with simple correlations found in the data. Second, we establish a causal relationship between
MNE status and the effects of size and footlooseness on MNEs’ ETRs, above and beyond the effects of profit
shifting.
The stylized model does not include profit shifting activities or illegal tax evasion (to the extent that pre-tax
profits do not depend on statutory tax rates and deductions). Hence, any gap in ETRs between MNEs
and NEs is assumed to solely accrue to bargaining between tax authorities and firms. This is not generally
the case in the data. Hence, in the empirical framework we must control for profit shifting activities, such
as debt shifting, royalty payments, and transfer pricing, in order to not misascribe the difference in ETRs
between MNEs and NEs to bargaining. Only the residual or conditional difference in ETRs (above and
beyond profit shifting) between MNEs and NEs can and will be attributed to the bargaining of high-profit
firms relative to low-profit firms in general and of mobile MNEs relative to less mobile NEs in particular.
We will demonstrate later that this remaining difference but can be attributed to firm size independent of
MNE status and the greater footlooseness of MNEs relative to identical NEs given their declared profits and
must not necessarily be due to evasion.
In what follows, it is useful to distinguish between an entity – i.e., an independent unit of operation within
a firm (such as an affiliate or the headquarters) – and a firm. The latter is the conglomerate of all affiliates
and the headquarters, while the former is an individual component of that very conglomerate.
8

4.1 Data description
Data that would permit an assessment of bargaining above and beyond profit shifting on MNEs’ relative to
NEs’ ETRs must contain information on firms’ MNE status, profits, tax payments, and observable variables
that capture profit shifting (such as information on debt levels, trade activities, and intangibles). Large
collections of firm- (or, better, entity-) level data such as Bureau van Dijk’s ORBIS database provide these
ingredients for a limited set of countries – foremost France, parts of south-eastern Europe, and China. Of
those countries, France is a prime candidate: it hosts and headquarters a large number of MNEs and NEs,
it levies relatively high profit tax rates, and its economic and political institutions are representative of an
industrial economy, including the use of advance tax rulings. We therefore extract the relevant information
on French NEs, French MNEs with entities abroad (foreign affiliates), and foreign MNEs with affiliates in
France between the years 2007 and 2012. For the sake of better comparability of French NEs with MNEs
in the sample, we only include NEs with at least two entities. Every firm in the estimation sample is thus
a multi-entity enterprise.4 We define MNEs as having at least one affiliated entity in a country other than
where they are headquartered (France or abroad) in which they hold an ownership share of more than 50%.
We only use firms with unconsolidated accounts, which allows us to calculate firms’ local profit tax payments
and their respective ETRs. We compute the ETR from the ratio of total local profit tax payments (which in
France only includes corporate profit taxes) over local pre-tax profits (which in France account for operating
and financial profits/losses). We clean the data by deleting firms with abnormal returns, negative revenues,
and data errors showing excessive ETRs outside the interval of [0%, 100%]. Moreover, we restrict the sample
to firms with (i) profit tax payments of at least e763,000 and (ii) operating revenues that do not exceed e250
million. The first restriction ensures that all firms in the sample are subject to the 3.3% social contribution
surtax, while the second restriction ensures that firms in the sample are not subject to the 10.7% surtax
added after 2011. The applicable statutory tax rate between 2007 and 2012 is thus 34.43% for all firms in
the data. Restricting our sample in this way has two advantages. First, having the same statutory tax rate
for all firms eliminates a confounding factor. Second, excluding very big firms, mainly MNEs, makes the two
samples of MNEs and NEs in the data more comparable. Only a small share of the firms in our sample are
classified as small and medium sized entities by the French government.5 Most of the firms we consider are
larger firms from the perspective of the French government and we have reason to believe that these firms are
able to negotiate tax deductions. Moreover, we are interested in heterogeneous effects due to size differences
of firms, thus not focusing exclusively on very large firms helps us to identify the bargaining channel.
Table 1: Entities in France by type
Entities Obs Percent
Domestic multi-entity 1 758 3 246 69.64Multinational 632 1 415 30.36
Total 2 390 4 661
Imposing these restrictions yields a sample of 2,390 entities (4,661 entity-year observations) located in France.
632 of these entities (1,415, or 30.36% of the entity-year observations) are MNEs. Table 1 reports the
composition of the sample and Table 2 summarizes the entities’ observable characteristics. Of the 632 MNE
entities in France, 289 are the French subsidiaries of foreign owners, 273 are the French owners of foreign
4The results below, however, are insensitive to the inclusion of single-entity NEs.5Small and medium sized firms are defined by a total revenues below e50 million and less than 200 employees.
9
subsidiaries, and 70 are foreign-owned French subsidiaries which themselves own foreign subsidiaries. For
this last category of entities, the host country of the foreign owner of the French entity always charges a
higher tax rate than the lowest-tax host country of the foreign subsidiary of the same French entity.
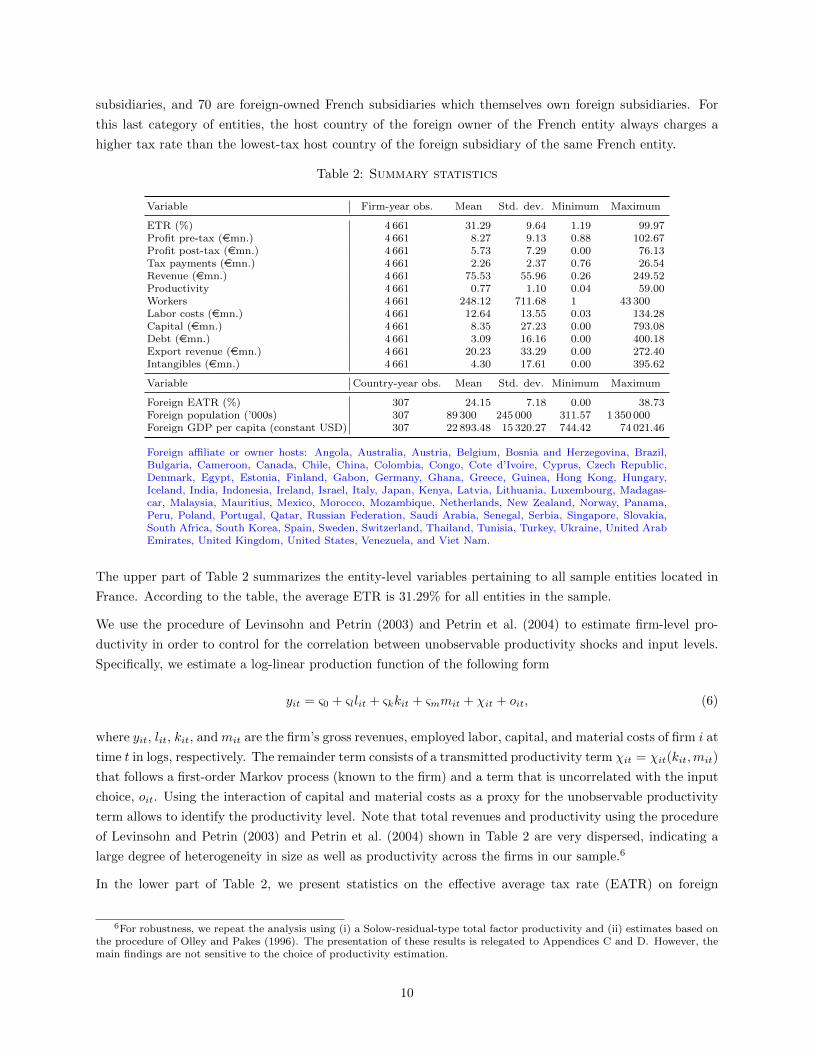
Table 2: Summary statistics
Variable Firm-year obs. Mean Std. dev. Minimum Maximum
ETR (%) 4 661 31.29 9.64 1.19 99.97Profit pre-tax (emn.) 4 661 8.27 9.13 0.88 102.67Profit post-tax (emn.) 4 661 5.73 7.29 0.00 76.13Tax payments (emn.) 4 661 2.26 2.37 0.76 26.54Revenue (emn.) 4 661 75.53 55.96 0.26 249.52Productivity 4 661 0.77 1.10 0.04 59.00Workers 4 661 248.12 711.68 1 43 300Labor costs (emn.) 4 661 12.64 13.55 0.03 134.28Capital (emn.) 4 661 8.35 27.23 0.00 793.08Debt (emn.) 4 661 3.09 16.16 0.00 400.18Export revenue (emn.) 4 661 20.23 33.29 0.00 272.40Intangibles (emn.) 4 661 4.30 17.61 0.00 395.62
Variable Country-year obs. Mean Std. dev. Minimum Maximum
Foreign EATR (%) 307 24.15 7.18 0.00 38.73Foreign population (’000s) 307 89 300 245 000 311.57 1 350 000Foreign GDP per capita (constant USD) 307 22 893.48 15 320.27 744.42 74 021.46
Foreign affiliate or owner hosts: Angola, Australia, Austria, Belgium, Bosnia and Herzegovina, Brazil,Bulgaria, Cameroon, Canada, Chile, China, Colombia, Congo, Cote d’Ivoire, Cyprus, Czech Republic,Denmark, Egypt, Estonia, Finland, Gabon, Germany, Ghana, Greece, Guinea, Hong Kong, Hungary,Iceland, India, Indonesia, Ireland, Israel, Italy, Japan, Kenya, Latvia, Lithuania, Luxembourg, Madagas-car, Malaysia, Mauritius, Mexico, Morocco, Mozambique, Netherlands, New Zealand, Norway, Panama,Peru, Poland, Portugal, Qatar, Russian Federation, Saudi Arabia, Senegal, Serbia, Singapore, Slovakia,South Africa, South Korea, Spain, Sweden, Switzerland, Thailand, Tunisia, Turkey, Ukraine, United ArabEmirates, United Kingdom, United States, Venezuela, and Viet Nam.
The upper part of Table 2 summarizes the entity-level variables pertaining to all sample entities located in
France. According to the table, the average ETR is 31.29% for all entities in the sample.
We use the procedure of Levinsohn and Petrin (2003) and Petrin et al. (2004) to estimate firm-level pro-
ductivity in order to control for the correlation between unobservable productivity shocks and input levels.
Specifically, we estimate a log-linear production function of the following form
yit = ς0 + ςllit + ςkkit + ςmmit + χit + oit, (6)
where yit, lit, kit, and mit are the firm’s gross revenues, employed labor, capital, and material costs of firm i at
time t in logs, respectively. The remainder term consists of a transmitted productivity term χit = χit(kit,mit)
that follows a first-order Markov process (known to the firm) and a term that is uncorrelated with the input
choice, oit. Using the interaction of capital and material costs as a proxy for the unobservable productivity
term allows to identify the productivity level. Note that total revenues and productivity using the procedure
of Levinsohn and Petrin (2003) and Petrin et al. (2004) shown in Table 2 are very dispersed, indicating a
large degree of heterogeneity in size as well as productivity across the firms in our sample.6
In the lower part of Table 2, we present statistics on the effective average tax rate (EATR) on foreign
6For robustness, we repeat the analysis using (i) a Solow-residual-type total factor productivity and (ii) estimates based onthe procedure of Olley and Pakes (1996). The presentation of these results is relegated to Appendices C and D. However, themain findings are not sensitive to the choice of productivity estimation.
10
corporate profits,7 and foreign country-size measures of population and real per-capita income from the
World Bank’s World Development Indicators for those foreign countries in which the multinational entities
in the sample either have foreign affiliates or foreign owners. Overall, the aforementioned 1,415 entity-year
MNE observations are nested in 307 country-year observations involving 72 countries. In the case of multiple
foreign affiliates (entities) per firm, we use country-level data for the lowest-taxing foreign location.8
4.2 Stylized correlations
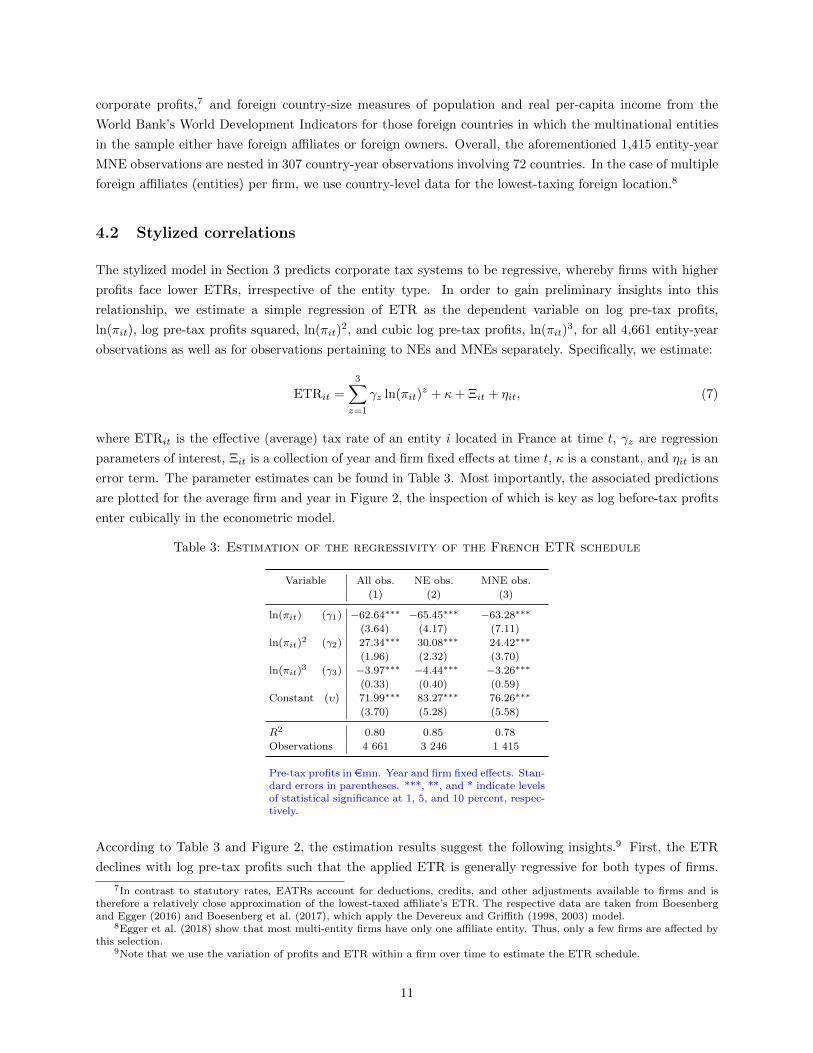
The stylized model in Section 3 predicts corporate tax systems to be regressive, whereby firms with higher
profits face lower ETRs, irrespective of the entity type. In order to gain preliminary insights into this
relationship, we estimate a simple regression of ETR as the dependent variable on log pre-tax profits,
ln(πit), log pre-tax profits squared, ln(πit)2, and cubic log pre-tax profits, ln(πit)
3, for all 4,661 entity-year
observations as well as for observations pertaining to NEs and MNEs separately. Specifically, we estimate:
ETRit =
3∑z=1
γz ln(πit)z + κ+ Ξit + ηit, (7)
where ETRit is the effective (average) tax rate of an entity i located in France at time t, γz are regression
parameters of interest, Ξit is a collection of year and firm fixed effects at time t, κ is a constant, and ηit is an
error term. The parameter estimates can be found in Table 3. Most importantly, the associated predictions
are plotted for the average firm and year in Figure 2, the inspection of which is key as log before-tax profits
enter cubically in the econometric model.
Table 3: Estimation of the regressivity of the French ETR schedule
Variable All obs. NE obs. MNE obs.
(1) (2) (3)
ln(πit) (γ1) −62.64∗∗∗ −65.45∗∗∗ −63.28∗∗∗
(3.64) (4.17) (7.11)
ln(πit)2 (γ2) 27.34∗∗∗ 30.08∗∗∗ 24.42∗∗∗
(1.96) (2.32) (3.70)
ln(πit)3 (γ3) −3.97∗∗∗ −4.44∗∗∗ −3.26∗∗∗
(0.33) (0.40) (0.59)
Constant (υ) 71.99∗∗∗ 83.27∗∗∗ 76.26∗∗∗
(3.70) (5.28) (5.58)
R2 0.80 0.85 0.78
Observations 4 661 3 246 1 415
Pre-tax profits in emn. Year and firm fixed effects. Stan-dard errors in parentheses. ***, **, and * indicate levelsof statistical significance at 1, 5, and 10 percent, respec-tively.
According to Table 3 and Figure 2, the estimation results suggest the following insights.9 First, the ETR
declines with log pre-tax profits such that the applied ETR is generally regressive for both types of firms.
7In contrast to statutory rates, EATRs account for deductions, credits, and other adjustments available to firms and istherefore a relatively close approximation of the lowest-taxed affiliate’s ETR. The respective data are taken from Boesenbergand Egger (2016) and Boesenberg et al. (2017), which apply the Devereux and Griffith (1998, 2003) model.
8Egger et al. (2018) show that most multi-entity firms have only one affiliate entity. Thus, only a few firms are affected bythis selection.
9Note that we use the variation of profits and ETR within a firm over time to estimate the ETR schedule.
11

Second, the MNEs’ ETR schedule is situated below the NEs’ ETR schedule. Third, the ETR schedule of
MNEs has a steeper slope and is thus more regressive over most of the range of pre-tax profits we consider in
our sample. The (unconditional) results from this simple empirical exercise are in line with the hypotheses
of the stylized model summarized by the proposition in Section 3. To make the results clearer we present
the two ETR schedules in Figure 2.
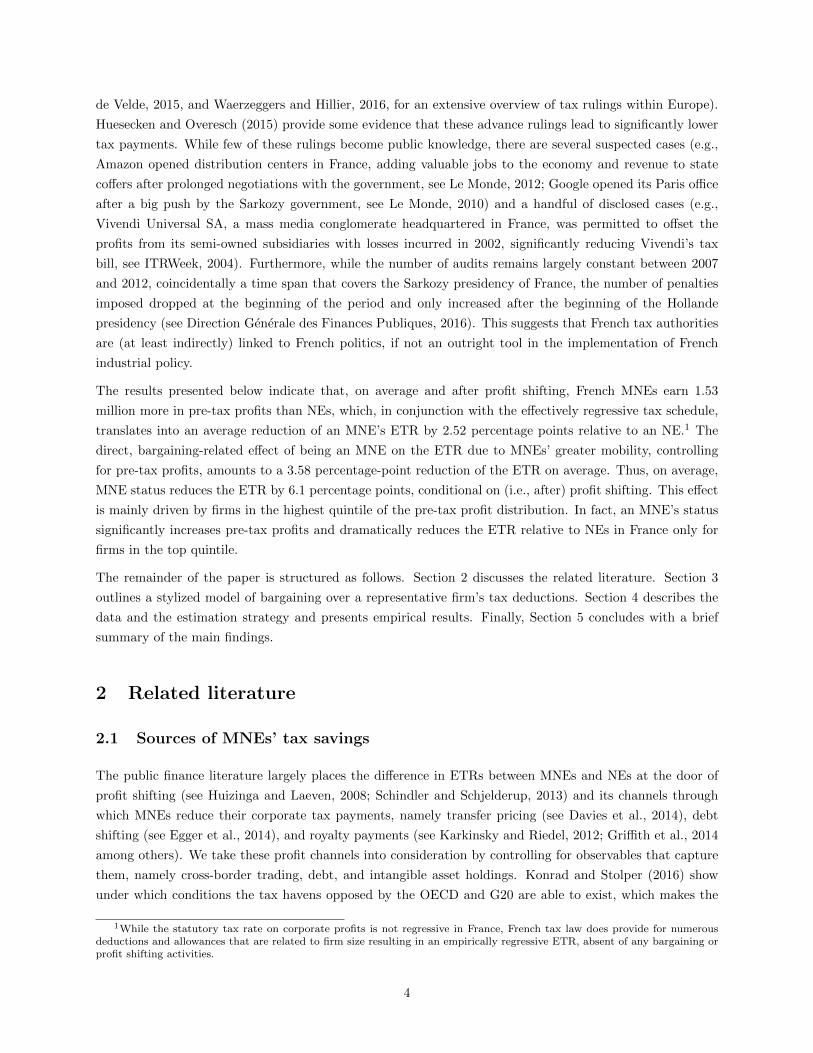
Moreover, we can use Figure 2 to visualize the two bargaining effects of being an MNE on the ETR. A
movement along the NEs’ ETR schedule (from point A to B) corresponds to the size effect, higher profits
due to the MNE status translate to a lower ETR given the regressivity of the ETR schedule. Switching from
the NEs’ ETR schedule to the MNEs’ ETR schedule (from point B to C) gives us the footlooseness effect
of being an MNE. The move from point A to C is the overall effect, which can be decomposed into the size
and the footlooseness effect.
0 1 2 3 4
20
40
60
80
100
Size effect
Footloosenesseffect
A
B
C
Pre-tax profits in ln(emn.)
Ave
rage
ET
R(%
)
NE MNE
Figure 2: Predicted ETR
Next, we focus on a theory-guided estimation of the determinants of the ETR based on equation (5).
Specifically we emphasize the role of fixed costs, Fi. In doing so, we focus entirely on MNEs – either
ones whose parent firms are located in France or ones whose parent firms are located abroad with at least
one affiliate in France. Following the aforementioned proposition, the ETR of a French MNE entity should
increase with the foreign (effective) tax rate, according to equation (5), at any level of fixed costs of relocating.
In addressing the role of foreign (effective) profit tax rates on the ETR, we amend the specification in
equation (7) by including the foreign effective tax rate of the country in which the French entity has an
affiliate. Because we cannot precisely estimate the foreign effective tax rate, ETRit, of the affiliated entities
of firm i, we use the effective average tax rate in the foreign country, EATR’it as a proxy. The latter is
however a good measure of effective foreign taxation a firm could expect after relocating. For these tax
rates, we use the lowest EATR within the foreign network of each MNE to measure EATR′it and estimate
the following equation:
ETRit =
3∑z=1
βz ln(πit)z + ϕEATR′it + Γit + εit, (8)
where ETRit is the effective tax rate of a French entity i at time t, and ln(πit) are the log pre-tax profits of
12
this entity. EATR′it is the effective average tax rate of the lowest-tax, foreign country in i’s network at time
t, Γit contains a collection of fixed effects in the dimension of years, foreign-lowest-tax-country in i’s MNE
network at time t, and the main sector affiliation of i at time t, and εit is an error term.10
In the estimation, we restrict our sample to MNEs, where the foreign (effective average) tax rate is observable.
We also distinguish between foreign-owned entities (designated foreign parents), which includes all foreign-
owned entities in France, irrespective of whether they themselves hold foreign entities or not, and foreign-
affiliate-owning French entities (designated French parents), which includes all French entities that own
affiliates abroad, irrespective of whether the French entities are headquarters or are themselves foreign-
owned. Hence, there is some small overlap in the samples.11 Overall, we suspect that the relocation costs
of a headquarters are higher than those of an affiliated firm with the headquarters abroad. Thus, the ETR
schedule should be more regressive for the former, while for both subgroups a higher foreign effective tax
rate would increase an MNE entity’s ETR in France.
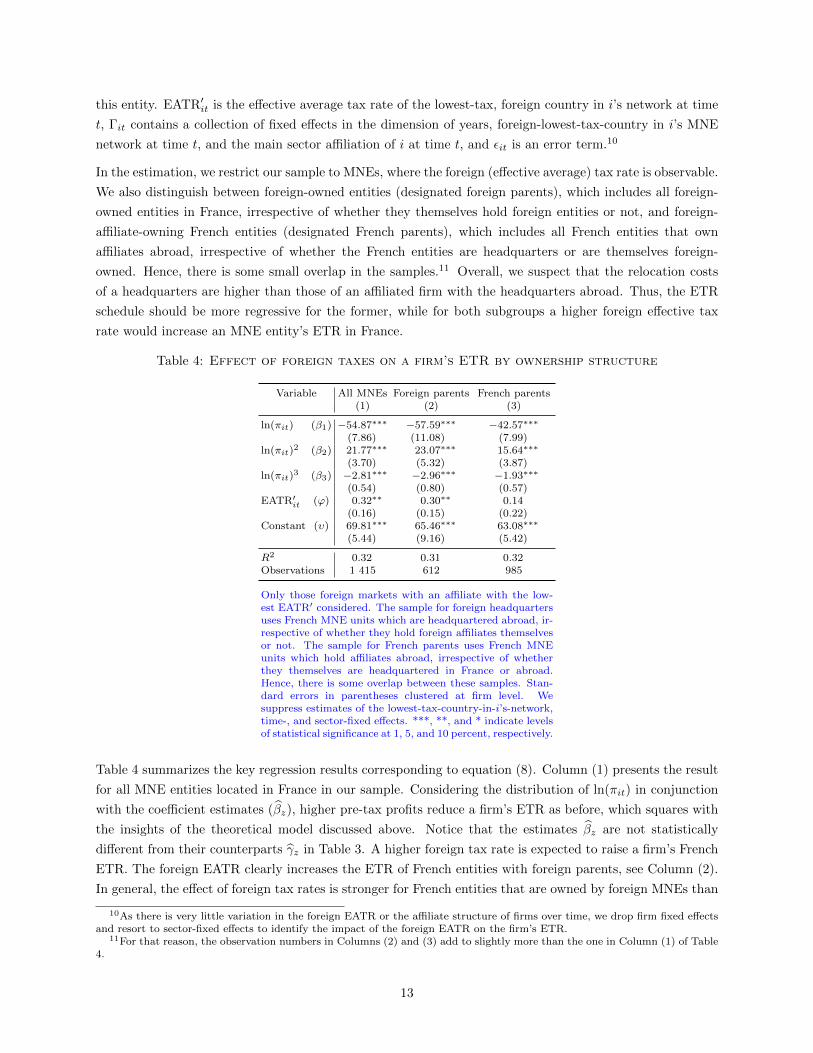
Table 4: Effect of foreign taxes on a firm’s ETR by ownership structure
Variable All MNEs Foreign parents French parents(1) (2) (3)
ln(πit) (β1) −54.87∗∗∗ −57.59∗∗∗ −42.57∗∗∗
(7.86) (11.08) (7.99)ln(πit)
2 (β2) 21.77∗∗∗ 23.07∗∗∗ 15.64∗∗∗
(3.70) (5.32) (3.87)ln(πit)
3 (β3) −2.81∗∗∗ −2.96∗∗∗ −1.93∗∗∗
(0.54) (0.80) (0.57)EATR′it (ϕ) 0.32∗∗ 0.30∗∗ 0.14
(0.16) (0.15) (0.22)Constant (υ) 69.81∗∗∗ 65.46∗∗∗ 63.08∗∗∗
(5.44) (9.16) (5.42)
R2 0.32 0.31 0.32Observations 1 415 612 985
Only those foreign markets with an affiliate with the low-est EATR′ considered. The sample for foreign headquartersuses French MNE units which are headquartered abroad, ir-respective of whether they hold foreign affiliates themselvesor not. The sample for French parents uses French MNEunits which hold affiliates abroad, irrespective of whetherthey themselves are headquartered in France or abroad.Hence, there is some overlap between these samples. Stan-dard errors in parentheses clustered at firm level. Wesuppress estimates of the lowest-tax-country-in-i’s-network,time-, and sector-fixed effects. ***, **, and * indicate levelsof statistical significance at 1, 5, and 10 percent, respectively.
Table 4 summarizes the key regression results corresponding to equation (8). Column (1) presents the result
for all MNE entities located in France in our sample. Considering the distribution of ln(πit) in conjunction
with the coefficient estimates (βz), higher pre-tax profits reduce a firm’s ETR as before, which squares with
the insights of the theoretical model discussed above. Notice that the estimates βz are not statistically
different from their counterparts γz in Table 3. A higher foreign tax rate is expected to raise a firm’s French
ETR. The foreign EATR clearly increases the ETR of French entities with foreign parents, see Column (2).
In general, the effect of foreign tax rates is stronger for French entities that are owned by foreign MNEs than
10As there is very little variation in the foreign EATR or the affiliate structure of firms over time, we drop firm fixed effectsand resort to sector-fixed effects to identify the impact of the foreign EATR on the firm’s ETR.
11For that reason, the observation numbers in Columns (2) and (3) add to slightly more than the one in Column (1) of Table4.
13

for French parent entities, where the effect is not significant, see Column (3). Implicitly, this means that
foreign-owned affiliates in France are gaining more from bargaining and, in the context of the theoretical
model, the bargaining power, α, of foreign owned affiliates is higher than that of French-owned entities.
We undertake a similar analysis using foreign statutory tax rates, and the associated results confirm the
assumption that effective tax rates are the relevant indicator of foreign taxation over statutory tax rates.12
Furthermore, we undertake a one-sided t-test of the assumption that the coefficient on EATR’ in Column
(2) is higher than and significantly different from the coefficient on EATR’ in Column (3). To that end, we
run the following two models using ρit to denote the error term:
ETRit =
3∑z
(%z ln(πit)z + φz (ForeignParentit × ln(πit)
z))
+ ψEATR′it +$ (ForeignParentit × EATR′it) + ρit,
(9)
where the test on joint significance of φz and $ results in an F-statistic of 3.13, which is significant at the
95% level, while the one-sided t-test for ϑ is not significant. Additionally, we run the following regression:
ETRit =
3∑z
%z ln(πit)z + ψEATR′it +$ (ForeignParentit × EATR′it) + ρit, (10)
where we force the coefficient %z to be the same for foreign-owned and French-owned firms, which results in
a significant coefficient for $ of -0.04 with a statistically standard error of 0.02.
4.3 Entropy balancing to establish causal relationships
Even though we can measure firms’ profits in France and estimate the shape of the nexus of profits and the
ETR, we cannot straightforwardly compare MNEs and NEs in terms of profits and the associated ETR to
gauge the bargaining component in ETRs, since MNEs can manipulate their profits in a way that is beyond
the reach of NEs. This leads to endogeneity of profits, ln(πit), in the above estimations. We address this by
using entropy balancing, which is a generalized weighting procedure. In doing so, we allow profits and MNE
status to be simultaneously determined by a set of observables.
Being an MNE affects the tax rate in two ways. (i) All else equal (meaning in the absence of or beyond profit
shifting), MNEs have higher profits on average (see Helpman et al., 2004), which mechanically reduces their
effective tax rate if the ETR schedule is regressive. (ii) MNEs are in a better bargaining position relative
to NEs and can thus reduce their tax burden even further. The first, the size effect, is related to the better
bargaining position of larger firms, while the latter, the footlooseness effect, arises from the reduced perceived
or expected costs of MNEs to relocate. Thus, we first need to estimate profits that are free of profit shifting
aspects to arrive at comparable units between NEs and MNEs. For this, we use a procedure capable of
retrieving the average difference between NEs and MNEs in terms of their (log) profits after conditioning on
a broad set of controls, including variables that are typically indicative of profit shifting, i.e., export volumes,
debt, and intangible assets. The remaining control variables are joint determinants of (revealed) profitability
and MNE status such that the obtained conditional mean is characterized by the same targeted moments of
the distribution of each and every such joint determinant between MNEs and NEs.
12Statutory tax rates are only somewhat significant in similar regressions.
14
We apply entropy balancing as proposed by Hainmueller (2012) and Hainmueller and Xu (2013). Akin
to other approaches invoking a selection (into treatment; here, MNE status) on observables which jointly
determine treatment status as well as outcome (in this case, (log) pre-tax profits or the French ETR), en-
tropy balancing lends itself to a weighting regression framework. With traditional approaches (such as linear
regression or propensity score matching), the weights are obtained in a way that is unconditional on the
distribution of the observables between the treated and the untreated. This is true for linear regression,
where all weights are identical, as well as for propensity score matching, which can be considered an in-
verse propensity-score-weighting regression (see Wooldridge, 2007). Differences in the covariate distributions
between the treated and the untreated observations may confound any identification of the parametric or
nonparametric link between treatment status and outcome. Entropy balancing avoids this problem by deter-
mining the weights subject to constraints which enforce the balancing of targeted moments of the distribution
of observables – captured by the respective entropy in the covariates – between the samples of MNE and NE
data points.
Specifically, we are interested in the average treatment effect on the treated (ATT) – the effect of being an
MNE on the MNEs in the data. After subsuming all observables into the vector Xit, we can drop entity-time
indices it and write the ATT as
ATT = E [ETR|MNE = 1]−∫E [ETR|X = x,MNE = 1] fX|MNE=1(x)dx, (11)
wherein ETR denotes the ETR outcome associated with MNE status, MNE, and X are the observable joint
determinants of MNE status and the ETR. The ATT is identified by selecting on a range of observables,
such that the ETR is independent of the MNE treatment status given the observables. This holds as long
as there is some overlap between the treated and the untreated in the values that the observables (x) may
take within the support of the observables among the treated, fX|MNE=1. In order to estimate this last
term, the covariate distribution of the control group’s observables must be adjusted to match the covariate
distribution of the treated. This enforces the orthogonality of the treatment indicator, MNE, and the
observables which is required for a causal inference of the treatment effect (see Hainmueller and Xu, 2013).
Moreover, this procedure automatically closes the gap between the ATT and the average treatment effect
(ATE), which is not the case when the balancing of the distribution of observables is not enforced. In
drawing a random entity from the data of MNEs and NEs, the predicted effect of being an MNE relative
to being an NE on either outcome (profits or the ETR) is the same under entropy balancing regression
but not under a propensity score weighting regression, which does not constrain the distribution of the
observables to be the same between treated and untreated units. Accordingly, entropy balancing generalizes
the unconstrained weighting approaches of treatment effects under a selection on observables, including
propensity score matching. Relative to unconstrained weighting approaches, entropy balancing gives greater
weight to observations in the control group that are similar to observations in the treatment group in terms
of the observables.
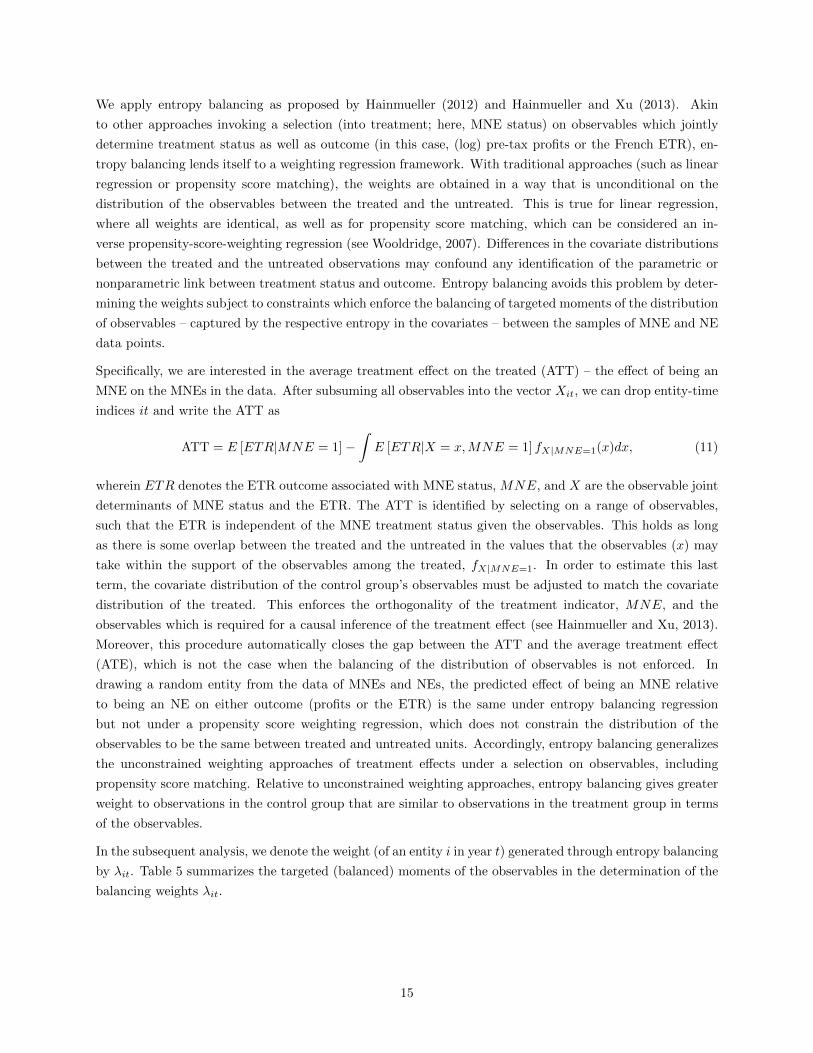
In the subsequent analysis, we denote the weight (of an entity i in year t) generated through entropy balancing
by λit. Table 5 summarizes the targeted (balanced) moments of the observables in the determination of the
balancing weights λit.
15
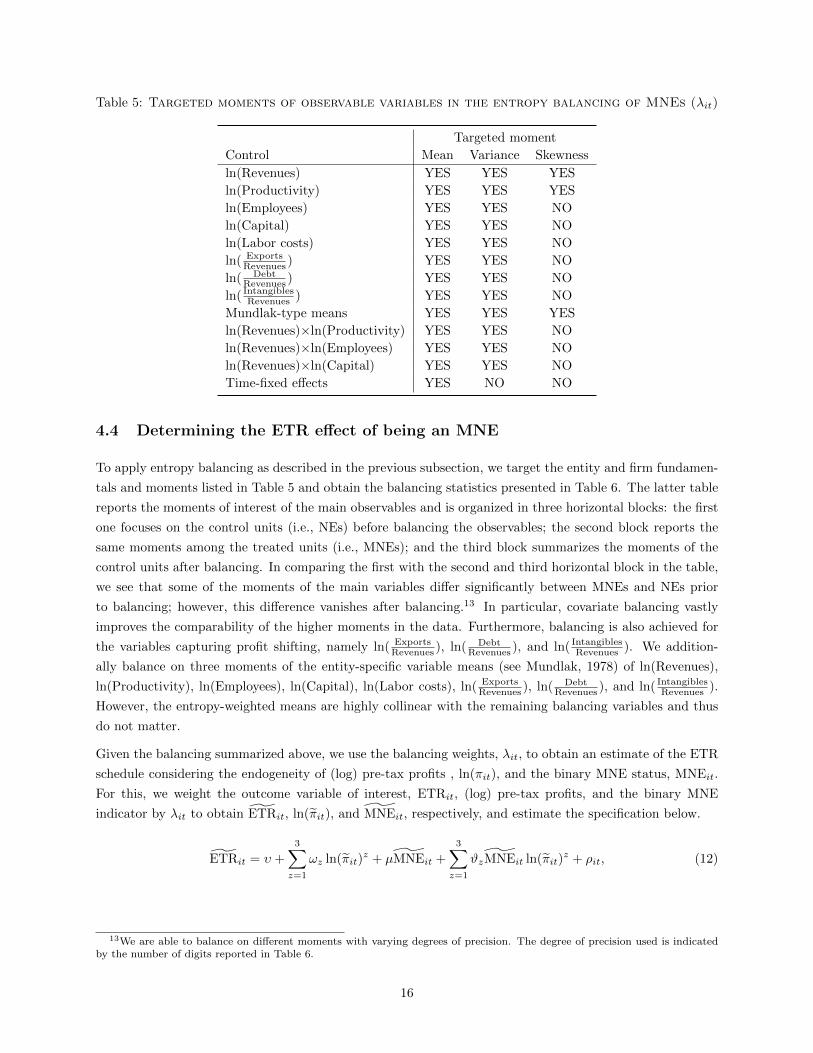
Table 5: Targeted moments of observable variables in the entropy balancing of MNEs (λit)
Targeted moment
Control Mean Variance Skewness
ln(Revenues) YES YES YES
ln(Productivity) YES YES YES
ln(Employees) YES YES NO
ln(Capital) YES YES NO
ln(Labor costs) YES YES NO
ln( ExportsRevenues ) YES YES NO
ln( DebtRevenues ) YES YES NO
ln( IntangiblesRevenues ) YES YES NO
Mundlak-type means YES YES YES
ln(Revenues)×ln(Productivity) YES YES NO
ln(Revenues)×ln(Employees) YES YES NO
ln(Revenues)×ln(Capital) YES YES NO
Time-fixed effects YES NO NO
4.4 Determining the ETR effect of being an MNE
To apply entropy balancing as described in the previous subsection, we target the entity and firm fundamen-
tals and moments listed in Table 5 and obtain the balancing statistics presented in Table 6. The latter table
reports the moments of interest of the main observables and is organized in three horizontal blocks: the first
one focuses on the control units (i.e., NEs) before balancing the observables; the second block reports the
same moments among the treated units (i.e., MNEs); and the third block summarizes the moments of the
control units after balancing. In comparing the first with the second and third horizontal block in the table,
we see that some of the moments of the main variables differ significantly between MNEs and NEs prior
to balancing; however, this difference vanishes after balancing.13 In particular, covariate balancing vastly
improves the comparability of the higher moments in the data. Furthermore, balancing is also achieved for
the variables capturing profit shifting, namely ln( ExportsRevenues ), ln( Debt
Revenues ), and ln( IntangiblesRevenues ). We addition-
ally balance on three moments of the entity-specific variable means (see Mundlak, 1978) of ln(Revenues),
ln(Productivity), ln(Employees), ln(Capital), ln(Labor costs), ln( ExportsRevenues ), ln( Debt
Revenues ), and ln( IntangiblesRevenues ).
However, the entropy-weighted means are highly collinear with the remaining balancing variables and thus
do not matter.
Given the balancing summarized above, we use the balancing weights, λit, to obtain an estimate of the ETR
schedule considering the endogeneity of (log) pre-tax profits , ln(πit), and the binary MNE status, MNEit.
For this, we weight the outcome variable of interest, ETRit, (log) pre-tax profits, and the binary MNE
indicator by λit to obtain ETRit, ln(πit), and MNEit, respectively, and estimate the specification below.
ETRit = υ +
3∑z=1
ωz ln(πit)z + µMNEit +
3∑z=1
ϑzMNEit ln(πit)z + ρit, (12)
13We are able to balance on different moments with varying degrees of precision. The degree of precision used is indicatedby the number of digits reported in Table 6.
16

Table 6: Pre-tax profit Balancing: French MNEs and domestic multi-entity firms
Control Treatment Control balanced
Mean Variance Skewness Mean Variance Skewness Mean Variance Skewness
ln(Revenues) 17.81 0.679 −0.4084 17.93 0.639 −0.9671 17.93 0.639 −0.9671
ln(Productivity) 6.490 0.151 1.136 6.563 0.256 2.109 6.564 0.256 2.109
ln(Employees) 4.85 1.37 4.99 1.38 4.99 1.38
ln(Capital) 14.42 3.03 14.97 2.76 14.97 2.76
ln(Labor costs) 16 1.153 16 1.072 16 1.072
ln( ExportsRevenues
) 0.225 0.082 0.359 0.087 0.359 0.087
ln( DebtRevenues
) 0.03263 0.029 0.07544 0.199 0.07544 0.199
ln( IntangiblesRevenues
) 0.05729 0.056 0.07284 0.091 0.07284 0.091
where ωz gives the coefficients of the ETR schedule for NEs and where µ and ϑz are components of the
conditional ATT and ATE of MNE status on the ETR beyond profit shifting, i.e., the change of the ETR
intersection and slope due to being an MNE, respectively. The parameter υ is a constant and ρit is an error
term. Since we condition on domestic-versus-foreign average tax- and profit-shifting-related differences in
the pre-tax profits when estimating ωz in equation (12), any remaining ATT (and ATE) of being an MNE
on the ETR is attributable to the footlooseness effect of being an MNE.
Table 7: Pre-tax profit balancing: French MNEs and domestic multi-entity firms
Variable Coef.
ln(π) (ω1) −48.65∗∗∗
(6.00)
ln(π)2 (ω2) 20.52∗∗∗
(3.29)
ln(π)3 (ω3) −2.76∗∗∗
(0.56)
MNE (µ) −9.31∗∗
(4.51)
MNE ln(π) (ϑ1) 15.75∗∗
(7.62)
MNE ln(π)2 (ϑ2) −8.45∗∗
(3.98)
MNE ln(π)3 (ϑ3) 1.23∗
(0.64)
Constant (υ) 66.25∗∗∗
(3.40)
F-statistic 20.43
Observations 4 661
Standard errors in parentheses ob-tained through bootstrapping. ***,**, and * indicate levels of statisti-cal significance at 1, 5, and 10 per-cent, respectively. F-statistic is forthe joint significance of all MNE ef-fects.
Otherwise identical firms will only differ in their MNE status. Moreover, by including firm-specific Mundlak-
type variable means in the balancing weights, we can compare the results of (12) to the firm-fixed effects
regression estimated from equation (7). Table 7 shows the estimated coefficients when using the balancing
17
weights, λit. The coefficients of this estimation will next be used to quantify the size and footlooseness effect.
To determine the size effect, we need to know the additional profits an MNE is able to generate relative to
an NE. We do so by estimating
ln(πit) = δMNEit + υ + νit, (13)
where δ gives the additional profits of an MNE. Note that analogous to the estimation of equation (12)
we can forgo firm-fixed effects in equation (13) due to the inclusion of firm-specific Mundlak-type means
in the entropy balancing. Table 8 shows the estimated additional profits using the balancing weights, λit.
Unconditionally, the pre-tax profits of MNEs are 38% higher than those of NEs, while conditioning on entity
and firm fundamentals reduces this unconditional difference from 38% to 18%. The average firm in our
sample has about e8.27 million in pre-tax profits, random assignment of the MNE status under balancing
would therefore imply a pre-tax profit increase of about e1.53 million.
Table 8: The ATE of MNE status on Profits
Variable unconditional balanced
MNE (δ) 0.38∗∗∗ 0.18∗∗∗
(0.03) (0.03)
Observations 4 661 4 661
The ATE of MNE status in the balancedregression is the effect beyond profit shift-ing activities. Standard errors in parenthe-ses obtained through bootstrapping. ***,**, and * indicate levels of statistical signif-icance at 1, 5, and 10 percent, respectively.
We can then translate these additional pre-tax profits into changes of the ETR (size effect) by using the
estimated additional (log) pre-tax profits, δ, in conjunction with the estimated parameters from equation
(12). The change of the ETR for a given level of pre-tax profits, π, can be written as
∆ETRit(πit) =
(3∑z=1
ωz ln(πit)z
)−
(3∑z=1
ωz(ln(πit) + δit)z
), (14)
where ωz are the estimated coefficients from equation (12) and δ are the estimated (log) additional profits
from equation (13). Note that we use the ETR schedule for NEs, i.e., MNE = 0.14 In our sample, the
e1.53 million in average, additional profits reduce the ETR over the support of pre-tax profits by around
2.52 percentage points. Similarly, we can compute the distance between the ETR schedules of MNEs and
NEs (the distance between points B and C in Figure 2), which gives us the footlooseness effect and is about
3.58 percentage points on average. Adding both effects produces an average overall effect of 6.10 percentage
points, where the footlooseness effect contributes about 58%.
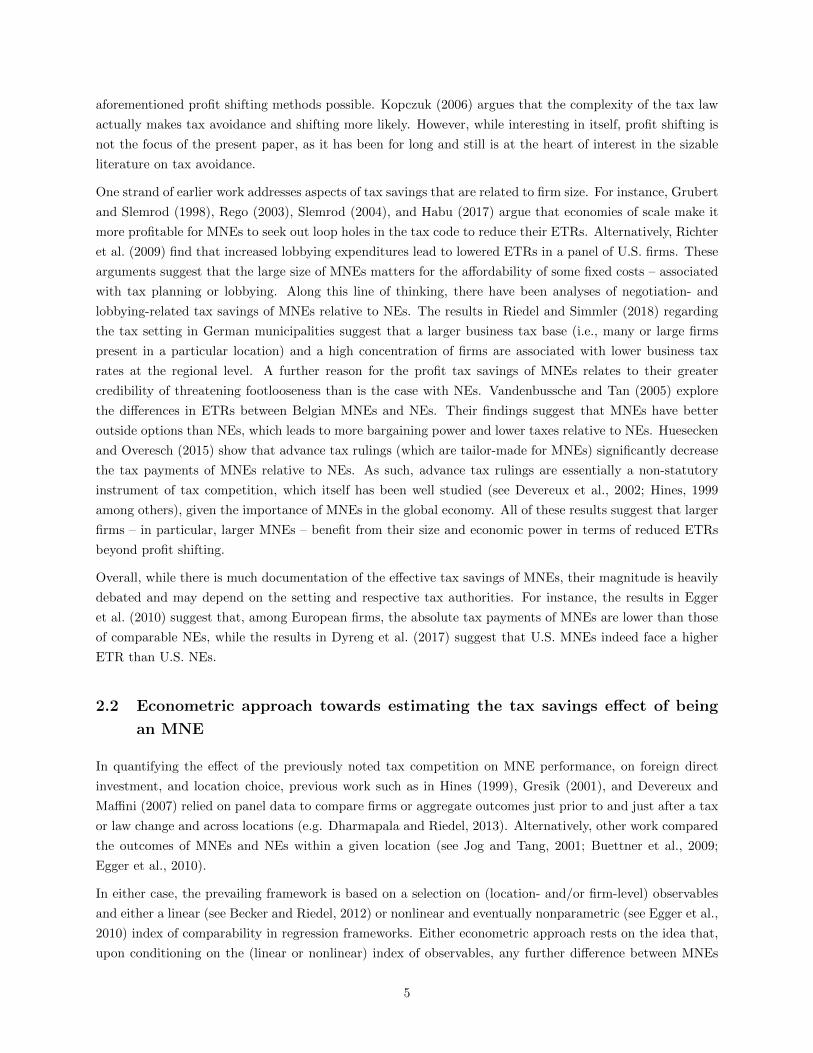
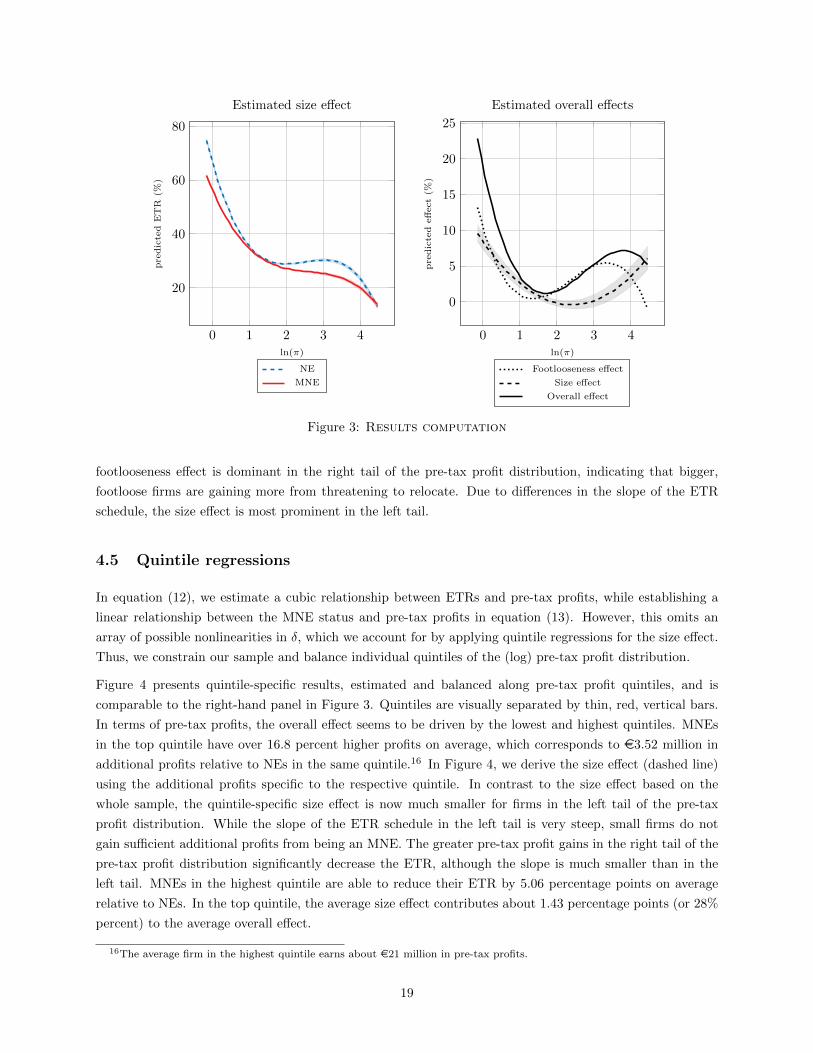
The left panel of Figure 3 plots the ETR schedules for MNEs and NEs using the estimated coefficients from
Table 7 with 95-percent confidence bounds.15 The right panel of the figure, in addition to the footlooseness
effect (dotted line, the difference in the MNEs’ and NEs’ ETR schedules from the left-hand panel), plots
the estimated size effect (dashed line) with 95-percent confidence bounds and the overall effect. Clearly, the
14The results are qualitatively similar when using the MNE ETR schedule instead.15This left-hand panel of Figure 3 is similar to Figure 2 but relies on the balanced sample to estimate the ETR schedule,
which explains the minor deviations.
18
0 1 2 3 4
20
40
60
80
ln(π)
pre
dic
ted
ET
R(%
)
Estimated size effect
NE
MNE
0 1 2 3 4
0
5
10
15
20
25
ln(π)
pre
dic
ted
eff
ect
(%)
Estimated overall effects
Footlooseness effect
Size effect
Overall effect
Figure 3: Results computation
footlooseness effect is dominant in the right tail of the pre-tax profit distribution, indicating that bigger,
footloose firms are gaining more from threatening to relocate. Due to differences in the slope of the ETR
schedule, the size effect is most prominent in the left tail.
4.5 Quintile regressions
In equation (12), we estimate a cubic relationship between ETRs and pre-tax profits, while establishing a
linear relationship between the MNE status and pre-tax profits in equation (13). However, this omits an
array of possible nonlinearities in δ, which we account for by applying quintile regressions for the size effect.
Thus, we constrain our sample and balance individual quintiles of the (log) pre-tax profit distribution.
Figure 4 presents quintile-specific results, estimated and balanced along pre-tax profit quintiles, and is
comparable to the right-hand panel in Figure 3. Quintiles are visually separated by thin, red, vertical bars.
In terms of pre-tax profits, the overall effect seems to be driven by the lowest and highest quintiles. MNEs
in the top quintile have over 16.8 percent higher profits on average, which corresponds to e3.52 million in
additional profits relative to NEs in the same quintile.16 In Figure 4, we derive the size effect (dashed line)
using the additional profits specific to the respective quintile. In contrast to the size effect based on the
whole sample, the quintile-specific size effect is now much smaller for firms in the left tail of the pre-tax
profit distribution. While the slope of the ETR schedule in the left tail is very steep, small firms do not
gain sufficient additional profits from being an MNE. The greater pre-tax profit gains in the right tail of the
pre-tax profit distribution significantly decrease the ETR, although the slope is much smaller than in the
left tail. MNEs in the highest quintile are able to reduce their ETR by 5.06 percentage points on average
relative to NEs. In the top quintile, the average size effect contributes about 1.43 percentage points (or 28%
percent) to the average overall effect.
16The average firm in the highest quintile earns about e21 million in pre-tax profits.
19

0 0.05 0.1 0.15 0.2 0.25
1
2
3
4
5
ω
Qu
inti
le
ω estimate
0 1 2 3 4
0
5
10
15
ln(π)
pre
dic
ted
effec
t(%
)
ETR estimate
Footlooseness effect
Size effect
Overall effect
Figure 4: ETR & (log) pre-tax profit estimate after balancing pre-tax profit quintiles
Table 9: Decompose the effects by quintile
Quintile ω Size effect Footlooseness Overall
1 0.04 1.46 6.71 8.17
2 0.00 0.00 1.15 1.15
3 0.03 0.24 0.48 0.72
4 0.02 0.04 1.00 1.04
5 0.17 1.43 3.63 5.06
Decomposition of the overall effect into the sizeand footlooseness effects. Point estimates of ω arethe average for each quintile.
Table 9 gives a detailed overview of the decomposition by quintile.
4.6 Robustness checks
We perform various robustness checks. First, we repeat our estimation using a Solow-type TFP residual as
our measure of productivity in Appendix C and using a productivity measure suggested by Olley and Pakes
(1996) in Appendix D. Second, we account for a finding in Habu (2017), who argues that unconditional
tax differentials of English MNEs and NEs arise from the incomplete consideration of MNEs with negative
profits. We approach the latter argument in two ways. We first follow Habu (2017) and include firms with
negative profits. To allow for negative profits in our estimation strategy, we use all variables in levels and
set the ETR equal to zero for all firms with negative profits. Specifically, we use the same set of variables in
our entropy balancing procedure, only in levels. Analogously, we estimate equations (12) and (13) in levels
to determine the ETR schedule and the absolute additional profits of MNEs. Second, we follow Dyreng et
al. (2017) and repeat the estimation after excluding all firms that had negative profits at any point in our
sample, as well as the year 2007, as we do not observe profits before that year, in Appendix E. This mitigates
20
the possibility of loss carryforward but reduces the number of observations. Lastly, we repeat the estimation
using a much bigger sample, which includes firms with revenues over e250 million and tax payments below
e763,000, in Appendix F. This last robustness check stands apart from the previous estimations in that the
applicable French statutory tax rate that the firms in the sample face is no longer constant across and within
firms, while all previous samples were constrained to firms with a French statutory tax rate of 34.43%.
The first two robustness checks on our measure of productivity lead us to conclude that our results are not
driven by our choice of the Levinsohn and Petrin (2003) and Petrin et al. (2004) productivity measure. The
results remain robust and consistent with the alternatives.
The third robustness check using firms with negative profits and estimated in levels (i.e. firms with an ETR
of zero) results in different estimated ETR schedules of NEs and MNEs. The great mass of firms with an
ETR of zero leads to an upward sloping ETR schedule in the left tail given the data at hand. Nevertheless,
even when including MNEs with negative pre-tax profits, MNEs are (on average) still more profitable than
similar NEs and their additional pre-tax profits are about e300,000. This result is once again mainly driven
by firms in the top quintile of the pre-tax profit distribution which have e0.5 million in additional profits
relative to comparable NEs. Similarly, tax loss carryforwards (TLCs) are unlikely to have affected our results,
as the results in the fourth robustness check are very similar to our benchmark estimation. Taken together,
the robustness checks permitting negative profits and eliminating negative profits lead us to conclude that
MNEs have systematically higher profits than comparable domestic firms and thus lower ETRs and our main
results are unchanged in Appendix E. In fact, domestic firms have systematically higher losses and TLCs
than comparable MNEs, which biases ETR in favor of domestic firms and would suggest that our results are
the lower bound.17
The last robustness check of relaxing the sample selection allows us to rule out that our sample selection
drives our results, as can be seen from the findings in Appendix F.
5 Conclusions
This paper investigates the differences in the ETRs of French MNEs vis-a-vis French domestic-only firms.
MNEs are in a better bargaining position in their negotiations with tax authorities due to both their size
and their reduced relocation costs relative to NEs. We formalize this idea in a simple stylized model, where
firms and tax authorities negotiate over tax deductions. Firms with higher pre-tax profits and lower fixed
costs of relocating have a better bargaining position and hence have lower ETRs. Moreover, the stylized
model implies that the ETR schedule is regressive, specifically due to the increased bargaining power of more
profitable firms. As MNEs have, on average, higher pre-tax profits, their bargaining power is higher and
hence their ETRs are lower. We refer to this as the size effect. On the other hand, the footlooseness effect
accounts for how much the effective tax rate decreases given the better bargaining position of MNEs and is
rooted in their lower fixed relocation costs and, thus, their higher credibility in threatening to move their
operations abroad.
In this paper, we argue that the unequal treatment of MNEs by French tax authorities, manifested in the
aforementioned bargaining channel, reduces their ETRs relative to comparable NEs – even after controlling
for possible debt shifting, patent trading, and transfer pricing. Advance tax rulings (especially undisclosed
17This also suggests that French domestic only firms might have been more severely impacted by the financial crisis in 2008.
21
ones) are an obvious candidate in the more favorable treatment of MNEs relative to NEs. On the other hand,
it appears implausible that tax authorities acting on good faith systematically err on the side of MNEs as
both MNEs and NEs are able to obtain advance tax ruling and appeal unfavourable ones. Given that the
footlooseness effect is increasing with firm size, it is furthermore implausible that the difference of ETR
between of MNEs and NEs can be exclusively attributed to a selection of MNEs into France due to favorable
advance tax rulings and non-selection in the case of unfavorable rulings. If the tax authorities act on good
faith with a random error, we would expect that the footlooseness effect (defined by the vertical distance
between NE and MNE ETR schedule) is constant over the firm size distribution. The stylized model suggests
that footlooseness interacts with pre-tax profits and, hence, we would expect that the footlooseness effect is
greater for (everything else being equal) more profitable firms. This is consistent with the empirical findings
and clearly suggests the existence and relevance of the bargaining channel (see Appendix G).
Empirically, we find that an average (French or foreign) MNE in France faces a 3.42 percentage point lower
(unconditional) effective tax rate than a French firm with purely domestic operations. We then decompose
the overall effect into its footlooseness- and size-related components. This is done by comparing MNEs
and domestic-only firms that are otherwise identical. While the footlooseness effect accounts for about 3.58
percentage points, the size effect corresponds to a 2.52 percentage point reduction of the ETR of MNEs.
In total, the conditional difference in the ETR between MNEs and NEs amounts to 6.1 percentage points.
Moreover, we find that the total bargaining effect of being an MNE on the ETR is mainly driven by high-
productivity (high-profit) firms, even among MNEs.
22
References
Becker, J. and N. Riedel, “Cross-border tax effects on affiliate investment – Evidence form European
multinationals,” European Economic Review, 2012, 56 (3), 436–450.
Bergin, J., “Amazon receives $252 million back tax claim,” Reuters, 12 November 2012.
Boesenberg, S. and P.H. Egger, “R&D tax incentives and the emergence and trade of ideas,” Economic
Policy, 2016, 32 (89), 39–80.
, , and B. Zoller-Rydzek, “Capital taxation, investment, growth, and welfare,” International Tax
and Public Finance, 2017. forthcoming.
Brinded, L., “Tax Avoidance Crackdown: France to Force Companies to Reveal Foreign Activity and
Bills,” International Business Times, 3 June 2013.
Buettner, T., M. Overesch, U. Schreiber, and G. Wamser, “Taxation and capital structure choice -
Evidence from a panel of German multinationals,” Economics Letters, 2009, 105 (3), 309–311.
Davies, R.B, J. Martin, M. Parenti, and F. Toubal, “Knocking on Tax Haven’s Door: Multinational
Firms and Transfer Pricing,” CESifo Working Paper Series, 2014, 15/01.
Devereux, Michael P. and Rachel Griffith, “The taxation of discrete investment choices,” 1998. IFS
Working Papers W98/16.
Devereux, M.P and G. Maffini, “The impact of taxation on the location of capital, firms and profit:
A survey of empirical evidence,” Oxford University Centre for Business Taxation Working Paper Series,
2007, 07/02.
Devereux, M.P. and R. Griffith, “Evaluating tax policy for location decisions,” International Tax and
Public Finance, 2003, 10 (2), 107–126.
Devereux, M.P, R. Griffith, and A. Klemm, “The impact of taxation on the location of capital, firms
and profit: A survey of empirical evidence,” Economic Policy, 2002, 17 (35), 449–495.
Dharmapala, D. and N. Riedel, “Earnings shocks and tax-motivated income-shifting: Evidence from
European multinationals,” Journal of Public Economics, January 2013, 97, 95–107.
Direction Generale des Finances Publiques, “Annuaire Statistique 2016,” 2016. Web. 2016-02-21.
Dyreng, S.D., M. Hanlon, E.L. Maydew, and J.R. Thornock, “Changes in Corporate Effective Tax
Rates Over the Past Twenty-Five Years,” Journal of Financial Economics, 2017, 124 (3), 441–463.
Egger, P.H., C. Keuschnigg, V. Merlo, and G. Wamser, “Corporate Taxes and Internal Borrowing
within Multinational Firms,” American Economic Journal: Economic Policy, 2014, 6 (2), 54–93.
, R. Riezman, and B. Zoller-Rydzek, “Multi-unit firms and their scope and location decision,” March
2018. mimeo.
, W. Eggert, and H. Winner, “Saving taxes through foreign plant ownership,” Journal of International
Economics, May 2010, 81 (1), 99–108.
Gresik, T.A, “The taxing task of taxing transnationals,” Journal of Economic Literature, 2001, 39 (3),
800–838.
23

Griffith, R., H. Miller, and M. O’Connell, “Ownership of intellectual property and corporate taxation,”
Journal of Public Economics, April 2014, 112, 12–23.
Grubert, H. and J. Slemrod, “The Effect of Taxes on Investment and Income Shifting to Puerto Rico,”
The Review of Economics and Statistics, 1998, 80 (3), 365–373.
Habu, K.A., “How much tax do companies pay in the UK? Evidence from UK confidential corporate tax
returns,” Oxford University Centre for Business Taxation Working Paper Series, 2017, 17/14.
Hainmueller, J., “Entropy Balancing for Causal Effects: A Multivariate Reweighting Method to Produce
Balanced Samples in Observational Studies,” Political Analysis, January 2012, 20 (1), 25–46.
and Y. Xu, “Ebalance: A Stata package for entropy balancing,” Journal of Statistical Software, 2013,
54 (7).
Helpman, E., M.J. Melitz, and S.R. Yeaple, “Export versus FDI with Heterogeneous Firms,” American
Economic Review, 2004, 94 (1), 300–316.
Hines, J.R., “Lessons from Behavioral Responses to International Taxation,” National Tax Journal, 1999,
52 (2), 305–322.
Huesecken, B. and M. Overesch, “Tax avoidance through advance tax rulings-evidence from the
LuxLeaks firms,” 2015. mimeo.
Huizinga, H. and L. Laeven, “International profit shifting within multinationals: A multi-country per-
spective,” Journal of Public Economics, June 2008, 92 (5–6), 1164–1182.
ITRWeek, “Vivendi strikes deal on French taxes,” International Tax Review, 30 August 2004.
Janeba, E., “Tax competition when governments lack commitment: Excess capacity as a countervailing
threat,” The American Economic Review, 2000, 90 (5), 1508–1519.
Jog, V. and J. Tang, “Tax reforms, debt shifting and tax revenues: Multinational corporations in canada,”
International Tax and Public Finance, 2001, 8 (1), 5–25.
Karkinsky, T. and N. Riedel, “Corporate taxation and the choice of patent location within multinational
firms,” Journal of International Economics, September 2012, 88 (1), 176–185.
Konrad, Kai A. and Tim B.M. Stolper, “Coordination and the fight against tax havens,” Journal of
International Economics, 2016, 103 (Supplement C), 96–107.
Kopczuk, W., “Tax simplification and tax compliance: An economic perspective,” in M. Sawicky, ed.,
Bridging the Tax Gap: Addressing the Crisis in Tax Administration, Economic Policy Institute, 2006,
pp. 111–143.
Le Monde, “Le pratron de Google recu par Nicolas Sarkozy,” Le Monde Technologies, 9 September 2010.
, “Interet confirme d’Amazon pour la Bourgogne,” Le Monde Economie, 8 June 2012.
Levinsohn, J. and A. Petrin, “Estimating production functions using inputs to control for unobservables,”
The Review of Economic Studies, 2003, 70 (2), 317–341.
Markusen, J., Multinational firms and the theory of international trade, MIT Press, 2002.
Mundlak, Y., “On the pooling of time series and cross section data,” Econometrica, 1978, 46, 69–85.
24
Olley, S.G. and A. Pakes, “The dynamics of productivity in the telecommunications equipment industry,”
Econometrica, 1996, 64 (6), 1263–1297.
Petrin, A., B.P. Poi, and J. Levinsohn, “Production function estimation in Stata using inputs to control
for unobservables,” Stata Journal, 2004, 4, 113–123.
Rego, S.O., “Tax-avoidance activities of U.S. multinational corporations,” Contemporary Accounting Re-
search, December 2003, 20 (4), 805–833.
Richter, B.K., K. Samphantharak, and J.F. Timmons, “Lobbying and taxes,” American Journal of
Political Science, 2009, 53 (4), 893–909.
Riedel, N. and M. Simmler, “Large and influential : firm size and governments’ corporate tax rate
choice,” CESifo Working Paper Series, 2018, 6904.
Schindler, D. and G. Schjelderup, “Transfer pricing and debt shifting in multinationals,” CESifo Work-
ing Paper Series, 2013, 4381.
Slemrod, J., “The economics of corporate tax selfishness,” National Tax Journal, 2004, 57 (4), 877–899.
Van de Velde, E., “’Tax rulings’ in the EU member states,” Study for the ECON Committee of Directorate
General for Internal Policies-Policy Department A: Economic and Scientific Policy, 2015.
Vandenbussche, H. and C. Tan, “The taxation of multinationals: Firm level evidence for Belgium,”
LICOS discussion paper, 2005.
Waerzeggers, C. and C. Hillier, “Introducing an Advance Tax Ruling (ATR) Regime,” Tax Law IMF
Technical Note, IMF February 2016.
Wooldridge, J.M., “Inverse Probability Weighted Estimation for General Missing Data Problems,” Journal
of Econometrics, December 2007, 141 (2), 1281–1301.
25
Appendix
A Proof of proposition
The proof of the proposition is straightforward.
(i) the ETR is downward sloping:∂ETRi
∂πi= −αFi
π2i
< 0.
(ii) the ETR schedule of MNEs lies below the one of NEs:
∂ETRi
∂Fi=
α
πi> 0 ∀πi.
(iii) the ETR increases with the foreign effective tax rate:
∂ETRi
∂ETR′= α > 0.
(iv) the ETR schedule of MNEs is more regressive than of NEs:
∂ETR2i
∂πi∂Fi= − α
π2i
< 0.
B Tax competition in the bargaining model
We have considered the foreign country to be passive in the main text, i.e., French tax authorities take
the foreign effective tax rate as given. Still, firms might be able to simultaneously negotiate with the
French and other foreign governments about deductions. We extend our stylized model to account for this
parallel negotiation and show that our main results are not affected. Moreover, we allow for different profit
opportunities in the foreign countries. We denote the possible profits in the foreign country by σπi, where
σ > 0. σ subsumes all profit losses or gains aside from the fixed relocation costs. For example it might be
that wages in the foreign country are lower or environmental regulations are stricter.
The optimal French deductions for firm i can be written as:
D?i = min
[argmax
Di
[(τ(πiσ −Di))
α((1− τ)πiσ + τDi − Fi − (1− ETR′i)σπi)1−α] , πi] , (15)
where we will derive the optimal foreign ETR′i endogenously in the model. We adapt the expression for the
optimal French effective tax rate in equation (3) to consider possible (gross) profit changes σ in the foreign
country.
ETRi = max
[α
(1− σ + σETR′i +
Fiπi
), 0
], (16)
26

given that the foreign ETR′i ≤ 1, the optimal effective tax rate for a firm i in France is decreasing in σ. The
more profitable a relocated firm would be, the more tax deduction the tax authority is willing to grant.
The optimal foreign deductions are
D′?i = min
[argmax
Di
[(τ(πiσ −Di))
α((1− τ)πiσ + τDi − Fi − (1− ETRi)πi)1−α] , πi] , (17)
where we assume that the foreign government takes the ETR of France as given, that the bargaining power
of both governments is identical and equal to α, and that tax authorities will not pay any subsidies to firm
i, i.e., deductions cannot be greater than total profits and hence the effective tax rate has to be positive.
Firm i’s (hypothetical) effective tax rate in the foreign country is given by
ETR′i = max
[τ(πiσ −D
′?i )
πiσ, 0
]= max
[α
σ
((1− σ) + ETRi −
Fiπi
), 0
]. (18)
The foreign (hypothetical) effective tax rate of a firm i decreases with σ, the easier profits can be transferred
or generated in the foreign country the less deductions the foreign tax authority is willing to grant to attract
the company. Fixed relocation costs have exactly the opposite sign, i.e., high relocation costs require higher
foreign tax deductions to attract the French firm.
In a Nash equilibrium no tax authority wants to change its ETR, thus we substitute equation (15) in equation
(18) and obtain optimal response functions
ETR′i = max
[αα− 1
1− α2
1
σ
((σ − 1)
Fiπi
), 0
]. (19)
The first expression in the parentheses is always smaller than zero and the optimal foreign ETR′i in our tax
negotiation setting is zero. Intuitively, the foreign tax authority is indifferent between attracting a firm to
relocate by deducting all profits and the firm not relocating at all. Given ETR′i = 0 we derive the optimal
French effective tax rate as
ETRi = α
((1− σ) +
Fiπi
). (20)
The equilibrium effective tax rate of a firm i in France does not depend on the foreign ETR′i of this firm, but
only on the bargaining power α, the fixed relocation costs Fi, profits πi, and the transferability of profits σ.
The higher is σ the lower is the effective tax rate for a firm i in France. Still statements (i), (ii) and (iv) in
the Proposition hold under tax competition and with incomplete transferability of profits.
Note that the foreign tax authorities cannot commit to an ETRi = 0. Thus, firms face a similar problem as
in Janeba (2000): once firm i has relocated, the foreign government would want to increase its tax rate. We
abstract from this problem at this point, as bilateral tax negotiations are not the focus of this paper.
27
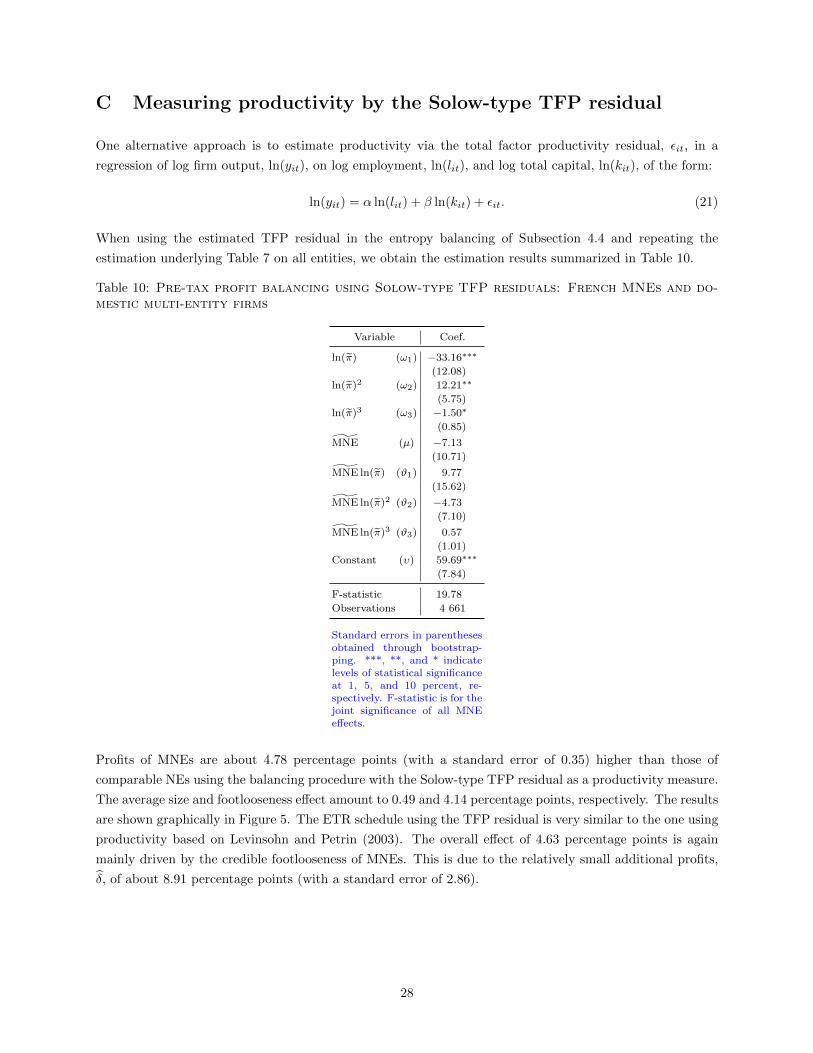
C Measuring productivity by the Solow-type TFP residual
One alternative approach is to estimate productivity via the total factor productivity residual, εit, in a
regression of log firm output, ln(yit), on log employment, ln(lit), and log total capital, ln(kit), of the form:
ln(yit) = α ln(lit) + β ln(kit) + εit. (21)
When using the estimated TFP residual in the entropy balancing of Subsection 4.4 and repeating the
estimation underlying Table 7 on all entities, we obtain the estimation results summarized in Table 10.
Table 10: Pre-tax profit balancing using Solow-type TFP residuals: French MNEs and do-mestic multi-entity firms
Variable Coef.
ln(π) (ω1) −33.16∗∗∗
(12.08)
ln(π)2 (ω2) 12.21∗∗
(5.75)
ln(π)3 (ω3) −1.50∗
(0.85)
MNE (µ) −7.13
(10.71)
MNE ln(π) (ϑ1) 9.77
(15.62)
MNE ln(π)2 (ϑ2) −4.73
(7.10)
MNE ln(π)3 (ϑ3) 0.57
(1.01)
Constant (υ) 59.69∗∗∗
(7.84)
F-statistic 19.78
Observations 4 661
Standard errors in parenthesesobtained through bootstrap-ping. ***, **, and * indicatelevels of statistical significanceat 1, 5, and 10 percent, re-spectively. F-statistic is for thejoint significance of all MNEeffects.
Profits of MNEs are about 4.78 percentage points (with a standard error of 0.35) higher than those of
comparable NEs using the balancing procedure with the Solow-type TFP residual as a productivity measure.
The average size and footlooseness effect amount to 0.49 and 4.14 percentage points, respectively. The results
are shown graphically in Figure 5. The ETR schedule using the TFP residual is very similar to the one using
productivity based on Levinsohn and Petrin (2003). The overall effect of 4.63 percentage points is again
mainly driven by the credible footlooseness of MNEs. This is due to the relatively small additional profits,
δ, of about 8.91 percentage points (with a standard error of 2.86).
28

0 1 2 3 4
20
40
60
ln(π)
pre
dic
ted
ET
R(%
)
Estimated size effect
NE
MNE
0 1 2 3 4
0
5
10
ln(π)
pre
dic
ted
eff
ect
(%)
Estimated overall effects
Footlooseness effect
Size effect
Overall effect
Figure 5: Pre-tax profit balancing using Solow-type TFP residuals for productivity: Re-sults computation
Analogously, we split the sample into quintiles to allow for non-linearities in δ. The associated results are
shown in Figure 6. Once again quintiles are visually separated by thin, red, vertical bars. Only firms in the
left tail of the size distribution derive significant additional profits from being a MNE, as with the benchmark
results. The footlooseness effect is most pronounced in the right tail of the distribution as before, but the
size effect remains important, especially for very large firms.
0 0.05 0.1 0.15
1
2
3
4
5
ω
Qu
inti
le
ω estimate
0 1 2 3 4
0
5
10
15
ln(π)
pre
dic
ted
effec
t(%
)
ETR estimate
Footlooseness effect
Size effect
Overall effect
Figure 6: Pre-tax profit balancing using Solow-type TFP residuals: ETR & (log) pre-taxprofit estimate after balancing pre-tax profit quintiles
29
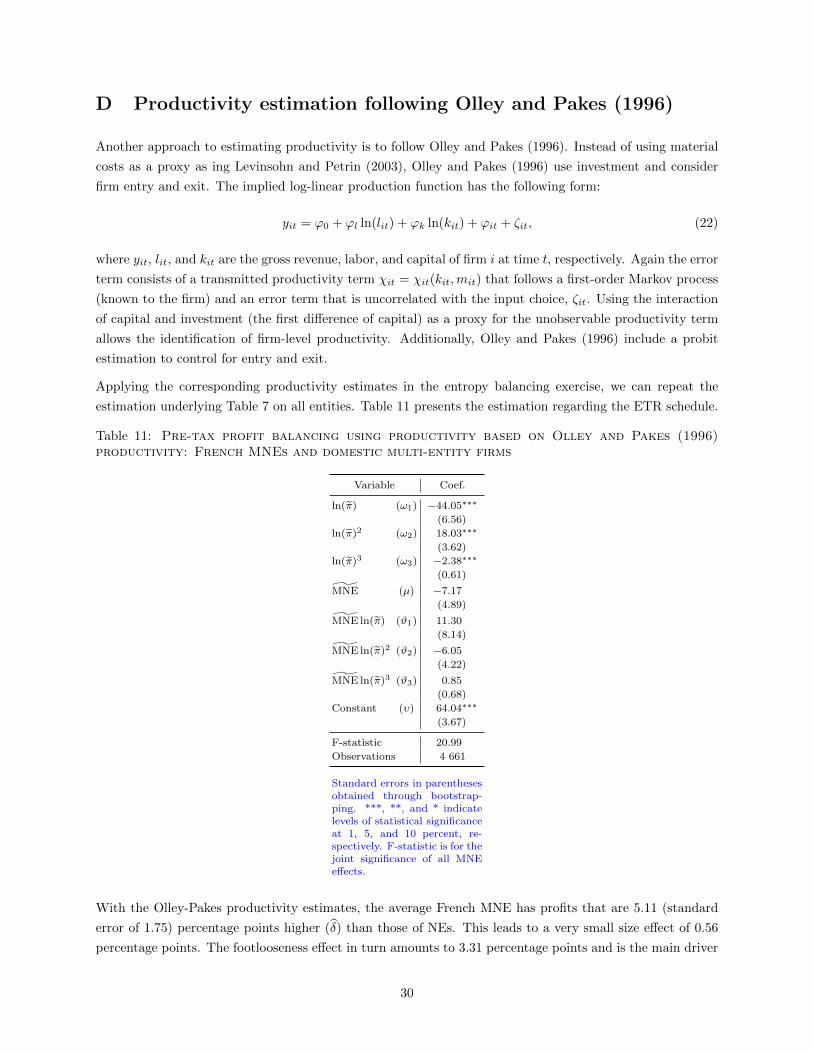
D Productivity estimation following Olley and Pakes (1996)
Another approach to estimating productivity is to follow Olley and Pakes (1996). Instead of using material
costs as a proxy as ing Levinsohn and Petrin (2003), Olley and Pakes (1996) use investment and consider
firm entry and exit. The implied log-linear production function has the following form:
yit = ϕ0 + ϕl ln(lit) + ϕk ln(kit) + ϕit + ζit, (22)
where yit, lit, and kit are the gross revenue, labor, and capital of firm i at time t, respectively. Again the error
term consists of a transmitted productivity term χit = χit(kit,mit) that follows a first-order Markov process
(known to the firm) and an error term that is uncorrelated with the input choice, ζit. Using the interaction
of capital and investment (the first difference of capital) as a proxy for the unobservable productivity term
allows the identification of firm-level productivity. Additionally, Olley and Pakes (1996) include a probit
estimation to control for entry and exit.
Applying the corresponding productivity estimates in the entropy balancing exercise, we can repeat the
estimation underlying Table 7 on all entities. Table 11 presents the estimation regarding the ETR schedule.
Table 11: Pre-tax profit balancing using productivity based on Olley and Pakes (1996)productivity: French MNEs and domestic multi-entity firms
Variable Coef.
ln(π) (ω1) −44.05∗∗∗
(6.56)
ln(π)2 (ω2) 18.03∗∗∗
(3.62)
ln(π)3 (ω3) −2.38∗∗∗
(0.61)
MNE (µ) −7.17
(4.89)
MNE ln(π) (ϑ1) 11.30
(8.14)
MNE ln(π)2 (ϑ2) −6.05
(4.22)
MNE ln(π)3 (ϑ3) 0.85
(0.68)
Constant (υ) 64.04∗∗∗
(3.67)
F-statistic 20.99
Observations 4 661
Standard errors in parenthesesobtained through bootstrap-ping. ***, **, and * indicatelevels of statistical significanceat 1, 5, and 10 percent, re-spectively. F-statistic is for thejoint significance of all MNEeffects.
With the Olley-Pakes productivity estimates, the average French MNE has profits that are 5.11 (standard
error of 1.75) percentage points higher (δ) than those of NEs. This leads to a very small size effect of 0.56
percentage points. The footlooseness effect in turn amounts to 3.31 percentage points and is the main driver
30

of the overall effect of 3.87 percentage points, as shown in Figure 7.
0 1 2 3 4
20
40
60
ln(π)
pre
dic
ted
ET
R(%
)
Estimated size effect
NE
MNE
0 1 2 3 4
0
5
10
ln(π)
pre
dic
ted
eff
ect
(%)
Estimated overall effects
Footlooseness effect
Size effect
Overall effect
Figure 7: Pre-tax profit Balancing using Olley and Pakes (1996): Results computation
Using quintiles estimates of δ to allow for non-linearities yields similar results as before. We present the
quintile results using Olley and Pakes (1996) productivity in Figure 8, where the quintiles are visually
separated by thin, red bars. Only for firms in the highest quintile does the size effect significantly contribute
to the overall effect.
0 0.05 0.1
1
2
3
4
5
ω
Qu
inti
le
ω estimate
0 1 2 3 4
0
5
10
15
ln(π)
pre
dic
ted
effec
t(%
)
ETR estimate
Footlooseness effect
Size effect
Overall effect
Figure 8: Pre-tax profit balancing using Olley and Pakes (1996): ETR & (log) pre-tax profitestimate after balancing pre-tax profit quintiles
31
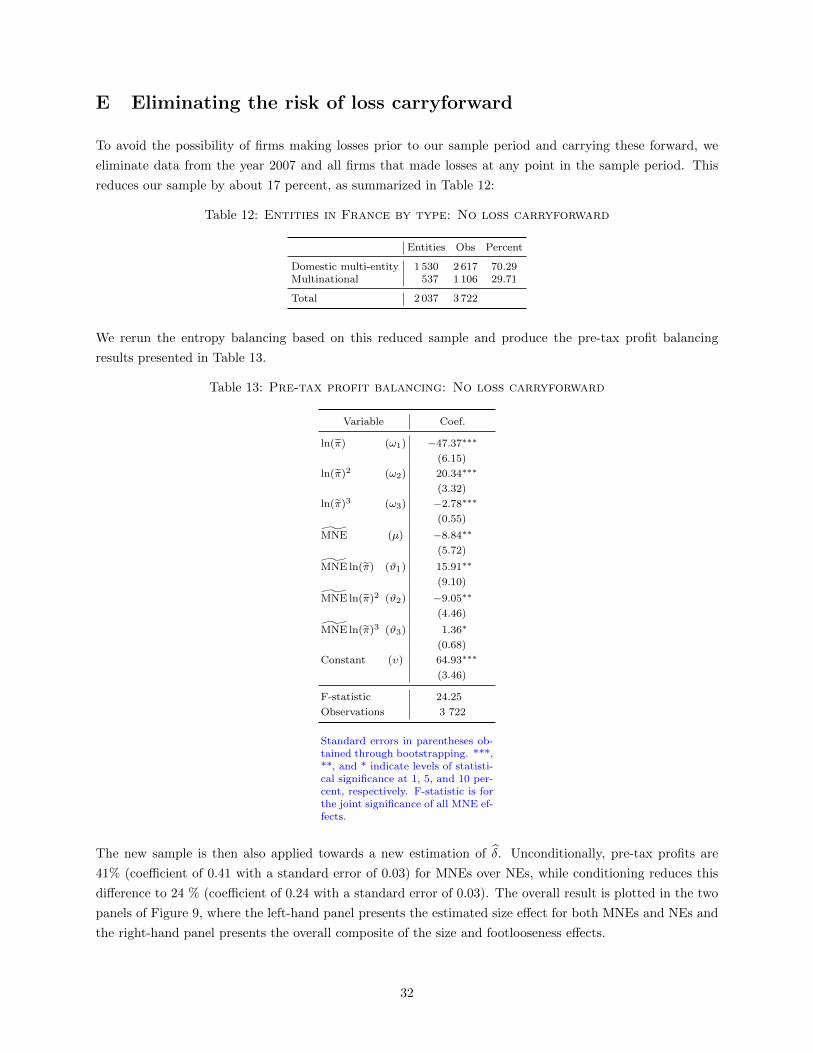
E Eliminating the risk of loss carryforward
To avoid the possibility of firms making losses prior to our sample period and carrying these forward, we
eliminate data from the year 2007 and all firms that made losses at any point in the sample period. This
reduces our sample by about 17 percent, as summarized in Table 12:
Table 12: Entities in France by type: No loss carryforward
Entities Obs Percent
Domestic multi-entity 1 530 2 617 70.29Multinational 537 1 106 29.71
Total 2 037 3 722
We rerun the entropy balancing based on this reduced sample and produce the pre-tax profit balancing
results presented in Table 13.
Table 13: Pre-tax profit balancing: No loss carryforward
Variable Coef.
ln(π) (ω1) −47.37∗∗∗
(6.15)
ln(π)2 (ω2) 20.34∗∗∗
(3.32)
ln(π)3 (ω3) −2.78∗∗∗
(0.55)
MNE (µ) −8.84∗∗
(5.72)
MNE ln(π) (ϑ1) 15.91∗∗
(9.10)
MNE ln(π)2 (ϑ2) −9.05∗∗
(4.46)
MNE ln(π)3 (ϑ3) 1.36∗
(0.68)
Constant (υ) 64.93∗∗∗
(3.46)
F-statistic 24.25
Observations 3 722
Standard errors in parentheses ob-tained through bootstrapping. ***,**, and * indicate levels of statisti-cal significance at 1, 5, and 10 per-cent, respectively. F-statistic is forthe joint significance of all MNE ef-fects.
The new sample is then also applied towards a new estimation of δ. Unconditionally, pre-tax profits are
41% (coefficient of 0.41 with a standard error of 0.03) for MNEs over NEs, while conditioning reduces this
difference to 24 % (coefficient of 0.24 with a standard error of 0.03). The overall result is plotted in the two
panels of Figure 9, where the left-hand panel presents the estimated size effect for both MNEs and NEs and
the right-hand panel presents the overall composite of the size and footlooseness effects.
32
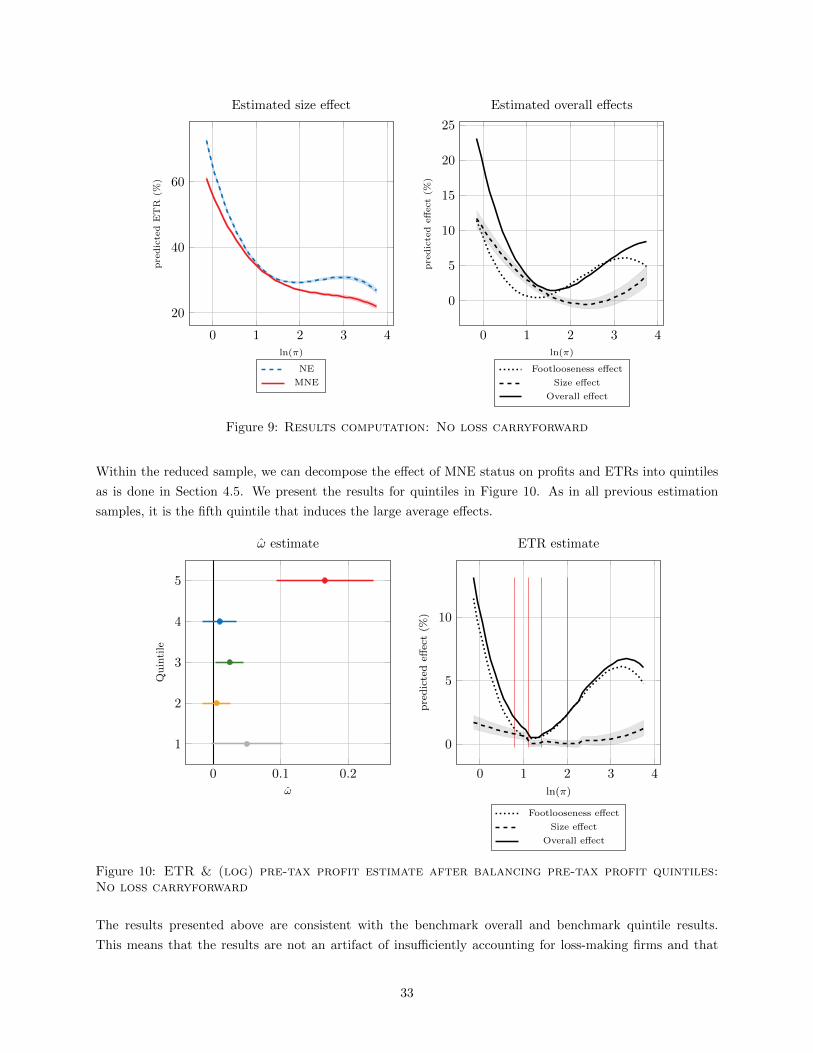
0 1 2 3 4
20
40
60
ln(π)
pre
dic
ted
ET
R(%
)
Estimated size effect
NE
MNE
0 1 2 3 4
0
5
10
15
20
25
ln(π)
pre
dic
ted
eff
ect
(%)
Estimated overall effects
Footlooseness effect
Size effect
Overall effect
Figure 9: Results computation: No loss carryforward
Within the reduced sample, we can decompose the effect of MNE status on profits and ETRs into quintiles
as is done in Section 4.5. We present the results for quintiles in Figure 10. As in all previous estimation
samples, it is the fifth quintile that induces the large average effects.
0 0.1 0.2
1
2
3
4
5
ω
Qu
inti
le
ω estimate
0 1 2 3 4
0
5
10
ln(π)
pre
dic
ted
effec
t(%
)
ETR estimate
Footlooseness effect
Size effect
Overall effect
Figure 10: ETR & (log) pre-tax profit estimate after balancing pre-tax profit quintiles:No loss carryforward
The results presented above are consistent with the benchmark overall and benchmark quintile results.
This means that the results are not an artifact of insufficiently accounting for loss-making firms and that
33

loss carryforward does exacerbate the tax differences found in the benchmark results. Conditional on firm
fundamentals, NEs still have lower profits than MNEs and are more likely to be loss making than their
comparable MNEs. The results presented above thus represent the lower bound of the ETR difference
between MNEs and NEs.
F Reducing the restrictions in sample selection
In the main body of the paper, we work with a subsample of entities whose statutory tax rate in France is
equal for the entire sample period and all observations. In this section, however, we maintain the complete
sample of French NEs and MNEs and take their different statutory tax rates into consideration using binary
indicators. The sample used in this section is summarized in Table 14 and is 2.5 times as large as the
benchmark sample.
Table 14: Entities in France by type: Fewer restrictions
Entities Obs Percent
Domestic multi-entity 2 674 5 123 42.34Multinational 3 461 6 977 57.66
Total 6 135 12 100
Table 15: Pre-tax profit balancing: Fewer restrictions
Variable Coef.
ln(π) (ω1) 0.33∗
(0.19)
ln(π)2 (ω2) −0.18∗∗∗
(0.05)
ln(π)3 (ω3) −0.03∗∗∗
(0.01)
MNE (µ) −3.12∗∗∗
(1.30)
MNE ln(π) (ϑ1) −1.04∗∗∗
(0.27)
MNE ln(π)2 (ϑ2) 0.13∗∗
(0.07)
MNE ln(π)3 (ϑ3) 0.03∗∗∗
(0.01)
Constant (υ) 28.14∗∗∗
(0.37)
F-statistic 4.50
Observations 12 100
Standard errors in parentheses ob-tained through bootstrapping. ***,**, and * indicate levels of statisti-cal significance at 1, 5, and 10 per-cent, respectively. F-statistic is forthe joint significance of all MNE ef-fects.
We rerun the entropy balancing and produce the pre-tax profit balancing results presented in Table 15. We
34
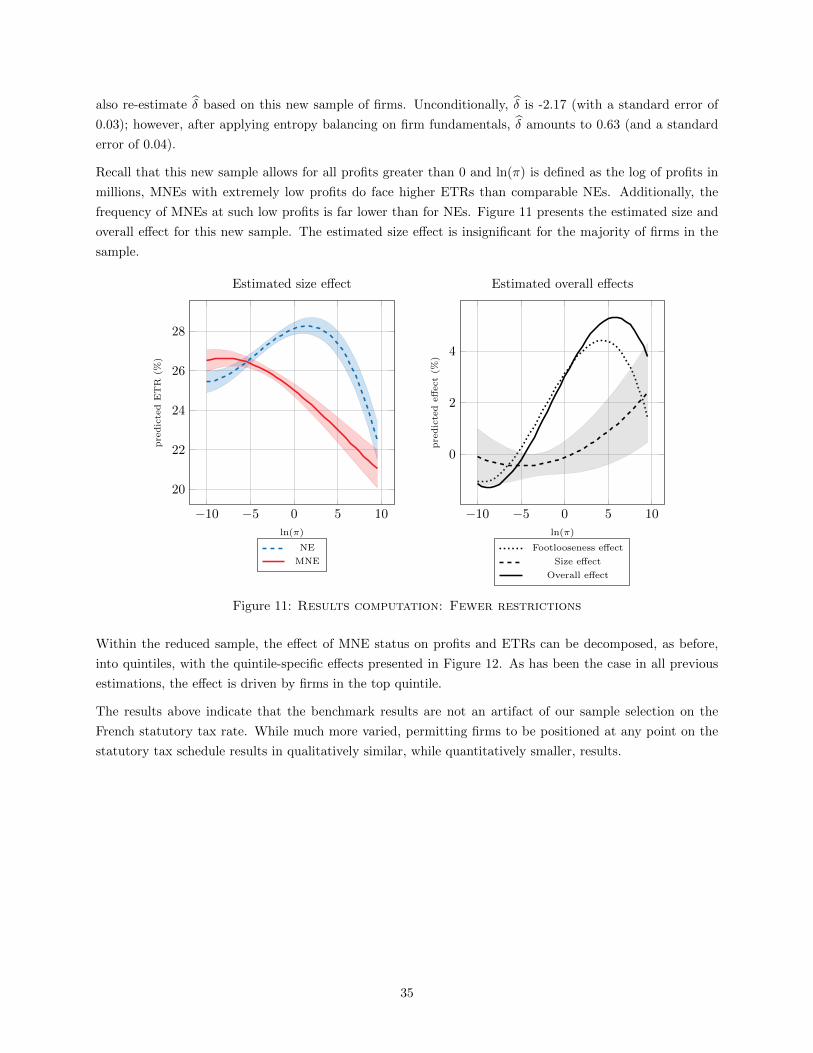
also re-estimate δ based on this new sample of firms. Unconditionally, δ is -2.17 (with a standard error of
0.03); however, after applying entropy balancing on firm fundamentals, δ amounts to 0.63 (and a standard
error of 0.04).
Recall that this new sample allows for all profits greater than 0 and ln(π) is defined as the log of profits in
millions, MNEs with extremely low profits do face higher ETRs than comparable NEs. Additionally, the
frequency of MNEs at such low profits is far lower than for NEs. Figure 11 presents the estimated size and
overall effect for this new sample. The estimated size effect is insignificant for the majority of firms in the
sample.
−10 −5 0 5 10
20
22
24
26
28
ln(π)
pre
dic
ted
ET
R(%
)
Estimated size effect
NE
MNE
−10 −5 0 5 10
0
2
4
ln(π)
pre
dic
ted
eff
ect
(%)
Estimated overall effects
Footlooseness effect
Size effect
Overall effect
Figure 11: Results computation: Fewer restrictions
Within the reduced sample, the effect of MNE status on profits and ETRs can be decomposed, as before,
into quintiles, with the quintile-specific effects presented in Figure 12. As has been the case in all previous
estimations, the effect is driven by firms in the top quintile.
The results above indicate that the benchmark results are not an artifact of our sample selection on the
French statutory tax rate. While much more varied, permitting firms to be positioned at any point on the
statutory tax schedule results in qualitatively similar, while quantitatively smaller, results.
35
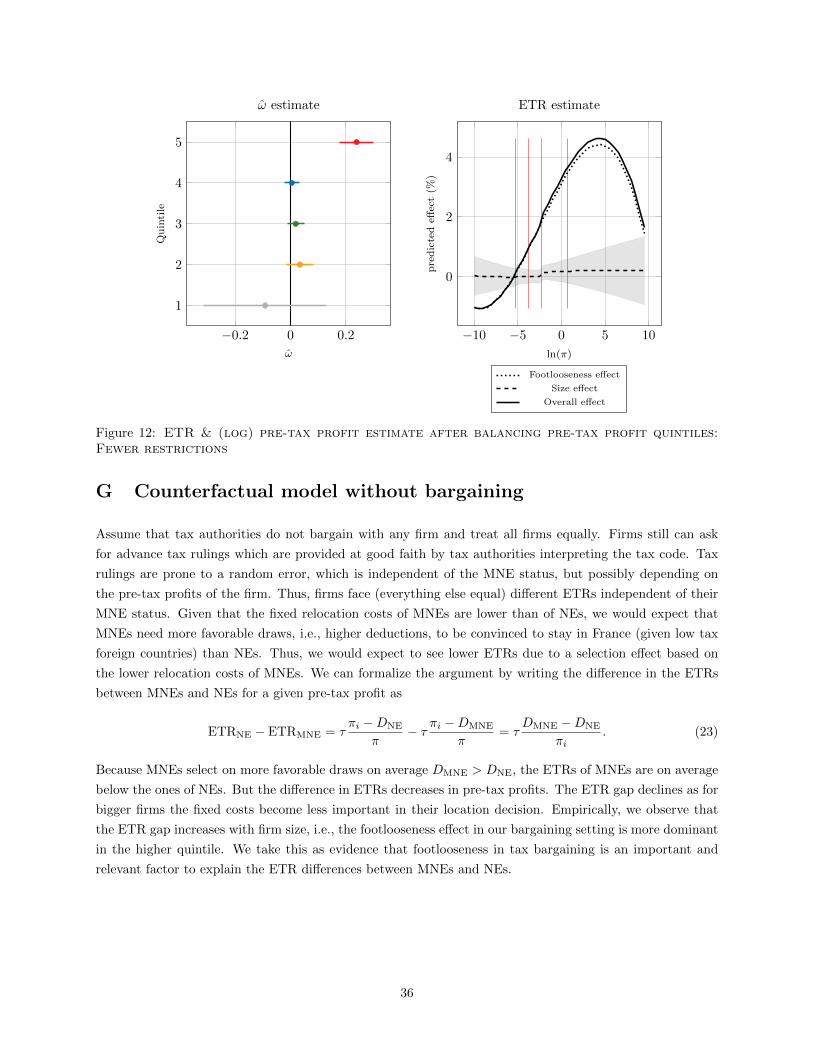
−0.2 0 0.2
1
2
3
4
5
ω
Qu
inti
le
ω estimate
−10 −5 0 5 10
0
2
4
ln(π)
pre
dic
ted
effec
t(%
)
ETR estimate
Footlooseness effect
Size effect
Overall effect
Figure 12: ETR & (log) pre-tax profit estimate after balancing pre-tax profit quintiles:Fewer restrictions
G Counterfactual model without bargaining
Assume that tax authorities do not bargain with any firm and treat all firms equally. Firms still can ask
for advance tax rulings which are provided at good faith by tax authorities interpreting the tax code. Tax
rulings are prone to a random error, which is independent of the MNE status, but possibly depending on
the pre-tax profits of the firm. Thus, firms face (everything else equal) different ETRs independent of their
MNE status. Given that the fixed relocation costs of MNEs are lower than of NEs, we would expect that
MNEs need more favorable draws, i.e., higher deductions, to be convinced to stay in France (given low tax
foreign countries) than NEs. Thus, we would expect to see lower ETRs due to a selection effect based on
the lower relocation costs of MNEs. We can formalize the argument by writing the difference in the ETRs
between MNEs and NEs for a given pre-tax profit as
ETRNE − ETRMNE = τπi −DNE
π− τ πi −DMNE
π= τ
DMNE −DNE
πi. (23)
Because MNEs select on more favorable draws on average DMNE > DNE, the ETRs of MNEs are on average
below the ones of NEs. But the difference in ETRs decreases in pre-tax profits. The ETR gap declines as for
bigger firms the fixed costs become less important in their location decision. Empirically, we observe that
the ETR gap increases with firm size, i.e., the footlooseness effect in our bargaining setting is more dominant
in the higher quintile. We take this as evidence that footlooseness in tax bargaining is an important and
relevant factor to explain the ETR differences between MNEs and NEs.
36